Article

Forecasting of Built-Up Land Expansion in a Desert Urban Environment

1
Geography Department, College of Arts and Social Sciences, Sultan Qaboos University, Al-Khoud P.C., Muscat 123, Oman
2
Department of Geography and GIS, Faculty of Arts, Alexandria University, Al Shatby, Alexandria 21526, Egypt
3
National Center for Remote Sensing Technology, Space and Aeronautics Research Institute, King Abdulaziz City for Science and Technology, P.O. Box 6086, Riyadh 11442, Saudi Arabia
4
The Faculty of Science and Technology, Lancaster University, Lancaster LA1 4YR, UK
5
Institute of Geographic Sciences and Natural Resources Research, Chinese Academy of Sciences, 11A Datun Road, Beijing 100101, China
6
Geography and Environment, University of Southampton, Southampton SO17 1BJ, UK
7
School of Earth and Planetary Sciences, Curtin University, Perth, WA 6102, Australia
*
Author to whom correspondence should be addressed.
Remote Sens. 2022, 14(9), 2037; https://doi.org/10.3390/rs14092037
Submission received: 31 March 2022 / Revised: 20 April 2022 / Accepted: 21 April 2022 / Published: 23 April 2022
(This article belongs to the Special Issue Application of Geospatial Analysis in Urban Environmental Health)

Abstract

:
In recent years, socioeconomic transformation and social modernisation in the Gulf Cooperation Council (GCC) states have led to tremendous changes in lifestyle and, subsequently, expansion of urban settlements. This accelerated growth is pronounced not only across vegetated coasts, plains, and mountains, but also in desert cities. Nevertheless, spatial simulation and prediction of desert urban patterns has received little attention, including in Oman. While most urban settlements in Oman are located in desert environments, research exploring and monitoring this type of urban growth is rare in the scientific literature. This research focuses on analysing and predicting land use–land cover (LULC) changes across the desert city of Ibri in Oman. A methodology was employed involving integrating the multilayer perceptron (MLP) and Markov chain (MC) techniques to forecast spatiotemporal LULC dynamics and map urban growth patterns. The inputs were three Landsat images from 2010 and 2020, and a series of covariate layers based on transforms of elevation, slope, population settlements, urban centres, and points of interest that proxy the driving forces of change. The findings indicated that the observed LULC changes were predominantly rapid across the city during 2010 to 2020, transforming desert, bare land, and vegetation into built-up areas. The forecast showed that area of land conversion from desert to urban would be 5666 ha during the next two decades and 7751 ha by 2050. Similarly, vacant land is expected to contribute large areas to urban expansion (2370 ha by 2040, and 3266 ha by 2050), although desert cities confront numerous environmental challenges, including water scarcity, shrinking vegetation cover, and being converted into residential land. Massive urban expansion has consequences for biodiversity and natural ecosystems—particularly in green areas, which are expected to decline by approximately 107 ha by 2040 (i.e., 10%) and 166 ha by 2050. The outcomes of this research provide fundamental guidance for decision-makers and planners in Oman and elsewhere to effectively monitor and manage desert urban dynamics and sustainable desert cities.

1. Introduction

Urban growth is causing major changes on the Earth’s surface. According to various spatial and non-spatial drivers, the rate of urban growth varies between developed and developing countries. During the last decade, urban growth in developing countries was estimated at 2.3% per year, while it was 0.5% across developed nations. Likewise, urban populations are forecasted to increase during 2020–2050 by 72% in developing countries, compared to only 13% for developed regions [1]. This difference can be attributed to the expected high rate of natural population growth in the developing nations. Currently, hyper-arid (desert), arid, and semi-arid areas cover 41.3% of the Earth’s land surface. One in three people in the world today live in dryland regions, and approximately 2.1 billion people live in desert lands [2]. It is likely that these urban agglomerations located in drylands will experience high rates of urbanisation due to continued population growth.
The world has witnessed significant changes in desert environments and ecosystems due to accelerated urban growth and sprawl [3,4,5]. Accordingly, significant effort has been made to monitor and forecast the dynamics of land use and land cover, particularly at the local scale, utilising GIS and remote sensing techniques [6,7,8,9,10]. Among the most visible impacts of urban sprawl is the degradation of vegetation and agricultural lands in arid and semi-arid environments [11,12,13,14]. Such changes are commonly associated with the various spatial drivers and human activities involving the conversion of crop land to settlements and housing units [15,16,17,18].
Conceptually, land cover is described as the natural characteristics of the Earth’s surface, including hydrological systems, surface water and groundwater, soils, vegetation, and topographic structure [19,20]. Land use is the result of the interaction between human activities and the landscape; for example, in the fields of agriculture and forestry, building expansion and infrastructure construction both trigger loss of productive lands [21,22]. Urban sprawl is a form of land-use change that has received extensive attention in the literature [23,24,25,26,27,28,29], which signifies an unplanned and uneven form of settlements to describe as ‘negative urban growth’, with poor accessibility to services [26,30]. Such patterns of urban growth trigger various environmental problems, including green cover loss, traffic congestion, and air pollution [31,32,33]. There exist three basic forms of sprawl: leapfrog, ribbon, and low-density continuous sprawl [34,35]. Leapfrog sprawl is a discontinuous urban pattern that occurs as urban objects separated from one another. This type of sprawl is often linked to constraints such as wetlands, rugged terrain, mineral lands, or lands that are separated by water bodies. Ribbon sprawl is associated with transportation networks, particularly along transport corridors and outward routes from urban cores. Low-density sprawl is characterised by high consumption of land along the fringes and development over large areas, with a low density of residential buildings.
In the literature, particularly regarding urbanisation in North America, there has been some debate about the definition of urban sprawl as uncoordinated growth and without community concern for planning. In particular, the nature of the sprawl and the local spatial scale of development determine whether sprawl is a modern form of urban growth or just an unplanned process and random type [24,36,37]. Accordingly, urban sprawl can be considered to be the result of various demographic, socioeconomic, and environmental pressures. In the GCC states, several factors and drivers are responsible for LULC changes towards accelerated urbanisation. These include demographic transition and population growth, rural–urban migration, rural lifestyle changes, modernisation, and governmental wellbeing policies. Nevertheless, in the GCC states, due to urban expansion and sprawl, large areas of arable and most other productive agricultural lands have been converted into residential zones and settlements. The ramifications of urban expansion and sprawl include landscape fragmentation, wildlife loss, and negative influences on rural livelihoods, biodiversity, and ecosystems.
During the last three decades, arid and semi-arid areas have witnessed rapid urban growth, which has impacted ecosystems, biodiversity, and the sustainability of natural resources [38,39]. At present, several desert environments and dry parts of the world—such as the American Southwest and Arabian Gulf regions—are home to big cities with large populations [40,41]. Although urban development in these areas has always been confronted by various environmental constraints—particularly drought, water scarcity, high temperatures, and dust storms—advanced technologies and innovations such as transportation systems, road networks, food supply chains, desalination, and air conditioning have allowed arid urban areas to grow exponentially. Nonetheless, these innovative technologies and drivers that support urban expansion in desert areas are limited, and have resulted in numerous challenges in terms of environmental sustainability, including habitat destruction, climate change, drought, deforestation, water stress, urban heat, air pollution, and public health crises [3,42,43].
The accelerated urban sprawl in arid areas in the GCC region is primarily shaped by various forces, such as cheap land, separated land uses, car-centric design, and the connection to regional and national road networks. In the literature, a much-debated question is whether to separate land-cover change and land-use change models, as land use is described by human activities, while land-cover change might happen due to natural processes such as climate change [44,45,46]. In spite of this debate on separating or integrating land use and land cover when addressing land changes, the majority of studies—particularly in the field of urban growth—forecast changes in both land types to incorporate the effects of human actions and ecological processes (e.g., [4,47,48,49,50,51,52]). Accordingly, and over the last two decades, spatiotemporal changes in LULC have been assessed and modelled utilising several GIS and remote sensing techniques, including cellular automata (CA), Markov chains, neural networks, and agent-based models (e.g., [4,47,53,54,55,56]).
Four main types of modelling techniques have been employed to simulate LULC changes: empirical–statistical, stochastic, optimisation, and agent-based models. The first type mostly includes regression techniques to empirically characterise the spatial causes of LULC changes [57,58,59]. Modelling the changes from one land category to another at the local scale, stochastic models—such as grid-based models—simulate LULC changes according to transition probabilities that are observed during past periods. The most well-known example of this model type is CA, whereby an LULC state transition is defined based on the state of neighbouring cells, and quite often it is combined with other models—particularly Markov chains [4,7,60,61]. Optimisation models utilise linear algorithms, including criteria for land allocations, to measure and assess how various policies influence land-use change. Several studies have employed optimisation techniques for modelling urban growth, noting that this type of model is limited to human activities that cannot be optimised in reality [62,63]. Dynamic-process-based models take into account human decision making, along with socioeconomic and environmental processes, when LULC changes are forecasted [46,64] Despite the wide implementation of the above models for LULC changes, a hybrid approach utilising multiple models has been recommended to increase the accuracy of the simulation process [20].
During the last four decades, oil revenue has directly influenced socioeconomic transformation in Oman, increasing the quality of life and leading to urban expansion. Local communities across Oman and other GCC states have integrated into the global capitalist markets, which has led to changes in ideological and cultural perspectives. These changes have transformed traditional societies into urban agglomeration. Despite its undeniable positive outcomes, oil revenue, combined with cultural changes, has led to cumulative rates of urban sprawl, and the loss of vegetation and agricultural lands. Subsequently, pressure on natural resources such as fertile soils, underground water, and vegetation has led to substantial degradation of ecosystem production across bare land, and this is likely to increase further with forecasted growth in population.
Despite the wide range of existing research on LULC changes across the Middle East, desert urban areas across the GCC region—especially Oman—have not been adequately investigated. In Oman, urban agglomerations have their own unique characteristics and spatial diversity, with oases, coasts, mountains, and deserts shaping the cities and towns. Although the influence of land surface developments on ecosystems and the nature of these environments is well known, the precise spatial dynamics of desert landscapes in Oman have not been assessed. Therefore, and due to the continuing, rapid socio-economic and environmental changes, efficient and reliable simulation and assessment of LULC dynamics in desert areas is crucial—not only to investigate the nature of LULC changes, but also to preserve ecosystem functionality across desert environments. Utilising remote sensing techniques and advanced GIS methods to simulate and forecast desert urban environments not only across the GCC region, but also globally, is still quite rare. To fill this gap, the primary aim of this research was to assess recent LULC changes across the urban desert of Oman, and determine their major drivers, as well as forecast future patterns, using satellite images and advanced geospatial techniques. The following specific research questions of this work are:
  • What is the nature of desert urban dynamics across cities and towns in Oman?
  • What are the dominant drivers of LULC across the desert urban environments of Oman?
  • What are the magnitude and directions of LULC changes across desert urban areas? To what extent do these urban dynamics affect green cover?

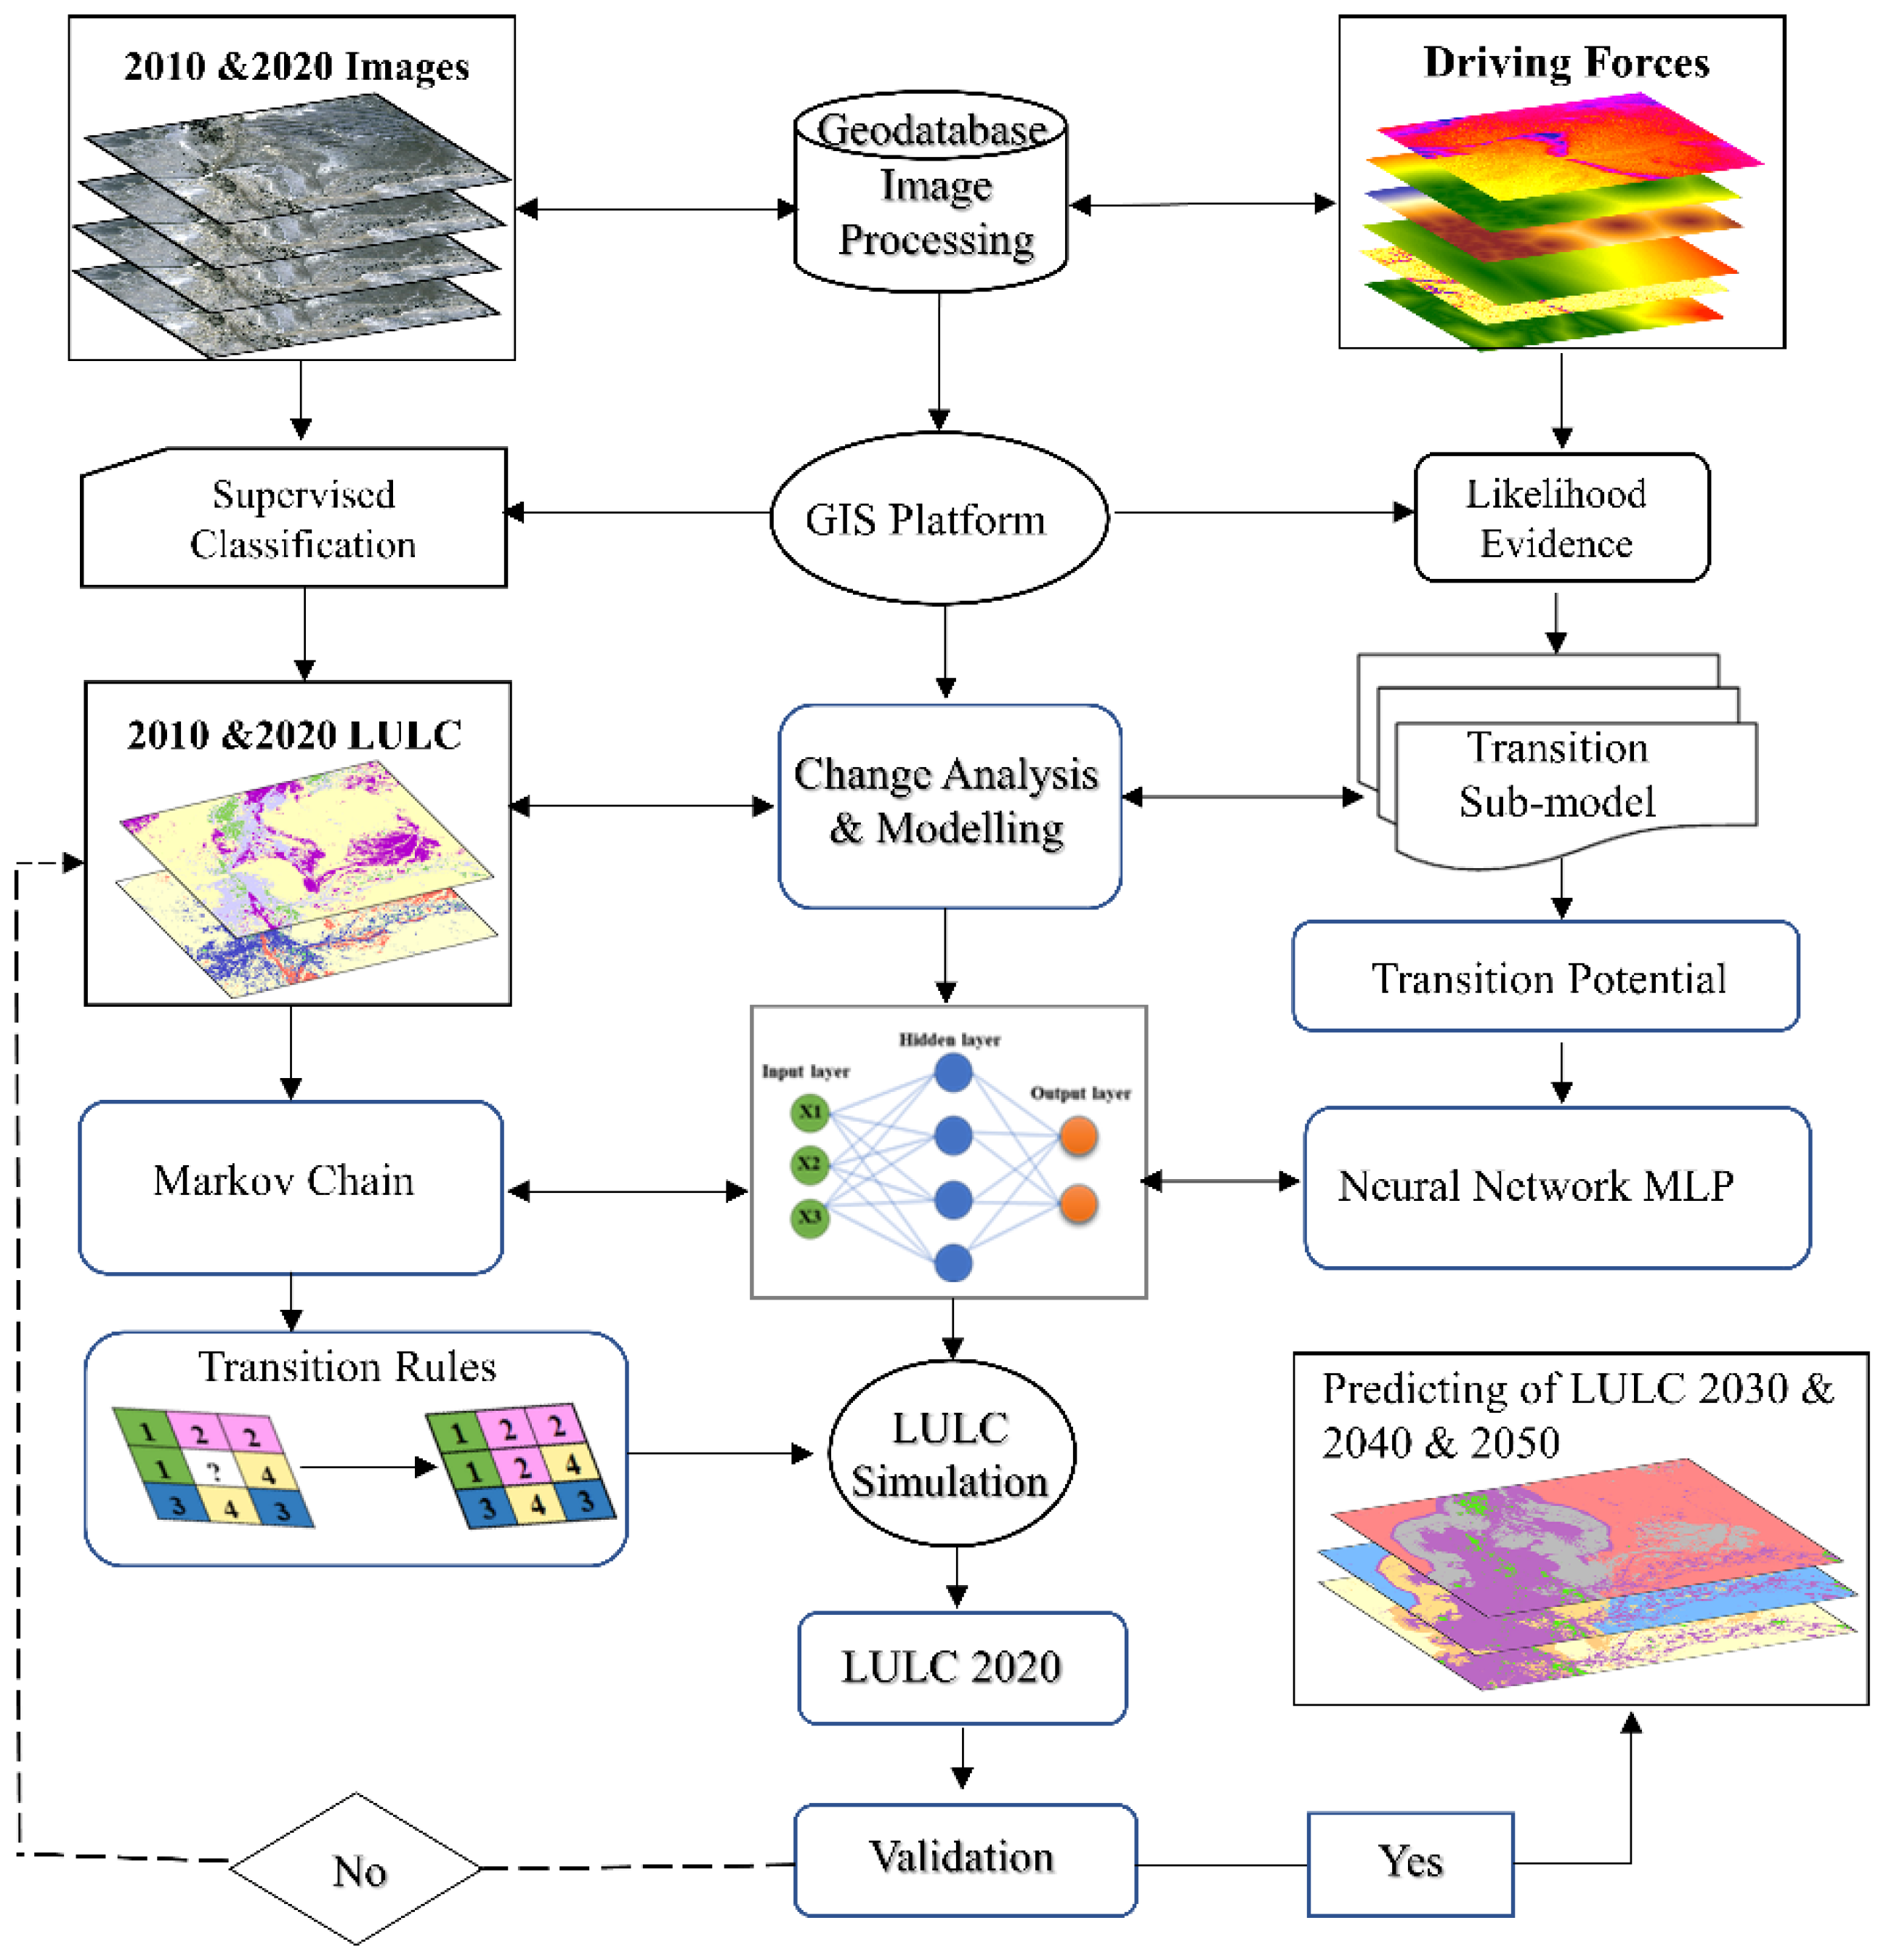
2. Materials and Methods
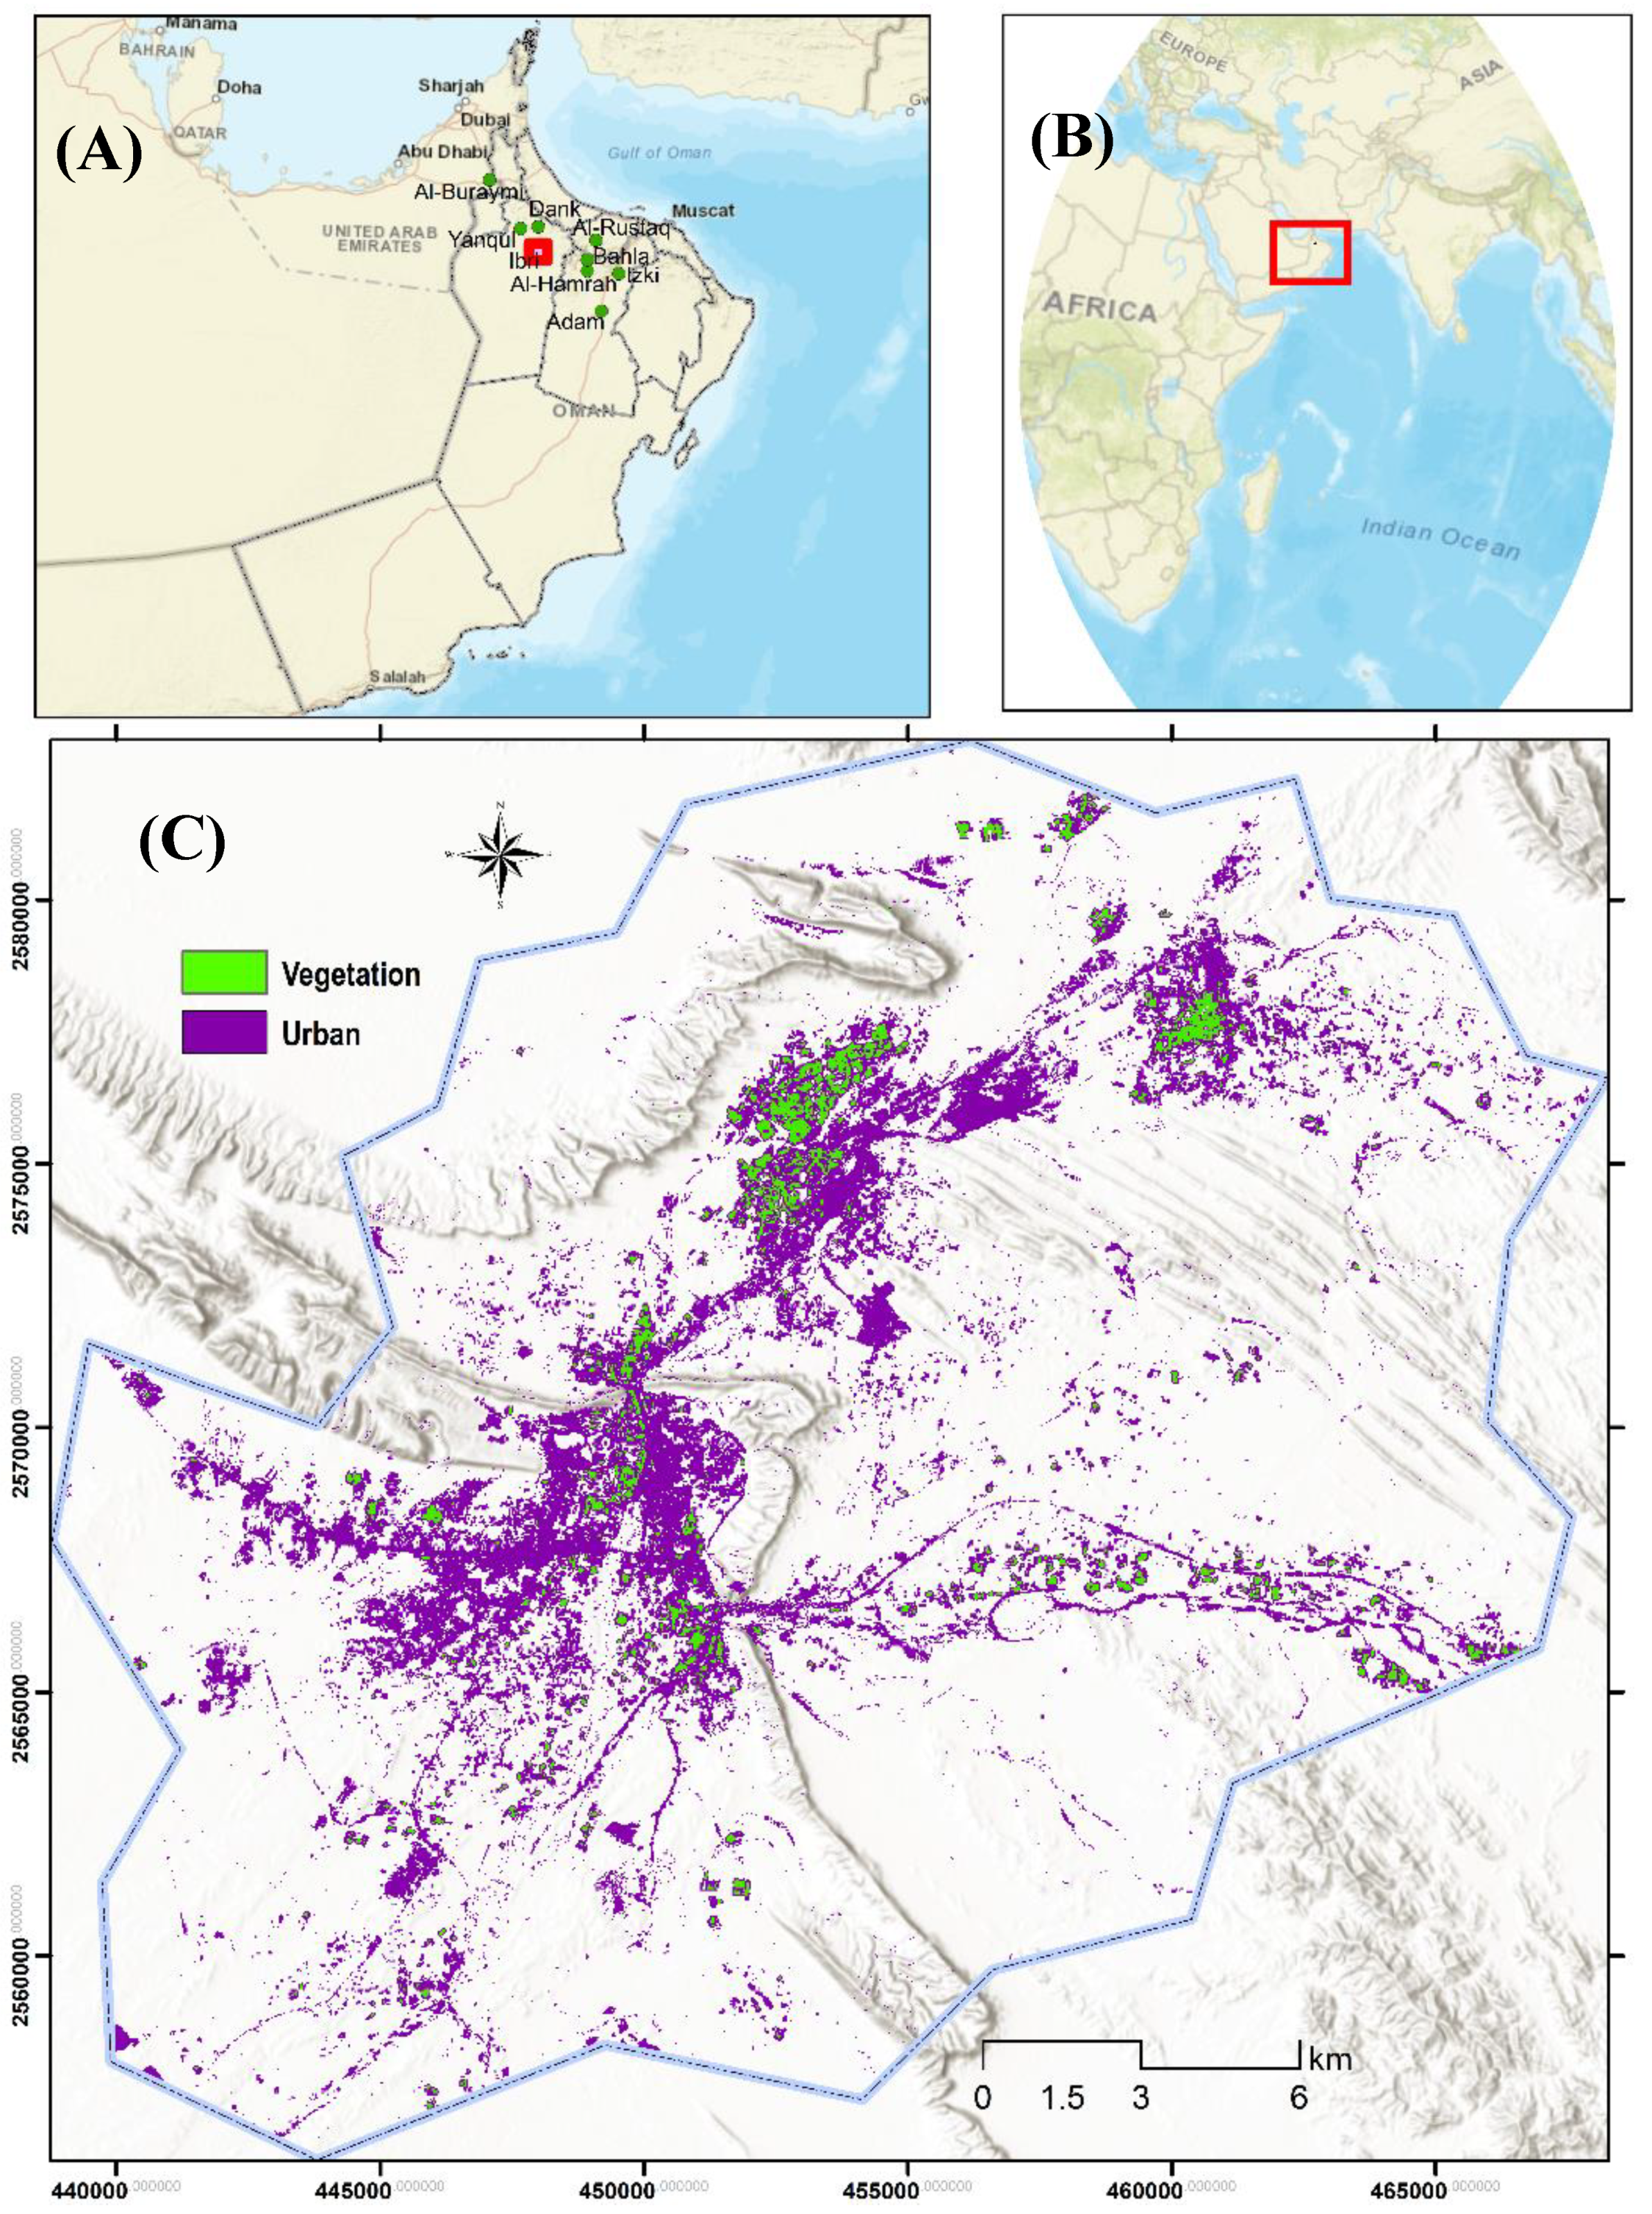
2.1. Study Area

The study area is located between 23.15° and 23.3° north, and 56.38° and 56.56° east. Geographically, the city of Ibri is situated in Wilayat Ibri, which is located towards the northeast corner of Al-Dhahra Governorate (one of the 11 Omani governorates). It is the capital of the Al-Dhahra North region (Figure 1). The city is located about 279 km away from Muscat—the capital of Oman—and it is bordered to the south by Haima and to the east by Bahla, Al-Hamra and Al-Rustaq. To the north, it borders Al-Buraimi, Dhank, and Yanqul, while to the northwest it borders the United Arab Emirates, and Saudi Arabia to the southwest. The city of Ibri is the largest within the governorate, and it consists of sprawling urban agglomerations, with a major highway connecting it to Buraimi in the northwest and Nizwa in the southeast. Due to its location, the climate of Ibri is considered to be desert, with an average annual temperature of 26.2°C. The amount of rain falling on the city is almost 78 mm annually, and it is higher in the winter than in the summer.
In 2020, the total population of the city reached almost 60,000 inhabitants, and it is expected that this number will reach 130,000 inhabitants by 2040. Spatially, Al-Dhahra Governorate (in which the city of Ibri is located) has prepared a regional urban strategy that includes various resilience criteria and socioeconomic drivers, specifically to aid in restructuring and planning to accommodate urban sprawl and expansion [65]. The city of Ibri is characterised by its archaeological sites and monuments, including forts, castles, and towers, such as Bait al-Sarooj. Throughout history, the city of Ibri has been a major crossing point for trade caravans heading to various locations in the Arabian Peninsula. The city serves as a rest destination on the way to or from the UAE, where most travellers visit the UNESCO-protected cemeteries in Al Ain and Wadi Hajar. In Ibri, there are many conventional crafts and industries, the most prominent of which are grazing, weaving, and agriculture with a variety of crops, including dates of different types, wheat, oranges, grapes, citrus, vegetables, and animal fodder. In addition, many traditional crafting industries are found in the city, such as camel-decorating tools, leather, pottery, palm fronds, and Omani sweets. There also exist several valleys that are home to traditional farming villages. At present, the Empty Quarter’s border with Saudi Arabia has been opened to the west of Ibri for pilgrims to Mecca. Despite the fact that the study area is a desert region with distinctive geography, during the last decade, Ibri has witnessed comprehensive socioeconomic development and pronounced urban growth. For example, currently there are 57 schools, 2 hospitals, a health centre, and a nursing institute, in addition to the College of Applied Sciences’ sports complex and vocational training centre and a satellite station.

2.2. Data Acquisition and Processing

Methodologically, several spatial datasets including satellite images and geographic information as spatial layers were incorporated into the LULC change simulation process. Figure 2 represents the methodological framework of employing MLP and MC models within a GIS platform to forecast the dynamics of LULC across the city of Ibri.

2.2.1. Satellite Imagery

To measure and forecast potential future changes in LULC, Landsat satellite sensor images with a spatial resolution of 30 m for the periods 2000, 2010, and 2020 were downloaded from the United States Geological Survey (USGS). To avoid seasonal variation between the images, all images were acquired in the same month (January). The cloud cover threshold was set to <10%, and all acquired images had zero or close to zero cloud cover over the study area. Attributes of these images are given in Table 1. The 2010 Landsat 7 ETM+ image was characterised by the scan line corrector (SLC) and, consequently, strip lines (almost 22% of the pixels per scene) were corrected utilising the Landsat toolbox’s ‘fix Landsat 7’ scan line error [66,67].

2.2.2. LULC Classification and Accuracy

The LULC classification was initially undertaken using the maximum likelihood classifier (MLC) to produce four classes (i.e., vegetation, urban, bare land, and desert), defined as follows: The vegetation category includes all plant types over a large surface, including date palm trees, cultivated lands, grass, agriculture, and croplands. The urban class encompasses residential and commercial settlements, industrial areas, urban agglomerations, roads, bridges, transportation networks, infrastructure, and urban amenities. The bare land category represents land that is not being used, with no buildings or settlements—often bare soil. For urban areas that are under development, bare land is required by urban residents to build houses or establish urban activities, and it is the key competitive asset for the urbanisation processes. Finally, desert is barren land that is non-vegetated, with little precipitation, often consisting of large areas of rocks and sand covering the entire landscape.
Implementing an accuracy assessment is a crucial step required to assess the reliability of the classified images [68,69]. Using a reference dataset, the accuracy of the classified images was determined. This was conducted through creating ground reference data and comparing them to classified images. The user accuracy (UA), reflecting the probability that a pixel that is classified on the map represents the correct land class in reality, was calculated as follows:
  UA = CP TP
where CP denotes correctly classified pixels in each LULC category, and TP indicates the total number of classified pixels in each LULC category. The producer’s accuracy (PA), representing the probability of a reference data pixel being correctly classified, is defined as follows:
PA = CP RP
where CP signifies correctly classified pixels in each LULC class, and RP specifies the total number of reference pixels in each LULC category.
Kappa statistics aim to adjust the actual agreement between points on the map and on the ground for the agreement expected by chance [70]. From a confusion or error matrix, the Kappa coefficient was calculated as follows:
K = N i = 1 r x i i i = 1 r ( x i + × x i + )   N 2 ( x i + × x + i )  
where N indicates total number of points, r is the number of rows in the error matrix, xii refers to the number of points in row i and column i, xi+ specifies the marginal total for row i, and x+i represents the marginal total for column i.

2.2.3. Multilayer Perceptron (MLP)

A multilayer perceptron (MLP) model—a machine learning technique—was utilised in this research to compute the potential transition of LULC categories based on previous LULC maps. The calculated transition probabilities capture the influence of environmental and socioeconomic driving forces on LULC changes [71]. An MLP consists of several inputs (variables or drivers), one or more hidden layers, and an output layer. Each hidden layer receives the values from the initial input layer, and then a weight is computed before passing the information to the output layer to produce results [72]. Throughout the weighting process, the MLP structure allows inputs to transfer through the layers, where each neuron receives data from the previous layer and calculates a weighted sum of all of its net inputs, as follows:
LULC i = f j = 1 n w i j x j + b i
where LULCi indicates the output at node i, f is an activation function, x represents the inputs or drivers (x1, xi, … xn), w represents the weights (w1j,…wij,…wnj), wij is the weight connection from the ith node in the preceding layer to node j, and bi is a constant that modifies the output along with synaptic weights to optimise the model fit. In the MLP, the value of a neuron N can be specified as follows:
u N = j = 1 k w k j x j
where the value uN is a linear combination, and wk1, wk2, … wkn represent the synaptic weights of neuron N. The output of the neuron N can also be expressed as follows:
y N = ( u N θ N )
where is the action function (linear or nonlinear), and θ k is the threshold.

2.2.4. Markov Chain (MC)

A Markov chain is a stochastic model characterising a sequence of temporal events in which the forecasted event depends entirely on the current status of the dynamic phenomenon being simulated [73]. In modelling urban growth, the algorithm starts by determining a specific temporal basis to generate the possible transformation between various LULC categories through a transition probability matrix. In this research, an MC model was employed to estimate LULC changes for three decades in the future:
S ( t + 1 ) = M i j × s ( t )
where S(t) and S(t + 1) are the LULC types at time t and t + 1, respectively, and Mij is the transition probability matrix in a state, which is calculated as follows:
M = M i j = [ M 11 M 12 M 1 n M 21 M 22 M 2 n M n 1 M n 2 M n n ] ( 0     p i j <   1   and   j = 1 N M i j = 1 ,   ( i , j = 1 ,   2 , . . n )
where M is the Markov transition matrix, i and j are the LULC type at the first and second time, respectively, Mij signifies the probability of LULC type i changing to type j, and N denotes the number of LULC classes in the study area.

2.2.5. Spatial Trends

To measure the rate of LULC change across the study area, trend surface analysis was applied, defined mathematically as follows [74]:
S = i = 0 k j = 0 i b i j x i j y j
where S refers to the interpolated surface, k denotes the maximum order to be generated, and b represents a coefficient of the polynomial. Both i and j are iteration parameters associated with k, in which i = 0, … k and j = 0, … i.

3. Results

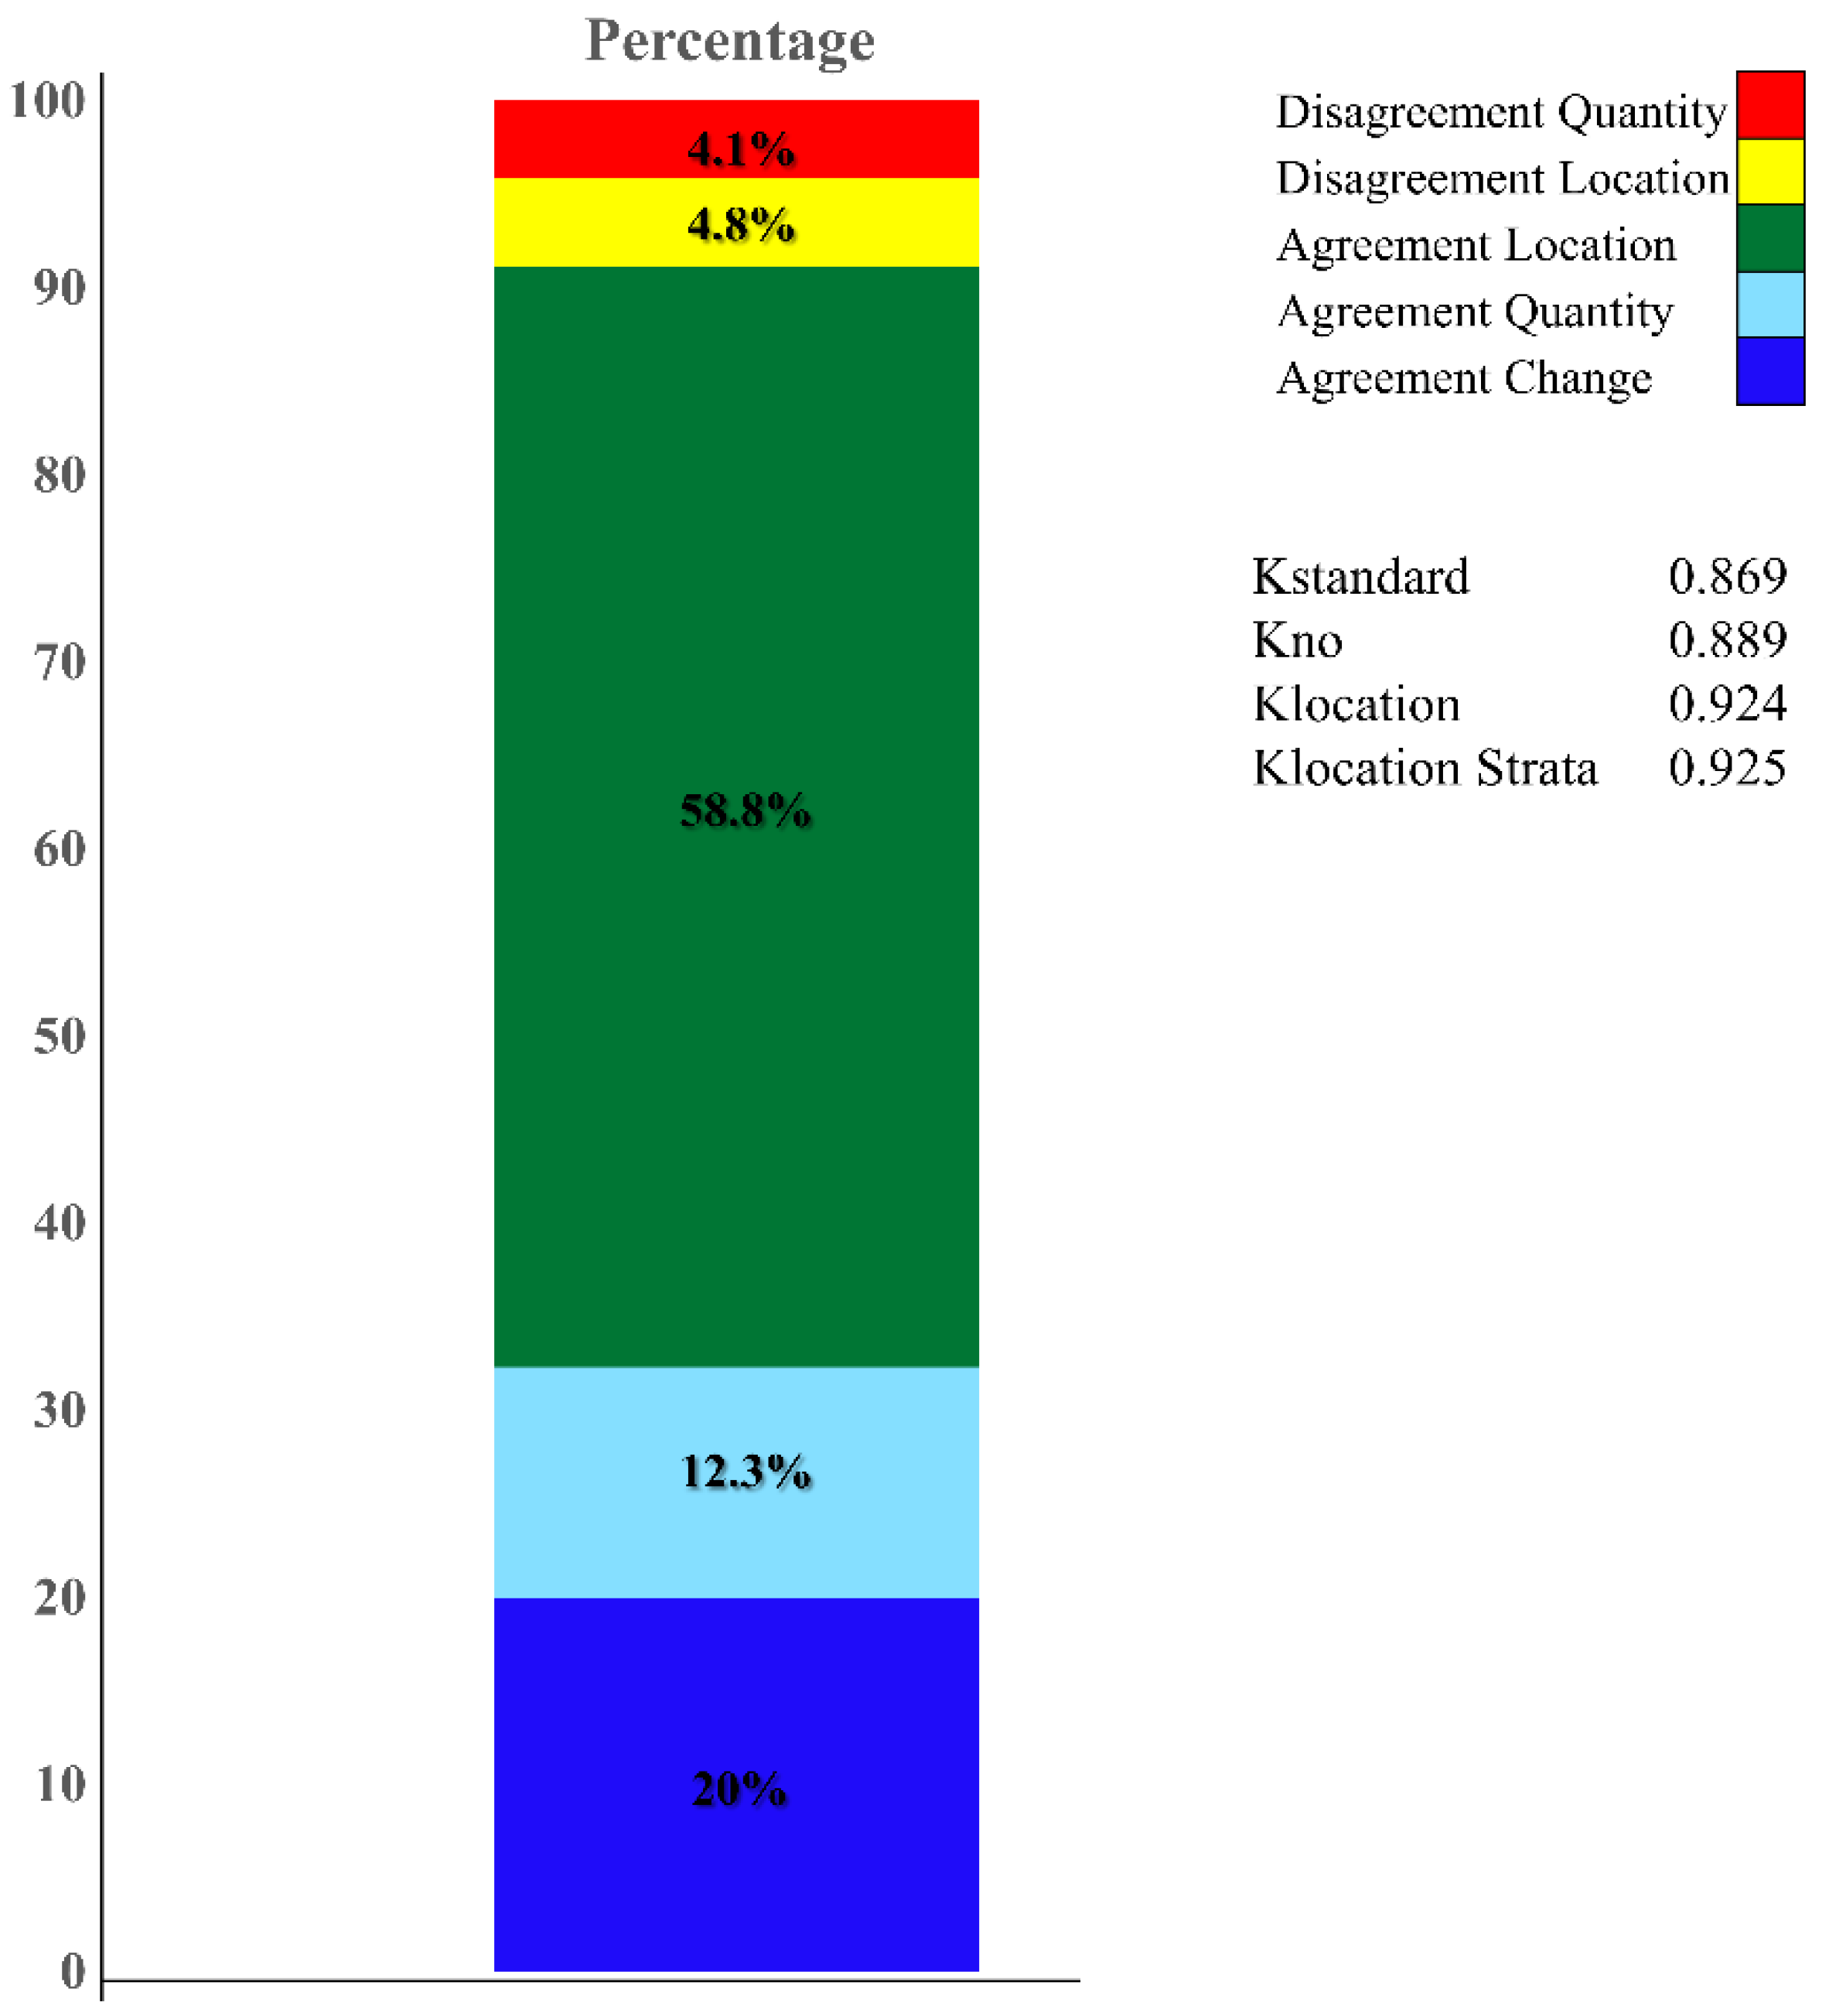
3.1. Model Validation

Validation is a crucial step in any predictive modelling process. To assess model accuracy, a Kappa test was performed comparing the simulated 2020 LULC map with a reference map from the same year. Figure 3 illustrates several indices and parameters of the test through which quantity, agreement, disagreement, and pixel allocation can be assessed. A Kappa value of 0% shows that the agreement level between the two maps is due to chance, while 100% indicates perfect agreement. In this model, 58.8% of simulated LULC changes were correctly allocated, and the proportion of agreement quantity was 12.3% of the changes. The quality disagreement and location disagreement together represented less than 9%. The parameters Kno, Kstandard, and Klocation measure the overall accuracy of the model. The Kno value was 88.9, indicating very high agreement between the actual and predicted 2020 maps. Likewise, the value of Klocation was 86.9, indicating a higher level of the model’s outcome accuracy. The output of the validation process also shows that the model was robust and accurate in simulating the future LULC dynamic scenarios across the study area.

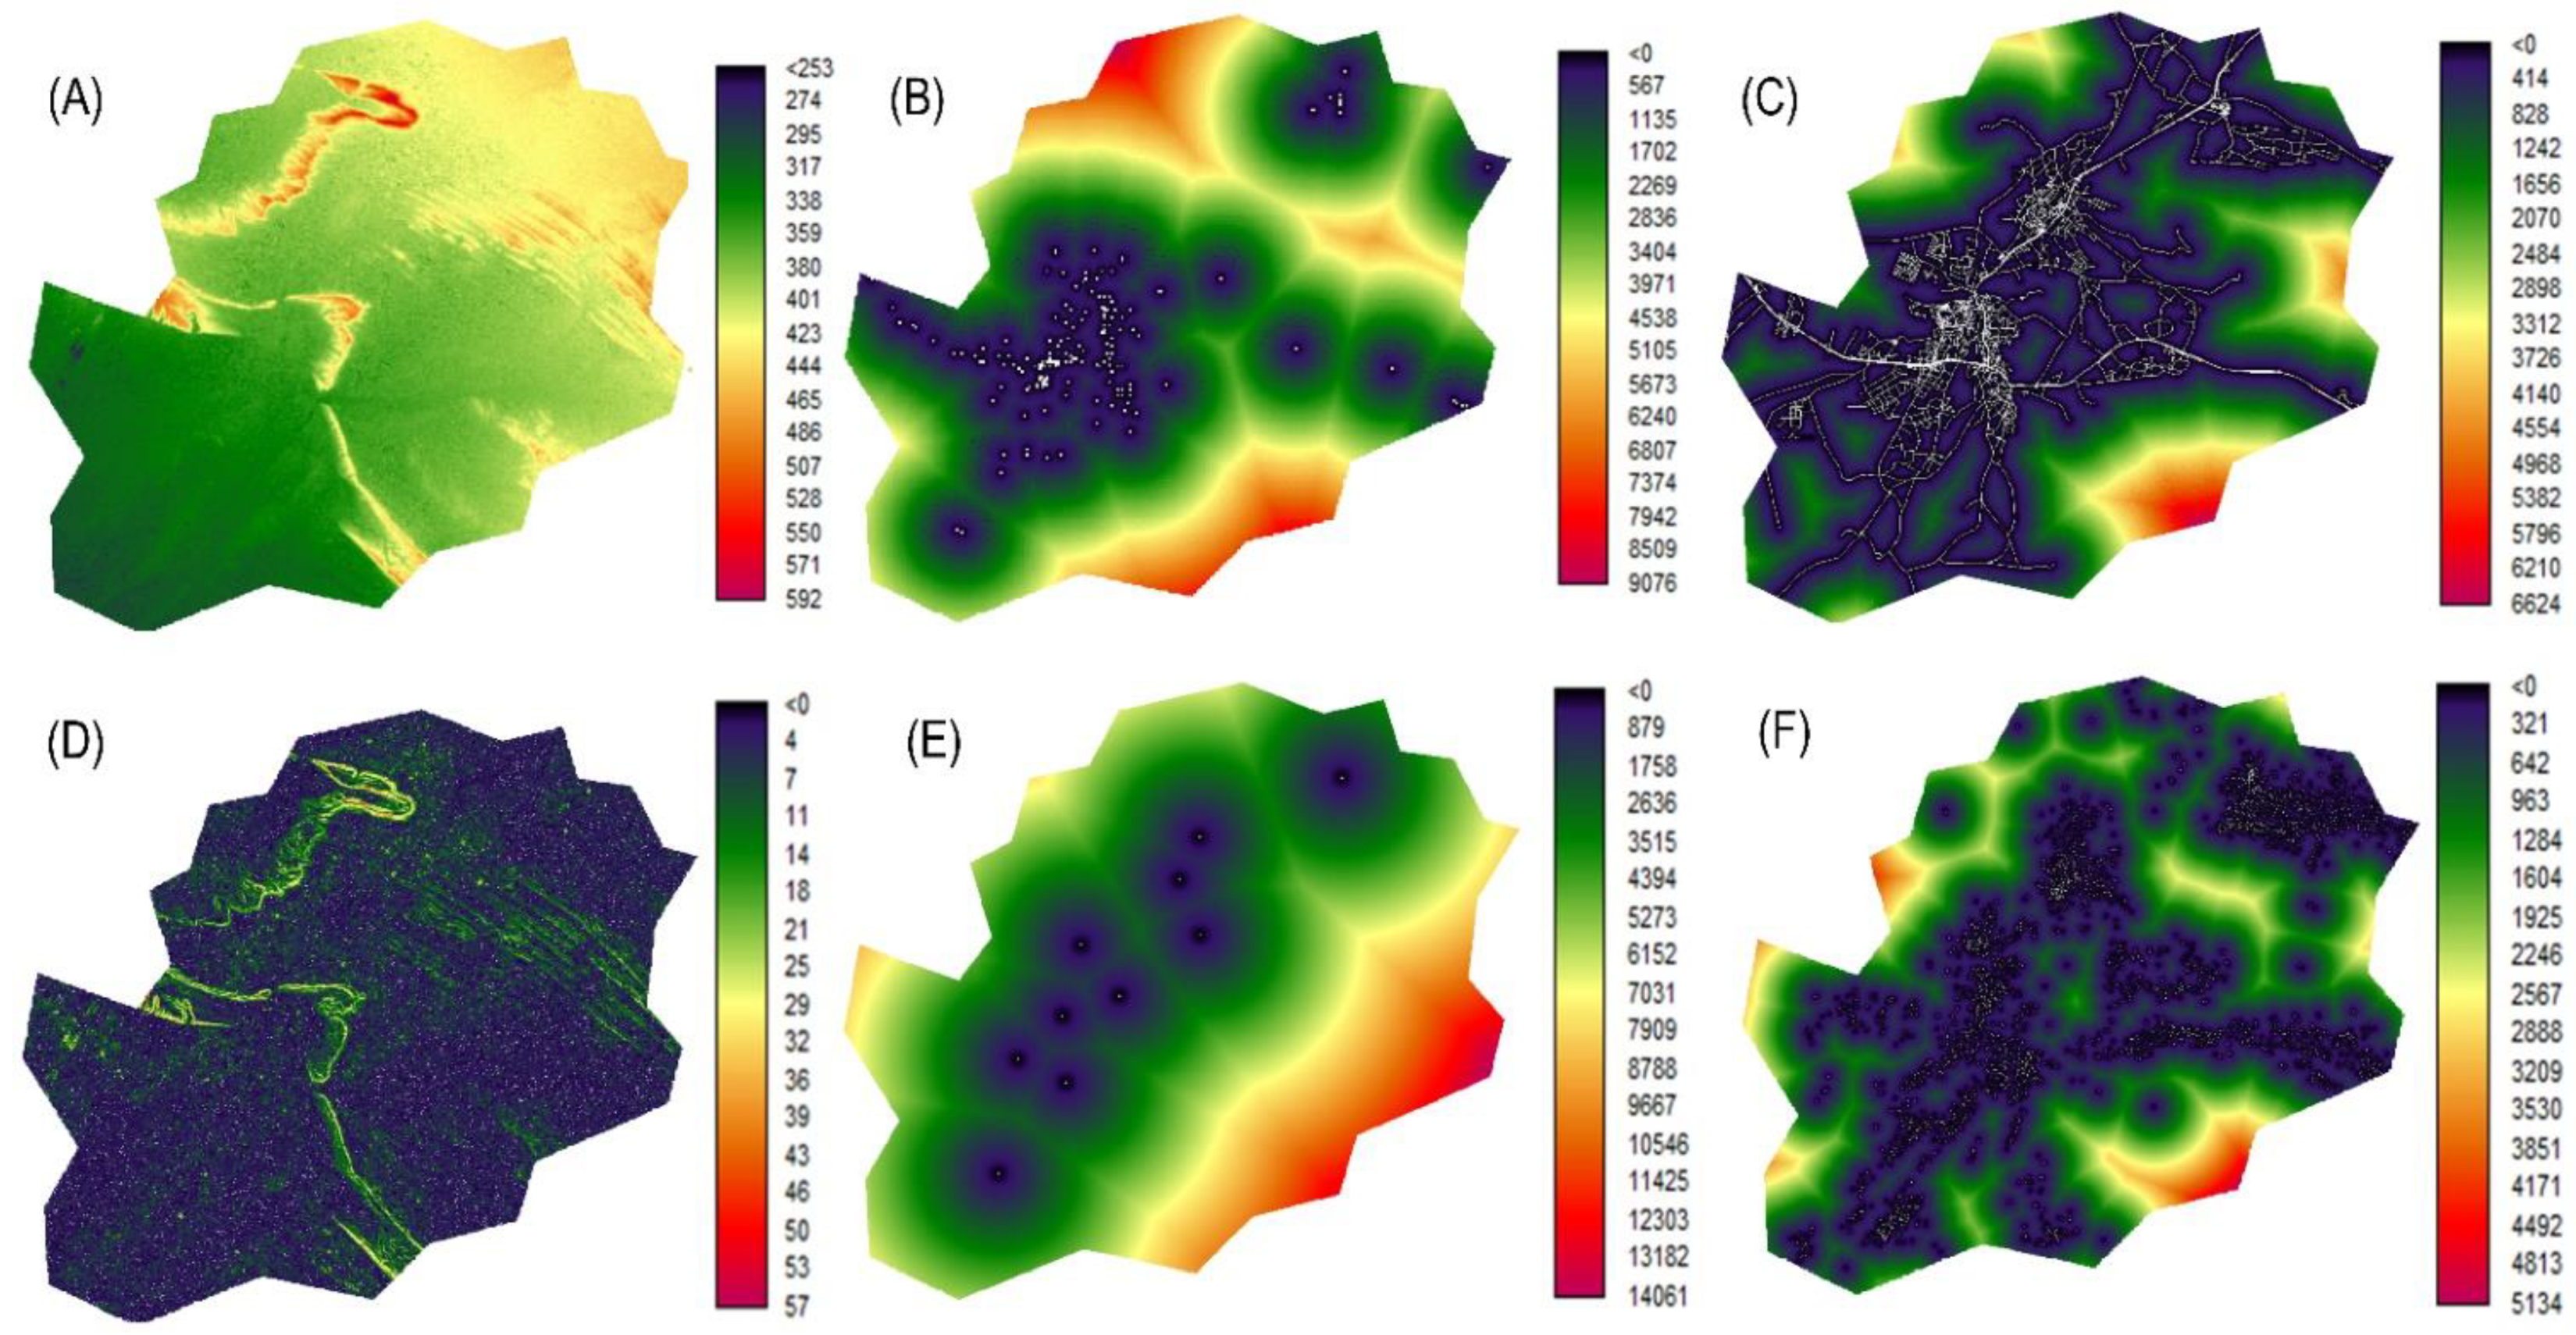
3.2. Driving Forces of Urban Dynamics

Urban growth and land-use changes in the study area are influenced by human activities and environmental factors—particularly with respect to the availability of arable land and water resources. The driving forces or causes of urbanisation in the city of Ibri can be classified into six major socioeconomic and topographical factors: elevation, slope, distance to roads, distance to urban centres, distance to points of interest (POIs), and distance to underground water wells (Figure 4). The topographical variables (elevation and slope) are important constraints on urban growth, especially in areas with poor natural resources and environmental conditions. As the city consists of fairly flat land, except for hilly areas that are located in the northwest, the middle, and the southeast, urban expansion has been shaped by linear features constrained by these hills (Figure 4A,D). The distance to roads fundamentally influences the growth direction in two ways: First, as the road network determines access, expansion over barren lands can accelerate rapidly near major roads, where access to urban facilities and amenities is available. Second, major roads cause a ‘leapfrog’ urban pattern and sprawl, particularly across the marginal parts of the city. Hence, most of the marginal agglomerations rely heavily on highways to access the city centre and other neighbouring cities (Figure 4C). The dynamic process of urban growth is governed by accessibility to amenities and day-to-day facilities—particularly health and educational services. Most urban amenities are concentrated in the central and northwestern parts of the city; thus, new urban agglomerations are expanding and clustered close to these amenities (Figure 4B).

3.3. LULC Probability Transitions

Proximity to urban centres has been identified as an important driver of urban dynamics. These centres act jointly with other forces, and operate spatiotemporally to drive urban changes across the city. The urban centres are located along linear patterns, and stretch from northeast to southwest (Figure 4E). The vacant lands within and close to these centres usually attract large numbers of migrants and locals to establish businesses and construct new houses. Consequently, the most recent urban growth has occurred rapidly surrounding these centres. In desert regions, water resources are vital and, thus, crucial for urban development.
Although a large reduction in domestic and commercial use of groundwater has been targeted by the government, relying instead on wastewater treatment and desalination, underground water infrastructure—particularly from the drilling of wells—is still a major supply of urban water. The spatial distribution of wells across the study area is linked with barren land, soils, dams, rocky basins, and the flow of dry valleys, and they are less concentrated in marginal areas (Figure 4F).

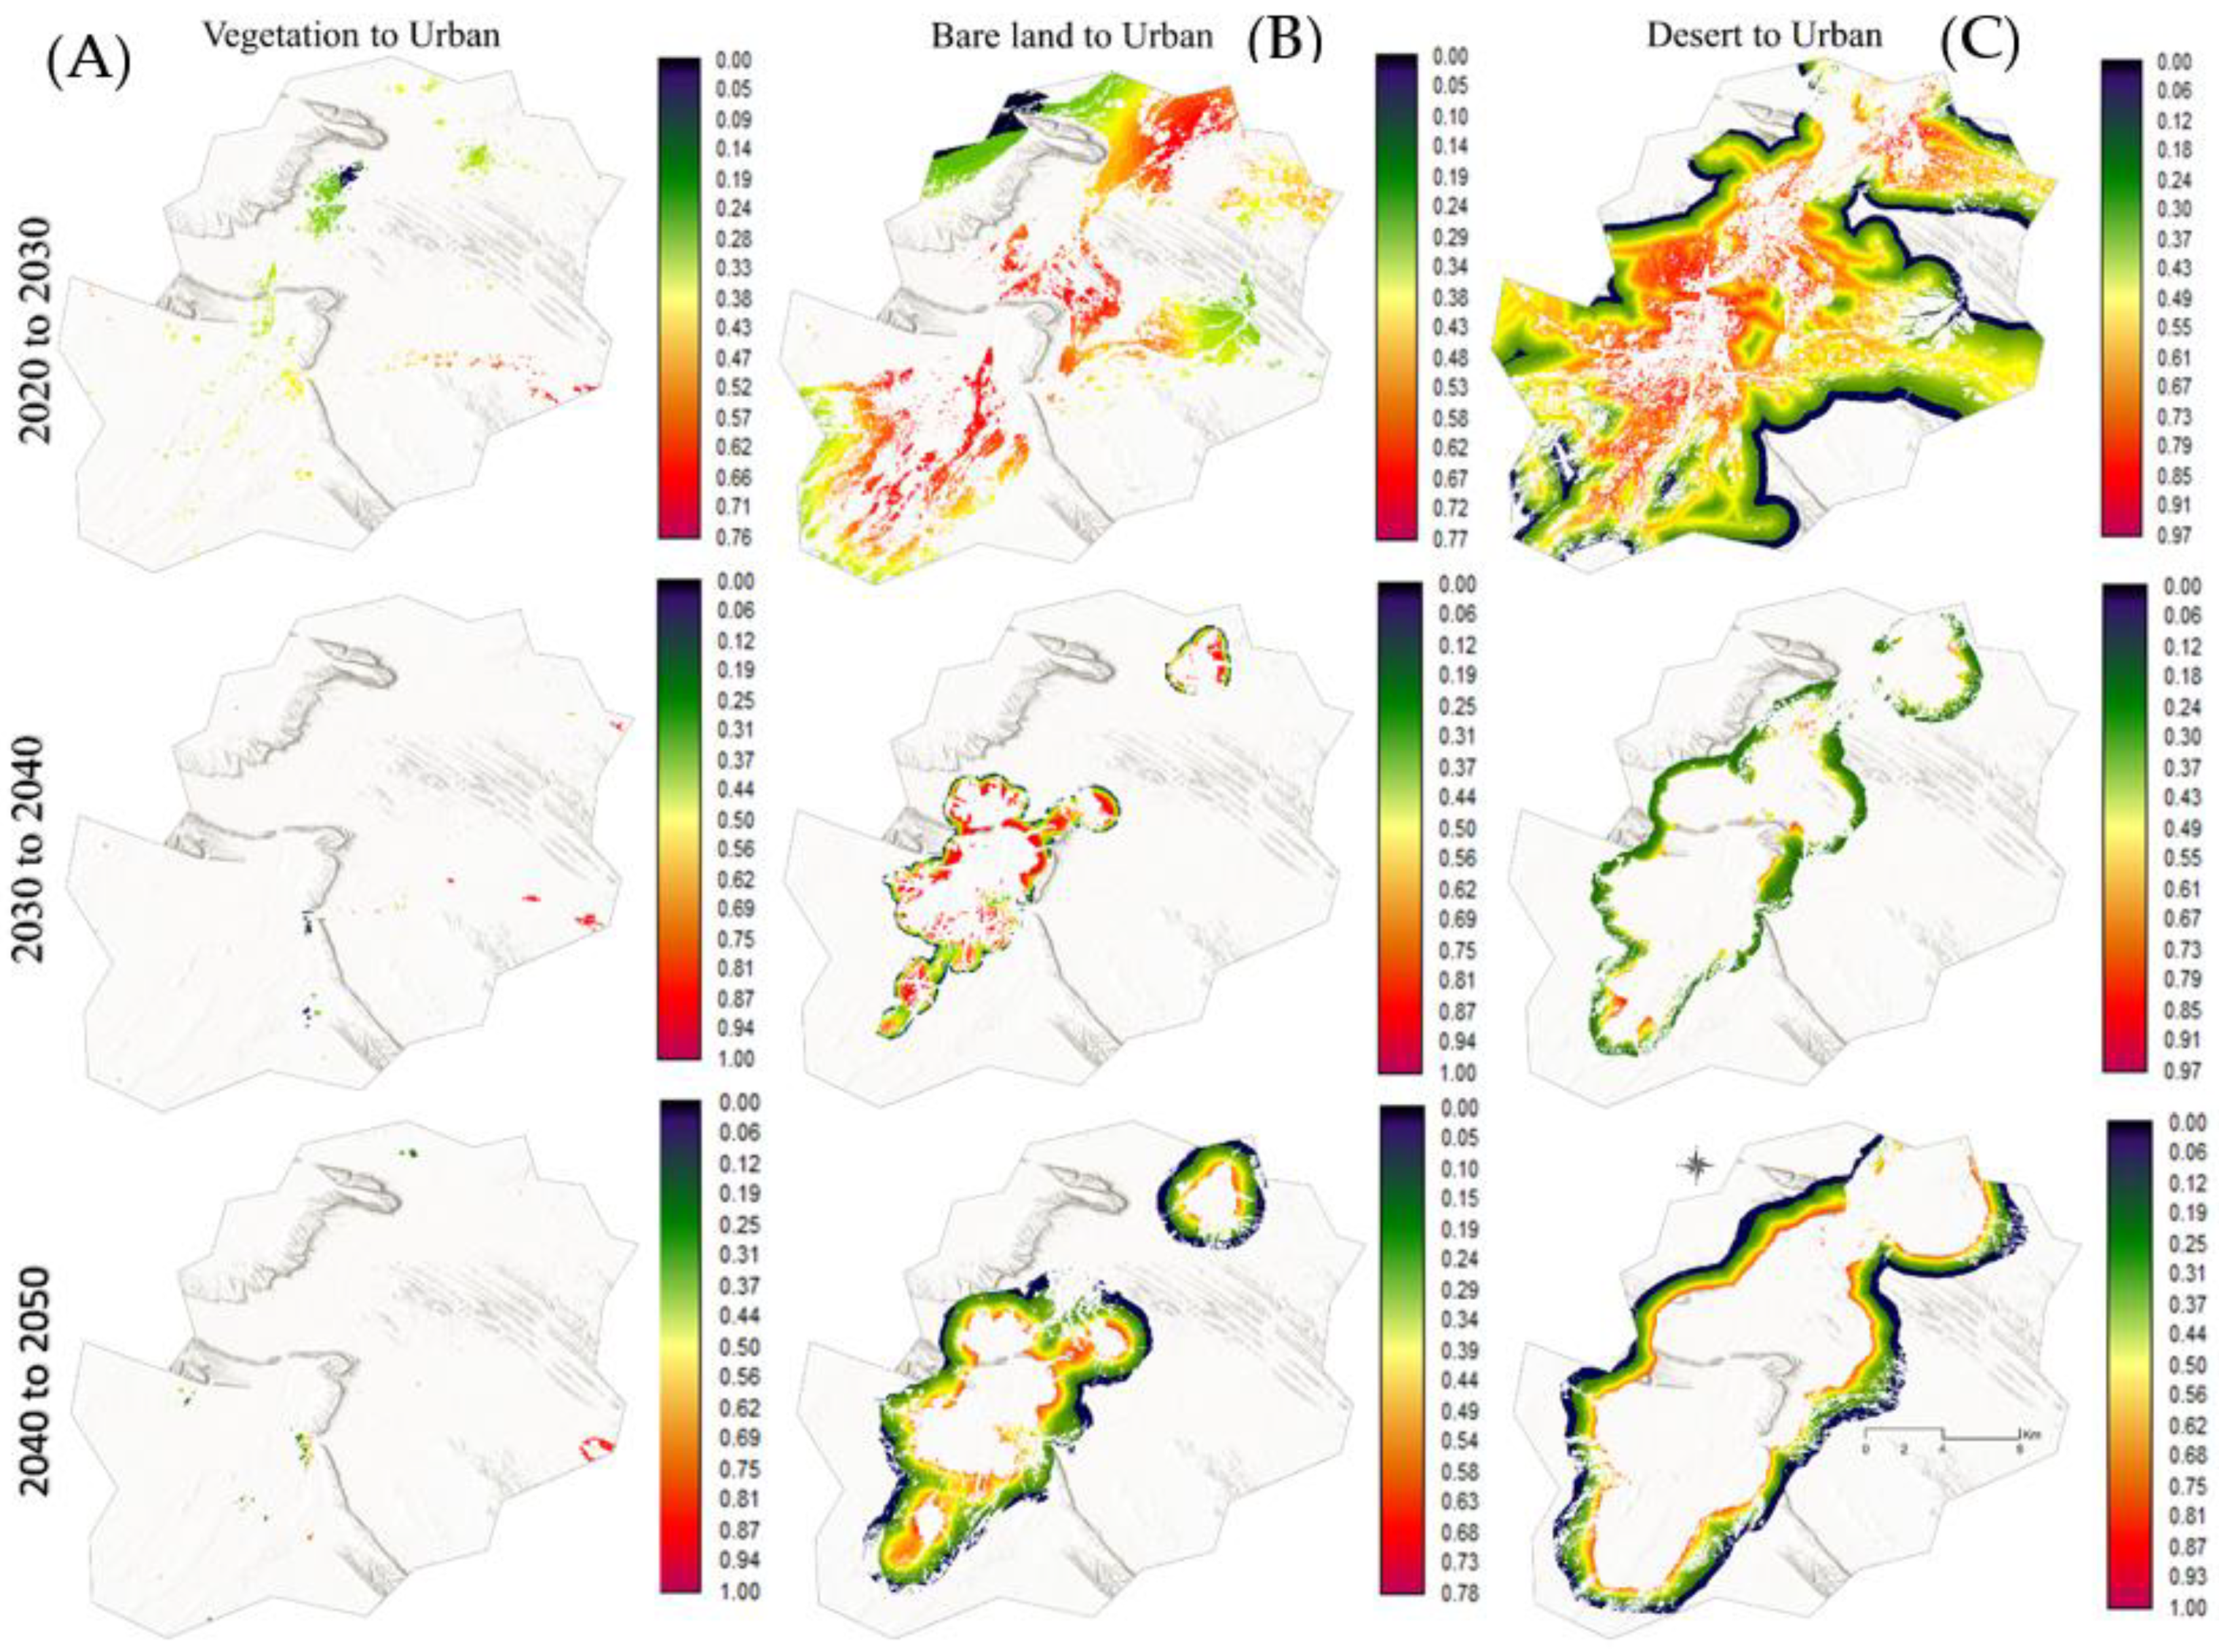
3.4. MLP Simulation of Transition Potential Changes

In this study, since the key concern was to model desert urban areas, the transition probabilities were limited to only land transformation into urban land (e.g., transformation from bare land into built-up areas). The MLP was employed to create the transition layers, and each driver (variable) was selected only if it was significantly influential on overall accuracy and skill measure. Accordingly, drivers with no positive impact were eliminated from the model. Methodologically, the MLP is a robust technique based on its capability to develop multiple transitions (up to nine) at once. The test of the MLP model indicated high accuracy (93.8%) (Table 2), which was higher than the acceptance cutoff (80%). The skill measure statistic can vary between values of −1 (no skill) and 1 (perfect forecasting).
In this study, the skill measure of the model was 0.87 (87%), denoting an accurate simulation of LULC dynamics, and confirming an appropriate selection of driving factors related to urban growth. Table 3 illustrates the results of testing the transition from bare land to urban land and forcing a single independent variable to be constant. The output indicates that the most influential driver on transition from bare land to built-up areas was elevation, while the least influential was distance to urban centres.
As the skill of the MLP increases by eliminating a chosen driver each time, the backward stepwise method was implemented, and the results (Table 4) demonstrate that the selected six driving factors were the best combination; thus, these variables can be utilised to forecast LULC changes. Consequently, no factors were eliminated from the MLP model.
By completing the MLP model training, transition maps showing potential areas for urban transformation were produced (Figure 5). Forecasting LULC changes in 2030, the probability of vegetation being transformed into urban land was high in the east and southeast, while it was low in other parts of the city. Regarding the forecasting of the transformation of bare land into built-up areas, a high probability was observed across the northern, central, and southern parts of the city. Indeed, these places include most of the vacant land around existing settlements and residential districts. The probability of desert land transforming into urban land was significantly higher in the central, western, northeastern, and southwestern areas. This type of land includes sandy areas and open spaces, particularly along the outer and marginal parts of the city. The transition potential and likelihood of LULC change in 2040 shows that small, isolated areas of vegetation located in the western part of the city have a high probability of changing into urban land. The potential for the conversion of bare land to urban land in 2040 was also high in the central and northern parts. Regarding the probability of desert land transforming into urban land, it was high in small, scattered patches throughout the southern parts of the city. In 2050, the potential probability of transformation of different LULC types into urban land was similar to that for 2040.

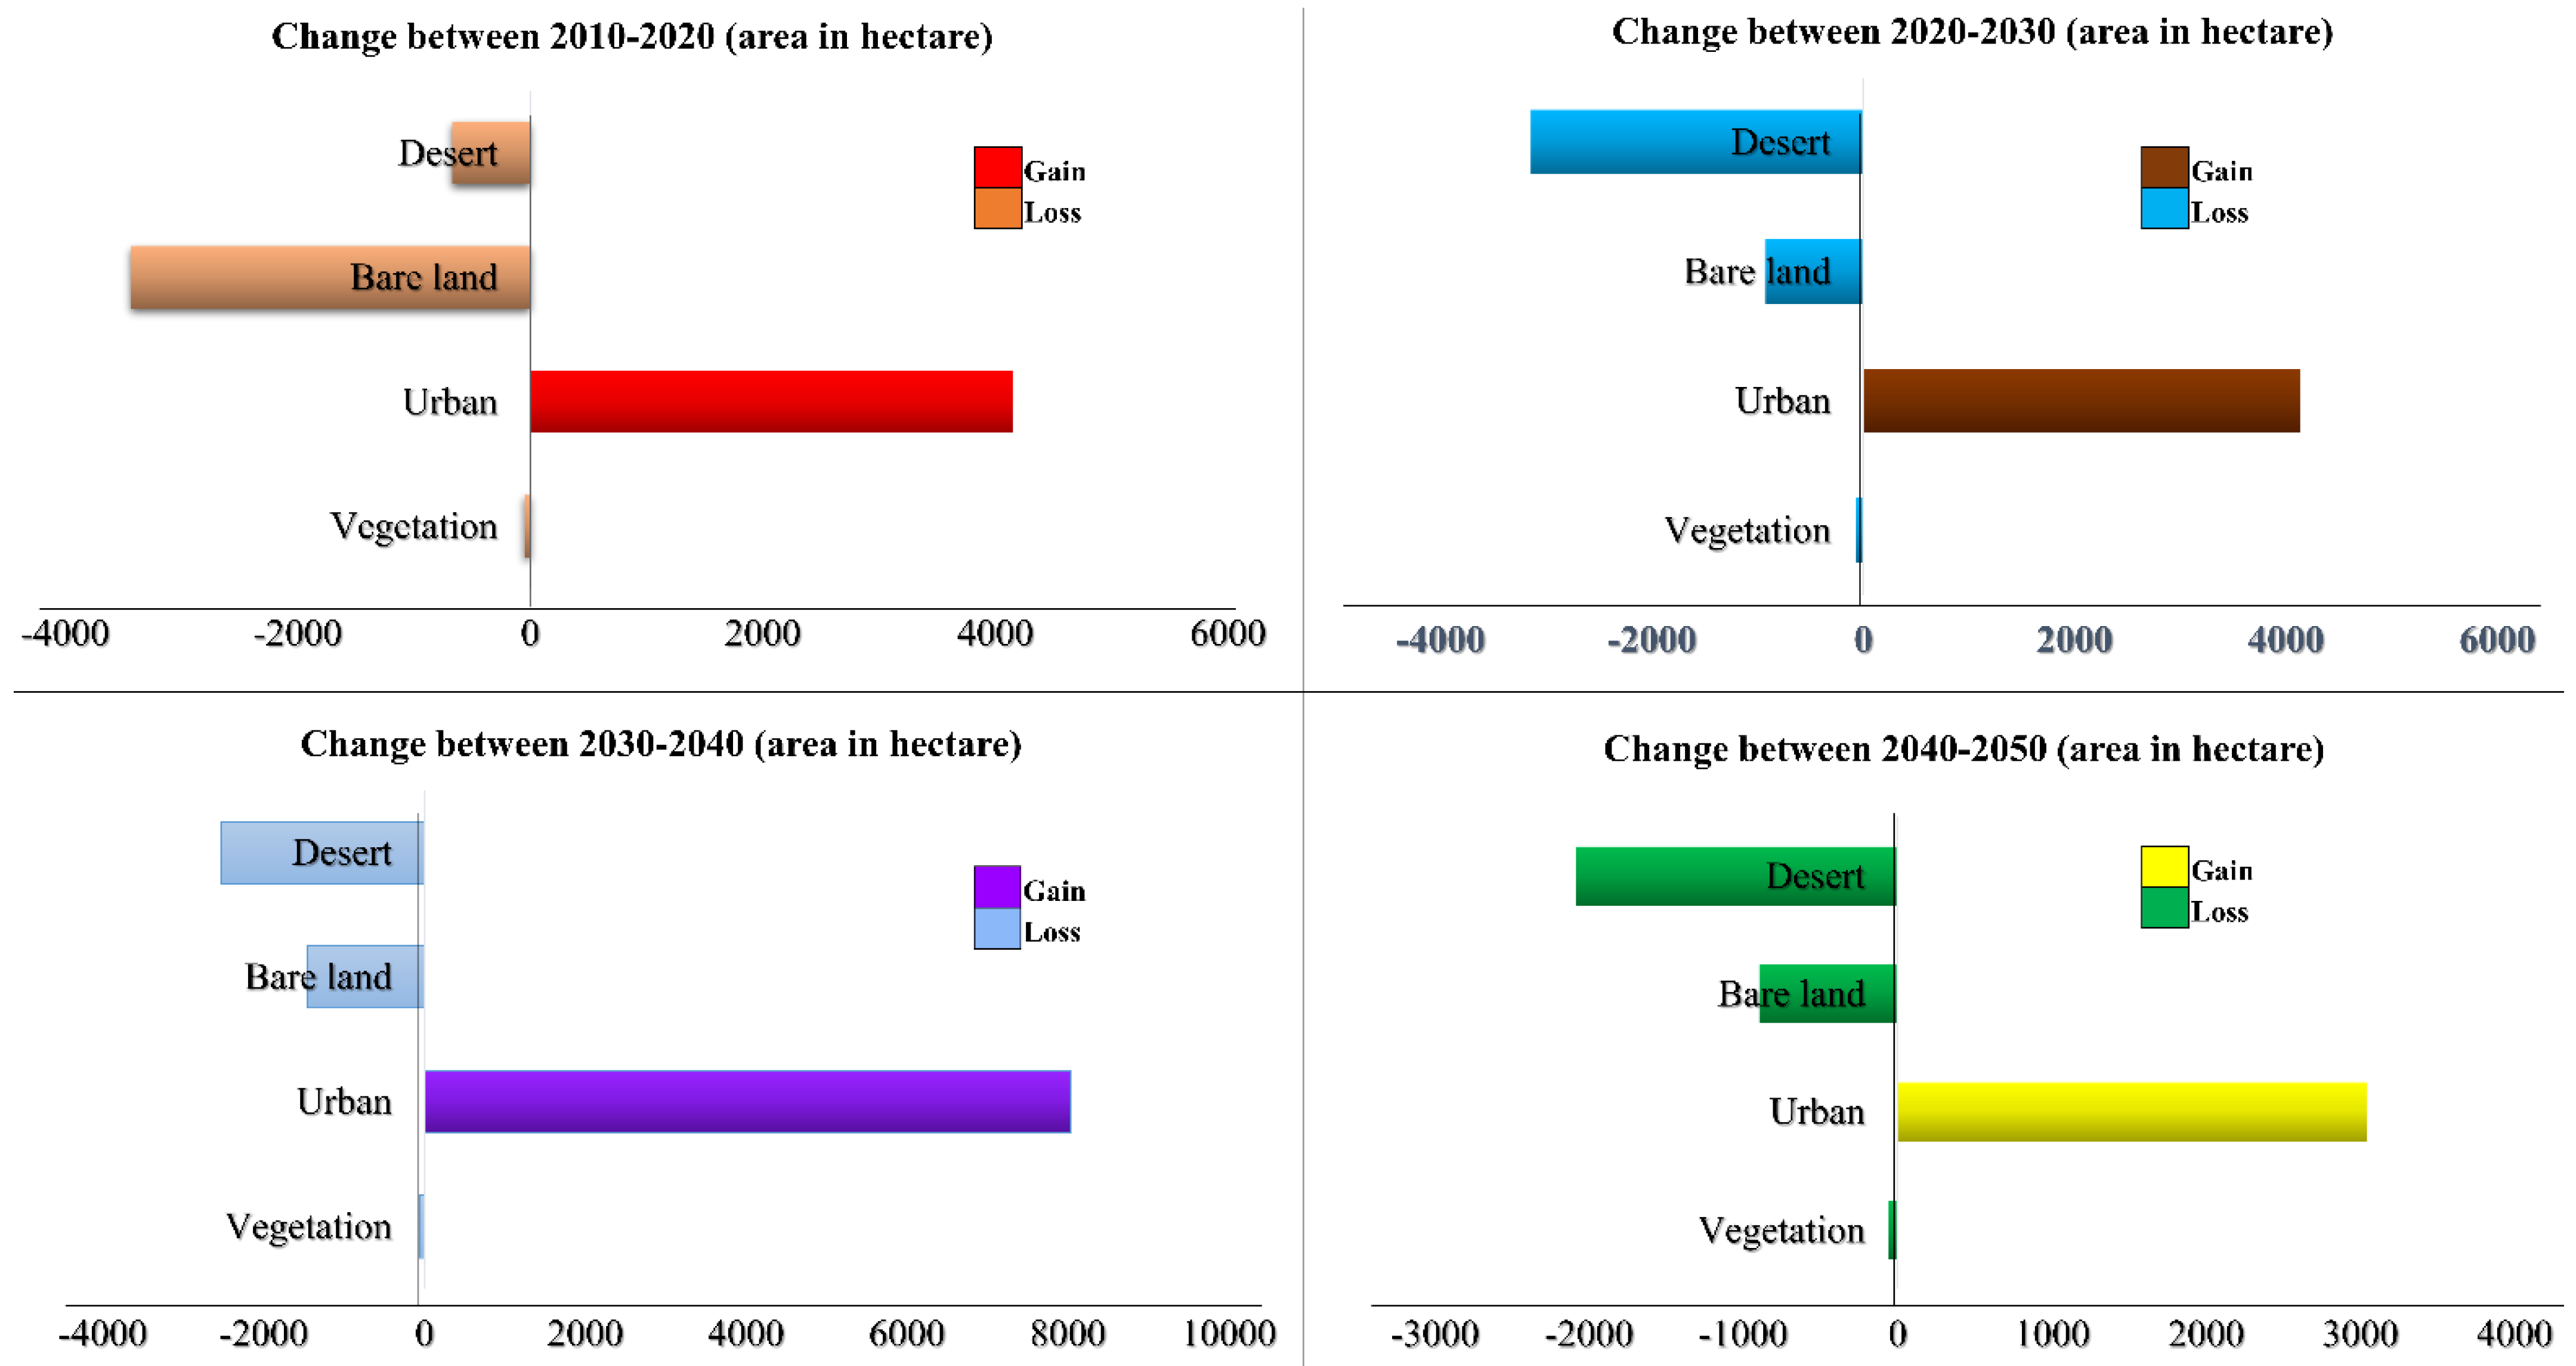
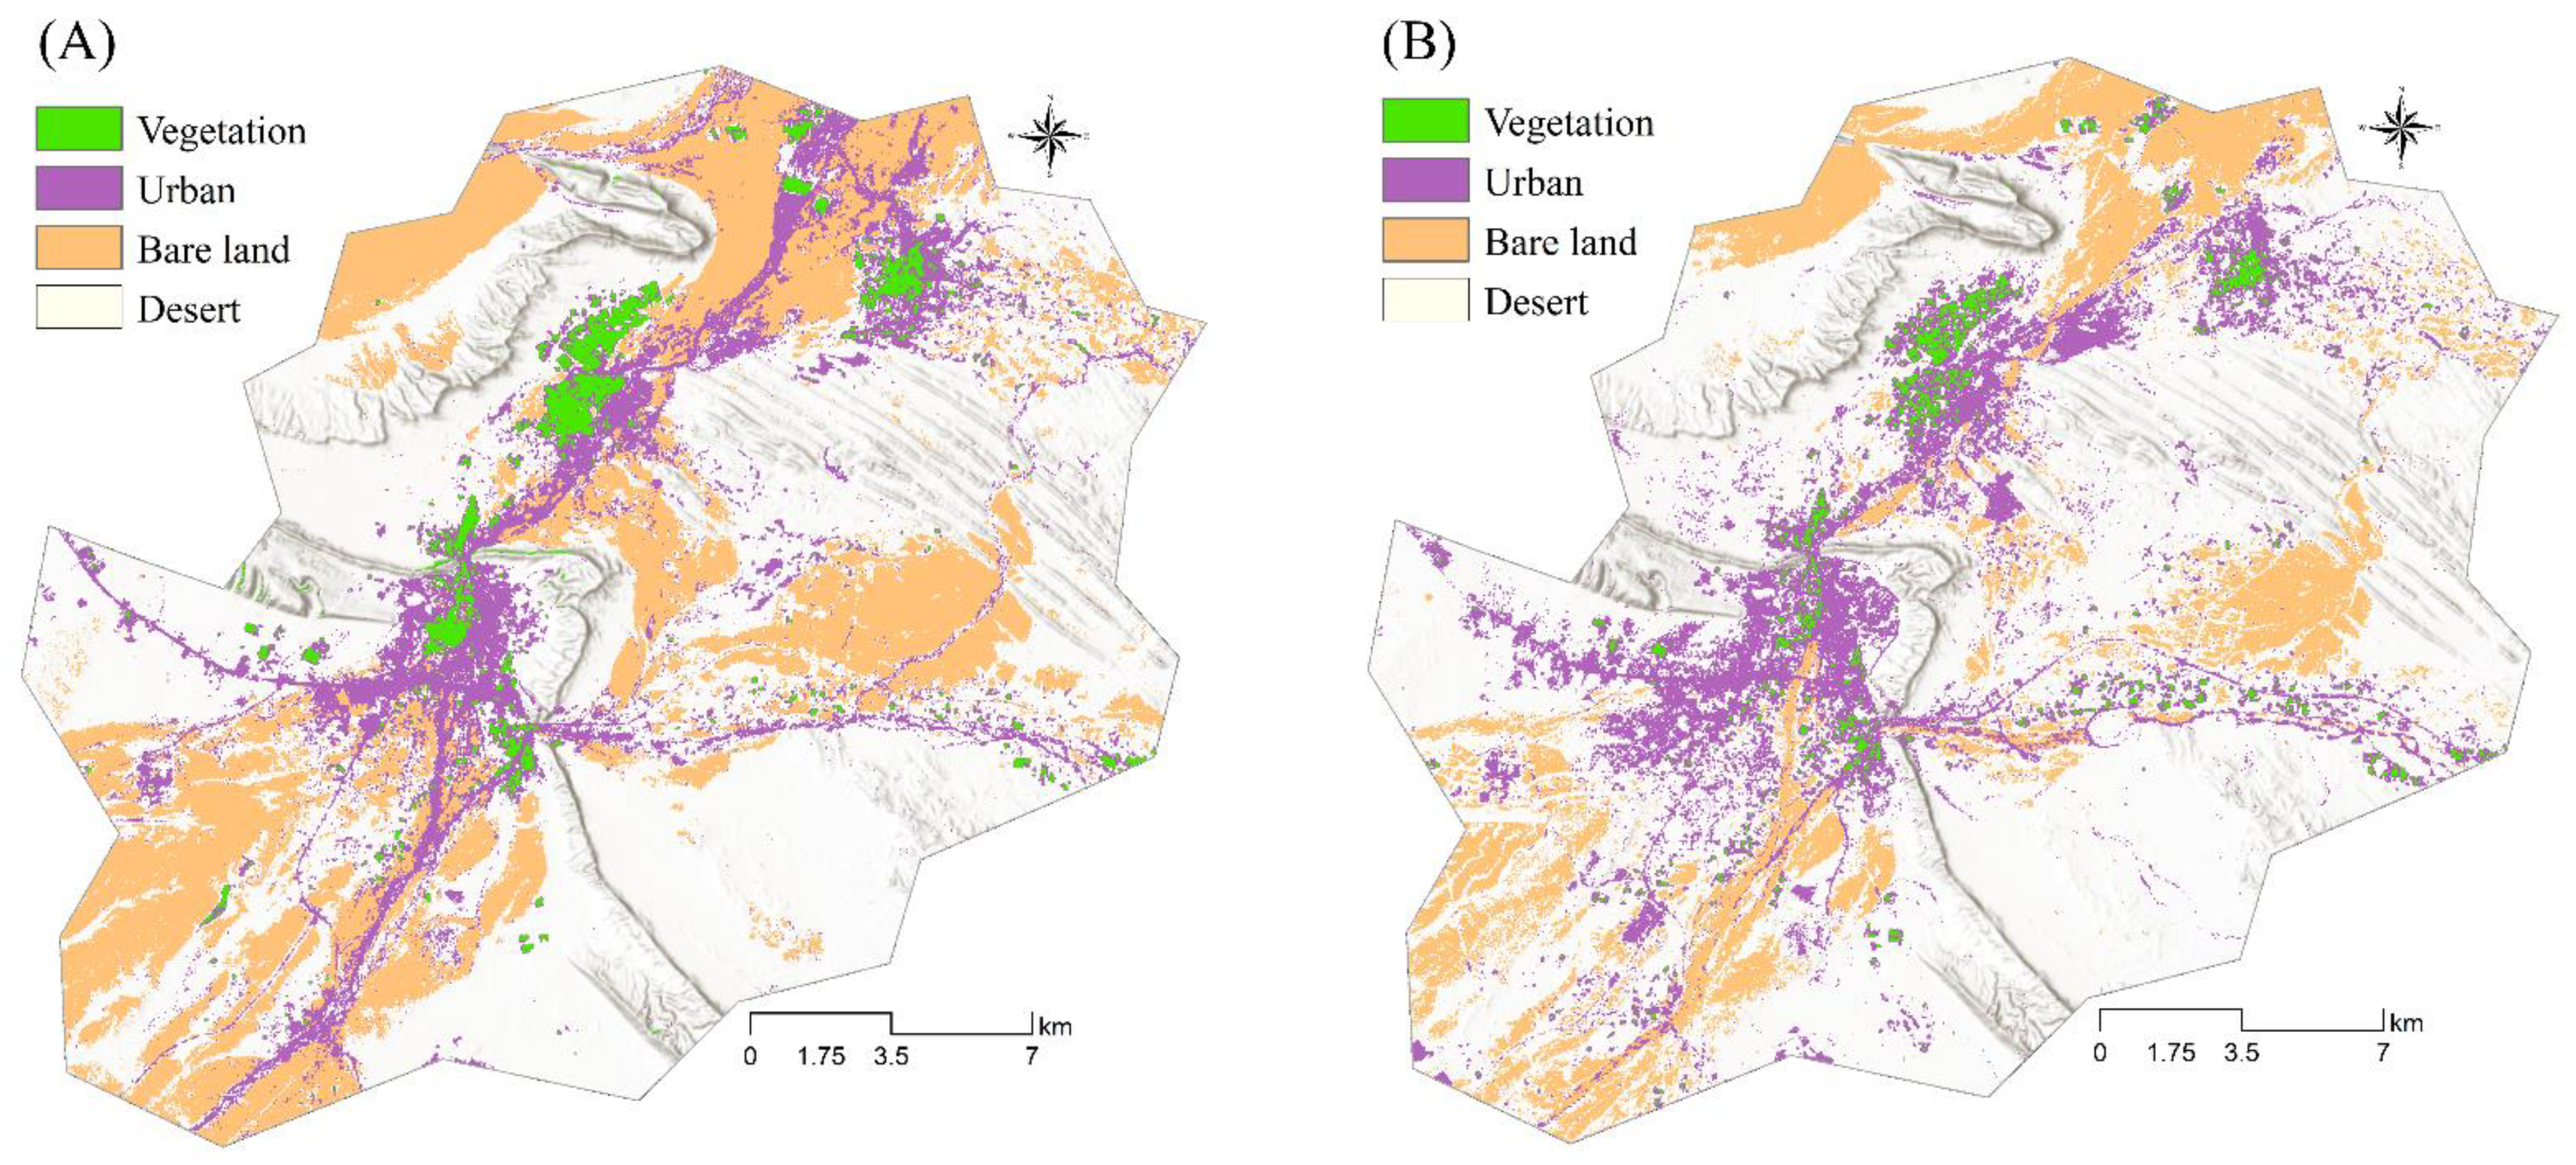
3.5. LULC Change Analysis

As local demand for the construction of houses continues to rise with population growth and the increasing affluence of the city of Ibri, further urban expansion and loss of bare land and vegetation is inevitable. Figure 6 shows LULC changes between 2010 and 2020. Overall, the study area experienced land transformation during this period, increasing the urban spatial extent and affecting growth patterns. The distribution of LULC classes in 2020 indicates that urban expansion occurred spatially along major linear trends from northeast to southwest, with a recognised concentration in the central part of the city and, initially, around the old settlements. In contrast, there was a decline in vegetation cover by almost 50 ha, and in bare land by 3429.5 ha (41%) (Table 5). Although desert land was the dominant LULC class, it also exhibited a significant decline, which substantially contributed to an increase of 669 ha in urban area.

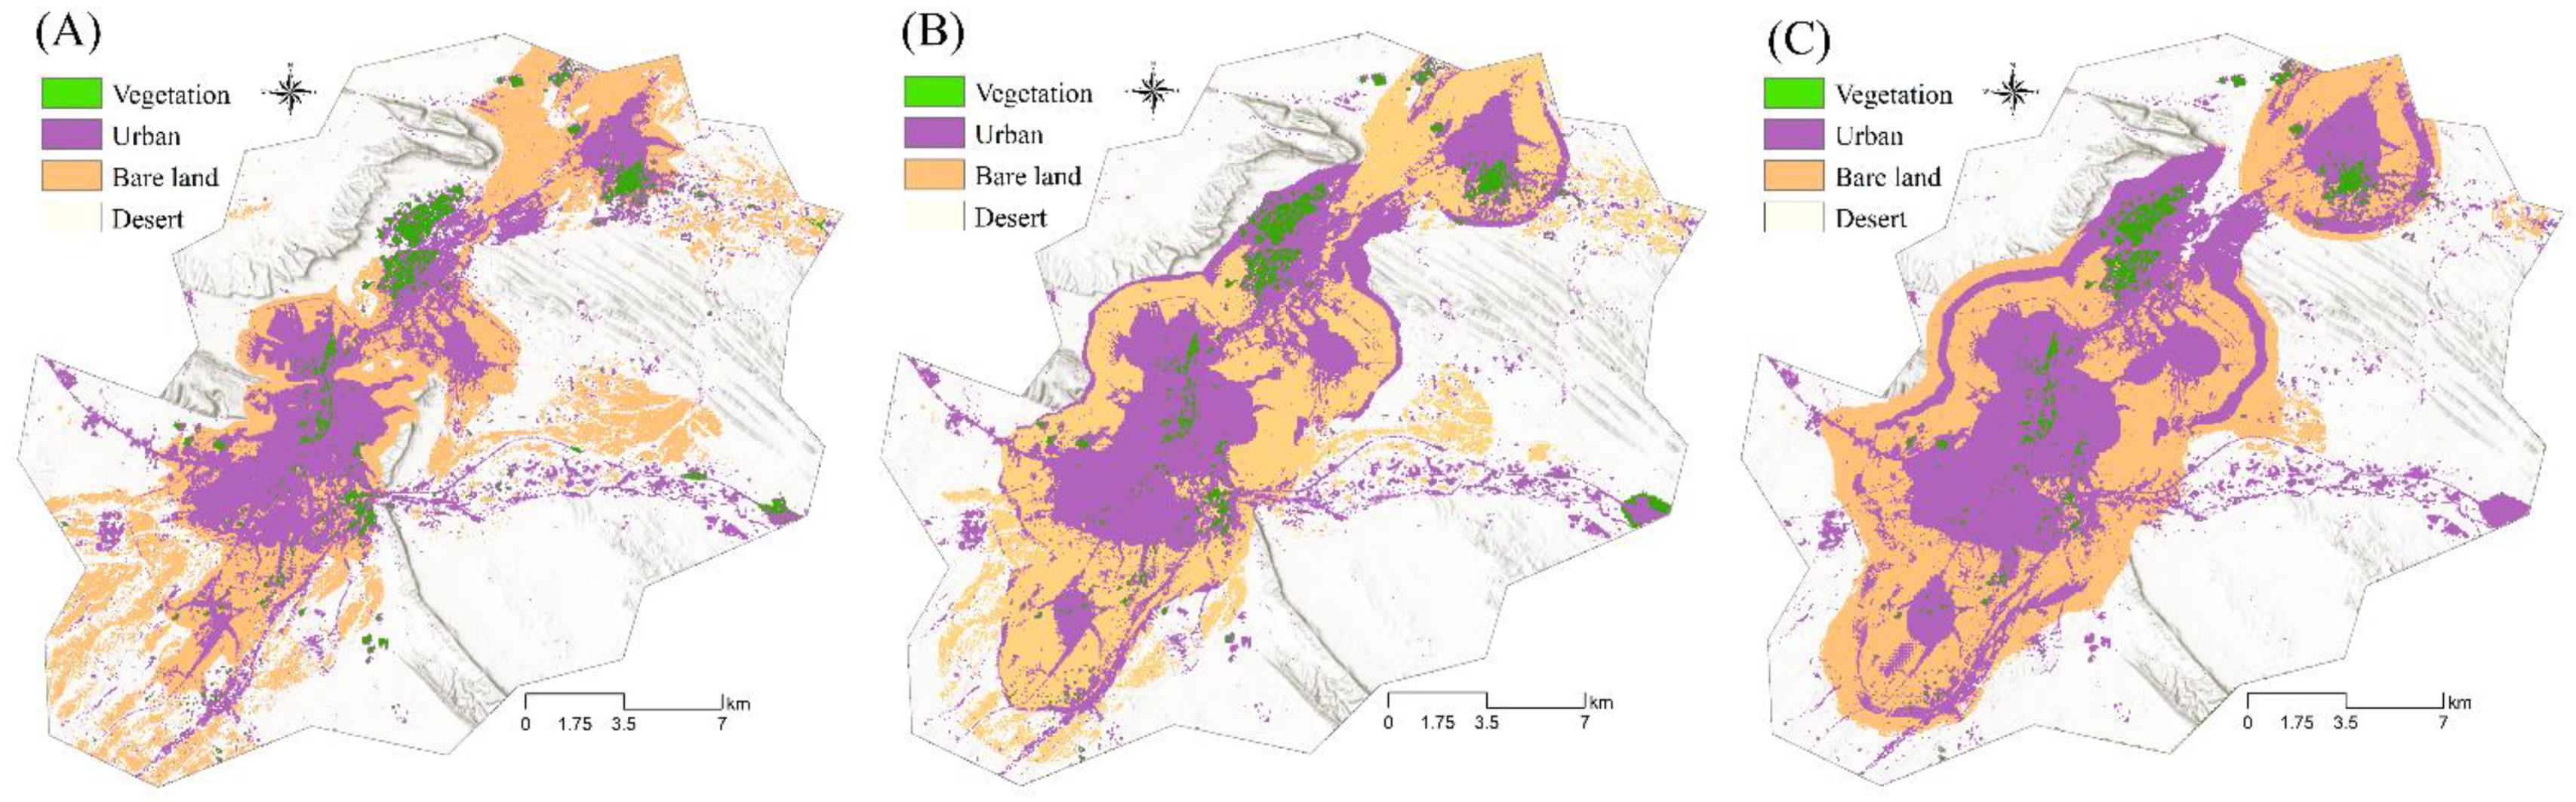
3.6. Prediction of LULC Dynamics

Using the transition matrix of 2010 to 2020, and utilising the MLP-MC model, future changes in LULC were forecasted. According to the spatial distribution of LULC in the city of Ibri during this period (2010 to 2020), urban dynamics were forecasted for the years 2030, 2040, and 2050 (Figure 7 and Figure 8). The changes in each LULC type are presented in Table 6, along with their percentage of change. The forecasted map for 2030 shows that vegetation and green areas will decrease by approximately 0.80% (66 ha), and the city will also experience a pronounced decrease in barren land by 11% (924 ha). Similarly, desert land is expected to decrease by 38% (3142.6%) (Table 6). The city is expected to continue to urbanise and, hence, bare land, vegetation, and desert areas totalling 4132.6 ha will transform into built-up areas, which are expected to occupy 50% of the total area of the city (Figure 7A). In the second period (2030–2040), transformation from desert land into urban land is expected to be larger (2523 ha) than from both bare land and vegetation combined (990.65 ha). Overall, during this period, the rate of urbanisation is expected to be more comprehensive than for the previous period, constituting 66% of the total LULC change across the study area (Figure 7B). The simulated map for 2040–2050 reveals a substantial increase in urban areas, which are expected to be the dominant LULC (21,396 ha), while a large area of vegetation, bare soils, and desert lands will primarily be converted into residential areas, infrastructure, and housing units (3041 ha) (Figure 7C).
The major LULC dynamics are shown to be largely concentrated in the central part of the city, in rings that expand to outside of the boundaries. Overall, three major clusters of built-up areas and urban centres can be recognised, stretching from the northeast towards the southwest. Throughout this linear feature, the previous and forecasted urban growth occurs, while bare soils, vegetation, and desert lands decline. Nonetheless, the magnitude of change is expected to be larger in the southwest, contrasted by a considerable decrease in desert and bare land areas, and divergent underlying construction of a new road network. Moreover, while the urban development towards the central and western directions occurs rapidly, it is less pronounced in the northeast direction.

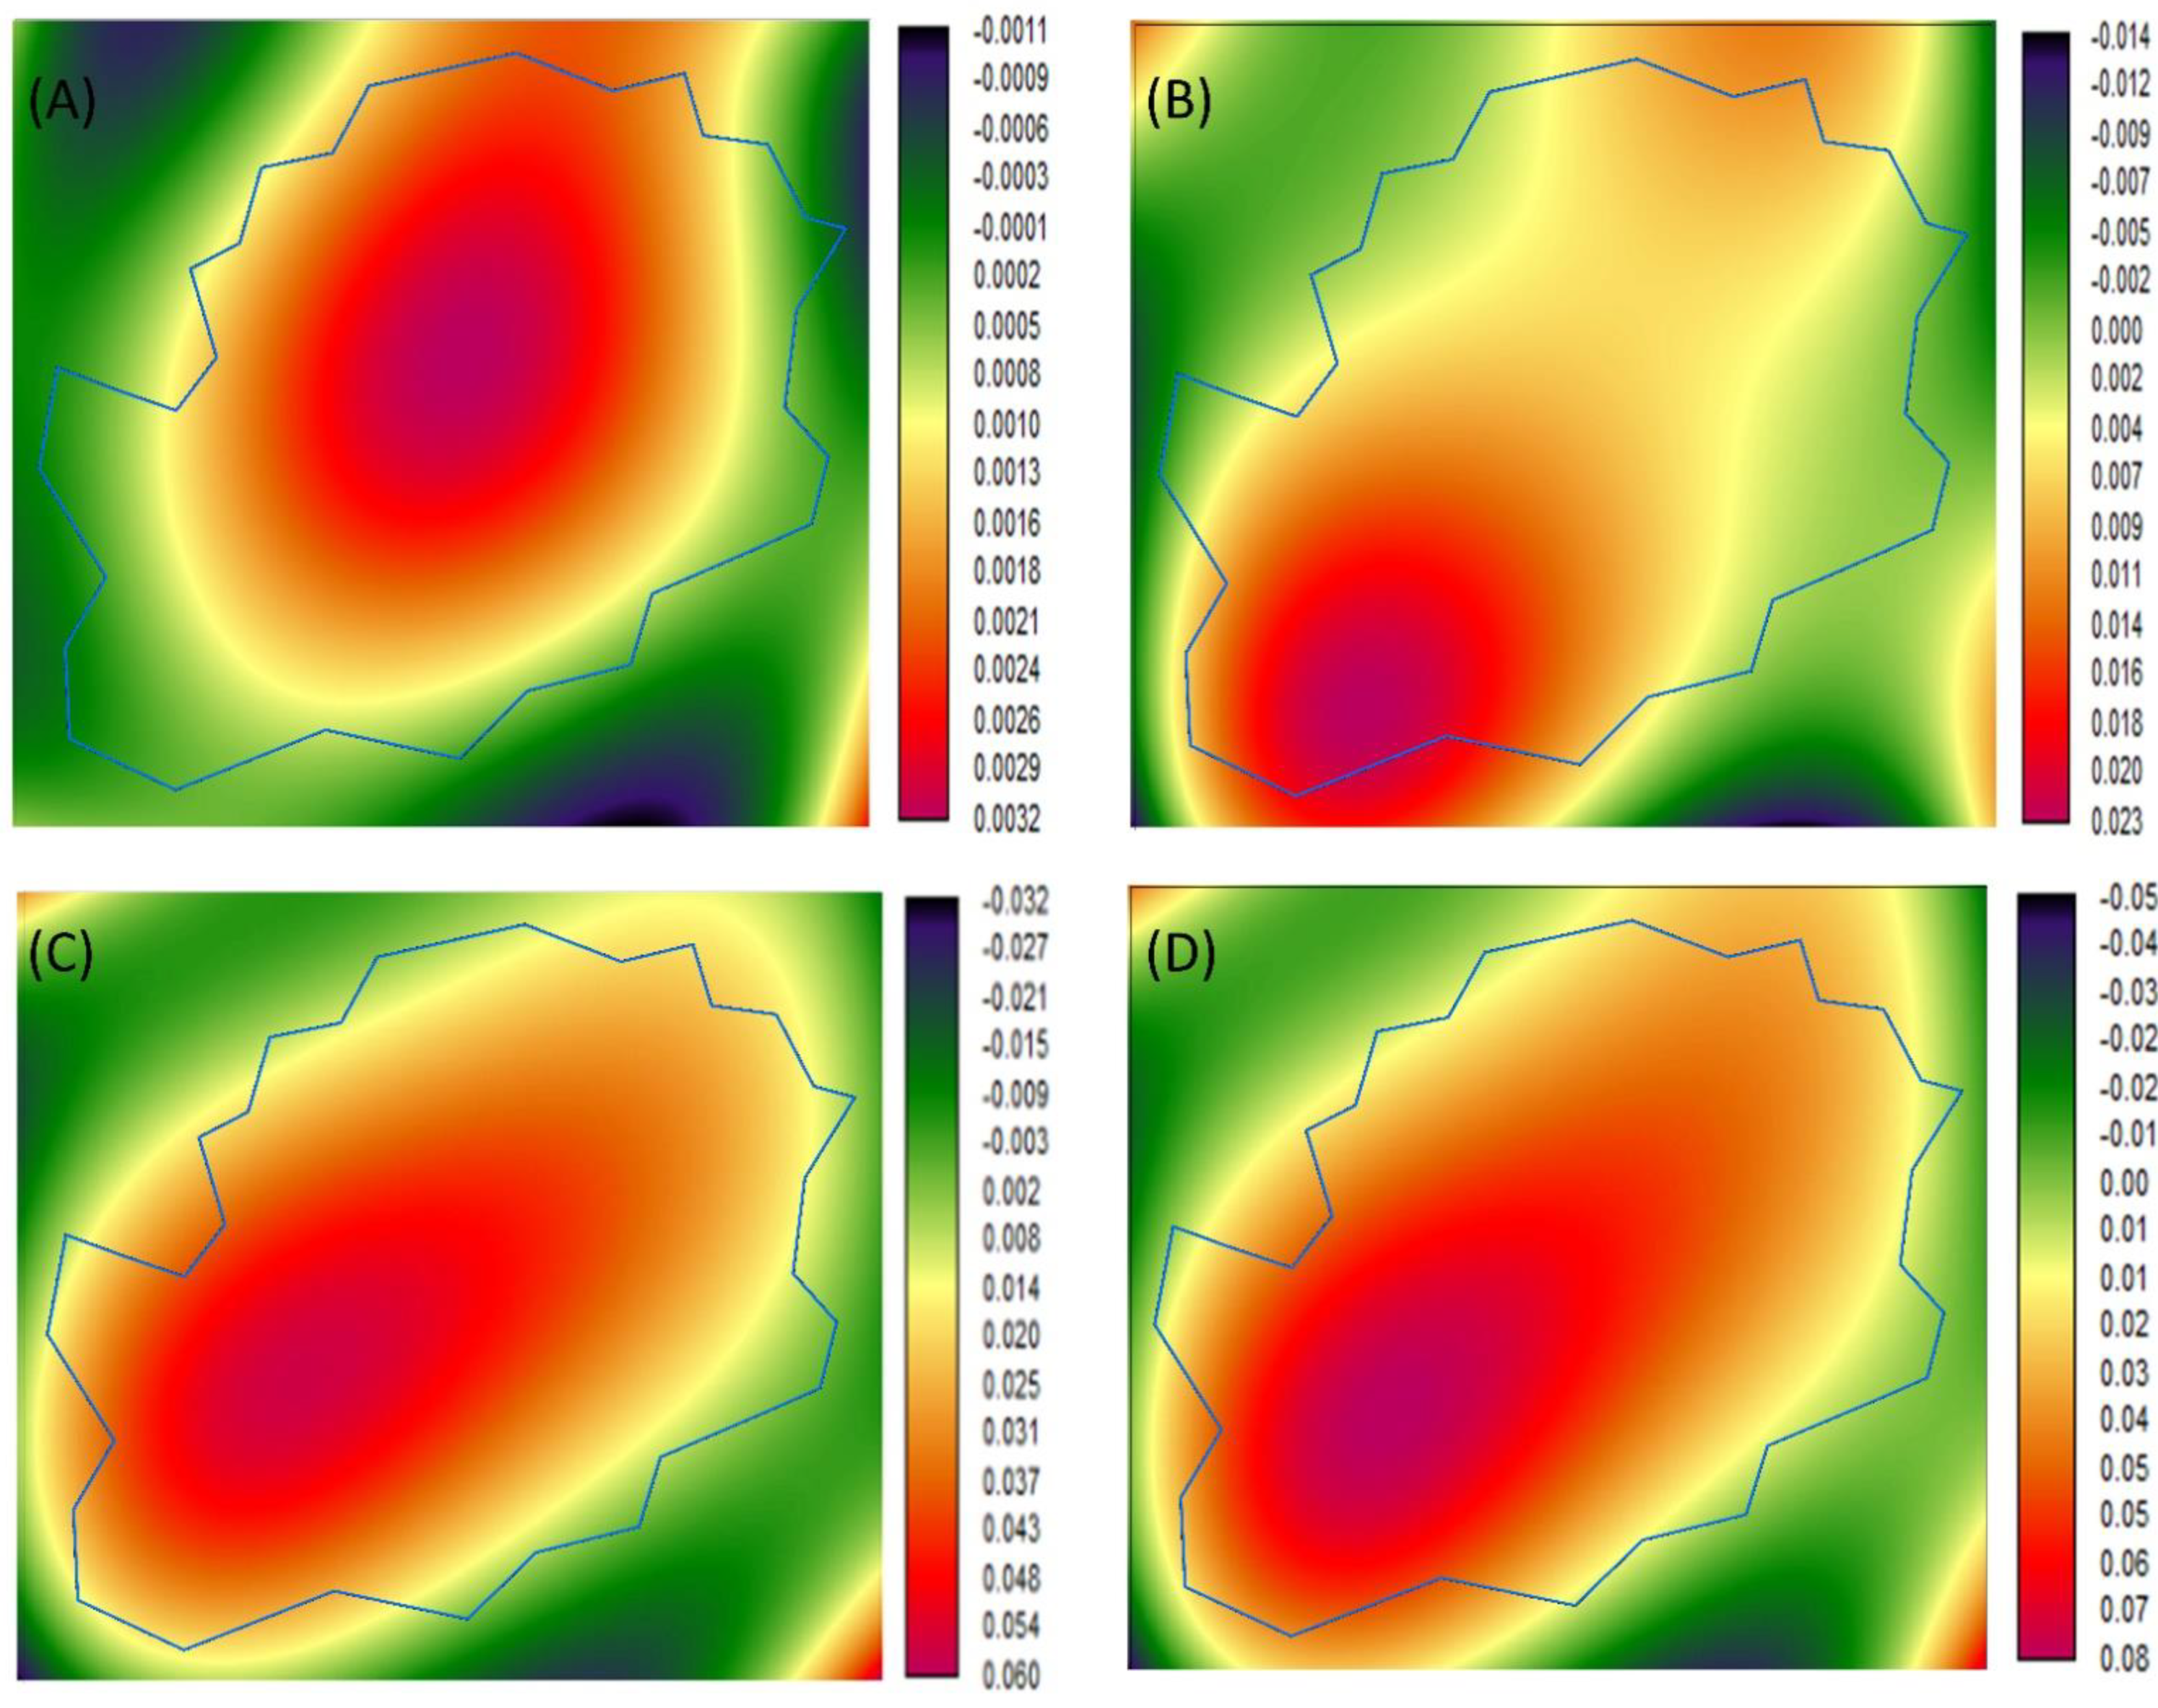
3.7. Spatial Trends of LULC Changes

The intensity and trends of the forecasted 2030 LULC spatial changes are represented in Figure 9. Transformation of vegetation and green cover into built-up areas is expected to be concentrated largely in the central areas of the city, with high concentrations occurring around the centres of old settlements (Figure 9A). In contrast, the transformation of green areas is expected to be less in the northeast and in marginal places. The transition from barren lands into urban areas is likely to range from moderate to high intensity across the southwestern and western areas. Nevertheless, the lowest intensity of this transition occurs toward the northeast and northwest directions (Figure 9B). The conversion of intense arable land into built-up areas is expected to occur in the far southwest, where urban development and population concentration are dominant. The intensity of bare land loss and conversion will continue close to major roads and old urban centres, where high accessibility to the city centre and basic facilities will accelerate urban expansion rates. Desert loss can be seen around the existing urban areas, expected to be transformed into built-up areas—particularly towards the southwest, south, and northwest. The greatest and most intense transformation of all LULC categories into urban areas is expected to occur along the essential linear axis, which extends from the northeast to the southwest (Figure 9D). However, the contribution of desert land to urban expansion will be relatively more intense around urban centres, located mainly in the central and southern parts of the city. Notably, these places are expected to witness the highest rates of urban expansion and sprawl during the next three decades.

4. Discussion

Although demographic metrics such as population size are widely used to classify cities and differentiate urban areas from rural settlements, Omani cities can be characterised by their spatial features and, hence, can be classified into coastal, mountainous, or desert cities. Indeed, Omani cities, which are developing rapidly, have been shaped by several attributes according to their spatial characteristics, area, and locations.
LULC changes across the study area resulted from various complex processes and entangled local driving forces. Several spatially explicit modelling techniques—particularly NNs and MCs—have been commonly implemented to analyse, quantify, and forecast key LULC dynamics (e.g., [4,53,54,55,56]).
During the last decade (2010 to 2020), desert urban settlements have grown precipitously, and the pace of urbanisation is expected to continue into the future. According to the predictions of this work, built-up areas and urban settlements will expand rapidly from 2020 to 2030, 2040, and 2050. By 2030 and 2040, urban areas are expected to expand significantly by about 4133 and 8033 ha, respectively, while vegetation will decrease by 66 and 64 ha, respectively. Although the majority of the contribution to urban expansion could be from bare land (925 ha) and desert (3142 ha), a decline in green areas would negatively impact the city–ecology balance. This finding indicates that during the upcoming three decades up to 2050 the city of Ibri is expected to witness an accelerated stage of urbanisation.
Focusing on the spatial patterns in the simulated future scenarios, at present—and probably during the next decade—urban growth within the city may be characterised by linear patterns; therefore, the urban spillover is limited to around major roads. However, this polarisation around the road network may not continue for long, for many reasons: Firstly, the vacant land patches within residential areas and near major roads are expected to be converted into houses; thus, urban areas might expand away from the residential centres—outward, and over open desert spaces. Secondly, placing new business and industrial areas within the city will require large areas; thus, they could be located mainly in the marginal open desert spaces. Thirdly, other driving forces—particularly underground water supply—could increase the pace of desert urbanisation and expansive land development towards open marginal spaces. Finally, Omani households rely fundamentally on private car transportation; thus, this pattern of dependency on automobiles could lead to the rate of urban sprawl and fragmentation of the urban fabric.
The growth of desert urban areas is essentially the outcome of multiple entangled and evolving local factors. It is expected that population movement and migration from rural to urban areas are drivers of urban expansion and development over desert spaces. In particular, the population of the city is expected to reach 130,000 inhabitants by 2040 [65]. Accordingly, and considering the spatial hierarchy of the city of Ibri as a central destination among its surrounding urban centres, urban expansion will occur much faster, influenced not only by the natural increase in urban population, but also by population mobility and rural-to-urban migration, specifically from surrounding villages.
In essence, the expected urban expansion during the next three decades will not only increase population energy consumption and the burden of constructing new infrastructure and facilities, but will also create more environmental challenges and problems—particularly air, soil, and water pollution. Such urban transformation processes and their consequences will influence sustainable desert urban living and, therefore, diminish natural resource flows [3,4,5].
As stated previously, urban expansion across desert cities not only diminishes available natural resources, but also impacts natural and biological ecosystems. Similar studies conducted elsewhere showed that urban growth across desert areas has led to numerous environmental challenges [3,42]. Within the study area, water scarcity, along with a range of environmental degradations, will affect the availability of groundwater and the aquifers on which populations in desert urban areas depend. Some underground water wells have been depleted, and are likely to expire within a generation. Despite the fact that the Omani government’s urban strategy has adopted several protective policies—such as strengthening the system of water collection and storage—climate change is expected to reduce the volume of groundwater recharge [65]. Accordingly, and as water scarcity and stress directly affect vegetation and decrease crop yield, new urban settlements will depend critically on limited freshwater availability, as well as the shrinking of green covers. Planning for providing new settlements and growth with fresh water supplies is a challenge across desert urban areas. Nonetheless, the need for securing water for these growing agglomerations is a serious concern to ensure a sustainable future.
Our findings indicate that during the next three decades, green spaces in the city of Ibri will decrease, and large areas will be converted into residential places. The decline in vegetation cover and green area due to the direct conversion of agricultural and farm land into housing units is likely to arise from unplanned urban expansion, and to negatively impact the natural ecosystem. Furthermore, green areas might be influenced not only by spontaneous urban expansion, but also by the pressure on underground water and increasing demand for fresh water for irrigation. Several negative consequences of urban green conversion have been reported elsewhere [12,13,14,16,17], such as ecological imbalance—particularly in arid and semi-arid urban environments. Hence, governmental planners and policymakers should consider plantation strategies—specifically, to grow plants in open spaces, such as date palm trees, which are more adapted to the desert environment. Similarly, the government should support the desert ecosystem and enhance biodiversity by establishing new national and subnational parks, and maintain landscape connectivity by connecting open spaces with green infrastructure.
Satellite images and remote sensing techniques have been intrinsically employed to model and simulate the dynamics of desert urban areas in Oman. The outcomes of such image processing and spatial simulation analysis could greatly improve the monitoring of urban growth, and forecast its socioeconomic and environmental ramifications not only in the GCC region, but also across all desert urban areas. Future forecasts of LULC dynamics and urbanisation across desert cities are necessary to quantify and investigate the intense spatial ramifications on natural resources and environmental biodiversity. The rapid pace of development over desert areas raises a concern about the process of urbanisation, which often irreversibly alters the structure of natural settings. In Oman and other GCC states, urban development has been associated largely with numerous socioeconomic and environmental changes. Given the pronounced impacts of urban expansion that have already been observed, careful local policy actions should be taken, and are necessary to ensure that desert urban growth is sustainable. Ultimately, future forecasts of desert urban areas should explore pathways towards sustainable urban structure, to ensure that the same level of quality of life will sustain desert urban populations compared with plains and coastal cities, and under various scenarios of economic development and environmental degradation. Several negative consequences of desert urban sprawl are expected to occur, including inequality in accessibility to services, water-table decline and contamination, air pollution, high surface temperatures, disruption of wildlife, flood risk, drought hazard, and low quality of life. Accordingly, effective policies should be adopted to control this type of urban sprawl and preserve the natural ecosystem of the desert environment. Likewise, municipal policies should involve forecasting methods that can employ advanced remote sensing and image processing techniques to monitor future urban expansion.

5. Conclusions

The overall aim of this study was to assess the spatiotemporal dynamics of desert urban areas in Oman over the last two decades, as well as to forecast urban expansion across the city of Ibri over the next three decades. We employed a methodology that integrated remote sensing and GIS methods with an MLP neural network and Markov chain model to characterise recent growth and forecast future expansion of the desert urban LULC type across the city of Ibri in Oman. The integration of machine learning, CA–Markov, and remotely sensed data was quite instructive in simulating the spatiotemporal dynamics of desert urban areas. The model accuracy of predicting desert urban changes was evaluated utilising satellite imagery data only, and by comparing the projected 2020 image to the actual 2020 classified image. The agreement between the actual and projected 2020 maps was 89%, indicating a high model performance and efficiency.
The findings clearly indicate that the city has undergone substantial changes in the last few years, and is anticipated to undergo drastic LULC changes by 2050. The most noticeable changes were due to numerous local drivers—particularly infrastructure, road development, and the reclamation of desert lands. Prominent transitions involved shifting from agricultural, arable, and desert lands to residential areas. Nevertheless, the simulated results revealed that desert land conversion across the city is expected to be the most dominant, contributing significantly to urban and residential areas. Similarly, the loss of arable land and fertile soils was also another dominant force driving urban growth. The city of Ibri is likely to expand greatly and reach a mature stage of urbanisation over the next three decades. However, creating liveable, green, open spaces will be a major challenge, considering the fact that the loss of green areas is presumably to be simultaneously associated with the increasing rate of expansion of built-up areas. Agricultural land—specifically date farms—is projected to experience severe decline (i.e., 10%) by 2040, and total of 166 ha is likely to be converted into built-up areas by 2050. This type of intensified and dramatic decrease in green areas will negatively influence ecosystem services across the city.
A key limitation of this study is the lack of detailed ancillary spatial layers—in particular, demographic and population data at the district or subdistrict administrative levels. Inclusion of such variables could strengthen the influence of driving forces in forecasting the future of LULC changes. However, to the best of our knowledge, research on the simulation of desert urban growth in Oman and other surrounding GCC states is absent. Overall, the findings of this study could be used as spatial guidelines and to rethink approaches to controlling urban sprawl and directing urban planning of desert cities—not only in Oman or the GCC states, but also in other developing countries. Therefore, this study bridges knowledge in desert LULC forecasting, contributing to a more detailed understanding of desert city dynamics, and connecting directly with a globally relevant and interdisciplinary research agenda. Hence, it provides insights into understanding the LULC dynamics of desert cities across Oman and the surrounding regions.

Author Contributions

Conceptualisation, methodology, data curation, formal analysis, investigation, methodology, writing—original draft, S.M.; investigation, methodology, writing—original draft, M.A.; investigation, writing—review and editing, A.D. and P.M.A. All authors have read and agreed to the published version of the manuscript.

Funding

This research received no external funding.

Conflicts of Interest

The authors declare no conflict of interest.

References

  1. UN. World Urbanization Prospects: The 2018 Revision. 2018. Available online: https://population.un.org/wup/Publications/Files/WUP2018-Report.pdf (accessed on 25 June 2021).
  2. UN. United Nation Decade for Desert and Fight against Desertification. 2021. Available online: https://www.un.org/en/events/desertification_decade/whynow.shtml (accessed on 24 June 2021).
  3. Nassar, A.K.; Blackburn, G.A.; Whyatt, J.D. Developing the desert: The pace and process of urban growth in Dubai. Comput. Environ. Urban Syst. 2014, 45, 50–62. [Google Scholar] [CrossRef] [Green Version]
  4. Mansour, S.; Al-Belushi, M.; Al-Awadhi, T. Monitoring land use and land cover changes in the mountainous cities of Oman using GIS and CA-Markov modelling techniques. Land Use Policy 2020, 91, 104414. [Google Scholar] [CrossRef]
  5. Andrade, R.; Larson, K.L.; Hondula, D.M.; Franklin, J. Social–spatial analyses of attitudes toward the desert in a Southwestern US city. Ann. Am. Assoc. Geogr. 2019, 109, 1845–1864. [Google Scholar]
  6. Jenerette, G.D.; Wu, J. Analysis and simulation of land-use change in the central Arizona–Phoenix region, USA. Landsc. Ecol. 2001, 16, 611–626. [Google Scholar] [CrossRef]
  7. Halmy, M.W.A.; Gessler, P.E.; Hicke, J.A.; Salem, B.B. Land use/land cover change detection and prediction in the north-western coastal desert of Egypt using Markov-CA. Appl. Geogr. 2015, 63, 101–112. [Google Scholar] [CrossRef]
  8. Hosseini, S.; Gholami, H.; Esmaeilpoor, Y. Assessment of land use and land cover change detection by using remote sensing and gis techniques in the coastal deserts, South of Iran. Int. Arch. Photogramm. Remote Sens. Spat. Inf. Sci. 2019, 42, 489–492. [Google Scholar] [CrossRef] [Green Version]
  9. Salem, M.; Tsurusaki, N.; Divigalpitiya, P. Land use/land cover change detection and urban sprawl in the peri-urban area of greater Cairo since the Egyptian revolution of 2011. J. Land Use Sci. 2020, 15, 592–606. [Google Scholar] [CrossRef]
  10. Ansari, A.; Golabi, M.H. Prediction of spatial land use changes based on LCM in a GIS environment for Desert Wetlands—A case study: Meighan Wetland, Iran. Int. Soil Water Conserv. Res. 2019, 7, 64–70. [Google Scholar] [CrossRef]
  11. Becerril-Pina, R.; Mastachi-Loza, C.A.; González-Sosa, E.; Díaz-Delgado, C.; Bâ, K.M. Assessing desertification risk in the semi-arid highlands of central Mexico. J. Arid. Environ. 2015, 120, 4–13. [Google Scholar] [CrossRef]
  12. Barbero-Sierra, C.; Marques, M.-J.; Ruíz-Pérez, M. The case of urban sprawl in Spain as an active and irreversible driving force for desertification. J. Arid. Environ. 2013, 90, 95–102. [Google Scholar] [CrossRef]
  13. Maconachie, R. Urban Growth and Land Degradation in Developing Cities: Change and Challenges in Kano Nigeria; Routledge: London, UK, 2016. [Google Scholar]
  14. Tripathy, P.; Kumar, A. Monitoring and modelling spatio-temporal urban growth of Delhi using Cellular Automata and geoinformatics. Cities 2019, 90, 52–63. [Google Scholar] [CrossRef]
  15. Liu, J.; Zhang, Z.; Xu, X.; Kuang, W.; Zhou, W.; Zhang, S.; Li, R.; Yan, C.; Yu, D.; Wu, S. Spatial patterns and driving forces of land use change in China during the early 21st century. J. Geogr. Sci. 2010, 20, 483–494. [Google Scholar] [CrossRef]
  16. Msofe, N.K.; Sheng, L.; Lyimo, J. Land use change trends and their driving forces in the Kilombero Valley Floodplain, Southeastern Tanzania. Sustainability 2019, 11, 505. [Google Scholar] [CrossRef] [Green Version]
  17. Yan, X.; Li, J.; Shao, Y.; Hu, Z.; Yang, Z.; Yin, S.; Cui, L. Driving forces of grassland vegetation changes in Chen Barag Banner, Inner Mongolia. GIScience Remote Sens. 2020, 57, 753–769. [Google Scholar] [CrossRef]
  18. Wu, Y.; Wu, Z.; Liu, X. Dynamic changes of net primary productivity and associated urban growth driving forces in Guangzhou City, China. Environ. Manag. 2020, 65, 758–773. [Google Scholar] [CrossRef]
  19. Comber, A.; Fisher, P.; Wadsworth, R. What is land cover? Environ. Plan. B Plan. Des. 2005, 32, 199–209. [Google Scholar] [CrossRef] [Green Version]
  20. Lambin, E.F.; Geist, H.J.; Lepers, E. Dynamics of land-use and land-cover change in tropical regions. Annu. Rev. Environ. Resour. 2003, 28, 205–241. [Google Scholar] [CrossRef] [Green Version]
  21. Atik, M.; Işikli, R.C.; Ortaçeşme, V.; Yildirim, E. Definition of landscape character areas and types in Side region, Antalya-Turkey with regard to land use planning. Land Use Policy 2015, 44, 90–100. [Google Scholar] [CrossRef]
  22. Ellis, E.; Pontius, R. Land-use and land-cover change. Encycl. Earth 2007, 1, 1–4. [Google Scholar]
  23. Jaeger, J.A.; Bertiller, R.; Schwick, C.; Kienast, F. Suitability criteria for measures of urban sprawl. Ecol. Indic. 2010, 10, 397–406. [Google Scholar] [CrossRef]
  24. Bhatta, B. Urban growth and sprawl. In Analysis of Urban Growth and Sprawl from Remote Sensing Data; Springer: Berlin/Heidelberg, Germany, 2010; pp. 1–16. [Google Scholar]
  25. Hennig, E.I.; Schwick, C.; Soukup, T.; Orlitová, E.; Kienast, F.; Jaeger, J.A. Multi-scale analysis of urban sprawl in Europe: Towards a European de-sprawling strategy. Land Use Policy 2015, 49, 483–498. [Google Scholar] [CrossRef] [Green Version]
  26. Oueslati, W.; Alvanides, S.; Garrod, G. Determinants of urban sprawl in European cities. Urban Stud. 2015, 52, 1594–1614. [Google Scholar] [CrossRef] [PubMed] [Green Version]
  27. Airoldi, L.; Turon, X.; Perkol-Finkel, S.; Rius, M. Corridors for aliens but not for natives: Effects of marine urban sprawl at a regional scale. Divers. Distrib. 2015, 21, 755–768. [Google Scholar] [CrossRef] [Green Version]
  28. Bae, C.-H.C. Urban Sprawl in Western Europe and the United States; Routledge: London, UK, 2017. [Google Scholar]
  29. Hamidi, S. Urban sprawl and the emergence of food deserts in the USA. Urban Stud. 2020, 57, 1660–1675. [Google Scholar] [CrossRef]
  30. Squires, G.D. Urban sprawl and the uneven development of metropolitan America. In Urban Sprawl: Causes, Consequences, and Policy Responses; Urban Institute: Washington DC, USA, 2002; pp. 1–22. [Google Scholar]
  31. Zhao, P. Sustainable urban expansion and transportation in a growing megacity: Consequences of urban sprawl for mobility on the urban fringe of Beijing. Habitat Int. 2010, 34, 236–243. [Google Scholar] [CrossRef]
  32. Habibi, S.; Asadi, N. Causes, results and methods of controlling urban sprawl. Procedia Eng. 2011, 21, 133–141. [Google Scholar] [CrossRef] [Green Version]
  33. Chen, D.; Lu, X.; Liu, X.; Wang, X. Measurement of the eco-environmental effects of urban sprawl: Theoretical mechanism and spatiotemporal differentiation. Ecol. Indic. 2019, 105, 6–15. [Google Scholar] [CrossRef]
  34. Harvey, R.O.; Clark, W.A. The nature and economics of urban sprawl. Land Econ. 1965, 41, 1–9. [Google Scholar] [CrossRef]
  35. Chin, N. Unearthing the Roots of Urban Sprawl: A Critical Analysis of Form, Function and Methodology; Centre for Advanced Spatial Analysis (UCL): London, UK, 2002. [Google Scholar]
  36. Batty, M. Polynucleated urban landscapes. Urban Stud. 2001, 38, 635–655. [Google Scholar] [CrossRef]
  37. Arbury, J. From Urban Sprawl to Compact City: An Analysis of Urban Growth Management in Auckland; Academia: San Francisco, CA, USA, 2005. [Google Scholar]
  38. Nagendra, H.; Sudhira, H.; Katti, M.; Schewenius, M. Sub-regional assessment of India: Effects of urbanization on land use, biodiversity and ecosystem services. In Urbanization, Biodiversity and Ecosystem Services: Challenges and Opportunities; Springer: Dordrecht, The Netherlands, 2013; pp. 65–74. [Google Scholar]
  39. Hosseini, S.A.; Shahraki, S.Z.; Farhudi, R.; Hosseini, S.M.; Salari, M.; Pourahmad, A. Effect of urban sprawl on a traditional water system (Qanat) in the City of Mashhad, NE Iran. Urban Water J. 2010, 7, 309–320. [Google Scholar] [CrossRef]
  40. Lang, R.E.; Simmons, P.A. Boomburbs”: The Emergence of Large, Fast-Growing Suburban Cities in the United States; Fannie Mae Foundation: Washington, DC, USA, 2001; Volume 14. [Google Scholar]
  41. Bagaeen, S. Brand Dubai: The instant city; or the instantly recognizable city. Int. Plan. Stud. 2007, 12, 173–197. [Google Scholar] [CrossRef]
  42. Díaz-Caravantes, R.E.; Zuniga-Teran, A.; Martín, F.; Bernabeu, M.; Stoker, P.; Scott, C. Urban water security: A comparative study of cities in the arid Americas. Environ. Urban. 2020, 32, 275–294. [Google Scholar] [CrossRef]
  43. Dewan, A.M.; Corner, R.J. The impact of land use and land cover changes on land surface temperature in a rapidly urbanizing megacity. In Proceedings of the 2012 IEEE International Geoscience and Remote Sensing Symposium, Munich, Germany, 22–27 July 2012 ; 2012; pp. 6337–6339. [Google Scholar]
  44. Brown, D.G.; Pijanowski, B.C.; Duh, J.D. Modeling the relationships between land use and land cover on private lands in the Upper Midwest, USA. J. Environ. Manag. 2000, 59, 247–263. [Google Scholar] [CrossRef] [Green Version]
  45. Brown, D.G.; Duh, J.-D. Spatial simulation for translating from land use to land cover. Int. J. Geogr. Inf. Sci. 2004, 18, 35–60. [Google Scholar] [CrossRef]
  46. Verburg, P.H.; Overmars, K.P. Combining top-down and bottom-up dynamics in land use modeling: Exploring the future of abandoned farmlands in Europe with the Dyna-CLUE model. Landsc. Ecol. 2009, 24, 1167–1181. [Google Scholar] [CrossRef]
  47. Singh, S.K.; Mustak, S.; Srivastava, P.K.; Szabó, S.; Islam, T. Predicting spatial and decadal LULC changes through cellular automata Markov chain models using earth observation datasets and geo-information. Environ. Processes 2015, 2, 61–78. [Google Scholar] [CrossRef] [Green Version]
  48. Qiang, Y.; Lam, N.S. Modeling land use and land cover changes in a vulnerable coastal region using artificial neural networks and cellular automata. Environ. Monit. Assess. 2015, 187, 57. [Google Scholar] [CrossRef]
  49. García-Álvarez, D. The influence of scale in LULC modeling. A comparison between two different LULC maps (SIOSE and CORINE). In Geomatic Approaches for Modeling Land Change Scenarios; Springer: Berlin/Heidelberg, Germany, 2018; pp. 187–213. [Google Scholar]
  50. Adbagher, E.; Becek, K.; Berberoglu, S. Modeling land use/land cover change using remote sensing and geographic information systems: Case study of the Seyhan Basin, Turkey. Environ. Monit. Assess. 2018, 190, 494. [Google Scholar] [CrossRef]
  51. Jiang, H.; Xu, X.; Guan, M.; Wang, L.; Huang, Y.; Liu, Y. Simulation of spatiotemporal land use changes for integrated model of socioeconomic and ecological processes in China. Sustainability 2019, 11, 3627. [Google Scholar] [CrossRef] [Green Version]
  52. Ren, Y.; Lü, Y.; Comber, A.; Fu, B.; Harris, P.; Wu, L. Spatially explicit simulation of land use/land cover changes: Current coverage and future prospects. Earth-Sci. Rev. 2019, 190, 398–415. [Google Scholar] [CrossRef]
  53. Liu, P.; Jia, S.; Han, R.; Liu, Y.; Lu, X.; Zhang, H. RS and GIS supported urban LULC and UHI change simulation and assessment. J. Sens. 2020, 2020, 5863164. [Google Scholar] [CrossRef]
  54. Talukdar, S.; Singha, P.; Mahato, S.; Pal, S.; Liou, Y.-A.; Rahman, A. Land-use land-cover classification by machine learning classifiers for satellite observations—A review. Remote Sens. 2020, 12, 1135. [Google Scholar] [CrossRef] [Green Version]
  55. Kafy, A.-A.; Shuvo, R.M.; Naim, M.N.H.; Sikdar, M.S.; Chowdhury, R.R.; Islam, M.A.; Sarker, M.H.S.; Khan, M.H.H.; Kona, M.A. Remote sensing approach to simulate the land use/land cover and seasonal land surface temperature change using machine learning algorithms in a fastest-growing megacity of Bangladesh. Remote Sens. Appl. Soc. Environ. 2021, 21, 100463. [Google Scholar] [CrossRef]
  56. Singh, V.K.; Kumar, V.; Jana, A. Spatial Distribution of Socioeconomic Factors and Its Impact on Urban Land Use Dynamics: An Agent Based Modeling Approach. In Urban Science and Engineering: Proceedings of ICUSE 2020; Springer: Singapore, 2021; Volume 121, p. 27. [Google Scholar]
  57. Rutherford, G.; Guisan, A.; Zimmermann, N. Evaluating sampling strategies and logistic regression methods for modelling complex land cover changes. J. Appl. Ecol. 2007, 44, 414–424. [Google Scholar] [CrossRef]
  58. Schubert, H.; Caballero Calvo, A.; Rauchecker, M.; Rojas-Zamora, O.; Brokamp, G.; Schütt, B. Assessment of Land Cover Changes in the Hinterland of Barranquilla (Colombia) Using Landsat Imagery and Logistic Regression. Land 2018, 7, 152. [Google Scholar] [CrossRef] [Green Version]
  59. Sekteria Pasaribu, U.; Virtriana, R.; Deliar, A.; Sumarto, I. Driving-factors identification of land-cover change in west java using binary logistic regression based on geospatial data. Proc. IOP Conf. Ser. Earth Environ. Sci. 2020, 500, 012003. [Google Scholar] [CrossRef]
  60. Clarke, K.C.; Hoppen, S.; Gaydos, L. A self-modifying cellular automaton model of historical urbanization in the San Francisco Bay area. Environ. Plan. B Plan. Des. 1997, 24, 247–261. [Google Scholar] [CrossRef] [Green Version]
  61. Nath, B.; Wang, Z.; Ge, Y.; Islam, K.; Singh, R.P.; Niu, Z. Land use and land cover change modeling and future potential landscape risk assessment using Markov-Ca model and analytical hierarchy process. ISPRS Int. J. Geo-Inf. 2020, 9, 134. [Google Scholar] [CrossRef] [Green Version]
  62. Hamedianfar, A.; Gibril, M.B.A.; Hosseinpoor, M.; Pellikka, P.K. Synergistic use of particle swarm optimization, artificial neural network, and extreme gradient boosting algorithms for urban LULC mapping from WorldView-3 images. Geocarto Int. 2020, 37, 1–19. [Google Scholar] [CrossRef]
  63. Handayanto, R.T.; Tripathi, N.K.; Kim, S.M. Land Use Growth Simulation and Optimization for Achieving a Sustainable Urban Form. Telkomnika 2018, 16, 2063–2072. [Google Scholar] [CrossRef]
  64. Parker, D.C.; Manson, S.M.; Janssen, M.A.; Hoffmann, M.J.; Deadman, P. Multi-agent systems for the simulation of land-use and land-cover change: A review. Ann. Assoc. Am. Geogr. 2003, 93, 314–337. [Google Scholar] [CrossRef] [Green Version]
  65. Al-Dhahra Spatial Strategy. 2020. Available online: https://www.aldahra.com/img/multimedia/Al-Dahra-Sustainability-Report-2020-V26.pdf (accessed on 20 April 2021).
  66. Abir, F.A.; Saha, R. Assessment of land surface temperature and land cover variability during winter: A spatio-temporal analysis of Pabna municipality in Bangladesh. Environ. Chall. 2021, 4, 100167. [Google Scholar] [CrossRef]
  67. Chemura, A.; Mutanga, O. Developing detailed age-specific thematic maps for coffee (Coffea arabica L.) in heterogeneous agricultural landscapes using random forests applied on Landsat 8 multispectral sensor. Geocarto Int. 2017, 32, 759–776. [Google Scholar] [CrossRef]
  68. Foody, G.M. Status of land cover classification accuracy assessment. Remote Sens. Environ. 2002, 80, 185–201. [Google Scholar] [CrossRef]
  69. Rwanga, S.S.; Ndambuki, J.M. Accuracy assessment of land use/land cover classification using remote sensing and GIS. Int. J. Geosci. 2017, 8, 611. [Google Scholar] [CrossRef] [Green Version]
  70. Pontius, R.G., Jr.; Millones, M. Death to Kappa: Birth of quantity disagreement and allocation disagreement for accuracy assessment. Int. J. Remote Sens. 2011, 32, 4407–4429. [Google Scholar] [CrossRef]
  71. Bratley, K.; Ghoneim, E. Modeling urban encroachment on the agricultural land of the eastern Nile Delta using remote sensing and a GIS-based Markov chain model. Land 2018, 7, 114. [Google Scholar] [CrossRef] [Green Version]
  72. Pijanowski, B.C.; Brown, D.G.; Shellito, B.A.; Manik, G.A. Using neural networks and GIS to forecast land use changes: A land transformation model. Comput. Environ. Urban Syst. 2002, 26, 553–575. [Google Scholar] [CrossRef]
  73. Shen, L.; Li, J.; Wheate, R.; Yin, J.; Paul, S. Multi-layer perceptron neural network and Markov chain based geospatial analysis of land use and land cover change. J. Environ. Inform. Lett. 2020, 3, 29–39. [Google Scholar] [CrossRef]
  74. Gustafson, E.J. Quantifying landscape spatial pattern: What is the state of the art? Ecosystems 1998, 1, 143–156. [Google Scholar] [CrossRef]
Figure 1. Location of the study area: The upper-left map illustrates the location of the city of Ibri within Al-Dhahra Governorate (A), while the location of Oman is presented in (B). The bottom map shows the spatial distribution of vegetation and urban area in 2020 (C).
Remotesensing 14 02037 g001
Figure 2. Flowchart showing the methodological framework for predicting LULC changes in the study area.
Remotesensing 14 02037 g002
Figure 3. Statistics of Kappa parameters from the comparison of the simulated LULC map and the reference map.
Remotesensing 14 02037 g003
Figure 4. Standardised driving forces (variables) used in the simulation process: elevation (A); POIs (B); distance from roads (C); slopes (D); distance from urban centres (E); distance from water wells (F).
Remotesensing 14 02037 g004
Figure 5. Potential areas for transition into urban land and the probability of being built-up (2030 to 2050): vegetation to urban (A), bare land to urban (B), and desert to urban (C).
Remotesensing 14 02037 g005
Figure 6. Historical changes in LULC between 2010 (A) and 2020 (B).
Remotesensing 14 02037 g006
Figure 7. Simulated LULC scenarios for 2030 (A), 2040 (B), and 2050 (C) in the study area.
Remotesensing 14 02037 g007
Figure 8. Gain and loss of LULC categories during observed times (2010–2020) and predicted years (2030–2050).
Remotesensing 14 02037 g008
Figure 9. Spatial trend surface (4th-order trend) of LULC dynamics in 2030: vegetation to urban (A); bare land to urban; (B) desert to urban; (C) all land types to urban (D).
Remotesensing 14 02037 g009
Table 1. Details of Landsat satellite images.
Satellite/
Sensor
Spatial
Resolution
Path/RawDate AcquiredProduct TypeCloud Cover
Landsat 7 ETM+30 m159/04421 January 2000L1TP0.00%
Landsat 7 ETM+30 m159/04417 February 2000L1TP0.00%
Landsat 8 OLI-TIRS30 m159/445 December 2000L1TP0.00%
Table 2. Parameters and performance of the MLP model.
ParameterOutcome
Input layer neurons5
Hidden layer neurons5
Output layer neurons2
Requested samples per class6418
Final learning rate0.0005
Momentum factor0.5
Sigmoid constant1
Acceptable RMS0.01
Iterations10,000
Training RMS0.2575
Testing RMS0.254
Accuracy rate93.67%
Skill measure0.873
Table 3. The outcome of forcing a single independent variable to be constant when testing the transition from bare land to urban land.
ModelAccuracy (%)Skill MeasureInfluence Order
With all variables93.670.8733N/A
Var. 1 constant93.480.86964
Var. 2 constant79.470.58932
Var. 3 constant93.420.86833
Var. 4 constant93.650.87305 (least influential)
Var. 5 constant72.30.44601 (most influential)
Var. 6 constant81.40.83216
Table 4. The outcome of MLP model with backwards stepwise constant forcing.
ModelVariables IncludedAccuracy (%)Skill Measure
With all variablesAll variables93.670.8733
Step 1: var. [4] constant[1,2,3,5,6]93.650.8731
Step 2: var. [1,4] constant[2,3,5,6]93.510.8702
Step 3: var. [4,1,3] constant[2,5,6]93.310.8661
Step 4: var. [4,1,3,2] constant[5,6]79.950.599
Step 5: var. [4,1,3,2,5] constant[6]86.330.644
Table 5. Observed LULC between 2010 and 2020.
LULC TypeArea in 2010 (ha)Area in 2020 (ha)Change (2010–2020)
Vegetation1118.521068.48−50.04
Urban6040.6210,188.854148.23
Bare land12,954.519525.06−3429.45
Desert36,221.3535,552.61−668.74
Table 6. Changes in LULC between 2020 and 2030.
LULC TypeArea in 2020 (ha)Area in 2030 (ha)Change (2020–2030)
Vegetation1068.481002.33−66.15
Urban10,188.8514,322.124133.27
Bare land9525.068600.56−924.5
Desert35,552.6132409.99−3142.62
Changes in LULC between 2030 and 2040
LULC typeArea in 2030 (ha)Area in 2040 (ha)Change (2030–2040)
Vegetation1002.33938.25−64.08
Urban10,322.1218,355.138033.01
Bare land8600.567155.5−1445.06
Desert32,409.9929,886.12−2523.87
Changes in LULC between 2040 and2050
LULC typeArea in 2040 (ha)Area in 2050 (ha)Change (2020–2050)
Vegetation938.25878.19−60.06
Urban18,355.1321,396.123040.99
Bare land7155.56259−896.5
Desert29,886.1227,801.69−2084.43
Publisher’s Note: MDPI stays neutral with regard to jurisdictional claims in published maps and institutional affiliations.

