Communication

A Novel Anchor-Free Method Based on FCOS + ATSS for Ship Detection in SAR Images

1
Graduate College, Air Force Engineering University, Xi’an 710051, China
2
Air and Missile Defense College, Air Force Engineering University, Xi’an 710051, China
3
Aeronautics Engineering College, Air Force Engineering University, Xi’an 710051, China
*
Author to whom correspondence should be addressed.
Remote Sens. 2022, 14(9), 2034; https://doi.org/10.3390/rs14092034
Submission received: 9 February 2022 / Revised: 14 April 2022 / Accepted: 15 April 2022 / Published: 23 April 2022

Abstract

:
Ship detection in synthetic aperture radar (SAR) images has been widely applied in maritime management and surveillance. However, some issues still exist in SAR ship detection due to the complex surroundings, scattering interferences, and diversity of the scales. To address these issues, an improved anchor-free method based on FCOS + ATSS is proposed for ship detection in SAR images. First, FCOS + ATSS is applied as the baseline to detect ships pixel by pixel, which can eliminate the effect of anchors and avoid missing detections. Then, an improved residual module (IRM) and a deformable convolution (Dconv) are embedded into the feature extraction network (FEN) to improve accuracy. Next, a joint representation of the classification score and localization quality is used to address the inconsistent classification and localization of the FCOS + ATSS network. Finally, the detection head is redesigned to improve positioning performance. Experimental simulation results show that the proposed method achieves 68.5% average precision (AP), which outperforms other methods, such as single shot multibox detector (SSD), faster region CNN (Faster R-CNN), RetinaNet, representative points (RepPoints), and FoveaBox. In addition, the proposed method achieves 60.8 frames per second (FPS), which meets the real-time requirement.

1. Introduction

Synthetic aperture radar (SAR) images have played an important role in the military and civilian fields as a result of the development of sensors. At present, SAR ship detection has been widely applied in maritime management and surveillance and has attracted more and more scholars’ attention [1,2,3,4,5,6]. For example, Pappas et al. [7] introduced superpixels (SPs) to improve the constant false alarm rate (CFAR) detector. Wang et al. [8] proposed a ship detection method based on hierarchical saliency filtering. He et al. [9] applied SP-level local information measurement on polarimetric SAR ship detection. However, these traditional ship detection methods are not ideal. This is because of the weak generalization ability and high computational cost.
In the past ten years, machine learning [10,11] and deep learning have continued to evolve. Object detectors via convolutional neural network (CNN) are booming, which can be roughly divided into two categories. The first is the two-stage detectors, such as faster region CNN (Faster R-CNN) [12]. The other is the one-stage detectors, such as you only look once (YOLO) [13], single shot multibox detector (SSD) [14] and RetinaNet [15]. Two-stage detectors can provide relatively good detection performance, but accrue high time costs. In contrast, one-stage detectors are characterized by lower computational costs and higher real-time application values.
Due to the emergence of large-scale SAR datasets [16,17,18,19,20], CNN-based ship detectors [21,22,23,24,25,26,27] have been proposed. For example, Li et al. [28] proposed a ship detector via lightweight Faster R-CNN. Deng et al. [29] proposed a method to detect small and densely clustered ships that is trained from scratch. Zhang et al. [30] proposed a ship detection method via a semantic context-aware network (SCANet). Gao et al. [31] proposed a SAR-Net for achieving a balance between speed and accuracy. The above methods are anchor-based detectors. These methods still have certain shortcomings, even if they work well in ship detection. First, all hyperparameters of anchors are set according to prior knowledge. If the detection task changes, these hyperparameters need to be reset. Second, most anchor boxes tend to contain backgrounds, and only a few anchor boxes contain ships, which will result in far more negative samples than positive samples, i.e., sample imbalance. Finally, a large number of anchor frames are redundant, thereby bringing additional computational costs.
Anchor-free methods directly predict the category and localization instead of using the anchor box. Anchor-free methods consist of key-point-based methods [32,33,34] and center-based methods [35,36,37,38]. The key-point-based methods such as CenterNet [34] and representative points (RepPoints) [32] first detect the key points and then combine the key points for object detection. Center-based methods, such as adaptive training sample selection (ATSS) [35], fully convolutional one-stage object detection (FCOS) [36], FoveaBox [37] and feature selective anchor-free (FSAF) [38], directly detect objects by the center point and the bounding box. Although the anchor-free methods [39,40,41] for ship detection are still under development, they have shown a better performance potential and a trade-off between speed and accuracy. However, the performance of the anchor-free method still needs to be improved. Because of the complex surroundings and diversity of the scales, the network’s feature representation ability needs to be further improved. In addition, there is the inconsistency of classification and localization in the existing networks. Finally, there is also the blurred border caused by scattering interferences from land or sea surface in SAR images. To address the above problems, an improved anchor-free method based on the FCOS + ATSS network is proposed for ship detection in SAR images. The contributions are summarized as follows:
  • An improved anchor-free detector based on the FCOS + ATSS network is proposed for ship detection in SAR images, which can eliminate the effect of anchors and improve detection performance.
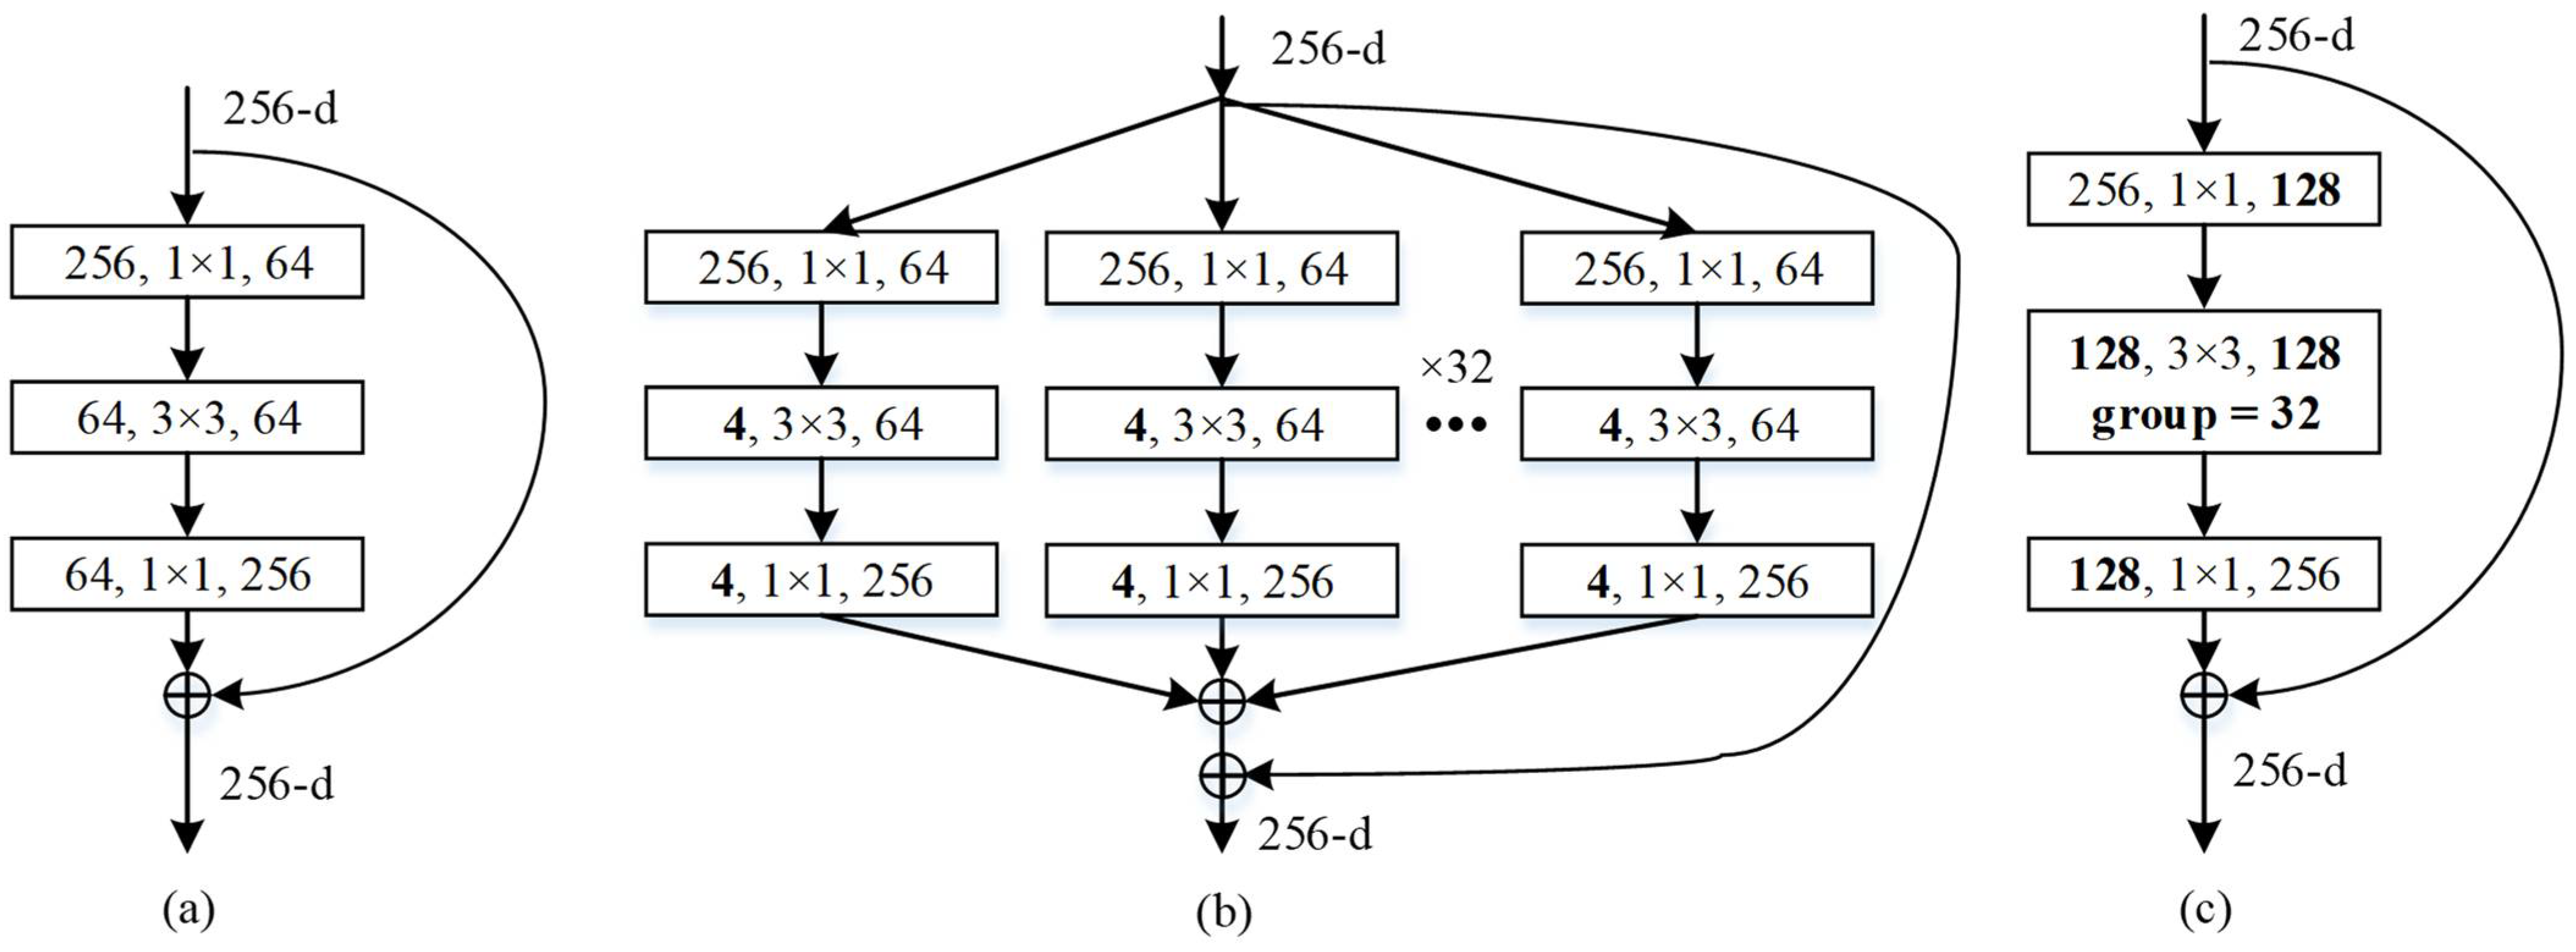
  • To improve accuracy, an improved residual module (IRM) and a deformable convolution (Dconv) are embedded into the feature extraction network (FEN).
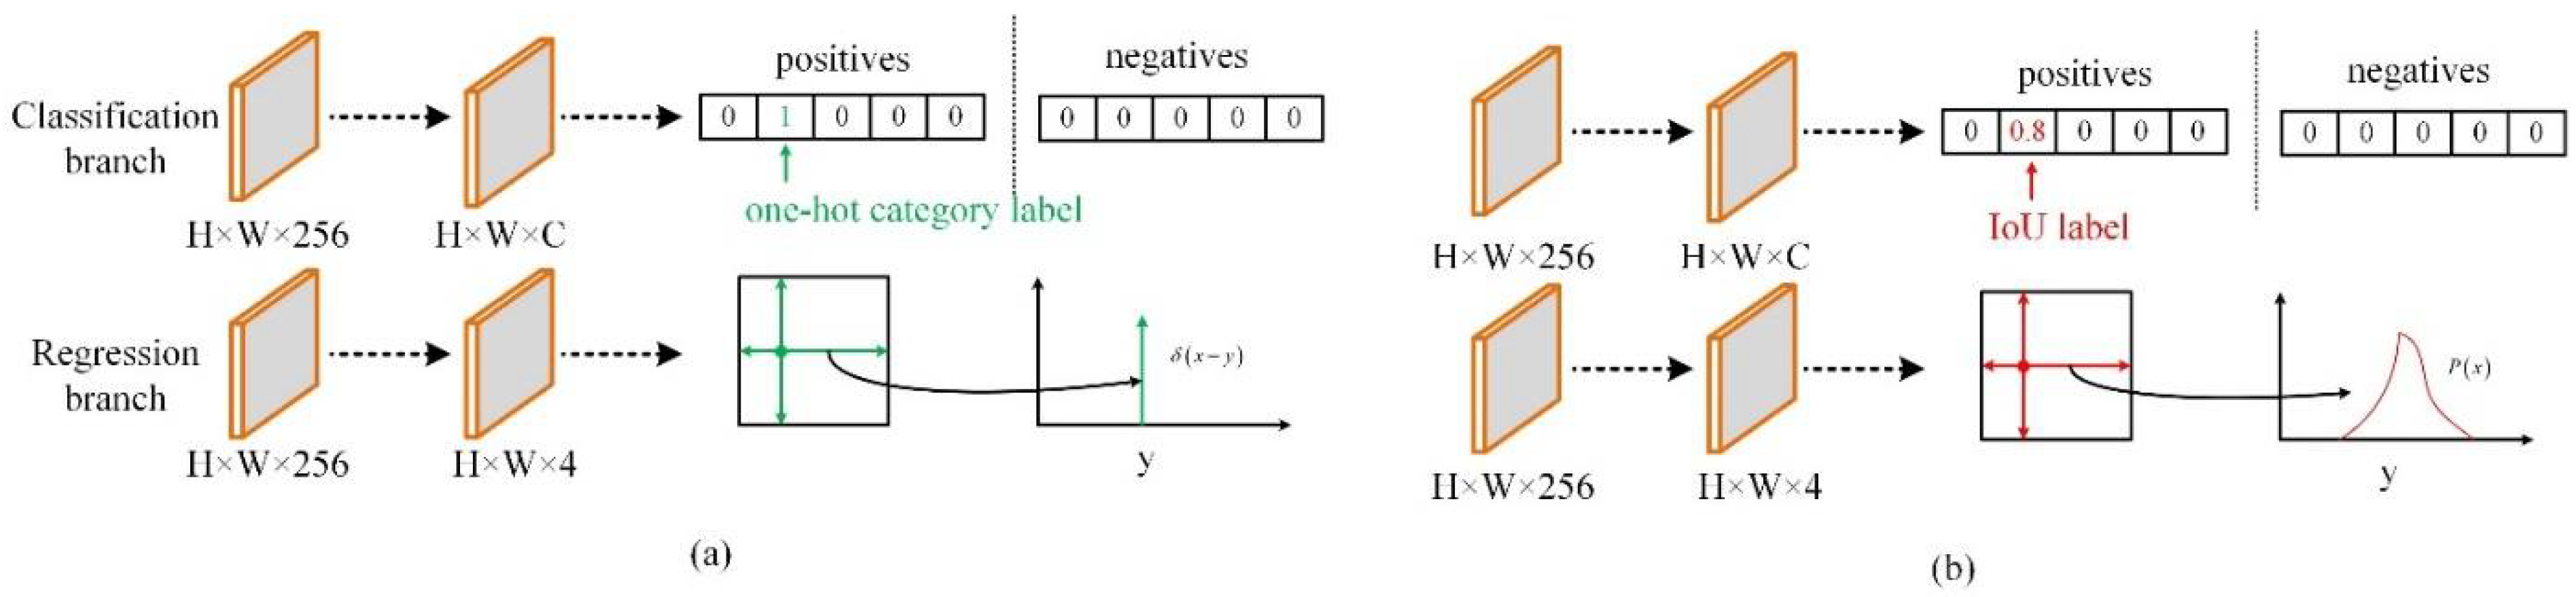
  • Considering the inconsistency of classification and localization of the FCOS + ATSS network, we propose a joint representation of the classification score and localization quality.
  • Considering the blurred borders caused by scattering interferences, we redesign the detection to improve positioning performance.

2. Materials and Methods
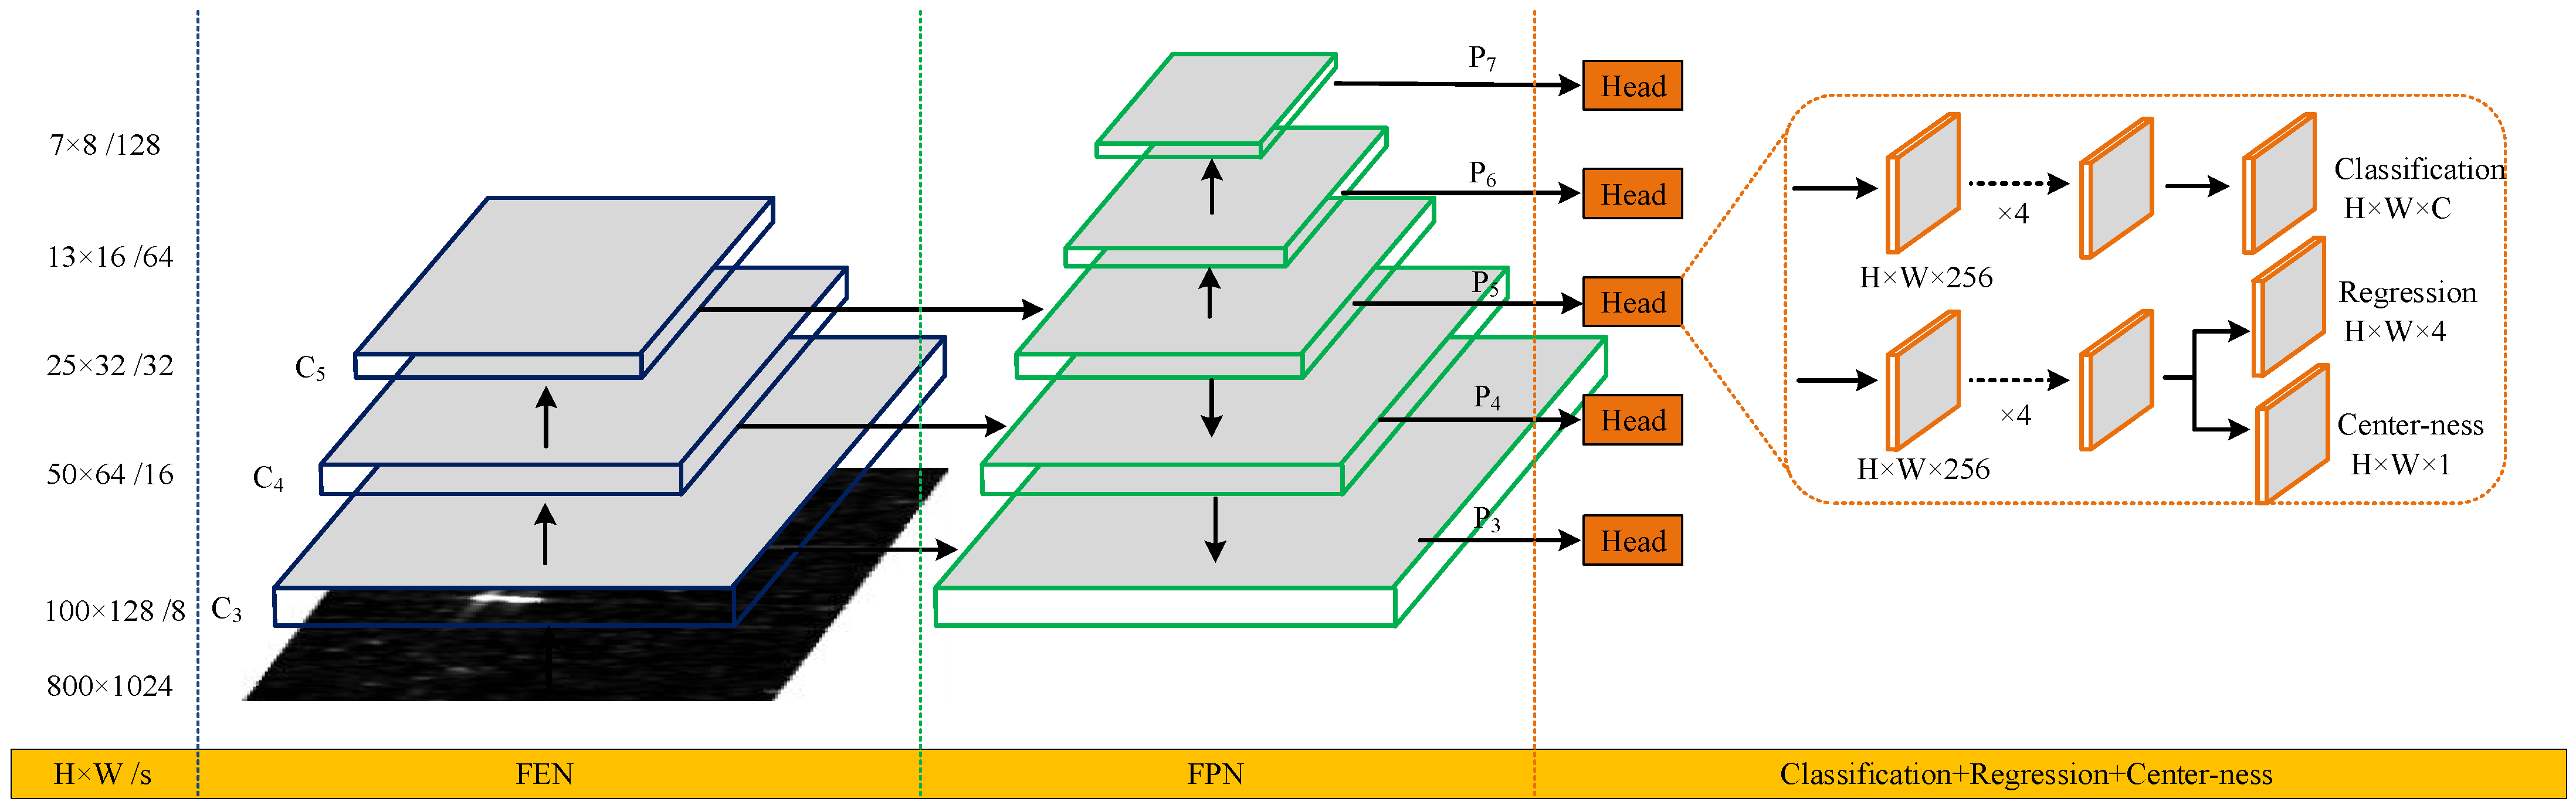
In this section, the FOCS + ATSS network is introduced as the baseline of the proposed method first. Second, the overall scheme of our method is presented. Then, the FEN redesign and detection head redesign are described in detail. Finally, the loss function is given.

2.1. FCOS + ATSS

The FCOS network includes an FEN, a feature pyramid network (FPN), and a detection head, as shown in Figure 1. The FEN is responsible for computing a convolutional feature map over an entire input image. Specifically, for ResNets we use the feature activations output by each stage’s last residual block. We denote the output of these last residual blocks as {C3, C4, C5} for the conv3, conv4, and conv5 outputs, and note that they have strides of {8, 16, 32} pixels with respect to the input image. The FPN construct features pyramid levels P3 to P7, where P3 to P5 are computed from the output of the corresponding C3 to C5 using top-down and lateral connections and P6 and P7 are obtained via a 3 × 3 convolutional layer, with the stride being 2 on P5 and P6, respectively. Moreover, the feature levels P3, P4, P5, P6, and P7 have strides of 8, 16, 32, 64, and 128, respectively. The different pyramid levels of FPN are used to detect different sized objects. The detection head consists of a classification branch, a regression branch, and a center-ness branch. The classification branch and regression branch are to achieve object classification and localization, respectively. The classification branch and regression branch predict a vector p for classification and a real vector t = ( l , t , r , b ) , encoding bounding-box coordinates, respectively. Here, l , t , r , b are the distances from the location to the four sides of the bounding box. The center-ness branch is to predict the “center-ness” of a location. The “center-ness” represents the normalized distance from the location to center of the object that the location is responsible for. Given the regression targets ( l , t , r , b ) for a location, the center-ness target is defined as:
centerness = min ( l , r ) max ( l , r ) × min ( t , b ) max ( t , b )
where sqrt is used to slow down the decay of the center-ness. The center-ness ranges from 0 to 1. When testing, the final score is the square root of the product of the predicted center-ness and the corresponding classification score. Consequently, center-ness can down-weight the scores of bounding boxes far from the center of an object.
In this paper, we adopt the ATSS version of FCOS (FCOS + ATSS) as the baseline model for the proposed method. According to the characteristics of an object, ATSS is proposed to define positive and negative samples, which hardly increases the network’s hyperparameters. To apply FCOS + ATSS to SAR ship detection, we perform experiments on a high-resolution SAR image dataset (HRSID) [18]. The total training loss function is expressed as follows:
L ( { p x , y } , { t x , y } ) = 1 N pos x , y L cls ( p x , y , c x , y ) + 1 N pos x , y [ c x , y 1 ] L reg ( t x , y , t x , y ) + 1 N pos x , y L CE ( centerness x , y , centerness x , y )
where ( x , y ) denotes each location on the feature maps. p x , y denotes the predicted score, and c x , y denotes the ground-truth score. t x , y denotes the predicted regression, and t x , y denotes the ground-truth regression. Centerness denotes the predicted center-ness and centerness denotes the ground-truth center-ness. N pos denotes the number of positive samples. L cls , L reg , and L CE denote focal loss [15], generalized intersection over union (GIoU) loss [42], and binary cross entropy loss, respectively. [ c x , y 1 ] denotes the Iverson bracket indicator function as follows:
[ c x , y 1 ] = { 1 c x , y 1 0 otherwise
where c x , y is 1 if c x , y 1 and 0 otherwise.
As can be seen from Figure 2, FCOS + ATSS can accurately detect most of the ships. However, there is a severe problem of missing ships. In addition, the strong scattering objects are mistakenly detected as ship targets. To reduce false alarms and missing detections, the FEN and detection head of the FCOS + ATSS network need to be further improved.

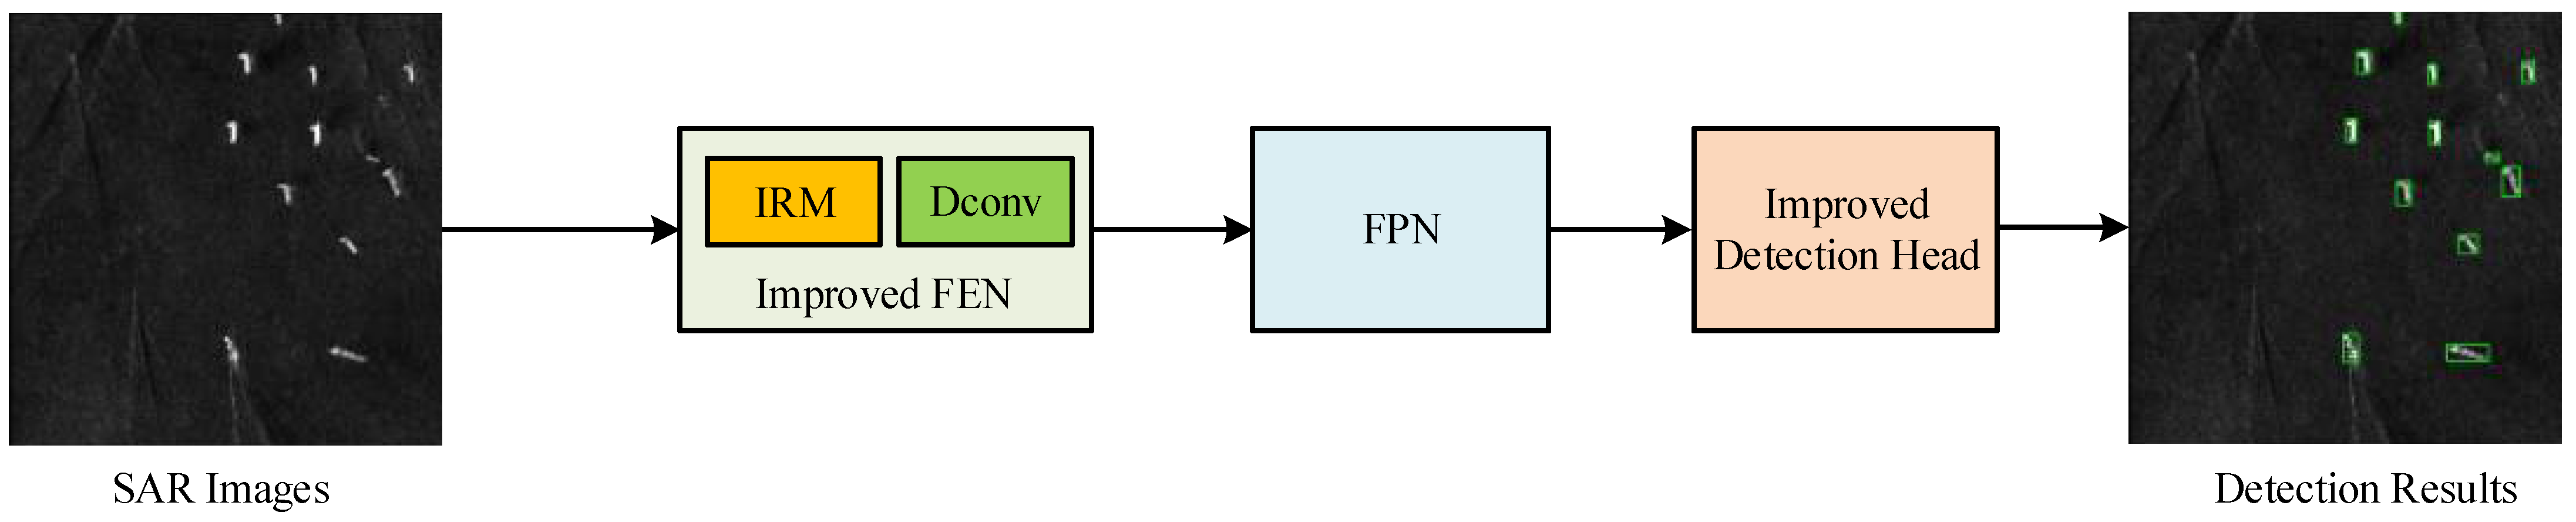
2.2. Overall Scheme of the Proposed Method

In this paper, an improved FCOS + ATSS method is proposed for ship detection. In brief, the IRM and Dconv are embedded into FEN to improve the ability of feature representation. In addition, a joint representation and a general distribution are used to improve the detection head. To clearly illustrate the proposed method, Figure 3 presents its flowchart. First, SAR images are fed into the improved FEN, which is utilized to extract the feature maps (C1 to C5) of SAR images by a bottom-up pathway. Second, the FPN is established to construct multiscale feature pyramid levels (P3 to P7) with C = 256 channels. Specifically, P3 to P5 are computed from C3 to C5 via lateral connections and a top-down pathway. P6 is computed from C5 via a 3 × 3 convolution. P7 is computed from P6 by applying a ReLU function and a 3 × 3 convolution. Finally, the improved detection heads output detection results that include classification and localization.

2.3. Feature Extraction Network Redesign

Increasing the depth or width of a network is usually used to improve accuracy. However, as the number of hyperparameters increases, so does the complexity and computational cost of a network. Therefore, how to improve accuracy without increasing parameters is a difficult trade-off problem. The inception model can achieve a high level of accuracy while maintaining low model complexity. The reason is that the inception model follows a split–transform–merge strategy. However, the hyperparameter setting of the inception model is complex, so the model’s scalability is moderate. For better accuracy, this paper introduces the strategy of split–transform–merge into the residual module, as shown in Figure 4.
In Figure 4a, the parameters of the original residual module are 256 × 64 + 3 × 3 × 64 × 64 + 64 × 256 = 69,632. In Figure 4b, the parameters of the IRM are 32 × (256 × 4 + 3 × 3 × 4 × 4 + 4 × 256) = 70,144. Therefore, the parameters of the network hardly change after the improvement in the residual module. To reduce the model’s parameters, we introduce a group convolution to further optimize the IRM, as shown in Figure 4c. In the group convolution, the input and output channels are divided into 32 groups, and convolutions are performed separately within each group. To further improve the network’s ability to adapt to SAR ships, we use the Dconv [43] to replace the ordinary convolution.

2.4. Detection Head Redesign

Among all bounding boxes output by the FCOS + ATSS network, some bounding boxes with accurate localization may be eliminated due to their low classification scores. In addition, some bounding boxes containing background pixels may be preserved due to their high classification scores. This is because of the inconsistency of classification and localization. To address this issue, we propose a joint representation of the classification score and localization quality.
Focal loss (FL) is adopted by FCOS + ATSS to address class imbalance during training. A typical form of FL is as follows:
L FL ( p , y ) = α t ( 1 p t ) γ log ( p t )
p t = { p i f y = 1 ( 1 p ) o t h e r w i s e
α t = { α i f y = 1 ( 1 α ) o t h e r w i s e
where y { 0 , 1 } denotes the ground-truth class and p { 0 , 1 } is the predicted probability. α , γ are the weighting factor and tunable focusing parameter, respectively.
As shown in Figure 5, the proposed method softens the standard one-hot category label and uses an IoU [ 0 , 1 ] label on the corresponding category (see the classification branch in Figure 5), where IoU is the IoU score between the predicted bounding box and its corresponding ground-truth bounding box during training. Specifically, IoU = 0 denotes the negative samples with 0 quality scores, and 0 < IoU 1 stands for the positive samples with target IoU scores. Due to FL only supporting discrete labels { 0 , 1 } , the original FL needs to be improved.
L IFL ( σ , IoU ) = | IoU σ | β ( ( 1 IoU ) log ( 1 σ ) + IoU log ( σ ) )
where σ denotes the sigmoid operator and β denotes the modulating factor.
Due to scattering interferences from land or sea surface in SAR images, the borders of ships are relatively unclear. As stated in Section 2.1, we adopt the relative offsets from the location to the four sides of a bounding box as the regression targets (see the regression branch in Figure 5). As shown in Figure 5a, in the FCOS + ATSS model the regressed label y is expressed as a single Dirac delta distribution, δ ( x y ) , which cannot cope with the ambiguity and uncertainty of the data. To improve positioning performance, we model the regressed label, y, as a general distribution, P ( x ) , as shown in Figure 5b. The predicted value, y , is presented as:
y = y 0 y n P ( x ) x d x
where y 0 and y n denote the minimum and maximum values of y.
To facilitate implementation with neural networks, we transform the above equation into a discrete form. Specifically, we divide the range [ y 0 , y n ] into equal intervals by Δ = 1 , so the predicted value, y , can be expressed as:
y = i = 0 n P ( y i ) y i
where i = 0 n P ( y i ) = 1 .
The shape of P ( x ) is optimized to improve the efficiency of network learning by the following loss function:
L P ( P ( y i ) , P ( y i + 1 ) ) = ( ( y i + 1 y ) log ( P ( y i ) ) + ( y y i ) log ( P ( y i + 1 ) ) )
where y i and y i + 1 are the two closest values to y.

2.5. Loss Function

The entire network is trained with a multi-task loss function as follows:
L = 1 N pos j L IFL + 1 N pos j [ c j 1 ] ( 2 L GIoU + 0.25 L P )
where L GIoU denotes the GIoU loss function [38].

3. Results

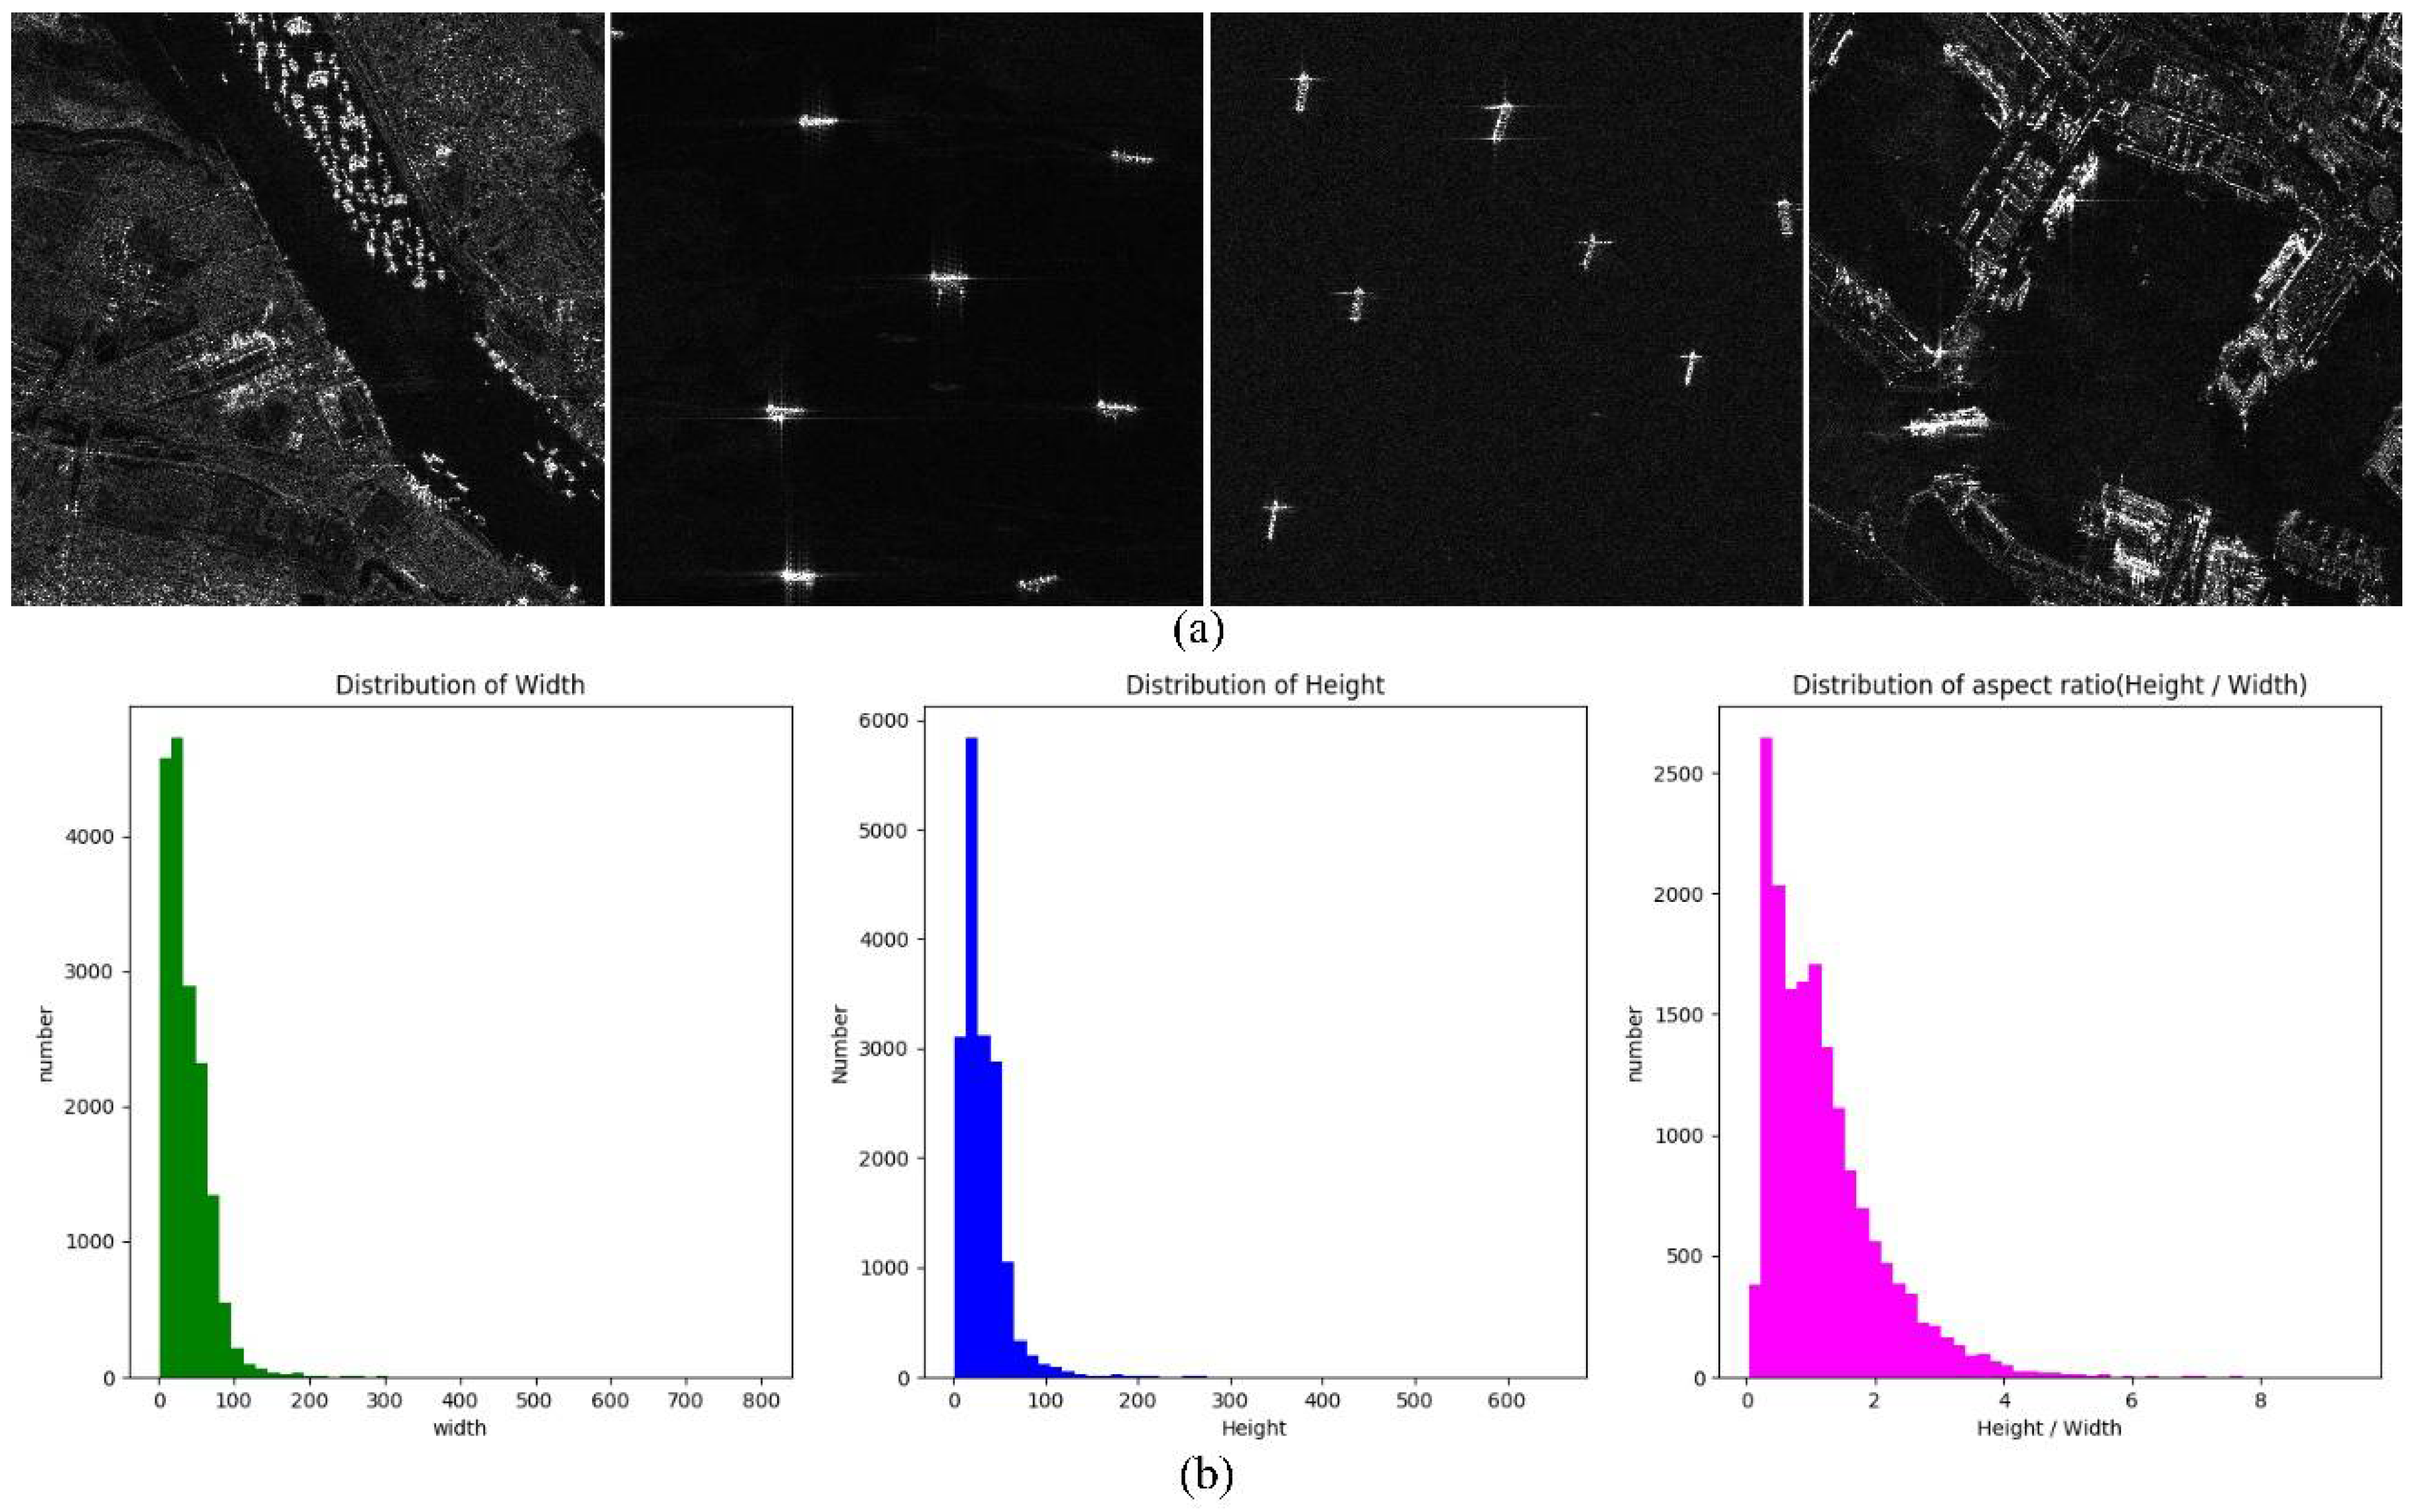
3.1. Dataset and Evaluation Metrics

The HRSID [18] is used to evaluate the detection performance of the proposed method. The HRSID proposed by Wei et al. is constructed by using original SAR images from the Sentinel-1B, TerraSAR-X, and TanDEM-X satellites. There are 5604 images with 800 × 800 pixels and 16,951 multiscale ships in the HRSID. These images have various polarizations, imaging modes, imaging conditions, etc. The entire dataset is divided into a training set with 1821 images, a validation set with 1821 images, and a test set with 1962 images. Some samples and shape distributions of HRSID are shown in Figure 6.
The average precision (AP), AP50, and frames per second (FPS) [40] are used as the evaluation metrics.

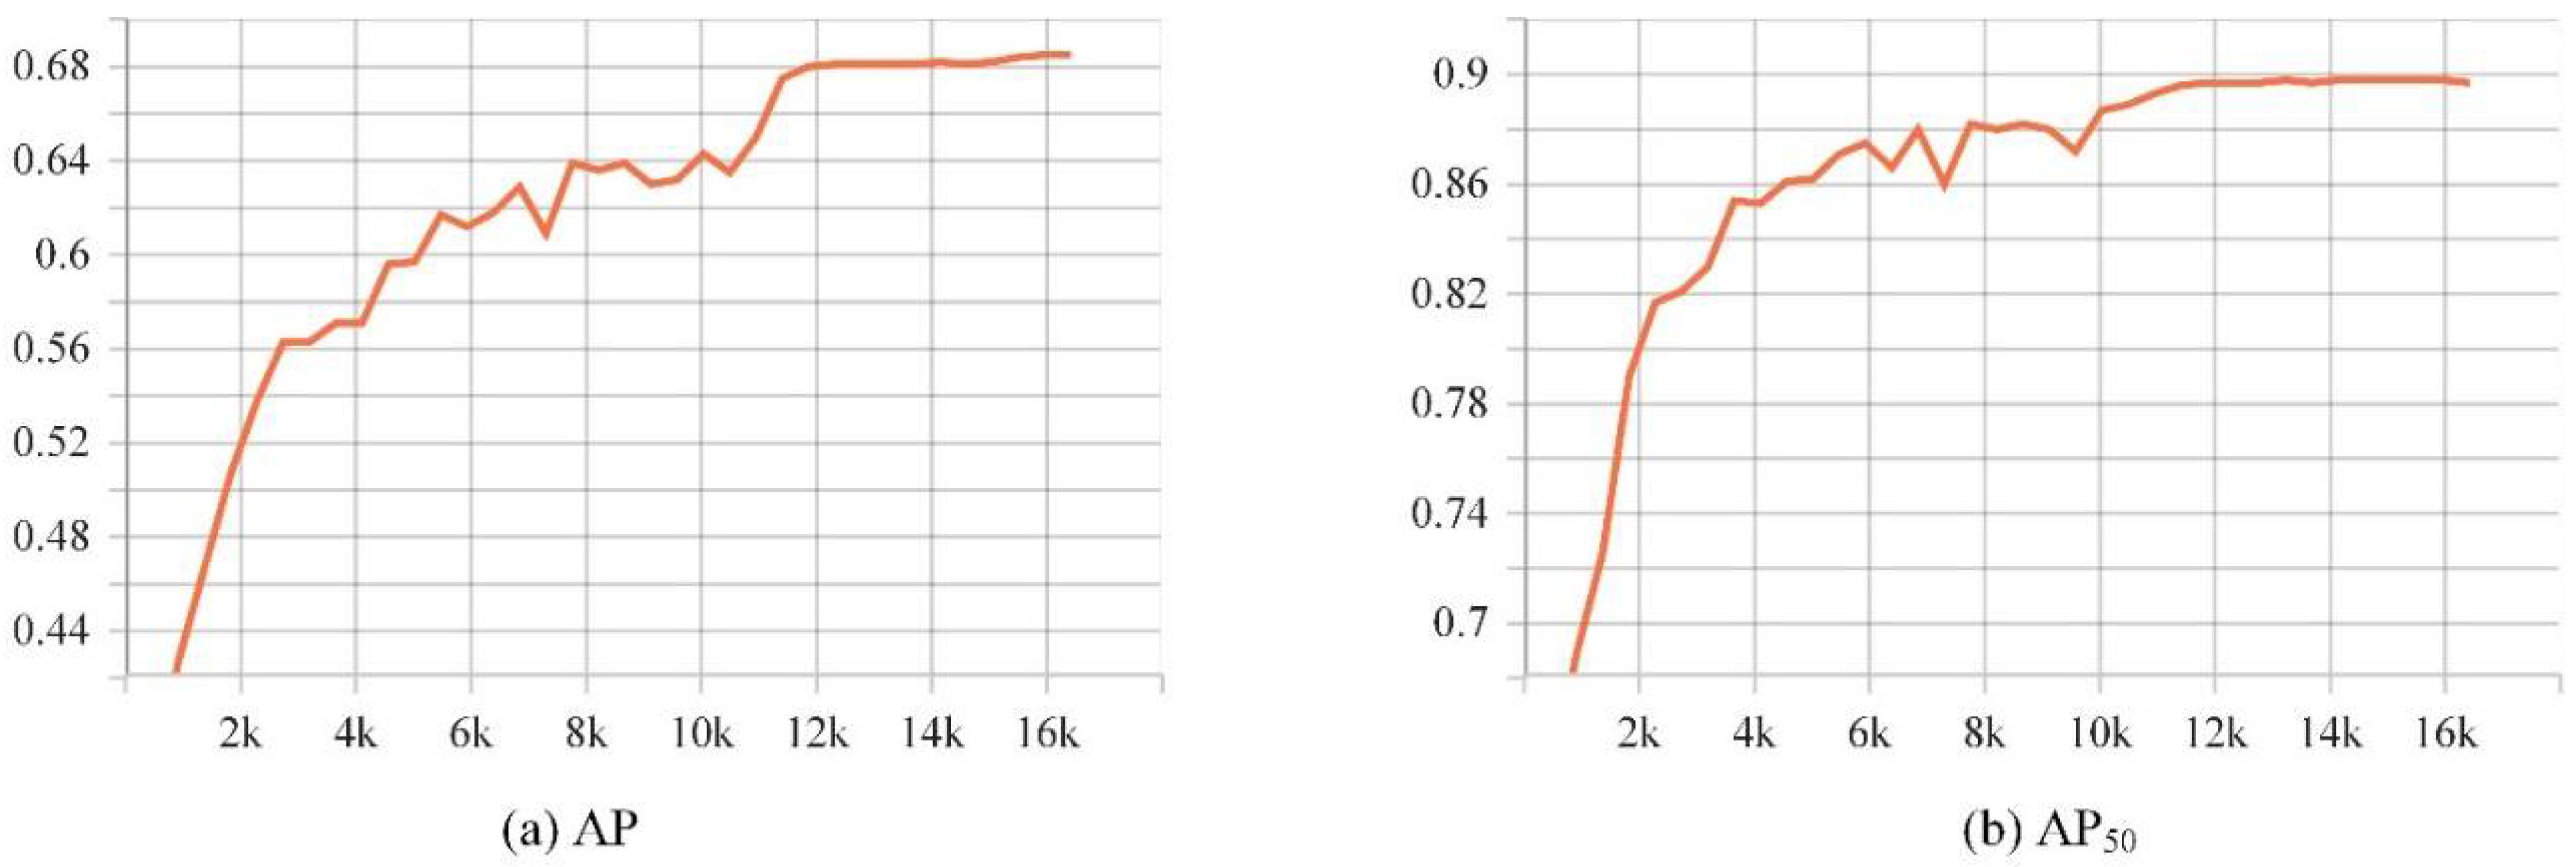
3.2. Network Training

All the experiments were supported by a personal computer with the Ubuntu 16.04 operating system. The software configuration consisted of python programming language, PyTorch, CUDA, and cuDNN. The hardware capabilities included an RTX 2080Ti GPU, Intel i9-9820X CPU, and 128 GB RAM. To maintain the same hyperparameters of the detectors, we chose MMDetection for training and testing. All the detectors were trained with the GPU and finished in 30th epochs. The momentum and weight decay were set to 0.9 and 0.0001, respectively. The IoU threshold was set to 0.6 when training and testing. We chose SGD with the initial learning rate of 0.005 as the optimizer, and the other hyperparameters were set to the default values in MMDetection. We set β = 2 and n = 16 in the proposed method.

3.3. Ablation Study

Since the proposed method is similar in structure to the FCOS + ATSS network, FCOS + ATSS was used as the baseline. The detection results of ablation studies are shown in Table 1, where S1 and S2 denote the FEN redesign and detection head redesign, respectively.

3.3.1. Analysis on FEN Redesign

As shown in Table 1, the AP and AP50 of baseline + S1 method are 4.8% and 3.7% higher than baseline, respectively. These results suggest that the FEN redesign is effective for improving detection accuracy by improving the network’s feature representation ability. Specifically, we introduced the IRM and Dconv module to improve the network’s feature representation ability. Although the FPS of the baseline + S1 method decreases (73.9 > 61.0), it is acceptable.

3.3.2. Analysis of Detection Head Redesign

As shown in Table 1, the AP and AP50 of the baseline + S2 method are 5.5% and 3.3% higher than baseline, respectively, suggesting that the detection head redesign is effective for improving detection accuracy. On one hand, the baseline + S2 method achieves the joint representation of classification score and localization quality. On the other hand, the general distribution improves localization accuracy. Although the FPS of the baseline + S2 method decreases (73.7 > 73.7), the reduction is small.

3.3.3. Analysis on FEN Redesign and Detection Head Redesign

As shown in Table 1, the AP and AP50 of the baseline + S1 + S2 (Ours) method are 8.3% and 4.7% higher than baseline, respectively. In addition, the AP and AP50 of our method are the highest among all methods. This is because the advantages of two modules are combined in our method. Although the detection speed of our method is the slowest, our method still meets the real-time requirement. Figure 7 shows some detection results of FCOS + ATSS and the proposed method. It can be seen that the proposed method can reduce missing detections and false alarms, indicating that the proposed method can improve the detection performance of FCOS + ATSS.

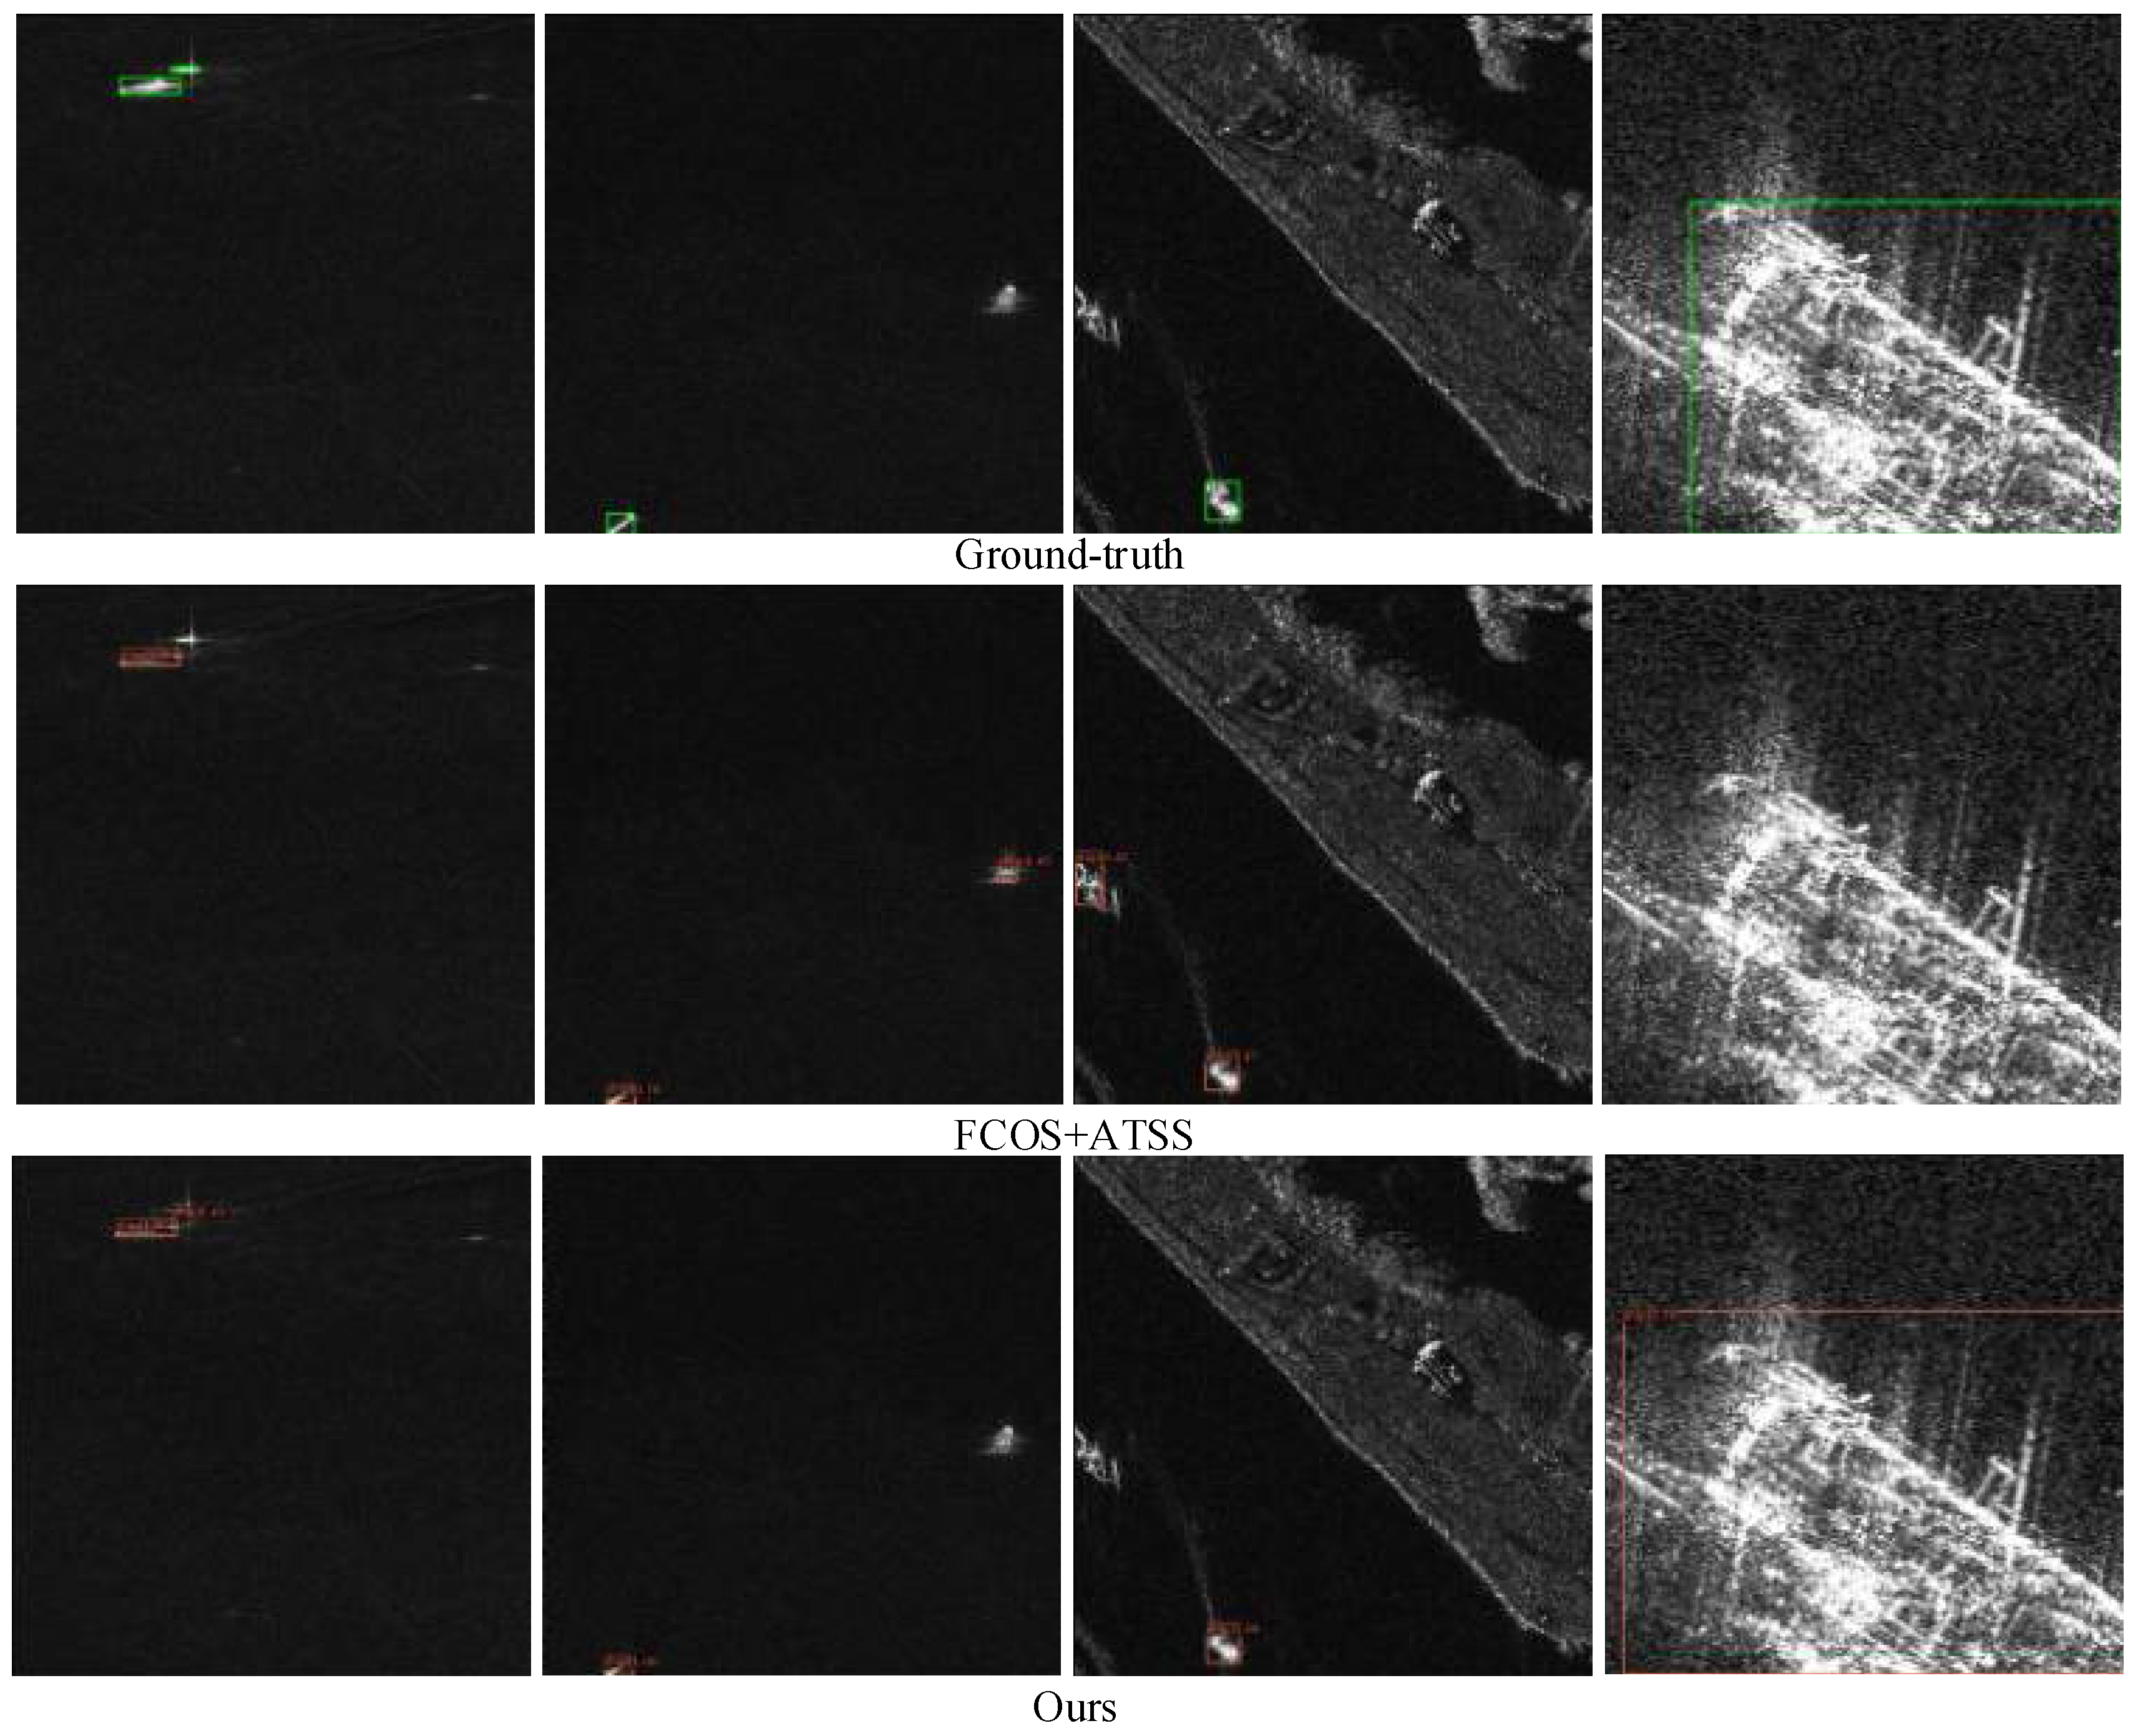
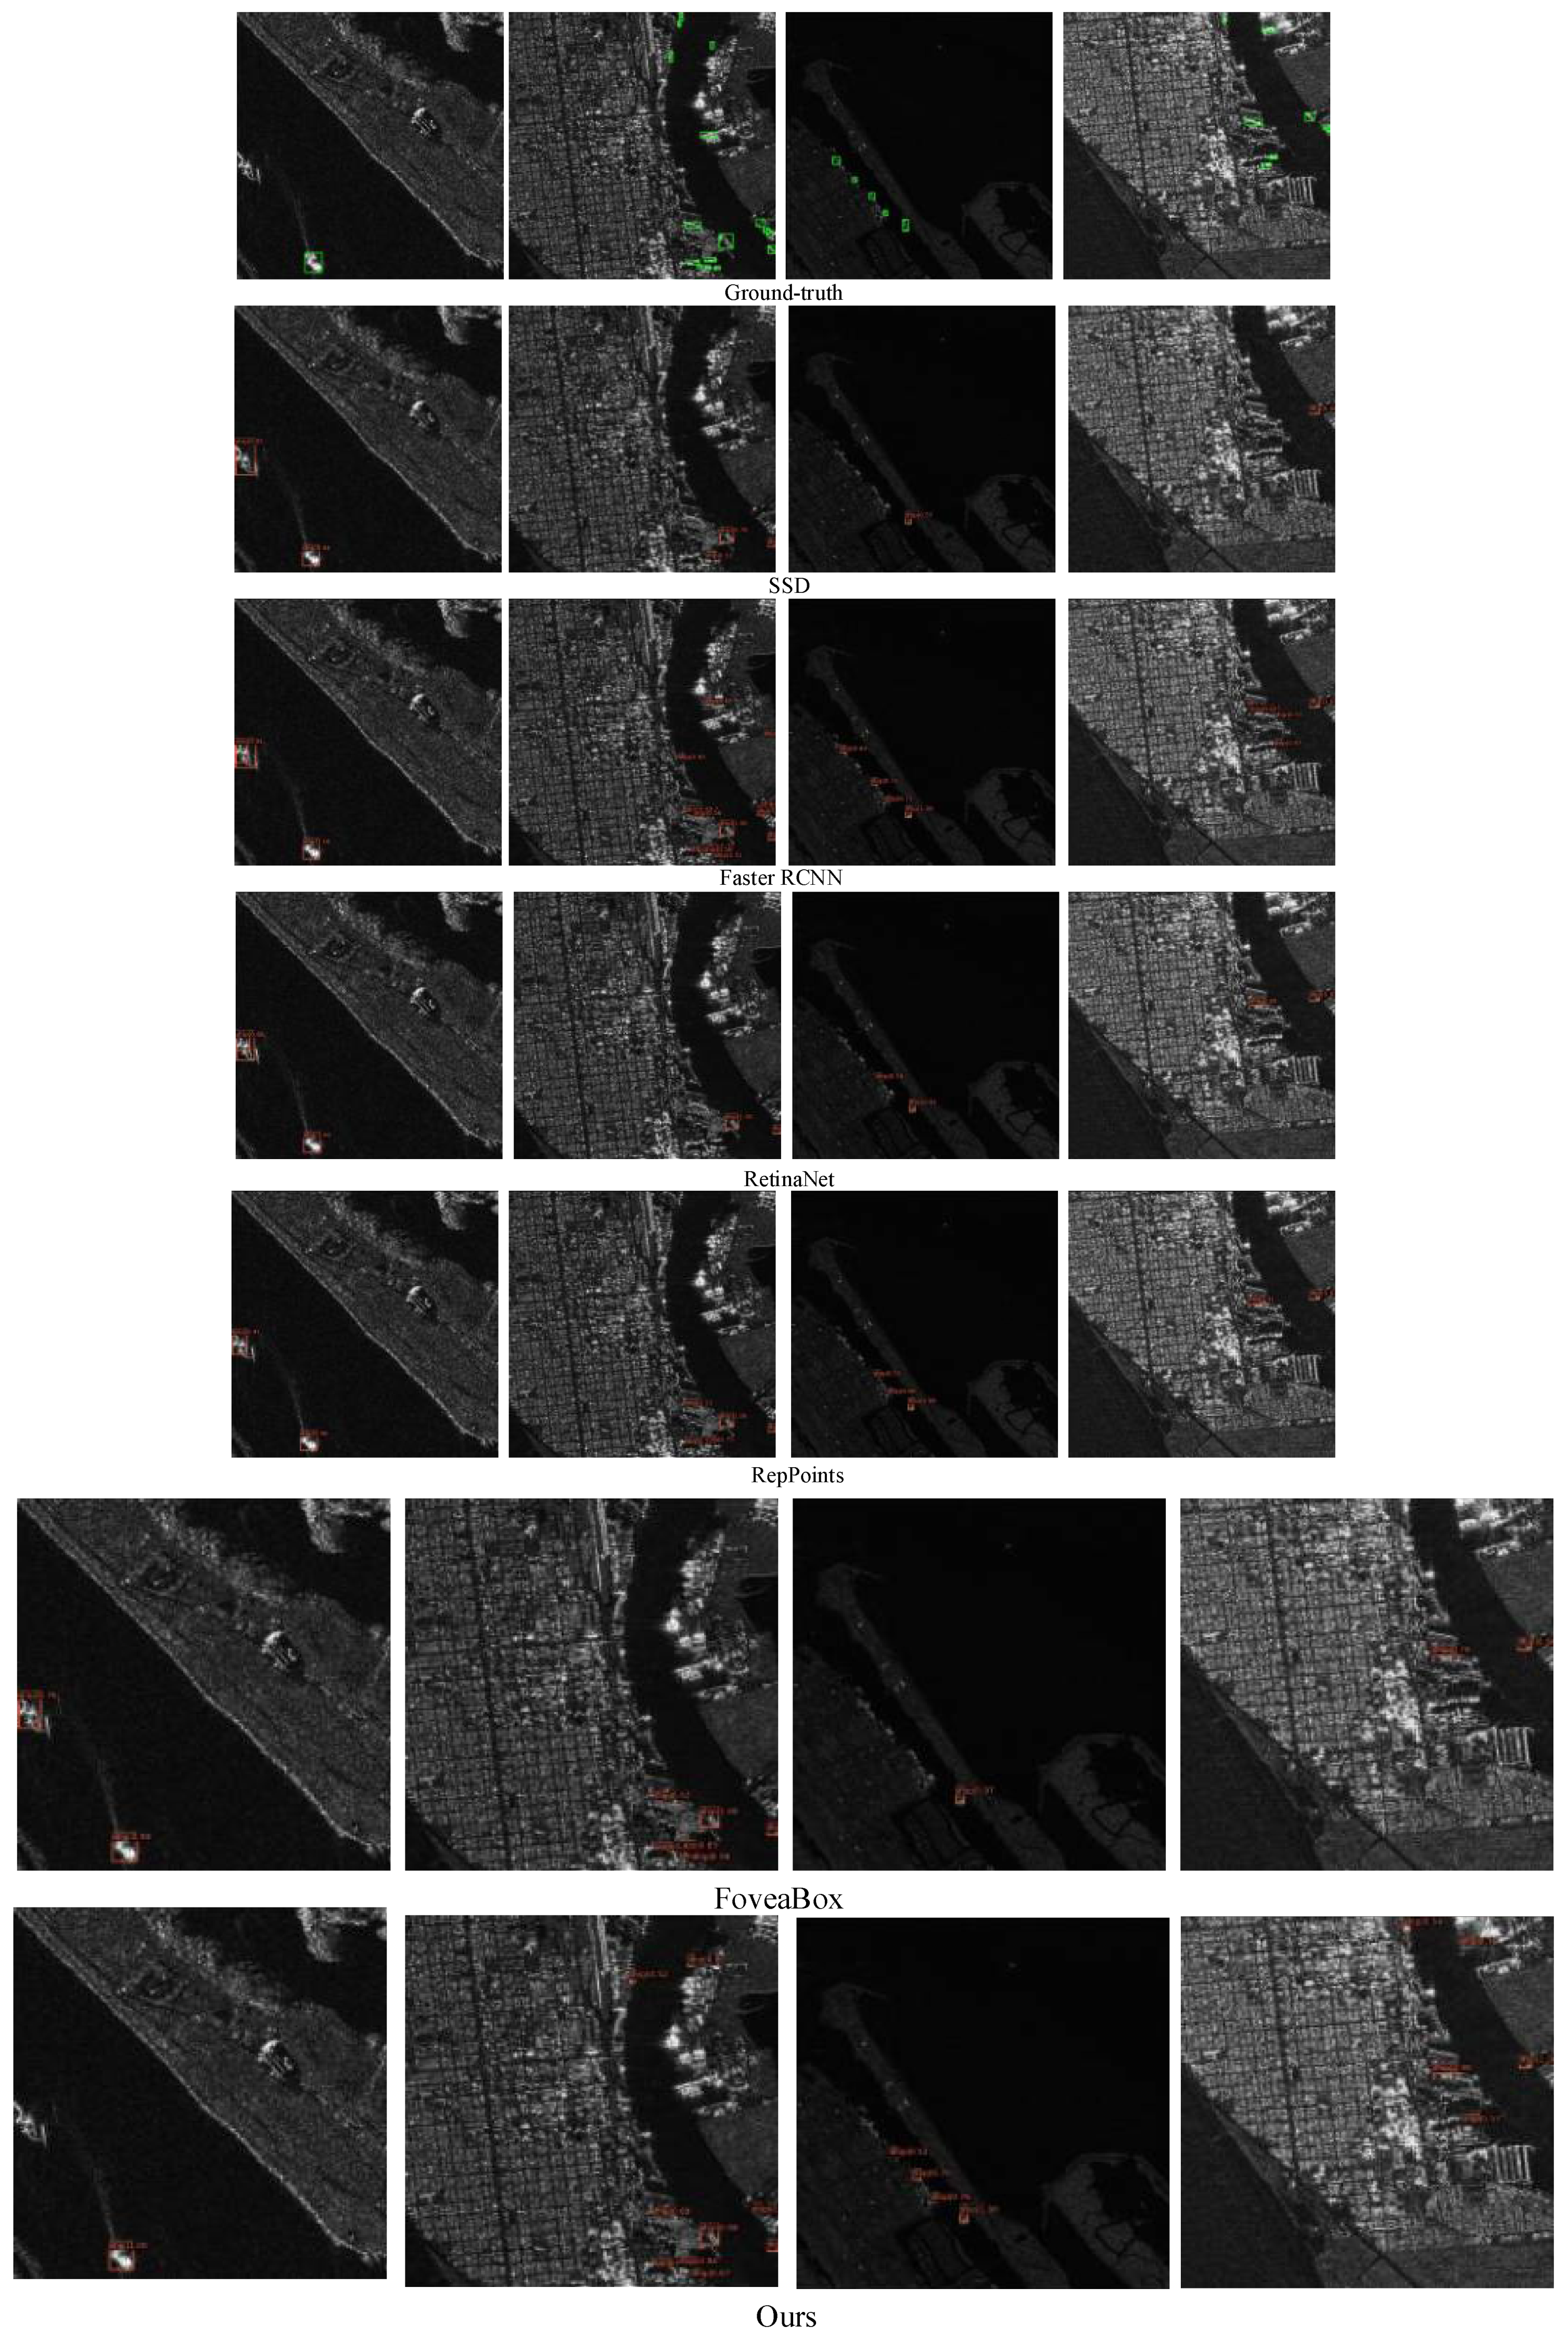
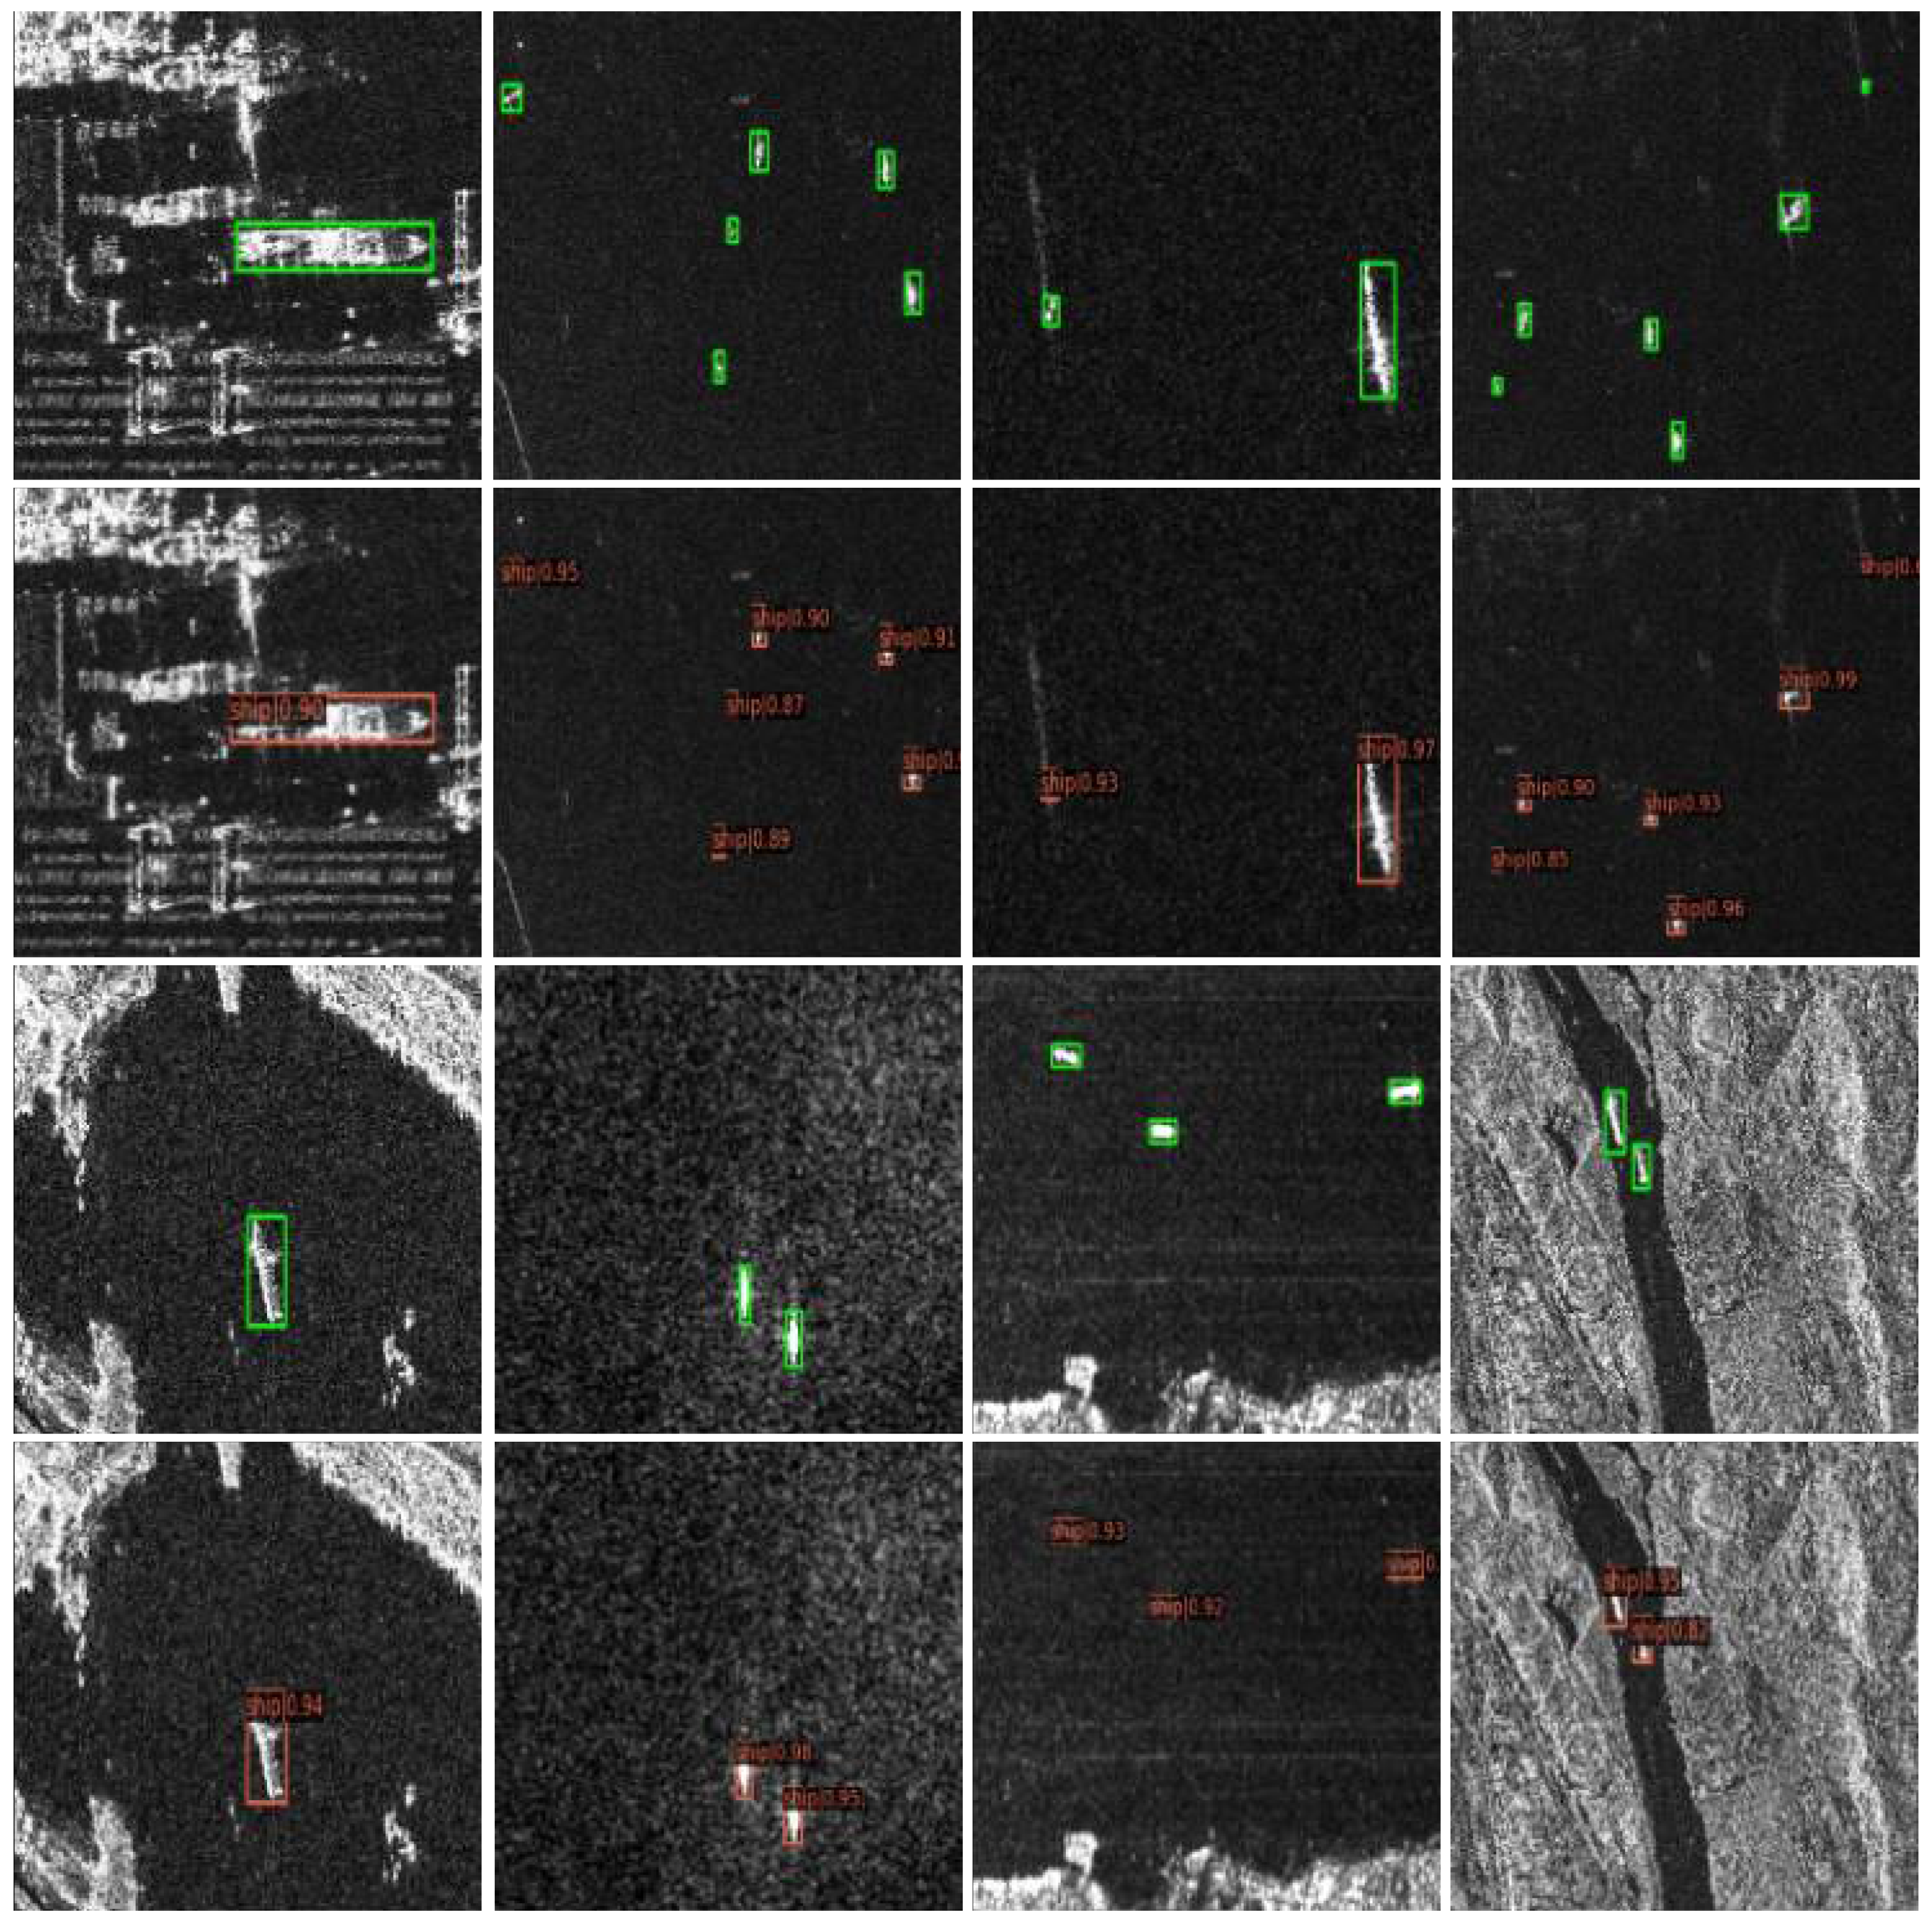
3.4. Comparison with Other Methods

Based on the same experimental environment, the detection performance of the proposed method is compared with those of other methods, such as Faster RCNN [12], SSD [14], RetinaNet [15], RepPoints [32], and FoveaBox [37]. From Table 2, we can draw the following conclusions:
  • The AP and AP50 of our method are better than those of other methods. Specifically, the AP of our method is 68.5%, which is 21.5%, 14.8%, 10.3%, 11.1%, and 10.0% higher than SSD, Faster RCNN, RetinaNet, RepPoints, and FoveaBox, respectively. The AP50 of our method is 89.8%, which is 15.4%, 13.1%, 6.8%, 4.3%, and 7.2% higher than SSD, Faster RCNN, RetinaNet, RepPoints, and FoveaBox, respectively.
  • The AP and AP50 of SSD are the worst. This is because SSD uses high-resolution features to detect small ships, resulting in unsatisfactory detection results. In addition, SSD reduces the input image size to 300 × 300, which destroys the image information.
  • The AP and AP50 of anchor-free methods such as RepPoints and FoveaBox are generally better than those of anchor-based methods except for RetinaNet. This shows that the anchor-free method is more suitable for SAR ship detection.
  • The FPS of SSD is the highest, and that of Faster RCNN is the lowest. Although the FPS of our method is only 60.8, it already meets the real-time requirement.
To visually demonstrate the detection performance of different methods, Figure 8 shows the comparative results for the different methods. In the first column of Figure 8, one false alarm exists in the other methods, but the proposed method can avoid this false alarm. In the second and third columns of Figure 8, some missing ships exist in all methods. However, Faster RCNN and our method have fewer missed ships than the other methods. In the fourth column of Figure 8, most of the ships were missed by the other methods. However, our method has the fewest missing detections. Compared with the other methods, the proposed method obtains a better detection performance.

4. Discussion

The detection results on the validation set are shown in Figure 9. As shown in Figure 9, the AP and AP50 of the validation set gradually increased with the network training, and the AP and AP50 finally stabilized to 68% and 90%, respectively. The AP and AP50 of our method on the test set are 68.5% and 89.8%, respectively. Therefore, there is no significant difference between the detection accuracy of the training set and the test set, which verifies the effectiveness of the method in this paper.
The simulation experiments were carried out on the SSDD [20] to verify the model migration ability. AP and FPS were used to evaluate the detection performance of different methods on SSDD, as shown in Table 3. It can be seen that the AP of the proposed method is 98.4%, which is 6.4%, 4.5%, 2.1%, 1.9%, 2.8% higher than SSD, Faster RCNN, RetinaNet, RepPoints, and FoveaBox, respectively. Although the FPS of R-FCOS is only 19.2, it is acceptable. In order to visually demonstrate the ship detection performance of the proposed method, some detection examples are given in Figure 10. It can be seen that the proposed method can accurately detect all ships.

5. Conclusions

In this paper, an improved anchor-free detector based on FCOS + ATSS is proposed for ship detection. We redesigned FCOS + ATSS with the aim to address the issues of the complex surroundings, scattering interference, and diversity of the scales. The IRM and Dconv were embedded into FEN to improve the feature representation ability. The joint representation of classification score and localization quality was used to address the inconsistency of classification and localization. The bounding box regression method was redesigned to improve object positioning performance. The experimental results on HRSID show that the proposed method achieves a competitive detection performance in comparison with SSD, Faster RCNN, RetinaNet, RepPoints, and FoveaBox. In addition, we verify the model migration ability of the proposed method on SSDD. However, it also needs to be noted that, although the proposed method has better detection accuracy, its detection speed is not the fastest, which requires further analysis and research. Therefore, lightweight networks are the focus of our future work.

Author Contributions

Conceptualization, M.Z. and G.H.; methodology, M.Z.; software, M.Z.; validation, M.Z., S.L., H.Z., S.W. and Z.F.; formal analysis, M.Z.; investigation, M.Z.; resources, M.Z.; data curation, M.Z.; writing—original draft preparation, M.Z.; writing—review and editing, M.Z.; visualization, M.Z.; supervision, M.Z.; project administration, G.H.; funding acquisition, S.W. All authors have read and agreed to the published version of the manuscript.

Funding

This research was funded by the Natural Science Foundation Research Project of Shaanxi Province, China, under Grant 2020JM-345.

Institutional Review Board Statement

Not applicable.

Informed Consent Statement

Not applicable.

Conflicts of Interest

The authors declare no conflict of interest.

References

  1. Yang, F.; Xu, Q.; Li, B. Ship Detection From Optical Satellite Images Based on Saliency Segmentation and Structure-LBP Feature. IEEE Geosci. Remote Sens. Lett. 2017, 14, 602–606. [Google Scholar] [CrossRef]
  2. Song, S.; Xu, B.; Yang, J. SAR Target Recognition via Supervised Discriminative Dictionary Learning and Sparse Representation of the SAR-HOG Feature. Remote Sens. 2016, 8, 683. [Google Scholar] [CrossRef] [Green Version]
  3. Li, T.; Liu, Z.; Xie, R.; Ran, L. An Improved Superpixel-Level CFAR Detection Method for Ship Targets in High-Resolution SAR Images. IEEE J. Sel. Top. Appl. Earth Observ. Remote Sens. 2018, 11, 184–194. [Google Scholar] [CrossRef]
  4. Salembier, P.; Liesegang, S.; Lopez-Martinez, C. Ship Detection in SAR Images Based on Maxtree Representation and Graph Signal Processing. IEEE Trans. Geosci. Remote Sens. 2019, 57, 2709–2724. [Google Scholar] [CrossRef] [Green Version]
  5. Lin, H.; Chen, H.; Jin, K.; Zeng, L.; Yang, J. Ship Detection With Superpixel-Level Fisher Vector in High-Resolution SAR Images. IEEE Geosci. Remote Sens. Lett. 2020, 17, 247–251. [Google Scholar] [CrossRef]
  6. Wang, X.; Li, G.; Zhang, X.-P.; He, Y. Ship Detection in SAR Images via Local Contrast of Fisher Vectors. IEEE Trans. Geosci. Remote Sens. 2020, 58, 6467–6479. [Google Scholar] [CrossRef]
  7. Pappas, O.; Achim, A.; Bull, D. Superpixel-Level CFAR Detectors for Ship Detection in SAR Imagery. IEEE Geosci. Remote Sens. Lett. 2018, 15, 1397–1401. [Google Scholar] [CrossRef] [Green Version]
  8. Wang, S.; Wang, M.; Yang, S.; Jiao, L. New Hierarchical Saliency Filtering for Fast Ship Detection in High-Resolution SAR Images. IEEE Trans. Geosci. Remote Sens. 2017, 55, 351–362. [Google Scholar] [CrossRef]
  9. He, J.; Wang, Y.; Liu, H.; Wang, N.; Wang, J. A Novel Automatic PolSAR Ship Detection Method Based on Superpixel-Level Local Information Measurement. IEEE Geosci. Remote Sens. Lett. 2018, 15, 384–388. [Google Scholar] [CrossRef]
  10. Suganthi, S.T.; Vinayagam, A.; Veerasamy, V.; Deepa, A.; Abouhawwash, M.; Thirumeni, M. Detection and classification of multiple power quality disturbances in Microgrid network using probabilistic based intelligent classifier. Sustain. Energy Technol. Assess. 2021, 47, 101470. [Google Scholar] [CrossRef]
  11. Abouhawwash, M.; Alessio, A.M. Multi-Objective Evolutionary Algorithm for PET Image Reconstruction: Concept. IEEE Trans. Med. Imaging 2021, 40, 2142–2151. [Google Scholar] [CrossRef] [PubMed]
  12. Ren, S.; He, K.; Girshick, R.; Sun, J. Faster R-CNN: Towards Real-Time Object Detection with Region Proposal Networks. IEEE Trans. Pattern Anal. Mach. Intell. 2017, 39, 1137–1149. [Google Scholar] [CrossRef] [PubMed] [Green Version]
  13. Redmon, J.; Divvala, S.; Girshick, R.; Farhadi, A. You Only Look Once: Unified, Real-Time Object Detection. In Proceedings of the 2016 IEEE Conference on Computer Vision and Pattern Recognition (CVPR), Las Vegas, NV, USA, 26 June–1 July 2016; pp. 779–788. [Google Scholar]
  14. Liu, W.; Anguelov, D.; Erhan, D.; Szegedy, C.; Reed, S.; Fu, C.; Berg, A.C. SSD: Single Shot MultiBox Detector. In Proceedings of the European Conference on Computer Vision, Amsterdam, The Netherlands, 8–16 October 2016; pp. 21–37. [Google Scholar]
  15. Lin, T.Y.; Goyal, P.; Girshick, R.; He, K.; Dollar, P. Focal Loss for Dense Object Detection. IEEE Trans. Pattern Anal. Mach. Intell. 2020, 42, 318–327. [Google Scholar] [CrossRef] [PubMed] [Green Version]
  16. Wang, Y.; Wang, C.; Zhang, H.; Dong, Y.; Wei, S. A SAR Dataset of Ship Detection for Deep Learning under Complex Backgrounds. Remote Sens. 2019, 11, 765. [Google Scholar] [CrossRef] [Green Version]
  17. Song, J.; Kim, D.-j.; Kang, K.-m. Automated Procurement of Training Data for Machine Learning Algorithm on Ship Detection Using AIS Information. Remote Sens. 2020, 12, 1443. [Google Scholar] [CrossRef]
  18. Wei, S.; Zeng, X.; Qu, Q.; Wang, M.; Su, H.; Shi, J. HRSID: A High-Resolution SAR Images Dataset for Ship Detection and Instance Segmentation. IEEE Access 2020, 8, 120234–120254. [Google Scholar] [CrossRef]
  19. Zhang, T.; Zhang, X.; Ke, X.; Zhan, X.; Shi, J.; Wei, S.; Pan, D.; Li, J.; Su, H.; Zhou, Y.; et al. LS-SSDD-v1.0: A Deep Learning Dataset Dedicated to Small Ship Detection from Large-Scale Sentinel-1 SAR Images. Remote Sens. 2020, 12, 2997. [Google Scholar] [CrossRef]
  20. Li, J.; Qu, C.; Shao, J. Ship detection in SAR images based on an improved faster R-CNN. In Proceedings of the 2017 SAR in Big Data Era: Models, Methods and Applications (BIGSARDATA), Beijing, China, 13–14 November 2017; pp. 1–6. [Google Scholar]
  21. Cui, Z.; Li, Q.; Cao, Z.; Liu, N. Dense Attention Pyramid Networks for Multi-Scale Ship Detection in SAR Images. IEEE Trans. Geosci. Remote Sens. 2019, 57, 8983–8997. [Google Scholar] [CrossRef]
  22. Zhao, Y.; Zhao, L.; Xiong, B.; Kuang, G. Attention Receptive Pyramid Network for Ship Detection in SAR Images. IEEE J. Sel. Top. Appl. Earth Observ. Remote Sens. 2020, 13, 2738–2756. [Google Scholar] [CrossRef]
  23. Hong, Z.; Yang, T.; Tong, X.; Zhang, Y.; Jiang, S.; Zhou, R.; Han, Y.; Wang, J.; Yang, S.; Liu, S. Multi-Scale Ship Detection From SAR and Optical Imagery Via A More Accurate YOLOv3. IEEE J. Sel. Top. Appl. Earth Observ. Remote Sens. 2021, 14, 6083–6101. [Google Scholar] [CrossRef]
  24. Chen, C.; He, C.; Hu, C.; Pei, H.; Jiao, L. MSARN: A Deep Neural Network Based on an Adaptive Recalibration Mechanism for Multiscale and Arbitrary-Oriented SAR Ship Detection. IEEE Access 2019, 7, 159262–159283. [Google Scholar] [CrossRef]
  25. Jin, K.; Chen, Y.; Xu, B.; Yin, J.; Wang, X.; Yang, J. A Patch-to-Pixel Convolutional Neural Network for Small Ship Detection With PolSAR Images. IEEE Trans. Geosci. Remote Sens. 2020, 58, 6623–6638. [Google Scholar] [CrossRef]
  26. Guo, H.; Yang, X.; Wang, N.; Gao, X. A CenterNet++ model for ship detection in SAR images. Pattern Recognit. 2021, 112, 107787. [Google Scholar] [CrossRef]
  27. Zhang, T.; Zhang, X. High-Speed Ship Detection in SAR Images Based on a Grid Convolutional Neural Network. Remote Sens. 2019, 11, 1206. [Google Scholar] [CrossRef] [Green Version]
  28. Li, Y.; Zhang, S.; Wang, W.-Q. A Lightweight Faster R-CNN for Ship Detection in SAR Images. IEEE Geosci. Remote Sens. Lett. 2020, 19, 1–5. [Google Scholar] [CrossRef]
  29. Deng, Z.; Sun, H.; Zhou, S.; Zhao, J. Learning Deep Ship Detector in SAR Images From Scratch. IEEE Trans. Geosci. Remote Sens. 2019, 57, 4021–4039. [Google Scholar] [CrossRef]
  30. Zhang, K.; Wu, Y.; Wang, J.; Wang, Y.; Wang, Q. Semantic Context-Aware Network for Multiscale Object Detection in Remote Sensing Images. IEEE Geosci. Remote Sens. Lett. 2021, 19, 1–5. [Google Scholar] [CrossRef]
  31. Gao, S.; Liu, J.M.; Miao, Y.H.; He, Z.J. A High-Effective Implementation of Ship Detector for SAR Images. IEEE Geosci. Remote Sens. Lett. 2021, 19, 1–5. [Google Scholar] [CrossRef]
  32. Yang, Z.; Liu, S.; Hu, H.; Wang, L.; Lin, S. RepPoints: Point Set Representation for Object Detection. In Proceedings of the 2019 IEEE/CVF International Conference on Computer Vision (ICCV), Seoul, Korea, 29 October–1 November 2019; pp. 9656–9665. [Google Scholar]
  33. Law, H.; Deng, J. Cornernet: Detecting objects as paired keypoints. In Proceedings of the European Conference on Computer Vision (ECCV), Munich, Germany, 8–14 September 2018; pp. 734–750. [Google Scholar]
  34. Zhou, X.; Wang, D.; Krahenbuhl, P. Objects as Points. arXiv 2019, arXiv:1904.07850. [Google Scholar]
  35. Zhang, S.; Chi, C.; Yao, Y.; Lei, Z.; Li, S.Z. Bridging the Gap Between Anchor-Based and Anchor-Free Detection via Adaptive Training Sample Selection. In Proceedings of the 2020 IEEE/CVF Conference on Computer Vision and Pattern Recognition (CVPR), ATSS, Seattle, WA, USA, 13–19 June 2020; pp. 9756–9765. [Google Scholar]
  36. Tian, Z.; Shen, C.; Chen, H.; He, T. FCOS: A Simple and Strong Anchor-free Object Detector. IEEE Trans. Pattern Anal. Mach. Intell. 2020, 44, 1922–1933. [Google Scholar] [CrossRef]
  37. Kong, T.; Sun, F.; Liu, H.; Jiang, Y.; Li, L.; Shi, J. FoveaBox: Beyound Anchor-Based Object Detection. IEEE Trans. Image Process. 2020, 29, 7389–7398. [Google Scholar] [CrossRef]
  38. Zhu, C.; He, Y.; Savvides, M. Feature Selective Anchor-Free Module for Single-Shot Object Detection. In Proceedings of the 2019 IEEE/CVF Conference on Computer Vision and Pattern Recognition (CVPR), Long Beach, CA, USA, 15–19 June 2019; pp. 840–849. [Google Scholar]
  39. Cui, Z.; Wang, X.; Liu, N.; Cao, Z.; Yang, J. Ship Detection in Large-Scale SAR Images Via Spatial Shuffle-Group Enhance Attention. IEEE Trans. Geosci. Remote Sens. 2021, 59, 379–391. [Google Scholar] [CrossRef]
  40. Fu, J.; Sun, X.; Wang, Z.; Fu, K. An Anchor-Free Method Based on Feature Balancing and Refinement Network for Multiscale Ship Detection in SAR Images. IEEE Trans. Geosci. Remote Sens. 2021, 59, 1331–1344. [Google Scholar] [CrossRef]
  41. Sun, Z.; Dai, M.; Leng, X.; Lei, Y.; Xiong, B.; Ji, K.; Kuang, G. An Anchor-Free Detection Method for Ship Targets in High-Resolution SAR Images. IEEE J. Sel. Top. Appl. Earth Observ. Remote Sens. 2021, 14, 7799–7816. [Google Scholar] [CrossRef]
  42. Rezatofighi, H.; Tsoi, N.; Gwak, J.; Sadeghian, A.; Reid, I.; Savarese, S. Generalized Intersection Over Union: A Metric and a Loss for Bounding Box Regression. In Proceedings of the 2019 IEEE/CVF Conference on Computer Vision and Pattern Recognition (CVPR), 2019 IEEE/CVF Conference on Computer Vision and Pattern Recognition (CVPR), Long Beach, CA, USA, 15–20 June 2019; pp. 658–666. [Google Scholar]
  43. Zhu, X.; Hu, H.; Lin, S.; Dai, J. Deformable ConvNets V2: More Deformable, Better Results. In Proceedings of the 2019 IEEE/CVF Conference on Computer Vision and Pattern Recognition (CVPR), Long Beach, CA, USA, 15–20 June 2019; pp. 9300–9308. [Google Scholar]
Figure 1. Architecture of the FCOS network. H × W denotes the height and width of feature maps. C denotes the number of classes, and ‘/s’ denotes the down-sampling ratio of the feature maps at the level to the input image. As an example, all the numbers are computed with an 800 × 1024 input.
Remotesensing 14 02034 g001
Figure 2. Detection results of FCOS + ATSS on HRSID. The green rectangles and red rectangles are the ground truth and detection results, respectively.
Remotesensing 14 02034 g002
Figure 3. The overall flowchart of the proposed method.
Remotesensing 14 02034 g003
Figure 4. Schematic diagram of different modules. (a) The original residual module. (b) IRM. (c) IRM + Dconv. Notations in bold text highlight the reformulation changes. A layer is denoted as in channels, filter size, and out channels. ‘-d’ denotes the dimensionality of the feature map.
Remotesensing 14 02034 g004
Figure 5. Schematic diagram of different detection heads. (a) FCOS + ATSS. (b) The proposed method.
Remotesensing 14 02034 g005
Figure 6. Some samples and shape distributions of HRSID. (a) Some samples. (b) Shape distributions.
Remotesensing 14 02034 g006
Figure 7. Comparison results of FCOS + ATSS and the proposed method on HRSID. The green rectangles indicate the ground-truth, and the red rectangles indicate the detection results.
Remotesensing 14 02034 g007
Figure 8. Comparison of the results of different methods on HRSID. The green rectangles indicate the ground-truth, and the red rectangles indicate the detection results.
Remotesensing 14 02034 g008
Figure 9. The detection results on the validation set. (a) AP. (b) AP50.
Remotesensing 14 02034 g009
Figure 10. Visual results of the proposed method on SSDD. The green rectangles indicate the ground-truth, and the red rectangles indicate the detection results.
Remotesensing 14 02034 g010
Table 1. The detection results of ablation studies.
MethodAP (%)AP50 (%)FPS
baseline60.285.173.9
baseline + S165.088.861.0
baseline + S265.788.473.7
baseline + S1 + S2 (Ours)68.589.860.8
Table 2. The evaluation metrics of different methods on HRSID.
MethodAP (%)AP50 (%)FPS
SSD47.074.4101.4
Faster RCNN53.776.723.3
RetinaNet58.283.068.8
RepPoints57.485.566.9
FoveaBox58.582.667.8
Ours68.589.860.8
Table 3. The evaluation metrics of different methods on SSDD.
MethodAP (%)FPS
SSD92.021.4
Faster RCNN93.912.6
RetinaNet96.320.3
RepPoints96.519.7
FoveaBox95.620.0
Ours98.419.2
Publisher’s Note: MDPI stays neutral with regard to jurisdictional claims in published maps and institutional affiliations.

