Article

Sustainable Development of Life Service Resources: A New Framework Based on GIScience and Spatial Justice

1
School of Public Administration and Policy, Renmin University of China, Beijing 100872, China
2
China Institute for Urban Governance, Shanghai Jiao Tong University, Shanghai 200030, China
3
School of International and Public Affairs, Shanghai Jiao Tong University, Shanghai 200030, China
*
Author to whom correspondence should be addressed.
Remote Sens. 2022, 14(9), 2031; https://doi.org/10.3390/rs14092031
Submission received: 8 March 2022 / Revised: 21 April 2022 / Accepted: 21 April 2022 / Published: 23 April 2022

Abstract

:
The sustainable development goals (SDGs) reflect the pursuit of achieving spatial justice. Both SDG 1.4 and SDG 11.1 reflect a concern for urban services. Life service resources, which are the new concept proposed by the Chinese government, also call for sustainable development path. However, few studies have focused on the realization of spatial justice in life service resources. This paper proposes a two-level, four-step analysis framework composed of quantity, structure, pattern, and coupling coordination to perceive the spatial justice of life service resources. Based on remote sensing technology and geographic information science, this paper acquires and analyses multi-source data including population density, building outlines, point of interests, subway lines, etc. Furthermore, the case study in downtown Beijing found the following: (1) The total life service resources are extensive and varying in type; (2) regional differences are evident and low-level equilibrium and high-level priority development coexist; (3) life service resources are concentrated in contiguous and multi-centre clusters with a greater north–south than east–west difference; (4) the overall level of life service resources is low, specifically for “high in the centre and low in the periphery” and “high in the east and low in the west”. Future management should consider narrowing the development gap and formulating industry development plans to improve spatial justice. Finally, the comparison between Beijing and London and more cities in the future needs to consider the urban development stage, population density, and other aspects.

1. Introduction

The 2030 Agenda for Sustainable Development proposes 169 sustainable development goals (SDGs) and a new model of “people, planet, prosperity, peace, and partnership” placing humanism at the core of sustainable development [1]. Specifically, SDG 1.4 states, “By 2030, ensure that all men and women, in particular the poor and the vulnerable, have equal rights to economic resources, as well as access to basic services”. SDG 11.1 presents, “By 2030, ensure access for all to adequate, safe and affordable housing and basic services and upgrade slums”. These SDGs clearly point to a common issue, namely, that of urban services. In 2018, the World Urbanization Prospects indicated that, by 2050, the global urban population would increase by another 2.5 billion, and the urbanisation rate would increase to 68% [2]. This means that the disparity between the demands of the urban population and the supply of service facilities will continue to increase. This disparity is reflected in the supply shortage and the upgrading of service facilities’ types. In other words, with the development of urbanisation, the needs of residents are not limited to traditional public services (e.g., national defence, fire protection, medical treatment, transportation, education) but have grown to the life service resources (LSRs). This is particularly evident in China. In 2010, the output value of China’s life service industry was about CNY 3491.05 billion, accounting for 9% of the gross domestic product (GDP) [3]. This shows that the life service industry has long become a pillar industry in China, and the considerable demand for life service facilities cannot be ignored.
To ensure that everyone can share the benefits of urbanisation, the Chinese government developed the life service industry to establish a basic service system with “extensive coverage, rich business forms, and a reasonable layout”. In 2015, China’s State Council stated that “the improvement of the national income level has expanded the new demand for life service consumption, the continuous breakthrough of information network technology has expanded the new channels of life service consumption, and the implementation of major national strategies such as new urbanisation has expanded the new space for life service consumption. People’s demand for life services is increasing, the demand for service quality is beefing up, and the life service consumption contains huge potential great potential” [4]. In 2016, China’s Ministry of Commerce, in the Thirteenth Five-Year Plan for the Development of Residents’ Life Service Industry, define the different types of LSRs for the first time [5]. In 2019, China’s Ministry of Finance and State Administration of Taxation jointly issued a document that aimed to reduce life service enterprises’ financial burden [6]. In 2021, China’s National Development and Reform Commission presented several opinions on the problems of “insufficient effective supply, insufficient convenience sharing, and inadequate implementation of policies” for LSRs [7]. These policies demonstrate China’s increasing attentiveness to the fair allocation of LSRs.
Existing literature shows that LSRs can impact people’s daily lives in three dimensions: quantity, structure, and pattern. First, in terms of quantity, insufficient LSRs decrease residents’ satisfaction and social welfare [8,9]. From the viewpoint that everyone should meet specific living standards [10], it is unfair that some people do not have access to the resources necessary to achieve this goal [11]. Second, from the structure dimension, low-quality LSRs (e.g., fast-food restaurants, tobacco, alcohol, and gambling outlets) tend to be more prevalent in communities with a low socio-economic status [12,13,14], resulting in higher obesity, disease, mortality, and crime rates [15,16]. However, gentrified communities have more influence and resources for keeping low-quality LSRs out of their areas than socio-economically disadvantaged communities [12], which may exacerbate social spatial isolation [17]. Third, from the perspective of patterns, the uneven spatial distribution of LSRs is reflected in a concentration of areas with large passenger flow, strong road centrality, and traffic accessibility [18,19,20] and has become a common problem faced by many cities [9,21]. This not only hinders residents from enjoying life services conveniently [22], intensifying the spatial deprivation of poor communities and marginal groups [17], but it also inhibits the healthy development of the urban economy [23]. Fortunately, some studies have found several important factors affecting the spatial distribution of LSRs, such as urban planning [12], racism [24], consumption level [25], etc.
Although past studies have focused on characteristics of LSRs in different dimensions [25,26], few have integrated these scattered aspects. More importantly, there is a lack of a “people-oriented” theoretical basis in the existing studies. Therefore, the optimized configuration of LSRs failed to return to the goal of meeting human needs in time. Spatial justice (SJ) theory emphasizes the balanced distribution and equal access to public goods or services [27,28] and advocates that human beings should have equal access to various social resources in space [29,30]. We note that this theory seems to be no longer limited to managing basic public service facilities but has gradually extended to some fields initially configured only by the market mechanism, such as energy utilization [31,32]. The Chinese government has only recently proposed LSRs, which have the characteristics of high daily use frequency and low use price. This indicates that LSRs may be generated with the goal of making profits; however, in the long run, due to its social resource nature, government intervention (especially for socialist countries such as China) and the improvement in people’s demand level (after meeting basic public services, people hope to improve the quality of life), the realistic situation and realisation path of LSRs’ SJ should also be studied in depth.
It is worth noting that the research on SJ is showing a quantitative trend. Usually, scholars link urban facilities, population, income, and other socioeconomic factors for analysis. There are three representative approaches. The first is to design new indices. For example, residents living in the suburbs are forced to incur more commuting costs than those living in the downtown area. This further leads to differences in affordability for residents, thereby exacerbating spatial injustice. Thus, some scholars have designed a new index named H+T, which is the ratio of living costs (housing costs, transportation costs) to income [33]. The second is to identify key factors. Some scholars have used lots of methods (literature analysis, group discussions, expert interviews, and questionnaires) to determine the relevant factors that affect the SJ of public open space. Then, they determine the importance levels of SJ influencing factors by Exploratory Factor Analysis (EFA) and Fuzzy Synthetic Evaluation (FSE) methods [34]. The third is to construct complex models to analyse the drivers of SJ. For instance, one study has assessed the differential impact of various factors on SJ through Random Forest and SHAP Tree Explainer. It shows that Mean Commute Time can enhance SJ, while Medical Facilities Count and Food Desert Count will reduce SJ [35]. In another study, it is revealed by using structural equation modelling (SEM) that the upward mobility of compact regions is significantly higher than that of sprawling areas [36]. Consistent with the above-mentioned research, this paper aims to quantify SJ. However, due to the particularity of the research object (LSR is a new concept recently proposed by the Chinese government, and it is difficult to find the alternative data), the paper explores the SJ of LSR from the “distribution perspective”; that is, residents in different regions can share the same or similar LSRs. As an exploratory study, we look forward to obtaining more data for in-depth analysis in the future.
To sum up, this paper addresses the following three questions: (1) Why should SJ be considered when studying LSRs? (2) How should SJ be applied and interpreted for LSRs? Finally, (3) what strategies should the government use to optimise the allocation of LSRs? This paper will include a discussion of the specific characteristics of LSRs, explain why SJ should be considered, and describe the current status of SJ for LSRs. Furthermore, an SJ evaluation framework will be developed for LSRs that fully integrates the advantages of big data and geographic information systems (GIS) [37,38,39]. Using data from downtown Beijing, China, this paper provides a feasible framework for optimising the allocation of LSRs that can be used as a reference for other regions.
This paper responds to SDG 1.4 and SDG 11.1 proposed by the United Nations and uses a variety of geographic information science methods to analyse the optimal spatial allocation of LSRs in the downtown Beijing. The multi-source data (population density, building outline, points of interest, subway lines, etc.) and geographic information science methods (nearest neighbour, kernel density, standard deviation ellipse) used in this paper reflect the important value of GIScience and remote sensing for the sustainable management of urban services.

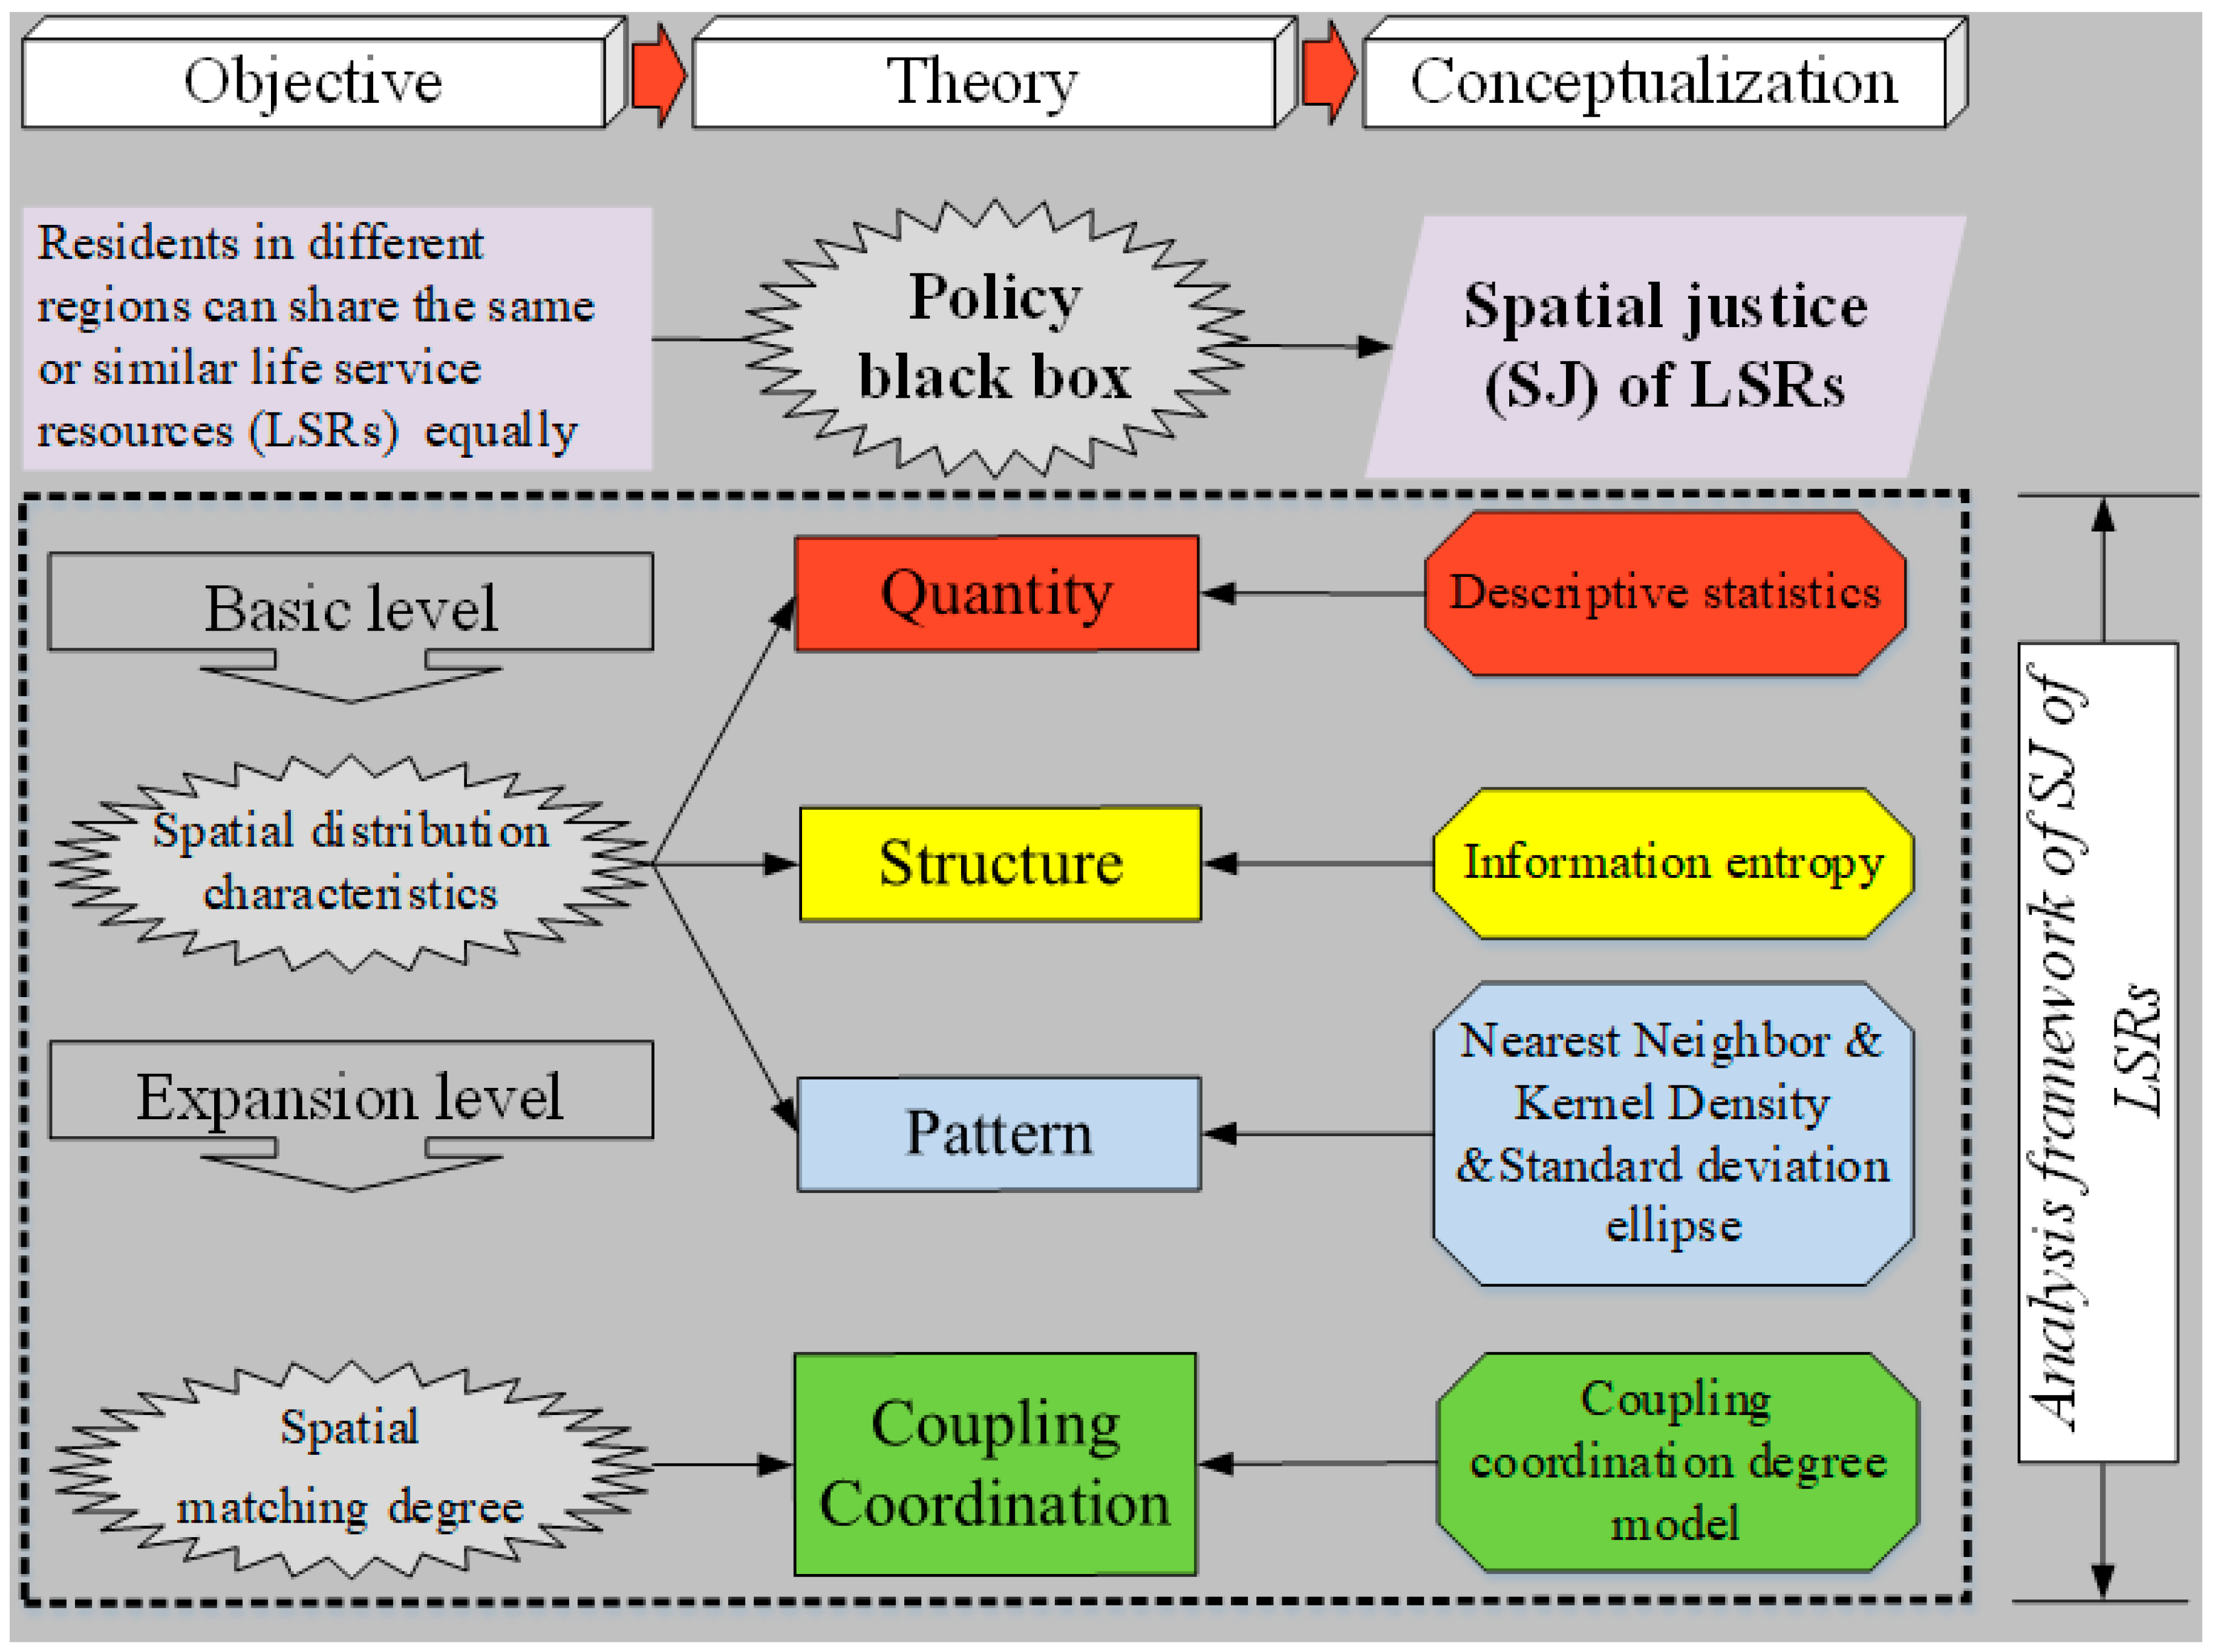
2. Theoretical Analysis Framework

2.1. Why Should SJ Be Considered When Studying LSRs?

LSRs refer to various service activities and services provided to meet the daily needs of residents and are closely related to living consumption. In 2016, China’s Ministry of Commerce divided LSRs into eight categories: (1) catering, (2) accommodation, (3) housekeeping, (4) dyeing, (5) bathing, (6) beauty salons, (7) appliance repairs, and (8) portrait photography [5]. SJ theory was first used to describe the inequity caused by insufficient public services in the 1960s [40]. Since then, many scholars have improved this theory. Henri Lefebvre criticises the opinion that “space is container and field” while advocating that social space is a product of society [41]. David Harvey proposes the concept of “territory redistribution justice”—the fair, just geographical distribution of social resources [42]. To condemn space deprivation and exclusion, Edward Soja encourages marginalised groups to fight for urban rights [43]. At present, SJ is generally regarded as social equity and justice regarding space rights and the interests of citizens in the urban field. Specifically, urban residents have the right to equal participation in all urban space production processes and all kinds of social life; all residents enjoy the benefits provided by urban life (especially high-quality urban centres); various forms of spatial isolation and restriction should be prevented; spatial marginalisation of vulnerable groups should be avoided; and the cultural discrimination and repression of space should be eliminated.
From the perspective of demand, LSRs should be configured based on SJ because the balanced allocation of LSRs is in line with the goal of SJ. LSRs are closely related to people’s daily lives and are frequently used service facilities. Abraham Maslow’s Hierarchy of Needs divides human needs into five levels from bottom to top: physiological, safety/security, love/belonging, esteem, and self-actualization [44]. Examining SJ and LSRs from the level of physiological needs, if a person is hungry and needs to eat, they will often turn to what is readily available (e.g., fast food restaurants, dessert shops, pastry shops). Furthermore, from the level of safety/security, when people are faced with problems, such as pipeline blockage or electrical damage, they need to obtain services, such as professional home appliance maintenance services, which may be determined by the proximity to their location. Therefore, meeting these types of needs are inseparable from the placement of LSRs. This also aligns with SJ’s goals, such as enabling them to enjoy the benefits brought by urban life, especially in high-quality urban centres [30]. In addition, SJ should be considered when establishing LSRs targeting the multilevel needs of residents, as the spatial injustice of LSRs will affect the total demand and long-term demand for these services. Compared to services such as the national defence and police and fire control, people use LSRs more frequently. Regardless of which LSRs are lacking, residents’ happiness and social stability will decrease. The differential production of LSRs by capital will eventually result in spatial plunder or spatial injustice of LSRs, such as spatial isolation, right occupation, or the social reconstruction of vulnerable groups, which leads to the decline of cities [42].
From the supply perspective, SJ theory can inform the sustainable supply of LSRs. The used price of LSRs is low so that most people can enjoy life services, including catering, accommodation, beauty salons, etc. This is in line with the SJ principle of “universal benefit”. However, maintaining this principle is challenging. Based on the current situation in China, the main suppliers of LSRs are individuals and enterprises, who are most often interested in making a profit. Obviously, relying solely on the market mechanism is prone to uneven space supply of LSRs. This supply issue further restricts people’s space rights. Hence, in addition to the market, we also need SJ theory to inform the reconstruction of spaces with diversity and diversification as the core [45].
From the perspective of SJ theory, life services can be regarded as a unique spatial production. In the process of practice, life services produce not only natural spaces (e.g., restaurants, hotels, and dry cleaners) but also social spaces generated by activities (e.g., guided use and after-sales service). In short, the space shaped by life services is based on the unity of natural space and social space. The problems exposed in life services, such as unreasonable service radius and lack of service items, involve natural space and social space. The SJ theory provides an “internal basis of legitimacy and rationality” and “effective value norms” for the balanced allocation of LSRs [30].

2.2. How Should SJ Be Applied and Interpreted for LSRs?

The existing SJ analysis framework is mainly measured from three dimensions: (1) quantity, (2) structure, and (3) pattern. These dimensions allow us to understand the SJ of service facilities, but some shortcomings still exist. These include a lack of systematic perspective, which is not conducive to the formation of a complete understanding of service facilities; insufficient research content where most of the existing studies have focused on descriptive analyses of service facilities but failed to further correlate with the needs of residents; and a limited effective evaluation strategies with most of the existing studies using ethnography, investigation, and interview to evaluate SJ, which require high time and cost resources [46].
To bridge the above gaps, this paper proposes a two-level, four-step analysis framework (Figure 1). The framework is used to achieve the distribution justice of LSRs; that is, residents in different regions can share the same or similar LSRs. The applicability of this framework will be described in detail below.
First, the basic level consists of three dimensions: quantity, structure, and pattern. Quantity refers to the number of LSRs, where the total amount of service facilities in a region determines the overall level of residents’ enjoyment of services. If the number of service facilities is insufficient, residents will not be able to make full use of service facilities, further resulting in a sense of injustice. This quantitative difference is a crucial reason for the difference in justice between the rich and the poor [47]. Structure refers to the configuration of different LSRs, where different service facilities have their own characteristics and can meet the diverse needs of residents. A balanced service facility structure can meet the diversified needs of residents. If the structure of LSRs is unreasonable, the multilevel needs of residents cannot be met simultaneously, which will create negative emotions. Hence, emphasising a balanced combination of different service facilities has become an essential trend in modern urban management [48]. Pattern refers to the spatial distribution pattern of LSRs, which affects residents’ access to services. If certain types of service facilities are concentrated in one area, it is difficult for residents in other areas to conveniently use such facilities. This violates the just principle that residents in different regions should enjoy services equally [49]. The above three dimensions combine quantitative statistical analysis (descriptive statistics, information entropy) and spatial analysis methods (nearest neighbour, kernel density, standard deviation ellipse).
Second, the expansion level aims to assess the degree of spatial matching between the LSRs and population distribution. Previous studies generally believe that the lack of resources or uneven spatial distribution is an injustice phenomenon [40]. This simple understanding is easy to accept but difficult to verify. The analysis based on “quantity, structure, and pattern” provides credible evidence to evaluate SJ, but it needs further development. In other words, it cannot be taken for granted that every resident is satisfied simply because there are a large number of LSRs. Therefore, LSRs should be associated with population demand and assessed by their coordinating degrees in space. Using this type of “coupling coordination”, we can identify the matching degree between each LSRs type and the local population simultaneously. Urban managers can use the above results to guide the spatial allocation of LSRs.
This new analysis framework integrates the steps of “quantity, structure, and pattern” and directly connects LSRs with population demand. There is currently no formal method for evaluating the SJ of LSRs in China; however, the combination of GIS data and spatial analysis can be called a strict and comprehensive method [50].

3. Data and Methods

This section may be divided by subheadings. It should provide a concise and precise description of the experimental results, their interpretation, as well as the experimental conclusions that can be drawn.

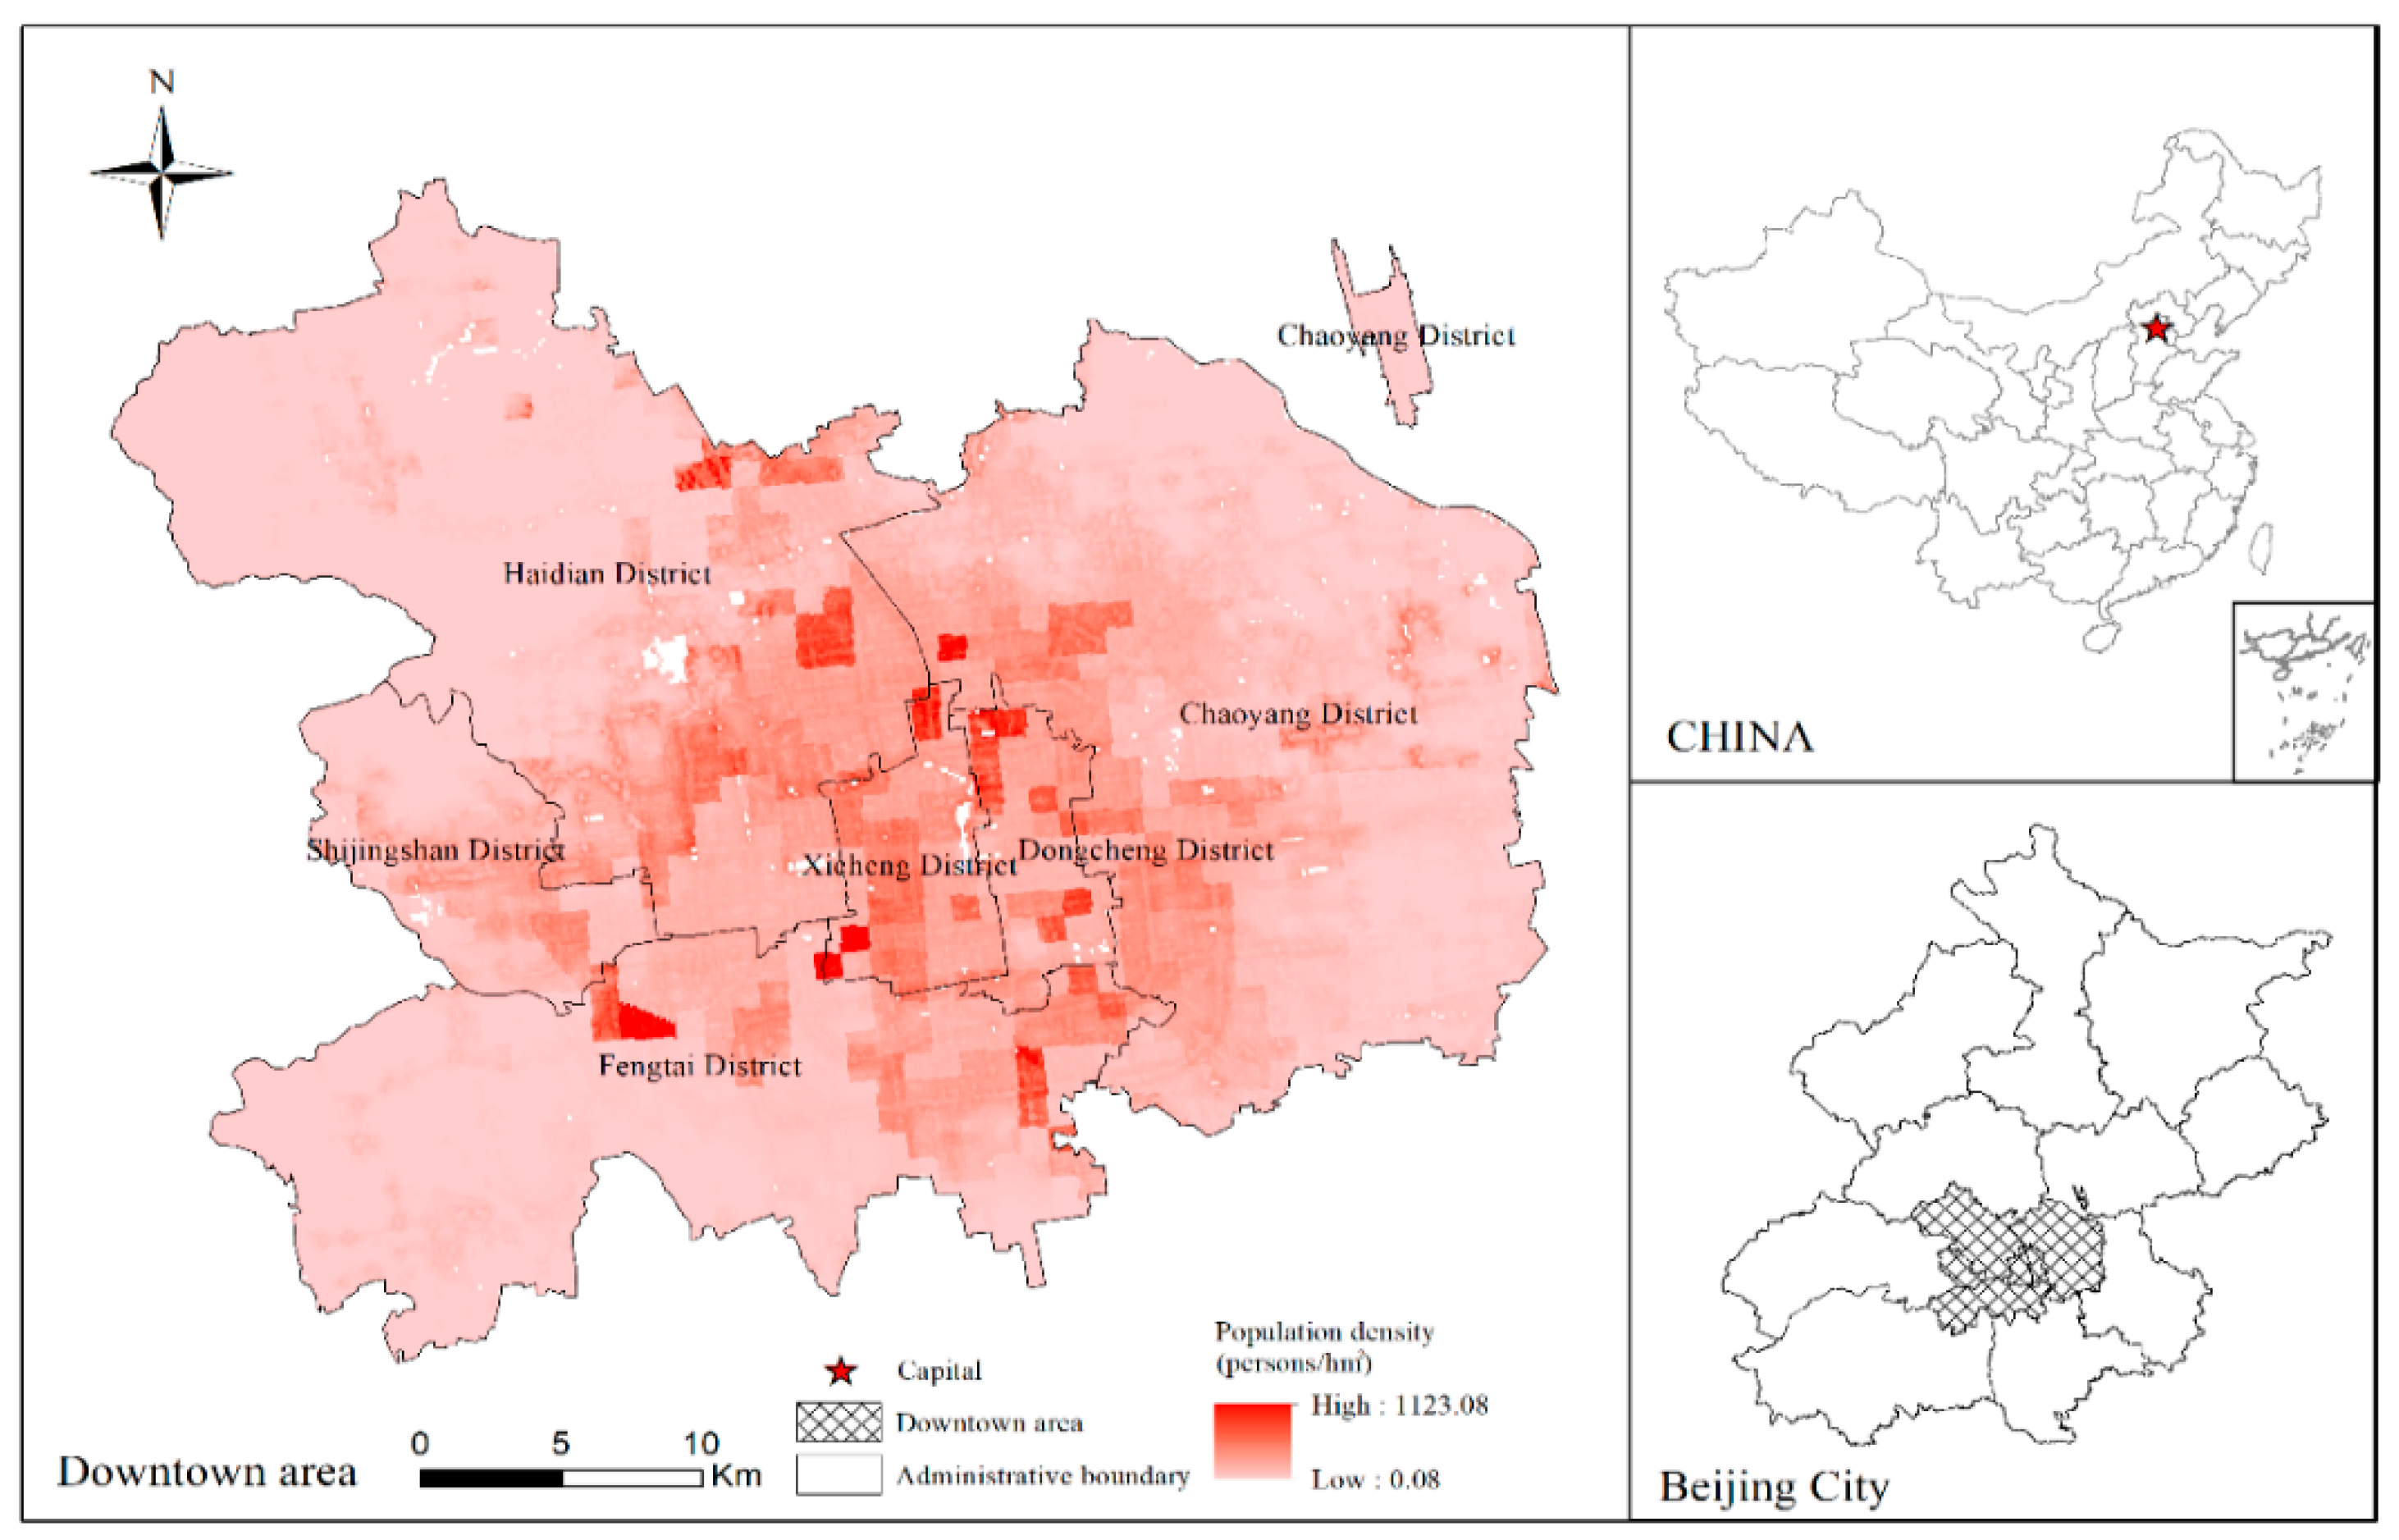
3.1. Area Description

Beijing is the centre of China’s political, cultural, and international exchanges and technological innovation. It has experienced significant population growth within a limited area in past decades, creating a massive and diverse demand for LSRs. Therefore, exploring the quantity, structure, pattern, and population matching of Beijing’s LSRs has important practical significance.
Influenced by the city’s transforming functional structure, foreign investment, and migrants, Beijing’s social polarisation and new urban poverty have increased [51]. From 2000 to 2010, Beijing’s industrial structure adjustment and spatial evolution further reconstructed the urban social space [52]. In 2017, the urban sustainable development goals of an “intensive and efficient production space, moderate living space, and beautiful ecological space” were proposed. Downtown Beijing was chosen as the current study area for three reasons. First, the economy is strong. In 2018, the GDP here accounted for more than 70% of the city’s GDP. Second, the concentrated population is large. In 2018, the permanent population here accounted for about 55% of the city. Third, there is variability in the supply and demand of LSRs. The living needs of different groups of people are intertwined. According to the Beijing City Master Plan (2016–2035), the downtown area includes the Dongcheng, Xicheng, Chaoyang, Haidian, Fengtai, and Shijingshan districts (Figure 2).

3.2. Research Methods

3.2.1. Descriptive Statistics

We used descriptive statistics to find the quantity of various LSRs. The LSRs data obtained are counted, and their proportion is calculated.

3.2.2. Information Entropy

This paper calculates balance and dominance based on previous studies [53]. First, we use Shannon’s information entropy Equation to define the information entropy of the LSRs as:
H = i N P i l n P i = i = 1 N A i / i N A i l n A i / i N A i ,
In Equation (1), A is the total number of point of interests (POIs) of LSRs in an area. LSRs in this area are divided into N types, and the number of POIs of each type is Ai (i = 1, 2, …, N). Pi is the percentage of the number of POIs per service type (equivalent to the probability of occurrence of this type of service), and the value is normalised. H is the information entropy of the residents’ life service system, reflecting the balance of the types of LSRs within the region. A higher entropy value means more abundant types of LSRs. Notably, when the number of POIs for each type is entirely equal, the occurrence probability for each type is equivalent to 1/N, and the maximum information entropy is Hm = lnN.
Second, the ratio between the measured value and the maximum value of information entropy can be regarded as the equilibrium degree of the life service structure:
J = H / H m = i P i l n P i / l n N ,
In Equation (2), J is the equilibrium degree, and the value location is (0, 1). The remaining parameters are the same as in Equation (1). The closer the J value is to 1, the life service structure of LSRs moves closer to being balanced.
Finally, the concept of dominance is introduced to assess the concentration level of the life service structure:
I = 1 J ,
In Equation (3), I is the dominance, and the value location is (0, 1). A value closer to 1 indicates that there is one or more dominant type(s) of life service(s) in the area.

3.2.3. Spatial Analysis Method

First, we investigate the spatial concentration of LSRs. The average nearest neighbour index is calculated by ArcGIS 10.1. It compares the average observation distance of a particular type of POI with the expected average distance based on a random distribution to determine the aggregation or dispersion of features. The Equations are as follows [54].
R = d i / d e = d i / 0.5 / N / A ,
Z = d i d e / 0.26136 / n 2 / A ,
In Equations (4) and (5), di and de are the average observation distance and the expected observation distance, respectively; N is the total number of POIs; A is the area of the research area; R is the nearest neighbour index; Z-score and p-value can determine whether the null hypothesis can be rejected in a statistical sense.
Second, to explore whether LSRs gather, kernel density is used to analyse point density. Plot density and Voronoi diagram density are also commonly used for this purpose; however, they face problems of uniform density in the unit space and abrupt changes in density at the joints of the unit. Kernel density analysis comprehensively considers the difference in focus intensity of different internal points and the continuity of spatial phenomena, so it has more advantages [55]. The Equation is as follows:
f s = i = 1 n 1 h 2 k s c i h ,
In Equation (6), n is the number of points whose distance at the same position s is not greater than h; h is the distance attenuation threshold; k is the spatial weight function; and f(s) is the kernel density estimate at position s. The above Equations describes the interaction between the kernel density value, and the radiation distance from the centre point—the distance attenuation effect of the centre point outward. Studies have shown that the spatial weight function has a limited impact on the point mode and, more importantly, on determining a suitable search radius (distance attenuation threshold) [56].
This paper uses 1500 m as the search radius for two reasons. One is the research experience of other cities in China. In the case of the central Chongqing city, the search radius is 1500 m. This case confirmed that 1500 m can not only identify small-scale POI aggregation areas, but also reflect the macro-scale polycentric pattern, and has a good smoothing effect [57]. The other is the scope of downtown Beijing. Based on the scope, ArcGIS software can automatically calculate the default search radius. For downtown Beijing, the default radius is roughly 1516 m. To facilitate comparison, 1516 m is simplified to 1510 m in this study.
Finally, we are interested in the expansion trend of LSRs. In 1926, D. Welty Lefever proposed the standard deviation ellipse analysis method to describe the direction distribution of points with parameters such as centre, azimuth, long axis, and short axis [58]. The centre is the relative position of the space occupied by a factor. The azimuth describes the main direction of development, and the direction, length, and length ratio of the major and minor axes, represent the primary and secondary development trends, the degree of dispersion in these trends, and spatial distribution morphology, respectively [59]. This paper uses the standard deviation ellipse tool of ArcGIS 10.1 to analyse spatial statistics.

3.2.4. Coupling Coordination Degree Model

The coupling coordination degree model can be used to measure the mutual influence between two subsystems (here, the matching effect of LSRs and residents’ needs) [60]. Usually, the population density in the area can be used to express residents’ needs [61]. Therefore, we substitute the kernel density value of the LSRs and the resident population density value into the coupling coordination degree model for calculation (the data are normalised in GIS in advance). Based on previous studies [60], the calculation Equation of coupling coordination degree is as follows:
C = f M × g N / f M + g N / 2 2 ,
D = C × T , T = α f M + β g N ,
where C represents the coupling degree, f (M) is the kernel density value of the LSRs, and g (N) is the resident population density, where T is the comprehensive coordination index, and α and β are the contribution weight of the kernel density value of the LSRs and resident population density, respectively. In this paper, α and β are each 0.5, which is equally important. D stands for the degree of coupling coordination, and the value range of D is (0, 1). A higher D value represents a higher coupling degree between LSRs and residents’ needs. Furthermore, the degree of coupling coordination of LSRs and residents’ needs was divided into five levels (Table 1).

3.3. Data Sources and Processing

We introduce POI data from the following aspects: (1) Information. The POI data obtained from Amap include the type, name, administrative district, longitude, and latitude of LSRs. (2) Source. The POI data come from a big data innovation enterprise under Shanghai Economic and Information Commission (https://www.metrodata.cn/) (accessed on 20 April 2022). (3) Time. We investigate downtown Beijing with data from March 2018. Over time, the number of POIs will change, such as the closure or relocation of some hotels. Objectively speaking, the research results of this paper can only reflect the LSRs in the central urban area of Beijing in March 2018. Therefore, this study has certain limitations. In the future, POI data at more time points will be obtained for tracking analysis. (4) Accuracy. We take two methods to test the accuracy of the data. The first is to compare the data provided by the Resource and Environmental Science and Data Center of the Chinese Academy of Sciences (https://www.resdc.cn/) (accessed on 20 April 2022). The second is to conduct manual random comparison on Baidu Maps. (5) Data processing. We cleaned the data, such as removing duplicate content, correcting coordinates, etc. By doing this, 14 categories of point data were initially obtained.
Combined with government documents, the actual situation in Beijing, and data availability, this paper finally determines 6 types of LSR. Specifically, in 2016, China’s Ministry of Commerce divided LSRs into 8 categories: catering, accommodation, housekeeping, dyeing, bathing, beauty salons, appliance repairs, and portrait photography. However, due to the following reasons, this paper cannot obtain enough POIs to represent housekeeping. This is because the housekeeping service is characterized by door-to-door service, is less dependent on physical stores than other services, the industry is still in the early stages of development, the supply is relatively small, and the profit of the housekeeping industry in downtown Beijing is limited as it is difficult to afford the high housing and rent prices. This paper also excludes bathing services because they are often difficult to separate from accommodation or beauty salon services, and the industry is small. Therefore, we categorize LSRs into 6 groups: catering, accommodation, dyeing (this refers to the business of laundry, dry cleaning, ironing, dyeing, darning, stain removal, etc.), beauty salons, appliance repairs, and portrait photography.
In addition, subway stations, subway lines, and building outlines data were obtained from Amap. The Amap collects data through vehicle, walking, and aerial photogrammetry. The POI, building outlines, and other data used in this paper are inseparable from the help of remote sensing technology. The population density raster data comes from Worldpop’s 2018 prediction of China’s population raster data, with a resolution of 100 m × 100 m (https://www.worldpop.org/) (accessed on 20 April 2022). As the data development team said, “this data is suitable where the accuracy of the satellite-based mapping of settlements is uncertain”. This means that it is very suitable for use in the capital of China (most of the core parts of downtown Beijing belong to the central government office area and military management area, where it is difficult to obtain remote sensing high-resolution data). The administrative boundaries come from the Resource and Environment Data Cloud Platform (http://www.resdc.cn) (accessed on 20 April 2022).

4. Results

4.1. Quantity Dimension

The number of catering facilities is the largest, accounting for more than half of the total facilities in the study area (Table 2). The number of beauty salons and accommodation facilities is second, with 17,239 and 15,677 establishments, respectively. The other three types of LSRs are relatively small, less than 10%.

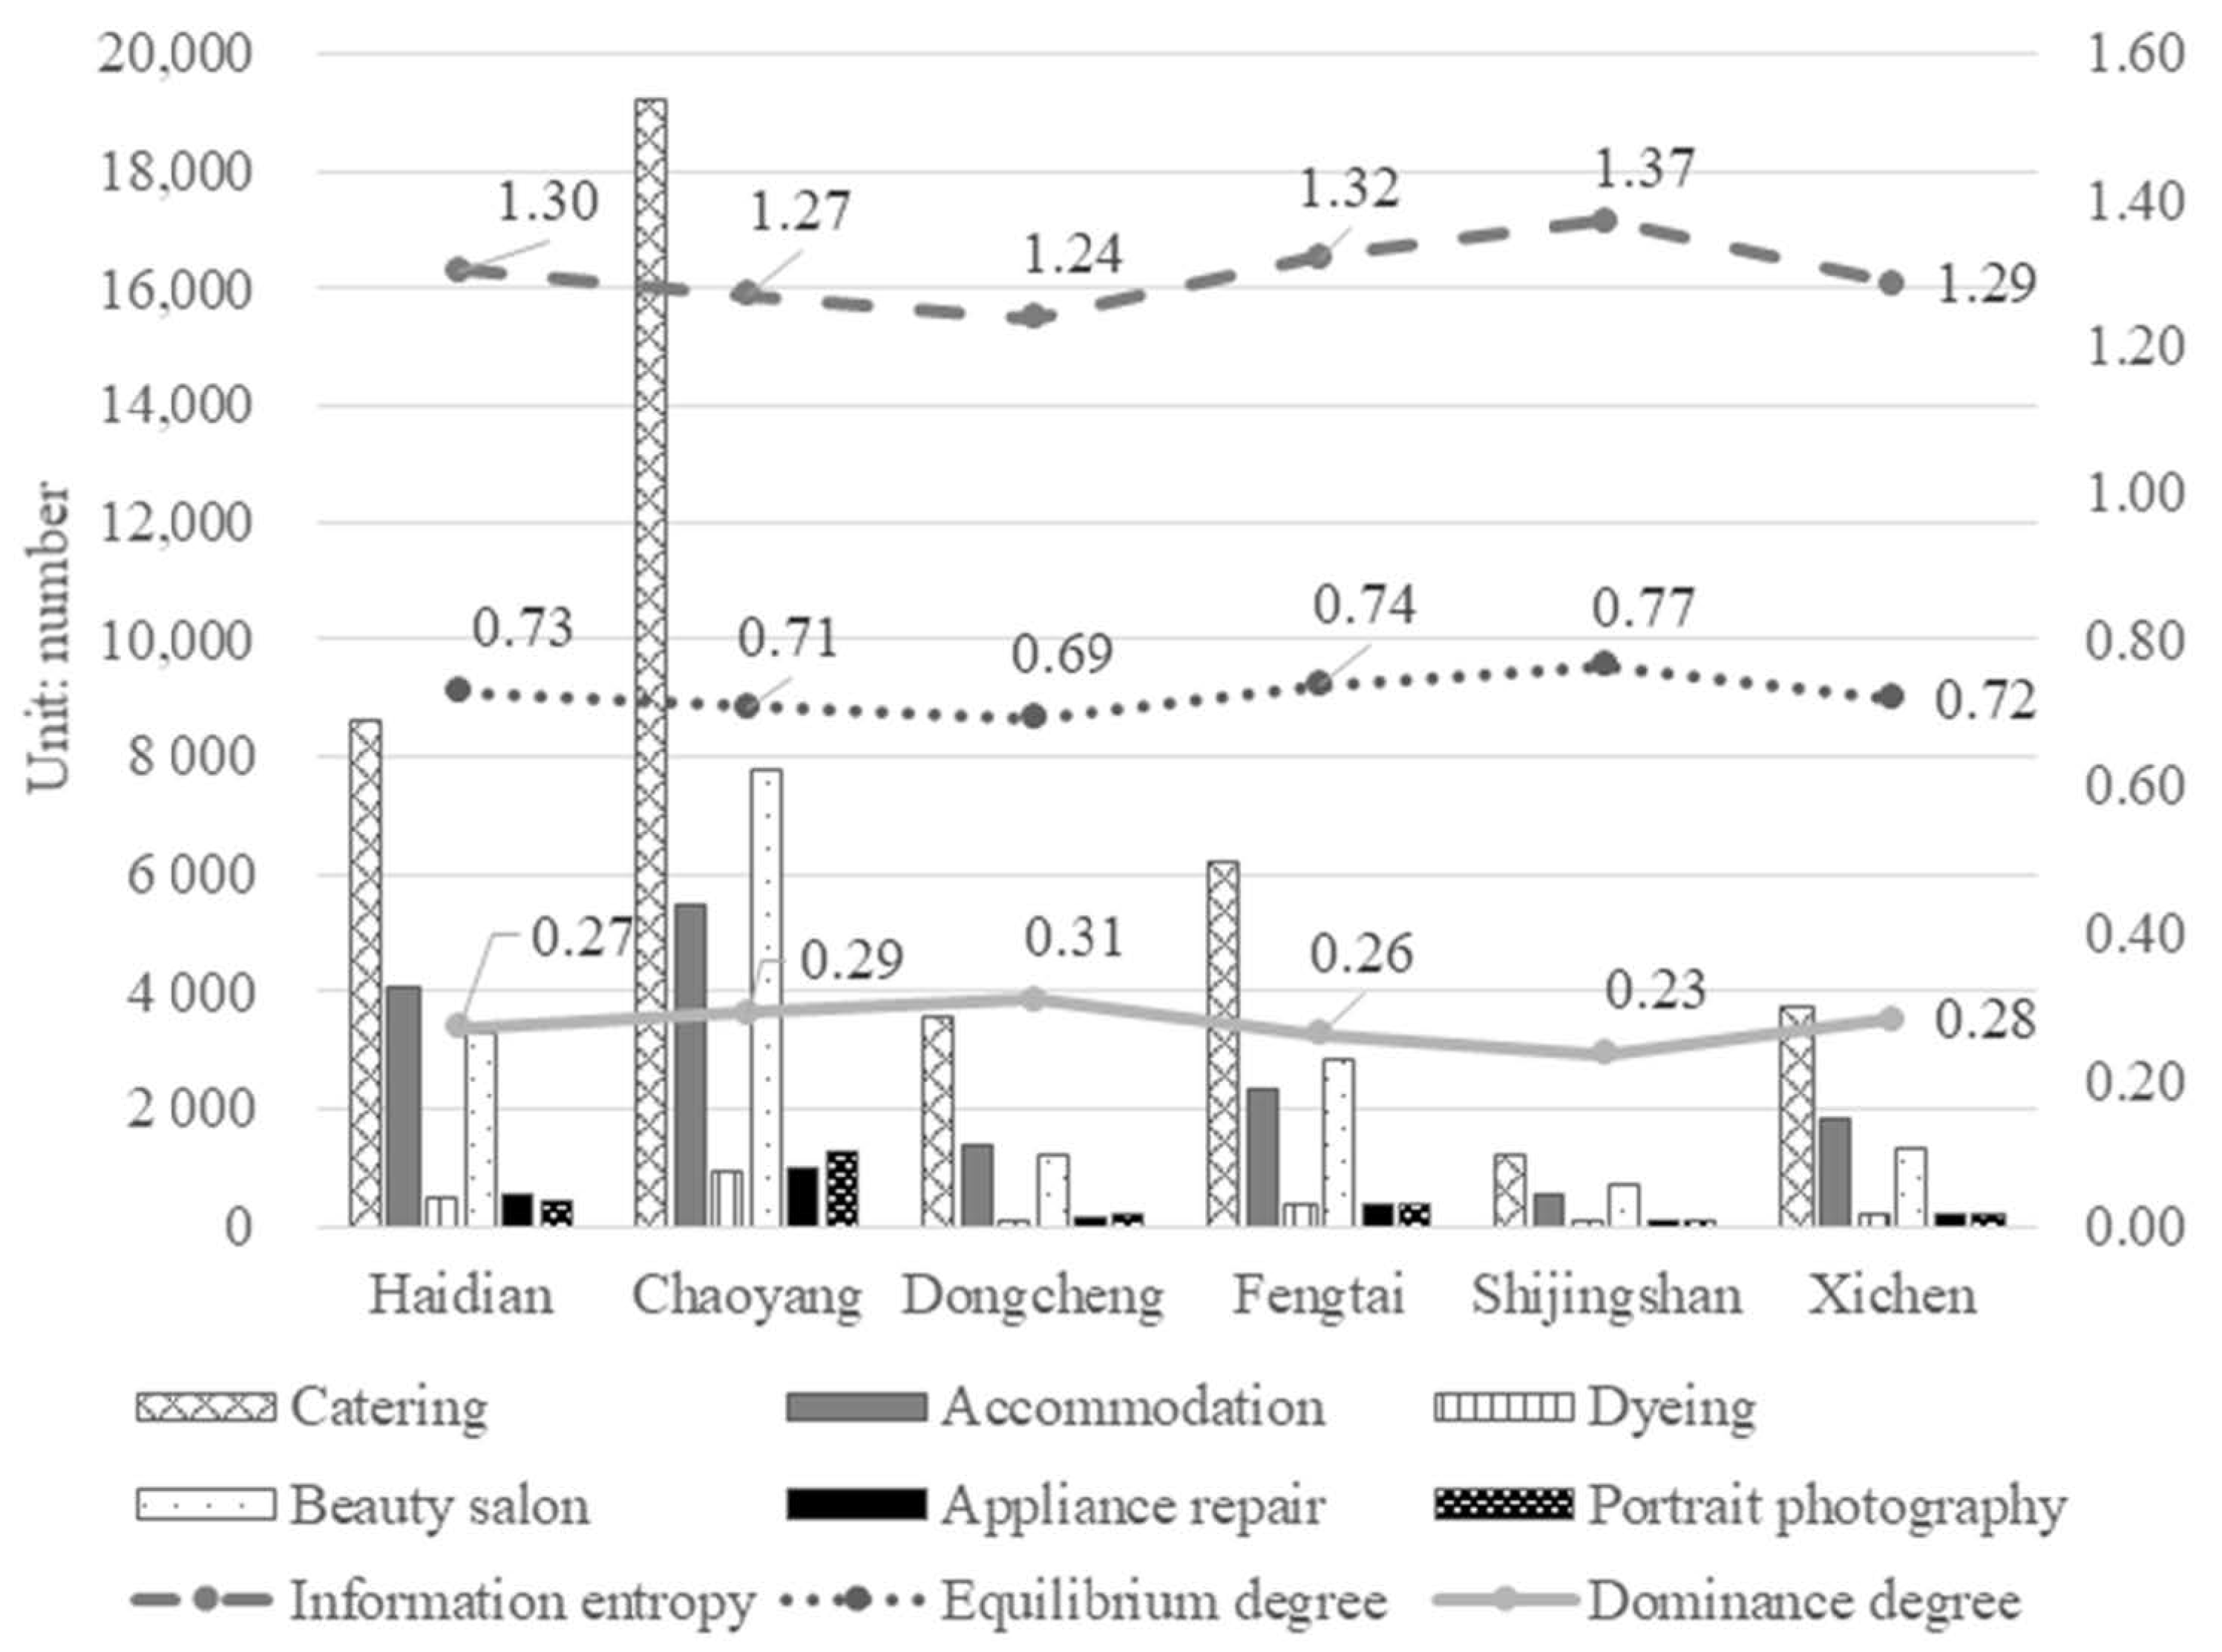
4.2. Structure Dimension

Figure 3 shows that: (1) For all districts, facilities such as catering, accommodation, and beauty salons are plentiful, while dyeing establishments, appliance repairs, and portrait photography shops are lacking. (2) As for the information entropy, the order of its value from high to low is Shijingshan, Fengtai, Haidian, Xicheng, Chaoyang, and Dongcheng. The maximum information entropy is 1.37 in Shijingshan. This shows that the quantity difference of various LSRs is the smallest in Shijingshan, and the structure of LSR tends to be balanced numerically here. In other words, although Shijingshan has the least number of LSRs, it is in a low-level equilibrium state. (3) For the equilibrium degree, the ranking result of its value is consistent with that of information entropy. This is because the equilibrium degree is calculated by dividing the information entropy by the constant (see Equation (2)). (4) From the perspective of dominance degree, the ranking result of its value is just opposite to that of equilibrium. This is because it is calculated by subtracting the equilibrium from 1 (see Equation (3)). For example, compared with other districts, Dongcheng has the smallest degree of equilibrium (0.69) and the largest degree of dominance (0.31). This indicates that there is the most obvious dominant LSR here.

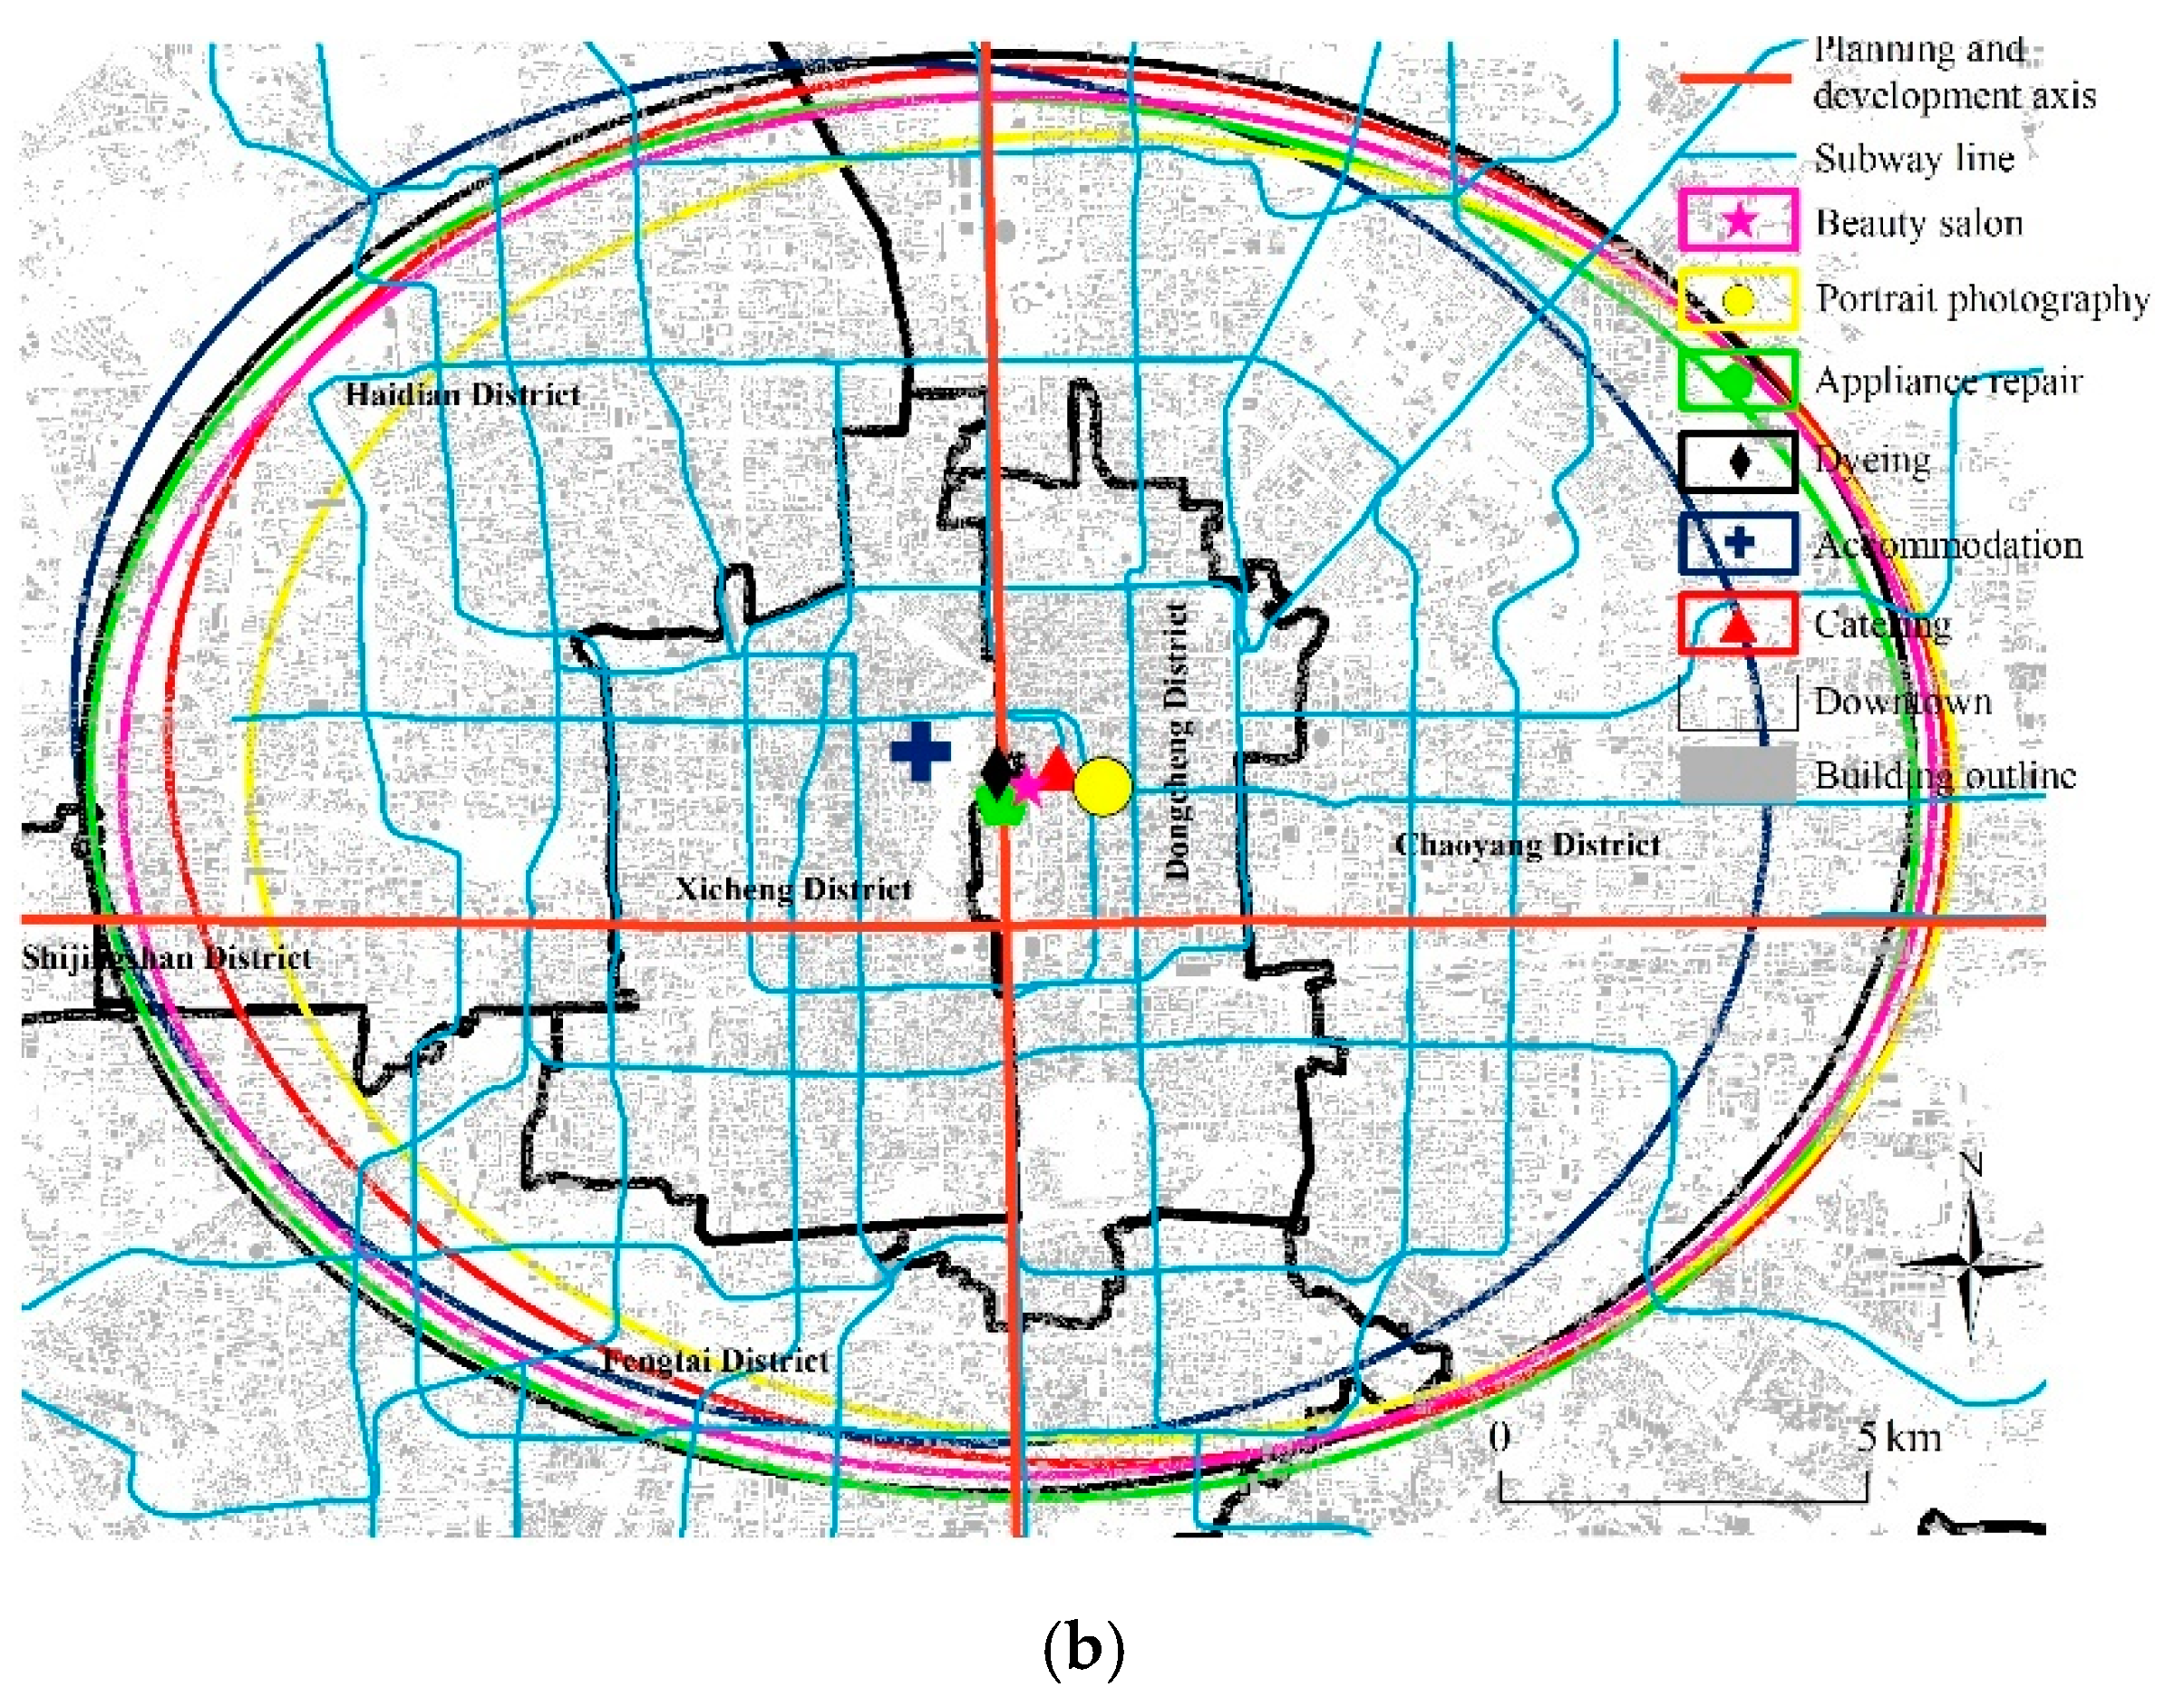
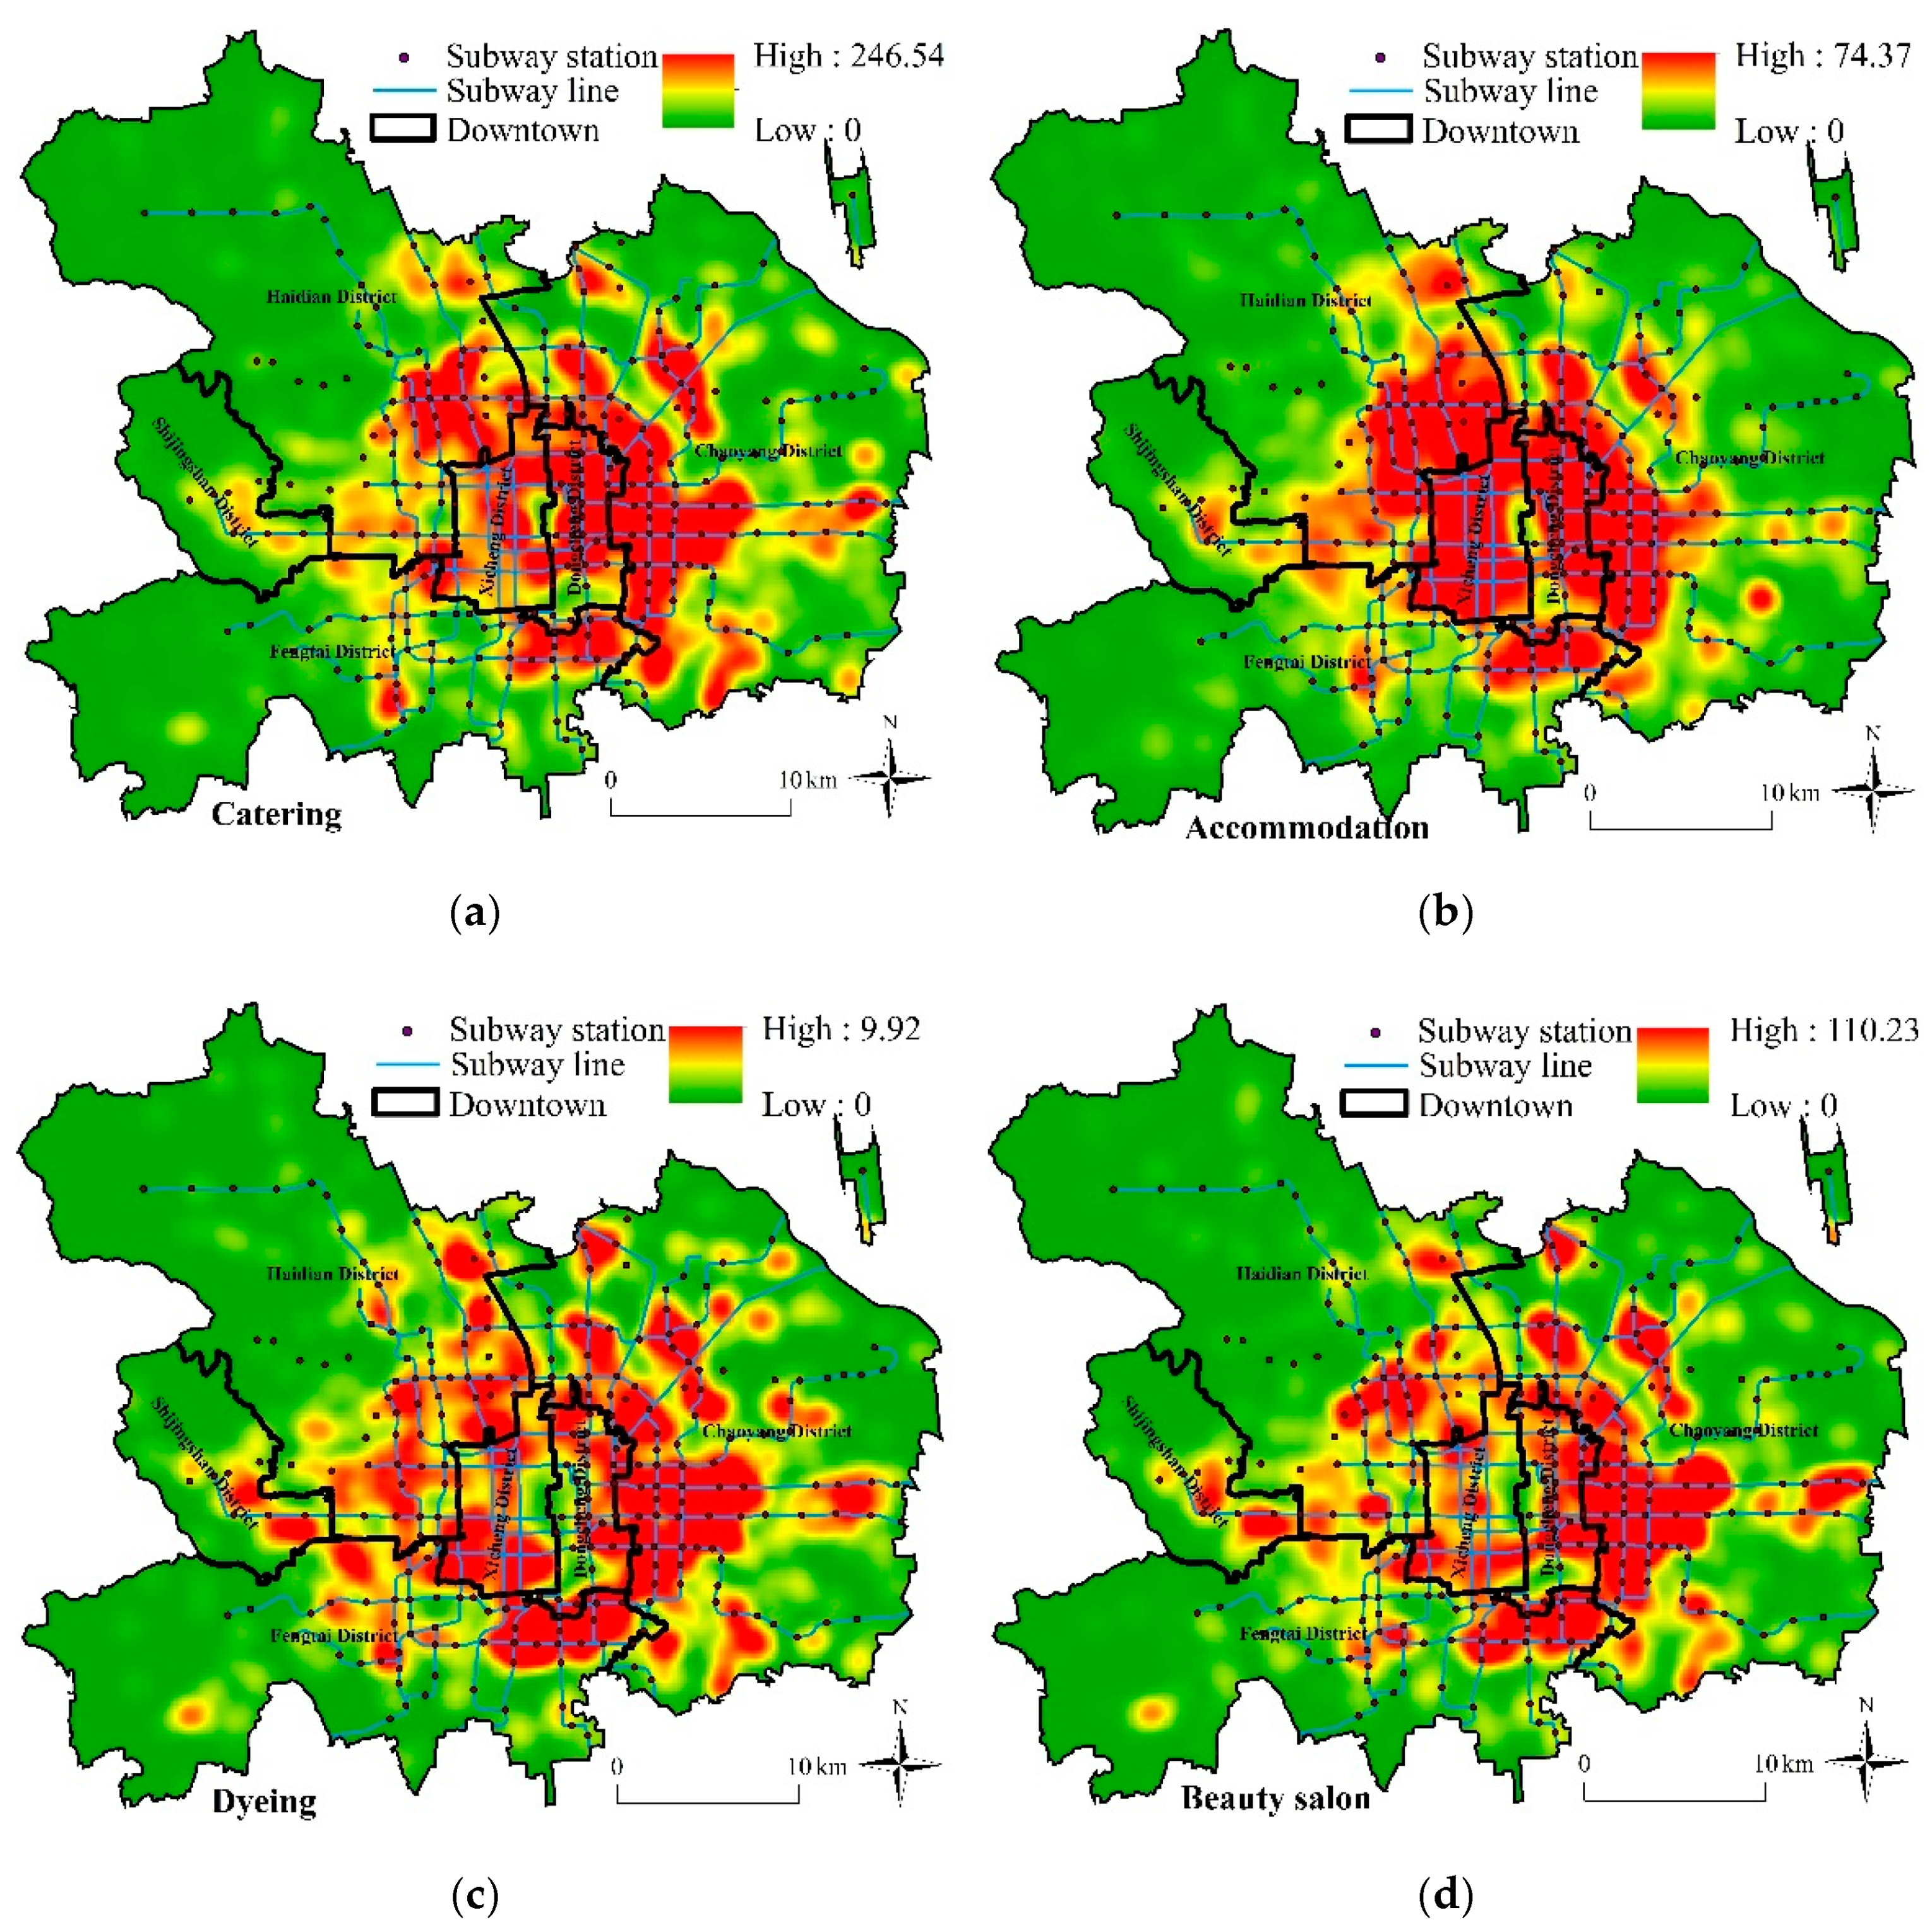
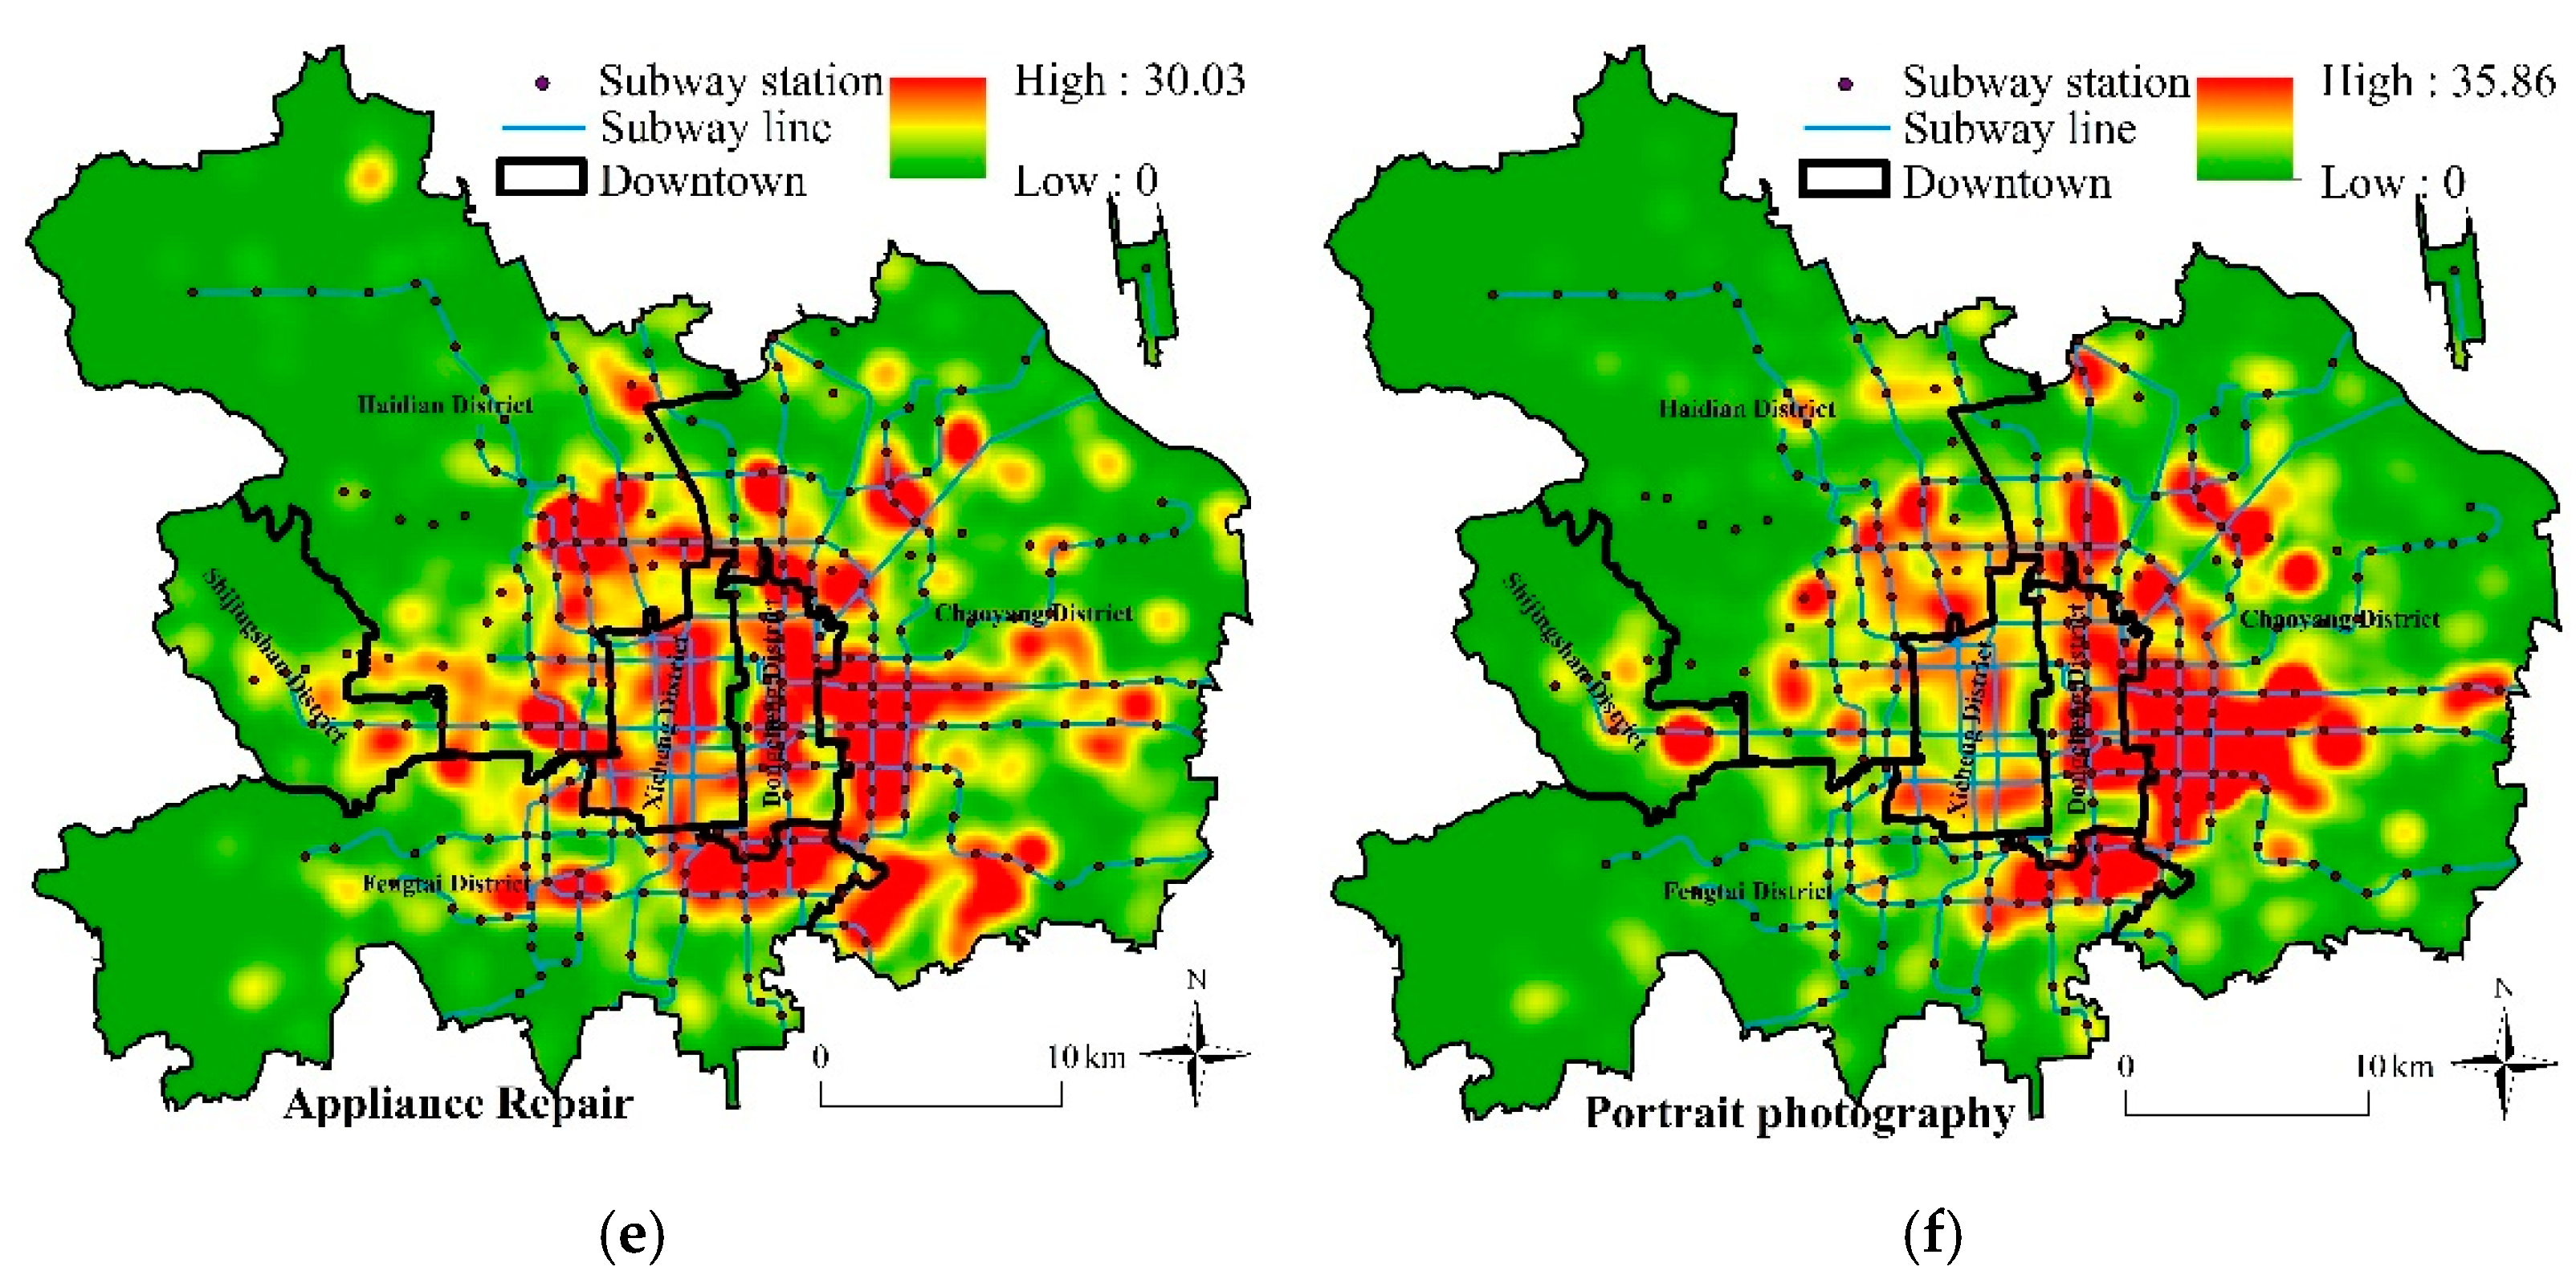
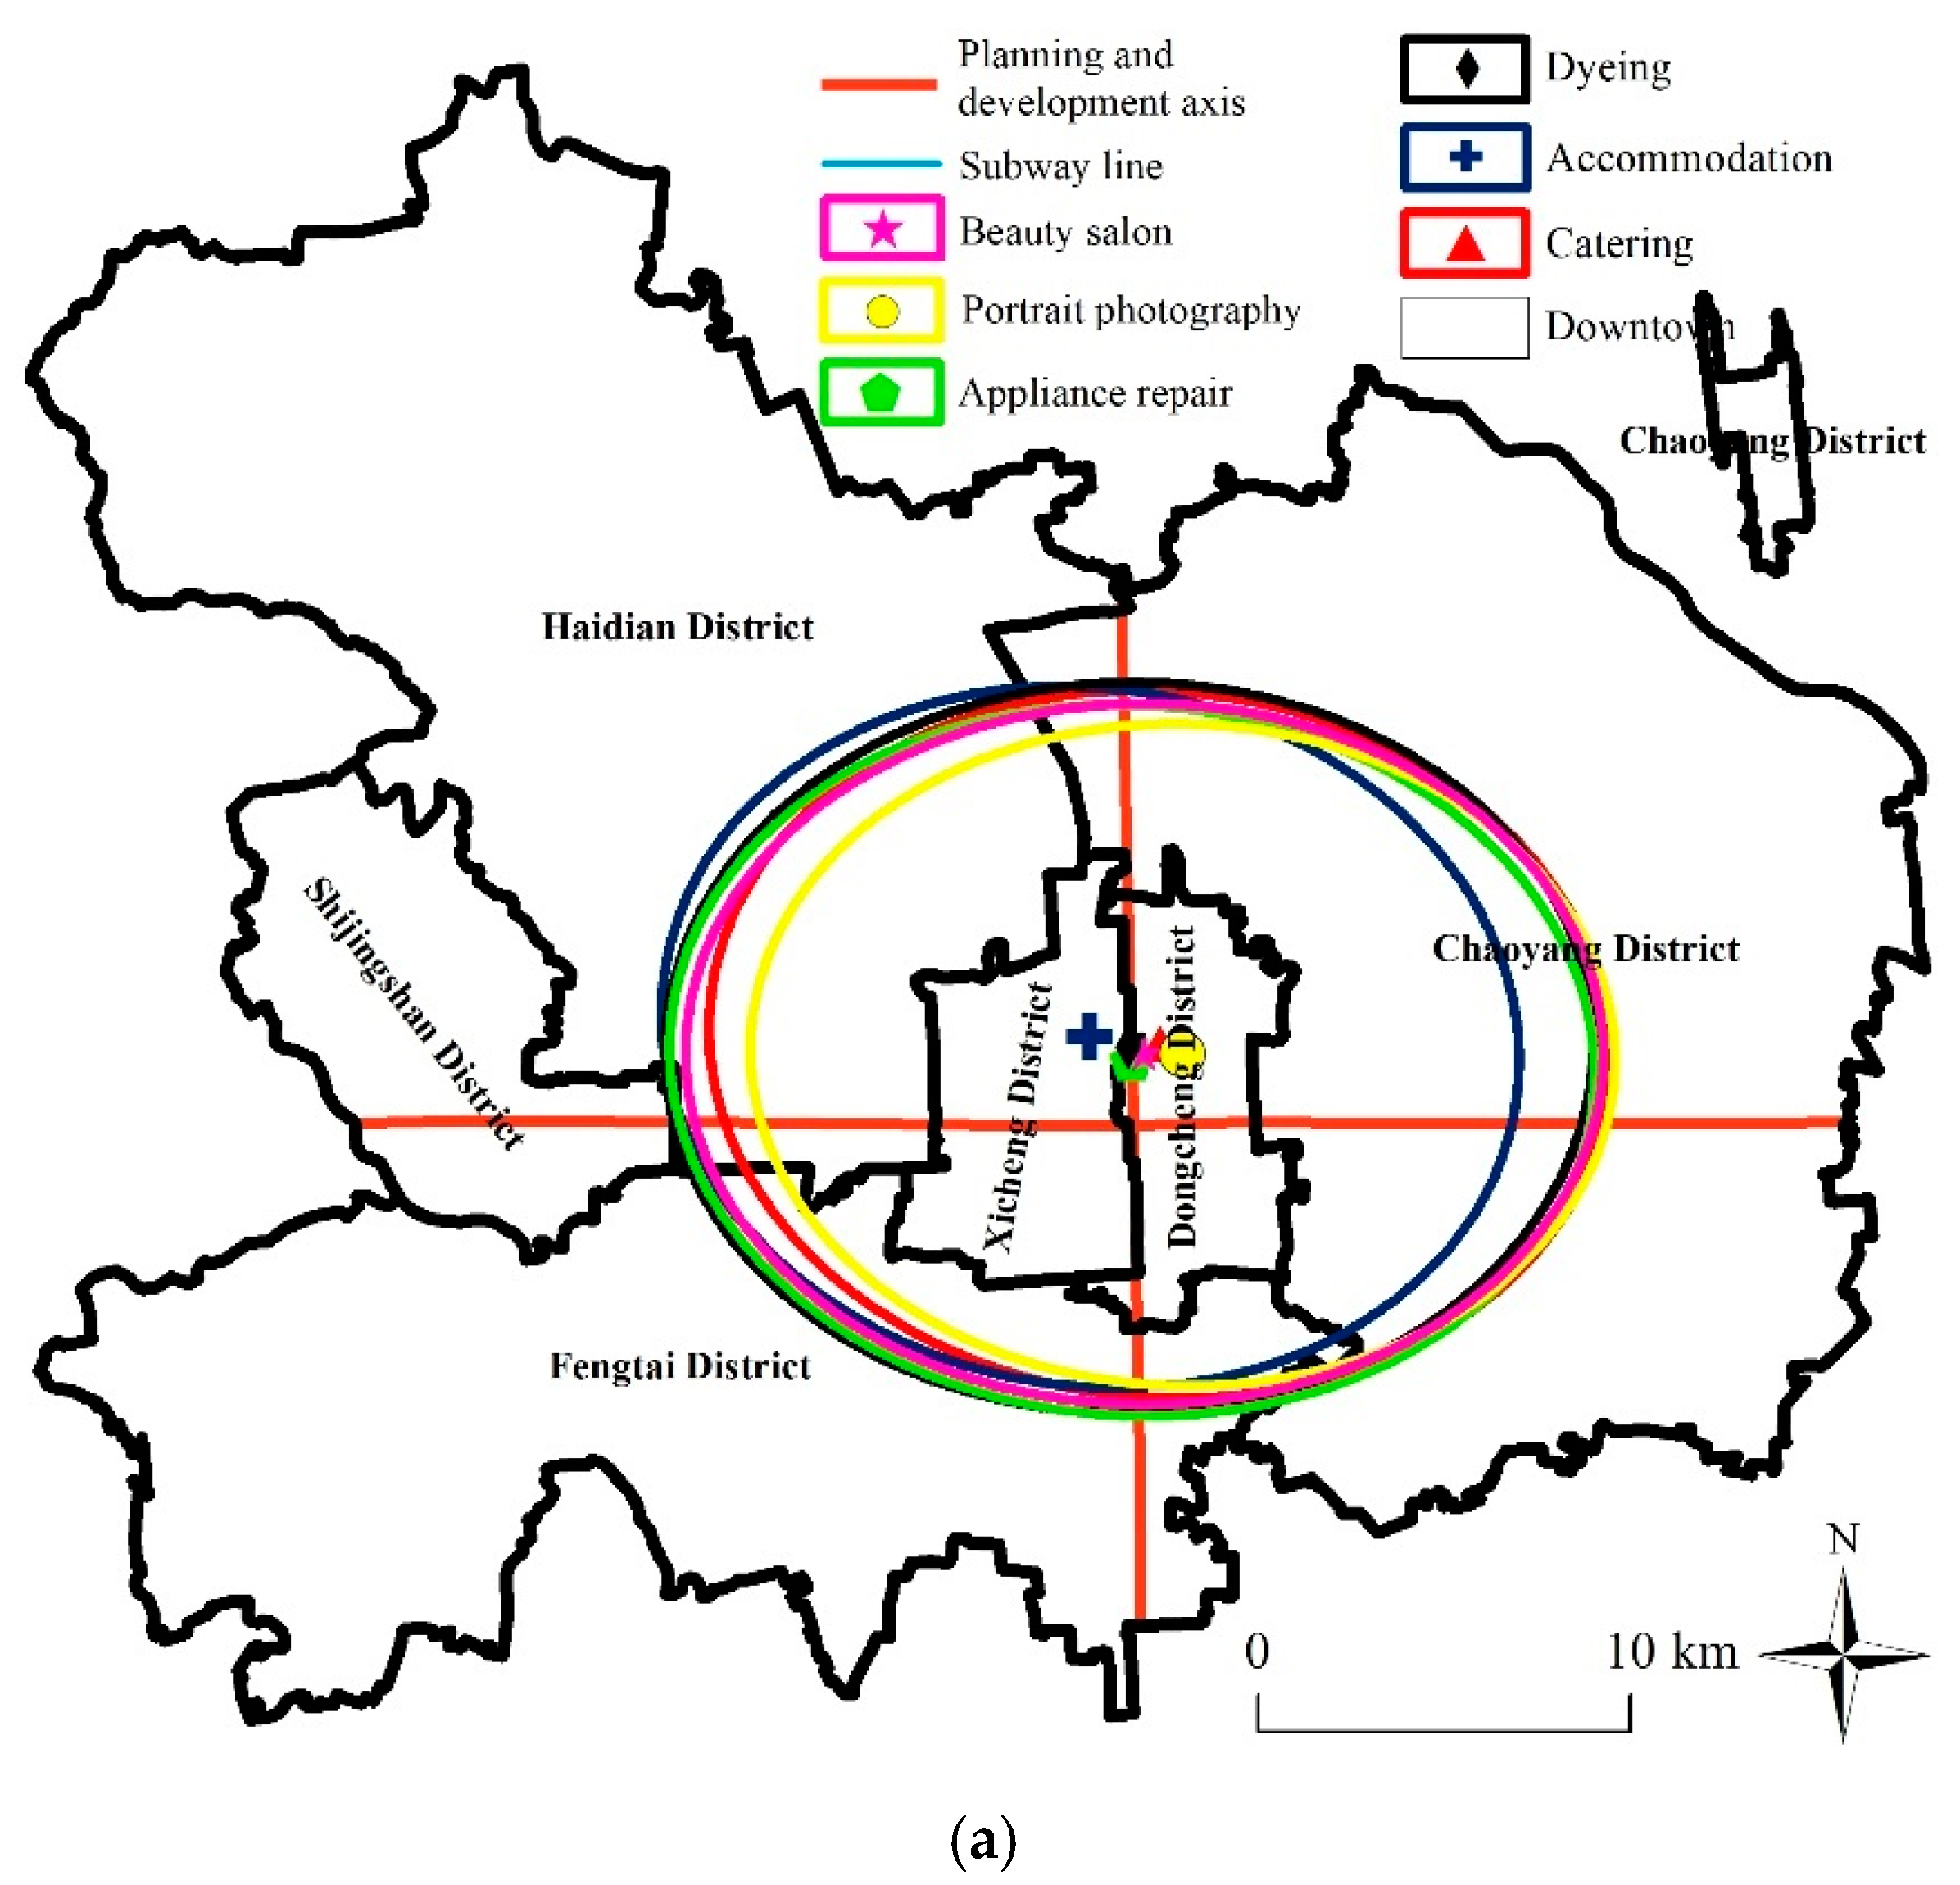
4.3. Pattern Dimension

Table 3 shows the results of the average nearest neighbour analysis. The Z scores and p-values indicate that all kinds of LSRs pass the significance test (p < 0.001) (i.e., have significant spatial agglomeration). The R value is in descending order for dyeing, accommodation, appliance repair, portrait photography, beauty salon, and catering. This shows that the concentration of dyeing and accommodation services is relatively high, while the concentration of beauty salons and catering services is relatively low.
The kernel density analysis found that the various LSRs in downtown Beijing are expressed as a spatial form of “centralised contiguous and multi-centre clusters” (Figure 4). Specifically, the catering and accommodation service facilities are concentrated in Dongcheng and Xicheng districts, and the concentration of contiguous areas is significantly larger than other types of LSRs. Dongcheng and Xicheng districts are the core functional areas of the capital, with high development intensity and urbanisation levels. Catering and accommodation services occupy an essential position and are used relatively often. Therefore, the services mentioned above are significantly concentrated in the functional core areas of downtown Beijing.
Chaoyang, Haidian, Fengtai, and Shijingshan districts are urban function expansion areas, as identified in the 2012 Beijing Major Function Zone Planning. Although these districts belong to this zone, the overall development level of Chaoyang and Haidian districts is significantly higher than that of Fengtai and Shijingshan districts. This objectively limits the concentration of life service functions turning them into multi-centred groups. Specifically, dyeing, beauty salons, appliance repair, and portrait photography services have a higher nuclear density at the junction of Dongcheng, Chaoyang, and Fengtai districts. We found that life services are primarily concentrated in transportation hubs in or near large residential and business districts. The large flow of people usually translates into higher demand for services. For example, Wangjing Station and China World Trade Centre Station are both located in a typical international business centre area. Many universities surrounding Wudaokou Station and Zhongguancun Station gather many high-tech enterprises, which constitute the life services core in Haidian District Circle. Babaoshan and Gucheng stations are close to Haidian District, so their nuclear density is relatively high. The Capital University of Economics and Business District, Muxiyuanqiao South Station, and Fangzhuang Station are adjacent to schools, railway stations, and large residential areas, so there is a large population and flow and strong demand for life services.
The centrality index shows that the difference in coordinates at the centre of the standard deviation ellipse for various LSRs are slight; the maximum difference in longitude and latitude are only 0.03° and 0.01°, respectively (Table 4). This difference reflects the proximity relationship between the centres of various LSRs in downtown Beijing. The perimeter and area of the spread ability index jointly describe the coverage of the standard deviation ellipse. The perimeter and area of each life service are in the same order, from largest to smallest: dyeing, appliance repair, beauty salon, catering, accommodation, and portrait photography. The long axis and the short axis indicate the direction and scope of the distribution of various life services, respectively. From the length difference between the long and short axis of the ellipse, the maximum difference in beauty salon services is 2.94 km, and the minimum difference in accommodation services is 2.23 km. This means that the flatness of the beauty salon service ellipse is larger, and the directionality of the data is more obvious than other services; the directional difference of the accommodation service ellipse is not statistically significant, indicating that service is more balanced in all directions. Generally, the difference between the long and short axis of the life service ellipse is within 3 km. The azimuth is the angle between the true geographic north and the X-axis of the ellipse. The maximum azimuth of the accommodation service ellipse is 98.93°, the minimum is 88.76° for dyeing services, and the average for all LSRs is 93.04°. Combined with the standard deviation ellipse chart, it is found that the elliptical shape of various LSRs does not show a clear northwest–southeast trend. However, it appears to be an approximately horizontal–vertical standard form. This is mainly because Beijing has gradually formed a typical spatial pattern of axial development over a long time (the power of the City Master Plan).
Figure 5 shows the standardised ellipse of LSRs in the study area. Combining the overall picture and the detailed map, each life service ellipse is divided into four parts by the planning development axis. The area difference of each part intuitively shows the north–south difference and the east–west difference. The centres of all services are in the Xicheng and Dongcheng districts, all located north of Chang’an Avenue. This shows that the six types of LSRs are more suited to residents’ needs north of Chang’an Avenue, and the supply of life services south of Chang’an Avenue, especially in Fengtai District, is insufficient. The current life services have an overall and more vital “north-south difference”. The accommodation service centre is located at the northwest corner of Tiananmen Square. In contrast, the catering and portrait photography centre occupies the northeast, and other life service centres are on the central axis. This shows that accommodation services are developing westward, catering and portrait photography are expanding eastward, while other services have not yet formed a clear development trend. Thus, there are hierarchical and low-level “east-west differences” in life services.

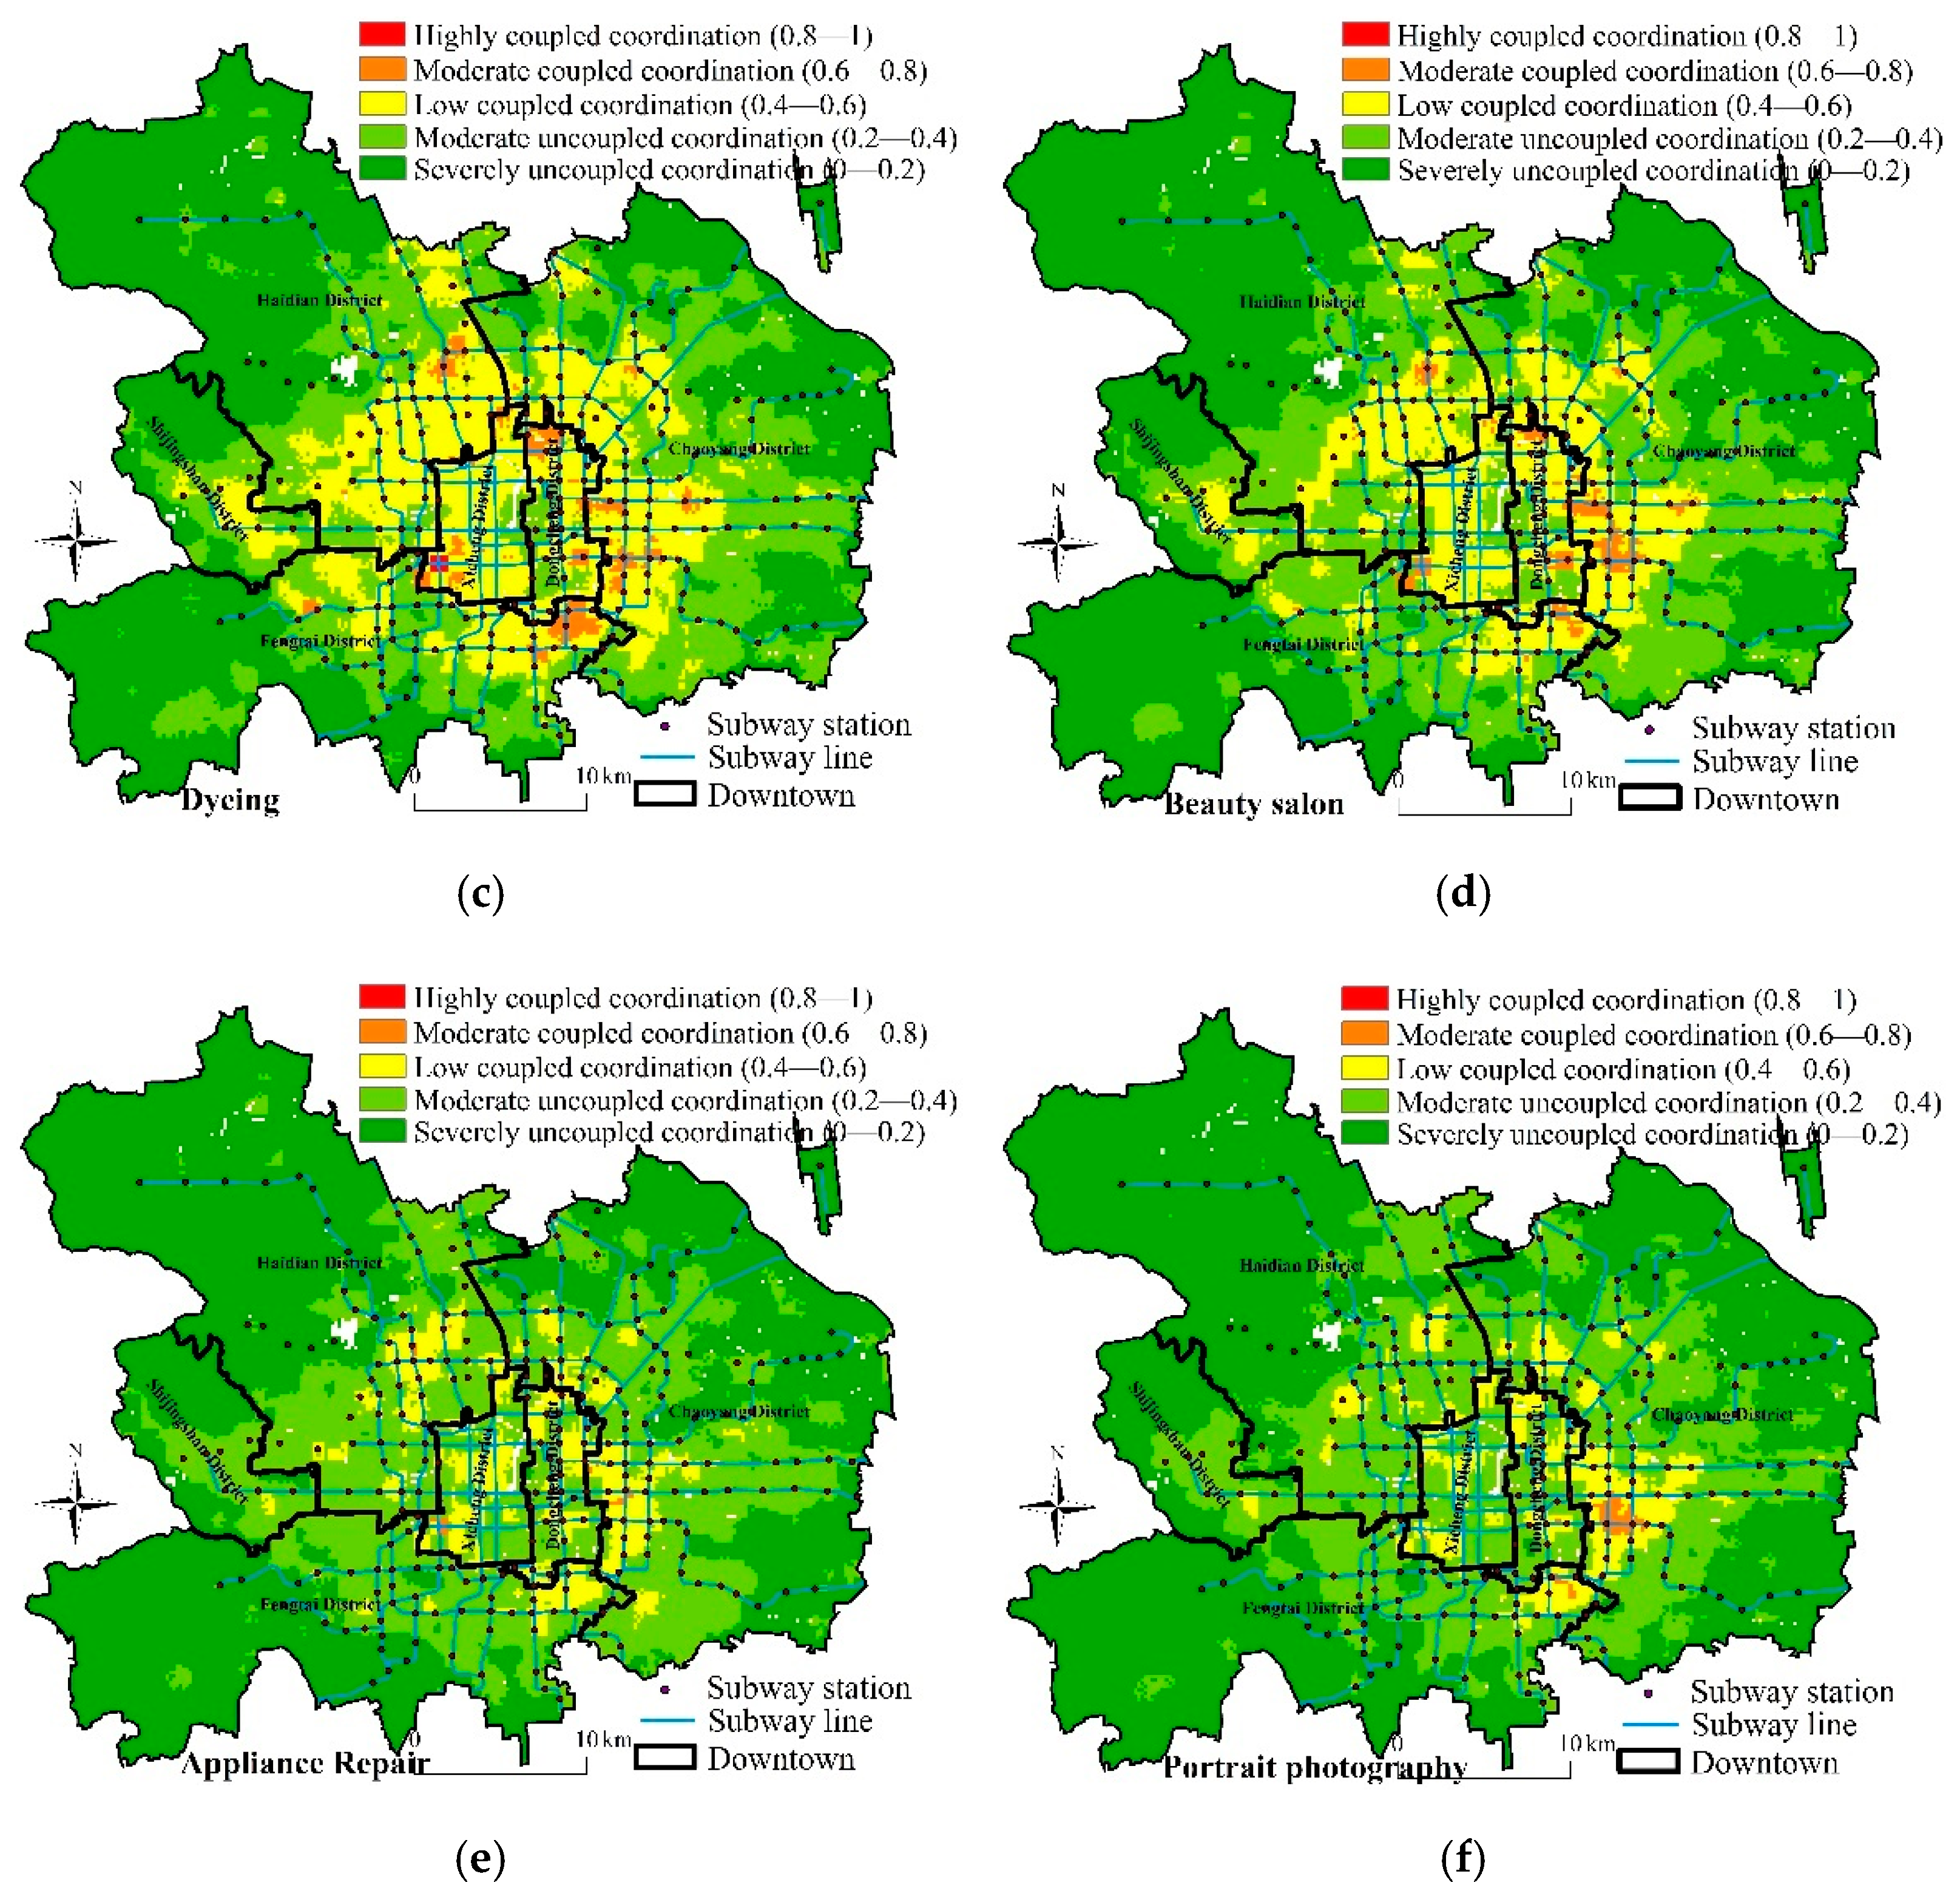
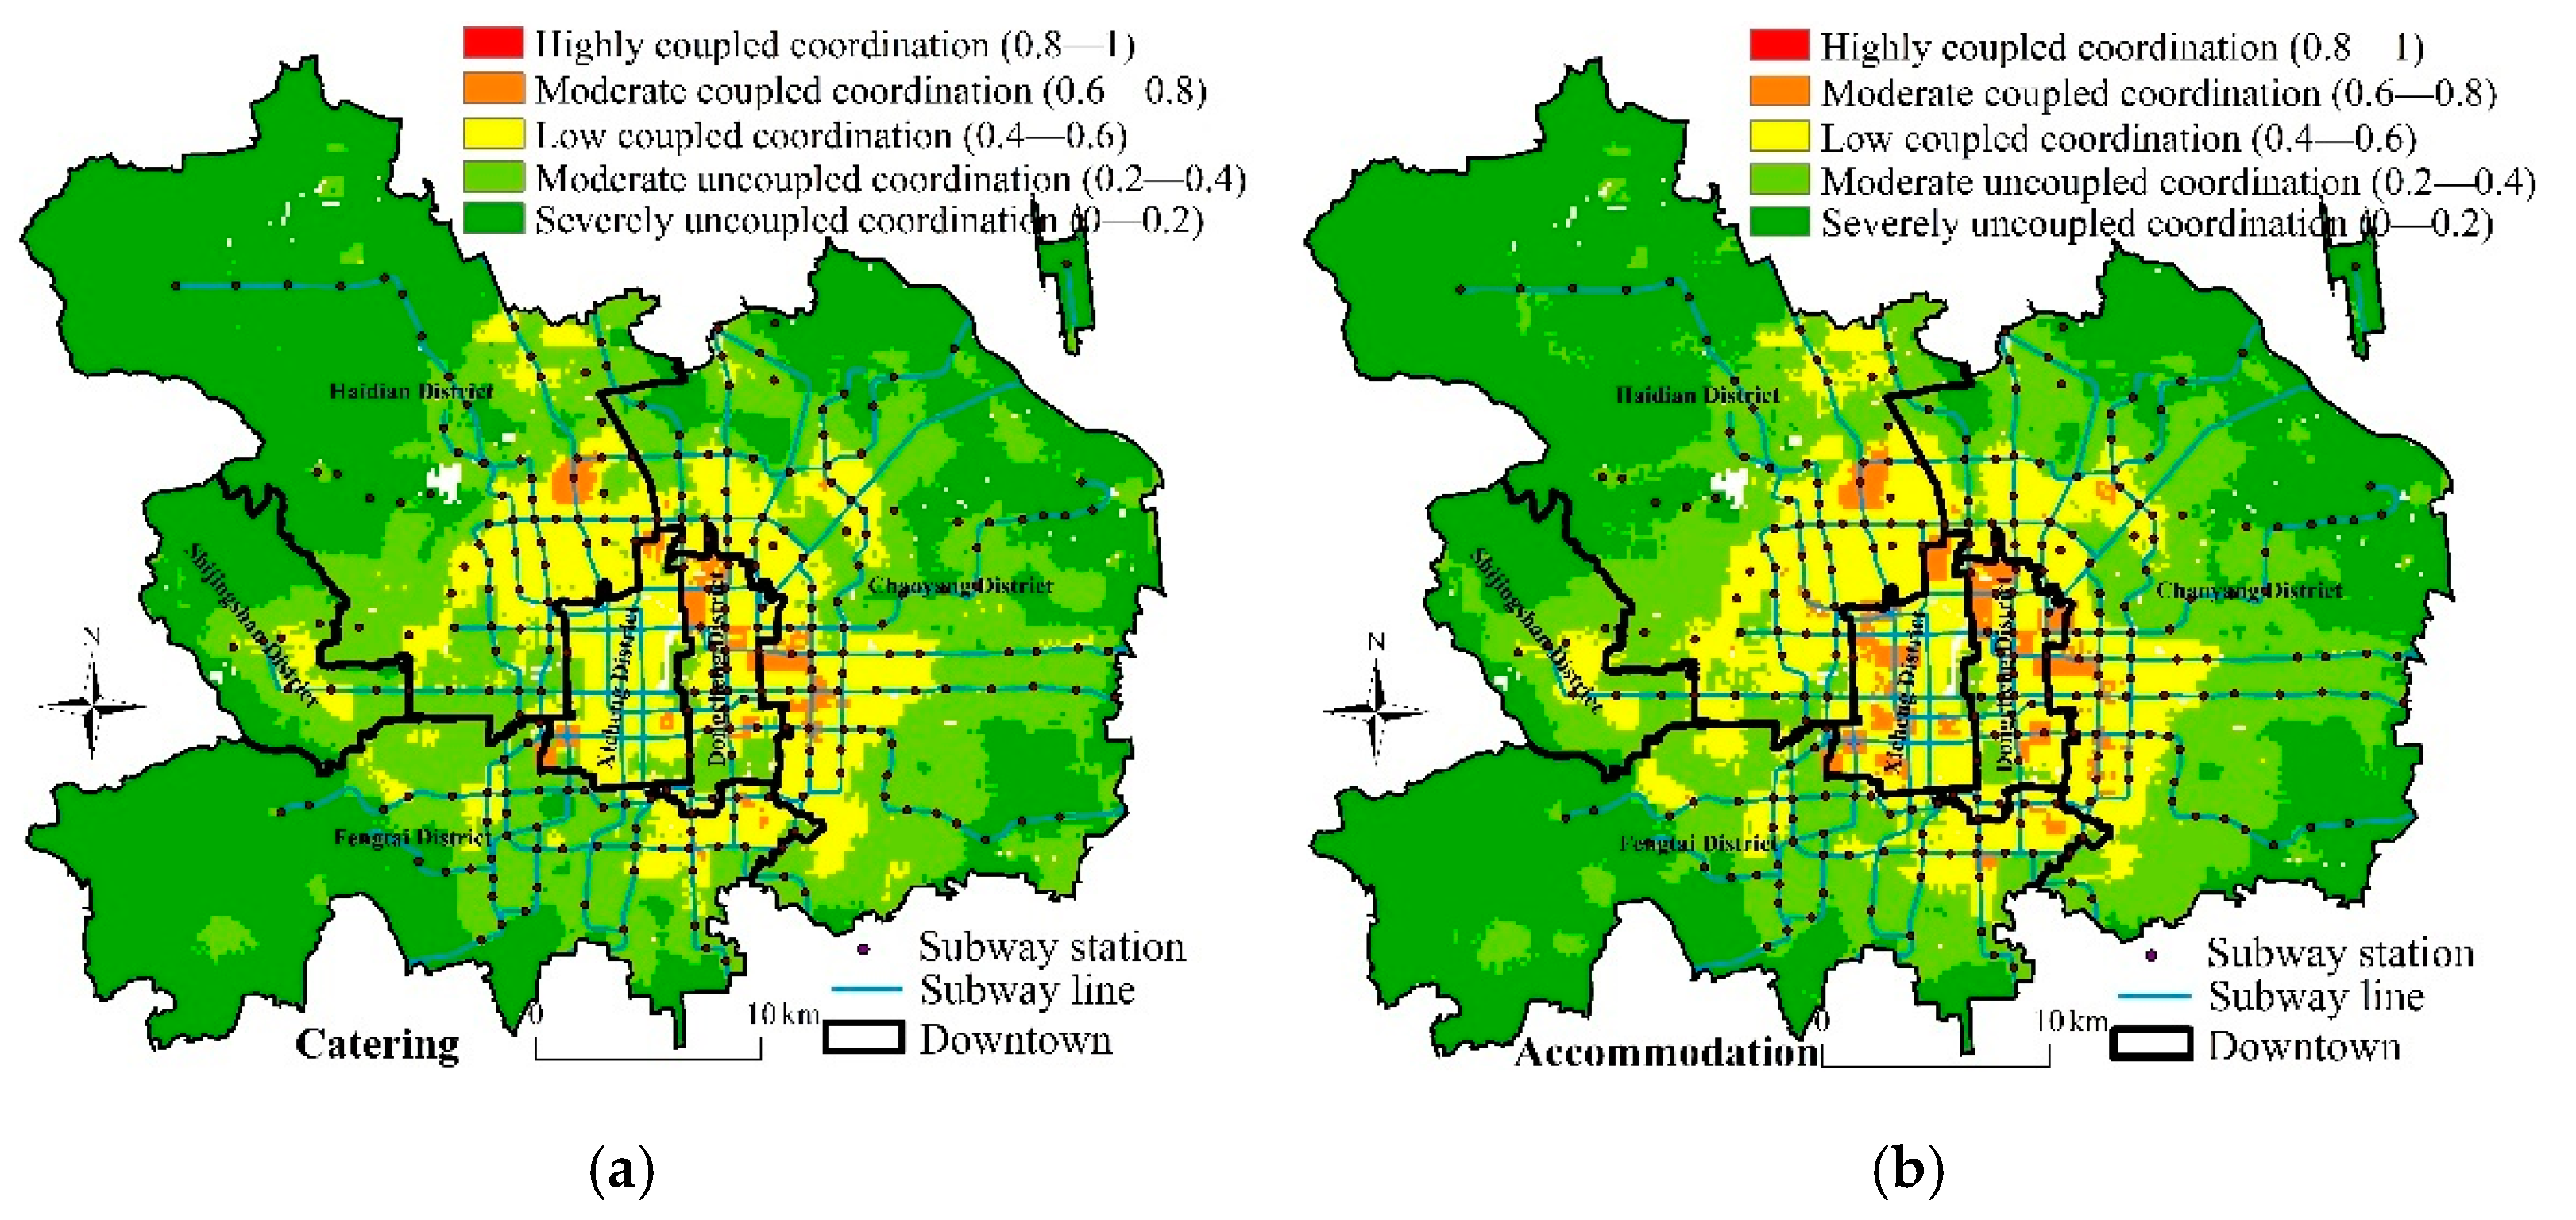
4.4. Coupling Coordination Dimension

Figure 6 shows that the current coupling and coordination of the six types of LSRs and population density has not yet reached the ideal level, and the overall characteristics are “high in the centre and low in the periphery” and “high in the east and low in the west”.
Specifically, the medium-coupling coordination areas of catering and accommodation facilities are similar, mainly concentrated around subway stations such as Wudaokou, South Luogu Lane, and China World Trade Centre. Wudaokou is close to top universities, such as Peking University and Tsinghua University. South Luogu Lane is a famous tourism alley in Beijing. The China World Trade Centre is in the city’s central business district, which contains many Fortune 500 companies. Students, tourists, and corporate employees stimulate the demand for catering and accommodation in the region, resulting in a relatively highly coupled coordination. The moderate coupled coordination areas of dyeing and beauty salons are similar, where “the east is higher than the west”. Compared with the other types, the moderate coupled coordination area of appliance repair and portrait photography facilities have the smallest area and tend to be more scattered. Most importantly, this study finds that most peripheral areas show moderate uncoupled coordination and severely coupled coordination.

5. Discussion

5.1. SJ of LSRs Reflected by Coupling Coordination Degree

Currently, there are two approaches to evaluating SJ. One is the qualitative method. For example, a case study approach is used to analyse the factors and mechanisms of SJ in rural Finland [62]. The other is the quantitative method, especially spatial analysis methods. For instance, using kernel density estimation, standard deviation ellipse, and social performance evaluation can explore the SJ of community sports and fitness venues in Shanghai [63]. Quantitative methods enable overlaying the analyses of population and other socioeconomic data to spatially identify areas of SJ [64]. Therefore, this paper uses quantitative methods to discuss SJ. These methods include descriptive statistics, information entropy, nearest neighbour, kernel density, standard deviation ellipse, and coupling coordination degree.
The results of the coupling coordination degree directly reflect the SJ: (1) For catering, accommodation, dyeing, and beauty salons, Dongcheng and Xicheng have the highest degree of SJ. The junction between the above two districts and other regions also has a high level of SJ. Dongcheng and Xicheng are the office areas of the Central Government and the Beijing Municipal Government. Hence, these areas are densely populated and require a wider variety of LSRs. (2) For appliance repair and portrait photography, the southeast of Haidian and the southwest of Chaoyang have the highest degree of SJ. Haidian District is the centre of education and technology, with a large concentration of schools and research institutes. Chaoyang District is an economic centre and an industrial base, with a well-known embassy area and a commercial and trade area. Therefore, some types of LSRs with higher technical requirements and more luxury will be concentrated here.

5.2. The LSRs among Beijing and London: Distributive Injustice

It is difficult to compare the LSRs supply globally for two main reasons directly. First, the Chinese government proposed the concept of LSRs in 2016. It originated from a life service industry with distinct Chinese characteristics. Therefore, it is difficult to find comparable programs in other countries. To our knowledge, even in China, there are few empirical studies on LSRs. The second reason is limited data sources. This paper uses POI data to measure LSRs, different from the previous field investigations. Hence, differences in data sources reduce comparability among various studies. In sum, these reasons pose challenges for effectively comparing the supply of LSRs in Beijing to other regions.
POI data currently have limited attributes (name, type, address, and coordinate information) but lack details, such as floor height, building area, and the number of households. Therefore, for accommodation services, it is inaccurate to directly compare the number of POIs because the number of people that can be accommodated in buildings of different heights varies. For instance, high-rise apartments accommodate more people than villas. However, for catering services, it is feasible to use the POI number of catering service facilities per capita as a benchmark for comparison for two main reasons. The first is that the catering service facilities are usually independent spatial units, such as a street containing many dining establishments (e.g., South Luogu Lane) or a luxuriously decorated hotel (e.g., QUANJUDE Peking Roast Duck). Although some large shopping malls can accommodate several restaurants on different floors simultaneously (e.g., Vanke Plaza, Wudaokou Shopping Centre), the name field of POIs can, generally, effectively distinguish different restaurants in similar locations. The second reason is that eating is a fixed demand for every citizen. Although there are no direct statistics, dining out constitutes a considerable proportion of residents’ daily lives for the capital city. The certainty of the demand for dining out and the need for restaurant reception capacity implies that a larger population will need more restaurants. In summary, the number of catering service facilities can roughly reflect the degree of satisfaction of residents’ dining out needs.
Inner London is a current representative case with a common benchmark with Beijing. There are 42,530 catering facilities in downtown Beijing (Table 3). According to the Beijing City Master Plan (2016–2035), the total area is about 1378 km2, and the population density in 2016 was 14,000 persons/km2. Studies have shown that as of November 2017, the Food & Shop in Inner London has 7355 POIs [65]. It also includes shops, a mall, a marketplace, vending machines, a pharmacy, fast food, a café, and a restaurant. In addition, statistics from the Greater London Authority (GLA) [66] show that the area of Inner London is 319.29 km2, and the population density in 2017 was 11,070 persons/km2. Comparing per capita catering service facilities in downtown Beijing to Inner London, the former has about 22.05 restaurants per 10,000 people, and the latter has 20.81 restaurants per 10,000 people. These two places have similar population densities, and the catering service facilities per population are close.
Although the population densities of these two places are similar, one limitation of making this type of comparison is that we do not know the income differences among people. High-income groups have the means to eat out more, while low-income groups may choose to cook at home. Therefore, there is an objective difference in the frequency of catering service facilities due to income. Furthermore, factors such as cultural differences in eating habits need to be considered. For British people, the habit of afternoon tea undoubtedly increases the frequency of visits to coffee shops. Even though the number of POIs for catering facilities per capita in London and Beijing is close, there are still cultural differences in residents’ total demand and use frequency of different catering facilities. In addition, there are differences in the stages of urban development between these two cities. In the late 1990s, the British government began the gentrification of Inner London [67], while the wave of urban renewal in China focused on rebuilding urban villages [68]. It was not until 2008 that Beijing began to construct two pilot projects to reconstruct urban villages and proposed to rebuild 50 key villages in the suburbs of Beijing over the next few years [69]. Thirty-two key villages have been rebuilt in downtown Beijing [70]. These differences demonstrate that the LSRs supply is insufficient in areas like downtown Beijing. However, the coupling and coordination degrees for the current study show that there is a low level of coupling and coordination between the catering facilities and the population distribution (Figure 6a). It indicates that there is still room for further improvement of catering service facilities in Beijing.

5.3. The Future of SJ Theory: Spatial Analysis and Big Data

The spatial analysis method is an effective tool for understanding SJ, which broadens the application field of SJ theory. For example, in environmental justice, Ripley’s K spatial analysis method was first used to evaluate the spatial point pattern of air toxins and environmental justice in West Oakland, California [64]. For energy justice, in addition to focusing on differences in social groups, it is also necessary to assess the justice impact of spatial differences on energy poverty risks and prevalence. This will help propose spatial injustice intervention measures based on geography [31]. In terms of traffic justice, GIS helped confirm that the diesel particulate matter (DPM) in the main highway corridors of Massachusetts was significantly higher than that in surrounding areas, and a hot spot analysis showed that an increase in DPM concentration and asthma occurrence had a statistically significant clustering. Therefore, decision makers need to consider the use of pollution reduction technologies in residential areas close to traffic corridors [71].
In addition to integrating spatial analysis, an increasing number of empirical studies are using big data. Big data provide cities with the potential to obtain valuable insights from data collected from various channels and support the construction of smart cities [72]. For example, Panoramio, Foursquare, and Twitter data jointly provide digital footprints of tourists in Madrid, helping the scenic spot to formulate new public policies to improve the tourist experience [73]. Baidu heat map data and urban POI data can help identify the urban population’s spatiotemporal distribution characteristics and mechanism in Xi’an, China [74]. Based on information from 10.16 million traffic monitoring records, the traffic congestion modes in Beijing have been divided into weekend mode, holiday mode, weekday mode, and weekday mode B [75]. Combined with spatial analysis and carpooling data, the multi-centre spatial structure of the Beijing metropolitan area can be defined. Unlike traditional research, this method accounts for periodicity and survey theme limitations, allowing for an easier attainment of independent conclusions [76].
This paper demonstrates how the multidimensional perception of SJ for LSRs can be realised through a combination of big data and spatial analysis. POI data helped us quickly determine the spatial location of six kinds of LSRs on a micro-scale. Using the spatial analysis methods of nearest neighbour, kernel density, and standard deviation ellipse, we were able to identify the distribution characteristics of LSRs. This provides a reliable path for future research addressing the status of LSRs. Moreover, it responds to the knowledge gaps of big data applications of SJ for LSRs. Big data and spatial analysis are important components for the future of SJ theory.

5.4. Spatial Difference of LSRs: Market Mechanism and Government Power

The market mechanism is the main reason for such a pronounced spatial difference of LSRs in Beijing. First, supply is determined by the needs of surrounding residents. Densely populated areas tend to have more choices of life service facilities. This is because consumers usually want public service facilities as close to their residences as possible, reducing unnecessary travel costs [77]. Second, establishing LSRs has corresponding costs. The market often allocates public services to those who can pay for them. Due to unequal income distribution, low-income groups cannot afford related public services [78]. We find that the current coupling coordination degree between LSRs and population density in Beijing’s urban centre has not yet reached an ideal level. The overall development characteristics are high in the centre and east but low in the periphery and to the west. Due to data limitations, this paper did not include complex regression models that may have revealed the driving mechanisms of spatial differences. However, the study of coupling coordination degree based on population density still confirms the power of market mechanisms at the supply and demand level.
Government power is another reason for the spatial difference in LSRs. First, most public service investments come from the government. The higher the level of economic development, the more the government can spend on public services. This is particularly obvious in areas with a backward economy. For example, in Laos from 2000 to 2011, the GDP grew at an average annual rate of about 7%, and the proportion of total public service expenditure in the GDP increased to 11.2% [79]. Laos was able to develop public services due to its growing economic strength. Second, the government shapes the spatial patterns of public service facilities. Data from poorer areas in Sweden show that policies, such as zoning laws, can forcibly allocate community resources to highly impoverished areas, improving the quality of life for the poor [80]. Our study finds that, for Beijing, government planning dominates the spatial pattern of LSRs. Policy requirements of the urban spatial structure further strengthen the contiguous and multi-centre clusters of LSRs, which led to greater north–south than east–west differences.

5.5. Limitations and Directions for Future Research

Overall, remote sensing technology provides a basic data source for this paper to explore the sustainable development of LSRs [81]. In addition, various methods of geographic information science provide tools for us to perceive the spatial justice (sustainability) of LSRs. However, we were unable to generate a description of residents’ psychological characteristics or analyse choice willingness from the perspective of psychology due to limitations of the data. The advantage of spatial analysis lies in creating a spatial visualisation of life service facilities; however, justice refers to the distribution of justice and requires more discussion from a philosophical and social sciences standpoint [82]. For example, in the future, data on differences in residents’ sense of justice could be collected through questionnaires. Second, POI data have limited attributes, so the driving factors and underlying mechanisms of LSRs were unable to be examined. Identifying the market mechanism and government forces behind the supply of LSRs is a crucial direction for subsequent studies. Again, future research should consider integrating methods, such as field interviews with big data, to examine these mechanisms.

6. Conclusions and Policy Recommendations

This study finds that: (1) the total LSRs are extensive and varying in type; (2) regional differences are evident, and low-level equilibrium and high-level priority development coexist; (3) LSRs are concentrated in contiguous and multi-centre clusters with a greater north–south than east–west difference; and (4) the overall level of LSRs is low, specifically for “high in the centre and low in the periphery” and “high in the east and low in the west”. Our findings inform the following recommendations:
(1)
The development gap needs to be reduced between the north and south. Here, Beijing’s LSRs have gradually formed an axial development pattern, and the north–south difference in LSRs is more significant than the east–west. Therefore, future LSR development should pay attention to the north–south difference, increasing investment in areas south of Chang’an Avenue. Furthermore, the distribution of LSRs around subway stations and subway lines tells us that improving transportation facilities is significant for achieving fairness in resource distribution.
(2)
The spatial differences for catering services need to be addressed. The number of catering services facilities in Chaoyang District is almost 10 times that of Shijingshan District. Given that catering services are a dominant type of LSRs, this paper suggests that policymakers need to provide more catering services in Shijingshan District. This does not mean that the government should directly fund the development of catering services. Still, it can help by providing more policy support for companies and individuals that provide catering services, such as providing sufficient land supply, guiding the agglomeration of catering companies, and creating a food street or plaza with scale effect.
(3)
Accommodation services could be combined with reconstructing old urban areas and the new construction of satellite cities. As a cultural symbol of Beijing, Hutong has played a crucial residential function to this day. However, due to the poor conditions of the public infrastructure, this area urgently needs renovation [83]. Some residents want to move out of the crowded hutongs, while others hope to transform the hutongs into hotels. Therefore, residents, planners, companies, and the government could work together to transform the old city and the construction of the satellite city. This embodies the procedural justice in SJ. Hence, the government should guide the orderly development of accommodation service facilities by formulating industry development plans.
(4)
As the old Chinese saying goes, “Loving beauty is part of human nature”. To facilitate residents’ access to beauty salon services, policymakers should consider establishing at least one beauty salon in each community. Currently, beauty salon services in Beijing are centralized in the junction area of Dongcheng, Chaoyang, and Fengtai Districts. As a result, a longer commute is required for residents outside of these areas to access these services. In addition, building beauty salons can increase the vitality of the urban area by increasing the diversity of consumption in the neighbourhood, which is another way to improve the life service resources.
(5)
Although the total number of POIs for dyeing, appliance repair, and portrait photography accounts for less than 10% of LSRs, existing services placement should be considered when establishing new service locations. Based on the results of the spatial pattern, there are fewer dyeing services in the northwest of the studied area. In contrast, appliance repair and portrait photography services tended to be found in the eastern region. The results of the coupling and coordination degrees in the current study reflect the unbalanced spatial distribution of these services in Beijing. Therefore, corresponding LSRs should be added in the above areas.

Author Contributions

Conceptualization, Z.X. and Z.Z.; methodology, L.N., J.H. and C.L.; writing—original draft preparation, Z.X. and L.N.; writing—review and editing, J.H., Z.L. and Y.H.; formal analysis, Z.X. and L.N.; visualization, L.N. and Y.W.; supervision, Z.Z. and X.G.; funding acquisition, Z.Z. All authors have read and agreed to the published version of the manuscript.

Funding

The paper was supported by the Key Project of National Social Science Fund (21AZD041) and National Natural Science Foundation of China (42077433).

Institutional Review Board Statement

Not applicable.

Informed Consent Statement

Not applicable.

Data Availability Statement

Not applicable.

Conflicts of Interest

The authors declare no conflict of interest.

References

  1. United Nations. Transforming Our World: The 2030 Agenda for Sustainable Development. 2015. Available online: https://sustainabledevelopment.un.org/content/documents/21252030%20Agenda%20for%20Sustainable%20Development%20web.pdf (accessed on 20 April 2022).
  2. United Nations. World Urbanization Prospects. Available online: https://www.un.org/development/desa/publications/2018-revision-of-world-urbanization-prospects.html (accessed on 20 April 2022).
  3. Yu, H. Pay close attention to and take measures to accelerate the development of life service industry. China Econ. Trade Her. 2012, 29, 27–30. [Google Scholar]
  4. State Council. Guiding Opinions on Accelerating the Development of Life Service Industry and Promoting the Upgrading of Consumption Structure. Available online: http://www.gov.cn/zhengce/content/2015-11/22/content_10336.htm (accessed on 20 April 2022).
  5. Ministry of Commerce. Thirteenth Five-Year Plan for the Development of Residents’ Life Service Industry. Available online: http://www.mofcom.gov.cn/article/guihua/201701/20170102495671.shtml (accessed on 20 April 2022).
  6. Ministry of Finance and State Taxation Administration. Announcement on Clarifying the Policy of Adding and Deducting Value-Added Tax of Life Service Industry. Available online: http://www.chinatax.gov.cn/chinatax/n810341/n810755/c5137754/content.html (accessed on 20 April 2022).
  7. National Development and Reform Commission. Notice on Several Opinions on Promoting the Life Service Industry to Make Up for Shortcomings and Improve People’s Quality of Life. Available online: http://www.gov.cn/zhengce/content/2021-11/02/content_5648192.htm (accessed on 20 April 2022).
  8. Weziak-Bialowolska, D. Quality of life in cities—Empirical evidence in comparative European perspective. Cities 2016, 58, 87–96. [Google Scholar] [CrossRef]
  9. Zhao, Z.; Pang, R.; Wang, S. Measurement of spatial accessibility performance of large retailing facilities in Changchun. Geogr. Res. 2016, 35, 431–441. [Google Scholar]
  10. De Vita, A. Inequality and poverty in global perspective. In Freedom from Poverty as a Human Right; Oxford University Press: New York, NY, USA, 2007; pp. 103–132. [Google Scholar]
  11. Christman, B.; Russell, H. Readjusting the political thermostat: Fuel poverty and human rights in the UK. J. Hum. Rights Commonw. 2016, 2, 116–128. [Google Scholar] [CrossRef]
  12. Macintyre, S. Deprivation amplification revisited; or, is it always true that poorer places have poorer access to resources for healthy diets and physical activity? Int. J. Behav. Nutr. Phys. Act. 2007, 4, 1–7. [Google Scholar] [CrossRef] [Green Version]
  13. Reidpath, D.D.; Burns, C.; Garrard, J.; Mahoney, M.; Townsend, M. An ecological study of the relationship between social and environmental determinants of obesity. Health Place 2002, 8, 141–145. [Google Scholar] [CrossRef]
  14. Wardle, H.; Keily, R.; Astbury, G.; Reith, G. “Risky Places?”: Mapping gambling machine density and socio-economic deprivation. J. Gambl. Stud. 2014, 30, 201–212. [Google Scholar] [CrossRef]
  15. Macdonald, L.; Olsen, J.R.; Shortt, N.K.; Ellaway, A. Do “environmental bads” such as alcohol, fast food, tobacco, and gambling outlets cluster and co-locate in more deprived areas in Glasgow City, Scotland? Health Place 2018, 51, 224–231. [Google Scholar] [CrossRef]
  16. Yen, I.H.; Kaplan, G.A. Neighborhood social environment and risk of death: Multilevel evidence from the Alameda County Study. Am. J. Epidemiol. 1999, 149, 898–907. [Google Scholar] [CrossRef]
  17. Anguelovski, I.; Cole, H.V.S.; O’Neill, E.; Baro, F.; Kotsila, P.; Sekulova, F.; Perez Del Pulgar, C.; Shokry, G.; Garcia-Lamarca, M.; Arguelles, L.; et al. Gentrification pathways and their health impacts on historically marginalized residents in Europe and North America: Global qualitative evidence from 14 cities. Health Place 2021, 72, 102698. [Google Scholar] [CrossRef]
  18. Buzzacchi, L.; Leveque, P.; Taramino, R.; Zotteri, G. Using betweenness metrics to investigate the geographical distribution of retailers. Environ. Plan. B-Urban Anal. City Sci. 2021, 48, 2221–2238. [Google Scholar] [CrossRef]
  19. Lv, Y.; Zheng, X.; Zhou, L. Relationships between street centrality and spatial distribution of functional urban land use: A case study of Beijing central city. Geogr. Res. 2017, 36, 1353–1363. [Google Scholar]
  20. Wu, M.; Pei, T.; Wang, W.; Guo, S.; Song, C.; Chen, J.; Zhou, C. Roles of locational factors in the rise and fall of restaurants: A case study of Beijing with POI data. Cities 2021, 113, 103185. [Google Scholar] [CrossRef]
  21. Ning, X.; Liu, Y.; Wang, H.; Hao, M.; Yang, B.; Wang, M. Research on Functional Land Division of the Main Urban Area in Beijing Based on Crowd Sourcing Geographic Data. Geogr. Geo-Inf. Sci. 2018, 34, 42–49. [Google Scholar]
  22. Jiang, B.; Wang, Y.; Ye, X. Detecting development pattern of urban business facilities using reviews data. Acta Geod. Cartogr. Sin. 2015, 44, 1022–1028. [Google Scholar]
  23. Wang, T.; Wang, Y.; Zhao, X.; Fu, X. Spatial distribution pattern of the customer count and satisfaction of commercial facilities based on social network review data in Beijing, China. Comput. Environ. Urban Syst. 2018, 71, 88–97. [Google Scholar] [CrossRef]
  24. Lee, J.P.; Ponicki, W.; Mair, C.; Gruenewald, P.; Ghanem, L. What explains the concentration of off-premise alcohol outlets in Black neighborhoods? SSM-Popul. Health 2020, 12, 669. [Google Scholar] [CrossRef]
  25. Fang, Y.; Mao, J.; Liu, Q.; Huang, J. Exploratory space data analysis of spatial patterns of large-scale retail commercial facilities: The case of Gulou District, Nanjing, China. Front. Archit. Res. 2021, 10, 17–32. [Google Scholar] [CrossRef]
  26. Wang, F.; Chen, C.; Xiu, C.; Zhang, P. Location analysis of retail stores in Changchun, China: A street centrality perspective. Cities 2014, 41, 54–63. [Google Scholar] [CrossRef]
  27. Pirie, G.H. On spatial justice. Environ. Plan. A 1983, 15, 465–473. [Google Scholar] [CrossRef]
  28. Smith, D.M. Geography and Social Justice; Blackwell: Oxford, UK, 1994. [Google Scholar]
  29. Israel, E.; Frenkel, A. Social justice and spatial inequality: Toward a conceptual framework. Prog. Hum. Geogr. 2018, 42, 647–665. [Google Scholar] [CrossRef]
  30. Soja, E.W. The city and spatial justice. In Justice et Injustices Spatiales; Presses Universitaires de Paris Nanterre: Nanterre, France, 2016; pp. 56–72. [Google Scholar]
  31. Bouzarovski, S.; Simcock, N. Spatializing energy justice. Energy Policy 2017, 107, 640–648. [Google Scholar] [CrossRef]
  32. Sovacool, B.K.; Heffron, R.J.; McCauley, D.; Goldthau, A. Energy decisions reframed as justice and ethical concerns. Nat. Energy 2016, 1, 1–6. [Google Scholar] [CrossRef] [Green Version]
  33. Guerra, E.; Kirschen, M. Housing Plus Transportation Affordability Indices: Uses, Opportunities, and Challenges. Available online: https://www.econstor.eu/handle/10419/173922 (accessed on 20 April 2022).
  34. Jian, I.Y.; Luo, J.; Chan, E.H.W. Spatial justice in public open space planning: Accessibility and inclusivity. Habitat Int. 2020, 97, 102122. [Google Scholar] [CrossRef]
  35. Deb, D.; Smith, R.M. Application of Random Forest and SHAP Tree Explainer in Exploring Spatial (In)Justice to Aid Urban Planning. ISPRS Int. J. Geo-Inf. 2021, 10, 629. [Google Scholar] [CrossRef]
  36. Ewing, R.; Hamidi, S.; Grace, J.B.; Wei, Y.D. Does urban sprawl hold down upward mobility? Landsc. Urban Plan. 2016, 148, 80–88. [Google Scholar] [CrossRef] [Green Version]
  37. Getis, A.; Mur, J.; Zoller, H.; Mur, J.; Fingleton, B.; Smith, T.; Plotnikova, M. Spatial Econometrics and Spatial Statistics. Available online: http://citeseerx.ist.psu.edu/viewdoc/download?doi=10.1.1.175.681&rep=rep1&type=pdf (accessed on 20 April 2022).
  38. Lloyd, C. Spatial Data Analysis: An Introduction for GIS Users; Oxford University Press: New York, NY, USA, 2010. [Google Scholar]
  39. Szewranski, S.; Kazak, J.; Sylla, M.; Swiader, M. Spatial data analysis with the use of ArcGIS and Tableau systems. In The Rise of Big Spatial Data; Springer: Cham, Switzerland, 2017; pp. 337–349. [Google Scholar]
  40. Fainstein, S.S. The just city. Int. J. Urban Sci. 2014, 18, 1–18. [Google Scholar] [CrossRef]
  41. Lefebvre, H.; Nicholson-Smith, D. The Production of Space; Blackwell: Oxford, UK, 1991; Volume 142. [Google Scholar]
  42. Harvey, D. Social Justice and the City; University of Georgia Press: Athens, GA, USA, 2010; Volume 1. [Google Scholar]
  43. Soja, E.W. Postmodern Geographies: The Reassertion of Space in Critical Social Theory; Verso: London, UK, 1989. [Google Scholar]
  44. Maslow, A.H. A theory of human motivation. Psychol. Rev. 1943, 50, 370–396. [Google Scholar] [CrossRef] [Green Version]
  45. Zheng, R. On Spatial Justice: The Reconstruction of Justice and the Criticism of Spatial Production; Shanghai Academy of Social Sciences Press: Shanghai, China, 2018. [Google Scholar]
  46. Ernstson, H. The social production of ecosystem services: A framework for studying environmental justice and ecological complexity in urbanized landscapes. Landsc. Urban Plan. 2013, 109, 7–17. [Google Scholar] [CrossRef] [Green Version]
  47. McConnachie, M.M.; Shackleton, C.M. Public green space inequality in small towns in South Africa. Habitat Int. 2010, 34, 244–248. [Google Scholar] [CrossRef] [Green Version]
  48. Tsou, K.W.; Hung, Y.T.; Chang, Y.L. An accessibility-based integrated measure of relative spatial equity in urban public facilities. Cities 2005, 22, 424–435. [Google Scholar] [CrossRef]
  49. Kronenberg, J.; Haase, A.; Laszkiewicz, E.; Antal, A.; Baravikova, A.; Biernacka, M.; Dushkova, D.; Filcak, R.; Haase, D.; Ignatieva, M.; et al. Environmental justice in the context of urban green space availability, accessibility, and attractiveness in postsocialist cities. Cities 2020, 106, 102862. [Google Scholar] [CrossRef]
  50. Beiler, M.O.; Mohammed, M. Exploring transportation equity: Development and application of a transportation justice framework. Transp. Res. Part D-Transp. Environ. 2016, 47, 285–298. [Google Scholar] [CrossRef]
  51. Gu, C.; Kesteloot, C. Social polarisation and segregation phenomenon in Beijing. Acta Geogr. Sin. 1997, 52, 385–393. [Google Scholar]
  52. Feng, J.; Zhong, Y. Restructuring of social space in Beijing from 2000 to 2010. Acta Geogr. Sin. 2018, 73, 711–737. [Google Scholar]
  53. Huang, X.; Chen, Z. The retail business structure of the metro site based on the information entropy–a case study of the 15 subway site in Guangzhou. Econ. Geogr. 2014, 3, 38–44. [Google Scholar]
  54. Ebdon, D. Statistics in Geography; Blackwell Publishing: Hoboken, NJ, USA, 1985. [Google Scholar]
  55. Wenhao, Y.; Tinghua, A. The visualization and analysis of POI features under network space supported by kernel density estimation. Acta Geod. Cartogr. Sin. 2015, 44, 82. [Google Scholar]
  56. Borruso, G. Network density estimation: A GIS approach for analysing point patterns in a network space. Trans. GIS 2008, 12, 377–402. [Google Scholar] [CrossRef]
  57. Duan, Y.; Liu, Y.; Liu, X.; Wang, H. Identification of polycentric urban structure of central Chongqing using points of interest Big Data. J. Nat. Resour. 2018, 33, 788–800. [Google Scholar]
  58. Lefever, D.W. Measuring geographic concentration by means of the standard deviational ellipse. Am. J. Sociol. 1926, 32, 88–94. [Google Scholar] [CrossRef]
  59. Zhao, L.; Zhao, Z. Projecting the spatial variation of economic based on the specific ellipses in China. Sci. Geogr. Sin. 2014, 34, 979–986. [Google Scholar]
  60. Wang, J.; Wang, S.; Li, S.; Feng, K. Coupling analysis of urbanization and energy-environment efficiency: Evidence from Guangdong province. Appl. Energy 2019, 254, 113650. [Google Scholar] [CrossRef]
  61. Neutens, T.; Delafontaine, M.; Scott, D.M.; De Maeyera, P. A GIS-based method to identify spatiotemporal gaps in public service delivery. Appl. Geogr. 2012, 32, 253–264. [Google Scholar] [CrossRef] [Green Version]
  62. Nordberg, K. Spatial Justice and local capability in rural areas. J. Rural Stud. 2020, 78, 47–58. [Google Scholar] [CrossRef]
  63. Sun, F.; Zhang, J.; Ma, J.; Wang, C.; Hu, S.; Xu, D. Evolution of the Spatial-Temporal Pattern and Social Performance Evaluation of Community Sports and Fitness Venues in Shanghai. Int. J. Environ. Res. Public Health 2022, 19, 274. [Google Scholar] [CrossRef]
  64. Fisher, J.B.; Kelly, M.; Romm, J. Scales of environmental justice: Combining GIS and spatial analysis for air toxics in West Oakland, California. Health Place 2006, 12, 701–714. [Google Scholar] [CrossRef]
  65. Xu, F.; Hu, M.; La, L.; Wang, J.; Huang, C. The influence of neighbourhood environment on Airbnb: A geographically weighed regression analysis. Tour. Geogr. 2020, 22, 192–209. [Google Scholar] [CrossRef]
  66. Greater London Authority. London Borough Profiles and Atlas. Available online: https://data.london.gov.uk/dataset/london-borough-profiles (accessed on 20 April 2022).
  67. Lees, L.; Ferreri, M. Resisting gentrification on its final frontiers: Learning from the Heygate Estate in London (1974–2013). Cities 2016, 57, 14–24. [Google Scholar] [CrossRef] [Green Version]
  68. Liu, Y.; Wu, F.; Liu, Y.; Li, Z. Changing neighbourhood cohesion under the impact of urban redevelopment: A case study of Guangzhou, China. Urban Geogr. 2017, 38, 266–290. [Google Scholar] [CrossRef] [Green Version]
  69. Zhao, P. Too complex to be managed? New trends in peri-urbanisation and its planning in Beijing. Cities 2013, 30, 68–76. [Google Scholar] [CrossRef]
  70. Times, G. Construction of 50 Key Villages in the Urban-Rural Fringe of Beijing. Available online: https://china.huanqiu.com/article/9CaKrnJvCIx (accessed on 20 April 2022).
  71. McEntee, J.C.; Ogneva-Himmelberger, Y. Diesel particulate matter, lung cancer, and asthma incidences along major traffic corridors in MA, USA: A GIS analysis. Health Place 2008, 14, 817–828. [Google Scholar] [CrossRef] [PubMed]
  72. Hashem, I.A.T.; Chang, V.; Anuar, N.B.; Adewole, K.; Yaqoob, I.; Gani, A.; Ahmed, E.; Chiroma, H. The role of big data in smart city. Int. J. Inf. Manag. 2016, 36, 748–758. [Google Scholar] [CrossRef] [Green Version]
  73. Henar Salas-Olmedo, M.; Moya-Gomez, B.; Carlos Garcia-Palomares, J.; Gutierrez, J. Tourists’ digital footprint in cities: Comparing Big Data sources. Tour. Manag. 2018, 66, 13–25. [Google Scholar] [CrossRef] [Green Version]
  74. Li, J.; Li, J.; Yuan, Y.; Li, G. Spatiotemporal distribution characteristics and mechanism analysis of urban population density: A case of Xi’an, Shaanxi, China. Cities 2019, 86, 62–70. [Google Scholar] [CrossRef]
  75. Zhao, P.; Hu, H. Geographical patterns of traffic congestion in growing megacities: Big data analytics from Beijing. Cities 2019, 92, 164–174. [Google Scholar] [CrossRef]
  76. Liu, X.; Yan, X.; Wang, W.; Titheridge, H.; Wang, R.; Liu, Y. Characterizing the polycentric spatial structure of Beijing Metropolitan Region using carpooling big data. Cities 2021, 109, 103040. [Google Scholar] [CrossRef]
  77. Cremer, H.; Dekerchove, A.M.; Thisse, J.F. An economic-theory of public facilities in space. Math. Soc. Sci. 1985, 9, 249–262. [Google Scholar] [CrossRef]
  78. Onokerhoraye, A.G. A conceptual framework for the location of public facilities in the urban areas of developing countries: The Nigerian case. Socio-Econ. Plan. Sci. 1976, 10, 237–240. [Google Scholar] [CrossRef]
  79. Warr, P.; Menon, J.; Rasphone, S. Public services and the poor in Laos. World Dev. 2015, 66, 371–382. [Google Scholar] [CrossRef]
  80. Kawakami, N.; Winkleby, M.; Skog, L.; Szulkin, R.; Sundquist, K. Differences in neighborhood accessibility to health-related resources: A nationwide comparison between deprived and affluent neighborhoods in Sweden. Health Place 2011, 17, 132–139. [Google Scholar] [CrossRef]
  81. Estoque, R.C. A Review of the Sustainability Concept and the State of SDG Monitoring Using Remote Sensing. Remote Sens. 2020, 12, 1770. [Google Scholar] [CrossRef]
  82. Pereira, R.H.M.; Schwanen, T.; Banister, D. Distributive justice and equity in transportation. Transp. Rev. 2017, 37, 170–191. [Google Scholar] [CrossRef]
  83. Zacharias, J.; Sun, Z.; Chuang, L.; Lee, F. The hutong urban development model compared with contemporary suburban development in Beijing. Habitat Int. 2015, 49, 260–265. [Google Scholar] [CrossRef]
Figure 1. Multidimensional perception of SJ for LSRs.
Remotesensing 14 02031 g001
Figure 2. An overview of Beijing.
Remotesensing 14 02031 g002
Figure 3. Number of POIs of LSRs and their spatial equilibrium parameters in downtown Beijing.
Remotesensing 14 02031 g003
Figure 4. Kernel density analysis of LSRs in downtown Beijing: (a) Catering; (b) Accommodation; (c) Dyeing; (d) Beauty salon; (e) Appliance repair; (f) Portrait photography.
Remotesensing 14 02031 g004aRemotesensing 14 02031 g004b
Figure 5. Standard deviational ellipse analysis of LSRs in downtown Beijing; (a) Overall picture; (b) Detailed picture.
Remotesensing 14 02031 g005aRemotesensing 14 02031 g005b
Figure 6. Coupling and Coordination Degree of LSRs in downtown Beijing: (a) Catering; (b) Accommodation; (c) Dyeing; (d) Beauty salon; (e) Appliance repair; (f) Portrait photography.
Remotesensing 14 02031 g006aRemotesensing 14 02031 g006b
Table 1. Classification of the degree of coupling coordination between LSRs and residents’ needs.
DCoupling Coordination State
0.8 ≤ D 1Highly coupled coordination
0.6 ≤ D 0.8Moderate coupled coordination
0.4 ≤ D 0.6Low coupled coordination
0.2 ≤ D 0.4Moderate uncoupled coordination
0 ≤ D 0.2Severely uncoupled coordination
Table 2. Characteristics of POI data of LSRs in downtown Beijing.
CategoryContentNumberProportion (%)
CateringChinese restaurant, foreign restaurant, casual restaurant, cold drink shop, dessert shop, fast food restaurant, coffee shop, pastry shop, tea house, etc.42,53051.4362
AccommodationResidential areas, hotels, tourist hotels, business residences, and commercial and residential buildings, etc.15,67718.9599
DyeingLaundry22042.6655
Beauty salonsBeauty salon store17,23920.8490
Appliance RepairAppliance repair store24212.9280
Portrait photographyPhoto print store26143.1614
Total 82,685100
Table 3. Nearest neighbour analysis of LSRs in downtown Beijing.
NameAverage
Observation Distance (di)
Expected Average Distance
(de)
Nearest
Neighbour Index
(R)
Z-Score
Catering34.625108.30.32−268.393
Accommodation116.455173.5980.671−78.846
Dyeing295.407440.3370.671−29.561
Beauty salons61.962167.0850.371−158.032
Appliance Repair249.173416.0870.599−37.761
Portrait photography223.872383.4320.584−40.702
Table 4. Standard deviational ellipse parameter of LSRs in downtown Beijing.
CategoryCentre
Longitude (°)
Centre Latitude (°)Perimeter (km)Area
(km2)
Length of Long Axis (km)Length of Short Axis (km)Azimuth (°)
Catering116.40E39.93N68.06360.2312.139.4695.16
Accommodation116.38E39.93N65.83339.0311.569.3398.93
Dyeing 1116.39E39.92N70.10382.6112.469.7888.76
Beauty salon116.39E39.92N68.50363.1812.329.3890.15
Appliance repair116.39E39.92N69.23371.3612.439.5193.58
Portrait photography116.41E39.92N64.60323.2611.608.8791.66
1 Note: Except for the dyeing services, the standard deviation ellipse long axis of other LSRs is on the X axis, and the short axis is on the Y axis.
Publisher’s Note: MDPI stays neutral with regard to jurisdictional claims in published maps and institutional affiliations.

