
Long-Term Temporal and Spatial Monitoring of Cladophora Blooms in Qinghai Lake Based on Multi-Source Remote Sensing Images


Abstract
:1. Introduction
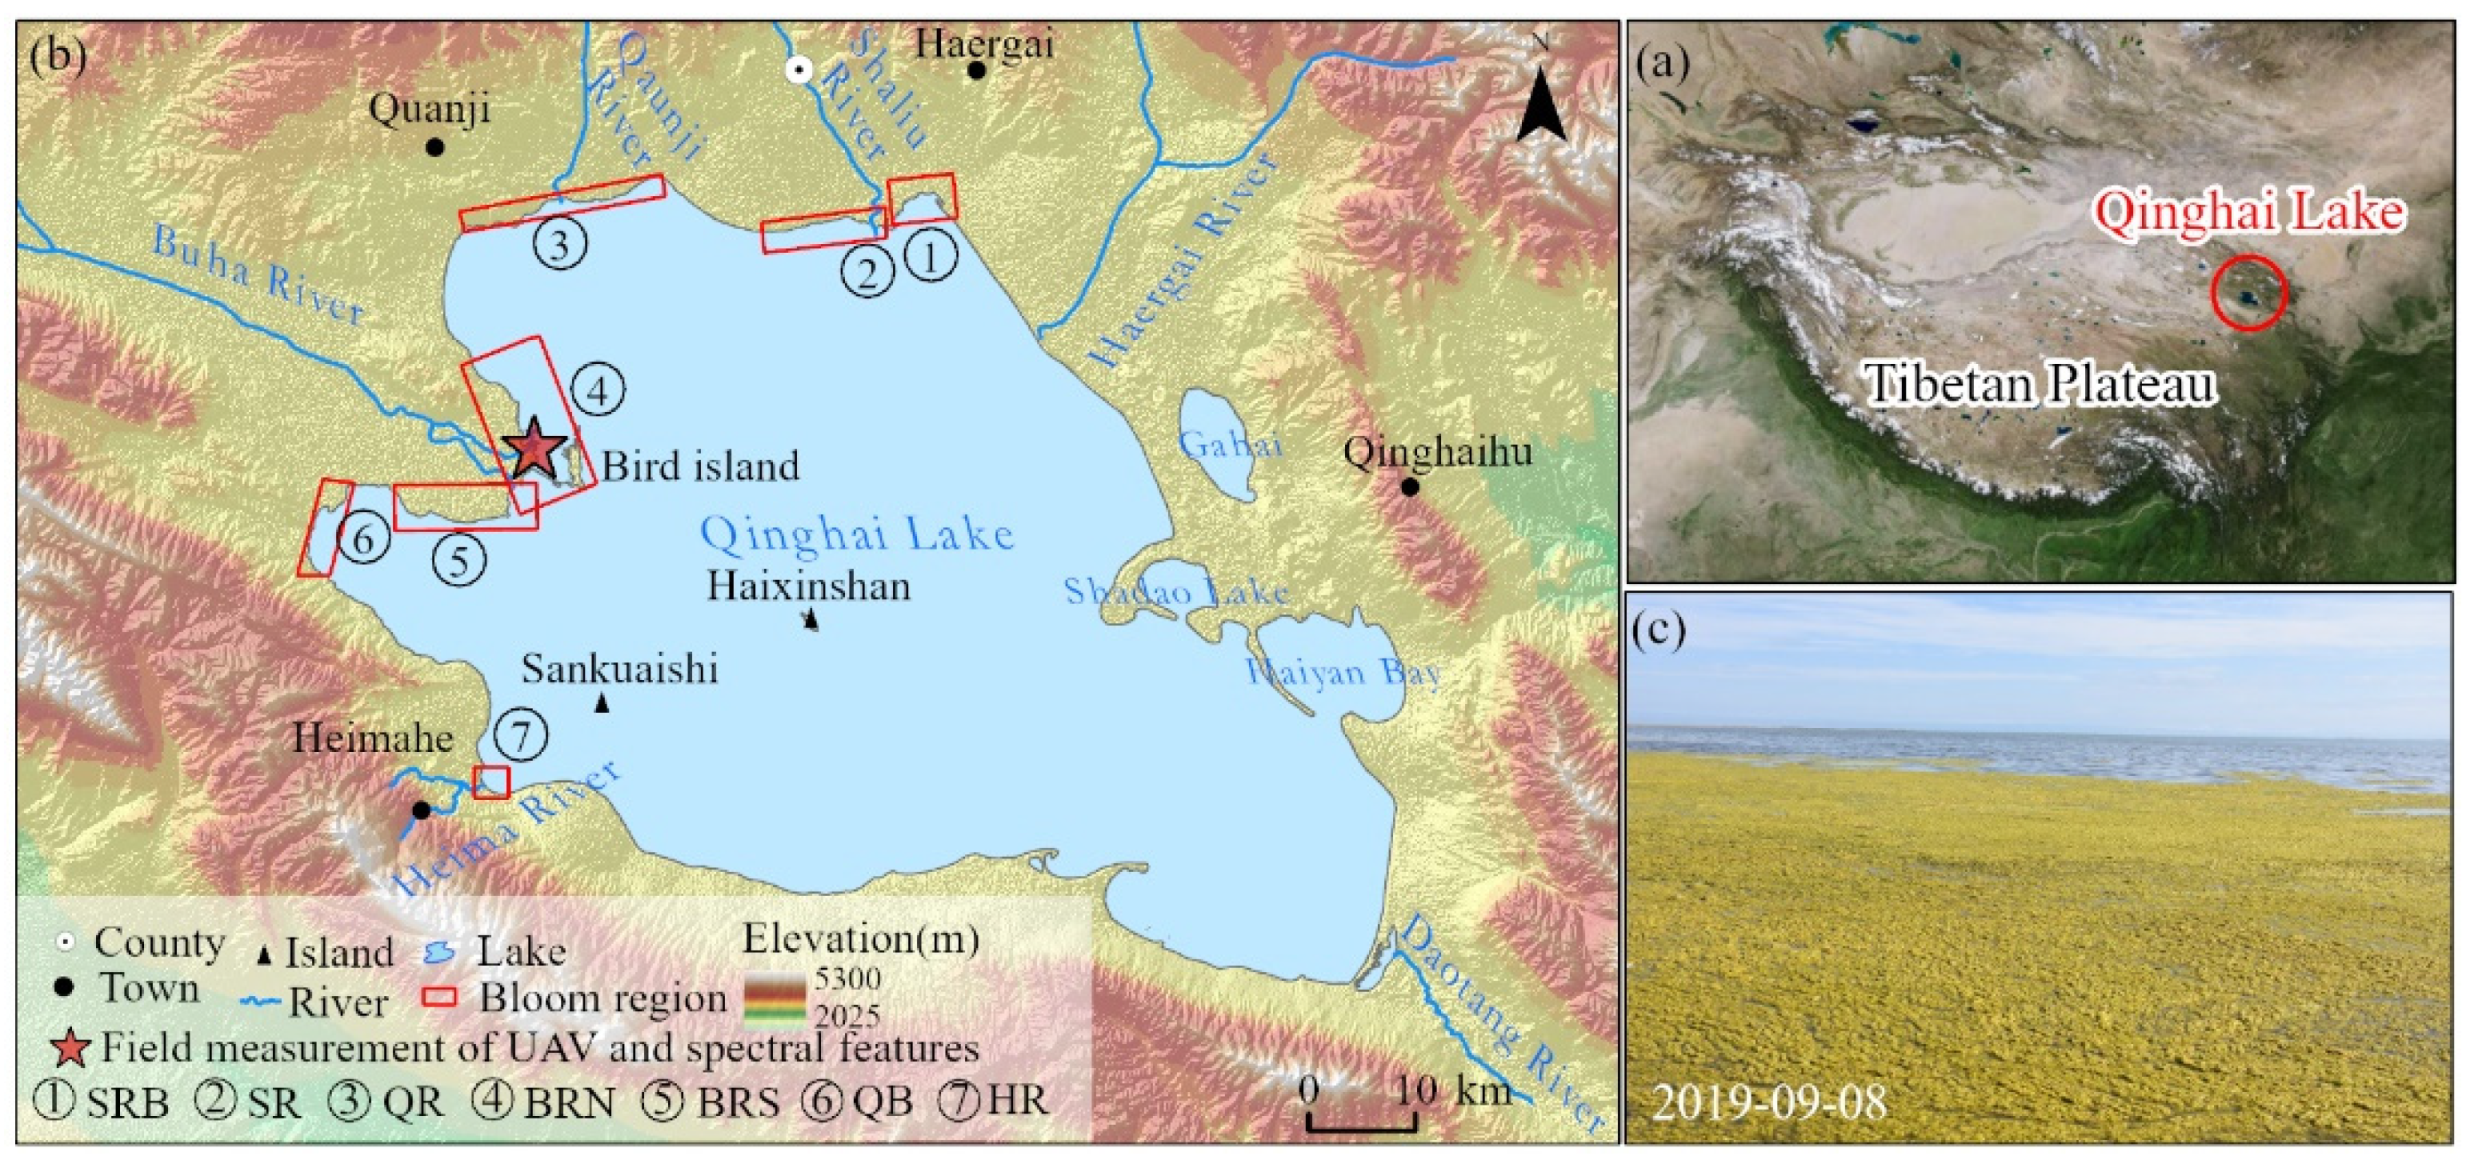
2. Study Area
2.1. Materials and Pre-Processing
2.2. Methods
2.2.1. Land Masking
2.2.2. FCBs Extraction
3. Results
3.1. The Change of FCBs
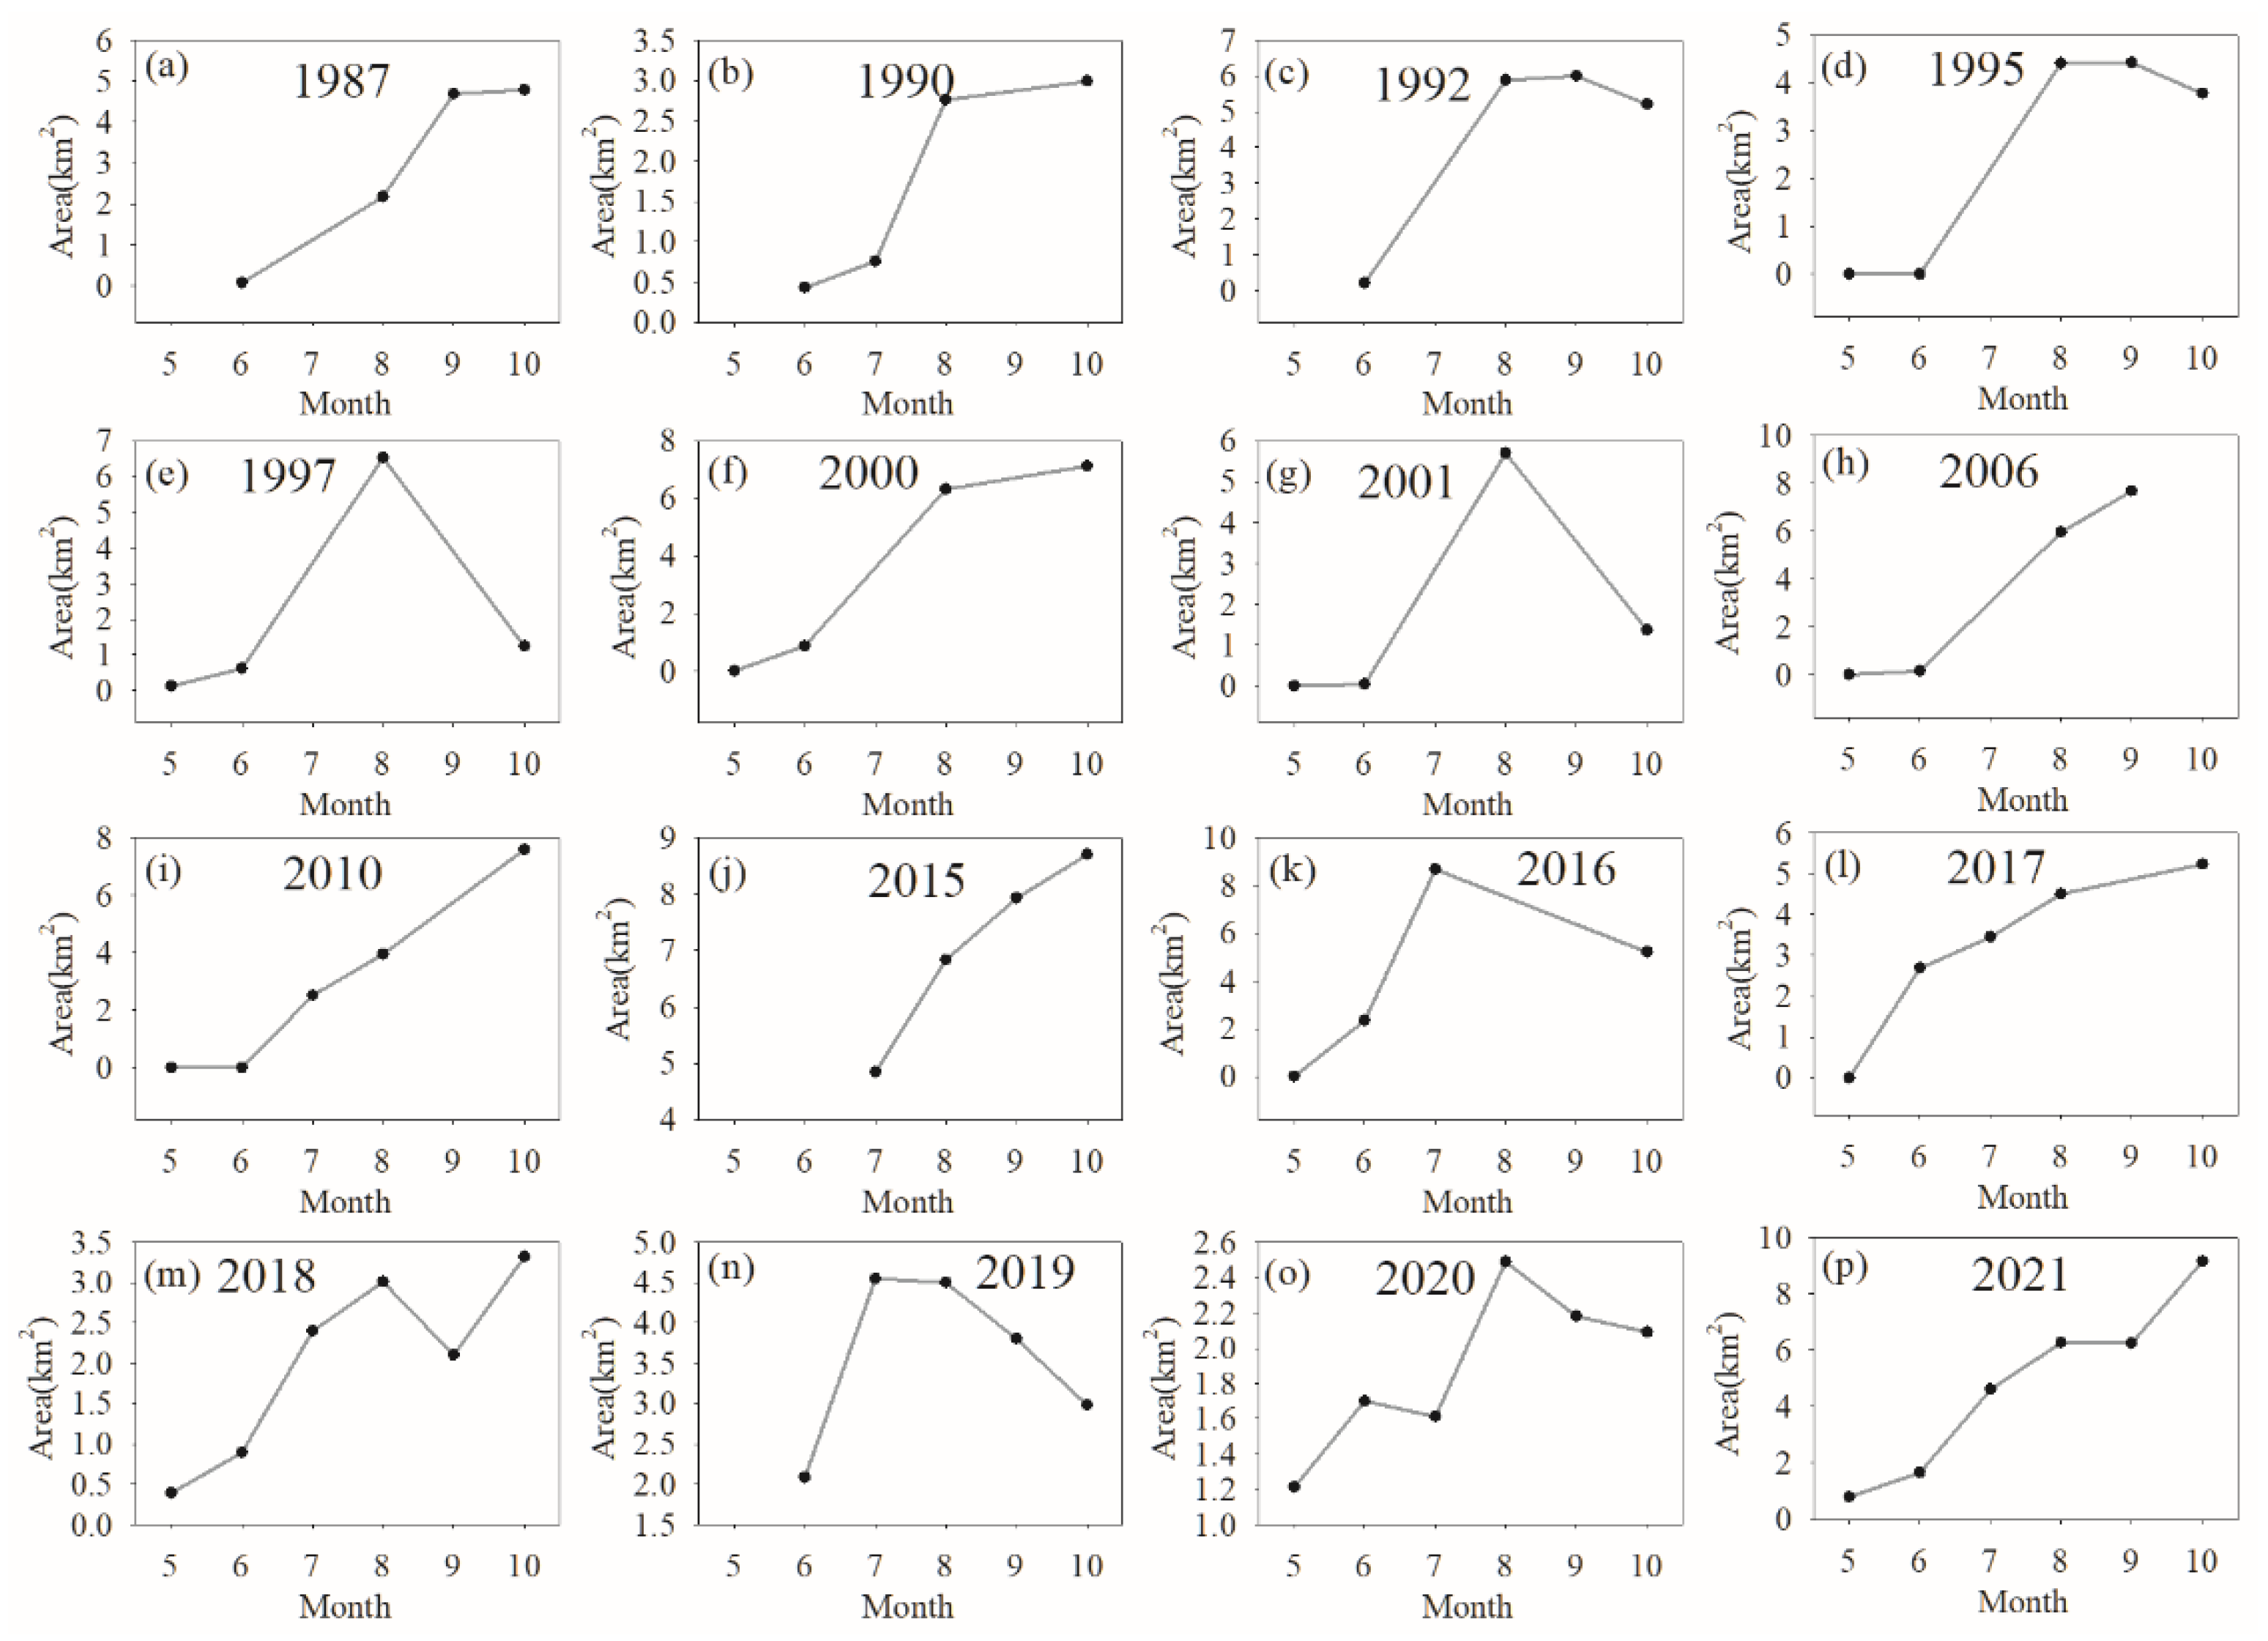
3.1.1. Intra-Annual Change
3.1.2. Inter-Annual Change
3.2. Spatial Pattern
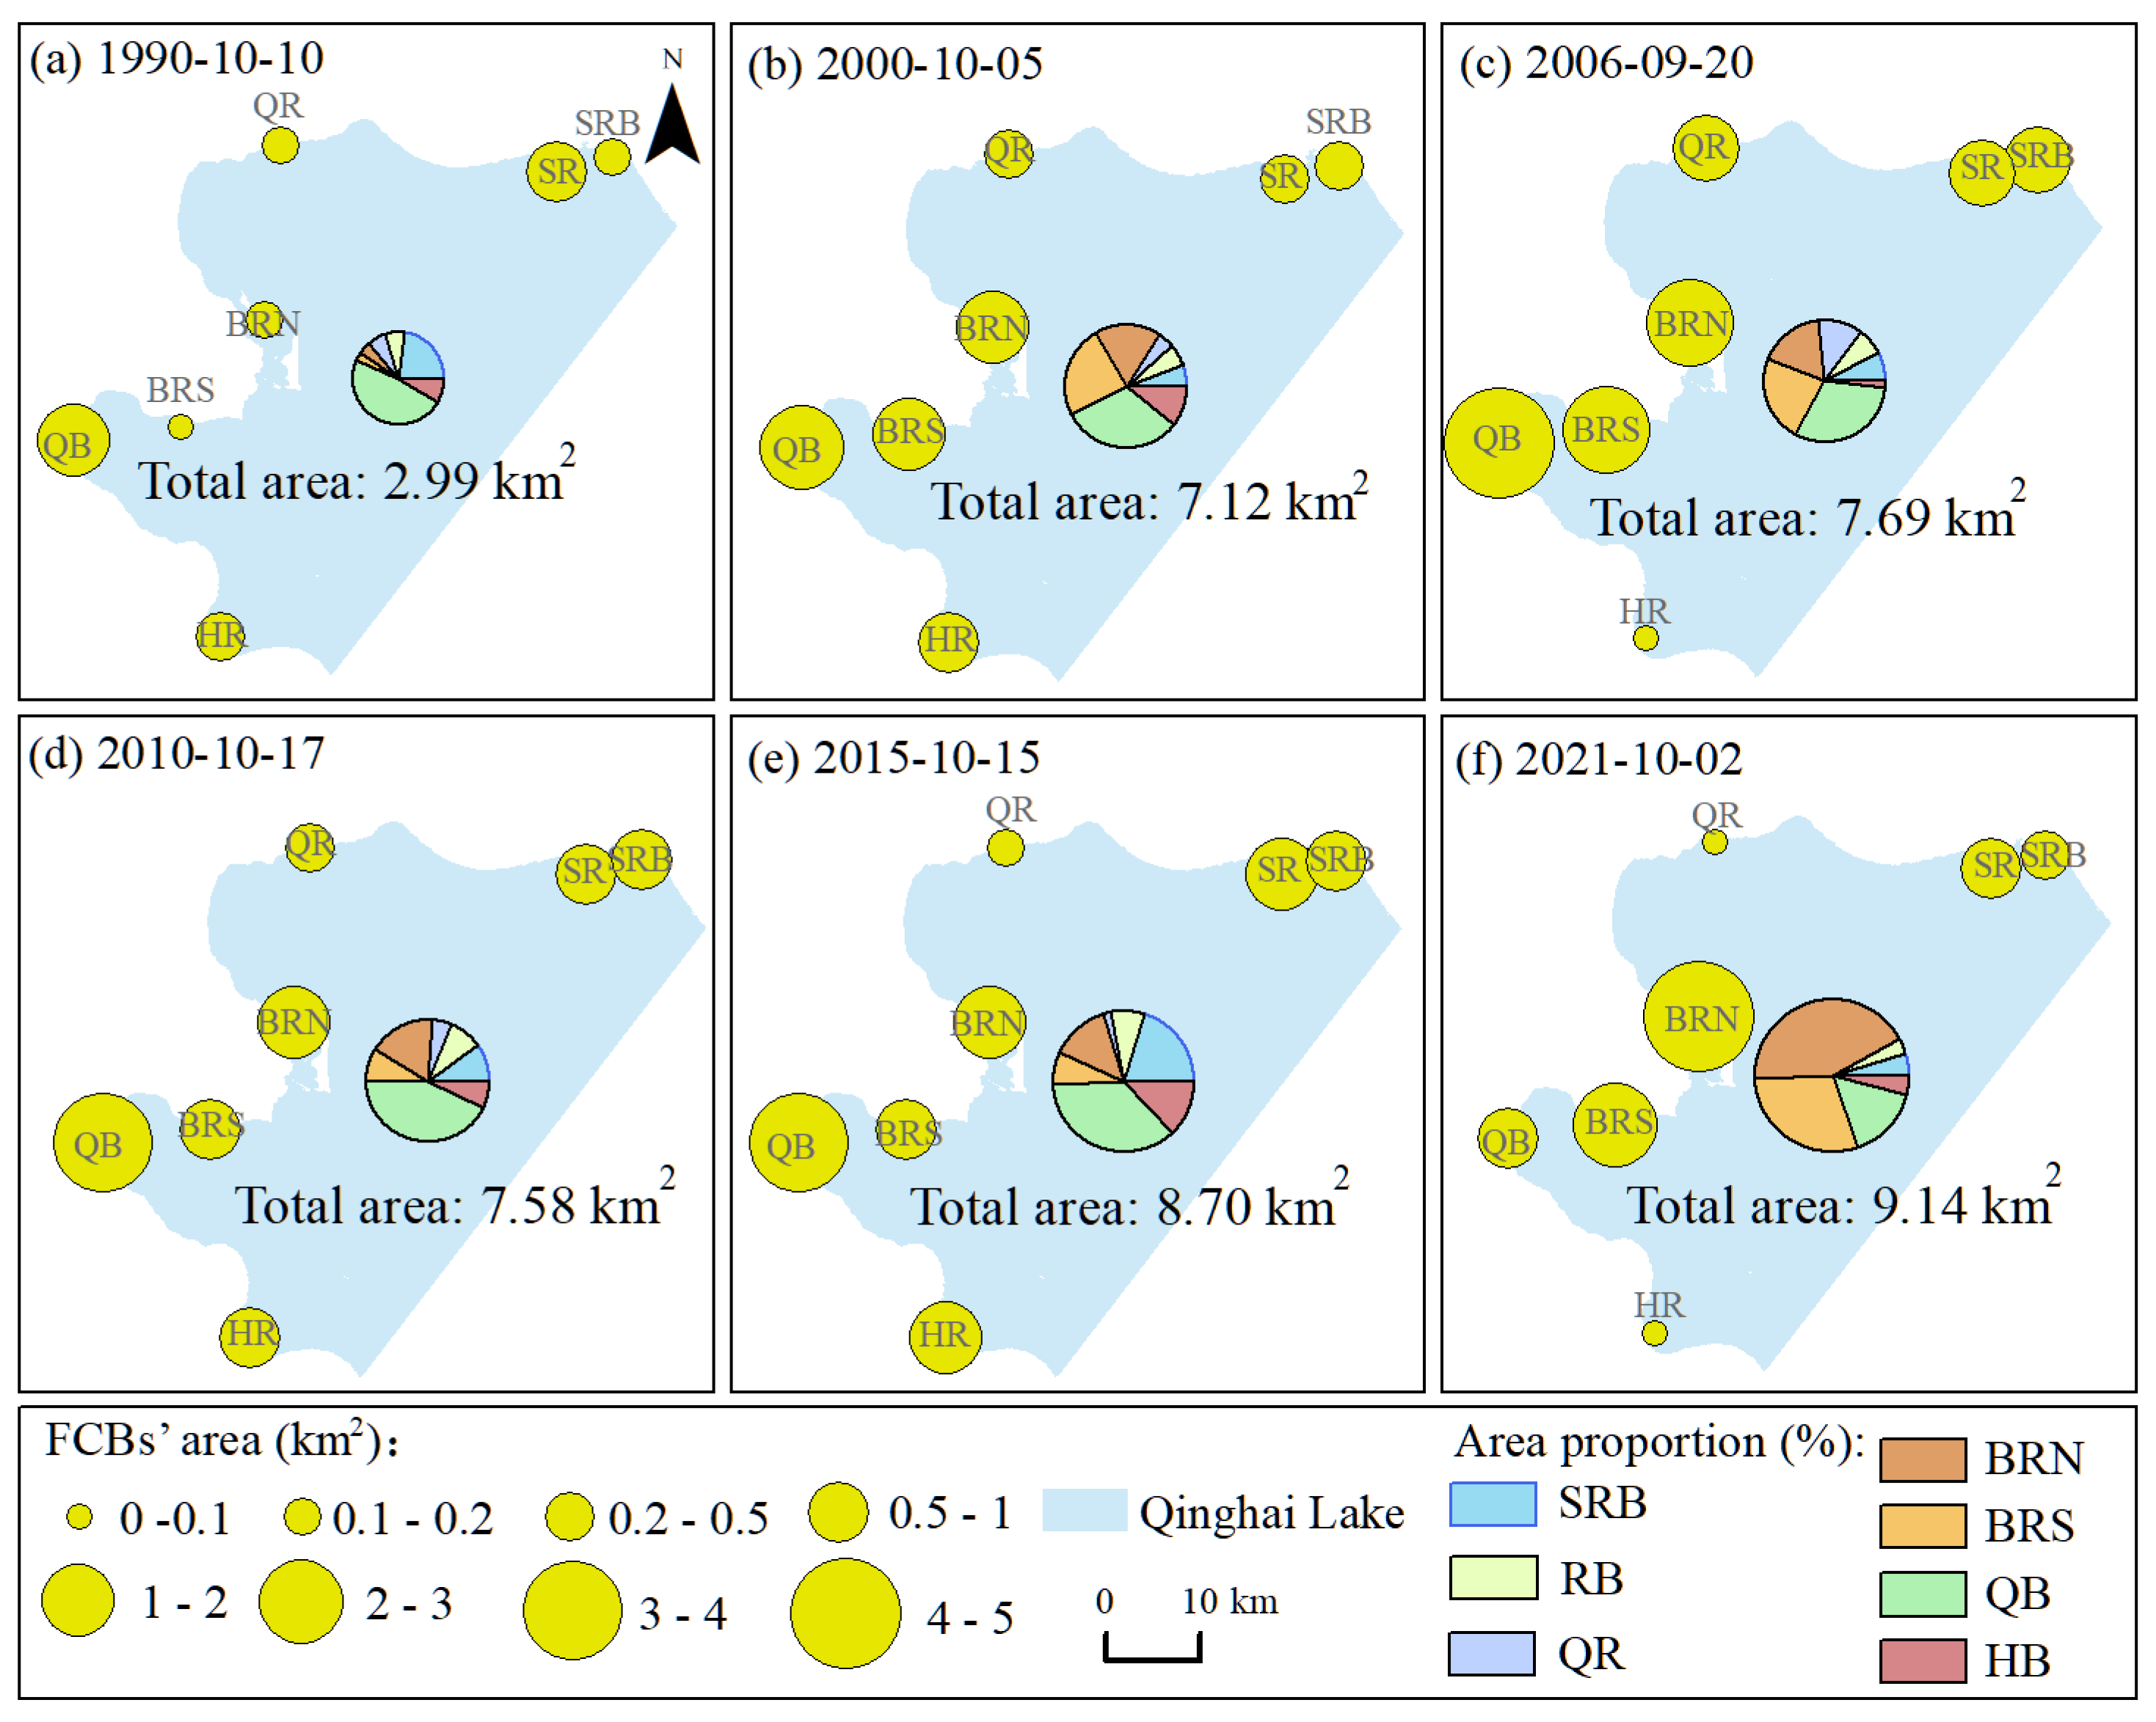
3.2.1. Spatial Distribution
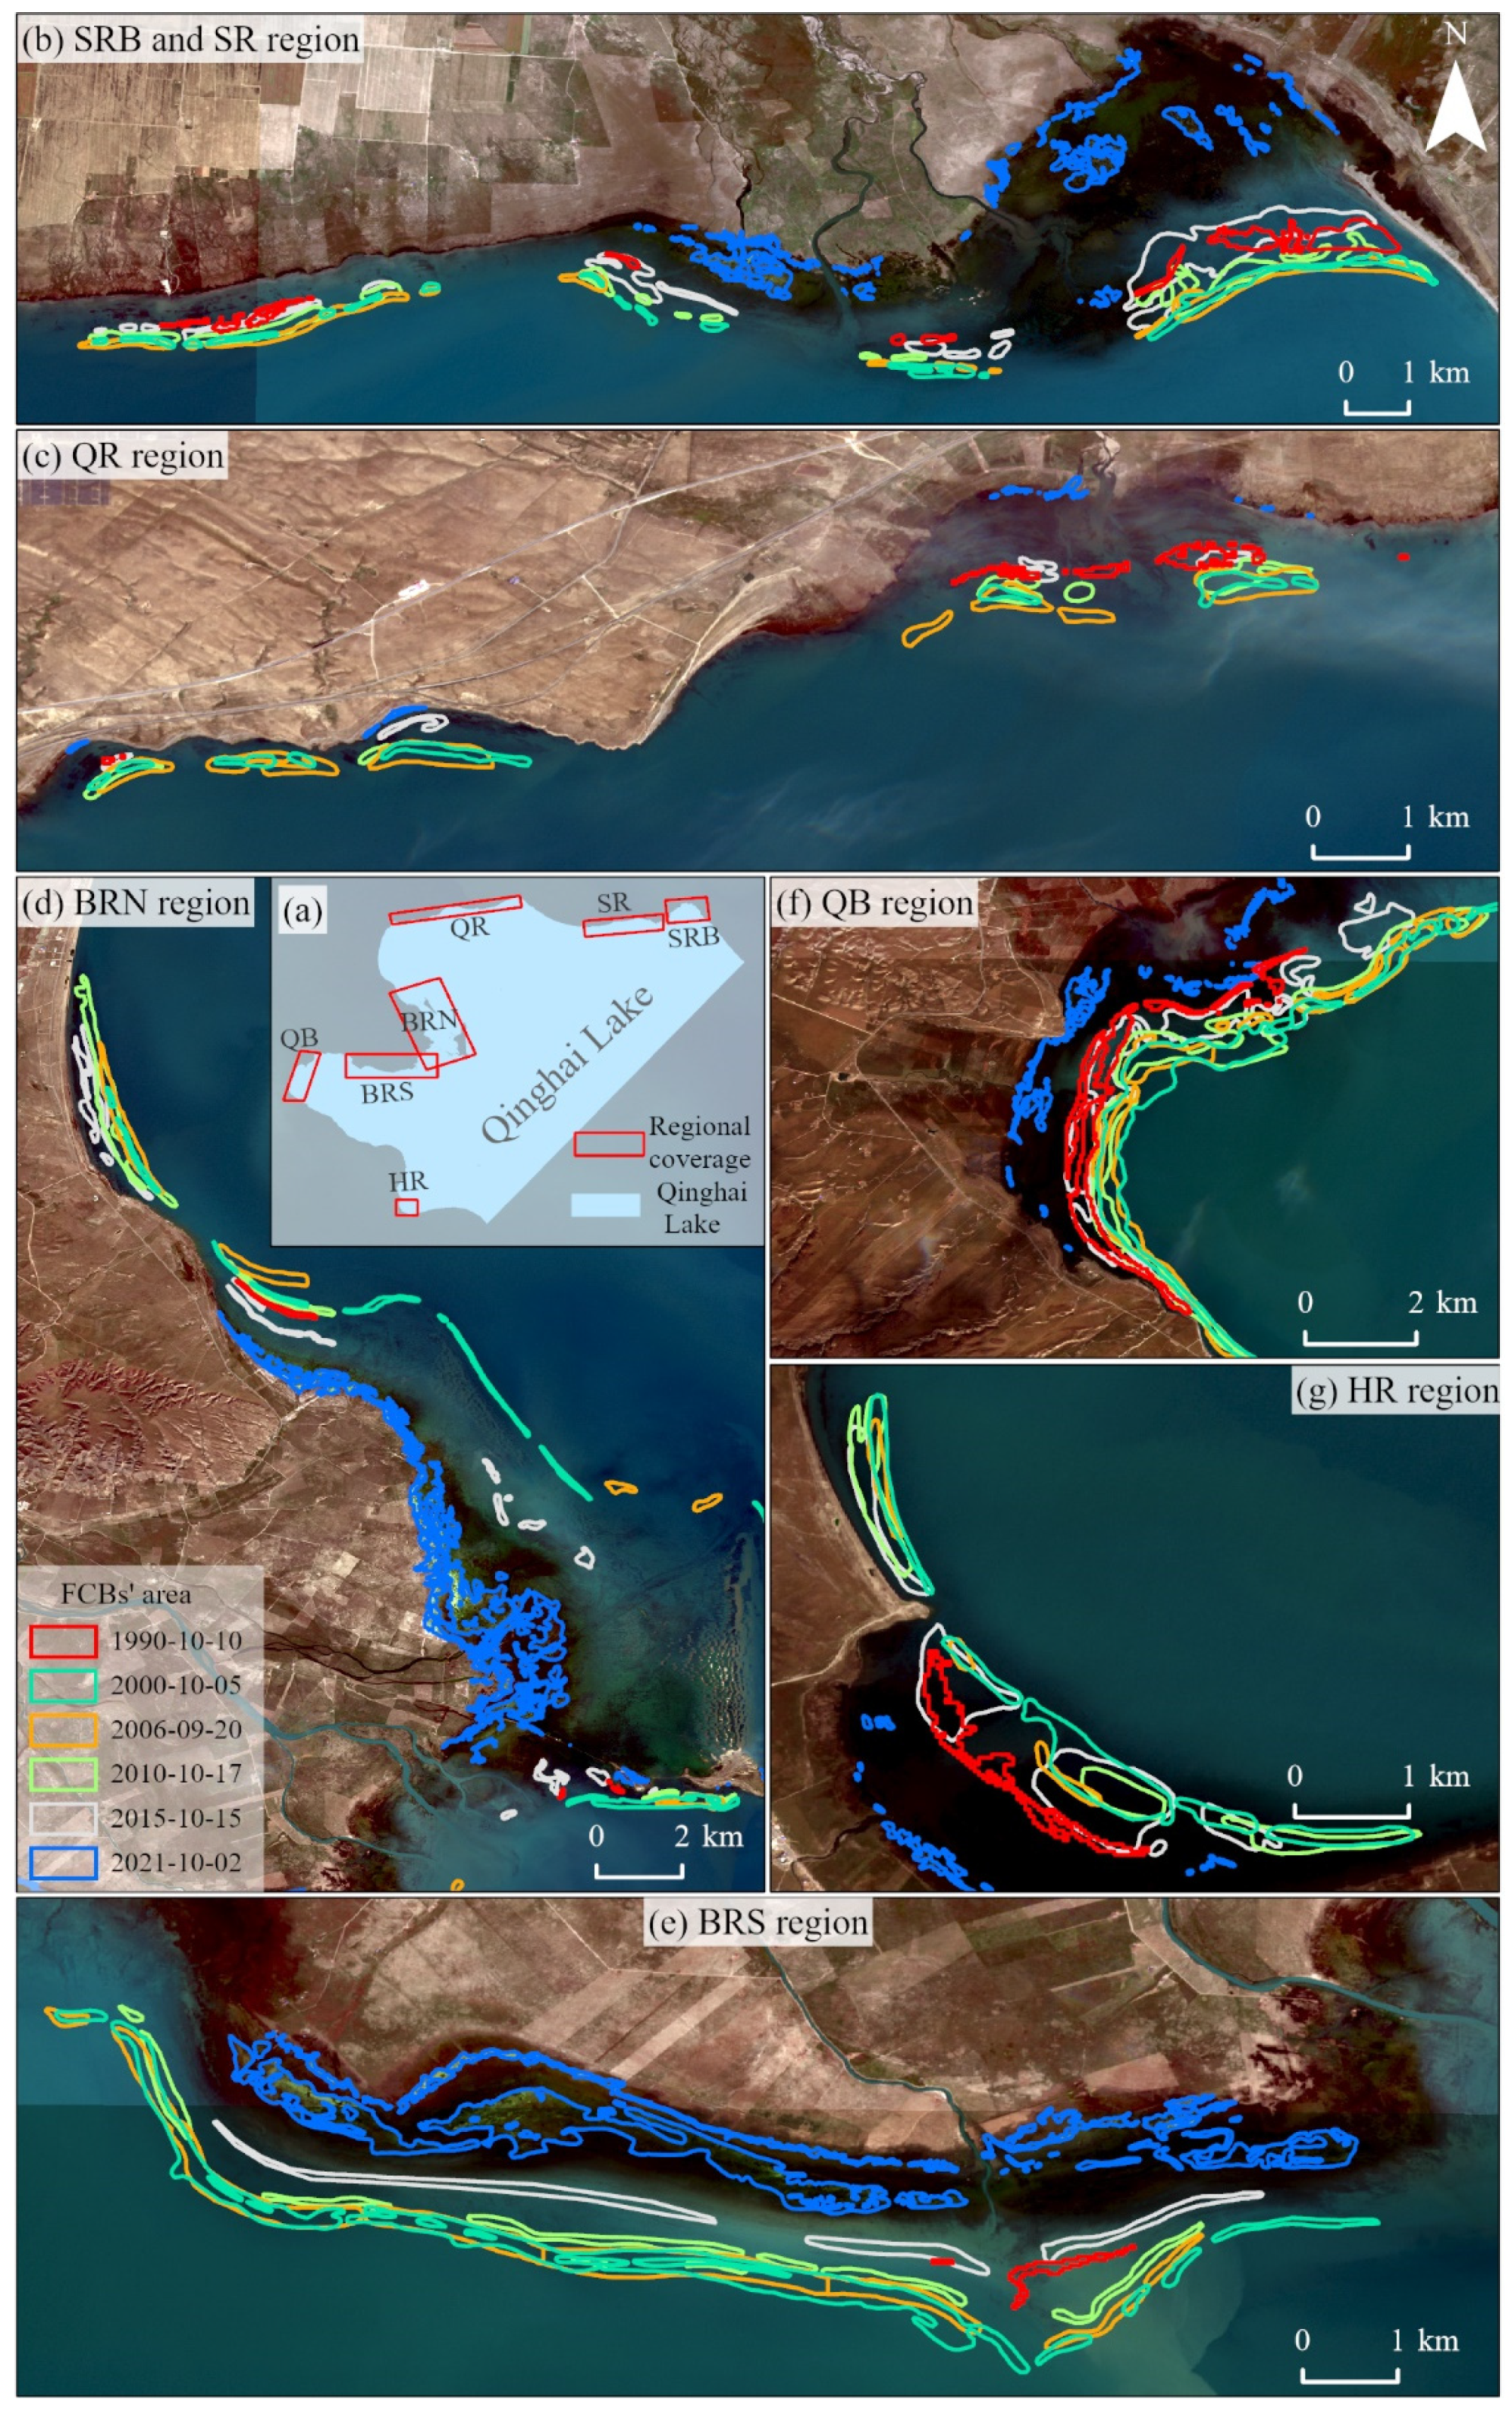
3.2.2. Spatial Change Pattern
4. Discussion
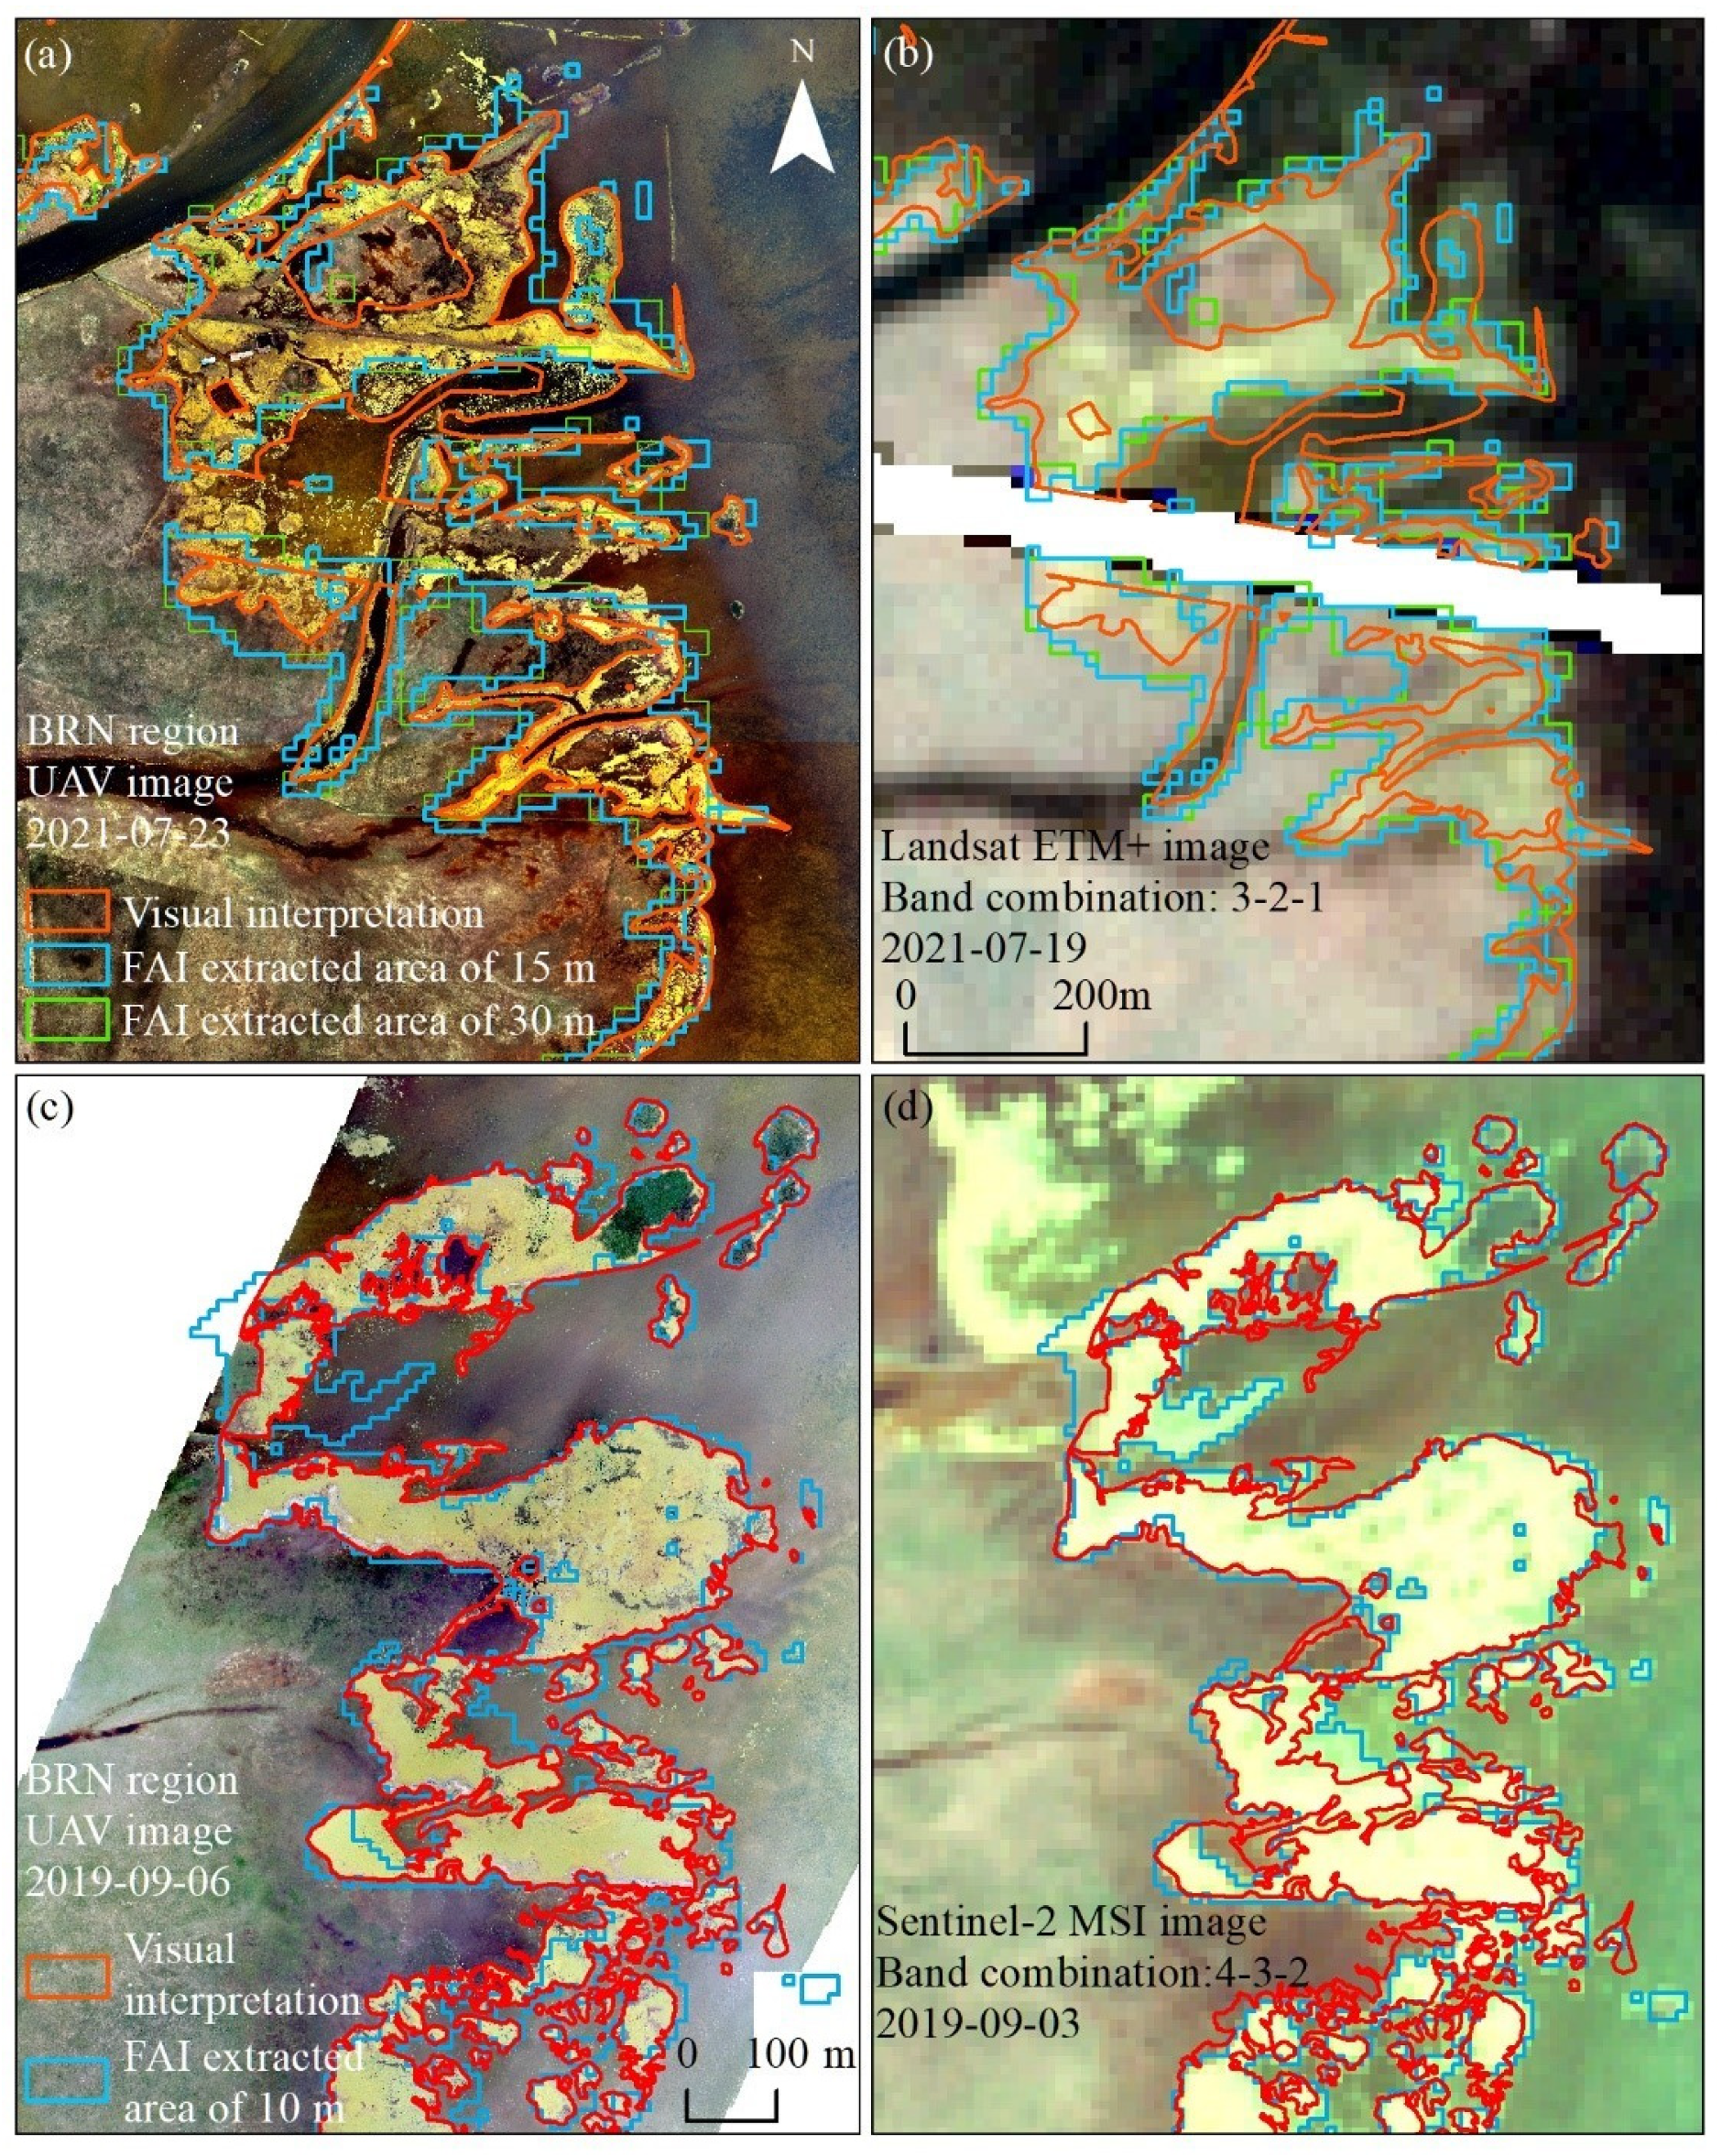
4.1. Accuracy and Consistency Evaluation
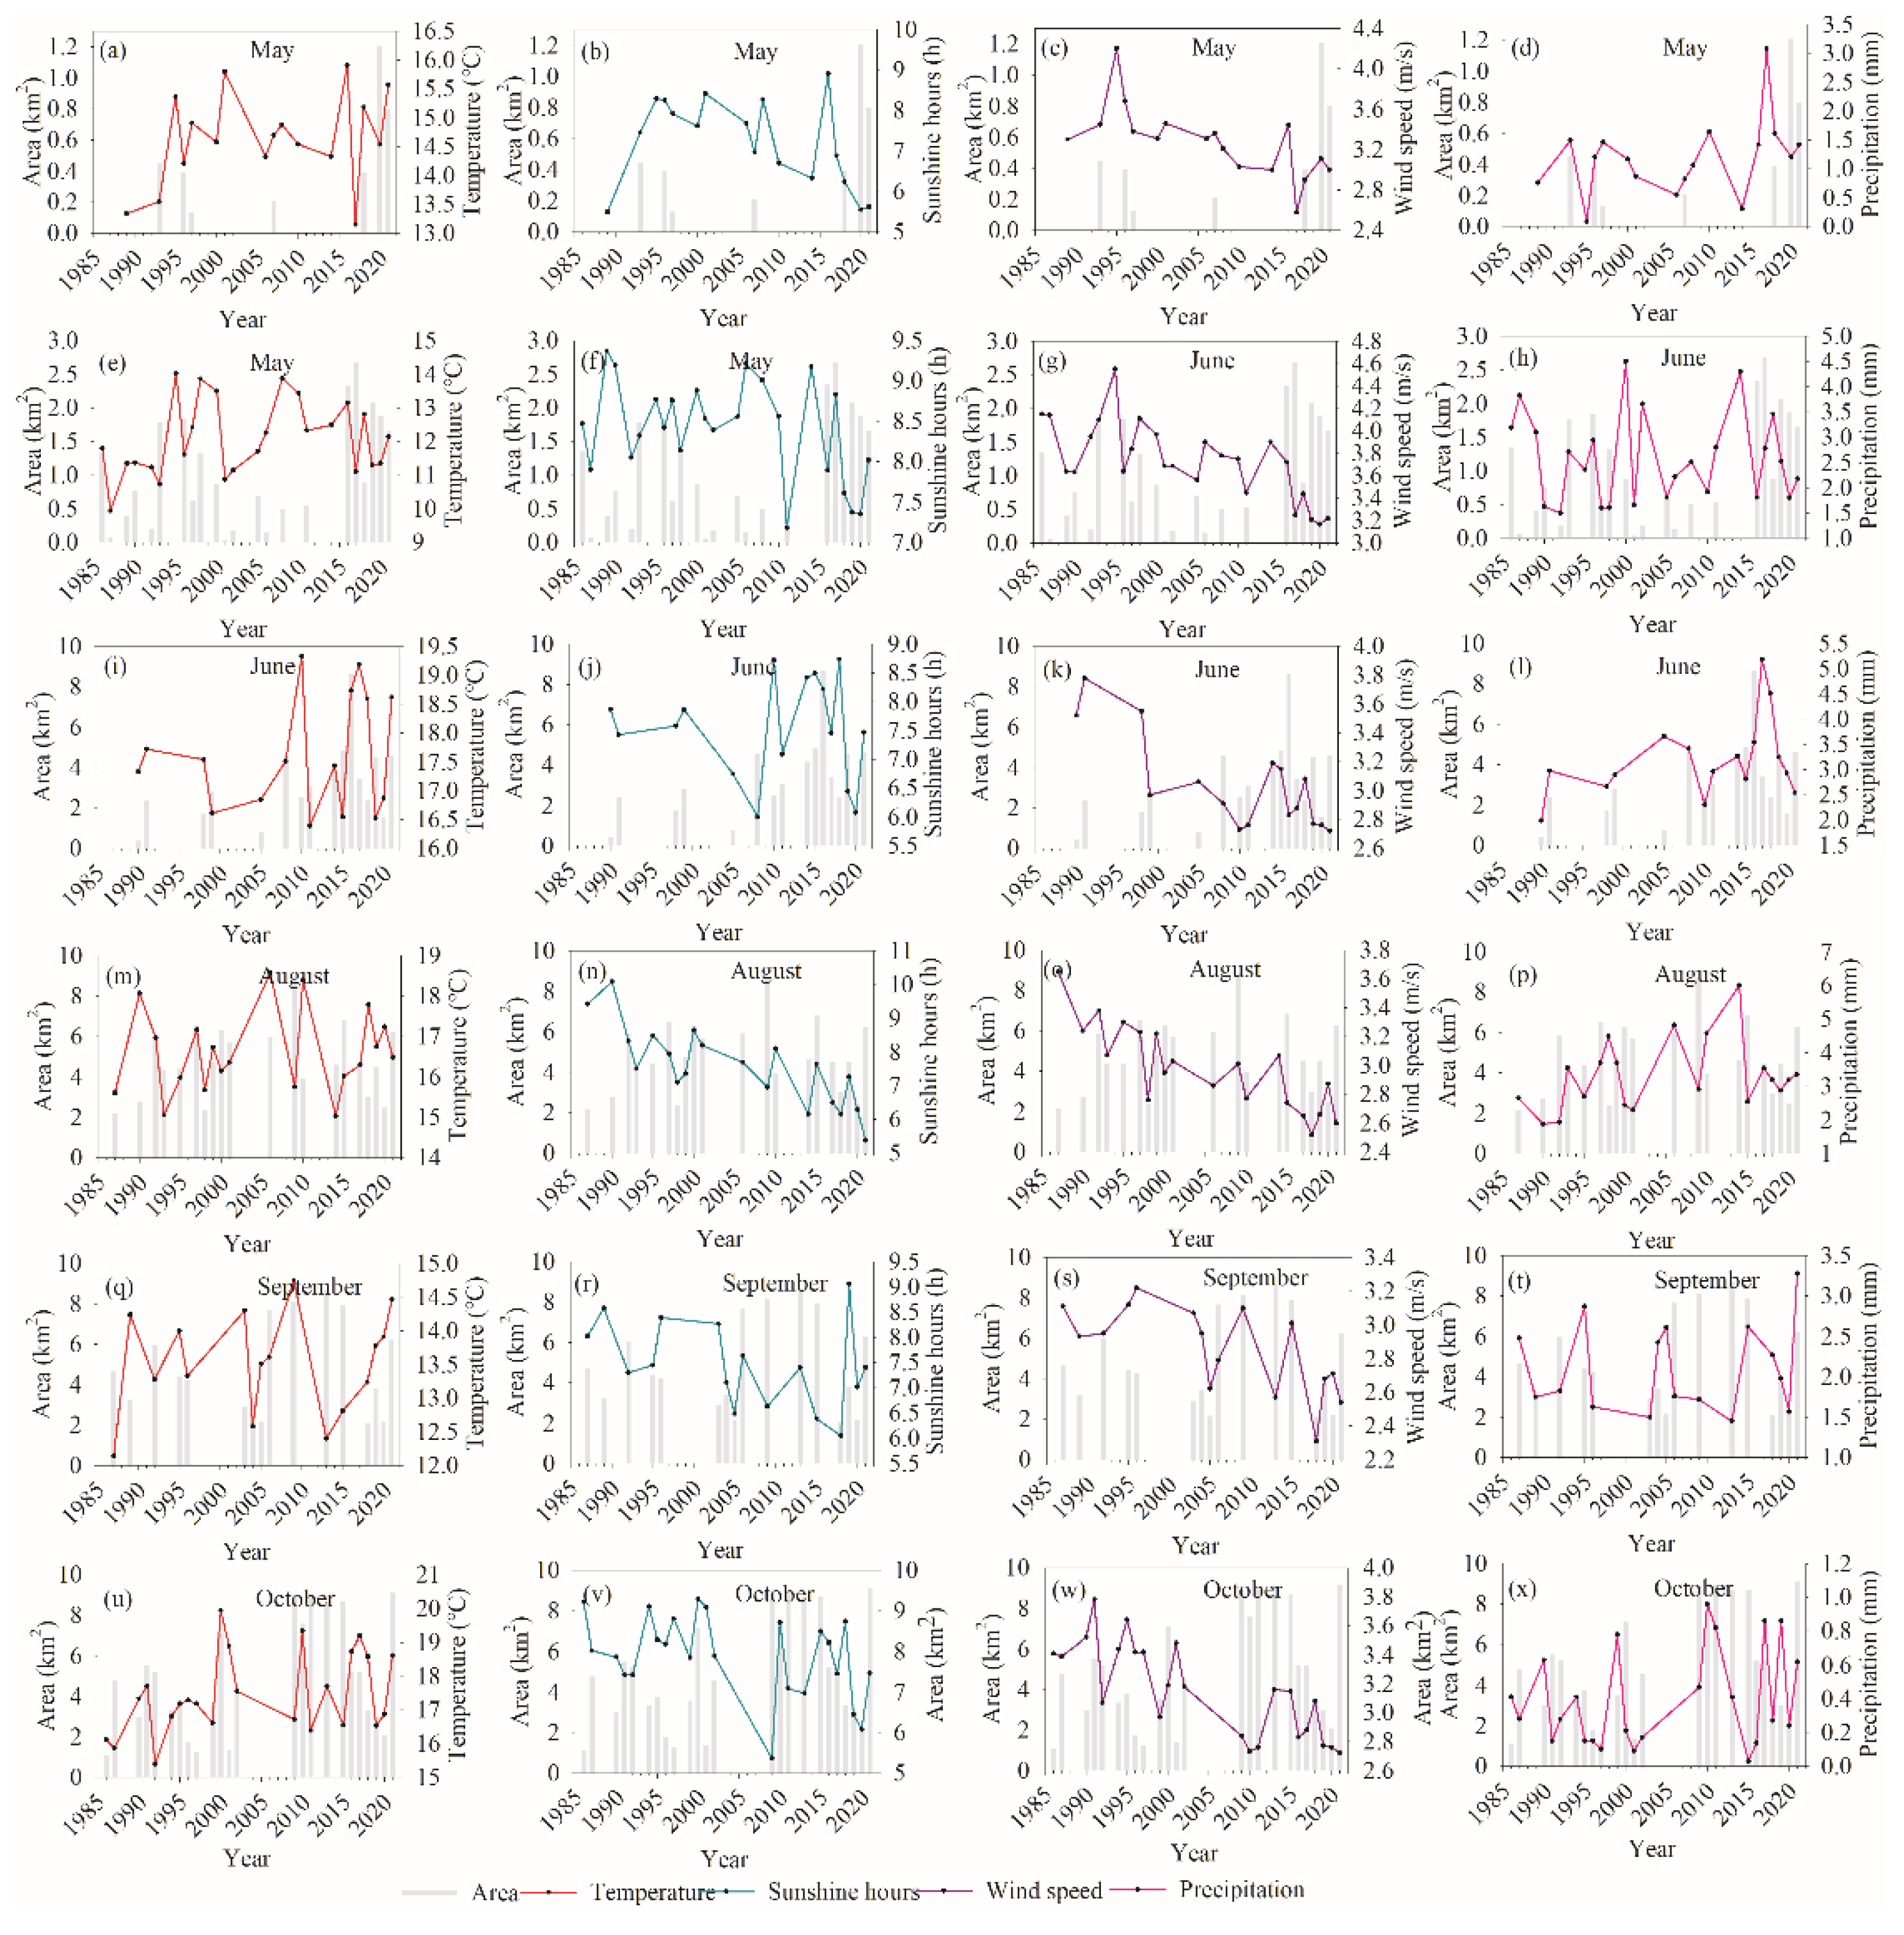
4.2. Driving Forces
5. Conclusions
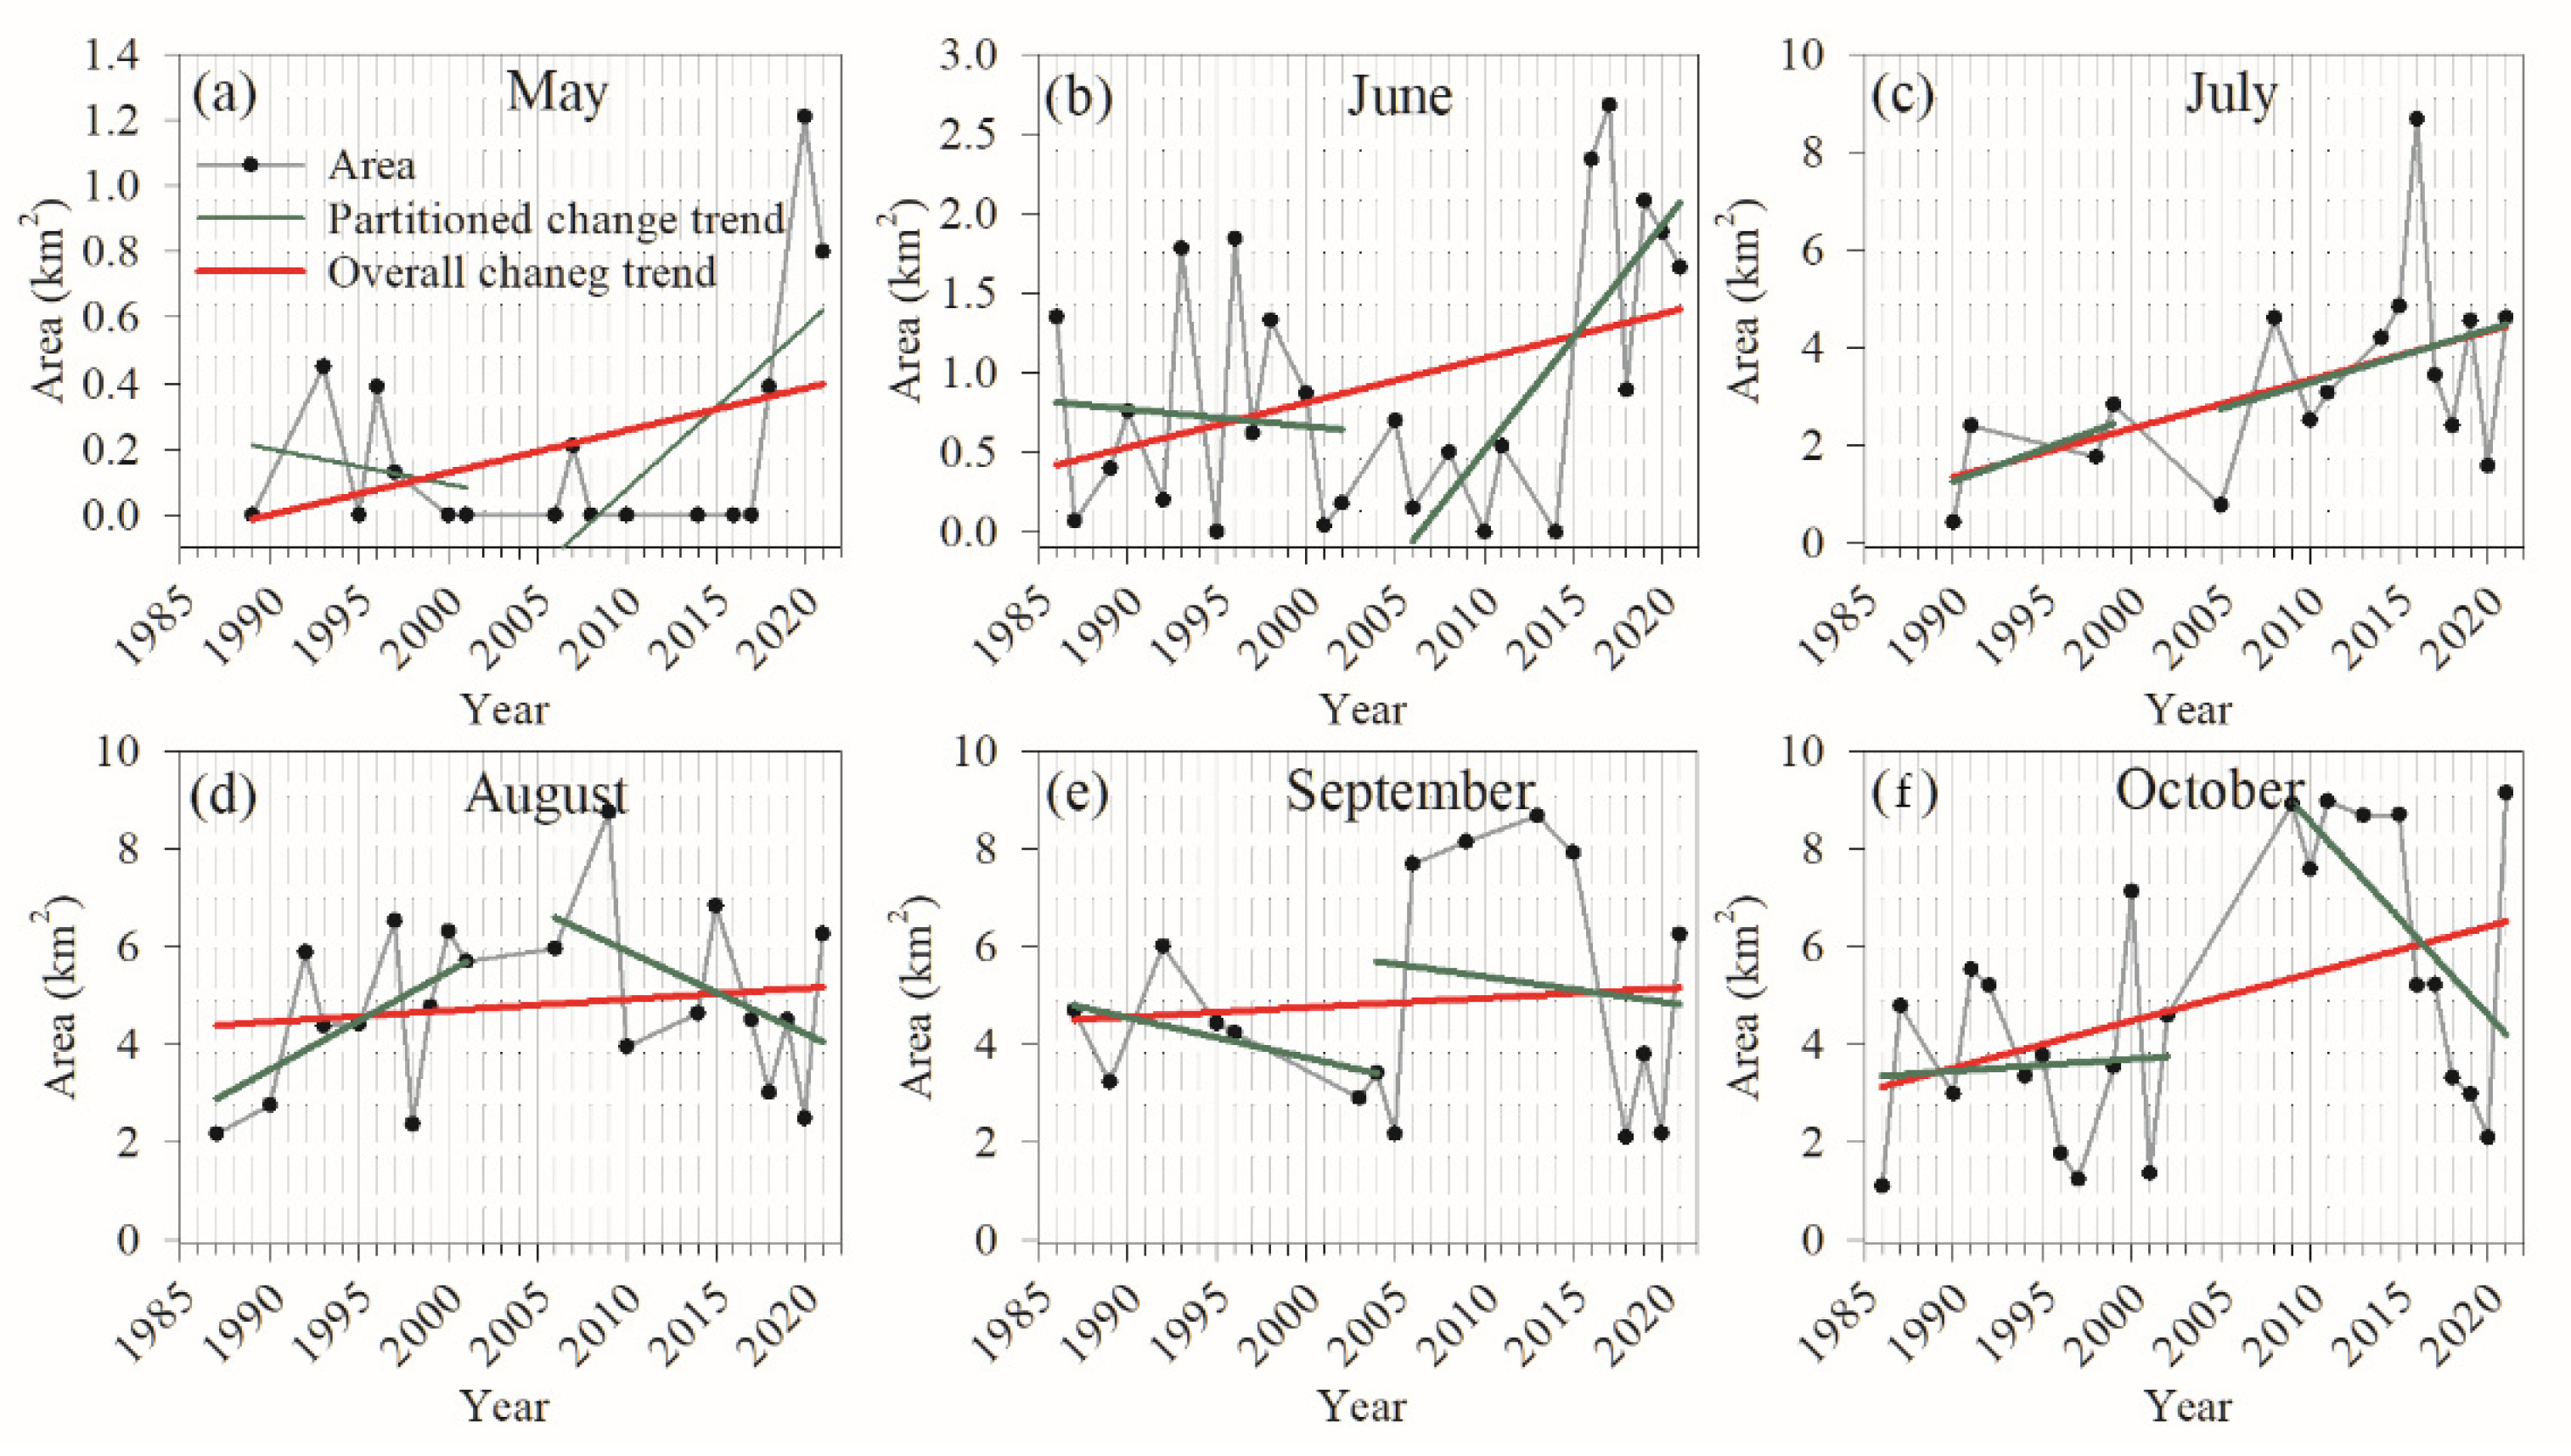
- The area of FCBs in Qinghai Lake from May to October showed a general change trend of starting in May, expanding rapidly from June to August and increasing steadily from September to October, and in fewer years, the FCBs peaked in July or August. From 1986 to 2021, the area of FCBs in Qinghai Lake showed an overall increasing trend in all months, with the largest increase in July at 0.1 km2/a, followed by October at 0.096 km2/a. In particular, each month showed different stages of change, with May and June showing a decrease followed by an increase, July showing a consistent increase, August showing an increase followed by a decrease, and September and October showing a decrease followed by an increase and then a decrease.
- FCBs in Qinghai Lake are mainly distributed in each estuary and lake bay regions on the west and north sides. Over the past 36 years, FCBs area showed a significant increasing trend in the BRN and BRS regions, a slight increase in the SR region and a decreasing trend in the QR region and the HR region.
- Studies of the driving forces of FCBs changes show that the intra-annual variation of FCBs may be due, firstly, to the presence of two types of morphology of Cladophora, attached and floating, and the transformation between the two types takes some time. Second, differences in temperature and light in different months lead to temporal differences in the biomass and morphological transformation of FCBs. The third is the potential influence of the double biomass peak pattern of algae in the northern hemisphere. The correlation between FCBs and meteorological elements was weak or largely uncorrelated, which may also be due to the small sample size. However, the negative correlation between wind speed and algal bloom was manifested in June and October.
- The inundated land caused by rising water levels in Qinghai Lake provided a large amount of substrate for Cladophora to adhere to, which, together with the shallow water environment in the inundated area favoring sunlight and the nutrients released from bird and animal excreta, led to a significant increase in FCBs area in the BRN region, which has become the largest area of FCBs in Qinghai Lake. The salvage measures for FCBs in this region by the Qinghai Lake management agencies showed their effectiveness in controlling the FCBs, resulting in the reduction of FCBs area in 2017–2020. However, more essential governance measures should be explored afterward.
Author Contributions
Funding
Data Availability Statement
Acknowledgments
Conflicts of Interest
References
- Cao, M.; Song, Q.; Jin, E.; Hao, Y.; Zhao, W. A spectral index for the detection of algal blooms using Sentinel-2 Multispectral Instrument (MSI) imagery: A case study of Hulun Lake, China. Int. J. Remote Sens. 2021, 42, 4514–4535. [Google Scholar] [CrossRef]
- Lai, L.; Zhang, Y.; Jing, Y.; Liu, Z. Research progress on remote sensing monitoring of phytoplankton in eutrophic water. J. Lake Sci. 2021, 33, 1299–1314. [Google Scholar] [CrossRef]
- Ho, J.; Michalak, A.; Pahlevan, N. Widespread global increase in intense lake phytoplankton blooms since the 1980s. Nature 2019, 574, 667–670. [Google Scholar] [CrossRef] [PubMed]
- Susan, B.; Watson, A.; Carol, M.; George, A.; Gregory, L.; Wayne, C.; Murray, N.; Charlton, F.; Remegio, C.; David, C.; et al. The re-eutrophication of Lake Erie: Harmful algal blooms and hypoxia. Harmful Algae 2016, 56, 44–66. [Google Scholar]
- Ulrich, A.; Malley, D.; Watts, P. Lake Winnipeg Basin: Advocacy, challenges and progress for sustainable phosphorus and eutrophication control. Sci. Total Environ. 2015, 542, 1030–1039. [Google Scholar] [CrossRef]
- Qin, B.; Deng, J.; Paerl, H.; Brookes, J.; Liu, J.; Jeppesen, E.; Zhu, G.; Zhang, Y.; Xu, H.; Shi, K. Why Lake Taihu continues to be plagued with cyanobacterial blooms through 10 years (2007–2017) efforts. Sci. Bull. 2019, 64, 7–9. [Google Scholar] [CrossRef] [Green Version]
- Huang, J.; Zhang, Y.; Huang, Q.; Gao, J. When and where to reduce nutrient for controlling harmful algal blooms in large eutrophic lake Chaohu, China? Ecol. Indic. Integr. Monit. Assess. Manag. 2018, 89, 808–817. [Google Scholar] [CrossRef]
- Wu, Z.; Liu, Y.; Liang, Z.; Wu, S.; Guo, H. Internal cycling, not external loading, decides the nutrient limitation in eutrophic lake: A dynamic model with temporal Bayesian hierarchical inference. Water Res. 2017, 116, 231–240. [Google Scholar] [CrossRef]
- Wu, Q.; Xie, P.; Yang, L.; Gao, G.; Liu, Z.; Pan, G.; Zhu, Z. Ecological consequences of cyanobacetrial blooms in lakes and their countermeasures. Adv. Earth Sci. 2008, 23, 1115–1123. [Google Scholar]
- Guo, L.; Li, L.; Li, L.; Li, G. The characteristics of Cladophora community and its influencing factors in a eutrophic lake. China Environ. Sci. 2017, 37, 4667–4674. [Google Scholar]
- Hao, M.; Zhu, H.; Xiong, X.; He, Y.; Ao, H.; Yu, G.; Wu, C.; Liu, G.; Luo, Z.; Liu, J. Analysis on the distribution and origin of Cladophora in the nearshore water of Qinghai Lake. Acta Hydrobiol. Sin. 2020, 44, 1152–1158. [Google Scholar]
- Jia, T.; Zhang, X.; Dong, R. Long-term spatial and temporal monitoring of Cyanobacteria blooms using MODIS on Google Earth Engine: A Case Study in Taihu Lake. Remote Sens. 2019, 11, 2269. [Google Scholar] [CrossRef] [Green Version]
- Ma, J.; Jin, S.; Li, J.; He, Y.; Shang, W. Spatio-temporal variations and driving forces of harmful algal blooms in Chaohu Lake: A multi-source remote sensing approach. Remote Sens. 2021, 13, 427. [Google Scholar] [CrossRef]
- Li, S.; Liu, J.; Song, K.; Liang, C.; Gao, J. Analysis on spatial and temporal character of Cladophora blooms in lake Chaohu and its driving factors based on Landsat imagery. Resour. Environ. Yangtze Basin 2021, 28, 1205–1213. [Google Scholar]
- Li, Y.; Shi, Z.; Zhang, Y.; Zhao, Q.; Li, A.; Jin, Y.; Tie, C. Evaluation method and application on Cyanobacteria bloom degree classification with algal density. Environ. Sustain. Dev. 2014, 39, 67–68. [Google Scholar]
- Li, L.; Li, G.; Li, G. Winter and spring succession of the Phytoplankton community in Dianchi Lake under the influences of environment change. J. Hydroecol. 2020, 41, 57–68. [Google Scholar]
- Zheng, W.; Han, X.; Liu, C.; Li, Y. Satellite remote sensing data monitoring “Huang Tai” Cladophora blooms in Lake Ulansuhai, lnner Mongolia. J. Lake Sci. 2010, 22, 321–326. [Google Scholar]
- Wang, Y.; Huang, Y.; Yu, C.; Qi, Y.; Zhang, J. Detection of temporal and spatial variation of Huangtai Cladophora blooms using MODlS satellite data in Lake Ulansuhai from 2000 to 2010. J. Lake Sci. 2012, 24, 519–527. [Google Scholar]
- Yue, A.; Ji, Y.; Liu, H.; Zhang, Z. Historical regional distribution specialties of algal bloom extraction from Yuqiao Reservoir via Landsat 8 and its driving factors. J. Saf. Environ. 2019, 19, 1448–1455. [Google Scholar]
- Zhang, Y. Eutrophication Study for Yuqiao Reservoir. Master’s Thesis, Tianjin University, Tianjin, China, 2011. [Google Scholar]
- Chen, J.; Wang, J.; Wang, Q.; Lv, J.; Li, N. Common fate of sister lakes in Hulunbuir Grassland: Long-term harmful algal bloom crisis from multi-source remote sensing insights. J. Hydrol. 2021, 594, 125970. [Google Scholar] [CrossRef]
- Li, S. A preliminary study on the types, evolution and biological productivity of Qinghai Lake. In Proceedings of the Second Plenary Session of the Western Pacific Fisheries Research Commission; Science Press: Beijing, China, 1959; pp. 97–105. [Google Scholar]
- Lanzhou Institute of Geology. Comprehensive Investigation Report of Qinghai Lake; Science Press: Beijing, China, 1979; pp. 15–22. [Google Scholar]
- Yang, H.; Wang, J. Analysis on the benthos and their productivity in Qinghai Lake. Qinghai Sci. Technol. 1997, 4, 36–39. [Google Scholar]
- Yao, W.; Shi, J.; Qi, H.; Yang, J.; Jia, L.; Pu, J. Study on the phytoplankton in Qinghai Lake during the summer of 2006–2100. Freshw. Fish. 2011, 41, 22–28. [Google Scholar]
- Zhao, Z.; Zhu, H.; Xiong, X.; He, Y.; Ao, H.; Wu, C. The identification of Cladophora Qinghaiensis SP. Nov., within the genus Cladophora collected from Qinghai Lake, China. Acta Hydrobiol. Sin. 2021, 45, 663–669. [Google Scholar]
- Wen, X.; Jing, Y.; Zhang, D. Review on application of common satellite sensors in monitoring algal blooms. Environ. Sci. Technol. 2014, 37, 81–87. [Google Scholar]
- Duan, H.; Zhang, S.; Zhang, Y. Cyanobacteria bloom monitoring with remote sensing in Lake Taihu. J. Lake Sci. 2008, 20, 145–152. [Google Scholar]
- Ma, R.; Kong, F.; Duan, H.; Zhang, S.; Kong, W.; Hao, J. Spatio-temporal distribution of cyanobacteria blooms based on satellite imageries in Lake Taihu, China. J. Lake Sci. 2008, 20, 687–694. [Google Scholar]
- Xu, J.; Zhang, B.; Li, F.; Song, K.; Wang, Z. Detecting modes of cyanobacteria bloom using MODIS data in Lake Taihu. J. Lake Sci. 2008, 20, 191–195. [Google Scholar]
- Hu, C. A novel ocean color index to detect floating algae in the global oceans. Remote Sens. Environ. 2009, 113, 2118–2129. [Google Scholar] [CrossRef]
- Guo, W. Study on Extraction methods of cyanophytes bloom based on HJ-1. Master’s Thesis, Nanjing Normal University, Nanjing, China, 2011. [Google Scholar]
- Matthews, M.; Odermatt, D. Improved algorithm for routine monitoring of cyanobacteria and eutrophication in inland and near-coastal waters. Remote Sens. Environ. 2015, 156, 374–382. [Google Scholar] [CrossRef]
- Li, X.; Zhang, Y.; Shi, H.; Jiang, S.; Wang, T.; Ding, M.; Cai, K. Application of Maximum Chlorophyl Index derived from Sentinel-3A satellite OLCI data for monitoring Cyanobacteria blooms in lake Taihu. Environ. Monit. China 2019, 35, 146–155. [Google Scholar]
- Qi, M.; Yao, X.; Liu, S.; Zhu, Y.; Gao, Y.; Liu, B. Dynamic change of Lake Qinghai shoreline from 1973 to 2018. J. Lake Sci. 2020, 32, 573–583. [Google Scholar]
- Du, J.; Li, Q.; Liu, X.; Wen, D. Hydrological characteristics of Qinghai Lake, 1956–2017. J. Hydroecol. 2020, 41, 27–33. [Google Scholar]
- Higgins, S.; Pennuto, C.; Howell, T.; Theodore, W.; Lewis, J.; Makarewicz, D. Urban influences on Cladophora blooms in Lake Ontario—ScienceDirect. J. Great Lakes Res. 2012, 38, 116–123. [Google Scholar] [CrossRef]
- Liu, X.; Chen, Y.W. A review on the ecology of Cladophora. J. Lake Sci. 2018, 30, 881–896. [Google Scholar]
- Hu, C.; Lee, Z.; Ma, R.; Yu, K.; Li, D.; Shang, S. Moderate resolution imaging spectroradiometer (MODIS) observations of cyanobacteria blooms in Taihu Lake, China. J. Geophys Res. Ocean. 2010, 115, C04002. [Google Scholar] [CrossRef] [Green Version]
- Wang, S.; Li, J.; Zhang, B.; Spyrakos, E.; Tyler, A.N.; Shen, Q.; Zhang, F.; Kuster, T.; Lehmann, M.K.; Wu, Y.; et al. Trophic state assessment of global inland waters using a MODIS-derived Forel-Ule index. Remote Sens. Environ. 2018, 217, 444–460. [Google Scholar] [CrossRef] [Green Version]
- Zhang, J.; Chen, L.Q.; Chen, X.L. Monitoring the cyanobacterial blooms based on remote sensing in Lake Erhai by FAl. J. Lake Sci. 2016, 28, 718–725. [Google Scholar]
- Hu, M.Q.; Zhang, Y.C.; Ma, R.H.; Zhang, Y.X. Spatial and Temporal Dynamics of Floating Algal Blooms in Lake Chaohu in 2016 and Their Environmental Drivers. Environ. Sci. 2018, 39, 87–99. [Google Scholar]
- Zhu, H.; Xiong, X.; Ao, H.; Wu, C.; He, Y.; Hu, Z.; Liu, G. Cladophora reblooming after half a century: Effect of climate change-induced increases in the water level of the largest lake in Tibetan Plateau. Environ. Sci. Pollut. Res. 2020, 27, 42175–42181. [Google Scholar] [CrossRef]
- Cambridge, M.L.; Breeman, A.M.; Van den Hoek, C. Temperature responses and distribution of Australian species of Cladophora (Cladophorales: Chlorophyta). Aquat. Bot. 1991, 40, 73–90. [Google Scholar] [CrossRef]
- Higgins, S.N.; Hecky, R.E.; Guildford, S.J. Environmental Controls of Cladophora Growth Dynamics in Eastern Lake Erie: Application of the Cladophora Growth Model (CGM). J. Great Lakes Res. 2006, 32, 629–644. [Google Scholar] [CrossRef]
- Whitton, B.A. Biology of Cladophora in freshwaters. Water Res. 1970, 4, 457–476. [Google Scholar] [CrossRef]
- Bellis, V.J.; McLarty, D.A. Ecology of Cladophora Glomerata (L.) KÜTZ in sourthern Ontario 1. J. Phycol. 2010, 3, 57–63. [Google Scholar] [CrossRef] [PubMed]
- Higgins, S.N.; Howell, E.T.; Hecky, R.E.; Guildford, S.J.; Smith, R.E. The wall of green: The status of Cladophora glomerata on the northern shores of Lake Erie’s eastern basin, 1995–2002. J. Great Lakes Res. 2005, 31, 547–563. [Google Scholar] [CrossRef]
- Zhang, M.; Duan, H.; Shi, X.; Yu, Y.; Kong, F. Contributions of meteorology to the phenology of cyanobacterial blooms: Implications for future climate change. Water Res. 2012, 46, 442–452. [Google Scholar] [CrossRef]


| Year | Month | |||||
|---|---|---|---|---|---|---|
| May | June | July | August | September | December | |
| 1986 | — | 06/09 T | — | — | — | 10/31 T |
| 1987 | — | 06/28 T | — | 08/15 T | 09/16 T | 10/02 T |
| 1989 | 05/16 T | 06/01 T | — | — | 09/21 T | — |
| 1990 | — | 06/20 T | — | 08/23 T | — | 10/10 T |
| 1991 | — | — | 07/09 T | — | — | 10/29 T |
| 1992 | — | 06/09 T | — | 08/28 T | 09/04 T | 10/15 T |
| 1993 | 05/27 T | 06/28 T | — | 08/31 T | — | — |
| 1994 | — | — | — | — | — | 10/21 T |
| 1995 | 05/17 T | 06/18 T | — | 08/21 T | 09/22 T | 10/08 T |
| 1996 | 05/19 T | 06/20 T | — | — | 09/08 T | 10/26 T |
| 1997 | 05/22 T | 06/23 T | — | 08/26 T | — | 10/29 T |
| 1998 | — | 06/26 T | 07/28 T | — | — | — |
| 1999 | — | — | 07/31 T | 08/08 E | — | 10/27 E |
| 2000 | 05/14 T | 06/15 T | — | 08/18 T | — | 10/05 T |
| 2001 | 05/09 E | 06/18 T | — | 08/21 T | — | 10/24 T |
| 2002 | — | 06/05 T | — | — | 10/11 T | |
| 2003 | — | — | — | 09/12 T | — | |
| 2004 | — | — | — | 09/14 T | — | |
| 2005 | — | 06/29 T | 07/15 T | — | 09/17 T | — |
| 2006 | 05/31 T | 06/16 T | — | 08/03 T | 09/20 T | — |
| 2007 | 05/18 T | — | — | — | — | — |
| 2008 | 05/04 T | 06/05 T | 07/23 T | — | — | — |
| 2009 | — | — | — | 08/11 T | 09/28 T | 10/30 T |
| 2010 | 05/10 T | — | 07/29 T | 08/14 T | — | 10/17 T |
| 2011 | — | 06/14 T | 07/16 T | — | — | 10/04 T |
| 2013 | — | — | — | — | 09/23 E | 10/09 E |
| 2014 | 05/21 O | 06/06 O | 07/24 O | 08/25 O | — | — |
| 2015 | — | — | 07/27 O | 08/12 O | 09/13 O | 10/15 O |
| 2016 | 05/11 M | 06/27 O | 07/30 M | — | — | 10/17 O |
| 2017 | 05/29 O | 06/30 O | 07/15 M | 08/04 M | — | 10/04 O |
| 2018 | 05/10 M | 06/10 M | 07/30 M | 08/19 M | 09/28 M | 10/03 M |
| 2019 | — | 06/05 M | 07/05 M | 08/14 M | 09/28 M | 10/28 M |
| 2020 | 05/05 M | 06/29 M | 07/14 M | 08/18 M | 09/02 M | 10/07 M |
| 2021 | 05/05 M | 06/04 M | 07/29 M | 08/28 M | 09/07 M | 10/02 M |
| Month | Overall Change Rate (km2/a) | Partitioned Change Trend (km2/a) | Largest Area | ||
|---|---|---|---|---|---|
| Before 2004 | After 2004 | km2 | Year | ||
| May | 0.013 | −0.011 | 0.050 | 1.21 | 2020 |
| June | 0.028 | −0.011 | 0.141 | 2.67 | 2017 |
| July | 0.100 | 0.132 | 0.108 | 8.67 | 2016 |
| August | 0.023 | 0.200 | −0.169 | 8.75 | 2009 |
| September | 0.020 | −0.082 | −0.052 | 8.67 | 2013 |
| October | 0.096 | 0.025 | −0.396 | 9.14 | 2021 |
| SRB | SR | QR | BRN | BRS | QB | HR | |
|---|---|---|---|---|---|---|---|
| Area (km2/a) | 0.003 | 0.009 | −0.007 | 0.06 | 0.03 | 0.004 | −0.007 |
| Area percent (%/a) | −0.21 | 0.03 | −0.19 | 0.65 | 0.38 | −0.41 | −0.26 |
| Group | July | August | September | October | ||||||||
|---|---|---|---|---|---|---|---|---|---|---|---|---|
| T (°C) | SH (h) | WS (m/s) | T (°C) | SH (h) | WS (m/s) | T (°C) | SH (h) | WS (m/s) | T (°C) | SH (h) | WS (m/s) | |
| 1 | 18.22 | 8.18 | 3.11 | 17.04 | 7.74 | 2.89 | 13.25 | 7.16 | 2.81 | 8.58 | 8.21 | 2.85 |
| 2 | 17.26 | 7.77 | 3.14 | 17.19 | 7.73 | 3.03 | 13.28 | 7.55 | 2.86 | 8.21 | 8.23 | 2.95 |
| Total | 17.80 | 8.00 | 3.12 | 17.11 | 7.74 | 2.95 | 13.26 | 7.33 | 2.83 | 8.42 | 8.22 | 2.89 |
| Month | Temperature | Sunshine Hours | Wind Speed | Precipitation | ||||
|---|---|---|---|---|---|---|---|---|
| R | P | R | P | R | P | R | P | |
| May | −0.05 | 0.85 | −0.513 * | 0.035 | −0.157 | 0.548 | 0.3729 | 0.1405 |
| June | −0.117 | 0.577 | −0.362 | 0.076 | −0.469 * | 0.018 | 0.0502 | 0.8117 |
| July | 0.231 | 0.39 | 0.15 | 0.578 | −0.397 | 0.128 | 0.4183 | 0.1067 |
| August | −0.118 | 0.620 | −0.135 | 0.571 | −0.071 | 0.766 | 0.3025 | 0.1949 |
| September | −0.108 | 0.69 | −0.123 | 0.651 | 0.104 | 0.581 | 0.0971 | 0.7204 |
| October | 0.164 | 0.445 | −0.0333 | 0.112 | −0.456 * | 0.025 | 0.2835 | 0.1795 |
Publisher’s Note: MDPI stays neutral with regard to jurisdictional claims in published maps and institutional affiliations. |
© 2022 by the authors. Licensee MDPI, Basel, Switzerland. This article is an open access article distributed under the terms and conditions of the Creative Commons Attribution (CC BY) license (https://creativecommons.org/licenses/by/4.0/).
Share and Cite
Duan, H.; Yao, X.; Zhang, D.; Jin, H.; Wei, Q. Long-Term Temporal and Spatial Monitoring of Cladophora Blooms in Qinghai Lake Based on Multi-Source Remote Sensing Images. Remote Sens. 2022, 14, 853. https://doi.org/10.3390/rs14040853
Duan H, Yao X, Zhang D, Jin H, Wei Q. Long-Term Temporal and Spatial Monitoring of Cladophora Blooms in Qinghai Lake Based on Multi-Source Remote Sensing Images. Remote Sensing. 2022; 14(4):853. https://doi.org/10.3390/rs14040853
Chicago/Turabian StyleDuan, Hongyu, Xiaojun Yao, Dahong Zhang, Huian Jin, and Qixin Wei. 2022. "Long-Term Temporal and Spatial Monitoring of Cladophora Blooms in Qinghai Lake Based on Multi-Source Remote Sensing Images" Remote Sensing 14, no. 4: 853. https://doi.org/10.3390/rs14040853
APA StyleDuan, H., Yao, X., Zhang, D., Jin, H., & Wei, Q. (2022). Long-Term Temporal and Spatial Monitoring of Cladophora Blooms in Qinghai Lake Based on Multi-Source Remote Sensing Images. Remote Sensing, 14(4), 853. https://doi.org/10.3390/rs14040853