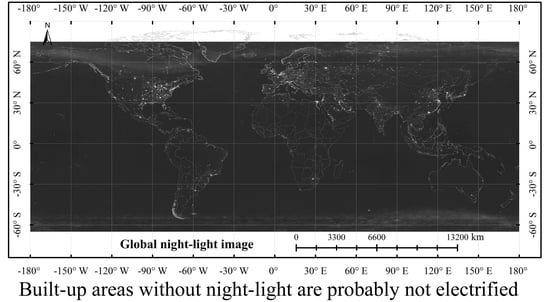
Global Identification of Unelectrified Built-Up Areas by Remote Sensing
Abstract
:1. Introduction
2. Materials and Methods
2.1. Materials
2.1.1. European Commission’s Built-Up Area Data
2.1.2. NPP/VIIRS Night-Light Image Data
2.2. Methods
2.2.1. Data Preprocessing
2.2.2. Sample Pool Construction
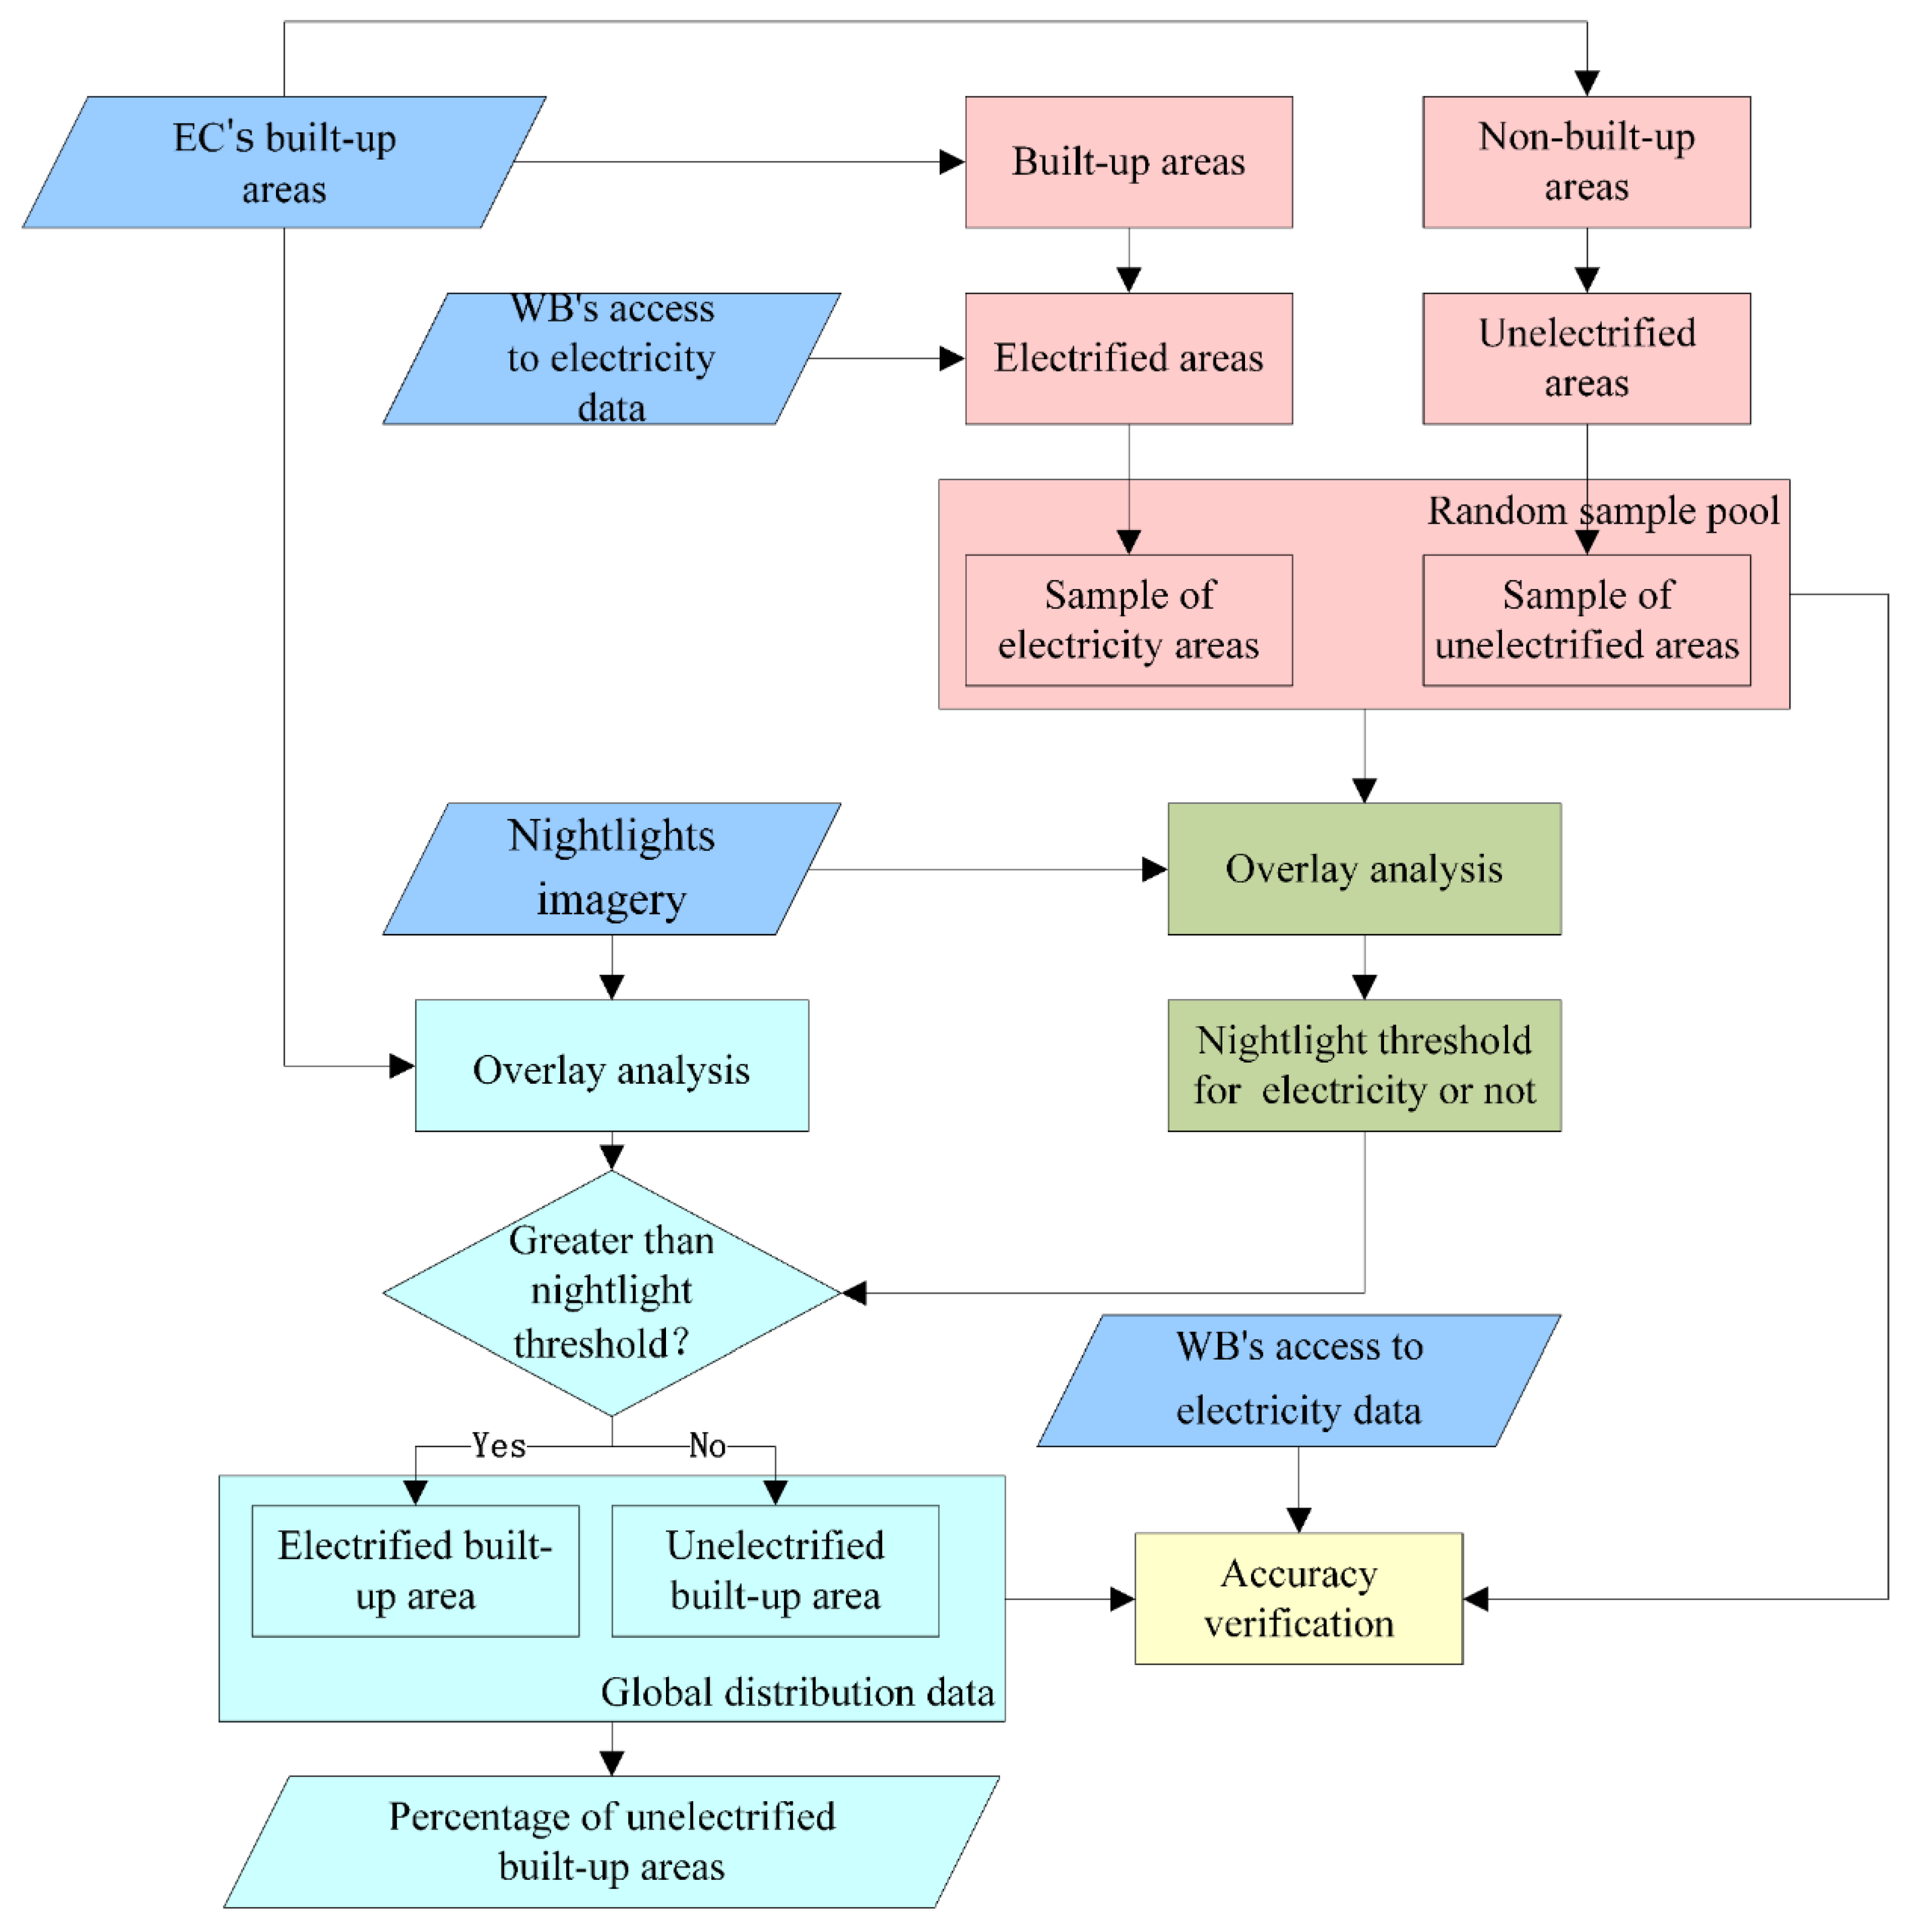
2.2.3. Threshold Selection and Identification of Electrified and Unelectrified Built-Up Areas
2.2.4. Accuracy Verification
3. Results
3.1. Threshold of Determination of whether Built-Up Areas Are Electrified
3.2. Global Identification of Unelectrified Built-Up Areas
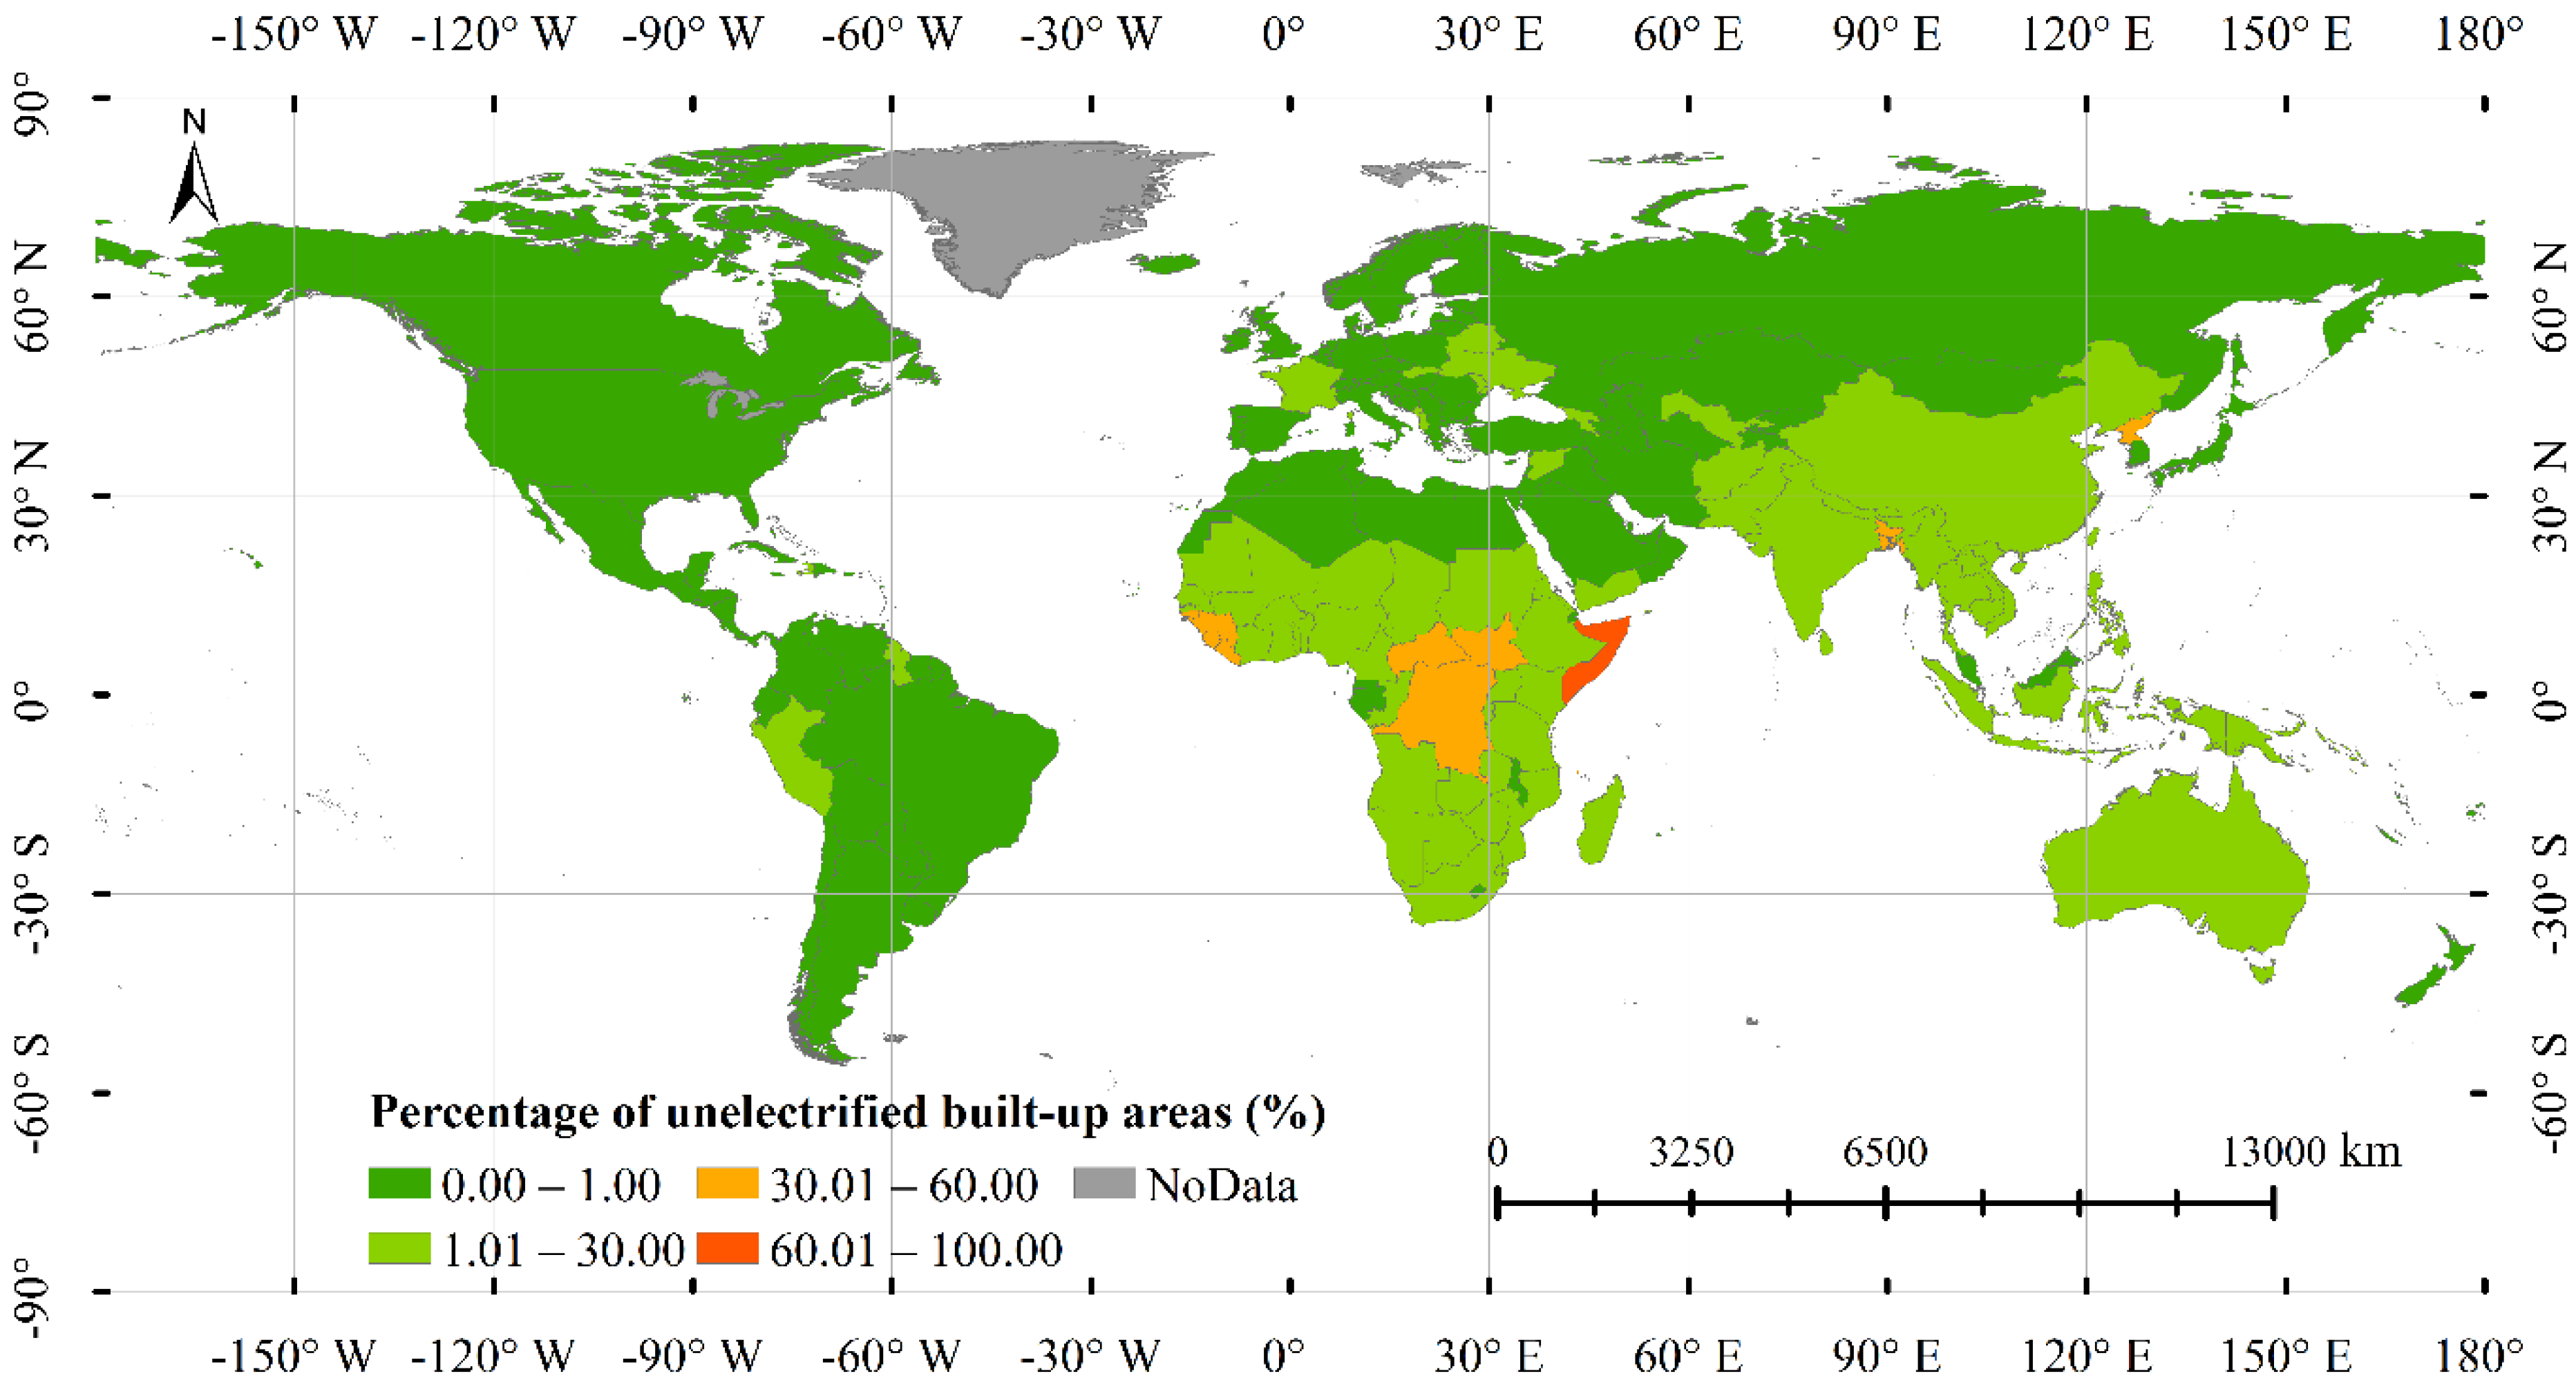
3.3. Percentage of Unelectrified Built-Up Areas
3.4. Accuracy Verification
3.4.1. Random Sample Accuracy Validation
3.4.2. Spatial Coupling between the Percentage of Unelectrified Built-Up Area and Non-Access to Electricity Data
4. Discussion
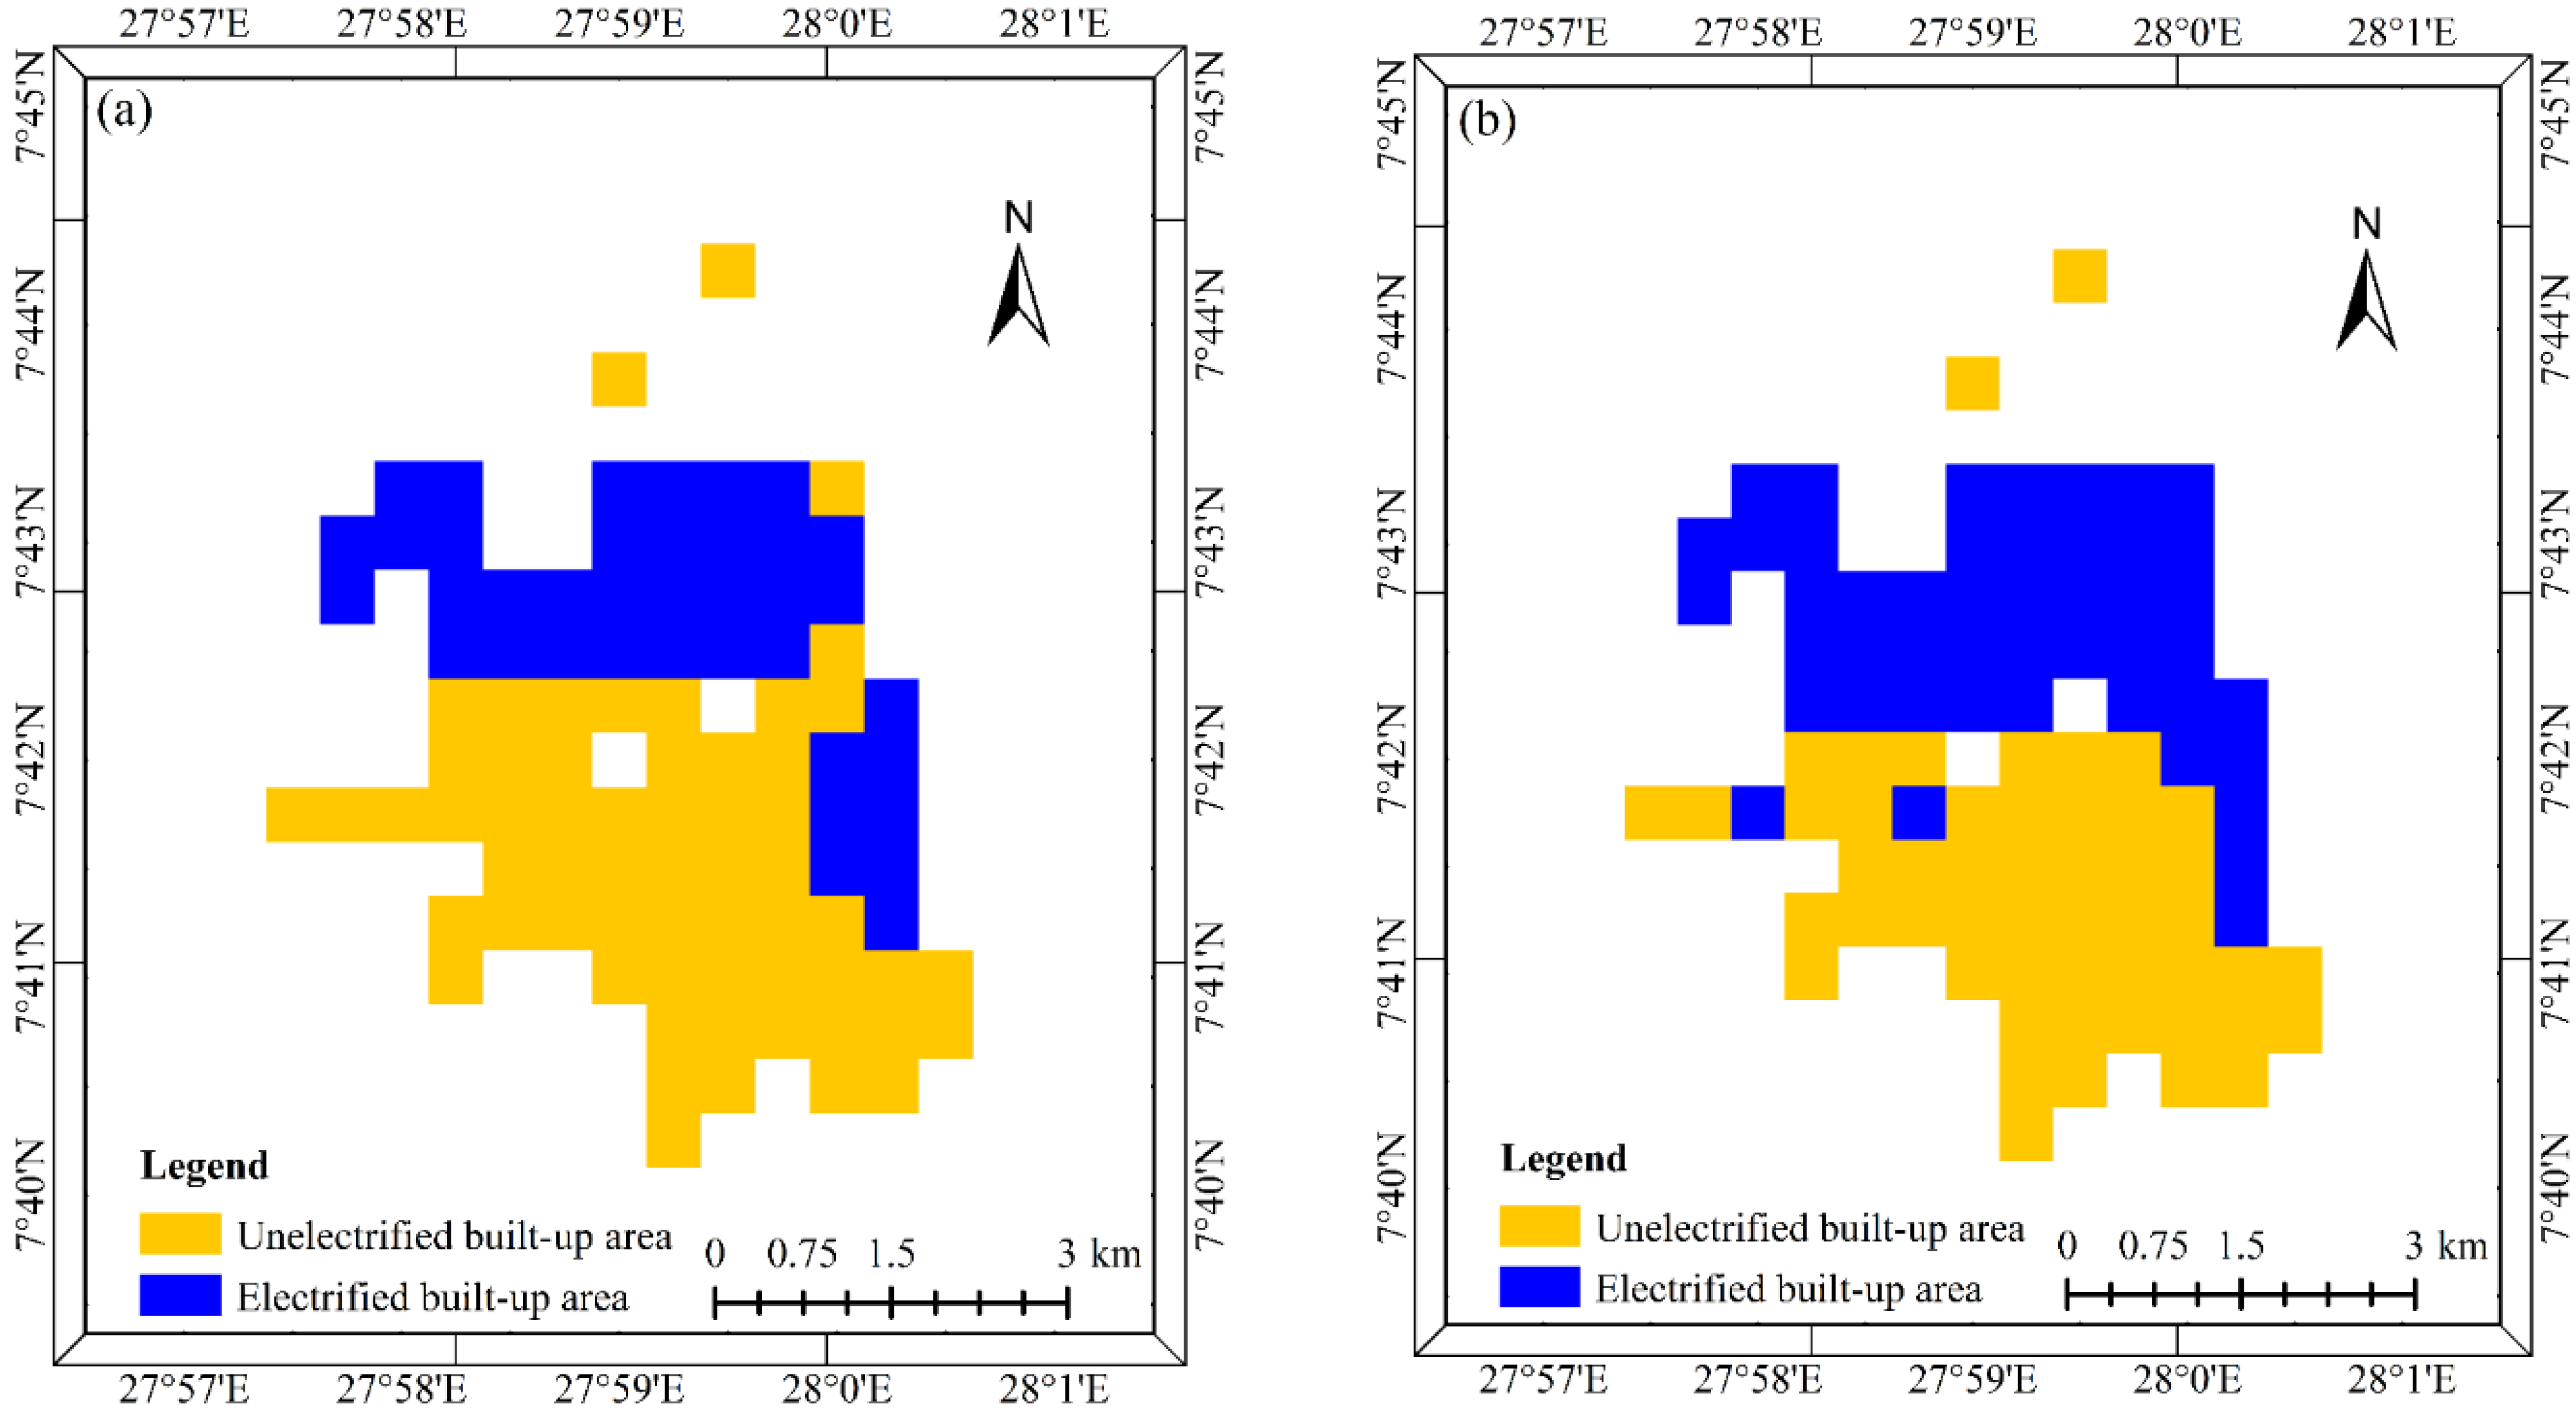
4.1. Comparative Analysis of Results in Two Years
4.2. Error Analysis
4.3. Application Scenarios
4.4. Limitations of This Study
5. Conclusions
Author Contributions
Funding
Institutional Review Board Statement
Informed Consent Statement
Data Availability Statement
Conflicts of Interest
Appendix A
| Country or Territory | Unelectrified Built-Up Area, 2014 (km2) | Proportion of Built-Up Area Not Electrified, 2014 (%) | Unelectrified Built-Up Area, 2020 (km2) | Proportion of Built-Up Area Not Electrified, 2020 (%) | Change in Proportion of Unelectrified Built-Up Area (%) |
|---|---|---|---|---|---|
| Afghanistan | 111.8342 | 14.5603 | 87.4974 | 11.3917 | 3.16853 |
| Albania | 14.6296 | 2.1460 | 14.4622 | 2.1214 | 0.02455 |
| Algeria | 6.1967 | 0.1169 | 5.6085 | 0.1058 | 0.01110 |
| Andorra | 0.0000 | 0.0000 | 0.0000 | 0.0000 | 0.00000 |
| Angola | 104.4335 | 7.5607 | 93.1601 | 6.7445 | 0.81617 |
| Anguilla | 0.0000 | 0.0000 | 0.0000 | 0.0000 | 0.00000 |
| Antigua and Barbuda | 0.0000 | 0.0000 | 0.0000 | 0.0000 | 0.00000 |
| Argentina | 6.9920 | 0.0758 | 5.3780 | 0.0583 | 0.01751 |
| Armenia | 45.0957 | 4.6220 | 27.7899 | 2.8483 | 1.77372 |
| Aruba | 0.2544 | 0.3015 | 0.0000 | 0.0000 | 0.30146 |
| Australia | 170.7810 | 1.0717 | 133.5447 | 0.8380 | 0.23367 |
| Austria | 29.6767 | 0.4790 | 17.4595 | 0.2818 | 0.19720 |
| Azerbaijan | 4.6436 | 0.2019 | 7.9572 | 0.3459 | −0.14404 |
| Bahamas | 0.9338 | 0.4430 | 1.7395 | 0.8252 | −0.38221 |
| Bahrain | 0.0000 | 0.0000 | 0.0000 | 0.0000 | 0.00000 |
| Bangladesh | 4137.9592 | 35.5531 | 2893.5518 | 24.8612 | 10.69187 |
| Barbados | 0.0000 | 0.0000 | 0.0000 | 0.0000 | 0.00000 |
| Belarus | 255.0775 | 2.7966 | 541.2175 | 5.9337 | −3.13712 |
| Belgium | 0.0000 | 0.0000 | 0.0000 | 0.0000 | 0.00000 |
| Belize | 0.2604 | 0.4506 | 0.0000 | 0.0000 | 0.45062 |
| Benin | 93.1004 | 13.4398 | 42.7384 | 6.1697 | 7.27017 |
| Bermuda | 0.0000 | 0.0000 | 0.0000 | 0.0000 | 0.00000 |
| Bhutan | 0.2799 | 4.8913 | 0.2799 | 4.8913 | 0.00000 |
| Bolivia | 4.9033 | 0.5947 | 3.6276 | 0.4400 | 0.15472 |
| Bosnia and Herzegovina | 2.0774 | 0.2000 | 1.7247 | 0.1660 | 0.03395 |
| Botswana | 3.7657 | 1.0054 | 2.6912 | 0.7185 | 0.28687 |
| Brazil | 23.3945 | 0.0804 | 26.5648 | 0.0913 | −0.01090 |
| British Indian Ocean Territory | 0.0000 | 0.0000 | 0.0000 | 0.0000 | 0.00000 |
| British Virgin Islands | 0.1889 | 3.1480 | 0.1889 | 3.1480 | 0.00000 |
| Brunei | 0.0000 | 0.0000 | 0.0000 | 0.0000 | 0.00000 |
| Bulgaria | 25.3332 | 0.5599 | 23.7142 | 0.5242 | 0.03578 |
| Burkina Faso | 16.4915 | 3.7346 | 8.1188 | 1.8386 | 1.89608 |
| Burundi | 8.2126 | 9.0198 | 4.9762 | 5.4653 | 3.55449 |
| Cambodia | 46.1479 | 15.7150 | 19.1609 | 6.5249 | 9.19002 |
| Cameroon | 109.5802 | 13.3651 | 112.8128 | 13.7594 | −0.39427 |
| Canada | 48.7055 | 0.1393 | 68.4845 | 0.1958 | −0.05655 |
| Canary Islands | 0.0000 | 0.0000 | 0.2842 | 0.1213 | −0.12134 |
| Cape Verde | 0.0000 | 0.0000 | 0.0000 | 0.0000 | 0.00000 |
| Cayman Islands | 0.0000 | 0.0000 | 0.0000 | 0.0000 | 0.00000 |
| Central African Republic | 82.4083 | 51.0310 | 62.6977 | 38.8253 | 12.20570 |
| Chad | 60.9334 | 27.9816 | 51.2279 | 23.5247 | 4.45692 |
| Chile | 9.7061 | 0.4153 | 9.3934 | 0.4019 | 0.01338 |
| China | 30972.6748 | 10.5381 | 6201.8089 | 2.1101 | 8.42798 |
| Colombia | 2.2409 | 0.1114 | 0.4972 | 0.0247 | 0.08667 |
| Commonwealth of Dominica | 0.0000 | 0.0000 | 0.0000 | 0.0000 | 0.00000 |
| Commonwealth of the Northern Mariana Islands | 0.0000 | 0.0000 | 0.0000 | 0.0000 | 0.00000 |
| Comoros | 20.3706 | 59.7781 | 13.3745 | 39.2478 | 20.53033 |
| Cook Islands | 0.2666 | 7.6271 | 0.0000 | 0.0000 | 7.62712 |
| Costa Rica | 0.2526 | 0.0436 | 0.0000 | 0.0000 | 0.04358 |
| Cote D’Ivoire | 158.8210 | 11.4453 | 90.2525 | 6.5040 | 4.94134 |
| Croatia | 4.1983 | 0.1546 | 5.3086 | 0.1955 | −0.04088 |
| Cuba | 4.8220 | 0.3307 | 2.1396 | 0.1467 | 0.18397 |
| Cyprus | 0.0000 | 0.0000 | 0.0000 | 0.0000 | 0.00000 |
| Czech | 6.9295 | 0.0769 | 2.3052 | 0.0256 | 0.05135 |
| Democratic Republic of the Congo | 1205.6779 | 55.9208 | 1135.9253 | 52.6856 | 3.23521 |
| Denmark | 77.2307 | 0.9287 | 19.0495 | 0.2291 | 0.69960 |
| Djibouti | 0.0000 | 0.0000 | 0.0000 | 0.0000 | 0.00000 |
| Dominica | 5.6264 | 0.5117 | 1.0469 | 0.0952 | 0.41646 |
| Ecuador | 0.2484 | 0.0308 | 0.4967 | 0.0617 | −0.03083 |
| Egypt | 0.5644 | 0.0084 | 0.0000 | 0.0000 | 0.00835 |
| El Salvador | 2.3006 | 0.4581 | 0.5107 | 0.1017 | 0.35641 |
| Equatorial Guinea | 0.2484 | 0.5914 | 0.0000 | 0.0000 | 0.59142 |
| Eritrea | 0.2575 | 5.4876 | 0.0000 | 0.0000 | 5.48759 |
| Estonia | 9.6082 | 0.8278 | 20.9352 | 1.8037 | −0.97587 |
| Ethiopia | 37.1955 | 5.7213 | 57.5592 | 8.8536 | −3.13227 |
| Federated States of Micronesia | 0.0792 | 4.1178 | 0.0792 | 4.1178 | 0.00000 |
| Fiji | 0.2536 | 0.7185 | 0.0000 | 0.0000 | 0.71853 |
| Finland | 39.5123 | 0.7520 | 89.8960 | 1.7109 | −0.95889 |
| France | 1394.8523 | 2.3745 | 1018.7433 | 1.7343 | 0.64027 |
| French Guiana | 0.0000 | 0.0000 | 0.0000 | 0.0000 | 0.00000 |
| French Polynesia | 0.5312 | 1.3741 | 0.0000 | 0.0000 | 1.37405 |
| Gabon | 0.4970 | 0.4783 | 0.2483 | 0.2390 | 0.23929 |
| Gambia | 33.9575 | 21.9800 | 8.1701 | 5.2883 | 16.69164 |
| Georgia | 27.6368 | 2.2566 | 4.6726 | 0.3815 | 1.87507 |
| Germany | 409.7373 | 0.5233 | 114.1249 | 0.1458 | 0.37754 |
| Ghana | 95.2585 | 3.5951 | 5.0014 | 0.1888 | 3.40633 |
| Gibraltar | 0.0000 | 0.0000 | 0.0000 | 0.0000 | 0.00000 |
| Greece | 16.7507 | 0.3619 | 12.7043 | 0.2745 | 0.08743 |
| Grenada | 0.0000 | 0.0000 | 0.0000 | 0.0000 | 0.00000 |
| Guadeloupe | 0.0000 | 0.0000 | 0.0000 | 0.0000 | 0.00000 |
| Guatemala | 2.8212 | 0.3267 | 2.8206 | 0.3266 | 0.00007 |
| Guinea | 205.0289 | 35.3655 | 172.7847 | 29.8037 | 5.56183 |
| Guinea-Bissau | 26.0958 | 37.5126 | 19.4987 | 28.0293 | 9.48328 |
| Guyana | 3.7354 | 6.3486 | 3.4910 | 5.9332 | 0.41541 |
| Haiti | 47.9069 | 11.2008 | 57.9351 | 13.5455 | −2.34463 |
| Honduras | 1.0233 | 0.1481 | 0.7709 | 0.1116 | 0.03654 |
| Hungary | 12.4644 | 0.1372 | 3.2951 | 0.0363 | 0.10090 |
| Iceland | 0.0000 | 0.0000 | 0.0000 | 0.0000 | 0.00000 |
| India | 988.7891 | 2.4650 | 452.5820 | 1.1283 | 1.33672 |
| Indonesia | 416.2179 | 2.5624 | 84.1484 | 0.5181 | 2.04438 |
| Iran | 1.2433 | 0.0123 | 0.2996 | 0.0030 | 0.00931 |
| Iraq | 0.2975 | 0.0078 | 3.3296 | 0.0876 | −0.07981 |
| Ireland | 9.5884 | 0.3937 | 7.5292 | 0.3092 | 0.08455 |
| Israel | 0.0000 | 0.0000 | 0.0000 | 0.0000 | 0.00000 |
| Italy | 40.1984 | 0.1179 | 38.1973 | 0.1120 | 0.00587 |
| Jamaica | 0.0000 | 0.0000 | 0.0000 | 0.0000 | 0.00000 |
| Japan | 140.3028 | 0.2534 | 135.6812 | 0.2451 | 0.00835 |
| Jordan | 0.0000 | 0.0000 | 0.0000 | 0.0000 | 0.00000 |
| Kazakhstan | 15.8222 | 0.1661 | 15.5984 | 0.1637 | 0.00235 |
| Kenya | 6.9580 | 2.1331 | 2.9816 | 0.9141 | 1.21908 |
| Kiribati | 0.2398 | 39.4158 | 0.0000 | 0.0000 | 39.41579 |
| Democratic People’s Republic of Korea | 380.3245 | 37.1298 | 204.3360 | 19.9486 | 17.18114 |
| Korea | 0.9233 | 0.0115 | 0.3158 | 0.0039 | 0.00758 |
| Kuwait | 0.0000 | 0.0000 | 0.0000 | 0.0000 | 0.00000 |
| Kyrgyzstan | 1.1261 | 0.0527 | 0.0000 | 0.0000 | 0.05270 |
| Laos | 3.7437 | 2.4275 | 2.6055 | 1.6894 | 0.73802 |
| Latvia | 4.1133 | 0.3504 | 3.1859 | 0.2714 | 0.07900 |
| Lebanon | 0.0000 | 0.0000 | 0.0000 | 0.0000 | 0.00000 |
| Lesotho | 0.0000 | 0.0000 | 0.0000 | 0.0000 | 0.00000 |
| Liberia | 77.8050 | 30.3199 | 56.0539 | 21.8437 | 8.47620 |
| Libya | 4.3342 | 0.1748 | 9.0320 | 0.3643 | −0.18948 |
| Liechtenstein | 0.0000 | 0.0000 | 0.0000 | 0.0000 | 0.00000 |
| Lithuania | 14.5081 | 0.6837 | 8.3566 | 0.3938 | 0.28990 |
| Luxembourg | 0.0000 | 0.0000 | 0.0000 | 0.0000 | 0.00000 |
| Madagascar | 3.3832 | 1.5656 | 2.6089 | 1.2073 | 0.35831 |
| Madeira | 0.0000 | 0.0000 | 0.0000 | 0.0000 | 0.00000 |
| Malawi | 0.5138 | 0.2629 | 0.5138 | 0.2629 | 0.00000 |
| Malaysia | 8.9171 | 0.1805 | 4.9626 | 0.1005 | 0.08006 |
| Maldives | 0.2199 | 6.1713 | 0.0000 | 0.0000 | 6.17125 |
| Mali | 52.4993 | 11.0030 | 23.1947 | 4.8613 | 6.14178 |
| Malta | 0.0000 | 0.0000 | 0.0000 | 0.0000 | 0.00000 |
| Marshall Islands | 0.0000 | 0.0000 | 0.0000 | 0.0000 | 0.00000 |
| Martinique | 0.0000 | 0.0000 | 0.0000 | 0.0000 | 0.00000 |
| Mauritania | 7.2445 | 4.8262 | 5.1962 | 3.4617 | 1.36452 |
| Mauritius | 0.0000 | 0.0000 | 0.0000 | 0.0000 | 0.00000 |
| Mayotte | 0.0000 | 0.0000 | 0.0000 | 0.0000 | 0.00000 |
| Mexico | 44.0788 | 0.2057 | 30.2135 | 0.1410 | 0.06471 |
| Moldova | 240.1905 | 7.2783 | 289.4682 | 8.7715 | −1.49322 |
| Monaco | 0.0000 | 0.0000 | 0.0000 | 0.0000 | 0.00000 |
| Mongolia | 1.4806 | 0.5961 | 1.4806 | 0.5961 | 0.00000 |
| Montenegro | 4.0925 | 1.6345 | 5.4493 | 2.1763 | −0.54187 |
| Morocco | 1.7822 | 0.0851 | 0.3007 | 0.0144 | 0.07078 |
| Mozambique | 129.8779 | 11.4506 | 122.1234 | 10.7669 | 0.68366 |
| Myanmar | 190.5299 | 12.7198 | 70.9998 | 4.7399 | 7.97981 |
| Namibia | 4.9320 | 3.7227 | 5.4649 | 4.1249 | −0.40222 |
| Nauru | 0.0000 | 0.0000 | 0.0000 | 0.0000 | 0.00000 |
| Nepal | 9.4892 | 2.9450 | 0.0000 | 0.0000 | 2.94504 |
| Netherlands | 1.9578 | 0.0123 | 0.0000 | 0.0000 | 0.01232 |
| Netherlands Antilles | 0.0000 | 0.0000 | 0.0000 | 0.0000 | 0.00000 |
| New Caledonia | 0.0000 | 0.0000 | 0.0000 | 0.0000 | 0.00000 |
| New Zealand | 15.7617 | 0.6322 | 15.0821 | 0.6049 | 0.02726 |
| Nicaragua | 0.5105 | 0.1482 | 0.2548 | 0.0740 | 0.07422 |
| Niger | 83.6143 | 26.6773 | 72.3850 | 23.0946 | 3.58273 |
| Nigeria | 1247.6289 | 13.7390 | 956.8827 | 10.5372 | 3.20171 |
| Norfolk Island | 0.2845 | 100.0000 | 0.0000 | 0.0000 | 100.00000 |
| North Macedonia | 0.3308 | 0.0563 | 0.9964 | 0.1694 | −0.11317 |
| Norway | 12.0534 | 0.2056 | 14.0764 | 0.2401 | −0.03450 |
| Oman | 0.0000 | 0.0000 | 0.0000 | 0.0000 | 0.00000 |
| Pakistan | 1086.5527 | 12.8175 | 869.6158 | 10.2584 | 2.55910 |
| Palau | 0.0000 | 0.0000 | 0.0000 | 0.0000 | 0.00000 |
| Panama | 0.2516 | 0.0454 | 0.2516 | 0.0454 | 0.00000 |
| Papua New Guinea | 2.0528 | 6.2187 | 0.8073 | 2.4455 | 3.77326 |
| Paraguay | 0.5287 | 0.0850 | 0.5287 | 0.0850 | 0.00000 |
| Peru | 19.5824 | 1.4003 | 18.3128 | 1.3095 | 0.09079 |
| Philippines | 79.9002 | 3.0324 | 35.7553 | 1.3570 | 1.67542 |
| Poland | 42.3286 | 0.1713 | 61.3299 | 0.2483 | −0.07692 |
| Portugal | 15.9723 | 0.2196 | 12.7830 | 0.1758 | 0.04386 |
| Puerto Rico | 0.2612 | 0.0150 | 0.3260 | 0.0188 | −0.00373 |
| Qatar | 0.0000 | 0.0000 | 0.0000 | 0.0000 | 0.00000 |
| Republic of the Congo | 12.6762 | 5.3491 | 14.9115 | 6.2924 | −0.94326 |
| Reunion | 0.7998 | 0.3617 | 0.7999 | 0.3618 | −0.00001 |
| Romania | 36.6328 | 0.3710 | 28.7944 | 0.2917 | 0.07939 |
| Russian Federation | 703.8669 | 0.5320 | 947.9048 | 0.7165 | −0.18446 |
| Rwanda | 10.9320 | 6.6333 | 5.4659 | 3.3166 | 3.31670 |
| Saint Kitts-Nevis | 0.0000 | 0.0000 | 0.0000 | 0.0000 | 0.00000 |
| Saint Lucia | 0.0000 | 0.0000 | 0.0000 | 0.0000 | 0.00000 |
| Saint Pierre and Miquelon | 0.0000 | 0.0000 | 0.0000 | 0.0000 | 0.00000 |
| Saint Vincent and the Grenadines | 0.0000 | 0.0000 | 0.0000 | 0.0000 | 0.00000 |
| San Marino | 0.0000 | 0.0000 | 0.0000 | 0.0000 | 0.00000 |
| Sao Tome and Principe | 0.0000 | 0.0000 | 0.0000 | 0.0000 | 0.00000 |
| Saudi Arabia | 7.7043 | 0.1762 | 7.7043 | 0.1762 | 0.00000 |
| Senegal | 49.1270 | 6.7833 | 18.3221 | 2.5299 | 4.25344 |
| Serbia | 2.0448 | 0.0481 | 1.3699 | 0.0322 | 0.01588 |
| Seychelles | 0.0000 | 0.0000 | 0.0000 | 0.0000 | 0.00000 |
| Sierra Leone | 79.7038 | 32.6631 | 59.9947 | 24.5862 | 8.07692 |
| Singapore | 0.0000 | 0.0000 | 0.0000 | 0.0000 | 0.00000 |
| Slovakia | 67.0682 | 1.4226 | 48.2477 | 1.0234 | 0.39922 |
| Slovenia | 1.8425 | 0.1573 | 2.5365 | 0.2165 | −0.05924 |
| Solomon Islands | 0.5023 | 4.0246 | 0.0000 | 0.0000 | 4.02457 |
| Somalia | 586.4573 | 79.3364 | 561.5776 | 75.9707 | 3.36574 |
| South Africa | 217.9137 | 1.9619 | 161.5485 | 1.4544 | 0.50746 |
| South Sudan | 63.4611 | 50.1188 | 47.7250 | 37.6911 | 12.42765 |
| Spain | 160.2261 | 0.9509 | 146.4375 | 0.8691 | 0.08183 |
| Sri Lanka | 10.5747 | 1.0892 | 2.0060 | 0.2066 | 0.88257 |
| Sudan | 113.6692 | 10.1769 | 59.4366 | 5.3214 | 4.85550 |
| Suriname | 0.5007 | 0.3982 | 0.2517 | 0.2001 | 0.19805 |
| Swaziland | 0.8312 | 1.9800 | 0.5547 | 1.3215 | 0.65855 |
| Sweden | 35.0522 | 0.2821 | 45.4066 | 0.3654 | −0.08333 |
| Switzerland | 5.3970 | 0.0928 | 2.1875 | 0.0376 | 0.05519 |
| Syria | 251.4053 | 8.7313 | 198.5683 | 6.8963 | 1.83504 |
| Tajikistan | 23.0878 | 0.9432 | 6.7623 | 0.2763 | 0.66696 |
| Tanzania | 79.4132 | 7.4632 | 42.6739 | 4.0105 | 3.45275 |
| Thailand | 311.1349 | 4.2063 | 67.9229 | 0.9183 | 3.28806 |
| Timor-Leste | 0.2939 | 2.2661 | 0.2297 | 1.7707 | 0.49534 |
| Togo | 12.2694 | 4.1098 | 5.2572 | 1.7610 | 2.34885 |
| Trinidad and Tobago | 0.0000 | 0.0000 | 0.0000 | 0.0000 | 0.00000 |
| Tunisia | 18.0062 | 0.8101 | 4.2261 | 0.1901 | 0.61995 |
| Turkey | 17.3954 | 0.1496 | 6.2782 | 0.0540 | 0.09558 |
| Turkmenistan | 0.0000 | 0.0000 | 0.0000 | 0.0000 | 0.00000 |
| Turks and Caicos Islands | 0.2384 | 1.0852 | 0.2384 | 1.0852 | 0.00000 |
| Uganda | 24.7265 | 4.9257 | 9.8171 | 1.9556 | 2.97004 |
| Ukraine | 949.9478 | 2.6119 | 1640.1530 | 4.5097 | −1.89775 |
| United Arab Emirates | 0.0000 | 0.0000 | 0.0000 | 0.0000 | 0.00000 |
| United Kingdom | 55.9738 | 0.1175 | 69.1107 | 0.1450 | −0.02757 |
| United States | 537.9265 | 0.1564 | 585.7227 | 0.1703 | −0.01390 |
| Uruguay | 0.5874 | 0.0645 | 0.5874 | 0.0645 | 0.00000 |
| Uzbekistan | 136.3654 | 1.1354 | 26.0056 | 0.2165 | 0.91890 |
| Vanuatu | 0.0000 | 0.0000 | 0.0000 | 0.0000 | 0.00000 |
| Vatican City | 0.0000 | 0.0000 | 0.0000 | 0.0000 | 0.00000 |
| Venezuela | 0.0000 | 0.0000 | 0.9943 | 0.0353 | −0.03529 |
| Vietnam | 597.7392 | 7.5150 | 58.0599 | 0.7299 | 6.78502 |
| Virgin Islands of the United States | 0.0000 | 0.0000 | 0.0000 | 0.0000 | 0.00000 |
| Wake Island | 0.0000 | 0.0000 | 0.0000 | 0.0000 | 0.00000 |
| Western Sahara | 0.0000 | 0.0000 | 0.0000 | 0.0000 | 0.00000 |
| Yemen | 22.4824 | 9.6580 | 30.6630 | 13.1722 | −3.51420 |
| Zambia | 24.1539 | 3.2525 | 9.3942 | 1.2650 | 1.98750 |
| Zimbabwe | 26.8092 | 4.3962 | 15.5474 | 2.5495 | 1.84672 |
| Other regions * | 377.1833 | 2.0432 | 272.0290 | 1.4736 | 0.56962 |
References
- UN. United Nations Sustainable Development Summit 2015. Available online: https://sustainabledevelopment.un.org/post2015/summit (accessed on 1 April 2022).
- UN. Sustainable Development Goals: 17 Goals to Transform Our World. Available online: http://www.un.org/sustainabledevelopment/sustainable-development-goals (accessed on 1 April 2022).
- IEA; IRENA; UNSD; WB; WHO. Tracking SDG 7: The Energy Progress Report; World Bank: Washington, DC, USA, 2021. [Google Scholar]
- WB. World Bank Database. 2021. Available online: https://data.worldbank.org.cn/indicator (accessed on 1 April 2022).
- IEA. World Energy Outlook 2019; International Energy Agency: Paris, France, 2019. [Google Scholar]
- IEA. World Energy Outlook 2020; International Energy Agency: Paris, France, 2020. [Google Scholar]
- CAS. Annual report series on “Big Data for Sustainable Development Goals”. Bull. Chin. Acad. Sci. 2021, 36, 1001. [Google Scholar]
- Levin, N.; Kyba, C.C.M.; Zhang, Q.L.; de Miguel, A.S.; Roman, M.O.; Li, X.; Portnov, B.A.; Molthan, A.L.; Jechow, A.; Miller, S.D.; et al. Remote sensing of night lights: A review and an outlook for the future. Remote Sens. Environ. 2020, 237, 111443. [Google Scholar] [CrossRef]
- Croft, T.A. Nighttime Images of the Earth from Space. Sci. Am. 1978, 239, 86–98. [Google Scholar] [CrossRef]
- Tian, H.F.; Wang, Y.J.; Chen, T.; Zhang, L.J.; Qin, Y.C. Early-Season Mapping of Winter Crops Using Sentinel-2 Optical Imagery. Remote Sens. 2021, 13, 3822. [Google Scholar] [CrossRef]
- Tian, H.F.; Qin, Y.C.; Niu, Z.; Wang, L.; Ge, S.S. Summer Maize Mapping by Compositing Time Series Sentinel-1A Imagery Based on Crop Growth Cycles. J. Indian Soc. Remote Sens. 2021, 49, 2863–2874. [Google Scholar] [CrossRef]
- Tian, H.; Chen, T.; Li, Q.; Mei, Q.; Wang, S.; Yang, M.; Wang, Y.; Qin, Y. A Novel Spectral Index for Automatic Canola Mapping by Using Sentinel-2 Imagery. Remote Sens. 2022, 14, 1113. [Google Scholar] [CrossRef]
- Elvidge, C.D.; Baugh, K.E.; Kihn, E.A.; Kroehl, H.W.; Davis, E.R.; Davis, C.W. Relation between satellite observed visible-near infrared emissions, population, economic activity and electric power consumption. Int. J. Remote Sens. 1997, 18, 1373–1379. [Google Scholar] [CrossRef]
- Lo, C.P. Modeling the population of China using DMSP operational linescan system nighttime data. Photogramm. Eng. Remote Sens. 2001, 67, 1037–1047. [Google Scholar]
- Shi, K.F.; Yu, B.L.; Huang, Y.X.; Hu, Y.J.; Yin, B.; Chen, Z.Q.; Chen, L.J.; Wu, J.P. Evaluating the Ability of NPP-VIIRS Nighttime Light Data to Estimate the Gross Domestic Product and the Electric Power Consumption of China at Multiple Scales: A Comparison with DMSP-OLS Data. Remote Sens. 2014, 6, 1705–1724. [Google Scholar] [CrossRef] [Green Version]
- Elvidge, C.D.; Sutton, P.C.; Ghosh, T.; Tuttle, B.T.; Baugh, K.E.; Bhaduri, B.; Bright, E. A global poverty map derived from satellite data. Comput. Geosci. 2009, 35, 1652–1660. [Google Scholar] [CrossRef]
- Jean, N.; Burke, M.; Xie, M.; Davis, W.M.; Ermon, S. Combining satellite imagery and machine learning to predict poverty. Science 2016, 353, 790–794. [Google Scholar] [CrossRef] [PubMed] [Green Version]
- Ghosh, T.; Elvidge, C.D.; Sutton, P.C.; Baugh, K.E.; Ziskin, D.; Tuttle, B.T. Creating a Global Grid of Distributed Fossil Fuel CO2 Emissions from Nighttime Satellite Imagery. Energies 2010, 3, 1895–1913. [Google Scholar] [CrossRef]
- Zhou, Y.Y.; Li, X.C.; Asrar, G.R.; Smith, S.J.; Imhoff, M. A global record of annual urban dynamics (1992–2013) from nighttime lights. Remote Sens. Environ. 2018, 219, 206–220. [Google Scholar] [CrossRef]
- Zhao, X.Z.; Yu, B.L.; Liu, Y.; Yao, S.J.; Lian, T.; Chen, L.J.; Yang, C.S.; Chen, Z.Q.; Wu, J.P. NPP-VIIRS DNB Daily Data in Natural Disaster Assessment: Evidence from Selected Case Studies. Remote Sens. 2018, 10, 1526. [Google Scholar] [CrossRef] [Green Version]
- Li, X.; Liu, S.S.; Jendryke, M.; Li, D.R.; Wu, C.Q. Night-Time Light Dynamics during the Iraqi Civil War. Remote Sens. 2018, 10, 858. [Google Scholar] [CrossRef] [Green Version]
- Koen, E.L.; Minnaar, C.; Roever, C.L.; Boyles, J.G. Emerging threat of the 21st century lightscape to global biodiversity. Glob. Chang. Biol. 2018, 24, 2315–2324. [Google Scholar] [CrossRef] [PubMed]
- Chand, T.R.K.; Badarinath, K.V.S.; Murthy, M.S.R.; Rajshekhar, G.; Elvidge, C.D.; Tuttle, B.T. Active forest fire monitoring in ttaranchal state, India using multi-temporal DMSP-OLS and MODIS data. Int. J. Remote Sens. 2007, 28, 2123–2132. [Google Scholar] [CrossRef]
- Elvidge, C.; Tilottama, G.; Kimberly, B.; Mikhail, Z.; Feng-Chi, H.; Selim, K.N.; Wilmon, P.; Quang, H.B. Rating the Effectiveness of Fishery Closures With Visible Infrared Imaging Radiometer Suite Boat Detection Data. Front. Mar. Sci. 2018, 5, 132. [Google Scholar] [CrossRef]
- Cole, T.A.; Wanik, D.W.; Molthan, A.L.; Roman, M.O.; Griffin, R.E. Synergistic Use of Nighttime Satellite Data, Electric Utility Infrastructure, and Ambient Population to Improve Power Outage Detections in Urban Areas. Remote Sens. 2017, 9, 286. [Google Scholar] [CrossRef] [Green Version]
- Shah, Z.; Taneja, J. Poster Abstract: Monitoring Electric Grid Reliability Using Satellite Data. In Proceedings of the 6th ACM International Conference on Systems for Energy-Efficient Buildings, Cities, and Transportation (BuildSys), New York, NY, USA, 13–14 November 2019; pp. 378–379. [Google Scholar]
- Min, B.; Gaba, K.M.; Sarr, O.F.; Agalassou, A. Detection of rural electrification in Africa using DMSP-OLS night lights imagery. Int. J. Remote Sens. 2013, 34, 8118–8141. [Google Scholar] [CrossRef]
- Min, B.; Gaba, K.M. Tracking Electrification in Vietnam Using Nighttime Lights. Remote Sens. 2014, 6, 9511–9529. [Google Scholar] [CrossRef] [Green Version]
- Dugoua, E.; Kennedy, R.; Urpelainen, J. Satellite data for the social sciences: Measuring rural electrification with night-time lights. Int. J. Remote Sens. 2018, 39, 2690–2701. [Google Scholar] [CrossRef]
- Ramdani, F.; Setiani, P. Multiscale assessment of progress of electrification in Indonesia based on brightness level derived from nighttime satellite imagery. Environ. Monit. Assess. 2017, 189, 15. [Google Scholar] [CrossRef] [PubMed]
- Andrade-Pacheco, R.; Savory, D.J.; Midekisa, A.; Gething, P.W.; Sturrock, H.J.W.; Bennett, A. Household electricity access in Africa (2000–2013): Closing information gaps with model-based geostatistics. PLoS ONE 2019, 14, 14. [Google Scholar] [CrossRef] [Green Version]
- Falchetta, G.; Pachauri, S.; Parkinson, S.; Byers, E. A high-resolution gridded dataset to assess electrification in sub-Saharan Africa. Sci. Data 2019, 6, 9. [Google Scholar] [CrossRef] [Green Version]
- Principe, J.; Takeuchi, W. Supply and Demand Assessment of Solar PV as Off-Grid Option in Asia Pacific Region with Remotely Sensed Data. Remote Sens. 2019, 11, 2255. [Google Scholar] [CrossRef] [Green Version]
- Corbane, C.; Florczyk, A.; Pesaresi, M.; Politis, P.; Syrris, V. GHS Built-Up Grid, Derived from Landsat, Multitemporal (1975–1990–2000–2014); R2018A; European Commission, Joint Research Centre (JRC): Petten, The Netherlands, 2018. [Google Scholar] [CrossRef]
- Pesaresi, M.; Huadong, G.; Blaes, X.; Ehrlich, D. A Global Human Settlement Layer From Optical HR/VHR RS Data: Concept and First Results. IEEE J. Sel. Top. Appl. Earth Obs. Remote Sens. 2013, 6, 2102–2131. [Google Scholar] [CrossRef]
- Florczyk, A.J.; Corbane, C.; Ehrlich, D.; Freire, S.; Kemper, T.; Maffenini, L.; Melchiorri, M.; Pesaresi, M.; Politis, P.; Schiavina, M.; et al. GHSL Data Package 2019; European Union: Luxembourg, 2019. [Google Scholar]
- Bian, J.H.; Li, A.N.; Huang, C.Q.; Zhang, R.; Zhan, X.W. A self-adaptive approach for producing clear-sky composites from VIIRS surface reflectance datasets. ISPRS J. Photogramm. Remote Sens. 2018, 144, 189–201. [Google Scholar] [CrossRef]
- Chen, Z.Q.; Yu, B.L.; Yang, C.S.; Zhou, Y.Y.; Yao, S.J.; Qian, X.J.; Wang, C.X.; Wu, B.; Wu, J.P. An extended time series (2000-2018) of global NPP-VIIRS-like nighttime light data from a cross-sensor calibration. Earth Syst. Sci. Data 2021, 13, 889–906. [Google Scholar] [CrossRef]
- Li, X.C.; Zhou, Y.Y.; Zhao, M.; Zhao, X. A harmonized global nighttime light dataset 1992–2018. Sci. Data 2020, 7, 168. [Google Scholar] [CrossRef]
- Kaifang, S.; Bailang, Y.; Yixiu, H.; Yingjie, H.; Bing, Y.; Zuoqi, C.; Liujia, C.; Jianping, W. Evaluating the Ability of NPP-VIIRS Nighttime Light Data to Estimate the Gross Domestic Product and the Electric Power Consumption of China at Multiple Scales: A Comparison with DMSP-OLS Data. Remote Sens. 2014, 6, 1705–1724. [Google Scholar]
- Elvidge, C.D.; Baugh, K.; Zhizhin, M.; Hsu, F.C.; Ghosh, T. VIIRS night-time lights. Int. J. Remote Sens. 2017, 38, 5860–5879. [Google Scholar] [CrossRef]
- Elvidge, C.D.; Zhizhin, M.; Ghosh, T.; Hsu, F.C.; Taneja, J. Annual Time Series of Global VIIRS Nighttime Lights Derived from Monthly Averages: 2012 to 2019. Remote Sens. 2021, 13, 922. [Google Scholar] [CrossRef]
- Wang, J.F.; Hu, Y. Environmental health risk detection with GeogDetector. Environ. Model. Softw. 2012, 33, 114–115. [Google Scholar] [CrossRef]
- Ju, H.R.; Zhang, Z.X.; Zuo, L.J.; Wang, J.F.; Zhang, S.R.; Wang, X.; Zhao, X.L. Driving forces and their interactions of built-up land expansion based on the geographical detector—A case study of Beijing, China. Int. J. Geogr. Inf. Sci. 2016, 30, 2188–2207. [Google Scholar] [CrossRef]
- Ren, Y.; Deng, L.Y.; Zuo, S.D.; Song, X.D.; Liao, Y.L.; Xu, C.D.; Chen, Q.; Hua, L.Z.; Li, Z.W. Quantifying the influences of various ecological factors on land surface temperature of urban forests. Environ. Pollut. 2016, 216, 519–529. [Google Scholar] [CrossRef] [Green Version]
- Shen, J.; Zhang, N.; He, B.; Liu, C.Y.; Li, Y.; Zhang, H.Y.; Chen, X.Y.; Lin, H. Construction of a GeogDetector-based model system to indicate the potential occurrence of grasshoppers in Inner Mongolia steppe habitats. Bull. Entomol. Res. 2015, 105, 335–346. [Google Scholar] [CrossRef] [Green Version]
- Du, Z.Q.; Xu, X.M.; Zhang, H.; Wu, Z.T.; Liu, Y. Geographical Detector-Based Identification of the Impact of Major Determinants on Aeolian Desertification Risk. PLoS ONE 2016, 11, e0151331. [Google Scholar] [CrossRef]
- Wang, J.F.; Li, X.H.; Christakos, G.; Liao, Y.L.; Zhang, T.; Gu, X.; Zheng, X.Y. Geographical Detectors-Based Health Risk Assessment and its Application in the Neural Tube Defects Study of the Heshun Region, China. Int. J. Geogr. Inf. Sci. 2010, 24, 107–127. [Google Scholar] [CrossRef]
- Wang, J.F.; Zhang, T.L.; Fu, B.J. A measure of spatial stratified heterogeneity. Ecol. Indic. 2016, 67, 250–256. [Google Scholar] [CrossRef]
- Zhang, Y.; Wang, J.; Liu, Y. The potentiality and model of China’s hollowing village reclamation based on Meta-analysis. J. Nat. Resour. 2022, 37, 110–120. [Google Scholar] [CrossRef]
- Li, Y.; Wang, H. Spatial distribution of rural population flow at the village level in China: Evidence from village samples in the third national agricultural census. Chin. Rural Econ. 2020, 4, 124–144. [Google Scholar]

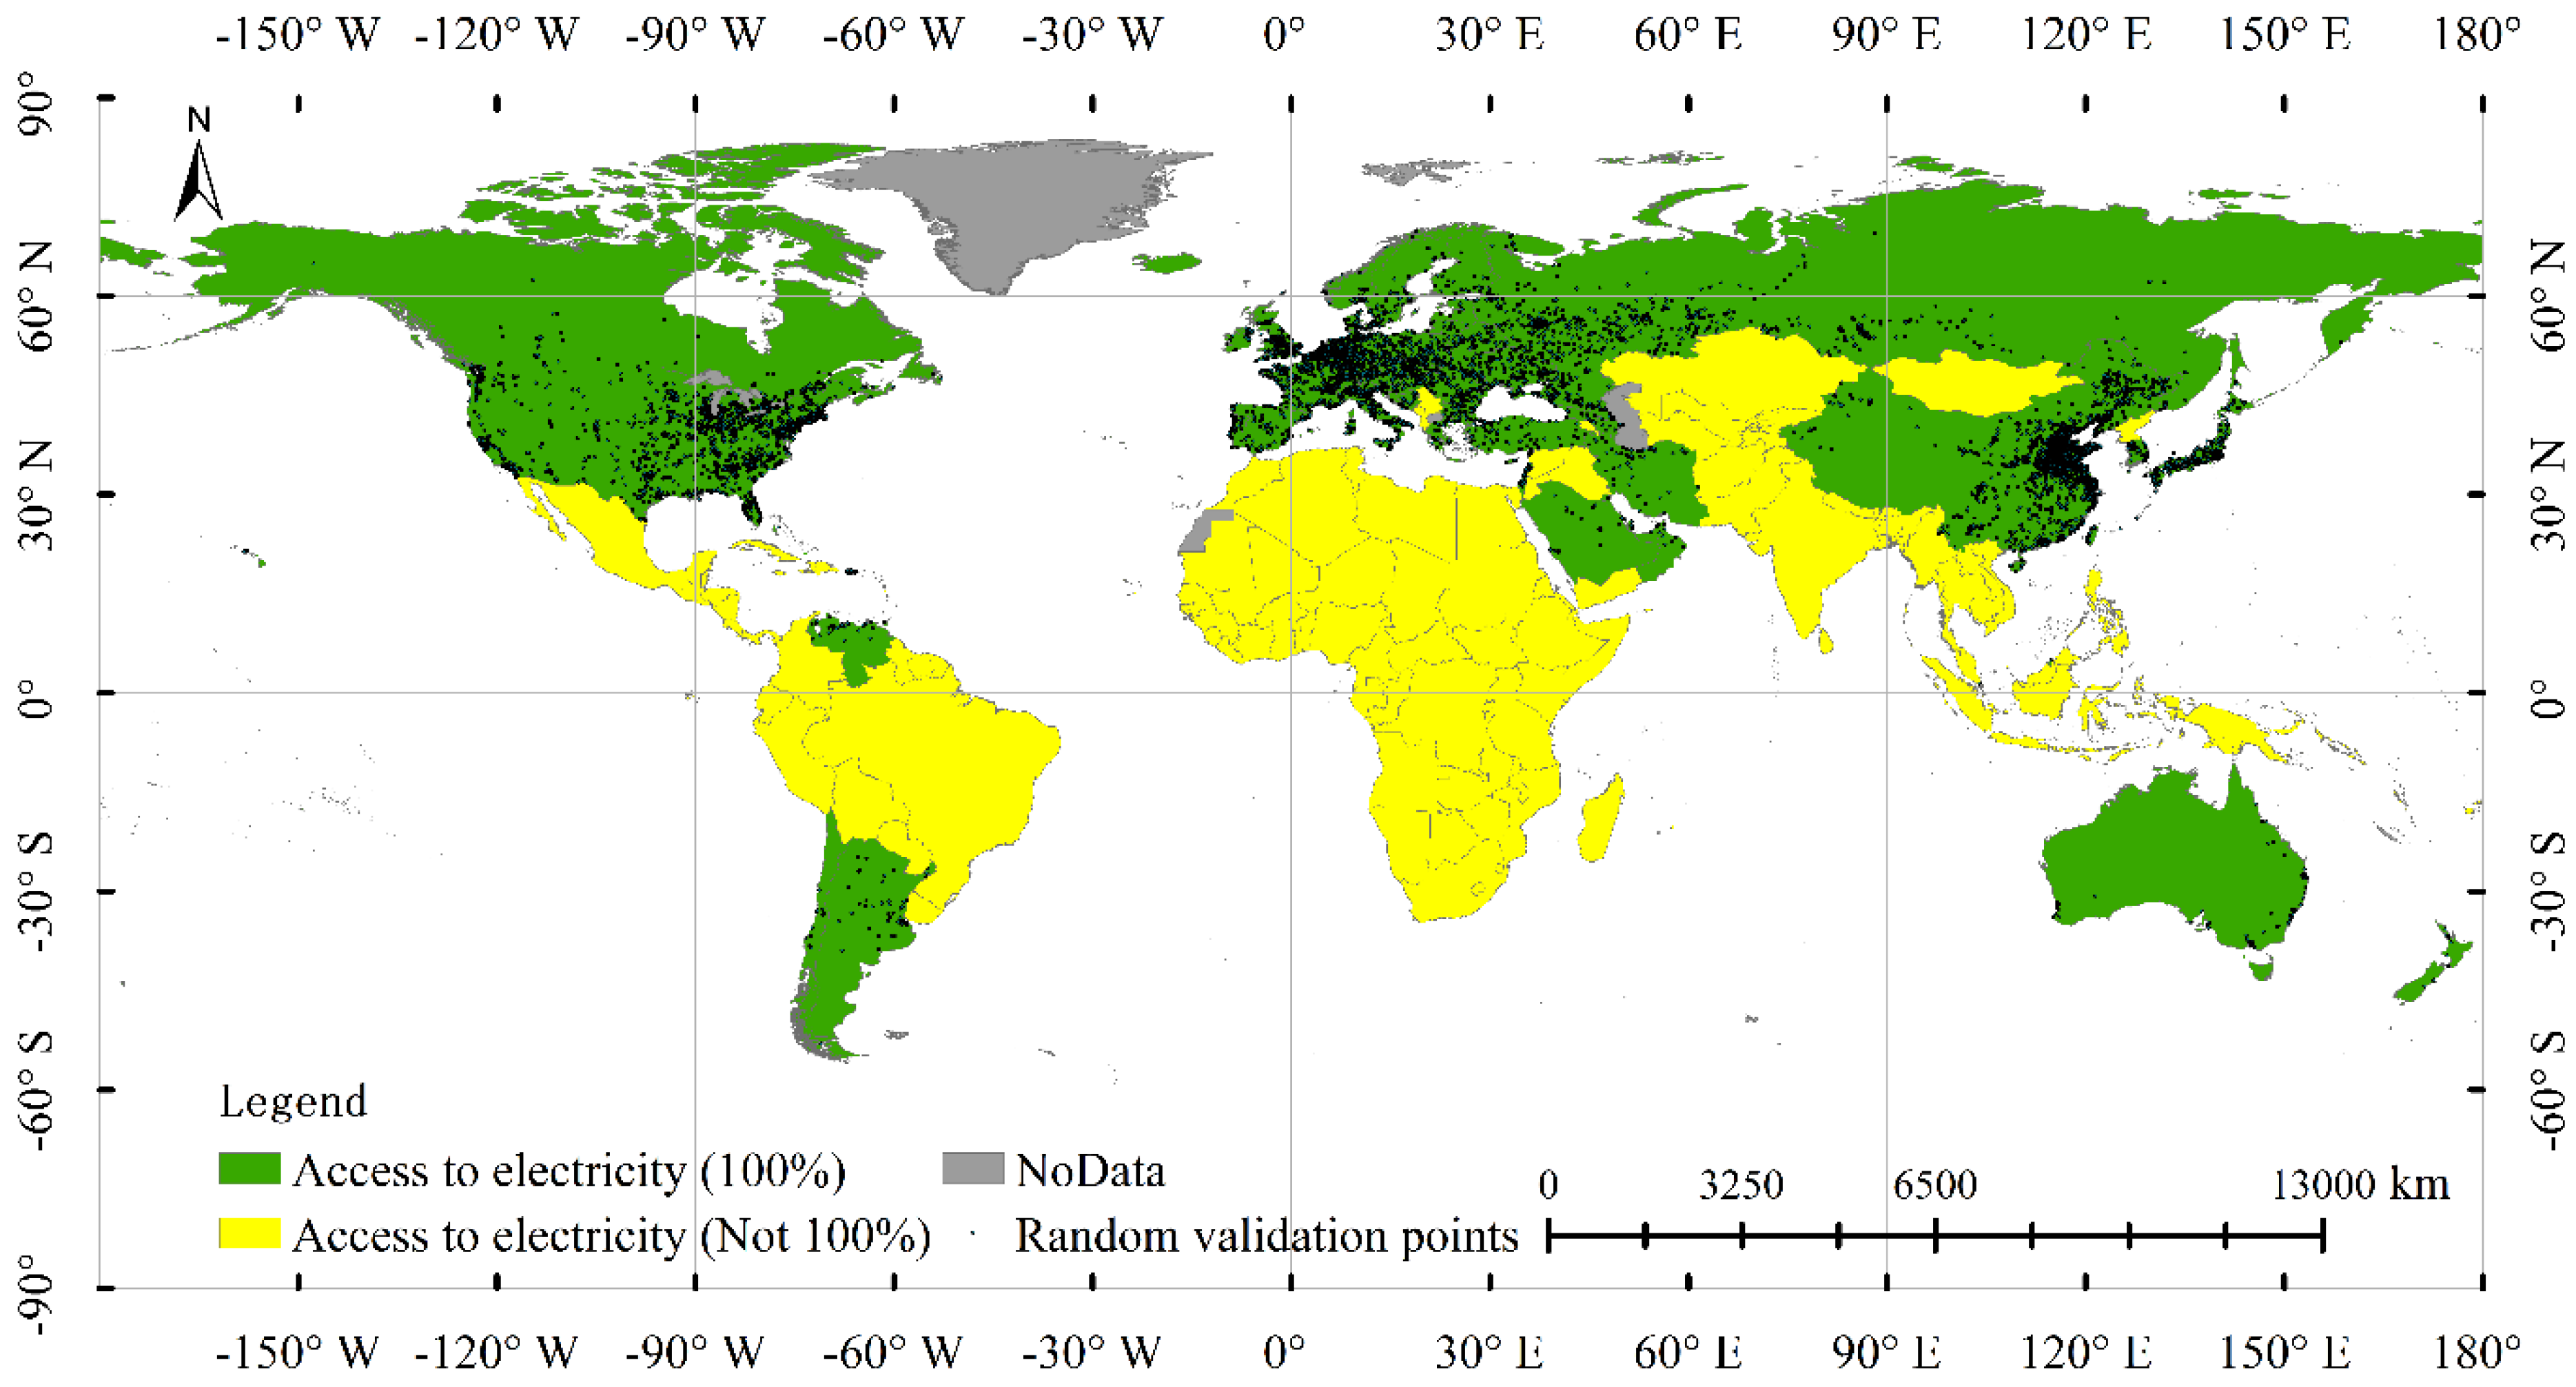

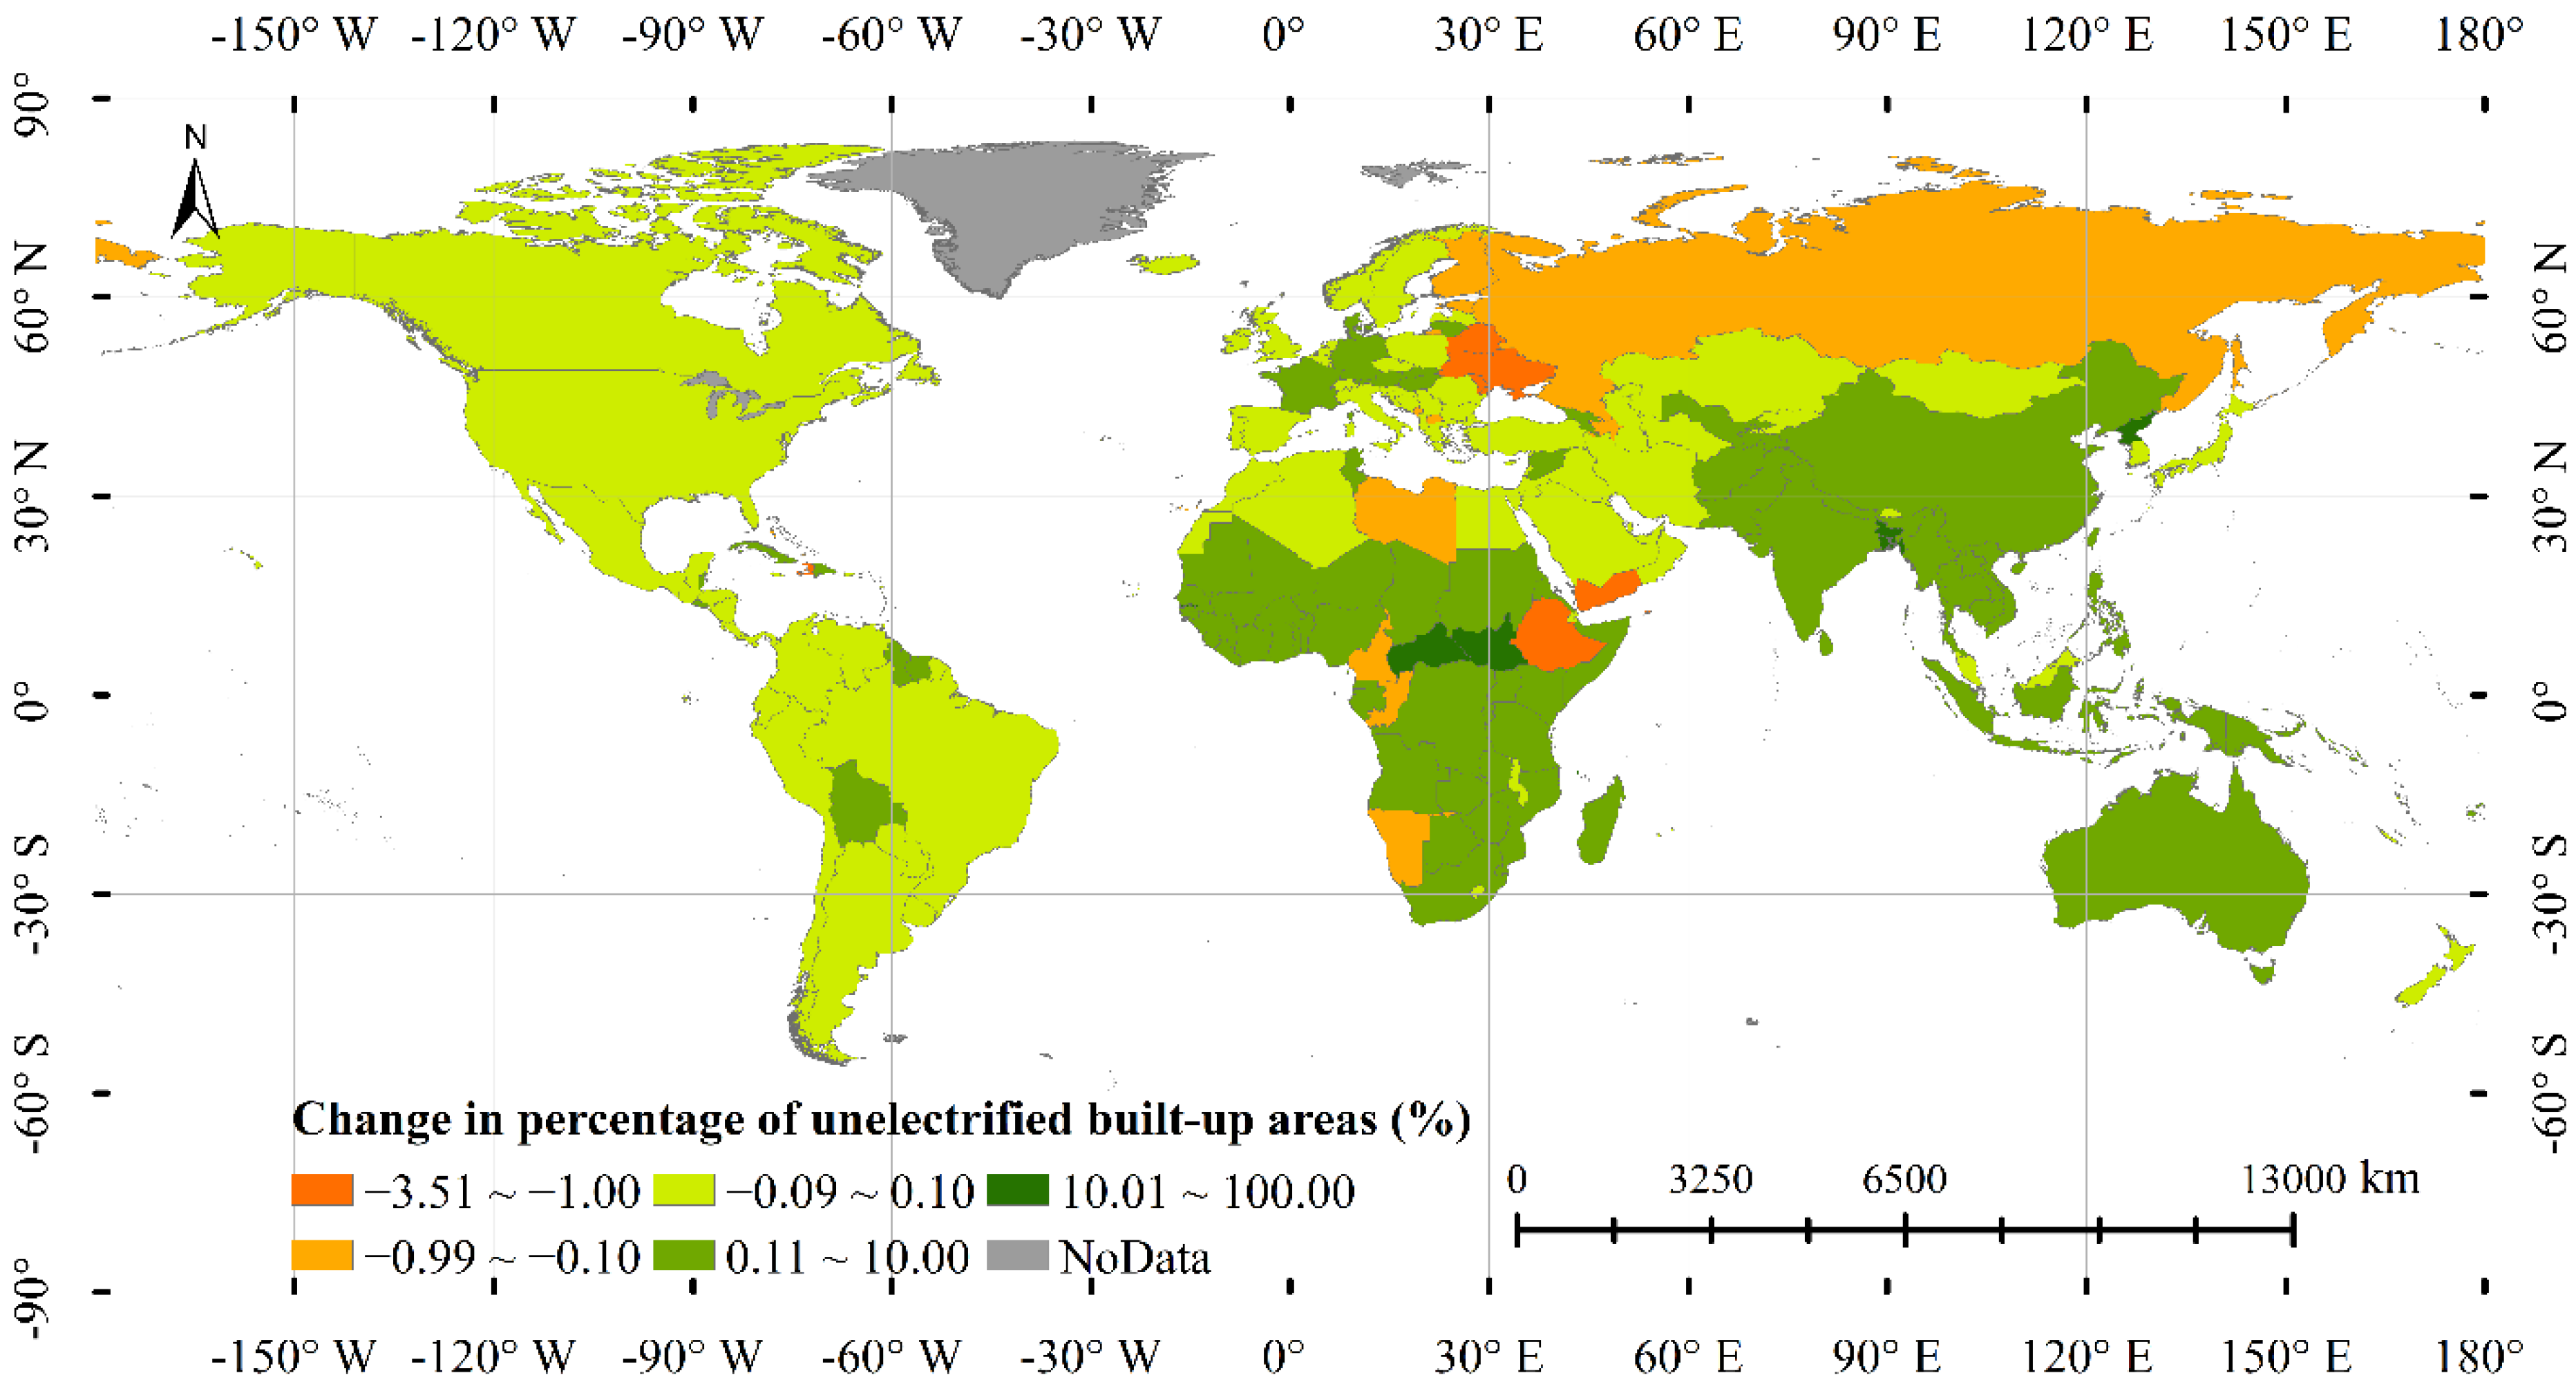
| Year | Identification Threshold (nW/cm2/sr) | Number of Identification Errors in Built-Up Areas | Number of Identification Errors in Unelectrified Areas | Built-Up Area Identification Accuracy | Unelectrified Area Identification Accuracy |
|---|---|---|---|---|---|
| 2014 | 0.30 | 46 | 1672 | 96.64% | 91.13% |
| 0.35 | 68 | 939 | 95.03% | 95.02% | |
| 0.40 | 93 | 724 | 93.21% | 96.16% | |
| 2020 | 0.43 | 38 | 1024 | 97.22% | 94.57% |
| 0.48 | 50 | 685 | 96.35% | 96.36% | |
| 0.52 | 65 | 525 | 95.25% | 97.21% |
Publisher’s Note: MDPI stays neutral with regard to jurisdictional claims in published maps and institutional affiliations. |
© 2022 by the authors. Licensee MDPI, Basel, Switzerland. This article is an open access article distributed under the terms and conditions of the Creative Commons Attribution (CC BY) license (https://creativecommons.org/licenses/by/4.0/).
Share and Cite
Gao, X.; Wu, M.; Niu, Z.; Chen, F. Global Identification of Unelectrified Built-Up Areas by Remote Sensing. Remote Sens. 2022, 14, 1941. https://doi.org/10.3390/rs14081941
Gao X, Wu M, Niu Z, Chen F. Global Identification of Unelectrified Built-Up Areas by Remote Sensing. Remote Sensing. 2022; 14(8):1941. https://doi.org/10.3390/rs14081941
Chicago/Turabian StyleGao, Xumiao, Mingquan Wu, Zheng Niu, and Fang Chen. 2022. "Global Identification of Unelectrified Built-Up Areas by Remote Sensing" Remote Sensing 14, no. 8: 1941. https://doi.org/10.3390/rs14081941
APA StyleGao, X., Wu, M., Niu, Z., & Chen, F. (2022). Global Identification of Unelectrified Built-Up Areas by Remote Sensing. Remote Sensing, 14(8), 1941. https://doi.org/10.3390/rs14081941


