Article

Why Is It Important to Consider Dust Aerosol in the Sevastopol and Black Sea Region during Remote Sensing Tasks? A Case Study

by
Darya V. Kalinskaya
* and
Anna S. Papkova
Marine Hydrophysical Institute of the Russian Academy of Sciences, 2 Kapitanskaya St., 299011 Sevastopol, Russia
*
Author to whom correspondence should be addressed.
Remote Sens. 2022, 14(8), 1890; https://doi.org/10.3390/rs14081890
Submission received: 27 February 2022 / Revised: 28 March 2022 / Accepted: 11 April 2022 / Published: 14 April 2022
(This article belongs to the Special Issue Seawater Bio-Optical Characteristics from Satellite Ocean Color Data)

Abstract

:
Atmospheric correction of satellite optical data is based on an assessment of the optical characteristics of the atmosphere, such as the aerosol optical thickness of the atmosphere and the spectral slope, the so-called Angstrom parameter. Inaccurate determination of these parameters is one of the causes of error in the retrieval of remote-sensed reflectance spectra. In this work, a large array of field and satellite data measured in Sevastopol and the northeastern part of the Black Sea were used, including ship-based measurements of atmospheric characteristics and sea reflectance, MODIS Aqua/Terra, and VIIRS NOAA/NPP Level 2 remote-sensed reflectance and atmospheric data. In total, three episodes of Saharan dust transfer over the Black Sea region were considered, mainly in the autumn-winter period. The purpose of this study was to show the numerical differences between the atmospheric parameters measured at the surface level and by satellites, and show their relationship with the differences between in situ and satellite remote-sensed reflectance. Based on the information identified, we propose an algorithm for additional correction of satellite level 2 data that uses a two-parametric model of the Black Sea remote-sensed reflectance as a first approximation. Moreover, additional correction significantly reduces the discrepancy between in situ and retrieved remote-sensed reflectance, especially in short-wave spectral bands.

Graphical Abstract

1. Introduction

Atmospheric dust aerosol noticeably absorbs solar radiation and is more transparent to thermal radiation. The dust aerosol generated by dust storms mainly consists of particles that originate from minerals. Fine fractions (particles with a diameter <1 μm) can be transferred by air flow far from their source and remain in the atmosphere for a long time. The effect of aerosols can be determined by defining the optical and microphysical properties of particles, and their complex refractive index, particle size distribution, density, shape, and total concentration in the atmosphere [1].
The main tasks of remote sensing monitoring of the transport of absorbed aerosols include rapid identification of the sources and assessment of the affected areas. Aqua and Terra MODIS data represent basic data used for remote sensing [2], and data from full-scale measurements of the optical parameters of the atmosphere of the underlying surface are used for refinement.
The combined MODIS data (Terra and Aqua) represents the satellite data of the aerosol products MODIS aerosol optical thickness (AOT) level 2. It is possible to obtain an accurate synoptic representation of the aerosol level in the atmosphere using this type of satellite information. Aerosols absorb and disperse incident sunlight, which reduces visibility and increases the optical depth. Various kinds of aerosols have various kinds of effects, both direct and indirect. As a direct effect, aerosols scatter sunlight back into space. As an indirect effect, they can either help or hinder the development of clouds, which in turn either cools or warms the planet [3].
Level 3 satellite data provide quantitative information. These data are used to predict aerosols’ impacts in various models. To determine the spatial distribution of atmospheric aerosol, and determine its optical and microphysical characteristics, data from the measurements of ground-based photometers and remote laser (lidar) sensing methods of the underlying surface are actively used. Due to the difficulties in determining aerosols’ characteristics using remote sensing methods, an essential stage is the theoretical (model, numerical) study of the possibilities of their determination using field measurements of aerosols’ characteristics [4]. The development of technical systems has made it possible to obtain accurate data on the physical processes occurring both in the atmosphere and in the aerosols themselves. To refine the aerosol models used to restore aerosol characteristics in satellite data, the AERONET ground-based photometric observation network (AErosolROboticNETwork, http://aeronet.gsfc.nasa.gov, accessed on 1 November 2021) was created. To measure the optical characteristics of atmospheric aerosol over the Black Sea and Sevastopol, in particular, the SPM photometer developed at the IAO SB RAS is used, which registers and records signals from the Sun in a cloudless sky in the following 10 spectral channels: 339, 373, 439, 499, 673, 871, 939, 1044, 1555, and 2139 nm. The aerosol optical thickness of the atmosphere is calculated according to Bouguer law by spectral attenuation of the direct solar radiation. To determine AOT, the attenuation of light due to molecular Rayleigh scattering and absorption by gaseous components of the atmosphere is calculated, which is then subtracted from the total optical thickness of the atmosphere. The results of the intercalibration of SPM data (measured in Sevastopol) and the AERONET network are presented in Refs. [5,6]. These measurements are used to calculate the aerosol optical thickness at each wavelength, excluding the 936 nm channel, which is used to determine the water vapor in the atmospheric column [7]. Aerosol optical thickness (AOT sometimes appear as AOD) is an indicator of the variability of the optical properties of the atmosphere due to the correlation between the concentrations of aerosol particles and light attenuation coefficients, the data for which are obtained through the widespread use of satellite remote sensing methods [8,9,10].
One of the informative hydro-optical characteristics of seawater is the reflectance coefficient or remote-sensed reflectance (Rrs). It is almost entirely determined by substances that are suspended and dissolved in seawater. This characteristic is important for understanding the biogeochemical processes that occur in the surface layer, such as primary production, the response of the marine ecosystem to climatic changes, etc. [11,12].
Calculations of Rrs at sea level from Rrs at the top of the atmosphere require atmospheric correction. Therefore, Rrs at sea level directly depends on the contribution of the aerosol component in atmospheric radiance since aerosols are highly variable and can significantly distort the results of atmospheric correction. Atmospheric correction, including the estimation of aerosols’ contribution, is performed according to the methodology proposed by Gordon and Wang [13], with updated aerosol models and approaches to the selection of these models [14]. This algorithm is based on the measurements of 2 sensors in the near infrared (e.g., 748 and 869 nm for MODIS), where the contribution of upwelling sea radiance is usually small and can be accurately estimated using the iterative approach to bio-optical modeling [15].
The purpose of this study was to research the effect of dust aerosol on error in the restoration of the spectral reflectivity of seawater and the aerosol optical thickness (AOT) using remote sensing methods (namely, atmospheric correction algorithms based on MODIS satellite data) and ground measurements based on AERONET network measurements.
To achieve this goal, a comparative analysis of the optical characteristics of a day (1) on which dust aerosol was present in the atmosphere and (2) a day on which the atmosphere was clean was performed.
The main object of research was the Black Sea, which has been studied for many decades by researchers and scientists from the Marine Hydrophysical Institute of the Russian Academy of Sciences (Sevastopol) [16]. Studies investigating the influence of absorbing aerosols on the optical characteristics of the atmosphere and surface layer of the Black Sea were initiated in the early 2000s [17,18] and have been urgent until now. With the advent of new instruments and higher-resolution satellite information, events and phenomena occurring in the atmosphere over the study area can now be described more accurately. Further comparison of the values of Rrs(λ), obtained by remote sensing, with their typical values based on decades of statistics and observation values serves as a criterion of reliability algorithms for atmospheric correction [19,20,21].
The relevance of this work is that incorrect consideration of the atmospheric component (presence of dust, biomass combustion products, industrial emissions, etc.) can distort the values of the restored Rrs(λ) values for the Black Sea and subsequently lead to large errors in the calculation of chlorophyll concentrations [19].
Every year, from March to October, many occurrences of dust transfers are recorded over the Sevastopol and Black Sea region, mainly from the southwest direction (Saharan dust) [21,22,23]. It is known that dust aerosol particles in the atmosphere have a significant impact on climate change, air quality, and the state of the ecosystem as a whole. Measurement of the optical and microphysical characteristics of dust aerosols using remote sensing methods is associated with several difficulties as dust particles show significant variability regarding their size, shape, and chemical composition, depending on the origin (region) and meteorological conditions. Previous studies (Kahn et al., 2016) have shown that in the presence of absorbing aerosol, such as dust, smoke, or anthropogenic particles, satellite AOT measurements are distorted, leading to the presence of anomalies in SSA single scatter albedo values and incorrect atmospheric correction. To assess the influence of regional features of the Black Sea region on the operation of the NASA Ocean color algorithm [24], cases of dust transport over the Mediterranean Sea were also considered separately.

2. Materials and Methods
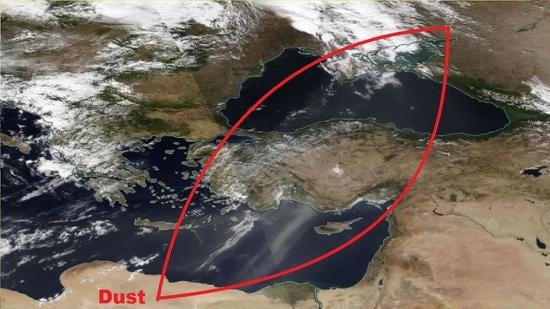
2.1. Study Area

The study area included the central and western parts of the Black Sea. The discussed data were obtained during the research period from 2017 to 2021. Data provided by the MODIS (Aqua) satellite and a network of ground-based photometers AERONET were analyzed. MODIS (or Medium-Resolution Spectroradiometer) is the key instrument aboard the Terra (EOS AM) and Aqua (EOS PM) satellites. Terra’s orbit around the Earth is calculated in such a way that in the morning, it passes from north to south through the equator, and Aqua passes through the equator from south to north in the afternoon. MODIS Terra and MODIS Aqua scan the entire surface of the Earth every 2 days, collecting data in 36 spectral bands. These data improve the understanding of global dynamics and processes occurring on land, in the oceans, and in the lower atmosphere. MODIS plays a vital role in the development of proven global interactive models of the Earth system capable of predicting global climate change trends with sufficient accuracy. Since 2005, MODIS data have regularly been used in the Ocean Color algorithms [25].

2.2. Field Measurements

As in situ measurements, we analyzed the measurement data of the CIMEL-318 photometer for 2 coastal AERONET stations located in the western Black Sea (Galata_Platform, Gloria (since 2019 Section_7_Platform)). Based on the measurements obtained at these two stations, we analyzed data on the reconstructed brightness of seawater (Lwn). Analysis of the main optical characteristics of atmospheric aerosols, such as AOT, the Angstrom parameter, and the size distribution of aerosol particles, was carried out to confirm the presence of dust aerosols over the Black Sea. More information about the AERONET network and its Ocean Color application can be found in Zibordi et al. (2018). Moreover, in this work, we used data obtained with a portable photometer, SPM [5,26,27] in Sevastopol. SPM has advantages regarding its spectral range and the number of measurement channels (filters). For additional information on the vertical stratification of atmospheric aerosol, and the trajectories of air masses, this paper presents the results of the modeling of 7-day back trajectories (7-day back trajectories analyses) of the AERONET (BTA) network.

2.2.1. Aerosol Concentration Measurements

The dust analyzer Atmas is designed for express and inspection measurements and continuous monitoring of the mass concentration of dust with various origins and chemical compositions while monitoring the maximum permissible concentrations in the atmospheric air.
One of the main quality indices of atmospheric air is the amount of suspended particles in the air. Suspended particles (particulate matter, PM) refer to atmospheric pollutants, which are often analyzed in terms of their particle mass concentrations. Special attention should be devoted to the concentration of species in the air with particle diameters less than 2.5 (PM2.5) and 10 μm (PM10) [28]. When measuring atmospheric air, the metrological characteristics of Atmas only determine the maximum 1-time concentration of aerosols, which is determined both for the total suspended matter and separately for PM10 and PM2.5. The concentration of impurities in the atmosphere is determined by a sample taken over a 20–30-min time interval.
At the same time, the volume of the sample is not regulated. The high sensitivity of the piezo-balance method does not require large volumes of samples to be taken to measure the mass concentrations of dust at the level of 0.1 mg/m3 and higher (specific air flow is 1 L/min). Dust sampling is carried out by a built-in blower through the impactor, which is installed on the inlet flange. The impactor has two interchangeable nozzles and a removable manifold. A dust sensor is installed in the center of the output flange of the measuring chamber, the signal from which is fed to the frequency measurement unit. The measuring nozzle PM10 has a calibrated hole, which filters out particles with an aerodynamic diameter of more than 10 μm from the air flow, which are deposited on the impactor collector. In still air, particles with an aerodynamic diameter of more than 10 μm are practically absent since their gravitational settling rate is high. Suspended atmospheric particles are present as a mixture, whose physicochemical characteristics vary as a function of their origin, the different meteorological factors influencing their transport, and particle interactions. Ultrafine particles with diameters less than 0.1 μm, which are often called fine suspended particles, are also classified as PM2.5. PM2.5 particles account for 50–70% of PM10 over most of the territory of Europe [28].

2.2.2. Atmospheric Measurements

The spectral transparency of the atmosphere was measured with an SPM Sun photometer [26] over 11 wavelengths λ (340, 379, 441, 501, 548, 675, 872, 1020, 1244, 1556, and 2134 nm). The obtained measurement data measurements were used to calculate the spectral AOT τ λ α , the parameters α and β of the Angstrom formula τ λ α = β · λ α , and the optical depth of coarse- ( τ c ) and fine-mode aerosol τ 500 f = τ 500 a τ c for the wavelength 500 nm. The methods and algorithms used to calculate these characteristics are presented in [26,27,29].
The SPM Sun photometer is a portable instrument that is used to measure the spectral transparency in the transparency windows of the atmosphere and the absorption band of water vapor (940 nm). Data processing (calculation of physical characteristics) is performed using a special computer program.
The SPM photometer receives direct radiation from the Sun as it passes through the Earth’s atmosphere. In order to obtain the aerosol optical thickness due to scattering, molecular scattering and absorption are excluded from the signal. Earlier (from 2006 to 2015), in the Black Sea region, similar measurements were carried out using the CE-318 photometer within the framework of the AERONET international program. Since 2015, work under this program has been suspended and photometric measurements have been continued with the SPM. Based on previous research results, SPM measurements agree well with the data provided by the CE-318 photometer; however, the methods used to determine τ λ α , τc and τ 0.5 f for the CE-318 and SPM photometers differ [26,27]. From the comparison of joint measurements using these photometers, the mean square of the deviation between the results ( τ λ α , τc, and τ 0.5 f ) does not exceed the error of their measurements. The error of AOT when using SPM in the spectral range of 340–2134 nm does not exceed 0.01.

2.3. Satellite Data

Many ocean color applications use global layer 3 (L3) satellite data due to their regular Earth grid coordinate system. However, the quality of a satellite ocean color determination is usually assessed based on level 2 (L2) data with the original span resolution and satellite geometry. L3 staking and gridded data represent the products of L2 satellite data by matching satellites to points. L2 and L3 satellite data for chlorophyll-a photosynthetic pigment are compared with a conventional in situ dataset, showing similar L2 and L3 in situ satellite imagery for both MODIS (Aqua) and VIIRS-SNPP. This implies that L2 validation results are generally applicable to L3 data. However, when L3 data are generated from L2 data, uncertainties arise. The comparison of L3 data introduces a wider time window between the in situ measurement time and satellite observation time, which can affect the satellite image quality or algorithm performance [30,31,32,33].
As a follow-up VIIRS instrument, VIIRS-NOAA-20 is essentially built in the same manner as VIIRS-SNPP. Therefore, the sensor characteristics of the two instruments are very similar. Both SNPP and NOAA-20 operate in the 824-km Sun-synchronous polar orbit, which crosses the equator at about 13:30 local time. There is about a 50-min delay between the paths of NOAA-20 and SNPP, which makes the NOAA-20′s path run through the middle of 2 adjacent SNPP paths, and vice versa. The overlap of the spatial coverages of the two sensors automatically fills each other’s gaps caused by high sensor-zenith angles and high Sun glint contamination, and it significantly reduces the missing pixels in the merged images. In addition, the ocean color products from SNPP and NOAA-20 have the same spatial and temporal resolution and are processed with the same software package, i.e., the Multi-Sensor Level-1 to Level-2 (MSL12) ocean color data processing system [30,31,32,33]. Therefore, the statistics of their ocean color products are very similar, and in fact, the data can be directly merged without adjustment to match with each other’s statistical properties. However, much data is still missing in the merged VIIRS SNPP/NOAA-20 products [33].

3. Results

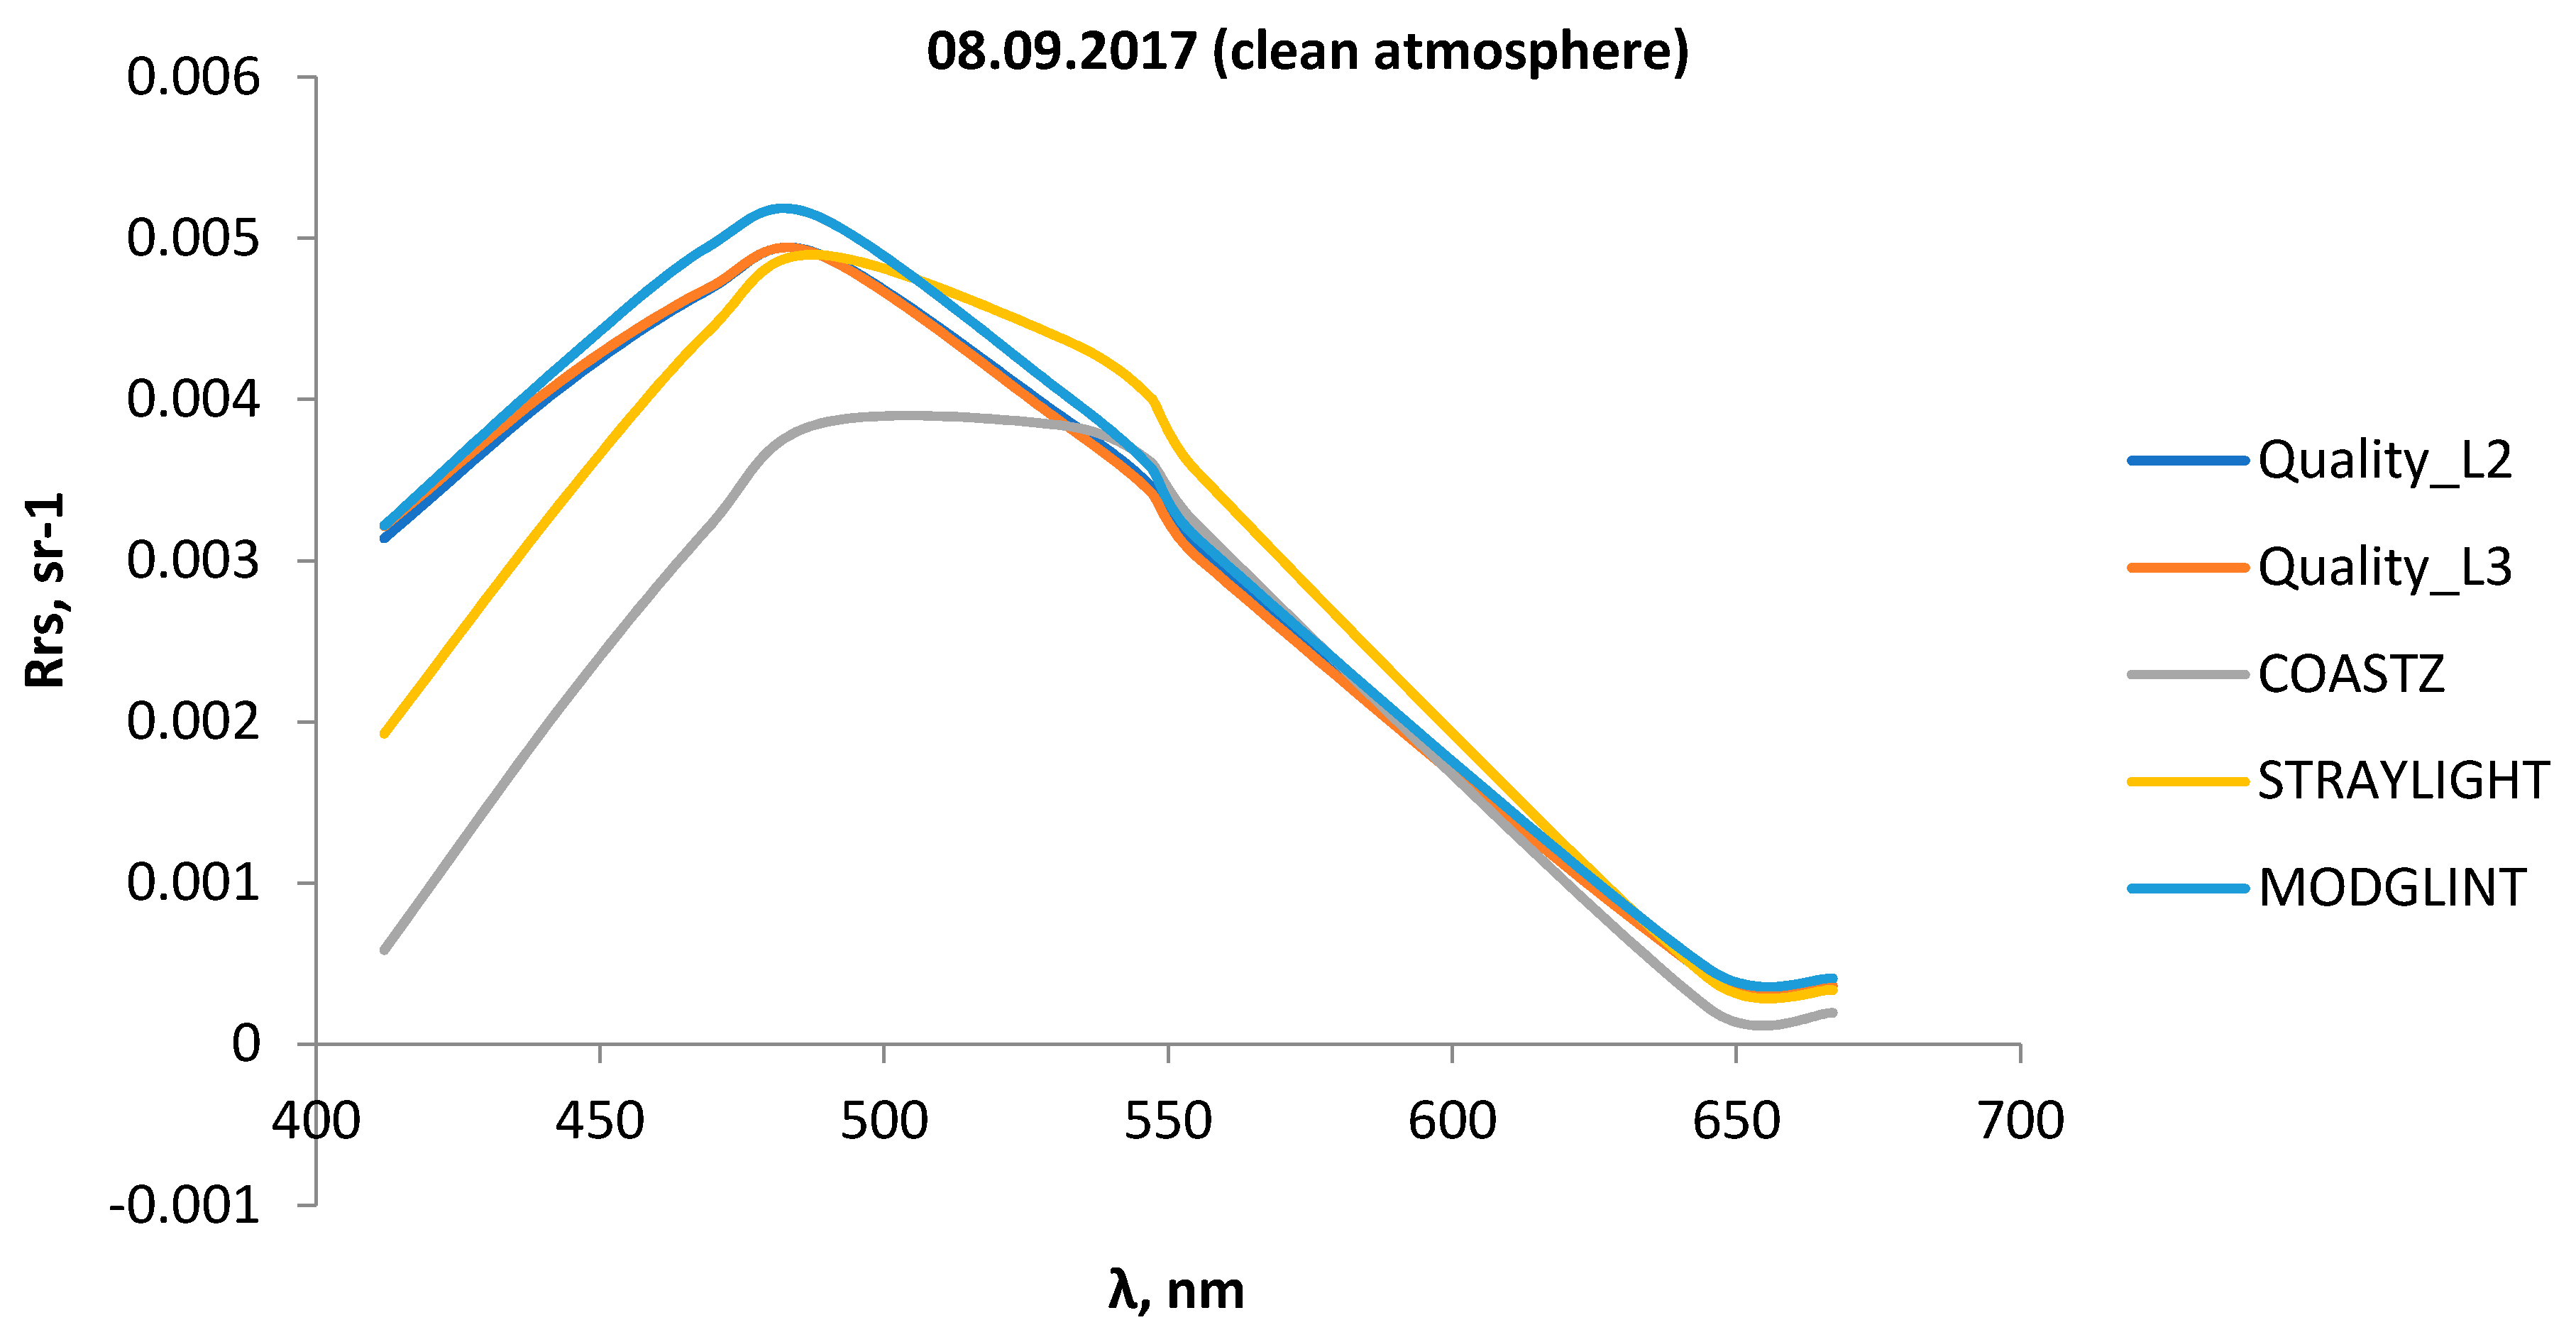
3.1. In Situ Spectra

3.1.1. MODIS In Situ Spectra

For a reliable assessment of the errors in the remote sensing reflectance values, identification of a day on which the atmosphere was clean and a day on which dust transport occurred, with no phytoplankton seasonal blooming, over the Black Sea is necessary. On 12 September 2017, a case of dust aerosol transport was recorded over the Black Sea region, as confirmed by in situ measurements (AERONET, SPM), satellite measurements (MODIS, VIIRS), and the 7-day AERONET (BTA) and HYSPLIT backward trajectories. The date meets the abovementioned criteria, namely: no sea blooms were present and this day was free of clouds, which allows evaluation of the standard values of Rrs(λ). It should be noted that in this paper, all time is presented in Greenwich Mean Time.
For comparison, 8 September 2017 was selected as the day with a clean atmosphere in the same month and in the same year. On this day, very low (less than 0.1) values of AOT were observed, which corresponds to a very clean atmosphere, and the satellite images did not contain clouds (Figure 1).
Thus, the first stage of the study was to consider the eastern part of the Black Sea (analysis of data of the coordinates of in situ measurements for the corresponding pixels).

3.1.2. Atmospheric Data

Analysis of in the situ SPM data indicating the optical characteristics of atmospheric aerosol on 12 September 2017 showed increased AOT values over the entire spectral range. So, for example, on this day, the average daily AOT values at the wavelengths of 500 and 872 nm (AOT (500) and AOT (872)) were 0.37 and 0.2, respectively, which is 1.8 times more than the average monthly value at a given wavelength. The average daily values of AOT (500) and AOT (872) were 0.07 and 0.04, respectively, on 8 September 2017, indicating a very clean atmosphere.
To determine the aerosol source on 12 September 2017 and 8 September 2017, the data of the modeling of the air mass transfer AERONET (BTA) and HYSPLIT were analyzed (Figure 2).
Figure 2 shows that according to the modeling data of both AERONET and HYSPLIT, on 12 September 2017, dust transport from the side of the Sahara Desert was recorded at all studied heights while on 8 September 2017, westerly transport from the Atlantic Ocean was recorded. To estimate the contribution of atmospheric dust aerosol to the atmospheric correction of satellite data over the region under study, the error flag statistics (l2_flags) (https://oceancolor.gsfc.nasa.gov/atbd/ocl2flags/, accessed on 12 November 2021) were analyzed.

3.2. Comparison of Satellite and In Situ AOT

The next stage of this study was the processing of the Ocean Color L2 files. These data were used to analyze the variability of the optical characteristics depending on the error flags. In addition to AOT and Angstrom data, remote sensing data provide data on the chlorophyll-a concentration (2 OSI and OC3 models) and diffuse attenuation coefficient at a wavelength of 490 nm. L3 data can be considered as being the most reliable for the selected dates. In total, 173,182 pixels were analyzed for the eastern part of the Black Sea on the day of dust transfer. The statistics did not consider the error flags of a purely technical nature (PRODFAILE, MAXITER, etc.) nor errors that made up less than 1% of the data according to the L2 level data. Thus, on the day of dust transfer (12 September 2017) and the day with a clean atmosphere (8 September 2017), an array of Rrs data were obtained for statistical analysis (Table 1).
An analysis of the data results from the 2 tables shows that during the dust transfer, AOT at a wavelength of 869 nm (AOT(869)) increased by more than 5-fold. This is due to the absorption capacity of dust. So, according to the SPM data obtained in Sevastopol, it was demonstrated that on 12 September 2017, the Angstrom parameter values did not differ from the Angstrom parameter values on the day with a clean atmosphere. The dust that reached Sevastopol on this day contained a lot of fine-mode aerosol fractions and the values of α decreased by 17–20% relative to the monthly average. The chlorophyll data recorded on the day on which dust aerosols were present in the atmosphere were overestimated by 9% according to the results from the calculation of the 2 models for L2 and L3. When analyzing the error flags, the largest number of pixels was noted for MODGLINT (moderate pollution due to Sun glare). On the day of dust transfer, the percentage of pixels with this flag was 59% of the level 2 data and 69% of the eastern part of the Black Sea with a clear atmosphere. Low-quality Rrs(λ) in the clear OZ of the southern IO in the second half of the year may be attributed to contamination due to residual Sun glint signals. During MODIS and VIIRS image processing from level 1 to level 2 implemented by the NASA Ocean Biology Processing Group (OBPG), pixels are flagged as “HIGLINT” and “MODGLINT” if the normalized Sun glint surface-reflected radiance (LGN) exceeds 0.005 and 0.0001 sr−1, respectively, and then a glint correction is applied according to the wind. Pixels with a “HIGLINT” flag are masked during level 2 to level 3 processing while those with a “MODGLINT” flag are reserved. The statistics indicate the impact of residual Sun glint contamination. Hence, the development of an advanced algorithm to remove residual Sun glint is still needed (Liu et al., 2021). Since the number of MODGLINT pixels was not significantly different between 12.09.2017 and 08.09.2017, we can conclude that the MODGLINT flag equally contributed to the calculations of Rrs(λ) on and before the day on which dust transfer occurred. For the convenience of analysis of the spectra of the brightness coefficient, we visualized the calculations according to Table 1.
From Figure 3, it follows that with dust, even with the maximum pixel quality (Quality_L3), Rrs(λ) in the short-wavelength region showed a negative value. This once again proves the incorrect operation of the atmospheric correction algorithms. Moreover, Rrs(λ) on the day on which the atmosphere was clean was 20% higher than when dust aerosols were present (Figure 3).
The correlation coefficient between the values of the remote sensing reflectance for days on which the atmosphere was clear and for days on which dust was present was calculated by the following formula:
C o r r e l ( X , Y ) = ( x x ¯ ) ( y y ¯ ) ( x x ¯ ) 2 ( y y ¯ ) 2
where x ¯ and y ¯ are the sample mean (in our case, for Rrs(λ)). Thus, the correlation of Rrs(λ) for L2 was 83%, and for L3, it was 84%. This confirms that an error of 16–17% was caused by the contribution of dust.
In the second stage of this study, analysis of the correlation between satellite and in situ measurement data (AERONET, portable spectrophotometer SPM) was carried out for the western part of the Black Sea, since the dust transfer that occurred on 12.09.2017 also affected it. A comparative analysis of the optical characteristics of the two dates for the AERONET Galata_Platform station is shown in Figure 4. Figure 4 shows the temporal variability of the daily AOT on 08.09.2017 and 12.09.2017. Figure 4 also demonstrates the spectral course of AOT according to the results from the SPM spectrophotometer measurements over Sevastopol on the investigated dates.
From Figure 4, it follows that even with the maximum correction of the Cimel-318 data (level 2) on the day on which dust transfer occurred, the AOT values were more than 1.5 times higher than the monthly average values on 08.09.2017. Moreover, the advantages of the day on which coarse aerosol fraction was present in the atmosphere, 12 September 2017, are indicated by the low Angstrom parameter values: α = 0.67, with a monthly average value for September of α = 1.415. A similar situation was observed for the Gloria station. Unfortunately, on the day on which dust transfer occurred, none of the coastal Black Sea stations recorded corresponding satellite values. Thus, we decided to search for the points (pixels) closest to the stations for the Galata_Platform station (43.045; 28.193). The closest possible pixel on 12.09.2017 was a coordinate located 7.4 km from the Galata_Platform station, namely, the point with the coordinates 43.005, 28.194. On 08.09.2017, data for this pixel could not be fully restored. Among the error flags in this pixel, only STRAYLIGHT (probable straylight contamination) was noted. The results from the comparison of the satellite and AERONET measurements at the corresponding coordinates are presented in Table 2.
Despite the similarity of the AOT and Angstrom parameter values, the correlation of the in situ and satellite remote sensing reflectance was 79%, with a clear tendency to underestimate the actual values. On the day on which the atmosphere was clean, 08.09.2017, despite the presence of turbidity, according to the MODIS data, the correspondence of the values was 88%. Best of all, in situ measurements can be reconstructed from VIIRS data, which is associated with its spatial resolution. However, due to the lack of VIIRS satellite data, a similar analysis on 12 September 2017 could not be carried out over the Black Sea. For the coastal zone of the Crimean Peninsula (the central part of the Black Sea), an analysis of the in situ measurements was carried out, which were obtained using a portable spectrophotometer, SPM. At the Marine Hydrophysical Institute of the Russian Academy of Sciences, the measurements were carried out on 08.09.2017 and 12.09.2017 (44.616; 33.517).
For the Sevastopol region, the AOT and particle size distribution data were obtained from the SPM measurements, which confirmed the presence of a large number of coarse aerosol dust particles in the atmosphere above the region under study. So, for example, on 12 September 2017, at this station, the average daily value of AOT (500) was 0.37 and the Angstrom parameter on this day was 0.8. On 8 September 2017, the average daily data of FROM (500) was 0.07, which is 3 times less than the average monthly values (FROM (500) = 0.21), confirming the presence of a clean atmosphere over the studied region on this day.
As noted earlier, according to the spectrophotometer data, there were obvious overestimations of AOT on the day on which dust transport occurred (12 September 2017). According to the MODIS data (Aqua), the data of the corresponding pixels were also analyzed. The closest possible pixel for comparison (44.617; 33.442) was recorded on 12.09.2017 according to the MODIS (Aqua) AOT values at a wavelength of 869 nm (AOT (869) = 0.23), which is an indicator of atmospheric turbidity. The Angstrom parameter is also consistent with the results of the portable spectrophotometer (α = 1.16 (α =1.02 according to the MODIS data)). At this point, there was only one error flag: MODGLINT. The spectral variability of the sea brightness coefficient showed identical spectral behavior for the cases of both the western and eastern parts of the Black Sea, with a clear underestimation of the Rrs(λ) values in the shortwave region.
Another day on which dust transport from the Sahara occurred in the Black Sea region, namely 27 September 2020, was analyzed in a similar way. The return trajectories of AERONET also confirmed the presence of dust transport (Figure 5).

3.3. Comparison of Atmospheric Parameters

To assess the optical characteristics of dust aerosol for the period from 27 September to 30 September 2020, the measurement data obtained using the SPM photometer were analyzed. According to the in situ data obtained from the R/V “Professor Vodyanitsky” in the Kerch Strait region, the average daily value of the aerosol optical thickness 27 September was 0.3 and = 0.16 for AOT (500) and AOT (872), respectively; for September 29, AOT (500) = 0.27 and AOT (872) = 0.18 and for 30 September, AOT (500) = 0.26 and AOT (872) = 0.15, which is more than 1.5 times the monthly average value of AOT (500) (0.156) and AOT (872) (0.09). Analysis of the fine- and coarse-mode aerosol fraction’s contribution to the total value of AOT for the days under study revealed that on more than 70% of the days, the atmospheric aerosol consisted of particles from the fine-mode fraction. The average daily water vapor content for the period from September 27 to September 30 exceeded the monthly average values by more than 1.5 times, confirming that these particles contained condensed water vapor. The aerosol optical thickness at a wavelength of 500 nm was obtained from measurements of the attenuation of direct solar radiation by the SPM photometer on 10.09.2020. AOT (500) was 0.12, which is less than the monthly average value of AOT (500) of 0.16. On 10.09.2020, analysis of the coarse-dispersed suspension’s contribution to the total distribution of the aerosol optical thickness showed the presence of both large (>1 μm) particles (30%) and the fine fraction (70%). Measurement data from the Atmas dust analyzer also showed low concentrations of both large particles (PM10 = 0.016) and smaller particles (PM2.5 = 0.01) on this day. The monthly averages for September were 0.017 and 0.01 for PM10 and PM2.5, respectively. Unfortunately, no Atmas data for 27 September 2020 were available; however, on the eve of 26 September 2020, the concentration of PM10 particles reached 0.03, which indicated the presence of coarse particles in the atmosphere.
As the clouds developed and moved, they precipitated onto the underlying surface of the study region. By analogy with the case of 12.09.2017, we considered the Ocean Color L2 data for the selected date from the VIIRS and MODIS (Aqua) satellites.
From 27 September 2020–29 September 2020, AOT over the Mediterranean and Black Seas reached the limit values, namely > 0.4. In the Black Sea, according to the MODIS data, an area of 166,855 pixels was identified. For a comparative analysis of the day on which dust transport occurred and the day on which the atmosphere was clean, the nearest possible date was 10.09.2020. This time interval is caused by a number of factors, including extensive cloudiness, dust transport with clouds, and strong Sun glint (Figure 6).
The fundamental difference from the previous date of this case is the lower percentage of Sun glint, specifically 20% of the total number of valid pixels from the L2 data (on 12.09.2017, MODGLINT was present in 59% of the pixels) (Figure 7).
Thus, we selected a site in the central-eastern region of the Black Sea for which a comparative analysis of the L2 and L3 data was carried out. In a similar way, on 29 September 2020, an analysis of the hydro-optical characteristics of the eastern part of the Black Sea during dust transport from the Sahara was carried out. It was also confirmed by back trajectories and measurements using a portable spectrophotometer, SPM. According to the VIIRS and MODIS data, the following values were obtained (Table 3).
Analysis of the data presented in Table 3 shows that for intensive dust transport (with a large AOT and high concentrations of dust aerosol particles), more significant error flags are present, namely LOWLW (very low sea brightness) and TURBIDW (turbid water detected). Figure 7 demonstrates the spectral variability of the mean Rrs(λ) values. According to the data presented in Table 3, the value of the correlation of Rrs(λ) data of different qualities was calculated. As a result, it was found that the correlation between the 2 dates was 28% for the L3 data and 27% for L2, which is a low indicator of the atmospheric correction quality of the results on the days of intense dust transfers. For dates other than 12 September 2017, a sharp increase (by a factor of 2) in the chlorophyll-a concentration values between the 2 dates, which is not typical for the Black Sea region, was observed. This may be due to incorrect atmospheric correction of the level 1B products. As can be seen from the data in Table 3 the values of Rrs(λ) were significantly underestimated in the visible region of the spectrum, and the spectral curve of Rrs(λ) in the long-wavelength region showed twice the values of Rrs(λ), which were overestimated in comparison with the day on which the atmosphere was clean. On 29.09.2020, the performed calculation of the correlation between the results of the L2 and L3 data in the case of dust transport according to the MODIS results showed a 99% accuracy (while negative values at a wavelength of 412 nm were retained) and VIIRS was 87%. It is also shown in the table that the chlorophyll-a measurements for the 2 m satellites differed. The correlation of data from a day on which the atmosphere was clean in the Black Sea region (10.09.2020) according to the MODIS L2 data was 47% and 58% according to the L3 data, which is also a low indicator of the reliability of the results.
Similar to the previous cases, a statistical analysis of the error flags of the satellite images obtained on 29.09.2020 was carried out and the correlation of the spectral luminance coefficient values was considered. Thus, for the same area of the eastern Black Sea with a size of 33,027 pixels, the statistics of the error flags (data processing quality) were recorded. As in the case of dust transfer on 27.09.2020, the largest number of flags were observed in the LOWLW (13%) and MODGLINT (23%) data. A comparative analysis of the data from the 2 satellites is presented in Table 3 for 2 quality levels.
As the third period of dust aerosol transfer over the Black Sea occurred from 25–27 February 2021, where, according to the AERONET data, there was also an increase in the AOT at Section_7 station, low values of the Angstrom parameter and a predominance of coarse-mode atmospheric aerosol were recorded (Figure 8). According to the Ocean Color images, the closest date for comparative analysis was 10.02.2021 due to the absence of clouds over the western part of the Black Sea. A similar analysis was also carried out (as in previous cases) through SeaDas (Figure 9).
Among the error flags noted on 27.02.2021, the following cases were recorded for STRAYLIGHT, ATMWARM, and TURBIDW, as for the previous dates: AOT recorded by the satellite near the Section_7 station (nearest possible pixels) = 0.25. On 10.02.2021, no error flags were found and the average AOT was 0.04. By analogy, a comparative analysis is presented in Table 4.
The Rrs(λ) values for the L2 and L3 levels on the days on which the atmosphere was clean (10 February 2021 and 27 February 2021) showed a 99 % correlation. However, when the effect of dust transport on the restoration of the sea brightness coefficients was considered (correlation between the day on which the atmosphere was clean and the atmosphere was dusty), the coefficient dropped to 53% for L3.
On 27 February 2021, in situ AERONET Ocean Color measurements of the normalized water-leaving radiance (Lwn) for the Section_7 station were also recorded.
The correlation between the in situ measurements recorded on 27 February 2021 and 10 February 2021 was 98%, which indicates the spectrum had the same shape and the close order of the values (Table 5).
On 27 February 2021, dust was mainly concentrated in the central part of the Black Sea, where, according to the VIIRS results, the AOT and Angstrom parameter values increased to 0.274 and 0.684, respectively.
According to the SPM measurements recorded on 26 and 27 February, increases relative to the monthly average AOT values were observed in all spectral ranges of the device. So, for example, AOT (500) on 26 February was 0.43, and AOT (500) on 26 February was 0.28, which is 1.7 times greater than the monthly average value of AOT (500) of 0.16. For the studied dates, low (<1) values of the Angstrom parameter on 26 and 27 February 2021 (α = 0.5 and α = 0.38, respectively) were also observed. At the same time, the particle size distribution analysis showed the advantage of large particles (more than 60%). According to the SPM measurements on 10.02.2021, AOT (500) was 0.062, which confirms that there was a day on which the atmosphere was clean over the territory of Sevastopol.
The data recorded by the Atmas dust analyzer on the day that dust transfer was registered (27.02.2021) showed excess PM10 concentrations of 0.03 (with average monthly PM10 concentrations of 0.016), which also confirms the presence of large dust particles in the atmosphere on that day.

4. Discussion

In general, the spectral coefficient Rrs(λ) does not have anomalous extremes. It should be noted that according to the results of the in situ AERONET and satellite data validation, a high correlation proficiency for the Black Sea stations (Galata_Platfrom and Gloria (from 2019 Section_7)), varying from 95 to 98% depending on the spectral channel, was found. However, none of the considered dates in [33] corresponded to the days on which dust transport occurred, which does not fully reflect the statistics. This study reveals the need for validation, taking into account dust aerosol, to identify trends in the distortion of Rrs(λ) spectra from satellite data. From Table 1, Table 2, Table 3, Table 4 and Table 5, it can be seen that AOT and the Angstrom parameter coincided on days on which the atmosphere was clean and days on which dust was present, but in the presence of Sun glint, the satellite data overestimated AOT, decreasing the Angstrom parameter by more than 3 and 2.5-fold. Similar tendencies in the variability of the spectral brightness coefficient values of the Black Sea during dust transfer were obtained by V. Suetin and described in 2008 [17]. Then, a study was also carried out on two dates (clean atmosphere and dust) for the SeaWIFS and MODIS satellites with a comparative analysis of AERONET data. Negative values for the Black Sea brightness coefficients in the shortwave region (412 nm) were obtained in a similar way. Thus, it follows that since 2008, the problem has not been resolved. Similar results regarding an underestimation of the brightness coefficient of the Black Sea, depending on the presence of Sun glint, are described in [18], where the authors note that this problem occurs for both MODIS and VIIRS.
Moreover, the introduction of error flags in dusty pixels remains particularly relevant, since they are capable of fully distorting the spectra. In [22], it was demonstrated that at the upper boundary values of AOT (>0.3), with dust transport, the values of the spectral brightness coefficient of the sea are greatly overestimated while for the Mediterranean Sea, they remain unchanged. Unfortunately, the ABSAER flag, indicating the presence of an absorbing aerosol, is generally not taken into consideration because the detection algorithm is still unreliable, and from 2012, it has been completely removed. Perhaps, based on the combinations of other error flags, it will be possible to detect dusty pixels in satellite images.
Moreover, this study shows the need not only for analysis but also the discovery of tools to predict dust transport events over the Black Sea region. The authors of [23] describe one such forecasting method.

5. Conclusions

A comparative analysis of the spectral brightness coefficient values obtained from the results of satellite measurements on days on which dust transport occurred in the atmosphere (12.09.2017, 27.09.2020, and 29.09.2020) and days on which the atmosphere was clean (08.09.2017 and 10.09.2020) showed that in the presence of dust aerosol, even with the maximum pixel quality (L3), the spectral luminance factor in the shortwave region had negative values. Moreover, the spectral brightness coefficients obtained on a day on which the atmosphere was clean were 20% higher than on a day on which dust transfer occurred. Thus, the correlation of the Rrs(λ) values for the L2 data was 83% and for L3, it was 84%.
For intense dust transport with a clear predominance of the coarse fraction on 27 September 2020, and the next day, on which the atmosphere was clean (10 September 2020), the correlation was 28% for L3 and 27% for L2, which is a low indicator of the atmospheric correction quality of the results for this period of intense dust transfers. For all dates except 12 September 2017, a sharp increase (by a factor of 2) in the chlorophyll-a concentration between the 2 dates was obtained, which is not typical for the Black Sea region.
Comparative analysis of the satellite and in situ data results revealed that even with identical or close AOT and Angstrom parameter values, the correlation of the in situ and satellite spectral brightness coefficients was 79%, with a clear tendency to underestimate the actual values. For the day on which the atmosphere was clean, 08.09.2017, despite the presence of turbidity according to the MODIS data, the correspondence of the values was 88%.
The Rrs(λ) values for L2 and L3 levels on a day on which the atmosphere was clean during winter (10 February 2021 and on 27 February 2021), the correlation was 99%. However, considering the dust transport effect on the restoration of the sea brightness coefficients (correlation between a day on which the atmosphere was clean and a day on which the atmosphere was dusty), the coefficient decreased to 53% for L3.
It is also worth noting that this study showed that a specific set of error flags can also serve as an indicator of dust, and specifically, in almost all cases, the combination included STRAYLIGHT, ATMWARM, TURBIDW, LOWLW, and MODGLINT.
The results obtained confirmed that the error in the values of the atmospheric correction of 16–17% was caused by dust aerosol. This fact also confirms that on days on which dust transfer occurs, it is necessary to carry out an additional atmospheric correction, and in situ measurements are also required in the studied region, as two points (AERONET stations) on the coast of the western part of the Black Sea cannot enable correct validation of satellite and field data.

Author Contributions

Conceptualization, D.V.K. and A.S.P.; methodology D.V.K. and A.S.P.; formal analysis, A.S.P. and D.V.K.; investigation, A.S.P. and D.V.K.; data curation, A.S.P. and D.V.K.; writing—original draft preparation, D.V.K.; writing—review and editing, D.V.K. and A.S.P.; visualization, D.V.K. and A.S.P. All authors have read and agreed to the published version of the manuscript.

Funding

This research was carried out in the framework of Russian Federation state task#0555-2021-0003 “Operational oceanology”, and RFBR grant 19-05-50023 and 19-35-90066.

Data Availability Statement

The data presented in this study are available on request from the corresponding author.

Acknowledgments

The authors thank Tom Kucsera, Brent Holben, Giuseppe Zibordi and Gene Feldman’s group from NASA for the pre-delivery of AOT data, calculations of BTA data, processing of measurements obtained at the Sevastopol AERONET station, and for the possibility of using high-quality photometric measurement data. The authors also express their gratitude to Sakerin S.M. and Kabanov D.M. for providing the SPM photometer and its software.

Conflicts of Interest

The authors declare no conflict of interest.

References

  1. Barber, P.W.; Hill, S.C. Light Scattering by Particles: Computational Methods; World Scientific: Singapore, 1990; 261p. [Google Scholar]
  2. Vermote, E.F.; El Saleous, N.Z.; Justice, C.O. Atmospheric correction of MODIS data in the visible to middle infrared: First results. Remote Sens. Environ. 2002, 83, 97–111. [Google Scholar] [CrossRef]
  3. Lyapustin, A.; Wang, Y. MAIAC-Multi-Angle Implementation of Atmospheric Correction for MODIS. AGU Spring Meet. Abstr. 2007, 2007, A51B-05. [Google Scholar]
  4. Vasiliev, A.B.; Ivlev, L.S.; Kugeyko, M.M.; Lysenko, S.A.; Terekhin, N.Y. Evaluation of the accuracy of control measurements in the problems of optical diagnostics of microphysical parameters of aerosol. Opt. Atmos. Ocean 2009, 22, 873–881. [Google Scholar]
  5. Firsov, K.M.; Bobrov, E.V. Restoring the aerosol optical thickness by ground measurements of SPM photometer. Math. Phys. Comput. Model. 2014, 2, 21. [Google Scholar]
  6. Kalinskaya, D.V.; Kabanov, D.M.; Latushkin, A.A.; Sakerin, S.M. Atmospheric aerosol optical thickness measurements in the Black sea region (2015–2016). Atmos. Ocean. Opt. 2017, 6, 489–496. [Google Scholar]
  7. Suslin, V.V.; Slabakova, V.K.; Kalinskaya, D.V.; Pryakhina, S.F.; Golovko, N.I. Optical features of the Black Sea aerosol and the sea water upper layer based on in situ and satellite measurements. Phys. Oceanogr. 2016, 1, 20–32. [Google Scholar]
  8. Ueda, S.; Miura, K.; Kawata, R.; Furutani, H.; Uematsu, M.; Omori, Y.; Tanimoto, H. Number–size distribution of aerosol particles and new particle formation events in tropical and subtropical Pacific Oceans. Atmos. Environ. 2016, 142, 324–339. [Google Scholar] [CrossRef] [Green Version]
  9. Mordas, G.; Plauškaitė, K.; Prokopčiuk, N.; Dudoitis, V.; Bozzetti, C.; Ulevicius, V. Observation of new particle formation on Curonian Spit located between continental Europe and Scandinavia. J. Aerosol Sci. 2016, 97, 38–55. [Google Scholar] [CrossRef]
  10. Kalinskaya, D.V.; Papkova, A.S. Optical characteristics of atmospheric aerosol from satellite and photometric measurements at the dust transfers dates. In Proceedings of the SPIE 26th International Symposium on Atmospheric and Ocean Optics, Atmospheric Physics, Moskow, Russia, 12 November 2020. [Google Scholar] [CrossRef]
  11. Lee, Z.; Marra, J.; Perry, M.J.; Kahru, M. Estimating oceanic primary productivity from ocean color remote sensing: A strategic assessment. J. Mar. Syst. 2015, 149, 50–59. [Google Scholar] [CrossRef]
  12. Karalli, P.G.; Glukhovets, D.I. Retrieving optical characteristics of the Russian Arctic seas water surface layer from shipboard and satellite data. Mod. Probl. Remote Sens. Earth Space 2020, 17, 191–202. [Google Scholar] [CrossRef]
  13. Gordon, H.R.; Wang, M. Retrieval of water-leaving radiance and aerosol optical thickness over the oceans with SeaWiFS: A preliminary algorithm. Appl. Opt. 1994, 33, 443–452. [Google Scholar] [CrossRef] [PubMed]
  14. Ahmad, Z.; Franz, B.; McClain, C.; Kwiatkowska, E.; Werdell, J.; Shettle, E.; Holben, B. New aerosol models for the retrieval of aerosol optical thickness and normalized water-leaving radiances from the SeaWiFS and MODIS sensors over coastal regions and Open Oceans. Appl. Opt. 2010, 49, 5545–5560. [Google Scholar] [CrossRef] [PubMed]
  15. Wang, M.; Gordon, H.R. A Simple, Moderately Accurate, Atmospheric Correction Algorithm for SeaWiFS. Remote Sens. Environ. 1994, 50, 231–239. [Google Scholar] [CrossRef]
  16. Varenik, A.V.; Kalinskaya, D.V. The Effect of Dust Transport on the Concentration of Chlorophyll-A in the Surface Layer of the Black Sea. Appl. Sci. 2021, 11, 4692. [Google Scholar] [CrossRef]
  17. Suetin, V.; Korolev, S.N.; Suslin, V.V.; Kucheryavyi, A.A. Improved interpretation of the data of observations of the black sea by a SeaWiFS satellite instrument in autumn 1998. Phys. Oceanogr. 2008, 18, 106–115. [Google Scholar] [CrossRef]
  18. Suetin, V.S.; Korolev, S.N.; Kucheryaviy, A.A. Sun Glint Manifestation at Evaluating the Black Sea Water Optical Parameters using Satellite Measurements. Phys. Oceanogr. 2016, 3, 47–56. [Google Scholar]
  19. Korchemkina, E.N.; Kalinskaya, D.V. Algorithm of Additional Correction of Level 2 Remote Sensing Reflectance Data Using Modelling of the Optical Properties of the Black Sea Waters. Remote Sens. 2022, 14, 831. [Google Scholar] [CrossRef]
  20. Suslin, V.V.; Suetin, V.S.; Korolev, S.N.; Kucheryaviy, A.A. Desert dust effects in the results of atmospheric correction of satelle sea color observations. In Proceedings of the 4th International Conference on Current Problems in Optics of Natural Waters, Nizhny Novgorod, Russia, 11–15 September 2007; pp. 184–187. [Google Scholar]
  21. Kalinskaya, D.V. Osobennosti opticheskikh kharakteristik pylevogo aerozol over the Black Sea [Features of optical characteristics of a dust aerosol over the Black Sea]. Ekologicheskaya bezopasnost coastal and shelf zones and complex use of shelf resources. Sci. Period. Ukr. 2012, 26, 151–162. Available online: http://nbuv.gov.ua/UJRN/ebpsz_2012_26%282%29__14 (accessed on 26 February 2022).
  22. Papkova, A.S.; Shibanov, E.B. Influence of dust aerosol on the results of atmospheric correction of remote sensing reflection of the Black and Mediterranean Seas from MODIS satellite data. Sovrem. Probl. Distantsionnogo Zondirovaniya Zemli Kosm. 2021, 18, 46–56. [Google Scholar] [CrossRef]
  23. Papkova, A.; Papkov, S.; Shukalo, D. Prediction of the Atmospheric Dustiness over the Black Sea Region Using the WRF-Chem Model. Fluids 2021, 6, 201. [Google Scholar] [CrossRef]
  24. Zhang, M.; Hu, C.; Barnes, B.B. Performance of POLYMER Atmospheric Correction of Ocean Color Imagery in the Presence of Absorbing Aerosols. IEEE Trans. Geosci. Remote Sens. 2019, 57, 6666–6674. [Google Scholar] [CrossRef]
  25. Gilerson, A.A.; Gitelson, A.A.; Zhou, J.; Gurlin, D.; Moses, W.; Ioannou, I.; Ahmed, S.A. Algorithms for remote estimation of chlorophyll-a in coastal and inland waters using red and near infrared bands. Opt. Express 2010, 18, 24109–24125. [Google Scholar] [CrossRef] [PubMed] [Green Version]
  26. Sakerin, S.M.; Kabanov, D.M.; Rostov, A.P.; Turchinovich, S.A.; Knyazev, V.V. Sun photometers for measuring spectral air transparency in stationary and mobile conditions. Atmos. Ocean. Opt. 2013, 26, 352–356. [Google Scholar] [CrossRef]
  27. Kabanov, D.M.; Veretennikov, V.V.; Voronina, Y.V.; Sakerin, S.M.; Turchinovich, Y.S. Information system for network solar photometers. Atmos. Ocean. Opt. 2009, 22, 121–127. [Google Scholar] [CrossRef]
  28. Kuznetsova, I.N.; Glazkova, A.A.; Shalygina, I.Y.; Nakhaev, M.I.; Arkhangel’skaya, A.A.; Zvyagintsev, A.M.; Semutnikova, E.G.; Zakharova, P.V.; Lezina, E.A. Seasonal and diurnal variability of particulate matter PM10 in surface air of Moscow habitable districts. Opt. Atmos. Okeana 2014, 27, 473–482. (In Russian) [Google Scholar]
  29. O’Neill, N.T.; Eck, T.F.; Smirnov, A.; Holben, B.N.; Thulasiraman, S. Spectral discrimination of coarse and fine mode optical depth. J. Geophys. Res. 2003, 108, 4559–4573. [Google Scholar] [CrossRef]
  30. O’Neill, N.T.; Dubovik, O.; Eck, T.F. A modified Angstrom coefficient for the characterization of sub-micron aerosols. Appl. Opt. 2001, 40, 2368–2375. [Google Scholar] [CrossRef]
  31. Scottand, J.P.; Werdell, P.J. Comparing level-2 and level-3 satellite ocean color retrieval validation methodologies. Opt. Express 2019, 27, 30140–30157. [Google Scholar] [CrossRef]
  32. Liu, X.; Wang, M. Filling the Gaps of Missing Data in the Merged VIIRS SNPP/NOAA-20 Ocean Color Product Using the DINEOF Method. Remote Sens. 2019, 11, 178. [Google Scholar] [CrossRef] [Green Version]
  33. Bridget, N.S.; Stumpf, R.P.; Schaeffer, B.A.; Loftin, K.A.; Werdell, P.J. Performance metrics for the assessment of satellite data products: An ocean color case study. Opt. Express 2018, 26, 7404–7422. [Google Scholar] [CrossRef] [Green Version]
Figure 1. Satellite images of MODIS (Aqua) for the day of dust transfer on 12 September 2017 (a) and 8 September 2017 (clean atmosphere); (b) AOT values’ variability (source: SeaDas).
Remotesensing 14 01890 g001aRemotesensing 14 01890 g001b
Figure 2. Results of the airmass transfer modeling according to data from the AERONET and HYSPLIT networks on 12 September 2017 and 8 September 2017.
Remotesensing 14 01890 g002aRemotesensing 14 01890 g002b
Figure 3. Spectral distribution of the average Rrs(λ) values according to MODIS (Aqua) data for 12.09.2017 and 08.09.2017 depending on the error flags.
Remotesensing 14 01890 g003aRemotesensing 14 01890 g003b
Figure 4. Spectral variability of AOT values according to the AERONET network data on 08.09.2017 and 12.09.2017 for the Galata_Platform station (a) and for the SPM spectrophotometer over Sevastopol (b).
Remotesensing 14 01890 g004aRemotesensing 14 01890 g004b
Figure 5. Satellite image (VIIRS) of dust transport over the Black Sea on 27.09.2020 (a) and the 7-day back trajectories of airmass transport at Sevastopol station (central part of the Black Sea) (b).
Remotesensing 14 01890 g005
Figure 6. Spatial distribution of MODIS AOT values from a clean atmosphere over the Black Sea on 10.09.2020 (a) and dust transfer on 27.09.2020 (MODIS) (central part of the Black Sea) (b), 29.09.2020 (c) (MODIS) and VIIRS (d) (source: SeaDas).
Remotesensing 14 01890 g006
Figure 7. Spectral distribution of the average Rrs(λ) values according to the MODIS (Aqua) data on 27.09.2020 depending on the error flags.
Remotesensing 14 01890 g007
Figure 8. (a) Variability of the daily AOT values using the AERONET network data on 10.02.2021 and 27.02.2021 for the Section_7_Platform station; (b) variability of the daily AOT values using the SPM (Sevastopol) data on 10.02.2021 and 27.02.2021; and (c) the 7-day back trajectories on 27.02.2021.
Remotesensing 14 01890 g008aRemotesensing 14 01890 g008b
Figure 9. Satellite images of VIIRS for the day on which dust transfer occurred on 27 February 2021 and 10 February 2021 (a) with a clean atmosphere and (b) the spatial variability of the AOT values (source: SeaDas).
Remotesensing 14 01890 g009aRemotesensing 14 01890 g009b
Table 1. Statistics and average values for the pixels of ocean color products on the day of dust transfer on 12 September 2017and to 8 September 2017 for the eastern part of the Black Sea according to MODIS Aqua satellite data.
12.09.201708.09.2017
Quality_L2Quality_L3Quality_L2Quality_L3
Pixels173,182161,908166,865156,545
AOT(869)0.1610.1570.0340.033
Angstrom1.3931.4101.6731.67
Rrs (412 nm)−0.0002−0.000050.00310.0032
Rrs (443 nm)0.002040.002110.00400.0041
Rrs (469 nm)0.00330.0033640.00460.0046
Rrs (488 nm)0.00360.0036450.00490.0049
Rrs (531 nm)0.00300.0030090.00390.0038
Rrs (547 nm)0.00260.0026640.00340.0034
Rrs (555 nm)0.00230.0022870.00300.0030
Rrs (645 nm)0.00020.00020.00040.0004
Rrs (667 nm)0.00020.00020.00030.0003
Rrs (678 nm)0.00020.00020.00040.0004
Table 2. MODIS (Aqua) satellite measurements and in situ measurements on a day on which dust transport occurred (12.09.2017) and a day on which the atmosphere was clean (08.09.2017) using AERONET.
12.09
Modis
Aqua
(10:37)
12.09
Galata_Platform
(07:13)
08.09
Modis
Aqua
(11:04)
08.09
VIIRS
(11:11)
08.09
Galata_Platform
(08:04)
AOT0.1780.210.160.0470.047
α0.610.6730.741.90981.68
Rrs (410 nm) 0.0018
Rrs (412 nm)−0.00020.00170.0006 0.0019512
Rrs (443 nm)0.00090.002280.00160.00250.00222697
Rrs (486 nm) 0.00291
Rrs (488 nm)0.00180.00290.00237 0.0029
Rrs (531 nm)0.00150.002570.0020 0.002263
Rrs (547 nm)0.00130.001950.00172 0.0018418
Rrs (551 nm) 0.0018
Rrs (555 nm)0.00110.001950.00154 0.00184311
Rrs (667 nm)−0.000050.000230.0001 0.00033676
Rrs (671 nm) 0.0001
Table 3. The statistics and average values of Rrs(λ) for pixels from the selected area of the Black Sea water area of Ocean color products for the days on which dust transfer occurred from 27–29 September 2020 and the days on which the atmosphere was clean before transfer on 10 September 2020, according to the MODIS satellite data.
10.09.202027.09.202029.09.2020 (MODIS)29.09.2020 (VIIRS)
Quality_L2Quality_L3Quality_L2Quality_L3Quality_L2Quality_L3Quality_L2Quality_L3
Pixels102,96599,512104,986100,47033,02725,11132,68825,096
AOT(869)0.0320.0300.2320.2330.2100.1930.1860.172
Angstrom1.5421.5510.9220.9160.7990.8560.7590.801
Rrs (412 nm)0.0030.003−0.001−0.001−0.0010.0000.0000.000
Rrs (443 nm)0.0030.0030.0010.0010.0010.0010.0030.003
Rrs (469 nm)0.0040.0040.0020.0020.0010.001
Rrs (488 nm)0.0030.0030.0020.0020.0020.0020.0030.003
Rrs (531 nm)0.0030.0030.0020.0020.0010.001
Rrs (547 nm)0.0020.0020.0020.0020.0010.0010.0020.002
Rrs (555 nm)0.0020.0020.0020.0020.0010.001
Rrs (645 nm)0.0000.0000.0010.0010.0000.000
Rrs (667 nm)0.0000.0000.0010.0010.0000.0000.0000.002
Rrs (678 nm)0.0000.0000.0010.0010.0000.000
Table 4. Statistics and average values of Rrs(λ) for the pixels of the selected area of the Black Sea water area of Ocean color products for the day on which dust transfer occurred on 10.02.2021 and 28.02.2021 according to the VIIRS satellite data.
10.02.202127.02.2021
Quality_L3Quality_L2Quality_L3
Rrs (411 nm)0.0018−0.002−0.0021
Rrs (445 nm)0.00340.000870.00076
Rrs (489 nm)0.00420.00260.0025
Rrs (556 nm)0.00280.00290.0027
Rrs (667 nm)0.00040.00060.0005
Table 5. The nearest time for satellite images’ Lwn(λ) values of in situ measurements at the Section_7AERONET station on 10.02.2021 (no dust) and 27.02.2021 (dust).
10.02.2021 (Section_7)27.02.2021 (Section_7)
Lwn (412 nm)0.428150.241267
Lwn (443 nm)0.5591740.464439
Lwn (490 nm)0.8142750.675236
Lwn (560 nm)1.2183370.988313
Lwn (667 nm)0.2852710.282637
Publisher’s Note: MDPI stays neutral with regard to jurisdictional claims in published maps and institutional affiliations.

