Abstract
Arctic sea ice characteristics have been changing rapidly and significantly in the last few decades. Using a long-term time series of sea ice products from satellite observations—the extended AVHRR Polar Pathfinder (APP-x)—trends in sea ice concentration, ice extent, ice thickness, and ice volume in the Arctic from 1982 to 2020 are investigated. Results show that the Arctic has become less ice-covered in all seasons, especially in summer and autumn. Arctic sea ice thickness has been decreasing at a rate of −3.24 cm per year, resulting in an approximate 52% reduction in thickness from 2.35 m in 1982 to 1.13 m in 2020. Arctic sea ice volume has been decreasing at a rate of −467.7 km3 per year, resulting in an approximate 63% reduction in volume, from 27,590.4 km3 in 1982 to 10,305.5 km3 in 2020. These trends are further examined from a new perspective, where the Arctic Ocean is classified into open water, perennial, and seasonal sea ice-covered areas based on sea ice persistence. The loss of the perennial sea ice-covered area is a major factor in the total sea ice loss in all seasons. If the current rates of sea ice changes in extent, concentration, and thickness continue, the Arctic is expected to have ice-free summers by the early 2060s.
1. Introduction
Sea ice covers 4–6% of the earth’s surface, depending on the season, the majority of which is in the Arctic. Changes in sea ice volume and extent are of great importance in understanding global climate change due to feedback mechanisms and teleconnections as well as transitions in the state of the atmosphere, ocean, land, and glacial coverage. The Arctic has been experiencing significant changes closely associated with changes in the cryosphere [1,2,3,4,5]. Many Arctic climate change indicators have showed significant Arctic warming during the past four decades [6,7]. There has been a significant decline in Arctic sea ice, as observed from both satellites and in situ measurements, with the lowest three records in Arctic sea ice extent during the summers of 2007, 2012, and 2020 in the past four decades [8,9,10,11,12]. The significant decline occurred after years of the shrinking and thinning of the sea ice pack [12,13,14,15,16] caused by increasing surface air temperature, changes in atmospheric circulation, and the ice–albedo feedback [11,17,18,19,20,21]. The multiyear ice of the Arctic has been rapidly replaced in recent years by thinner first-year ice [21,22,23] that is more sensitive to changes in the atmospheric and oceanic forcing [19].
The retreat of sea ice increases surface absorption of the solar radiation by the ocean due to the decrease in surface albedo, resulting in further warming and a retreat of the ice pack due to the ice–albedo feedback [24,25,26] and the associated changes in clouds [27,28,29], contributing to further ice decline. As a consequence of the diminishing sea ice, the Arctic area north of 60°N has warmed at more than twice the global average since late last century [30,31]. Numerical models have shown that the ice-free summer Arctic Ocean may occur as early as the late 2030s, using a criterion of 80% sea ice area loss, as the Arctic regional mean surface air temperature could increase by 8.5 ± 2.5°C in winter and 3.7 ± 0.9 °C in summer by the end of this century [32]. Other studies have indicated that Arctic multiyear sea ice will mostly disappear by September 2050 no matter what actions are taken now to reduce CO2 concentration in the atmosphere [33,34]. The same result could occur sooner than 2030 if there is no immediate reduction in anthropogenic CO2 and CH4 emissions, as suggested by models in phase six of the Coupled Model Intercomparison Project [35].
Some numerical model studies show that the simulated mean September ice thickness within the Arctic Ocean has declined from 3.7 m to 2.6 m at a rate of −0.57 m per decade over 1987–2007 for the Arctic Ocean basin [36]. Ice thickness data from in situ and satellite observations have indicated that the trend in annual mean ice thickness over the Arctic basin is −0.58 ± 0.07 m per decade over 2000–2012 [16]. A model-based reconstruction of the Arctic sea ice volume over 1980–2010 shows that the ice volume decreased at the rates of −3.8 × 10³ km3 per decade for all months and −4.20 × 10³ km3 per decade for September only, values that are about six times larger than during the so-called 1901–1940 early-twentieth-century warming period [37]. Climate models from the World Climate Research Programme Coupled Model Intercomparison Project Phase 5 (CMIP5), as a whole, tend to underestimate the rate of ice volume loss from 1979 to 2013, leading to an uncertain projection of when Arctic Ocean may become ice-free in the warm season [2,38].
Based on sea ice thickness data from satellite laser altimetry (ICESat) and radar altimetry (CryoSat-2) over the relative short time periods of 2003–2008 and 2011–2015, it was discovered that Arctic sea ice volume experienced net depletions of roughly 4.68 × 10³ km3 during autumn (October–November) and 1.46 × 10³ km3 during spring (February–March) [39], where most of the sea ice loss was perennial ice (two or more years old). From an ice age-based sea ice volume product, Arctic sea ice volume has a decreasing trend of −411 km3 per year from 1984 to 2018 [40]. Furthermore, it was shown that the change in Arctic sea ice thickness contributed at least 80% to the loss of sea ice volume from November to May, and nearly 50% in August and September.
The extended Advanced Very High Resolution Radiometer (AVHRR) Polar Pathfinder Extended (APP-x) climate data record (CDR) provides a long-time series of products that can be used to study changes in Arctic sea ice. APP-x consists of a suite of products starting from 1982 to the present [40]. The data set was used to generate a 25 km spatial resolution satellite-based ice thickness time series derived with a One-dimensional Thermal-dynamic Ice Model (OTIM) for estimating sea, lake, and river ice thickness [41]. This ice thickness time series provides a consistent, long-term product with high spatial resolution to study sea ice changes over the past 40 years. In this paper, we use it and a passive microwave sea ice concentration climate data record to examine changes in the extent of Arctic sea ice, concentration, thickness, and volume over the period 1982–2020 for the Arctic area north of 60°N. Arctic sea ice temporal and spatial distributions and trends are presented. Furthermore, we examined trends in multiple ice characteristics for seasonally and perennially ice-covered areas: ice extent, ice concentration, ice thickness, and ice volume. While these are related to the number of ice-free days in an area [3,4], they go far beyond that simple metric and provide a non-traditional, or new, approach to evaluating changes in sea ice.
The paper is organized as follows. We first introduce satellite data used in the trend analyses in Section 2. An effective and robust statistical method is then introduced and detailed in Section 2 as well. Characteristics and trends in ice extent, concentration, thickness, and volume are investigated in Section 3. In Section 4, we present our summary and conclusions.
2. Data and Methods
2.1. Data Sets
Sea ice concentration (SIC) data were from the version 4 of the NOAA/NSIDC Passive Microwave Sea Ice Concentration (SIC) CDR (https://nsidc.org/data/g02202, accessed on 10 October 2021). Sea ice extent (SIE) was determined and calculated from sea ice concentration data described in the next section. We used two CDRs together with the SIC data to generate sea ice thickness (SIT) and sea ice volume (SIV) data for this study, as described below. The two CDRs covering the polar regions have been produced from the AVHRR data: the AVHRR Polar Pathfinder (APP) and the Extended APP (APP-x) [40]. APP data set consists of twice-daily composites of AVHRR sensor data at a 5 km pixel size over the period of 1982 to the present. APP also includes a surface type derived from the SIC CDR mentioned above. APP-x data set includes retrievals of cloud fraction, cloud optical depth, cloud particle phase and size, cloud top pressure and temperature, surface skin temperature, surface broadband albedo, radiation fluxes, cloud radiative effects (“cloud forcing”), and sea ice thickness retrieved with OTIM [41]. For computational considerations, the original 5 km APP data were subsampled to 25 km by taking the central 5 km pixel from a 5 × 5 pixels box to represent that 25 × 25 km pixel for the products generated in APP-x, therefore each 25 km grid cell represents a 625 km2 area. The retrievals were performed with the Cloud and Surface Parameter Retrieval (CASPR) system [42,43]. Radiation fluxes were calculated in CASPR using FluxNet [44]. The consistency of the products from different satellites in APP and APP-x has been previously studied and no significant biases were observed [20]. APP-x data products have been validated primarily with the data collected during the Surface Heat Balance of the Arctic Ocean (SHEBA) field experiment in the western Arctic [45,46,47] and with the data from two Antarctic meteorological stations: South Pole and Neumayer [48]. The uncertainties of the retrieved surface, cloud, and radiation properties were discussed in a previous paper by Wang and Key [49].
OTIM was developed to retrieve sea, lake, and river ice thickness [41]. The inputs of OTIM include APP and some parameters in APP-x, e.g., ice surface temperature. The outputs are ice thickness and age as part of the APP-x product suite. The sea ice thickness in the APP-x data set has been validated extensively with the data from other satellites, aircraft, in situ measurements, and models. Overall, APP-x ice thickness has high spatial correlation with ice thickness from the Pan-Arctic Ice Ocean Modeling and Assimilation System (PIOMAS). Compared to in situ measurements, it was found that the mean absolute error of the APP-x sea ice thickness is 0.18 m for samples with a mean ice thickness of 1.62 m, i.e., an 11% mean absolute error from upward-looking submarine sonar measurements. Comparisons with in-situ Canadian stations and moored upward-looking sonar measurements produced similar results [41,50].
2.2. Methods
The focus of this paper is on trends in sea ice extent (SIE), sea ice concentration (SIC), sea ice thickness (SIT), and sea ice volume (SIV). Sea ice extent is a measurement of the total area that is covered by ice, where each satellite pixel must have at least 15% ice, therefore the total number of ice pixels multiplied by a pixel area (625 km2) will give the sea ice extent in km2. Sea ice concentration is the fractional area covered by ice in a satellite pixel, with values ranging from 0 to 1 or 0% to 100%. Sea ice thickness is the depth of a sea ice slab from its bottom to the interface of the ice and its overlying snow, if present, or the ice and the atmosphere in the absence of snow, which was calculated by OTIM. Sea ice volume is the total volume of the ice, calculated from area, concentration, and thickness, as described below.
In this study, the Arctic area north of 60°N latitude (AO60) is classified into three categories based on sea ice persistence in each satellite grid cell: seasonal ice-covered area (SICA), where sea ice exists for less than 95% of the days in a year; perennial ice-covered area (PICA), where sea ice exists for 95% or more of the days in a year; and open water area, which has ice cover 0% of the days in a year. An ice-covered area (AICA) is defined as the sum of SICA and PICA (Figure 1). According to the definitions, the maximum SIE over the course of a year should be equal to SICA in that year, and the SIE over PICA should remain unchanged and equal to PICA in that year as well. Definitions of these categories do not consider whether or not ice moves into or out of the grid cell, and no attempt is made to track ice parcels. The presence or absence of ice is determined at each location (grid cell or pixel) daily. This is unlike the ice age categories by Tschudi et al. [51], which employed Lagrangian tracking of ice parcels over a long period of time to determine their age in years. It is also unlike the traditional first-year and multiyear ice types that can be determined with passive microwave data, and it goes beyond the simple metric of ice-free days in a region [3,4]. This definition provides a new perspective in understanding changes in sea ice. In Figure 1, LAND is defined as land area without snow cover all year around, SSCA is defined as land area being covered with snow for less than 95% of the year, and PSCA is defined as land area being covered with snow for 95% or more of the year.
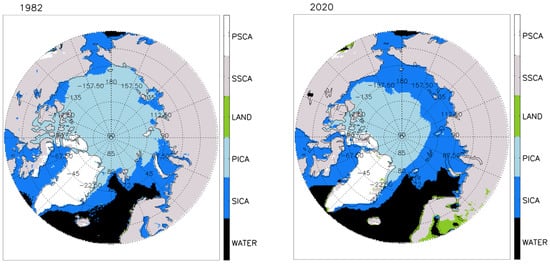
Figure 1.
Spatial distribution of Arctic sea ice extent in 1982 (left) and 2020 (right) derived from NOAA/NSIDC Climate Data Record of Passive Microwave Sea Ice Concentration. Color bar notation: WATER means open water area, SICA stands for seasonal ice-covered area, PICA denotes perennial ice-covered area, LAND means snow-free land, SSCA stands for seasonal snow covered land area, and PSCA denotes perennial snow covered land area.
For the evaluation of trends, we used a number of statistical metrics. The Mann–Kendall (MK) trend test [52,53,54] and the Sen’s slope statistical test [55] were employed in this study for the trend analyses of the inter-annual variability of Arctic sea ice over the past four decades. The MK method was suggested by the World Meteorological Organization (WMO) for assessing trends in environmental data time series [56]. The advantages of the MK trend test are that the measurements do not have to be normally distributed, and the trend, if present, does not have to be linear. Therefore, MK is a non-parametric (distribution-free) test method used to identify whether a monotonic trend exists in a time series. Even though it is adversely affected by missing values and outliers in a time series, it is at a lesser degree than the least-squares regression. A monotonic upward (downward) trend means that the variable consistently increases (decreases) through time; however, the trend may or may not be linear over any certain period of time. The MK test can be used to test if the slope of the linear regression line by Sen’s method is different from zero.
The MK test consists of comparing each value of a time series with the others that precede it in sequential order. The number of times that the preceding terms are greater than that under analysis is counted [57,58]. The MK statistic is given by:
where n is the length of a time series, and are two generic sequential data values, and the function assumes the following values:
Let S stand for the number of positive differences minus the number of negative differences found in the time series. For a normally distributed data set that has no trend, the statistic S should have the mean E(S) = 0 and the variance Var(S) as follows:
where n is the length of the time series, and g is the number of tied groups and is the number of observations in the p th tied group. For example, in the time series of {15, 17, 31, 6, 31, 17, 31, 17, 15}, we have g = 3 tied groups for the values of 15, 17, and 31, for which t1 = 2 for the tied value 15, t2 = 3 for the tied value 17, and t3 = 3 for the tied value 31. Then, the test statistic Z is denoted by:
If Z > 0, it means an increasing trend, and vice versa. Given a confidence level α, the sequential data would have a statistically significant trend if |Z| > Z(1 − α/2), where Z(1 − α/2) is the corresponding value of P = α/2 following the standard normal distribution, or vice versa from the given |Z| value calculated above in Equation (4) to calculate confidence level, α, following the standard normal distribution.
In addition, the magnitude of the trend in a time series is evaluated by a simple non-parametric procedure developed by Sen [55]. The trend is calculated by
where b is Sen’s slope estimate, i is from 1 to n − 1, and j is from 2 to n. b > 0 indicates an upward trend in a time series. Otherwise, the time series presents a downward trend over the time period.
The uncertainty of the regression can be estimated by the standard error of the regression, Uy:
where and are the original and regressed dependent variables values, respectively. Note that there are (n − 2) degrees of freedom in calculating Uy. We are estimating two parameters from the regression—the slope and the intercept. Therefore, the degrees of freedom should be n − 2, and we need at least three points to perform the regression analysis. That means that we are making two assumptions in this equation: (1) the sample population is the representative of the entire population, and (2) the values are the representative of the true y-values. For each assumption, we remove one degree of freedom, and our estimated standard deviation becomes larger.
The uncertainty of the slope can be estimated by the standard error or deviation of the slope, Ub:
where and are the individual and mean independent variable values, respectively. The slope of the regression line and its uncertainty are obviously important, as they determine the rate and uncertainty at which the dependent variable y changes with the independent variable x.
The uncertainty of the intercept can also be calculated in terms of the standard error of the regression as the standard error (or deviation) of the intercept, Ua:
The intercept of the regression line and its uncertainty have implications for both the smallest detectable dependent variable y and the corresponding lowest detectable independent variable x with their uncertainty.
With Arctic sea ice concentration, sea ice extent, and sea ice thickness information available, Arctic sea ice volume (SIV) can be calculated at every grid cell as a function of ice thickness, ice extent, and ice concentration by Equation (9) below:
where V is ice volume in km3, H is ice thickness in km, A is ice extent in km2, C is ice concentration that is unitless with a value between 0 and 1.
3. Results
Changing the Arctic sea ice extent is one important climate factor. Per the definitions above, SICA, PICA, and AICA do not change within a year. SICA and PICA do change from year to year. With the dramatic decrease in the overall Arctic sea ice extent on a yearly basis, SICA increases and PICA decreases from 1982 to 2020. The time series of annual SICA, PICA, and AICA are shown in Figure 2.
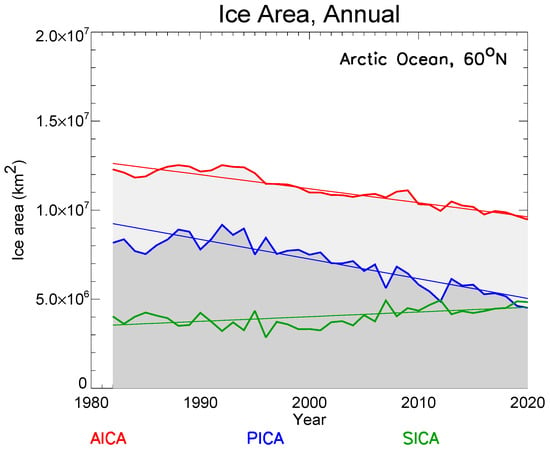
Figure 2.
Time series of Arctic seasonal, perennial, and all ice-covered areas on a yearly basis within the Arctic area north of 60°N degree. SICA (green) stands for seasonal ice-covered area, PICA (blue) denotes perennial ice-covered area, and AICA (red) is the sum of SICA and PICA.
3.1. Sea Ice Extent
Though PICA, SICA, and AICA are all defined and fixed for a year, i.e., they do not change over the course of a year, they do change from year to year, as shown in Figure 2. SIE varies over the course of a year over those areas, especially for SICA. Trends need to be examined for each month. SIE in each month and its monthly trends over 1982–2020 were calculated for PICA, SICA, and AICA.
SIE over PICA shows no monthly/seasonal changes in a year, while SIE over SICA does have monthly and seasonal fluctuations (Figure 3). SIE over PICA shows no seasonal changes over a year by the definition of PICA, but it does change from year to year. The trends of SIE over PICA from 1982 to 2020 are approximately −1.1050 × 10⁵ km2 per year. SIE over SICA reaches its maximum in winter and minimum in summer. The SIE over SICA in September is not zero because of the significantly lower amount of seasonal sea ice in early September and new seasonal sea ice forming in late September. The trends of SIE over SICA in winter are positive because of the transition of PICA to SICA, compensating for the partial loss of SICA over the study period, while in summer, the trends are either smaller or even negative.
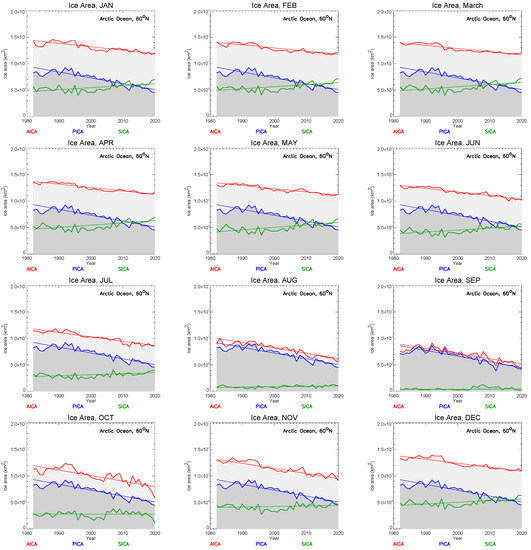
Figure 3.
SIE time series for the Arctic area north of 60°N over 1982–2020 for the months of January through December. PICA (blue) stands for perennial ice-covered area, SICA (green) denotes seasonal ice-covered area, and AICA (red) designates all ice (PICA + SICA) covered area.
As a combined result, the SIE over AICA in March declined to 1.21076 × 10⁷ km2 in 2020 from 1.41279 × 10⁷ km2 in 1982, resulting in a 14% decrease at a rate of −5.947 × 10⁴ km2 per year (Table 1). In September, the SIE over AICA is 4.32892 × 10⁶ km2 in 2020, down from 7.63860 × 10⁶ km2 in 1982, resulting in a 43% decrease at a rate of −9.719 × 10⁴ km2 per year when the ice retreats most, indicating more rapid ice area loss in summer. On an annual average, AICA SIE decreased by 2.80891 × 10⁶ km2 or 22% from 1.22837 × 10⁷ km2 in 1982 to 9.47483 × 10⁶ km2 in 2020. This overall decrease is mostly attributed to the PICA SIE reduction at −3.64707 × 10⁶ km2, accounting for 45% of PICA SIE in 1982, which is offset by 23% due to the SICA SIE increase during the same period (Table 1). Some of the reduction in PICA SIE involves the AICA, PICA, and SICA over 1982–2020.

Table 1.
Monthly mean SIE trend b (km2 per year) with its uncertainty Ub and confidence level α for AICA, PICA, and SICA over 1982–2020.
Obviously, September SIE was the smallest, and had decreasing trends for both AICA and PICA to the greatest degree over 1982–2020, though the SICA SIE trend in September, as in October and November, is not statistically significant. If the current SIE trend over PICA continues, a September ice-free Arctic Ocean would be expected in 2062. With the PICA trend uncertainties of one, two, and three standard deviations, an Arctic ice-free September would be expected in 2055, 2050, and 2045 at the earliest, and in 2068, 2077, and 2088 at the latest, respectively.
For the entire Arctic area north of 60°N, AICA SIE trends in all months and in annual mean are mainly controlled by PICA SIE trends, suggesting that the diminishing Arctic sea ice extent can mainly be attributed to the decreasing PICA year by year, e.g., the transition from PICA to SICA over the study period (Figure 3), together with the loss of SICA over 1982–2020. In addition, the ratios of PICA SIE and SICA SIE to AICA SIE are declining in March, when the Arctic sea ice-covered area reaches its maximum each year (Figure 4). Around 2015, SICA SIE began consistently surpassing PICA SIE.
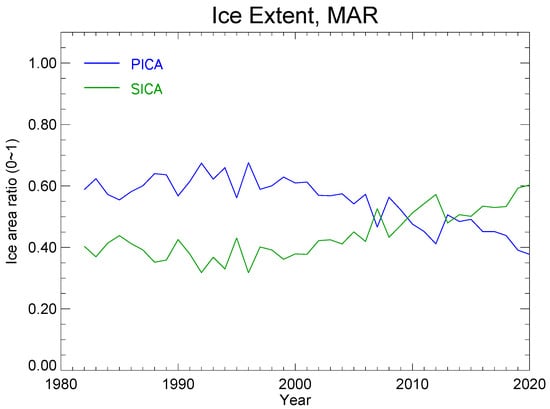
Figure 4.
Ratios of PICA SIE and SICA SIE to AICA SIE in March over 1982–2020 for the Arctic area north of 60°N.
3.2. Sea Ice Concentration
An example of sea ice concentration from the NOAA/NSIDC Climate Data Record of Passive Microwave Sea Ice Concentration is shown in Figure 5. The trends and patterns of SIC are determined for SICA, PICA, and AICA. Areas with an SIC of 0%, i.e., water pixels, were not included in the calculation of the areal mean SIC over SICA, PICA, or AICA.
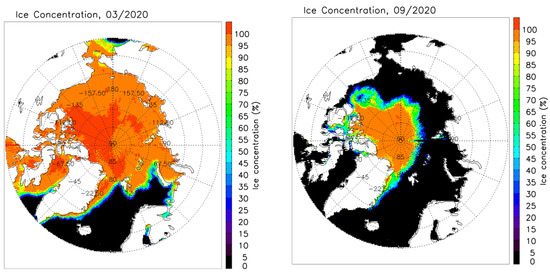
Figure 5.
Spatial distribution of Arctic monthly mean SIC in March (left) and September (right) in 2020 from the NOAA/NSIDC Climate Data Record of Passive Microwave Sea Ice Concentration.
Arctic SIC was changing over 1982–2020, with changing rates or trends that differed spatially and temporarily (Figure 6). Arctic SIC showed decreasing trends over most of the Arctic Ocean in all months, though their magnitudes were different. The largest declining trends were found in August and September over the Chukchi Sea, Beaufort Sea, Laptev Sea, Kara Sea, and Barents Sea, with the biggest rate of about −3.5% per year. The SIC over the Greenland Sea, Barents Sea, and Baffin Bay in winter was declining at a rate of about −2.0% per year.
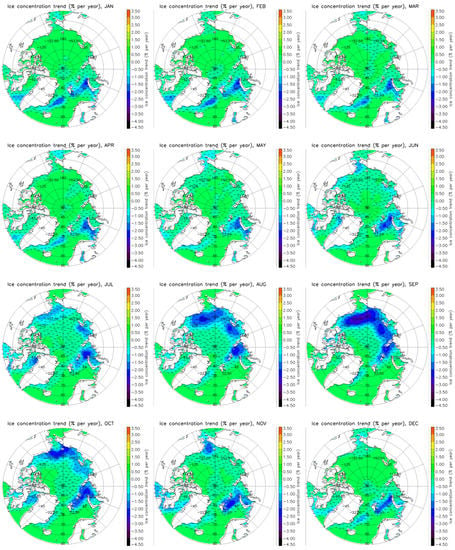
Figure 6.
Spatial distributions of Arctic monthly mean SIC trends for the months of January through December over 1982–2020. The SIC decreasing areas are marked with minus signs.
The areal mean trends in SIC were calculated for each month for PICA and SICA (Table 2). In addition, the actual fraction of the ice-covered portion in the whole Arctic area north of 60°N, including water and ice, was also calculated, called the Arctic Ocean Ice Fraction (AOIF), which has a value ranging from 0 to 100%.
Table 2.
Monthly mean SIC trend b (% per year) with its uncertainty Ub and confidence level α for AOIF, PICA, and SICA over 1982–2020.
AOIF was declining due to the shrinking ice-covered areas in all months. The SIC trends over PICA and SICA were positive in the cold season (November through April), indicating that PICA and SICA SICs were increasing. The decrease in AOIF is mainly due to losing sea ice over years. Over 1982–2020, AOIF declined to 72% from 78% in March, when the Arctic sea ice area is at its maximum in the year, and to 23% from 42% in September, when Arctic sea ice area is at its minimum and retreats most, indicating more rapid ice loss in summer. September SIC trends are all negative and statistically significant over PICA and SICA. On an annual average, AOIF decreased to 53% in 2020 from 66% in 1982 at a rate of −3.1% per decade.
Figure 7 shows SIC times series of 12 months over 1982–2020 for AOIF, PICA, and SICA. The AOIF trends are all negative, indicating the decreasing ice-covered areas in all months with a confidence level of less than 0.001. The SIC trends over SICA are positive in the cold season (November through April) and negative in the warm season (May through October), though not statistically significant for most months. This indicates that a portion of PICA was transitioned to SICA over the years, leading to an increase in SICA.
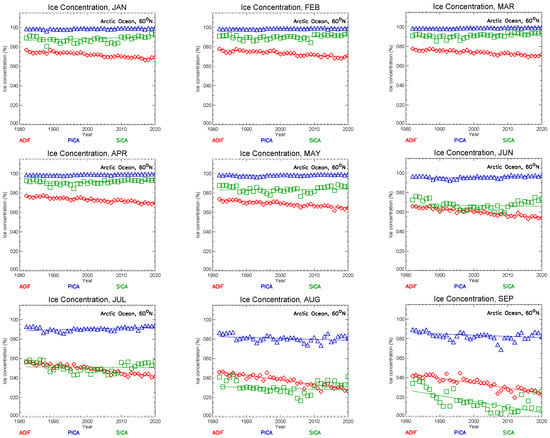
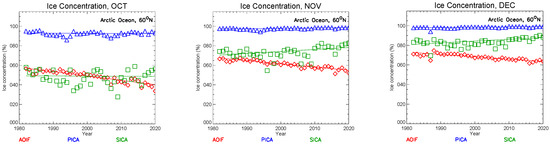
Figure 7.
SIC time series for the Arctic area north of 60°N over 1982–2020 for the months of January through December. PICA (blue) stands for perennial ice-covered area, SICA (green) denotes seasonal ice-covered area, and AOIF (red) is the actual fraction of the ice-covered portion over the Arctic area north of 60°N.
If the current AOIF trend continues, a September ice-free Arctic Ocean would be expected in 2061. With AOIF trend uncertainties of one, two, and three standard deviations, a September ice-free Arctic Ocean would be expected in 2054, 2049, and 2044 at the earliest, and in 2068, 2077, and 2088 at the latest, respectively.
3.3. Sea Ice Thickness
Arctic sea ice thickness (SIT) is not distributed evenly in space and time due to ice thermal and physical dynamic processes. The heterogeneous distribution features of Arctic SIT are apparent in March and September in 2020, corresponding to the maximum and minimum monthly mean SIT in a year (Figure 8).
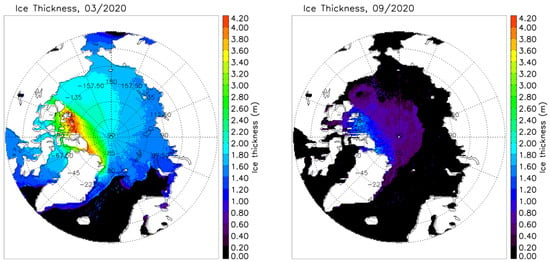
Figure 8.
Spatial distributions of Arctic monthly mean SIT in March (left) and September (right) in 2020 from this study.
The AICA SIT in March decreased to 1.80 m in 2020 from 3.85 m in 1982, resulting in a 53% decrease at a rate of −0.058 m per year when Arctic sea ice reaches its seasonal maximum extent in the Arctic Ocean. In September, when the Arctic sea ice is at its minimum extent, AICA SIT declined to 0.71 m in 2020 from 1.36 m in 1982, resulting in a 48% decrease at a rate of −0.016 m per year. On an annual average, AICA SIT decreased by 1.22 m, which is 52% of the 2.35 m in 1982, resulting in 1.13 m in 2020. Both PICA and SICA SIT declined to 1.32 m and 0.96 m in 2020 from 2.55 m and 1.86 m in 1982, respectively. All of the Arctic SIT trends in all months are statistically significant, however the SICA SIT trend in September is slightly positive, with a confidence level of 0.496 due to the very small sample size of seasonal ice in September (Table 3).
Table 3.
Monthly mean SIT trend b (m per year) with its uncertainty Ub and confidence level α for AICA, PICA, and SICA over 1982–2020.
Arctic SIT decreasing trends differ in spatial and temporal domains (Figure 9). The biggest declining SIT trends occurred in February and March along the Canadian Archipelagos with a rate of around −0.10 m per year, and the central Arctic Ocean contributed most to the declining SIT in AO60. The minimum declining SIT trends occurred in summer from July through September, with the rates ranging from −0.01 m to −0.05 m per year.
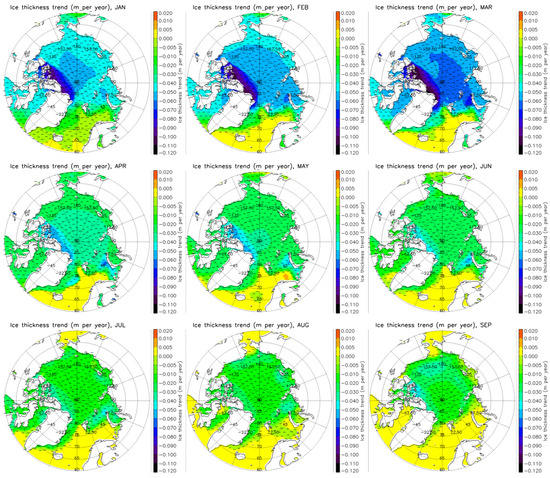
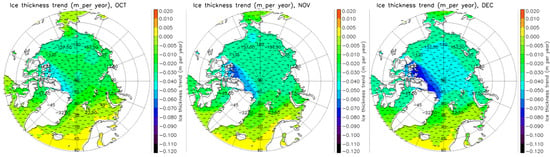
Figure 9.
Spatial distributions of Arctic monthly mean SIT trends over 1982–2020 for the months of January through December over 1982–2020.
The maximum SIT declining rates are −0.058, −0.061, and −0.045 m per year in March for AICA, PICA, and SICA, respectively. In general, Arctic SIT in Summer (July, August, and September) has the minimum changing rate of −0.011 m to −0.017 m per year for all of the ice-covered areas. If the SIT over AICA and PICA continues changing at their current rates, with 5 cm SIT as a threshold value of ice from open water, a September ice-free Arctic Ocean would be expected in 2064 in terms of both AICA and PICA SIT with high confidence. This agrees well with the September ice-free Arctic Ocean estimations from the SIC and SIE trend analyses. With the uncertainties of AICA and PICA SIT trends for one, two, and three standard deviations, a September ice-free Arctic Ocean would be expected in 2058, 2052, and 2048 at the earliest, and in 2071, 2080, and 2090 at the latest, correspondingly, which agree quite well with the previous SIC and SIE trend analyses that estimate the September ice-free Arctic Ocean occurring around in 2062 and 2061, respectively, in Section 3.1 and Section 3.2.
It appears that AICA SIT trends are mainly controlled by PICA SIT trends (Figure 10). The sea ice in SICA may still exist in September because some sea ice in SICA can survive in the beginning of September, and some may form in late September.
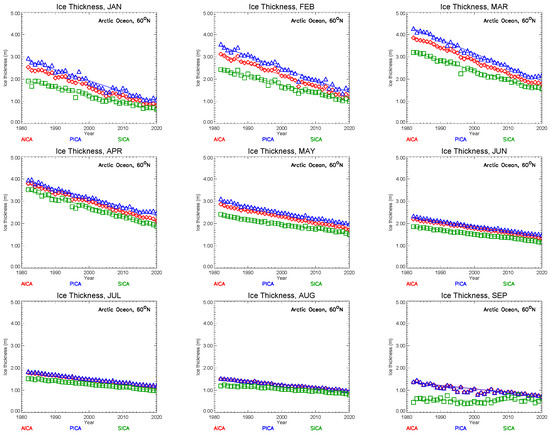
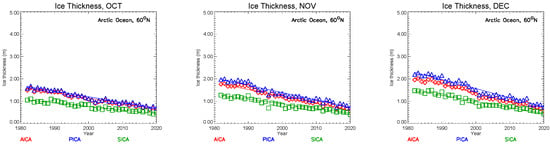
Figure 10.
SIT time series for the Arctic area north of 60°N over 1982–2020 for the months of January through December. PICA (blue) stands for perennial ice-covered area, SICA (green) denotes seasonal ice-covered area, and AICA (red) designates all ice (PICA + SICA) covered areas.
3.4. Sea Ice Volume
As for SIT analysis above, Arctic SIV within the Arctic area north of 60°N was also classified into three categories, as defined in the previous sections. As expected, the Arctic SIV also showed spatial and temporal heterogeneities just as SIT did (Figure 11).
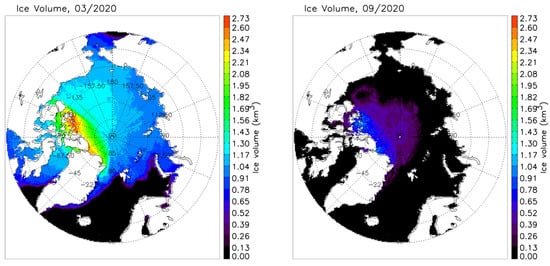
Figure 11.
Spatial distributions of Arctic monthly mean SIV in March (left) and September (right) in 2020 from this study.
Arctic SIV trends for all months from January through December are listed in the Table 4 below.
Table 4.
Monthly mean SIV trend b (km3 per year) with its uncertainty Ub and confidence level α for AICA, PICA, and SICA over 1982–2020.
Arctic SIV was changing along with changing Arctic SIC and SIT over 1982–2020. The SIV changing rates or trends differ in spatial and temporal domains (Figure 12).
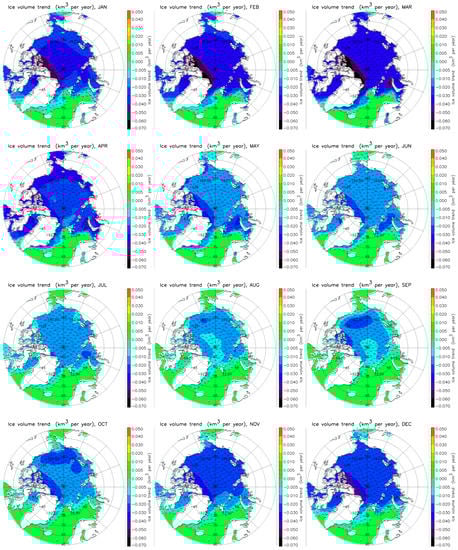
Figure 12.
Spatial distributions of Arctic monthly mean SIV trends over 1982–2020 for the months of January through December.
The biggest declining SIV trend occurred in February and March along the Canadian Archipelagos, with a changing rate of around −0.07 km3 per year. The minimum declining SIV trends were in summer from July through September, with a minimum changing rate of −0.010 km3 to −0.005 km3 per year over the central Arctic Ocean on a grid cell (pixel) level. Figure 13 shows the Arctic SIV times series of 12 months over 1982–2020 for AICA, PICA, and SICA with the fitted trend lines. AICA SIV trends are also mainly controlled by PICA SIV trends in all months.
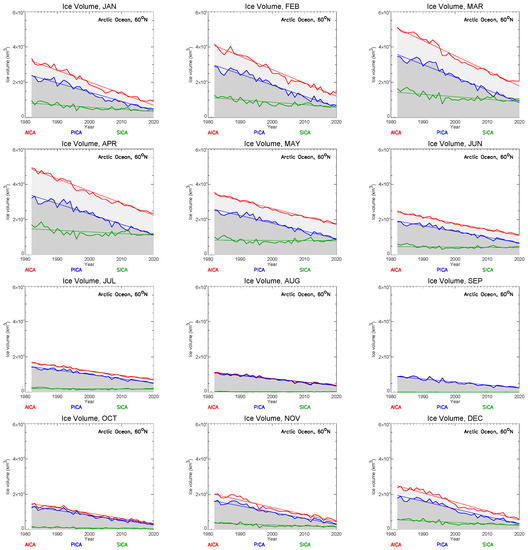
Figure 13.
Arctic SIV time series for the Arctic area north of 60°N over 1982–2020 for the months of January through December. PICA (blue) stands for perennial ice-covered area, SICA (green) denotes seasonal ice-covered area, and AICA (red) designates all ice (PICA + SICA) covered areas.
Over 1982–2020, AICA SIV decreased to 20,679.0 km3 in 2020 from 51,216.6 km3 in 1982, resulting in a 60% decrease at a rate of −859.2 km3 per year in March. In September, AICA SIV declined to 2462.0 km3 in 2020 from 8931.2 km3 in 1982, resulting in a 72% decrease at a rate of −170.2 km3 per year. Based on an annual average, AICA SIV decreased by 17,284.8 km3, which is 63% of the 27,590.4 km3 in 1982, resulting in 10,305.5 km3 SIV in 2020. PICA SIV and SICA SIV declined to 5766.0 km3 and 4522.8 km3 in 2020 from 20,313.0 km3 and 7271.0 km3 in 1982, respectively. In addition, the ratios of PICA SIV and SICA SIV to AICA SIV were declining in March, when Arctic sea ice reaches its maximum volume over 1982–2020 (Figure 14). It is around 2019 when the SICA SIV proportion started surpassing the PICA SIV proportion in March.
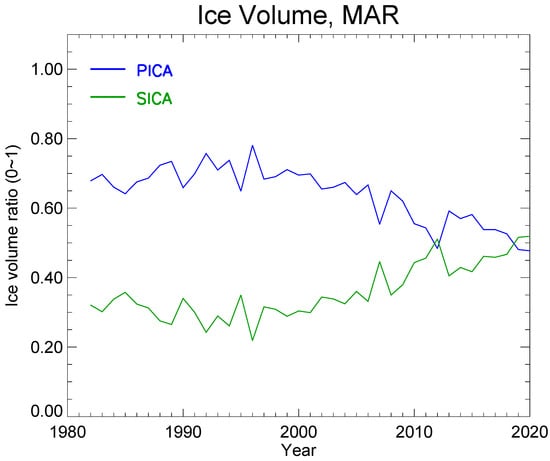
Figure 14.
Ratios of PICA SIV and SICA SIV to AICA SIV in March over 1982–2020 for the Arctic area north of 60°N.
4. Summary and Conclusions
Using satellite observations to study Arctic sea ice has the merits of broad spatial coverage and high temporal frequency. In this study, we used a long-term time series of Arctic sea ice properties that has been well validated and documented in the study of Arctic sea ice properties and changes over the period of 1982–2020 for the Arctic area north of 60 °N in each month and in the annual mean, and to estimate the time of a possible ice-free Arctic Ocean in September. Our analyses employed a new perspective based on ice longevity: the persistence of ice in each satellite grid cell determines whether that grid cell is a seasonal ice-covered area (SICA), a perennial ice-covered area (PICA), or an open water area. This approach provides a unique view of where ice is persistent and where it is disappearing, though it does not represent the true distribution of new and old ice in the traditional sense. The perspective on sea ice is important because it is the presence and persistence of ice in an area that directly influences local weather and climate, marine transportation, and ecosystems, and indirectly influences larger-scale climate elsewhere through the so-called Arctic Amplification (AA) phenomenon [59]. Furthermore, trends in ice extent, concentration, thickness, and volume for the ice persistence categories were examined.
We used an Arctic sea ice concentration (SIC) CDR derived with passive microwave data from the NOAA/NSIDC (https://nsidc.org/data/g02202, accessed on 10 October 2021) to investigate Arctic sea ice concentration and sea ice extent in this study. The Arctic sea ice concentration in PICA and SICA increased in the cold season and decreased in the warm season, though the trends during the warm season were not statistically significant. On an annual average, trends in Arctic SIC for both PICA and SICA were not statistically significant. In terms of ice-covered area in the entire Arctic area north of 60°N, or AOIF, Arctic sea ice retreated in every month and in the annual mean at a maximum rate of −0.52% per year in September, and −0.31% per year annually (Table 2). The AOIF declined 20% in the last four decades on an annual average.
Arctic AICA SIE was reduced 22% over the last four decades, mainly caused by PICA SIE reduction that declined at an annual rate of −1.105 × 10⁵ km2 per year. The annual increase in SICA SIE, at a rate of 2.640 × 10⁴ km2 per year, does not offset the decline in the PICA SIE, resulting in a net loss of AICA SIE at a rate of −7.871 × 10⁴ km2 per year. The AICA SIE in September had a minimum extent of 4.32892 × 10⁶ km2 in 2020 compared to the much larger SIE of 7.63860 × 10⁶ km2 in 1982, resulting in a 43% decline over the past four decades.
By using long-term APP-x climate data records and an OTIM ice thickness retrieval algorithm with the sea ice concentration climate data record from NOAA/NSIDC, Arctic sea ice thickness and sea ice volume can be estimated. Overall, Arctic SIT in AICA, PICA, and SICA declined over 1982–2020 at the rates of −3.2 cm per year, −3.3 cm per year, and −2.4 cm per year, respectively. The annual mean SIT decreased to 1.13 m, 1.32 m, and 0.96 m in AICA, PICA, and SICA in 2020 from 2.35 m, 2.55 m, and 1.86 m in 1982, respectively. Though the minimum ice extent occurs in mid-September, the thinnest ice occurs in late September or early October as a result of newly forming ice. In 2020, the PICA SIT in September, October, and November was approximately 0.70 m, while, in 1982, the PICA SIT was 1.38 m, 1.58 m, and 1.96 m in those three months, respectively. This implies an extended summertime ice condition in the Arctic over the study period.
On an annual average, Arctic sea ice volume including seasonal and perennial ice decreased by about 62% over the last four decades at a rate of −467.7 km3 per year. This was mainly caused by the loss of perennial ice, which decreased by 72% at a rate of −404.2 km3 per year. The seasonal ice volume decreased 38% at a rate of −60.3 km3 per year. In terms of absolute magnitude, the largest decrease in ice volume was in March, at a rate of −859.2 km3 per year. The lowest rate of decrease was in September, at a rate of −170.2 km3 per year (Table 4).
Based on the trends in sea ice extent, concentration, and thickness, the Arctic Ocean could become ice-free in September in the 2061–2064 timeframe if the current trends continue. Changes in other components of the climate system and climate feedbacks could alter these trends. If we use up to three standard deviations as reasonable uncertainties in the trends, the earliest years when Arctic Ocean could experience an ice-free September would be in the 2044–2048 timeframe, with the latest being around 2088–90.
Author Contributions
Conceptualization, X.W.; methodology, X.W.; software, X.W.; validation, X.W., J.R.K., Y.L. and R.D.; formal analysis, X.W., J.R.K. and Y.L.; investigation, X.W.; resources, X.W., Y.L. and R.D.; data curation, X.W.; writing—original draft preparation, X.W.; writing—review and editing, X.W., J.R.K., Y.L. and R.D.; visualization, X.W.; supervision, X.W. and J.R.K.; project administration, X.W.; funding acquisition, X.W. All authors have read and agreed to the published version of the manuscript.
Funding
This work was supported by the National Oceanic and Atmospheric Administration (NOAA) National Centers for Environmental Information (NCEI) Climate Data Records Program (grant no. 1332KP19FNEEN0003 to the University of Wisconsin-Madison) and the Joint Polar Satellite System (JPSS) Program Office (grant no. NA20NES4320003 to the University of Wisconsin).
Data Availability Statement
All data needed to make the results in the paper are present in the papers. The NOAA/NSIDC Passive Microwave Sea Ice Concentration (SIC) CDR is available at https://nsidc.org/data/g02202, accessed on 10 October 2021). The APP and APP-x datasets are available at https://nsidc.org/data/nsidc-0669, accessed on 10 October 2021). Code to process the data is available upon request.
Acknowledgments
We thank the National Snow and Ice Data Center (NSIDC) providing the ice concentration data. Our thanks also go to NASA-MERRA project for the reanalysis global profile data set.
Conflicts of Interest
The authors declare no conflict of interest.
References
- Walsh, J.E.; Overland, J.E.; Groisman, P.Y.; Rudolf, B. Ongoing Climate Change in the Arctic. AMBIO 2012, 40, 6–16. [Google Scholar] [CrossRef] [Green Version]
- Jansen, E.; Christensen, J.H.; Dokken, T.; Nisancioglu, K.H.; Vinther, B.; Capron, E.; Guo, C.; Jensen, M.F.; Langen, P.L.; Pedersen, R.A.; et al. Past perspectives on the present era of abrupt Arctic climate change. Nat. Clim. Chang. 2020, 10, 714–721. [Google Scholar] [CrossRef]
- Lebrun, M.; Vancoppenolle, M.; Madec, G.; Massonnet, F. Arctic sea-ice-free season projected to extend into autumn. Cryosphere 2019, 13, 79–96. [Google Scholar] [CrossRef] [Green Version]
- Bliss, A.C.; Steele, M.; Peng, G.; Meier, W.N.; Dickson, S. Regional variability of Arctic sea ice seasonal change climate indicators from a passive microwave climate data record. Environ. Res. Lett. 2019, 14, 045003. [Google Scholar] [CrossRef]
- Smith, A.; Jahn, A.; Wang, M. Seasonal transition dates can reveal biases in Arctic sea ice simulations. Cryosphere 2020, 14, 2977–2997. [Google Scholar] [CrossRef]
- Box, J.E.; Colgan, W.T.; Christensen, T.R.; Schmidt, N.M.; Lund, M.; Parmentier, F.-J.W.; Brown, R.; Bhatt, U.S.; Euskirchen, E.S.; Romanovsky, V.E.; et al. Key indicators of Arctic climate change: 1971–2017. Environ. Res. Lett. 2019, 14, 045010. [Google Scholar] [CrossRef]
- Druckenmiller, M.L.; Moon, T.; Thoman, R. The Arctic [in “State of the Climate in 2020”]. Bull. Am. Meteorol. Soc. 2021, 102, S263–S315. [Google Scholar] [CrossRef]
- Perovich, D.; Meier, W.; Tschudi, M.; Hendricks, S.; Petty, A.A.; Divine, D.; Farrell, S.; Gerland, S.; Haas, C.; Kaleschke, L.; et al. Sea Ice; NOAA Arctic Report Card; NOAA: Washington, DC, USA, 2020; pp. 44–53. [CrossRef]
- Cavalieri, D.J.; Parkinson, C.L.; Vinnikov, K.Y. 30-Year satellite reveals contrasting Arctic and Antarctic decadal sea ice variability. Geophys. Res. Lett. 2003, 30, 1970. [Google Scholar] [CrossRef] [Green Version]
- Parkinson, C.L.; Comiso, J.C. 2013: On the 2012 record low Arctic sea ice cover: Combined impact of preconditioning and an August storm. Geophys. Res. Lett. 2013, 40, 1356–1361. [Google Scholar] [CrossRef]
- Wang, X.; Key, J.; Liu, Y.; Fowler, C.; Maslanik, J.; Tschudi, M. Arctic Climate Variability and Trends from Satellite Observations. Adv. Meteorol. 2012, 2012, 505613. [Google Scholar] [CrossRef] [Green Version]
- Liu, Y.; Key, J.R.; Wang, X.; Tschudi, M. Multidecadal Arctic sea ice thickness and volume derived from ice age. Cryosphere 2020, 14, 1325–1345. [Google Scholar] [CrossRef] [Green Version]
- Kwok, R.; Rothrock, D.A. Decline in Arctic sea ice thickness from submarine and ICESat. Geophys. Res. Lett. 2009, 36, L15501. [Google Scholar] [CrossRef] [Green Version]
- Zhang, J.; Lindsay, R.; Schweiger, A.; Rigor, I. Recent changes in the dynamic properties of declining Arctic sea ice: A model study. Geophys. Res. Lett. 2012, 39, L20503. [Google Scholar] [CrossRef] [Green Version]
- Meier, W.N.; Hovelsrud, G.K.; Van Oort, B.E.; Key, J.R.; Kovacs, K.M.; Michel, C.; Haas, C.; Granskog, M.; Gerland, S.; Perovich, D.K.; et al. 2014: Arctic sea ice in transformation: A review of recent observed changes and impacts on biology and human activity. Rev. Geophys. 2014, 52, 185–217. [Google Scholar] [CrossRef]
- Lindsay, R.; Schweiger, A. Arctic sea ice thickness loss determined using subsurface, aircraft, and satellite observations. Cryosphere 2015, 9, 269–283. [Google Scholar] [CrossRef] [Green Version]
- Hassol, S. Arctic Climate Impact Assessment; Cambridge University Press: New York, NY, USA, 2005; p. 1042. [Google Scholar]
- Serreze, M.C.; Holland, M.M.; Stroeve, J. Perspectives on the Arctic’s Shrinking Sea-ice Cover. Science 2007, 315, 1533–1536. [Google Scholar] [CrossRef] [Green Version]
- Zhang, J.; Lindsay, R.; Steele, M.; Schweiger, A. What drove the dramatic retreat of arctic sea ice during summer 2007. Geophys. Res. Lett. 2008, 35, L11505. [Google Scholar] [CrossRef] [Green Version]
- Wang, X.; Key, J.R. Recent Trends in Arctic Surface, Cloud, and Radiation Properties from Space. Science 2003, 299, 1725–1728. [Google Scholar] [CrossRef]
- Nghiem, S.V.; Rigor, I.G.; Perovich, D.K.; Clemente-Colón, P.; Weatherly, J.W.; Neumann, G. Rapid reduction of Arctic perennial sea ice. Cryosphere 2007, 34, L19504. [Google Scholar] [CrossRef] [Green Version]
- Kwok, R. Arctic sea ice thickness, volume, and multiyear ice coverage: Losses and coupled variability (1958–2018). Environ. Res. Lett. 2018, 13, 105005. [Google Scholar] [CrossRef]
- Maslanik, J.A.; Fowler, C.; Stroeve, J.; Drobot, S.; Zwally, J.; Yi, D.; Emery, W. A younger, thinner Arctic ice cover: Increased potential for rapid, extensive sea-ice loss. Geophys. Res. Lett. 2007, 34, L24501. [Google Scholar] [CrossRef] [Green Version]
- Perovich, D.K.; Light, B.; Eicken, H.; Jones, K.F.; Runciman, K.; Nghiem, S.V. Increasing solar heating of the Arctic Ocean and adjacent seas 1979–2005: Attribution and role in the ice-albedo feedback. Geophys. Res. Lett. 2007, 34, L9505. [Google Scholar] [CrossRef] [Green Version]
- Perovich, D.K.; Richter-Menge, J.A.; Jones, K.F.; Light, B. Sunlight, water, and ice: Extreme Arctic sea ice melt during the summer of 2007. Geophys. Res. Lett. 2008, 35, L11501. [Google Scholar] [CrossRef] [Green Version]
- Polyakov, I.V.; Timokhov, L.A.; Alexeev, V.A.; Bacon, S.; Dmitrenko, I.A.; Fortier, L.; Frolov, I.E.; Gascard, J.; Hansen, E.; Ivanov, V.V.; et al. Arctic Ocea n warming contributes to reduced polar ice cap. J. Phys. Oceanogr. 2010, 40, 2743–2756. [Google Scholar] [CrossRef]
- Kay, J.E.; Gettelman, A. Cloud influence on and response to seasonal Arctic sea ice loss. J. Geophys. Res. 2009, 114, D18204. [Google Scholar] [CrossRef]
- Liu, Y.; Key, J.R.; Liu, Z.; Wang, X.; Vavrus, S.J. A cloudier Arctic expected with diminishing sea ice. Geophys. Res. Lett. 2012, 39, L05705. [Google Scholar] [CrossRef]
- Taylor, P.C.; Kato, S.; Xu, K.-M.; Cai, M.C.J.D. Covariance between Arctic sea ice and clouds within atmospheric state regimes at the satellite footprint level. J. Geophys. Res. Atmos. 2015, 120, 12656–12678. [Google Scholar] [CrossRef] [Green Version]
- Stuecker, M.F.; Bitz, C.M.; Armour, K.C.; Proistosescu, C.; Kang, S.M.; Xie, S.-P.; Kim, D.; Mc Gregor, S.; Zhang, W.; Zhao, S.; et al. Polar amplification dominated by local forcing and feedbacks. Nat. Clim. Chang. 2018, 8, 1076–1081. [Google Scholar] [CrossRef]
- Dai, A.; Luo, D.; Song, M.; Liu, J. Arctic amplification is caused by sea-ice loss under increasing CO2. Nat. Commun. 2019, 10, 121. [Google Scholar] [CrossRef] [Green Version]
- Zhang, X. Sensitivity of arctic summer sea ice coverage to global warming forcing: Towards reducing uncertainty in arctic climate change projections. Tellus A Dyn. Meteorol. Oceanogr. 2010, 62, 220–227. [Google Scholar] [CrossRef]
- Notz, D.; Stroeve, J. Observed Arctic sea-ice loss directly follows anthropogenic CO2 emission. Science 2016, 354, 747–750. [Google Scholar] [CrossRef] [PubMed] [Green Version]
- Davy, R.; Outten, S. The arctic surface climate in CMIP6: Status and developments since CMIP5. J. Clim. 2020, 33, 8047–8068. [Google Scholar] [CrossRef]
- Notz, D.; Community, S. Arctic Sea Ice in CMIP6. Geophys. Res. Lett. 2020, 47, 47. [Google Scholar] [CrossRef]
- Lindsay, R.W.; Zhang, J.; Schweiger, A.; Steele, M.; Stern, H. Arctic Sea Ice Retreat in 2007 Follows Thinning Trend. J. Clim. 2009, 22, 165–176. [Google Scholar] [CrossRef]
- Schweiger, A.J.; Wood, K.R.; Zhang, J. Arctic Sea Ice Volume Variability over 1901-2010: A Model-Based Reconstruction. J. Clim. 2019, 32, 4731–4752. [Google Scholar] [CrossRef]
- Stroeve, J.; Barrett, A.; Serreze, M.; Schweiger, A. Using records from submarine, aircraft and satellites to evaluate climate model simulations of Arctic sea ice thickness. Cryosphere 2014, 8, 1839–1854. [Google Scholar] [CrossRef] [Green Version]
- Bi, H.; Zhang, J.; Wang, Y.; Zhang, Z.; Zhang, Y.; Fu, M.; Huang, H.; Xu, X. Arctic Sea Ice Volume Changes in Terms of Age as Revealed From Satellite Observations. IEEE J. Sel. Top. Appl. Earth Obs. Remote Sens. 2018, 11, 2223–2237. [Google Scholar] [CrossRef]
- Key, J.R.; Wang, X.; Liu, Y.; Dworak, R.; Letterly, A. The AVHRR Polar Pathfinder Climate Data Records. Remote Sens. 2016, 8, 167. [Google Scholar] [CrossRef] [Green Version]
- Wang, X.; Key, J.R.; Liu, Y. A thermodynamic model for estimating sea and lake ice thickness with optical satellite data. J. Geophys. Res. Ocean. 2010, 115, 115. [Google Scholar] [CrossRef] [Green Version]
- Key, J.R.; Wang, X.; Stroeve, J.; Fowler, C. Estimating the cloudy-sky albedo of sea ice and snow from space. J. Geophys. Res. 2001, 106, 12489–12497. [Google Scholar] [CrossRef] [Green Version]
- Key, J.R.; Yang, P.; Baum, B.A.; Nasin, S.L. Parameterization of shortwave ice cloud optical properties for various particle habits. J. Geophys. Res. 2002, 107, 4181. [Google Scholar] [CrossRef]
- Key, J.R.; Schweiger, A.J. Tools for atmospheric radiative transfer: Streamer and FluxNet. Comput. Geosci. 1998, 24, 443–451. [Google Scholar] [CrossRef] [Green Version]
- Maslanik, J.A.; Key, J.R.; Fowler, C.W.; Nguyen, T.; Wang, X. Spatial and Temporal Variability of Satellite-derived Cloud and Surface Characteristics During FIRE-ACE. J. Geophys. Res. 2001, 106, 15233–15249. [Google Scholar] [CrossRef]
- Stroeve, J.; Box, J.; Fowler, C.; Haran, T.; Key, J. Intercomparison Between in situ and AVHRR Polar Pathfinder-derived Surface Albedo over Greenland. Remote Sens. Environ. 2001, 75, 360–374. [Google Scholar] [CrossRef] [Green Version]
- Key, J.; Intrieri, J. Cloud particle phase determination with the AVHRR. J. Appl. Metorol. 2000, 36, 1797–1805. [Google Scholar] [CrossRef]
- Pavolonis, M.J.; Key, J.R.; Wang, X. Antarctic cloud radiative forcing at the surface estimated from the ISCCP D2 and AVHRR Polar Pathfinder data sets, 1985–1993. IEEE Int. Geosci. Remote Sens. Symp. 2002, 6, 3237–3239. [Google Scholar] [CrossRef]
- Wang, X.; Key, J.R. Arctic Surface, Cloud, and Radiation Properties Based on the AVHRR Polar Pathfinder Data Set. Part I: Spatial and Temporal Characteristics. J. Clim. 2005, 18, 2558–2574. [Google Scholar] [CrossRef] [Green Version]
- Wang, X.; Key, J.R.; Kwok, R.; Zhang, J. Comparison of Arctic sea ice thickness from satellites, aircraft, and PIOMAS data. Remote Sens. 2016, 8, 713. [Google Scholar] [CrossRef] [Green Version]
- Tschudi, M.A.; Meier, W.N.; Stewart, J.S. An enhancement to sea ice motion and age products at the National Snow and Ice Data Center (NSIDC). Cryosphere 2020, 14, 1519–1536. [Google Scholar] [CrossRef]
- Mann, H.B. Non-parametric tests against trend. Econometrica 1945, 13, 163–171. [Google Scholar] [CrossRef]
- Kendall, M.G. Rank Correlation Methods, 4th ed.; Charles Griffin: London, UK, 1970. [Google Scholar]
- Gilbert, R.O. Statistical Methods for Environmental Pollution Monitoring; John Wiley & Sons: New York, NY, USA, 1987. [Google Scholar]
- Sen, P.K. Estimates of the Regression Coefficient Based on Kendall’s Tau. J. Am. Stat. Assoc. 1968, 63, 1379–1389. [Google Scholar] [CrossRef]
- Yu, P.S.; Yang, T.C.; Wu, C.K. 2002: Impact of Climate Change on Water Resources in Southern Taiwan. J. Hydrol. 2002, 260, 161–175. [Google Scholar] [CrossRef]
- Lettenmaier, D.P.; Wood, E.F.; Wallis, J.R. Hydroclimatological Trends in the Continental United States 1948-1988. J. Clim. 1994, 7, 586–607. [Google Scholar] [CrossRef] [Green Version]
- Burn, H.S.; Elnur, M.A.H. Detection of Hydrologic Trends and Variability. J. Hydrol. 2002, 255, 107–122. [Google Scholar] [CrossRef]
- Cohen, J.; Zhang, X.; Francis, J.; Jung, T.; Kwok, R.; Overland, J.; Ballinger, T.J.; Bhatt, U.S.; Chen, H.W.; Coumou, D.; et al. Divergent consensuses on Arctic amplification influence on midlatitude severe winter weather. Nat. Clim. Chang. 2020, 10, 20–29. [Google Scholar] [CrossRef]
Publisher’s Note: MDPI stays neutral with regard to jurisdictional claims in published maps and institutional affiliations. |
© 2022 by the authors. Licensee MDPI, Basel, Switzerland. This article is an open access article distributed under the terms and conditions of the Creative Commons Attribution (CC BY) license (https://creativecommons.org/licenses/by/4.0/).