Abstract
Accurate and reliable building footprint maps are of great interest in many applications, e.g., urban monitoring, 3D building modeling, and geographical database updating. When compared to traditional methods, the deep-learning-based semantic segmentation networks have largely boosted the performance of building footprint generation. However, they still are not capable of delineating structured building footprints. Most existing studies dealing with this issue are based on two steps, which regularize building boundaries after the semantic segmentation networks are implemented, making the whole pipeline inefficient. To address this, we propose an end-to-end network for the building footprint generation with boundary regularization, which is termed RegGAN. Our method is based on a generative adversarial network (GAN). Specifically, a multiscale discriminator is proposed to distinguish the input between false and true, and a generator is utilized to learn from the discriminator’s response to generate more realistic building footprints. We propose to incorporate regularized loss in the objective function of RegGAN, in order to further enhance sharp building boundaries. The proposed method is evaluated on two datasets with varying spatial resolutions: the INRIA dataset (30 cm/pixel) and the ISPRS dataset (5 cm/pixel). Experimental results show that RegGAN is able to well preserve regular shapes and sharp building boundaries, which outperforms other competitors.
1. Introduction
Building footprint generation is of great interest in remote sensing, which involves numerous applications, e.g., facilitating urban planning, identifying undocumented buildings, and assessing building damage after natural disasters. High-resolution remote sensing imagery, which provides huge opportunities for meaningful geospatial target extraction at a large scale, becomes a fundamental data source for mapping buildings. Nevertheless, reliable and accurate building footprint generation is still challenging because of several factors. On the one hand, the complex and heterogeneous appearance of buildings leads to internal variability. On the other hand, mixed backgrounds and other objects with similar spectral signatures further limit the class separability.
Early methods focus on the design of hand-crafted features that can best depict buildings. For instance, Ref. [1] proposed to utilize spectral and texture features to extract urban buildings from satellite imagery. Nonetheless, the empirical feature design was satisfactory only under specific requirements or on specific data and lacked good generalization capabilities.
Nowadays, convolutional neural networks (CNNs) are extensively utilized for remote sensing tasks [2], as they surpass conventional methods in terms of accuracy of efficiency. CNNs directly learn hierarchical contextual features from raw inputs, which offer greater generalization capabilities for the task of building footprint generation than traditional methods. Although building footprint maps provided by existing CNNs seem to be impressive at a large scale (Figure 1), it is observed that such results are not that perfect when we zoom in (see results from FC-DenseNet [3] in Figure 1). The extracted buildings show irregular shapes, which are far from their exact geometry.
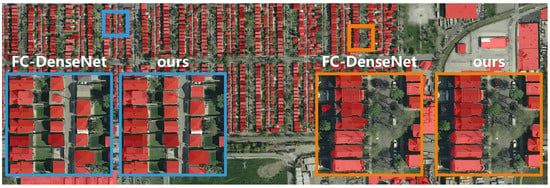
Figure 1.
The building masks extracted by FC-DenseNet [3] and RegGAN at large scale and two zoomed-in areas.
There are also some studies focused on delineating structured building footprint maps from remote sensing data. Their pipeline usually is composed of two steps, where the first step is building segmentation and the second step is building regularization. For the building regularization that aims to refine the semantic segmentation results, early efforts utilized low-level features [4] or manually defined constraints [5] for the optimization of building boundaries. However, such the hand-crafted features and rules utilized in these methods limit their generalization capability. Recently, a two stage method [6] was proposed to regularize building boundaries using deep learning networks. Nevertheless, their boundary regularization results heavily relied on the input building segmentation maps, thus, the potential of this method is restricted. Moreover, the separation of building segmentation and boundary regularization makes the whole pipeline inefficient in large-scale processing. Therefore, we propose RegGAN, which is an end-to-end network to produce regularized building footprint masks directly from remote sensing imagery. In particular, building segmentation results are not required as input data in RegGAN, making our method more efficient and robust. RegGAN is composed of two modules: the generator and the discriminator. More specifically, the generator has two paths. The regularization path takes remote sensing imagery as input and aims at producing regularized building footprints. The ideal input mask is encoded and decoded in the reconstruction path and then is taken as input to the discriminator. The generator is learned with four loss functions: semantic loss, adversarial loss, reconstruction loss, and regularized loss. It is notable that the regularized loss is beneficial to refining building boundaries in our method. Finally, a multiscale discriminator is proposed to distinguish between ideal building masks and regularized ones, which can leverage the information in different scales to improve the final results.
This work’s contributions are threefold.
(1) We propose to combine building mask segmentation and boundary regularization in an end-to-end network. The proposed method can generate building footprint maps directly from remote sensing imagery, and optimize building shapes while preserving semantic correctness.
(2) Our approach is a novel generative adversarial network (GAN). By designing a multiscale discriminator and incorporating the regularized loss in the full objective function, the proposed network can enhance building boundaries to generate structured building footprints.
(3) In terms of mask and boundary accuracy metrics, RegGAN is superior to other competitors in remote sensing imagery with different spatial resolutions.
2. Related Work
A lot of methods have been proposed to address the task of building footprint generation. According to the types of tasks, they can be classified into two types: semantic segmentation and regularization of building footprints.
2.1. Semantic Segmentation of Building Footprints
Semantic segmentation of building footprints can be regarded as a task of semantic segmentation that assigns each pixel in the image with the label of “building” or “non-building”.
Traditional methodologies include four general types: (1) index-based, (2) segmentation-based, (3) geometrical-primitives-based, and (4) classification-based methods. Index-based methods aim to directly extract buildings with a designed feature index. The morphological building index (MBI) [7] is a favored index to depict the built-up presence, which is calculated by a series of multiscale and multidirectional morphological operators. The segmentation-based methods generate building footprints based on image segmentation methods. For example, a region-based level set segmentation method was proposed in [8] for building extraction from remote sensing imagery. Geometrical-primitives-based algorithms delineate buildings based on the geometrical primitives of buildings such as corners or boundaries. In [9], the corner points of buildings were first detected by a Harris corner detector and then connected to construct polygonal representations. The objective of classification-based methods is to implement machine learning classifiers, assigning a label to each pixel. For instance, [10] generated building footprints by utilizing multiple classifiers and fusing them under a hierarchic architecture. However, these early works have a general limitation: a poor generalization due to the use of prior information and hand-crafted features.
Instead of the complex feature engineering exploited in traditional methods, deep learning methods can directly learn features from raw inputs, thus having a better generalization capability. With the introduction of deep learning architectures, recent studies can provide impressive building mapping results by utilizing semantic segmentation networks, which are usually referred to as fully convolutional network (FCN) [11] or encoder–decoder architectures. The commonly used networks are SegNet [12], U-Net [13], FC-DenseNet [3], and HRNet [14]. As a predecessor of semantic segmentation, FCN substitutes the transposed convolutions for fully connected layers, which effectively alters popular classification models to make pixel-level predictions. In [15], FCN was firstly initialized by using a large volume of possibly inaccurate OpenStreetMap building semantic masks and then was refined on a small number of accurately labeled datasets to generate large-scale building footprint maps. Encoder–decoder architectures are another favored variant. In the encoder, the spatial resolution of the image is gradually reduced to efficiently map features, which are then upsampled into a segmentation map with the original resolution in the decoder. A new cascaded multitask loss was introduced in the training of a SegNet model for the semantic segmentation of building footprints in [16]. From experiments conducted in [17], FC-DenseNet has been proved to achieve state-of-the-art performances in datasets with varied spatial resolutions.
2.2. Regularization of Building Footprints
Considering that the predicted building footprints from semantic segmentation networks usually have irregular shapes, the regularization methods aim to obtain refined building shapes with geometric constraints.
Most works adopt a two-stage pipeline, where the semantic segmentation of buildings is performed first, and then the boundary regularization is applied to the generated building footprint maps. Early efforts rely heavily on the heuristic design of features or constraint rules to do the regularization of building footprints. In order to obtain regularized boundaries, morphological filtering was applied in [18] to restrict the area and the number of building corners within a certain range. In [5,19,20], the length of the building boundary and its angle with respect to the principal orientation constraint were taken into consideration in the regularization step. However, it is still difficult for these manually designed regularization strategies to achieve satisfactory results when building shapes are diversified. Moreover, the accuracy metrics even decreased after the regularization algorithm was implemented [20]. Instead of manually defined criteria, a GAN with the combination of three loss functions (regularized loss, reconstruction loss, and adversarial loss) was proposed in [6] for the automatic regularization of the building footprints obtained from an FCN.
Recently, several studies have proposed to learn regularized building boundaries from remote sensing imagery in one framework. One study used deep structured active contours (DSAC) [21], which learn active contour models (ACM) [22] parameterizations with a CNN model. The other research proposed a deep active ray network (DARNet) [23] to learn ACM based on polar coordinates, which can avoid self-intersection. Although they encoded building regularization as a learnable problem, the results still did not strictly adhere to the realistic building boundaries. In addition, the initialization of both methods relied on some instance segmentation methods that were not incorporated into the learning process. Another framework that can directly generate regular building outlines from aerial images is PolygonCNN [24]. This end-to-end learning framework consists of two parts: an FCN for building semantic segmentation and a modified PointNet [25] for building regularization. However, these above methods still have a limitation in that these methods focus on only one building in each patch.
3. Methodology
3.1. Overview of RegGAN
Our goal is to achieve semantic labeling of each pixel with the aim of improving the boundary regularization results simultaneously. Recently, many semantic segmentation networks have achieved great success in this task, as they are able to automatically learn strong feature representations rather than manually engineered features. However, some problems have also emerged, such as irregular shapes, blurred boundaries, and so on. In parallel with semantic segmentation networks, boundary regularization networks, which produce regularized and visually pleasing boundaries, have also been shown to effectively improve semantic segmentation results. To improve the quality of building footprint maps without losing semantic accuracy, we propose to integrate semantic segmentation and boundary regularization in an end-to-end network.
As shown in Figure 2, RegGAN is a GAN network consisting of two modules: the generator G and the discriminator D. G aims to learn regularized building masks. D distinguishes between generated and ideal building masks. G tries to fool D, thus, these two modules compete with each other in a game. By doing so, G and D are capable of coadapting for the generation of the optimal output. The final output from the G is a more realistic version of buildings masks with sharp boundaries and corners.
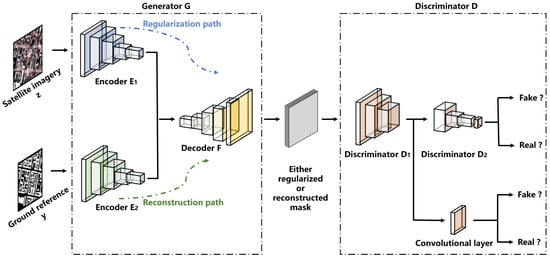
Figure 2.
Overview of the RegGAN.
The generator G has two paths: the regularization path and the reconstruction path. The regularization path aims at learning a function that maps ideal building masks y from the remote sensing imagery z. The regularization is accomplished by an encoder–decoder structure. It takes remote sensing imagery as input and generates the regularized building footprints from the encoder and decoder F. It should be noted that the discriminator does not directly estimate the ideal mask. Instead, the ideal building footprints are encoded and decoded by the encoder and the common decoder F in the reconstruction path. The design of the reconstruction path is for deriving a reconstructed version of y, which contributes to the training of the whole framework on two aspects. On the one hand, since the ideal mask consists of zeros and ones which will be easily distinguished by D, the output of the decoder with real values between zero and one can help to avoid the situation where D wins. On the other hand, the common decoder F is jointly trained with two encoders in the regularized and reconstructed path, thus the representation learning of F can be enhanced.
As the scale information is essential to the remote sensing imagery, a multiscale decision fusion is proposed in the discriminator D. D aims to distinguish if the presented building footprints are regularized masks from the regularization path or the reconstructed version from the reconstruction path. Specifically, D is separated into and , which distinguish between ideal masks and regularized ones at two scales, respectively. By combing the decision information of each scale, a more comprehensive understanding of the difference between regularized and reconstructed building footprints can be assured.
Note that the ground reference y is only utilized in the training stage. In the inference stage, the remote sensing imagery z is taken as input through the regularization path (encoder and decoder F) for outputting the final building masks.
3.2. Objective Function of RegGAN
We use an end-to-end training pipeline for the supervised learning of RegGAN. The whole network is trained by the following loss function:
where and are two loss functions for optimizing G and D, respectively.
G is learned with four loss functions: adversarial loss , reconstruction loss , semantic loss , and regularized loss , which are expressed as:
where , , , and are hyperparameters to introduce relative weights on each loss.
The adversarial loss learns the mapping function from z to y, motivating and F to generate building masks that are similar to the ideal ones. It is defined as:
The output features of are taken as input for .
The reconstruction loss ensures the correctness of the reconstructed version of ideal samples from the reconstruction path. This term can be calculated as:
The semantic loss alleviates the information loss in the regularization path, enabling semantic correctness in the regularized building masks, and is defined as:
Apart from the aforementioned losses, regularized loss is exploited to leverage more information from the images, which is an important loss term to further improve the building regularization results. It consists of two types of loss, i.e., Potts loss [26] and normalized cut loss [27] :
where is a hyperparameter to add a weight on the . Note that and are loss functions based on Potts [28] and normalized cut [29] models, respectively, which are graph clustering algorithms for image segmentation. The goal of these two loss terms is to accurately capture fine local details, helping to accurately localize building boundaries. Specifically, and are defined as:
where is a k-way softmax output from the regularization path and represents the kth channel in S. In our case, as we have two classes, i.e., building and non-building. W and are affinity matrices that measure weights between neighboring pixels and are computed with Gaussian kernels over the RGBXY space (z and S) [27].
and are trained to distinguish from regularized and reconstructed building masks at two scales, and the objective function is defined as:
It is worth noting that an approximation of the Wasserstein distance is used in Equation (9) as it helps to stabilize and improve the training and achieves higher quality results [30].
4. Experiments
4.1. Dataset
In our experiment, we used two datasets with varying spatial resolutions, i.e., the ISPRS dataset [31] and the INRIA dataset [32].
(1) ISPRS dataset: The ISPRS dataset consists of 38 tiles of aerial imagery (Figure 3), which were acquired from Potsdam. Each aerial image has a size of pixels. The ground sampling distance (GSD) is 5 cm/pixel. The corresponding ground truth map includes six land cover classes. In our experiment, aerial images with RGB bands were utilized as remote sensing imagery. For data preparation, we selected the class of building in the original ground reference as the positive class. The training/validation/test split followed [33]. Specifically, the training set had 20 tiles (id: 7-7, 7-9, 7-10, 7-11, 7-12, 6-7, 6-8, 6-9, 6-10, 6-11, 6-12, 5-10, 5-11, 4-11, 4-12, 3-10, 3-11, 3-12, 2-10, 2-12), the validation set had 4 tiles (id: 7-8, 5-11, 4-10, 2-11), and the test set consisted of the remaining 14 tiles.
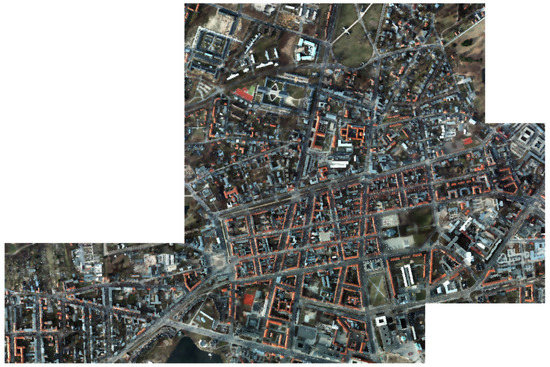
Figure 3.
Aerial images in the ISPRS dataset (GSD: 5 cm/pixel).
(2) INRIA dataset: The INRIA dataset [32] comprises images captured by airborne sensors and consists of 360 tiles of aerial images. Each aerial image (Figure 4) has pixels at a GSD of 30 cm/pixel. In this dataset, only the ground reference data of five regions (Austin, Chicago, Kitsap County, Western Tyrol, and Vienna) are made publicly available, and hence we only conducted experiments on these regions. According to the set up in [16], the data were split into training and validation sets in our research. The training set had 155 images, and 31 images with ids 6-36 were collected from each region, respectively. The validation set had 25 images, and 5 images with ids 1-5 were collected from each region, respectively. The statistics were derived from the validation set.
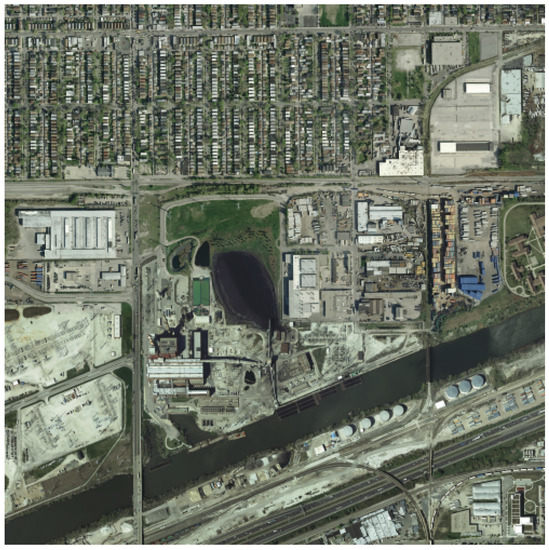
Figure 4.
Aerial imagery from the INRIA dataset (GSD: 30 cm/pixel).
4.2. Experiment Setup
In this research, we compared our approach with different semantic segmentation and boundary regularization methods. We first trained eight different semantic segmentation networks: FCN-8s [11], U-Net [13], SegNet [12], FC-DenseNet [3], HRNet [14], HA U-Net [34], EPUNet [35], and ESFNet [36]. Afterward, we selected the semantic segmentation network that had relatively better performance on two datasets, in order to provide the preliminary result for the two-stage method [6], a method recently proposed as a boundary regularization network of buildings. Finally, we compared the proposed method and the two-stage method [6].
4.3. Training Details
For network training, all images and ground-truth masks were cropped into small patches with a size of pixels. All models were implemented on the PyTorch framework and trained on an NVIDIA Quadro P4000 GPU with 8 GB memory. PyTorch is a framework that provides an efficient and easy way for the development and deployment of machine learning models. For the network training, we used the Adam [37] optimization algorithm, which can minimize error functions by adaptively estimating first-order and second-order moments [37]. The learning rate of Adam was set as 0.0001. The training batch size of all models was set as 4. For RegGAN, we utilized ResNet34 [38] in the encoders E1 and E2. The decoder F had the same architecture as that in the two-stage method [6]. The discriminators and shared the same layer combinations, which included a sequence of convolutional layers and two max-pooling operations. , , , and in Equation (2) were empirically set as 0.5, 1, 10, and 100, respectively. in Equation (6) was empirically set as 0.01.
4.4. Evaluation Metrics
In this research, the performance of different models was evaluated in two aspects. The mask metrics were exploited to assess building masks. The boundary metrics were focused on the measurement of the quality of building boundaries.
4.4.1. Mask Metrics
In our experiments, two metrics including the F1 score and intersection over union (IoU) were chosen to evaluate the accuracy of the predicted semantic masks [39].
where , , and represent the numbers of true positives, false negatives, and false positives.
4.4.2. Boundary Metrics
For the assessment of building boundaries, we selected the F-measure [40] and similarity index metric (SIM) as the two evaluation criteria in our experiments.
In order to derive the F-measure, we first used the Sobel edge operator [41] to extract building boundaries from predicted and ground reference building masks, respectively. The F-measure is defined as the geometric mean of the precision and recall of the extracted boundaries [39].
SIM measures the polygon similarity between the building polygons in two images [42]. For a set of ground reference polygons and predicted building polygons , SIM is defined as:
where IoU and GeoSim are the IoU and geometric similarity between the jth predicted polygon and the ith ground reference polygon. GeoSim [42] measures the turning functions [43] between the ground truth and predicted polygons. GeoSim [42] can be utilized to assess the quality of building boundaries [44].
5. Results
This section presents the comparisons among RegGAN, semantic segmentation networks (i.e., FCN-8s [11], U-Net [13], SegNet [12], FC-DenseNet [3], HRNet [14], HA U-Net [34], EPUNet [35], and ESFNet [36]), and boundary regularization networks (i.e., two-stage method [6]). Their quantitative (Table 1 and Table 2) and qualitative results (see Figure 5 and Figure 6) were derived from the ISPRS and INRIA datasets.

Table 1.
Accuracymetrics (%) of different methods on the ISPRS dataset (GSD: 5 cm/pixel).
Table 2.
Accuracy metrics (%) of different methods on the INRIA dataset (GSD: 30 cm/pixel).
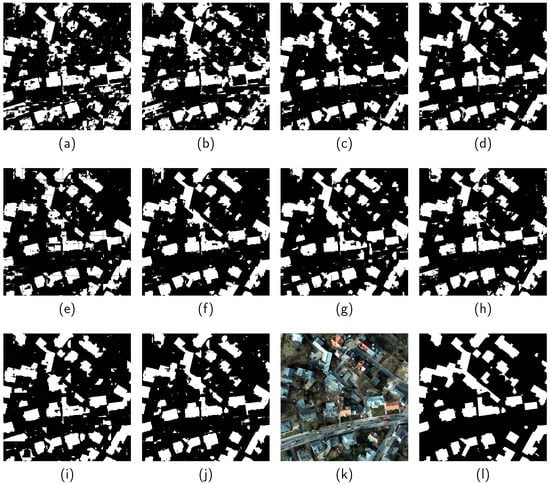
Figure 5.
Results obtained from (a) FCN-8s [11], (b) U-Net [13], (c) SegNet [12], (d) FC-DenseNet [3], (e) HRNet [14], (f) HA U-Net [34], (g) EPUNet [35], (h) ESFNet [36], (i) two-stage method [6], and (j) RegGAN. (k,l) are the corresponding remote sensing image and ground reference on the ISPRS dataset (GSD: 5 cm/pixel).
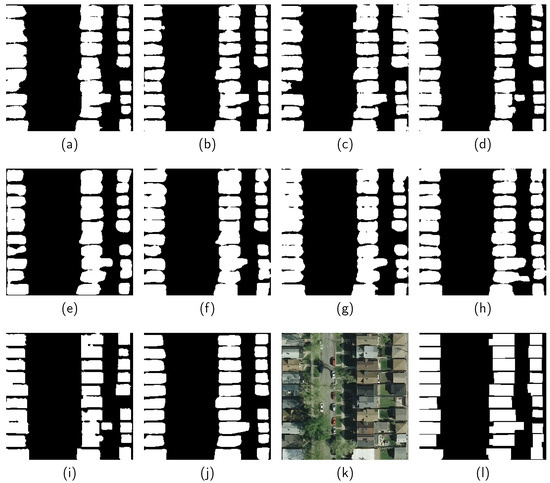
Figure 6.
Results obtained from (a) FCN-8s [11], (b) U-Net [13], (c) SegNet [12], (d) FC-DenseNet [3], (e) HRNet [14], (f) HA U-Net [34], (g) EPUNet [35], (h) ESFNet [36], (i) two-stage method [6], and (j) RegGAN. (k,l) are the corresponding remote sensing image and ground reference on the INRIA dataset (GSD: 30 cm/pixel).
Among all naive semantic segmentation networks, FC-DenseNet [3] performed relatively better on both datasets. The superiority in both mask and boundary results can be attributed to the dense block in the FC-DenseNet [3], which has greater feature extraction capability [17]. Therefore, we took the segmentation masks obtained by FC-DenseNet [3] as prior knowledge for the boundary regularization network: the two-stage method [6]. In other words, FC-DenseNet [3] was exploited to perform the initial semantic segmentation of buildings, and then this result was further processed by the regularization network proposed in [6] to generate the structured building footprints. Afterward, we made a further investigation of RegGAN, FC-DenseNet [3], and the two-stage method [6].
We first compared the results against those of semantic segmentation networks. From the statistical results in Table 1, RegGAN not only obtains increments on mask metrics (e.g., above 2% in IoU), but also improves on boundary metrics (e.g., above 6% in SIM). On the INRIA dataset (cf. Table 2), RegGAN surpasses other semantic segmentation networks by more than 3% in IoU. Moreover, the boundary metrics provided by our method are much higher. For instance, RegGAN shows about 3% improvement (71.44% vs. 67.94% in SIM, and 32.17% vs. 28.96% in F-measure) when compared to FC-DenseNet [3]. This confirms that RegGAN is superior to naive semantic segmentation networks. On the one hand, the proposed method can significantly boost performance in both mask and boundaries metrics. On the other hand, RegGAN is able to realize the semantic segmentation and regularization of buildings simultaneously in an end-to-end manner.
The quantitative results obtained by the two-stage method [6] on the ISPRS and INRIA datasets were further compared with that obtained by RegGAN. It was observed from both boundary and mask metrics on both datasets that RegGAN achieved better performance. In particular, on both datasets, the IOU of our approach was increased by more than 3%, and the SIM was improved by more than 1.5%. This demonstrates the effectiveness and robustness of RegGAN for the task of building footprint generation, as our approach can improve boundary regularization results while preserving semantic correctness.
Figure 5 presents a visual comparison among various methods on the ISPRS dataset. The building footprints generated by RegGAN are more accurate and reliable, as they coincide better with the ground reference when compared with the other two methods. The results provided by FC-DenseNet [3] were taken as the input of the two-stage method [6] for boundary regularization. However, if the results provided by FC-DenseNet [3] were not good, this also limited the potential of the two-stage method [6]. For instance, in Figure 5, some building structures are omitted by FC-DenseNet [3] negatively affecting the performance of the two-stage method [6]. In contrast, RegGAN is capable of accurately capturing more geometric details. It can be clearly seen that more refined boundary representations and detailed building structures can be acquired by our approach. This is due to the fact that RegGAN guides the network to initially learn more regular shapes of buildings from the raw images and get rid of results from other methods as preliminary inputs.
The results obtained by the different methods (Figure 6) correspond to the example area selected on the INRIA dataset. This scene belongs to a residential region where nearly connected buildings are detected as large buildings by most naive semantic segmentation networks (e.g., FCN-8s [11], HRNet [14], and HA U-Net [34]). It is notable that in Figure 6j, RegGAN is able to effectively distinguish consecutive buildings. Moreover, building boundaries delineated by the proposed approach are more rectilinear and precise when compared to other methods. This suggests that RegGAN is still promising in such challenging situations.
6. Discussion
6.1. Ablation Study
In RegGAN, regularized loss and a multiscale discriminator are employed to further improve the building regularization results. In order to investigate the effectiveness of both designs, we performed ablation studies with two competitors, i.e., RegGAN (no regularized loss) and RegGAN (no multiscale discriminator), where the regularized loss and multiscale discriminator were removed from the proposed method, respectively. In the RegGAN (no regularized loss), . For RegGAN (no multiscale discriminator), the in Equation (9) is defined as . That is to say, we only differentiate from regularized and reconstructed building footprints at one scale.
The statistical results are shown in Table 3 and Table 4, and visual results are illustrated in Figure 7 and Figure 8. As can be seen from the statistical results, the regularized loss and a multiscale discriminator both bring a significant improvement in mask and boundary metrics, leading to a positive influence on the performance of RegGAN. When compared to the RegGAN (no regularized loss), the use of both designs brings a 2.45% improvement in IoU and a 2.54% improvement in SIM on the ISPRS dataset, respectively. On the INRIA dataset, the proposed method with both designs outperforms RegGAN (no multiscale discriminator) by 4.73% in IoU and 1.66% in SIM, respectively.
Table 3.
Accuracy Metrics (%) of ablation studies on the ISPRS dataset (GSD: 5 cm/pixel).
Table 4.
Accuracy metrics (%) of ablation studies on the INRIA dataset (GSD: 30 cm/pixel).
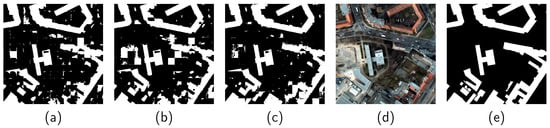
Figure 7.
Results obtained from (a) RegGAN (no regularized loss), (b) RegGAN (no multiscale discriminator), and (c) RegGAN. (d,e) are the corresponding remote sensing image and ground reference on the ISPRS dataset (GSD: 5 cm/pixel).
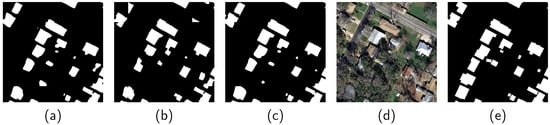
Figure 8.
Results obtained from (a) RegGAN (no regularized loss), (b) RegGAN (no multiscale discriminator), and (c) RegGAN. (d,e) are the corresponding remote sensing image and ground reference on the INRIA dataset (GSD: 30 cm/pixel).
Figure 7 and Figure 8 show visual comparisons of the segmentation results, which demonstrate that the performance of RegGAN is further boosted by the leverage of the regularized loss and a multiscale discriminator simultaneously. In Figure 7, the methods without these two designs wrongly identify impervious surfaces as buildings. This is because, impervious surfaces have similar appearances to buildings, leading to a misjudgment. In the example area presented in Figure 8, many buildings are occluded by trees and the methods without these two designs are not capable of providing accurate building boundaries. On the contrary, the use of these two designs is able to not only avoid such false alarms but also obtain refined building boundaries.
Thanks to both designs, RegGAN is capable of more effectively leveraging the information to improve results. Specifically, the regularized loss makes use of the RGB information of neighboring pixels, which helps to obtain refined building segmentation masks. The multiscale discriminator takes advantage of decision information at different scales to enhance the semantic correctness of learned masks. This is beneficial for the generator to learn more regularized building footprints.
6.2. Time Efficiency of Different Methods
Apart from the accuracy of the generated building footprint maps, the time efficiency of different methods is also of great interest in practical applications. In this regard, we investigated the training and inference time of the different methods (Figure 9). Specifically, the training time refers to the time cost of one iteration (batch size was 4), while the inference time measures the time cost of a single batch.
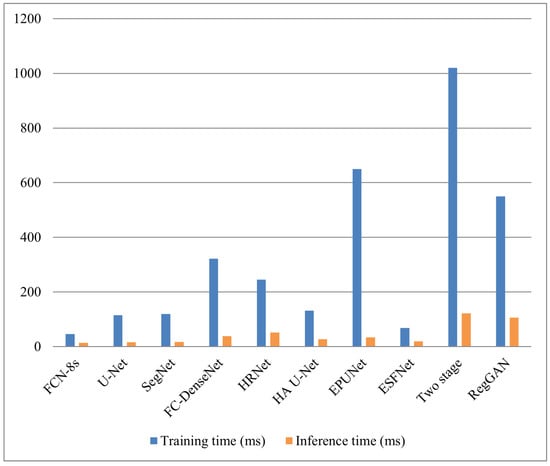
Figure 9.
Time efficiency of different methods.
Among all naive semantic segmentation networks, FCN-8s [11] and ESFNet [36] are superior to other methods in terms of the time costs for training and inference. Nevertheless, FCN-8s [11] performs much worse than other approaches on the ISPRS dataset (Table 1). Similarly, the accuracy metrics of ESFNet [36] are much lower than those of other methods on the INRIA dataset (Table 2).
Although the two-stage method [6] is able to obtain increments on both datasets in terms of boundary metrics, its time cost for both training and inference is the highest among all methods. One important reason is that it requires the predicted segmentation maps as input. In other words, another semantic segmentation network should be trained separately, leading to low time efficiency. Compared with the two-stage method [6], RegGAN has not only largely improved the mask and boundary accuracy, but also significantly reduced the time cost for both training and inference. This suggests that RegGAN can achieve a good trade-off between computational time and accuracy metrics.
7. Conclusions
In this paper, RegGAN, a new end-to-end semantic segmentation and boundary regularization network, was proposed to generate building footprint maps. RegGAN is a GAN model comprising two modules: a generator and a discriminator. More specifically, two paths in the generator were designed to learn regularized and reconstructed building footprints, respectively. Afterward, a multiscale discriminator was proposed to differentiate between them. In addition, we demonstrated that the regularized loss could boost the performance of the method, as it helped to obtain refined building boundaries. The performance of the RegGAN was validated on two datasets with varying resolutions: the INRIA dataset (30 cm/pixel) and the ISPRS dataset (5 cm/pixel). Experimental results demonstrated that RegGAN had the potential to generate more satisfying building footprints. On the one hand, building boundaries were more refined. On the other hand, false alarms where non-building classes are incorrectly identified as “building”, were alleviated.
Author Contributions
Conceptualization, X.X.Z. and F.F.; methodology, Q.L., S.Z. and Y.S.; validation, Q.L.; formal analysis, Q.L.; investigation, Q.L.; resources, X.X.Z.; data curation, Q.L.; writing—original draft preparation, Q.L.; writing—review and editing, Q.L., S.Z., Y.S. and F.F.; visualization, Q.L.; supervision, X.X.Z.; project administration, X.X.Z.; funding acquisition, X.X.Z. All authors have read and agreed to the published version of the manuscript.
Funding
This work was supported by the European Research Council (ERC) under the European Union’s Horizon 2020 research and innovation programme (grant agreement no. ERC-2016-StG-714087, acronym: So2Sat), by the Helmholtz Association through the Framework of Helmholtz AI (grant number: ZT-I-PF-5-01), local unit “Munich Unit @Aeronautics, Space and Transport (MASTr)” and the Helmholtz Excellent Professorship “Data Science in Earth Observation - Big Data Fusion for Urban Research”(grant number: W2-W3-100), and by the German Federal Ministry of Education and Research (BMBF) in the framework of the international future AI lab “AI4EO—Artificial Intelligence for Earth Observation: Reasoning, Uncertainties, Ethics and Beyond” (grant number: 01DD20001).
Conflicts of Interest
The authors declare no conflict of interest. The funding sponsors had no role in the design of the study; in the collection, analyses, or interpretation of data; in the writing of the manuscript, and in the decision to publish the results.
References
- Zhang, Y. Optimisation of building detection in satellite images by combining multispectral classification and texture filtering. ISPRS J. Photogramm. Remote Sens. 1999, 54, 50–60. [Google Scholar] [CrossRef]
- Zhu, X.X.; Tuia, D.; Mou, L.; Xia, G.S.; Zhang, L.; Xu, F.; Fraundorfer, F. Deep learning in remote sensing: A comprehensive review and list of resources. IEEE Geosci. Remote Sens. Mag. 2017, 5, 8–36. [Google Scholar] [CrossRef] [Green Version]
- Jégou, S.; Drozdzal, M.; Vazquez, D.; Romero, A.; Bengio, Y. The one hundred layers tiramisu: Fully convolutional densenets for semantic segmentation. In Proceedings of the IEEE Conference on Computer Vision and Pattern Recognition Workshops, Honolulu, HI, USA, 21 July 2017; pp. 11–19. [Google Scholar]
- Ling, F.; Li, X.; Xiao, F.; Fang, S.; Du, Y. Object-based sub-pixel mapping of buildings incorporating the prior shape information from remotely sensed imagery. Int. J. Appl. Earth Obs. Geoinf. 2012, 18, 283–292. [Google Scholar] [CrossRef]
- Wei, S.; Ji, S.; Lu, M. Toward automatic building footprint delineation from aerial images using cnn and regularization. IEEE Trans. Geosci. Remote Sens. 2019, 58, 2178–2189. [Google Scholar] [CrossRef]
- Zorzi, S.; Bittner, K.; Fraundorfer, F. Machine-learned Regularization and Polygonization of Building Segmentation Masks. In Proceedings of the 2020 International Conference on Pattern Recognition (ICPR), Milan, Italy, 10–15 January 2021. [Google Scholar]
- Huang, X.; Zhang, L. A multidirectional and multiscale morphological index for automatic building extraction from multispectral GeoEye-1 imagery. Photogramm. Eng. Remote Sens. 2011, 77, 721–732. [Google Scholar] [CrossRef]
- Karantzalos, K.; Argialas, D. A region-based level set segmentation for automatic detection of human-made objects from aerial and satellite images. Photogramm. Eng. Remote Sens. 2009, 75, 667–677. [Google Scholar] [CrossRef]
- Cote, M.; Saeedi, P. Automatic rooftop extraction in nadir aerial imagery of suburban regions using corners and variational level set evolution. IEEE Trans. Geosci. Remote Sens. 2012, 51, 313–328. [Google Scholar] [CrossRef]
- Senaras, C.; Ozay, M.; Vural, F.T.Y. Building detection with decision fusion. IEEE J. Sel. Top. Appl. Earth Obs. Remote Sens. 2013, 6, 1295–1304. [Google Scholar] [CrossRef]
- Long, J.; Shelhamer, E.; Darrell, T. Fully convolutional networks for semantic segmentation. In Proceedings of the IEEE Conference on Computer Vision and Pattern Recognition, Boston, MA, USA, 7–12 June 2015; pp. 3431–3440. [Google Scholar]
- Badrinarayanan, V.; Kendall, A.; Cipolla, R. Segnet: A deep convolutional encoder-decoder architecture for image segmentation. IEEE Trans. Pattern Anal. Mach. Intell. 2017, 39, 2481–2495. [Google Scholar] [CrossRef]
- Ronneberger, O.; Fischer, P.; Brox, T. U-net: Convolutional networks for biomedical image segmentation. In International Conference on Medical Image Computing and Computer-Assisted Intervention; Springer: Cham, Switzerland, 2015; pp. 234–241. [Google Scholar]
- Wang, J.; Sun, K.; Cheng, T.; Jiang, B.; Deng, C.; Zhao, Y.; Liu, D.; Mu, Y.; Tan, M.; Wang, X.; et al. Deep high-resolution representation learning for visual recognition. IEEE Trans. Pattern Anal. Mach. Intell. 2020, 43, 3349–3364. [Google Scholar] [CrossRef] [Green Version]
- Maggiori, E.; Tarabalka, Y.; Charpiat, G.; Alliez, P. Convolutional neural networks for large-scale remote-sensing image classification. IEEE Trans. Geosci. Remote Sens. 2016, 55, 645–657. [Google Scholar] [CrossRef] [Green Version]
- Bischke, B.; Helber, P.; Folz, J.; Borth, D.; Dengel, A. Multi-task learning for segmentation of building footprints with deep neural networks. In Proceedings of the 2019 IEEE International Conference on Image Processing (ICIP), Taipei, Taiwan, 22–25 September 2019; pp. 1480–1484. [Google Scholar]
- Li, Q.; Shi, Y.; Huang, X.; Zhu, X.X. Building Footprint Generation by Integrating Convolution Neural Network With Feature Pairwise Conditional Random Field (FPCRF). IEEE Trans. Geosci. Remote Sens. 2020, 58, 7502–7519. [Google Scholar] [CrossRef]
- Xie, Y.; Zhu, J.; Cao, Y.; Feng, D.; Hu, M.; Li, W.; Zhang, Y.; Fu, L. Refined Extraction Of Building Outlines From High-Resolution Remote Sensing Imagery Based on a Multifeature Convolutional Neural Network and Morphological Filtering. IEEE J. Sel. Top. Appl. Earth Obs. Remote Sens. 2020, 13, 1842–1855. [Google Scholar] [CrossRef]
- Xia, L.; Zhang, X.; Zhang, J.; Wu, W.; Gao, X. Refined extraction of buildings with the semantic edge-assisted approach from very high-resolution remotely sensed imagery. Int. J. Remote Sens. 2020, 41, 8352–8365. [Google Scholar] [CrossRef]
- Zhao, K.; Kang, J.; Jung, J.; Sohn, G. Building Extraction From Satellite Images Using Mask R-CNN With Building Boundary Regularization. In Proceedings of the IEEE Conference on Computer Vision and Pattern Recognition Workshops, Salt Lake City, UT, USA, 18–22 June 2018; pp. 247–251. [Google Scholar]
- Marcos, D.; Tuia, D.; Kellenberger, B.; Zhang, L.; Bai, M.; Liao, R.; Urtasun, R. Learning deep structured active contours end-to-end. In Proceedings of the IEEE Conference on Computer Vision and Pattern Recognition, Salt Lake City, UT, USA, 18–22 June 2018; pp. 8877–8885. [Google Scholar]
- Kass, M.; Witkin, A.; Terzopoulos, D. Snakes: Active contour models. Int. J. Comput. Vis. 1988, 1, 321–331. [Google Scholar] [CrossRef]
- Cheng, D.; Liao, R.; Fidler, S.; Urtasun, R. Darnet: Deep active ray network for building segmentation. In Proceedings of the IEEE Conference on Computer Vision and Pattern Recognition, Long Beach, CA, USA, 16–20 June 2019; pp. 7431–7439. [Google Scholar]
- Chen, Q.; Wang, L.; Waslander, S.L.; Liu, X. An end-to-end shape modeling framework for vectorized building outline generation from aerial images. ISPRS J. Photogramm. Remote Sens. 2020, 170, 114–126. [Google Scholar] [CrossRef]
- Qi, C.R.; Su, H.; Mo, K.; Guibas, L.J. Pointnet: Deep learning on point sets for 3d classification and segmentation. In Proceedings of the IEEE Conference on Computer Vision and Pattern Recognition, Honolulu, HI, USA, 21–26 July 2017; pp. 652–660. [Google Scholar]
- Tang, M.; Perazzi, F.; Djelouah, A.; Ben Ayed, I.; Schroers, C.; Boykov, Y. On regularized losses for weakly-supervised cnn segmentation. In Proceedings of the European Conference on Computer Vision (ECCV), Munich, Germany, 8–14 September 2018; pp. 507–522. [Google Scholar]
- Tang, M.; Djelouah, A.; Perazzi, F.; Boykov, Y.; Schroers, C. Normalized cut loss for weakly-supervised cnn segmentation. In Proceedings of the IEEE Conference on Computer Vision and Pattern Recognition, Salt Lake City, UT, USA, 18–22 June 2018; pp. 1818–1827. [Google Scholar]
- Boykov, Y.; Veksler, O.; Zabih, R. Fast approximate energy minimization via graph cuts. IEEE Trans. Pattern Anal. Mach. Intell. 2001, 23, 1222–1239. [Google Scholar] [CrossRef] [Green Version]
- Shi, J.; Malik, J. Normalized cuts and image segmentation. IEEE Trans. Pattern Anal. Mach. Intell. 2000, 22, 888–905. [Google Scholar]
- Arjovsky, M.; Chintala, S.; Bottou, L. Wasserstein gan. arXiv 2017, arXiv:1701.07875. [Google Scholar]
- ISPRS. Available online: http://www2.isprs.org/commissions/comm3/wg4/semantic-labeling.html (accessed on 1 June 2019).
- Maggiori, E.; Tarabalka, Y.; Charpiat, G.; Alliez, P. Can Semantic Labeling Methods Generalize Benchmark to Any City? The Inria Aerial Image Labeling. In Proceedings of the IEEE International Geoscience and Remote Sensing Symposium (IGARSS), Fort Worth, TX, USA, 23–28 July 2017. [Google Scholar]
- Marmanis, D.; Schindler, K.; Wegner, J.D.; Galliani, S.; Datcu, M.; Stilla, U. Classification with an edge: Improving semantic image segmentation with boundary detection. ISPRS J. Photogramm. Remote Sens. 2018, 135, 158–172. [Google Scholar] [CrossRef] [Green Version]
- Xu, L.; Liu, Y.; Yang, P.; Chen, H.; Zhang, H.; Wang, D.; Zhang, X. HA U-Net: Improved Model for Building Extraction From High Resolution Remote Sensing Imagery. IEEE Access 2021, 9, 101972–101984. [Google Scholar] [CrossRef]
- Guo, H.; Shi, Q.; Marinoni, A.; Du, B.; Zhang, L. Deep building footprint update network: A semi-supervised method for updating existing building footprint from bi-temporal remote sensing images. Remote Sens. Environ. 2021, 264, 112589. [Google Scholar] [CrossRef]
- Lin, J.; Jing, W.; Song, H.; Chen, G. ESFNet: Efficient network for building extraction from high-resolution aerial images. IEEE Access 2019, 7, 54285–54294. [Google Scholar] [CrossRef]
- Kingma, D.P.; Ba, J. Adam: A method for stochastic optimization. arXiv 2014, arXiv:1412.6980. [Google Scholar]
- He, K.; Zhang, X.; Ren, S.; Sun, J. Deep residual learning for image recognition. In Proceedings of the IEEE Conference on Computer Vision and Pattern Recognition, Las Vegas, NV, USA, 27–30 June 2016; pp. 770–778. [Google Scholar]
- Li, Q.; Mou, L.; Hua, Y.; Shi, Y.; Zhu, X.X. Building Footprint Generation Through Convolutional Neural Networks With Attraction Field Representation. IEEE Trans. Geosci. Remote Sens. 2021. [Google Scholar] [CrossRef]
- Kokkinos, I. Boundary detection using f-measure-, filter-and feature-(F 3) boost. In European Conference on Computer Vision; Springer: Berlin/Heidelberg, Germany, 2010; pp. 650–663. [Google Scholar]
- Sobel, I. An Isotropic 3 × 3 Gradient Operator, Machine Vision for Three–Dimensional Scenes; Freeman, H., Ed.; Academic Press: Cambridge, MA, USA, 1990; p. 376379. [Google Scholar]
- Wang, S.; Bai, M.; Mattyus, G.; Chu, H.; Luo, W.; Yang, B.; Liang, J.; Cheverie, J.; Fidler, S.; Urtasun, R. Torontocity: Seeing the world with a million eyes. arXiv 2016, arXiv:1612.00423. [Google Scholar]
- Arkin, E.M.; Chew, L.P.; Huttenlocher, D.P.; Kedem, K.; Mitchell, J.S. An Efficiently Computable Metric for Comparing Polygonal Shapes; Technical Report; Cornell Univ: Ithaca, NY, USA, 1991. [Google Scholar]
- Fan, H.; Zipf, A.; Fu, Q.; Neis, P. Quality assessment for building footprints data on OpenStreetMap. Int. J. Geogr. Inf. Sci. 2014, 28, 700–719. [Google Scholar] [CrossRef]
Publisher’s Note: MDPI stays neutral with regard to jurisdictional claims in published maps and institutional affiliations. |
© 2022 by the authors. Licensee MDPI, Basel, Switzerland. This article is an open access article distributed under the terms and conditions of the Creative Commons Attribution (CC BY) license (https://creativecommons.org/licenses/by/4.0/).