Article

Eagle-Eye-Inspired Attention for Object Detection in Remote Sensing

1
School of Artificial Intelligence, OPtics and ElectroNics (iOPEN), Northwestern Polytechnical University, Xi’an 710072, China
2
Key Laboratory of Intelligent Interaction and Applications, Ministry of Industry and Information Technology, Northwestern Polytechnical University, Xi’an 710072, China
3
Shaanxi Key Laboratory of Ocean Optics, Xi’an Institute of Optics and Precision Mechanics, Chinese Academy of Sciences, Xi’an 710119, China
*
Author to whom correspondence should be addressed.
Remote Sens. 2022, 14(7), 1743; https://doi.org/10.3390/rs14071743
Submission received: 12 February 2022 / Revised: 19 March 2022 / Accepted: 2 April 2022 / Published: 5 April 2022

Abstract

:
Object detection possesses extremely significant applications in the field of optical remote sensing images. A great many works have achieved remarkable results in this task. However, some common problems, such as scale, illumination, and image quality, are still unresolved. Inspired by the mechanism of cascade attention eagle-eye fovea, we propose a new attention mechanism network named the eagle-eye fovea network (EFNet) which contains two foveae for remote sensing object detection. The EFNet consists of two eagle-eye fovea modules: front central fovea (FCF) and rear central fovea (RCF). The FCF is mainly used to learn the candidate object knowledge based on the channel attention and the spatial attention, while the RCF mainly aims to predict the refined objects with two subnetworks without anchors. Three remote sensing object-detection datasets, namely DIOR, HRRSD, and AIBD, are utilized in the comparative experiments. The best results of the proposed EFNet are obtained on the HRRSD with a 0.622 A P score and a 0.907 A P 50 score. The experimental results demonstrate the effectiveness of the proposed EFNet for both multi-category datasets and single category datasets.

1. Introduction

Optical remote sensing images contain a large amount of scene information and intuitively reflect the shape, color, and texture of objects. Referring to specific algorithms, object detection of optical remote sensing images aims to search for and locate the objects of interest, such as aircraft, tanks, ships, and vehicles. Typical applications are urban planning, land use, disaster survey, military monitoring, and so on [1,2]. With the rapid development of observation technologies, the resolutions of acquired remote sensing images are becoming higher and higher. These high-resolution remote sensing images can provide detailed high-quality information that offers great opportunities to develop object-level applications. The characteristics and challenges of remote sensing images are summarized as follows: large scale, diverse direction, various shapes, and complex background. A multitude of works have aimed to theoretically and practically solve these problems [3].
The early object-detection algorithms for optical remote sensing images were mostly based on manually designed features [4,5,6,7,8,9]. Usually, candidate regions were first extracted, and then the features were manually designed for the objects. Finally, the object categories were determined by certain classifiers. Typical strategies were prior region uses, template matching, feature classification, selective search, etc. From the human perception of the object location, some methods learned the prior knowledge of candidate regions. This strategy is widely used for some representative applications, including segmentation of ocean and land for ship detection and airport detection for aircraft detection. To separate the sea surface, Antelo et al. [4] utilized the active contour method by constructing and minimizing the energy function. Some methods adopted the idea of template matching and match the candidate feature with the template library of objects. Liu et al. [7] proposed an aircraft detection method from coarse to fine. First, template matching is used to find the candidate areas of aircraft, and then principal component analysis (PCA) and a kernel density function are used to identify each area. Xu et al. [6] generated a ship shape library based on the Hough transform and used the sliding window method to calculate the feature similarity between each window region and shape library. The feature classification-based methods [10,11] usually extract the sliding window features first, and then certain classifiers are designed to predict the sliding image patches. Zhang et al. [12] used a sliding window to generate windows of different sizes and aspect ratios and extracted the visual features for each window. The cascading support vector machine (SVM) is then applied to complete the extraction process of candidate regions. The frequently used tool of selective search-based methods is segmentation which applies the similarity-merging strategy to obtain large areas. Aiming to capture possible object locations, Uijlings et al. [13] applied the appearance structure to guide the sampling process for the selective search. To reduce the search space, Liu et al. [14] analyzed the possibility of covering ships by rotated bounding boxes. In addition, a small number of potential candidates with high scores are found by a multi-cascaded linear model.
The methods mentioned above mostly adopted the traversal search method possessing redundant calculation and cannot deal with the complex and changeable environment of remote sensing images. Therefore, a great many algorithms have also tried to address the aspect of feature extraction. Feature extraction is the most critical step that directly affects the performance and efficiency of a detection algorithm. The commonly used features in object detection of remote sensing images include the color feature, the texture feature, the edge shape, and the context feature. To overcome the variable characteristics of the sea environment, Morillas et al. [15] proposed using block color and texture features for ship detection. In order to detect buildings, Konstantinidis et al. [16] combined the first module-enhanced HOG-LBP features and the second module region refinement processes. The texture feature is a visual feature that describes the homogeneity of the image, reflecting the slow change or periodic change of the object surface structure. Brekke et al. [17] conducted oil-spill detection based on the different texture characteristics between the sea surface area and the sea surface oil-slick area. In addition, the edge features reflect the object edge and shape information. To facilitate object detection, edge shape features are usually required to be invariant in scale, translation, and rotation. Sun et al. [18] extracted SIFT features from the sliding window and used the bag of words (BoW) model for classification. Cheng et al. [19] extracted binarized normed gradients (BING) for each window and used weighted SVM classifiers to improve the calculating speed. Tong et al. [20] also used SIFT features for the ship candidate areas. After extracting candidate ships, Shi et al. [21] extracted HOG (histograms of oriented gradients) features for each region. Then an AdaBoost classifier was adopted to screen and classify candidate regions. To improve the rotation invariance of the HOG feature, Zhang et al. [22] utilized part models to generate rotation invariance features. Moreover, the context feature, which mainly represents the spatial position relation of sequential topology adjacency between different instances, is also worthwhile [23,24,25]. On the basis of active contour segmentation, Liu et al. [23] introduced an energy function method to complete the separation of the sea. The ships are detected using context analyses and shape description. Using Markov random fields (MRF), Gu et al. [24], modeled the spatial position relations of objects to discriminate the object categories.
However, the adaptation range and robustness of traditional object-detection algorithms are limited, making them difficult to apply in complex environments of remote sensing images. With the thriving development of deep learning, the deep features extracted by a neural network have a stronger semantic representation ability and discrimination [26,27]. In light of the improvement of diversified object directions, some object-detection methods enhance the training image samples [28,29]. Cheng et al. [30] optimized a new objective function by introducing regularized constraints to achieve rotation invariance. Later on, Cheng et al. [31] also added a rotation-invariant regularizer to convolutional neural network (CNN) features by an objective function that can force tight mapping of feature representations to achieve rotation invariability. The ORSIm detector [32] adopted a novel space-frequency channel feature (SFCF) to deal with the rotation problem. This method comprehensively considers the rotation-invariant features from both the frequency domain and the spatial domain. To provide for small-scale objects [33,34], Zhang et al. [35] up-sampled candidate regions that were extracted in the previous stage. Replacing the convolution, Liu et al. [36] used dilated convolution to reduce parameters on the same receptive field. However, dilated convolution could cause the loss of local information. Wang et al. [37] improved the loss function to increase the training weight of small objects by combining with shallow information. The R3Det [38] improved the positioning accuracy of dense objects by adding fine-tuning modules to ensure the alignment of object features and object centers. Some works also aim to improve the adaptation of various object scales [39,40,41,42,43]. Based on the Faster R-CNN [44], Zhang et al. [41] introduced a candidate region extraction network to detect objects of different scales. A full-scale object-detection network (FSD-NET) was proposed in [42], and this network contained a backbone with a multi-scale enhanced network. In [43], a global component to a local network (GLNet) was also proposed, and the spatial contextual correlations were encoded by the long short-term memory with a clip. Given that the horizontal bounding boxes are not friendly to oriented objects, a large number of works adopted oriented quadrangles to surround the objects [45,46,47,48,49]. Zhu et al. [46] proposed an adaptive-period-embedding (APE) method to represent oriented objects of aerial images. Instead of regressing the four vertices of oriented objects, an effective and simple framework was proposed in [48]. In this framework, the vertex of horizontal bounding boxes on each corresponding side is glided to the oriented object. Different remote-sensing sensors possess the benefits of complementary information, hence the works [50,51] are based on deep neural networks and integrate several features to obtain an overall performance improvement.
The human visual mechanism possesses the ability to focus on a saliency region with obvious visual features, ignoring irrelevant background. Therefore, the attention mechanism is the most frequently used technique to improve the semantic representation [52,53,54]. To reduce the detection area, Song et al. [55] utilized color, direction, and gradient information to extract visual features and extracted ship regions according to saliency characteristics. To determine a potential airport, Yao et al. [8] adopted saliency regions to extract scale invariant feature transform (SIFT) features. In [
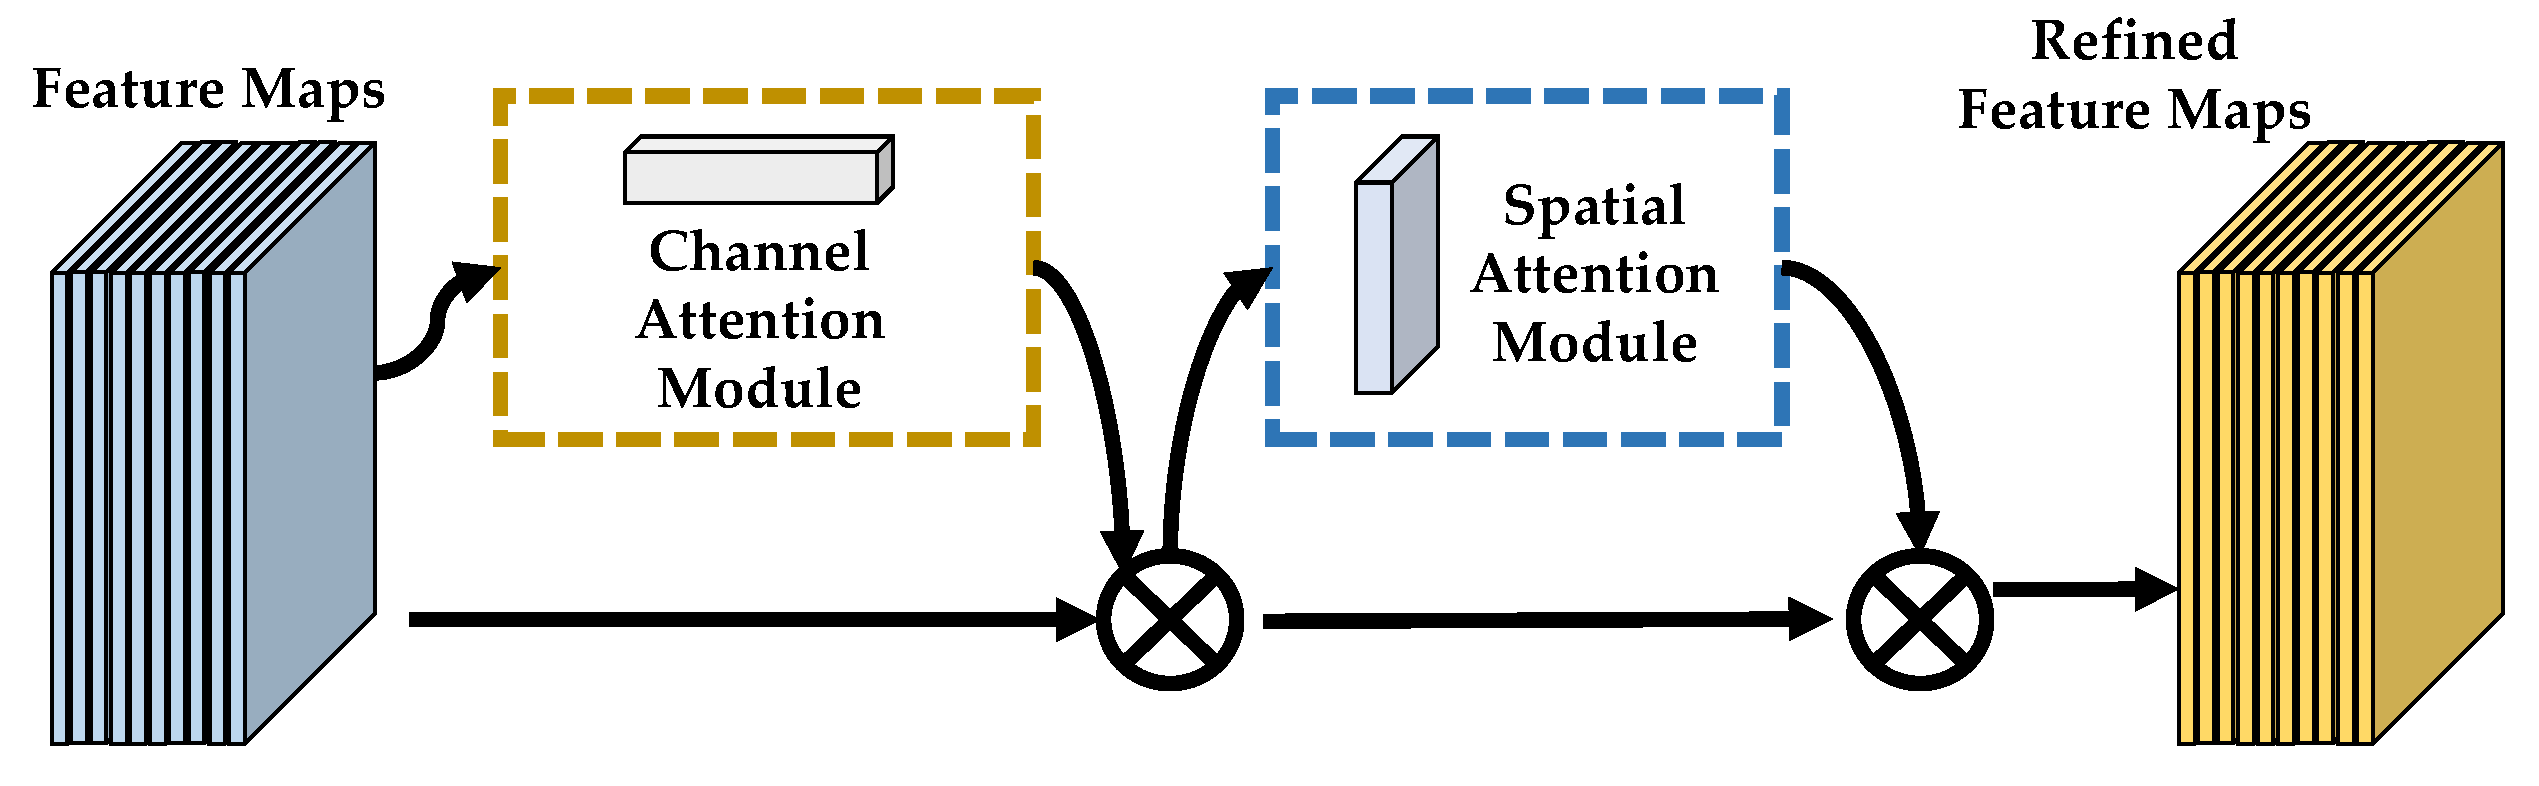
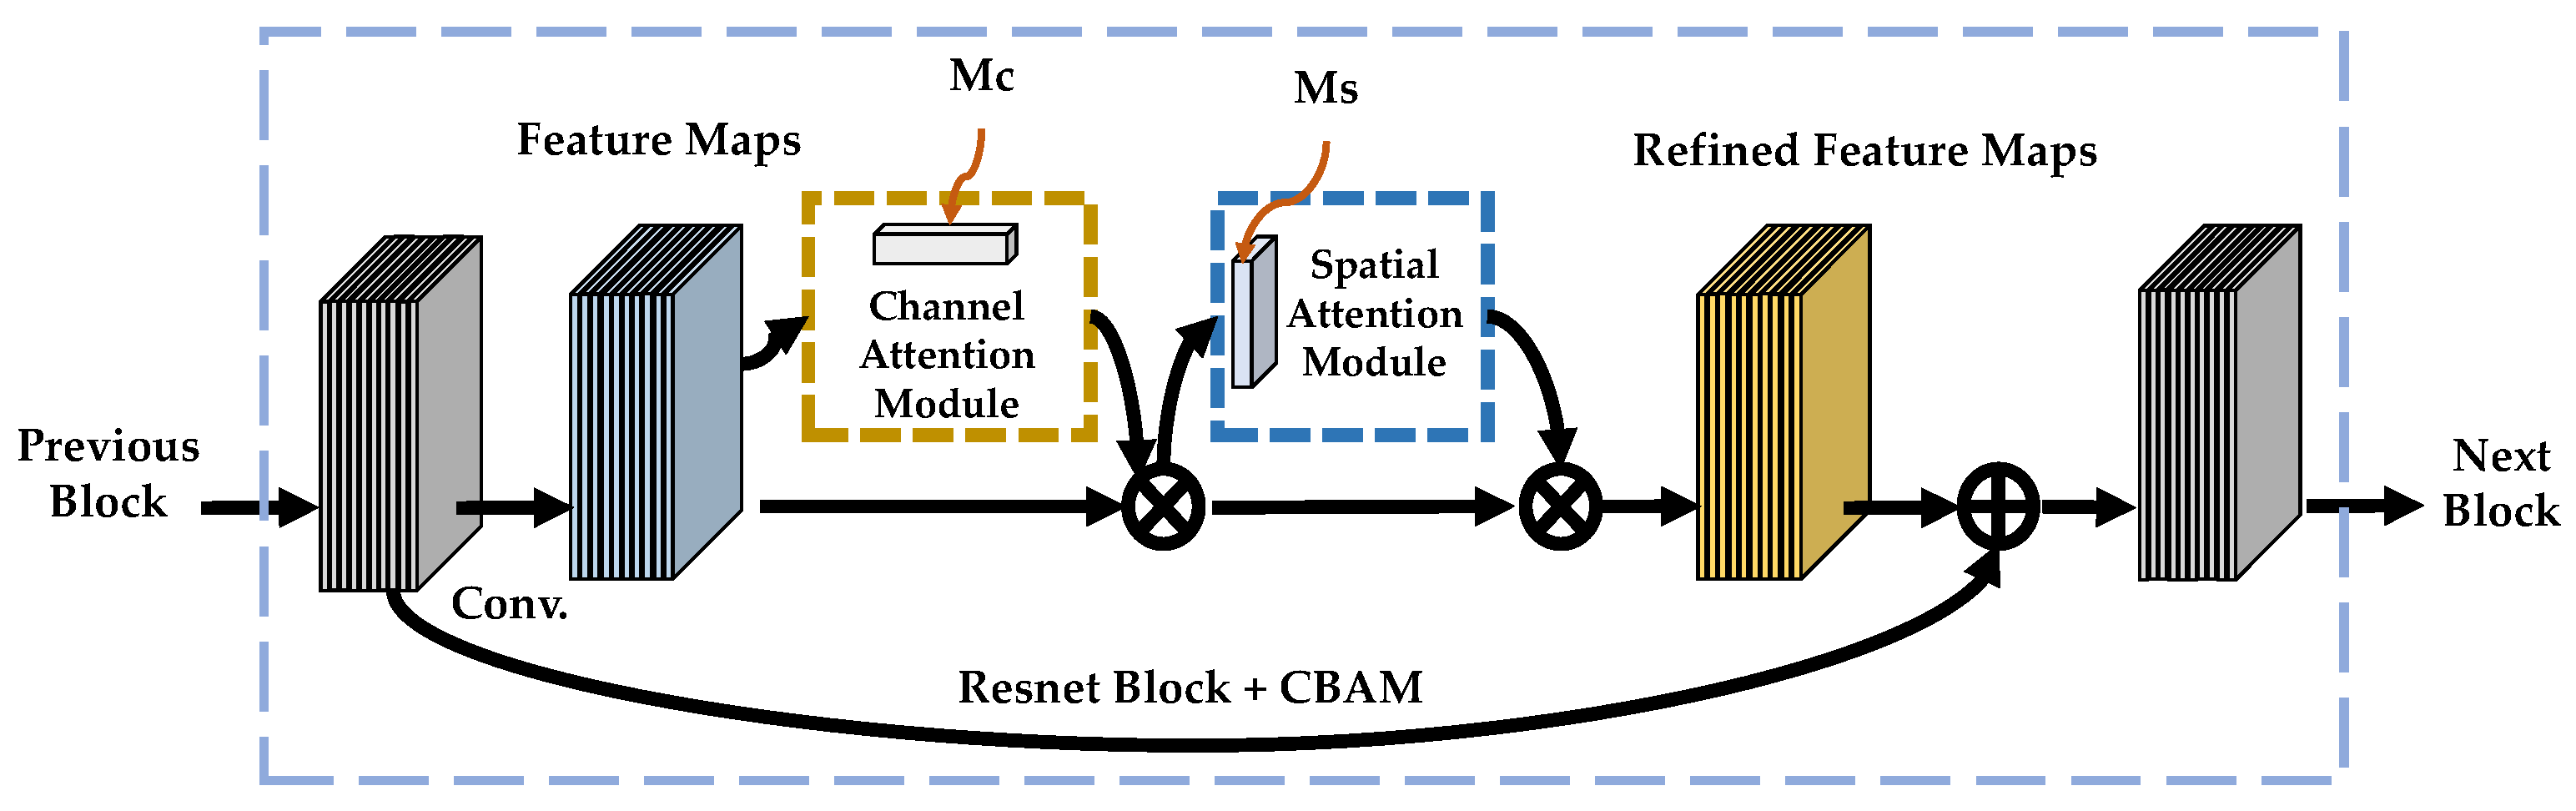
56], the authors proposed a convolutional block attention module which consists of a channel attention module and a spatial attention module. Wang et al. [57] used a multi-scale attention structure with a residual connection to meet the scale change. For multi-category detection, Wang et al. [45] also adopted a semantic attention-based network to extract the semantic representation of the oriented bounding box. In light of the densely distributed objects, the SCRDet [58] added a pixel attention mechanism and channel attention mechanism. With respect to the loss funtion, Sun et al. [59] proposed an adaptive saliency-biased loss (ASBL) for the both image level and the anchor level. In addition, the SCRDet++ [60] indirectly used the attention mechanism to improve the boundary differentiation of dense objects. Similarly, the work [61] used the density saliency attention to detect clustered buildings.
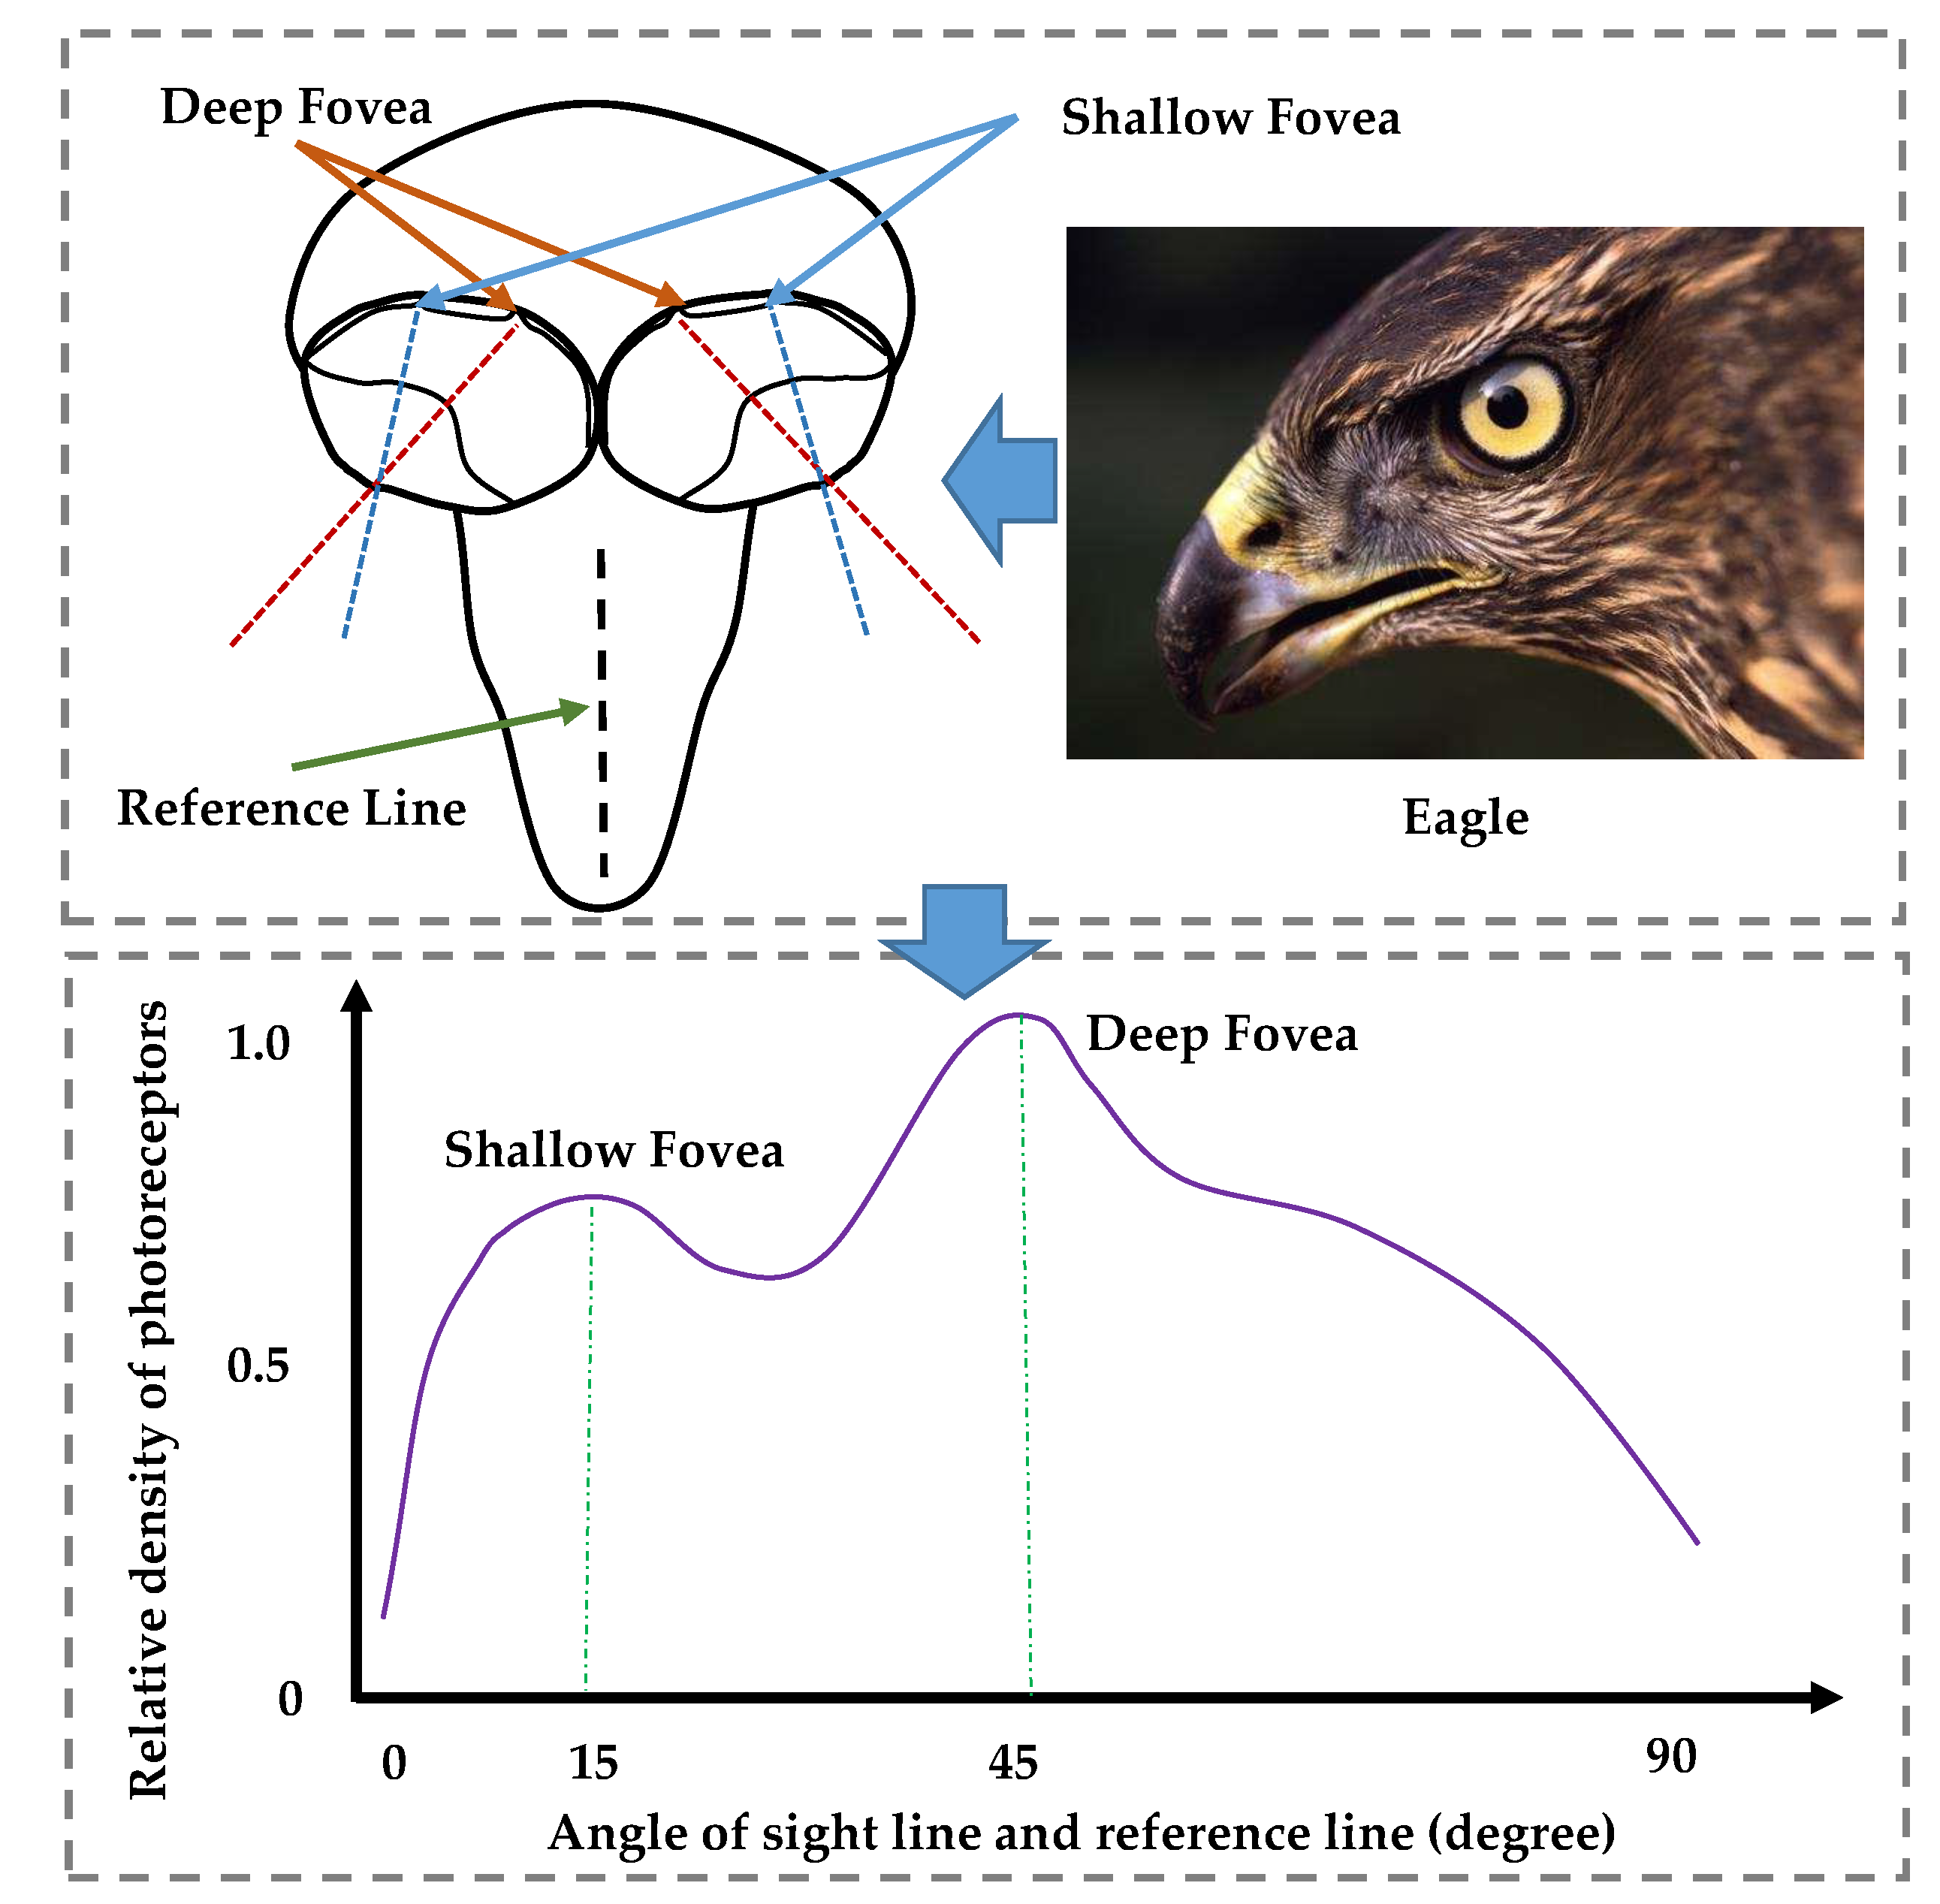
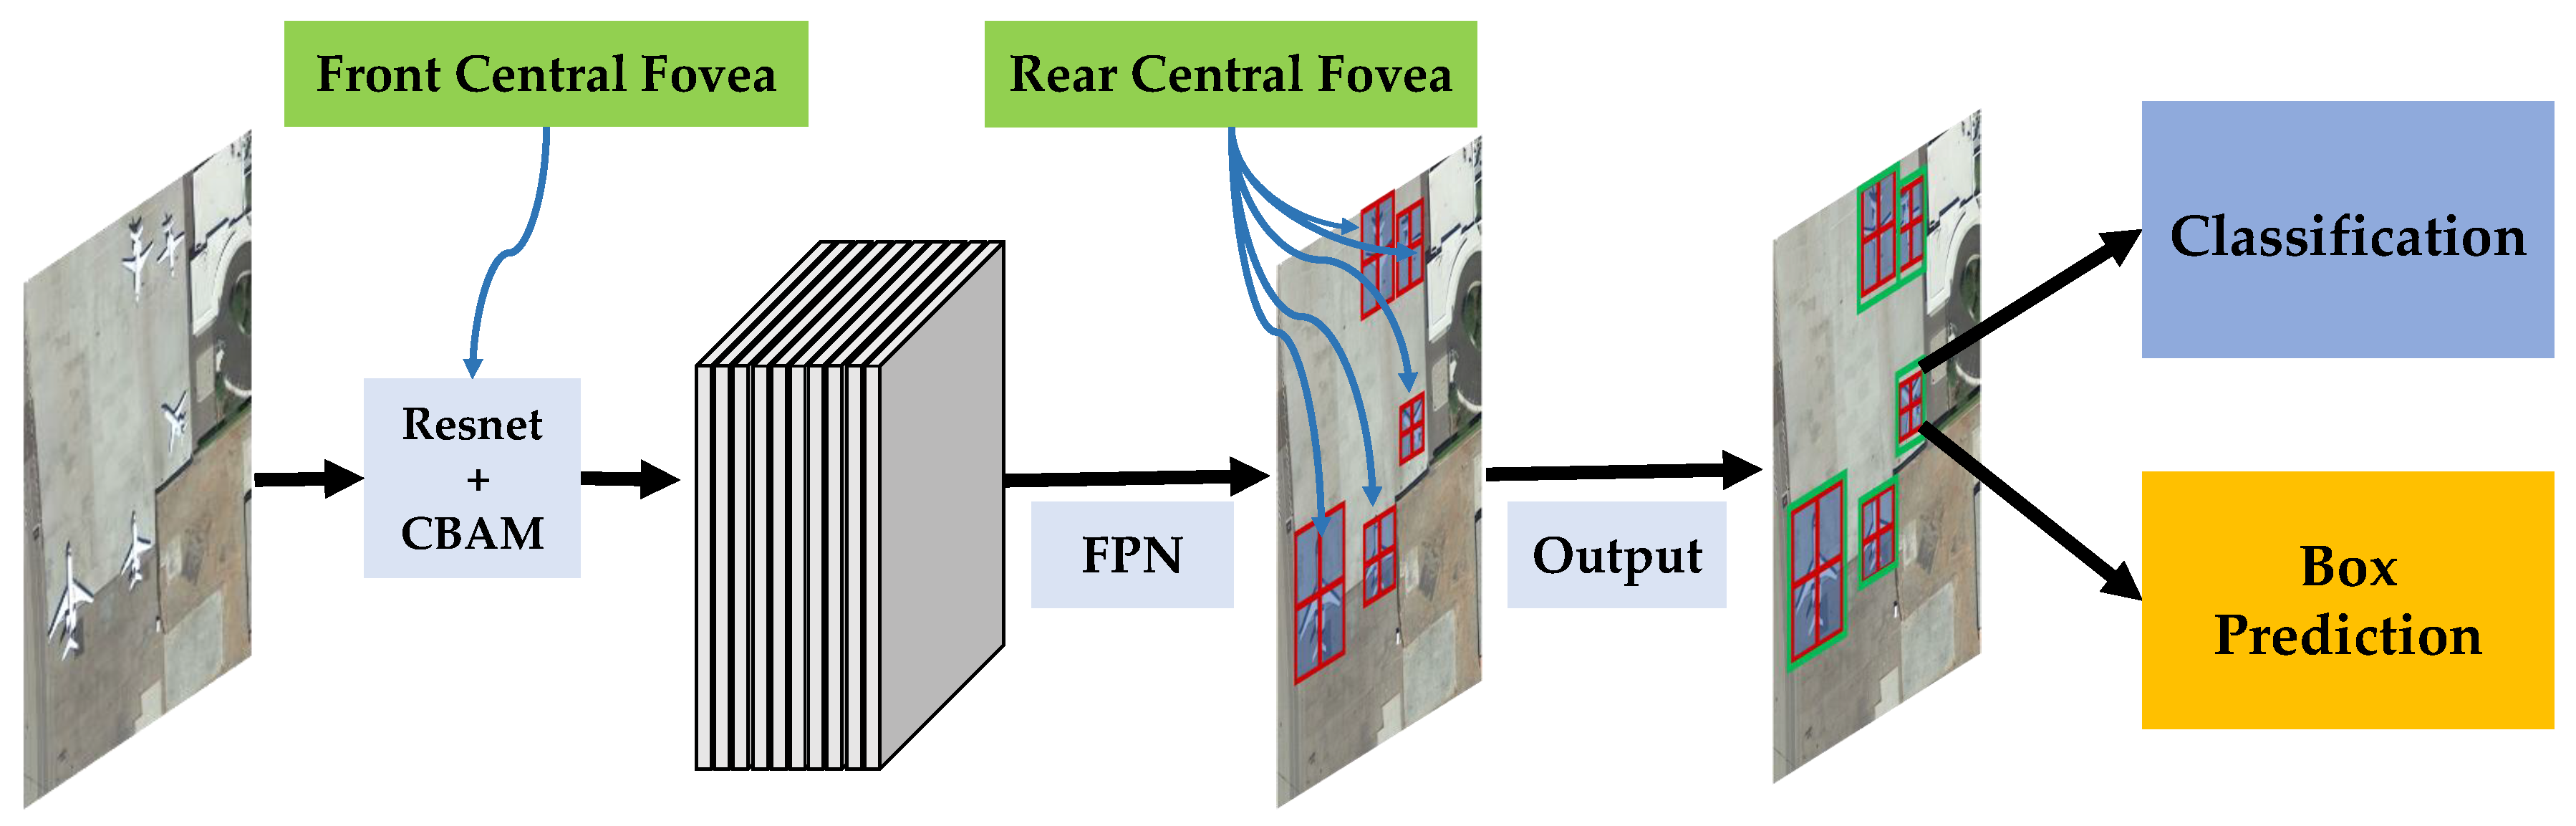
Although there are many good attention-based approaches for the object detection of remote sensing images, the robust problem is not yet completely solved. Therefore, in this paper, we propose a novel structure aiming to learn more robust and accurate object classification and positioning for remote sensing images. This framework is inspired by the eagle-eye, which has its complementary and exchangeable mechanism between the two foveae. The main contributions are as follows:
(1)
We propose a new architecture named the eagle-eye fovea network (EFNet) to detect objects in remote sensing images. This architecture is inspired by the vision attention mechanism and the cascade attention mechanism of eagle-eyes.
(2)
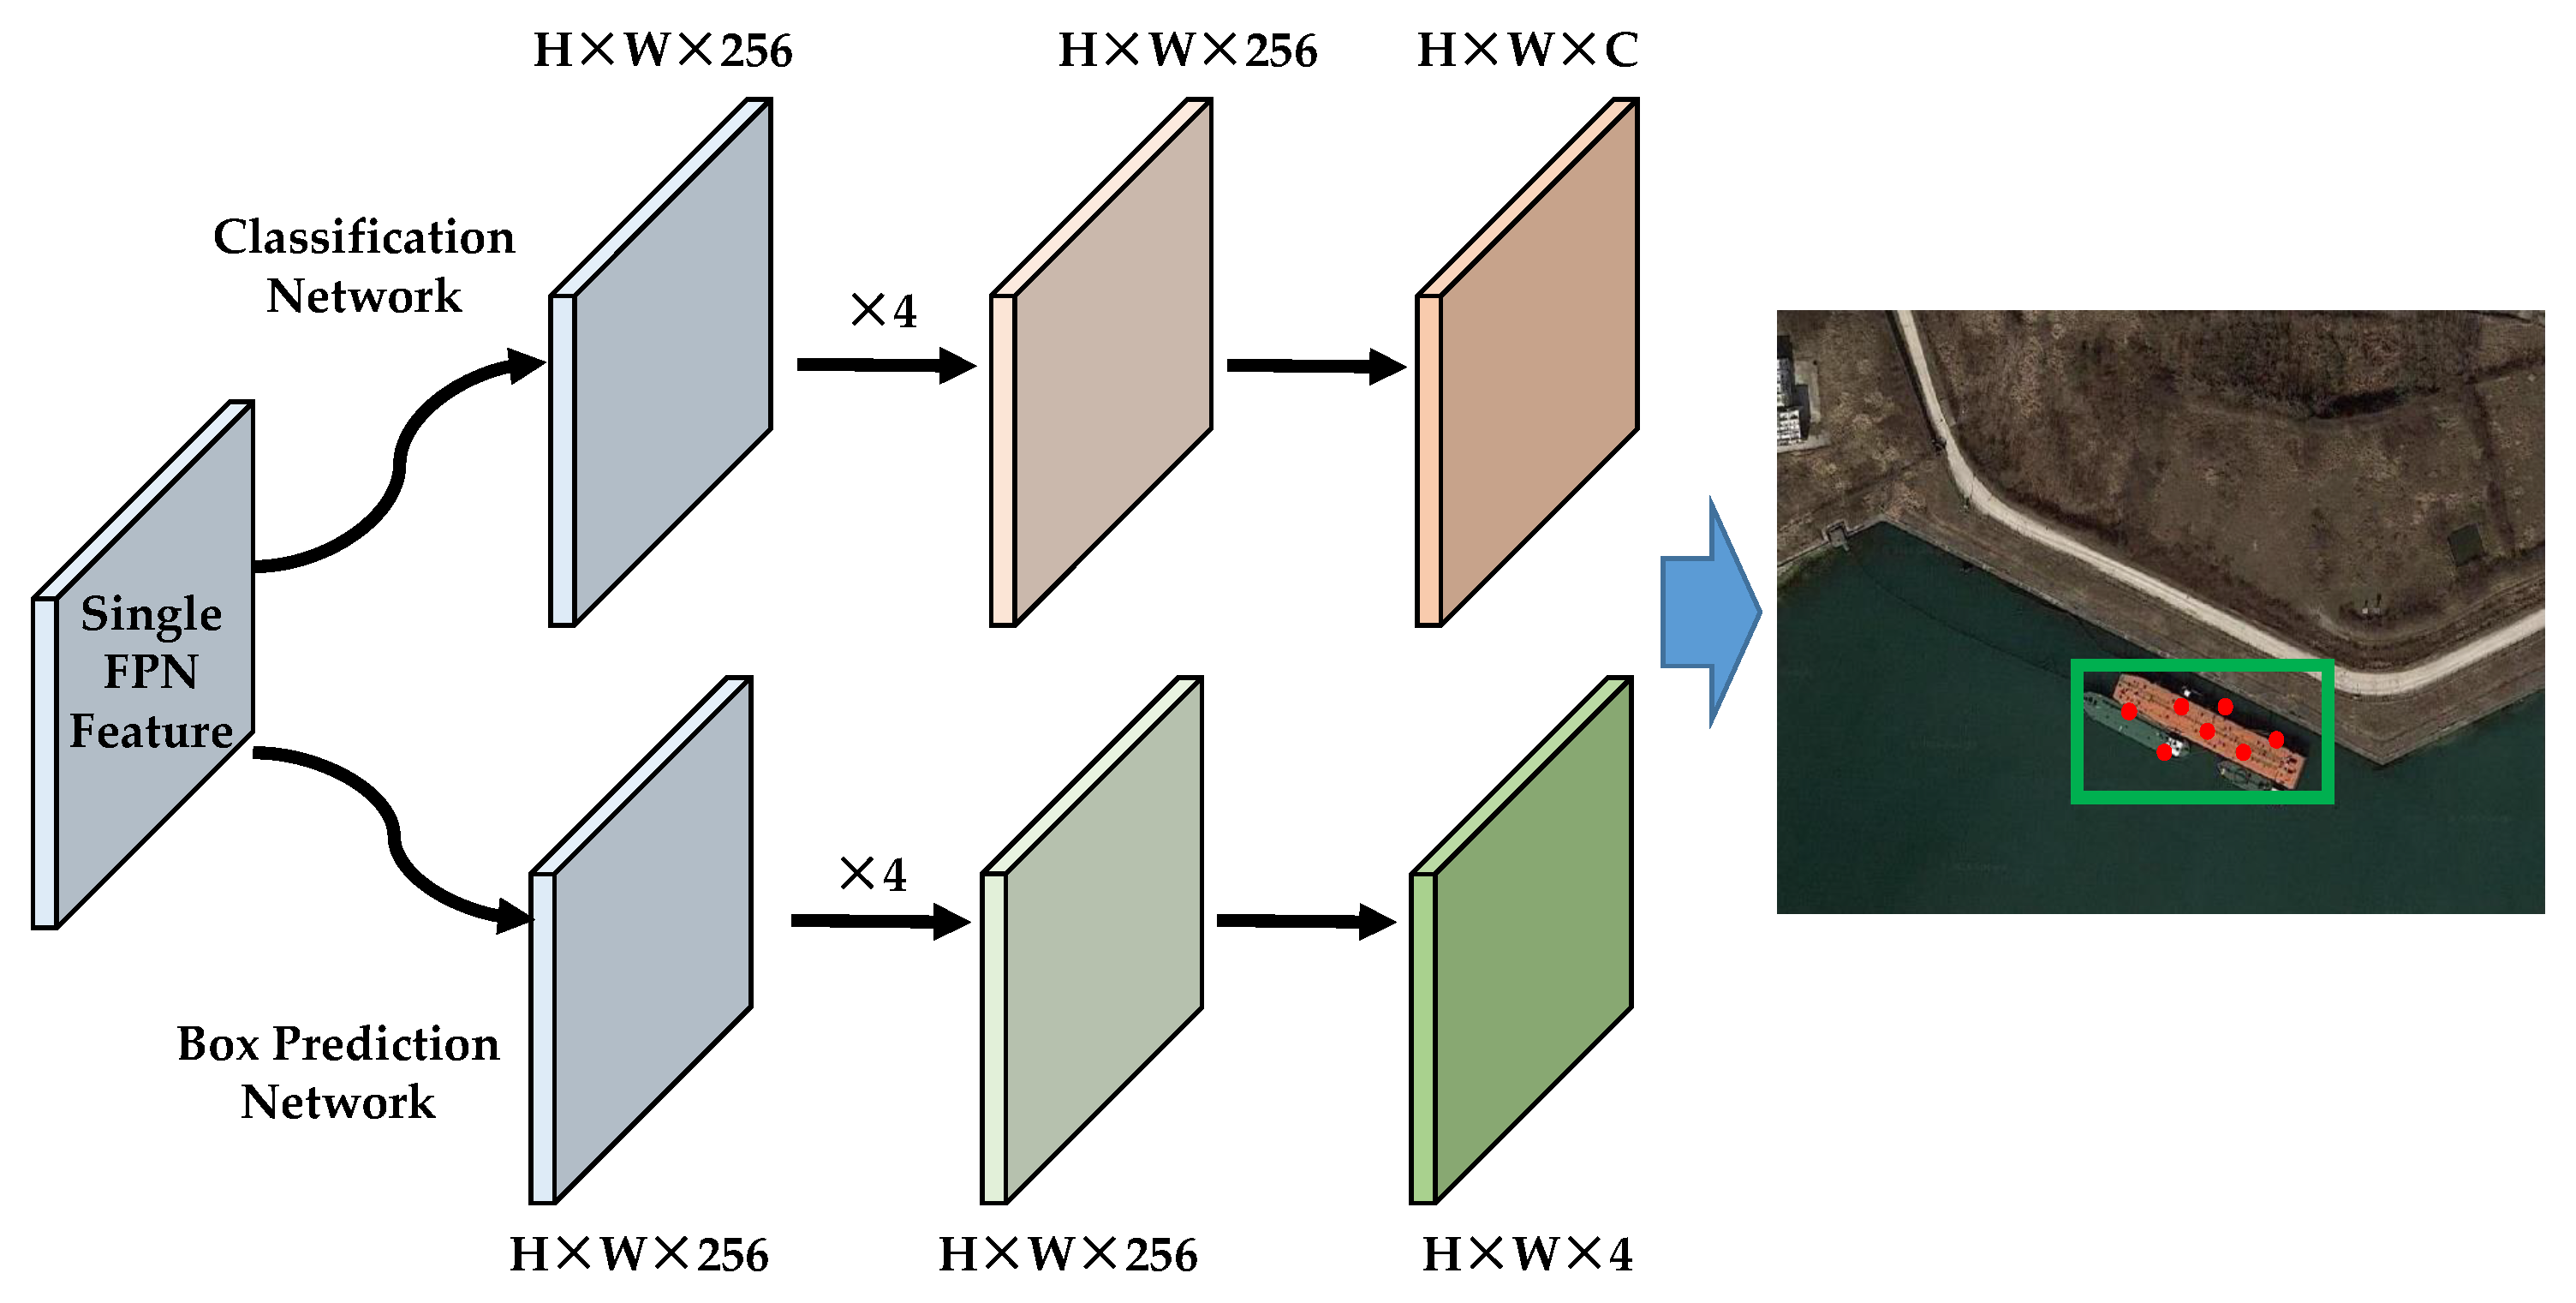
Two eagle-eye fovea modules, front central fovea (FCF) and rear central fovea (RCF), are included in the EFNet. The FCF mainly aims to learn the candidate–object knowledge based on the channel attention and the spatial attention, while the RCF aims mainly to predict the refined objects with two subnetworks without anchors.
(3)
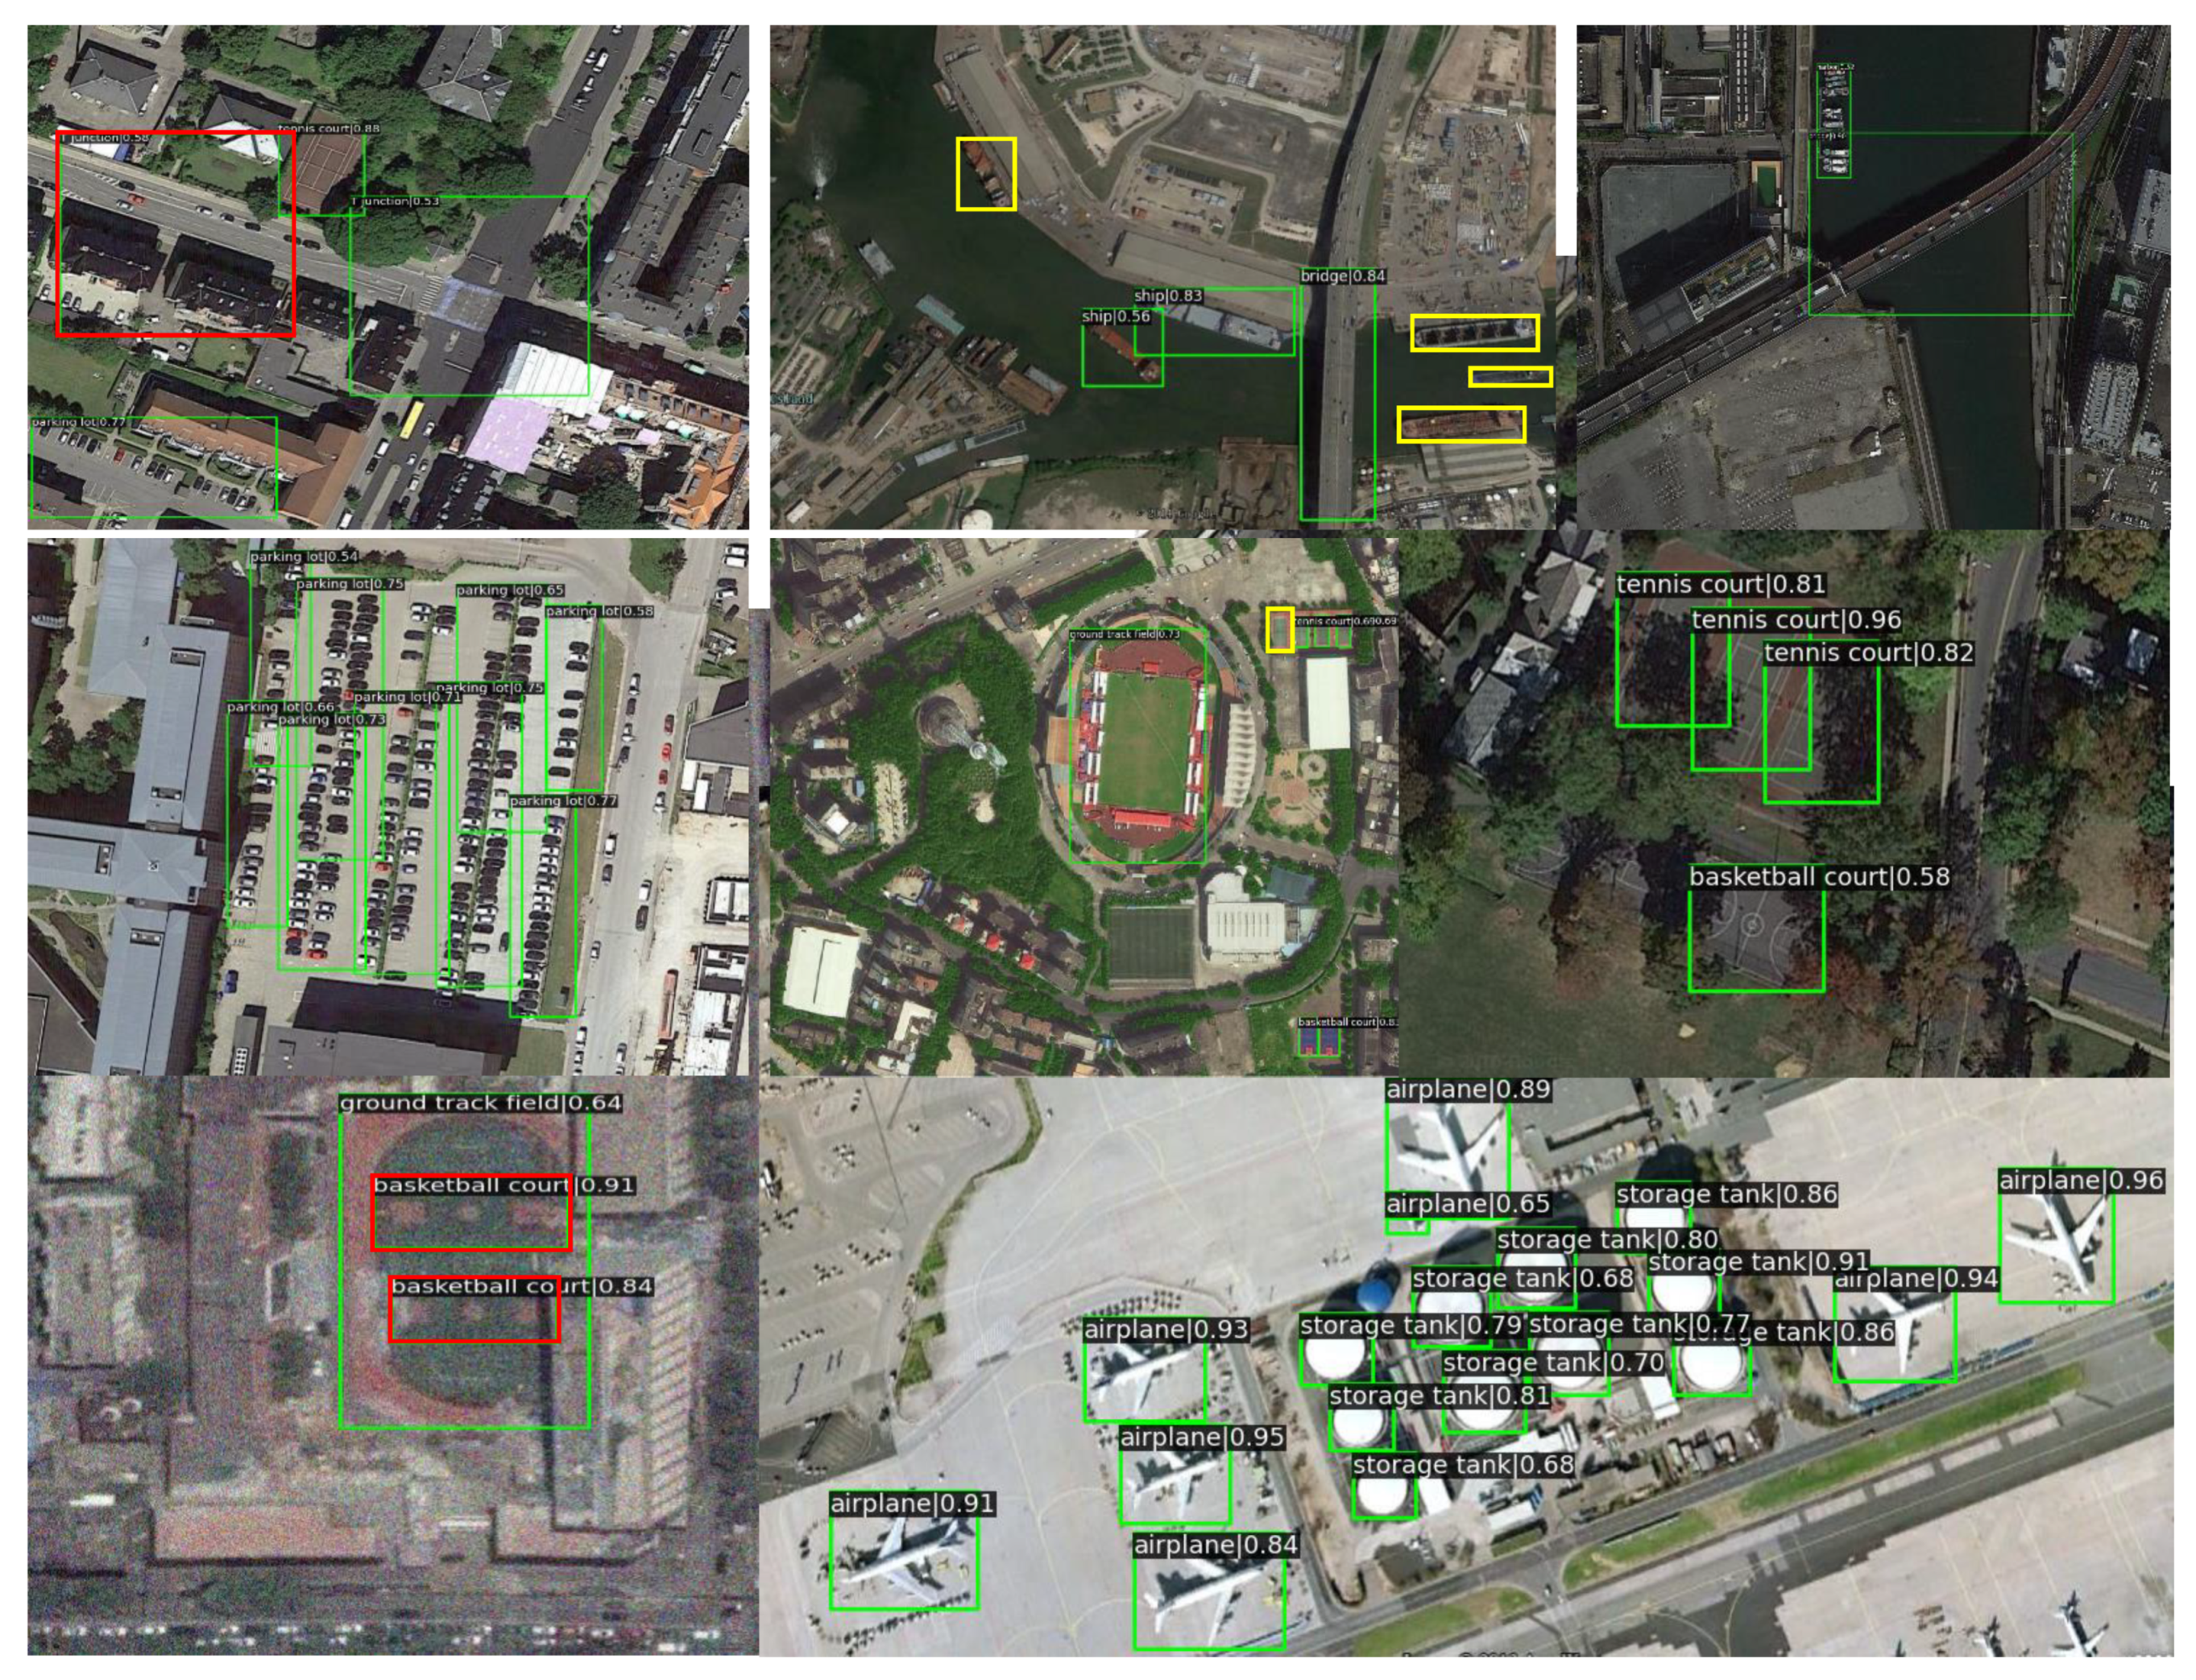
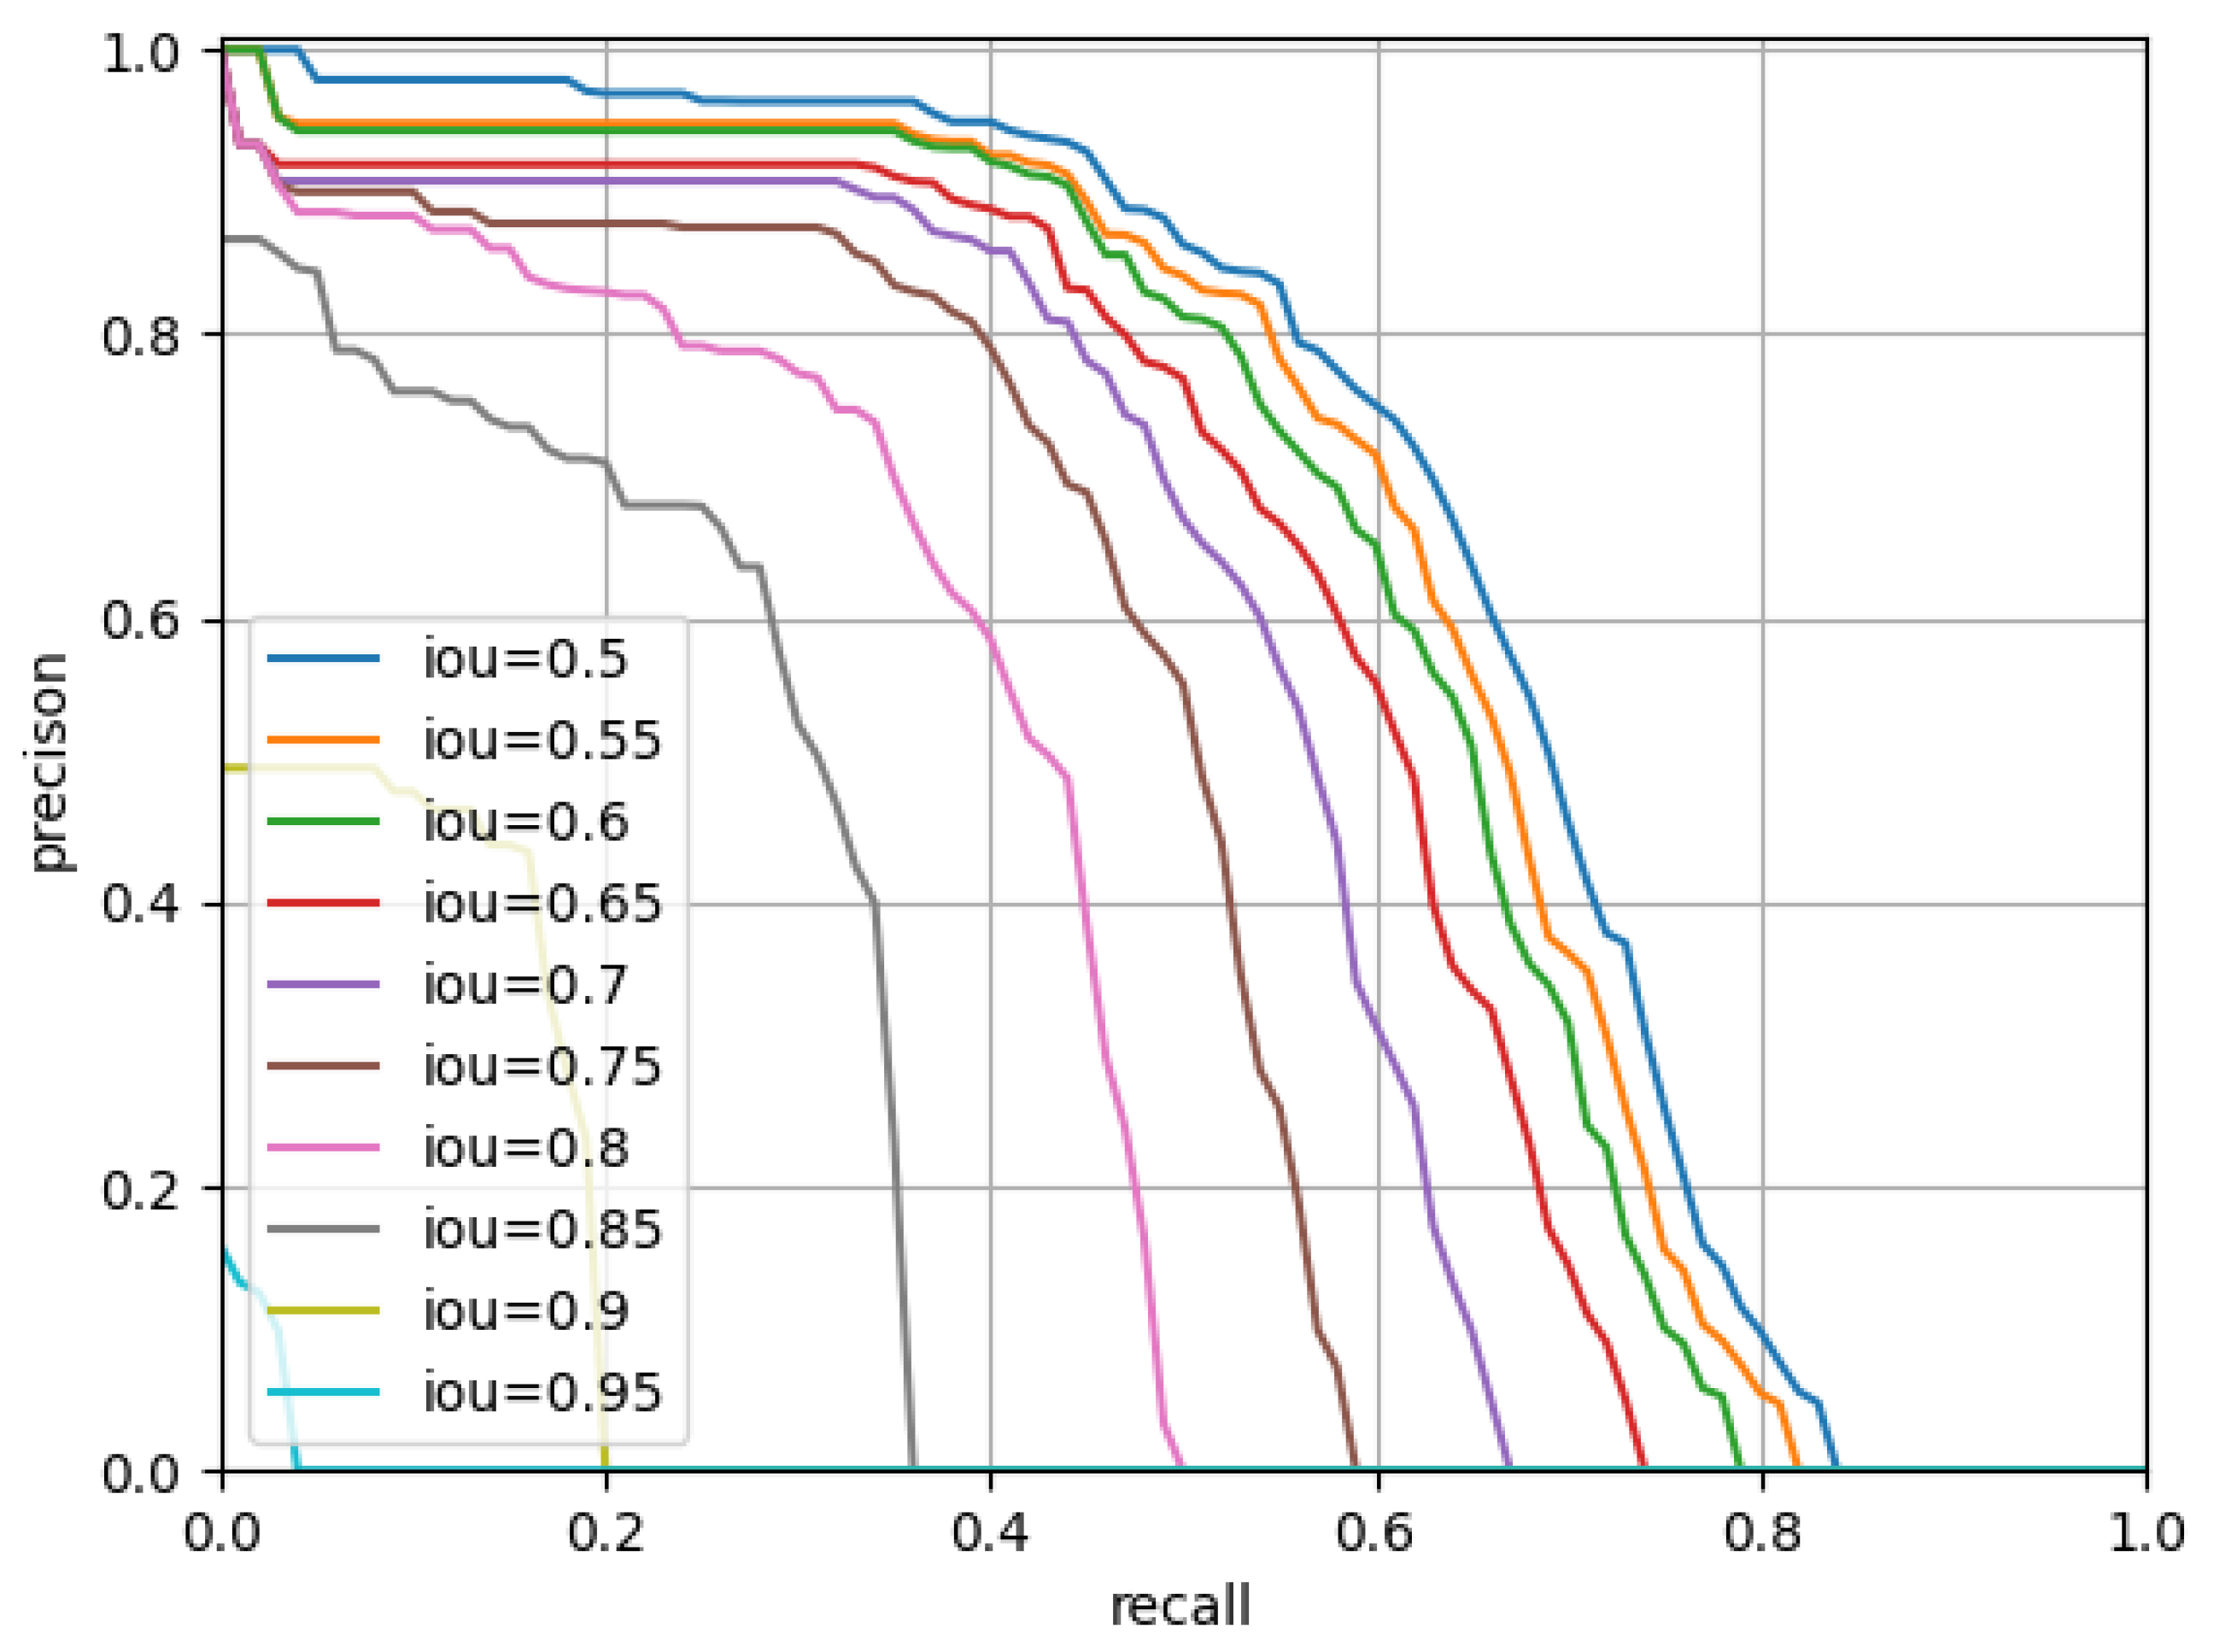
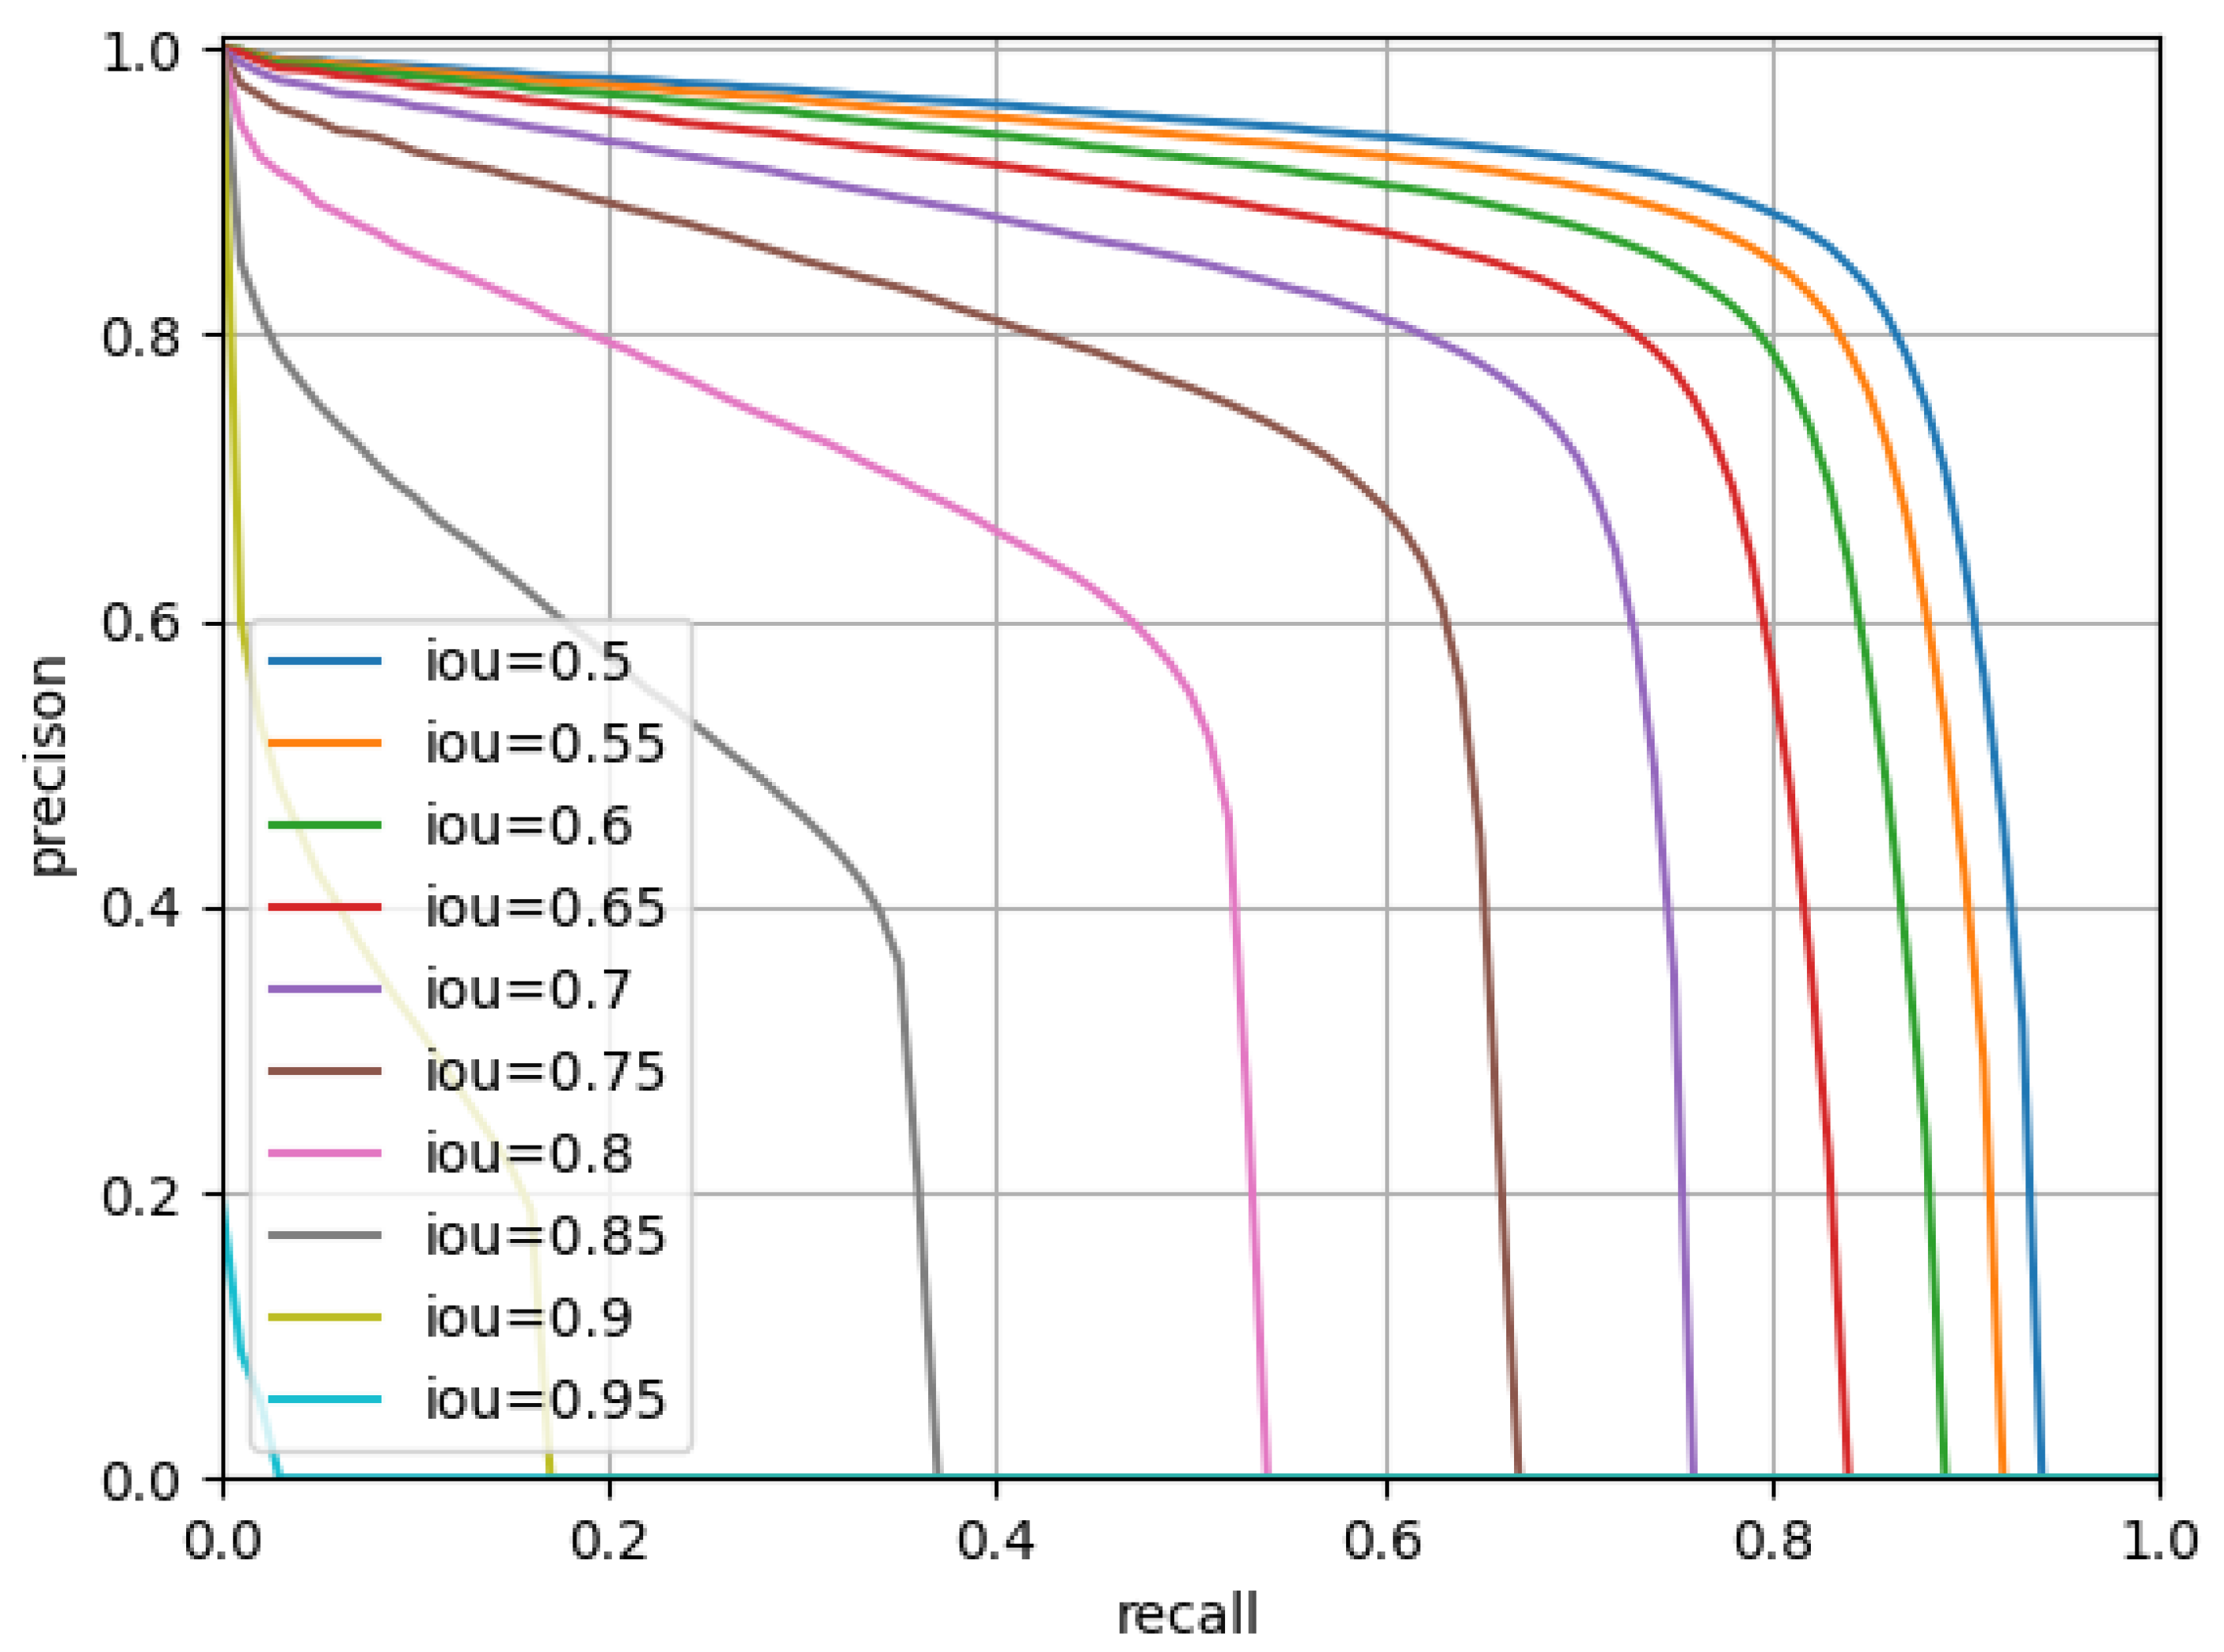
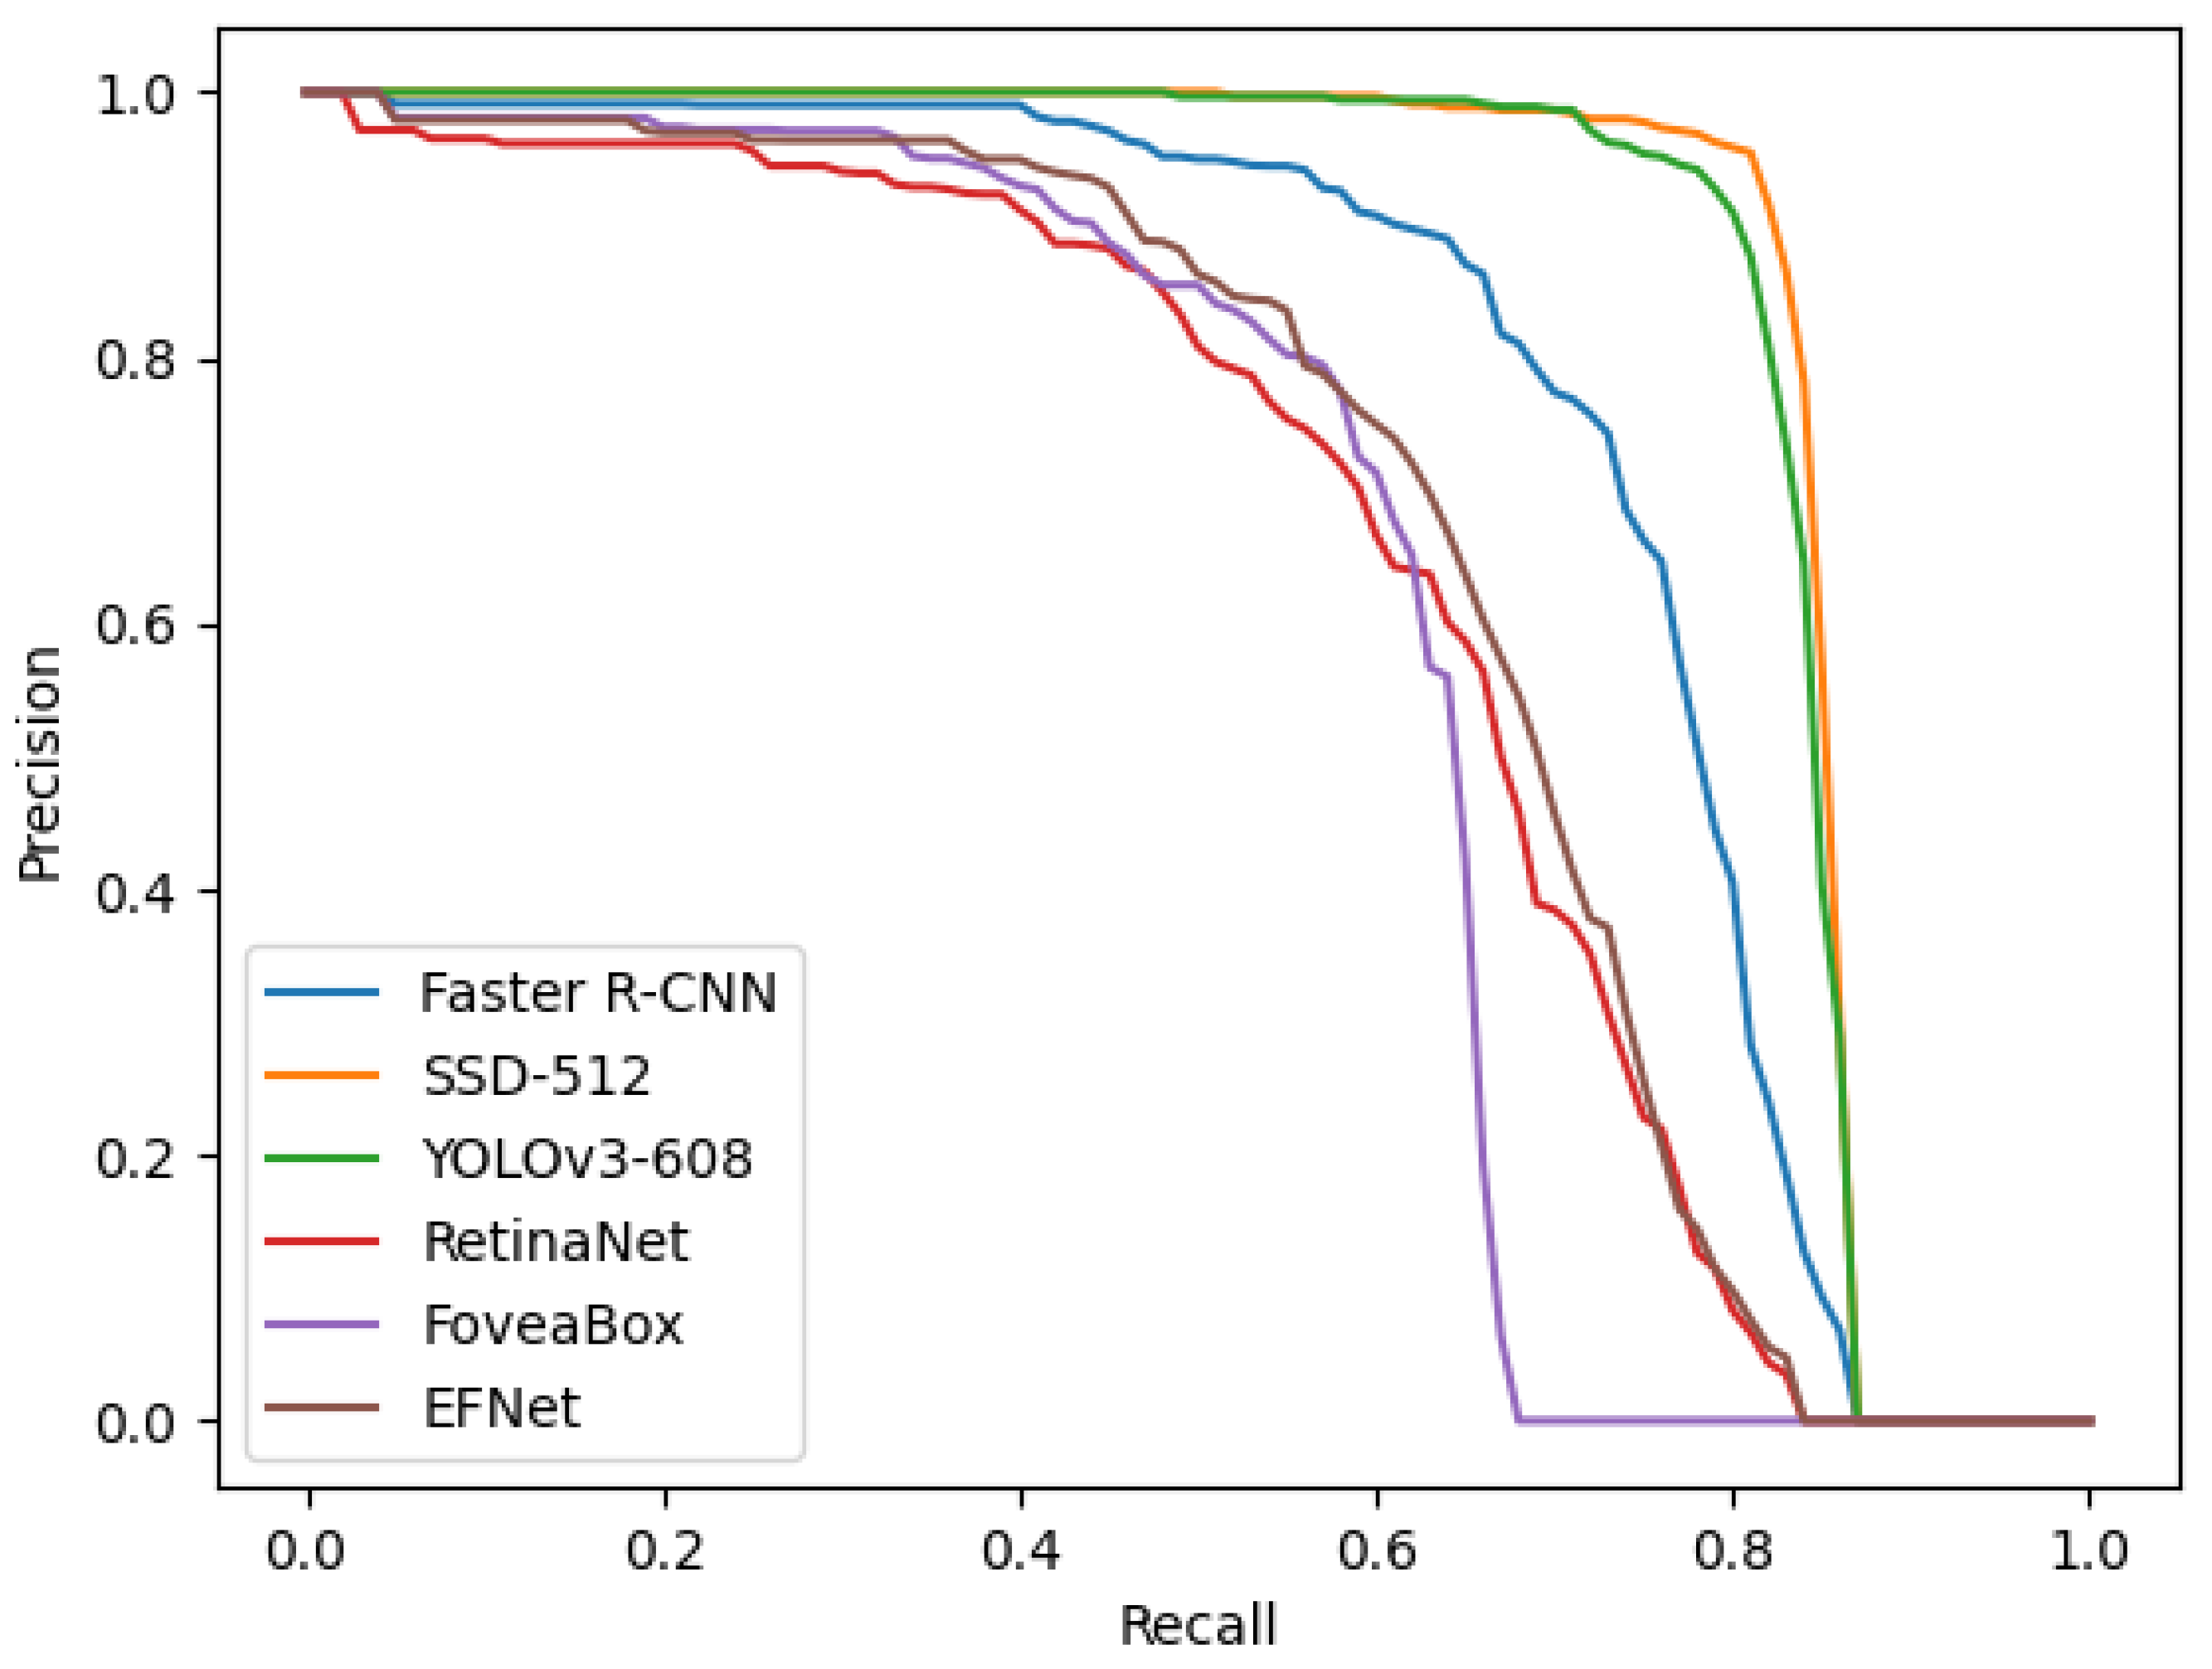
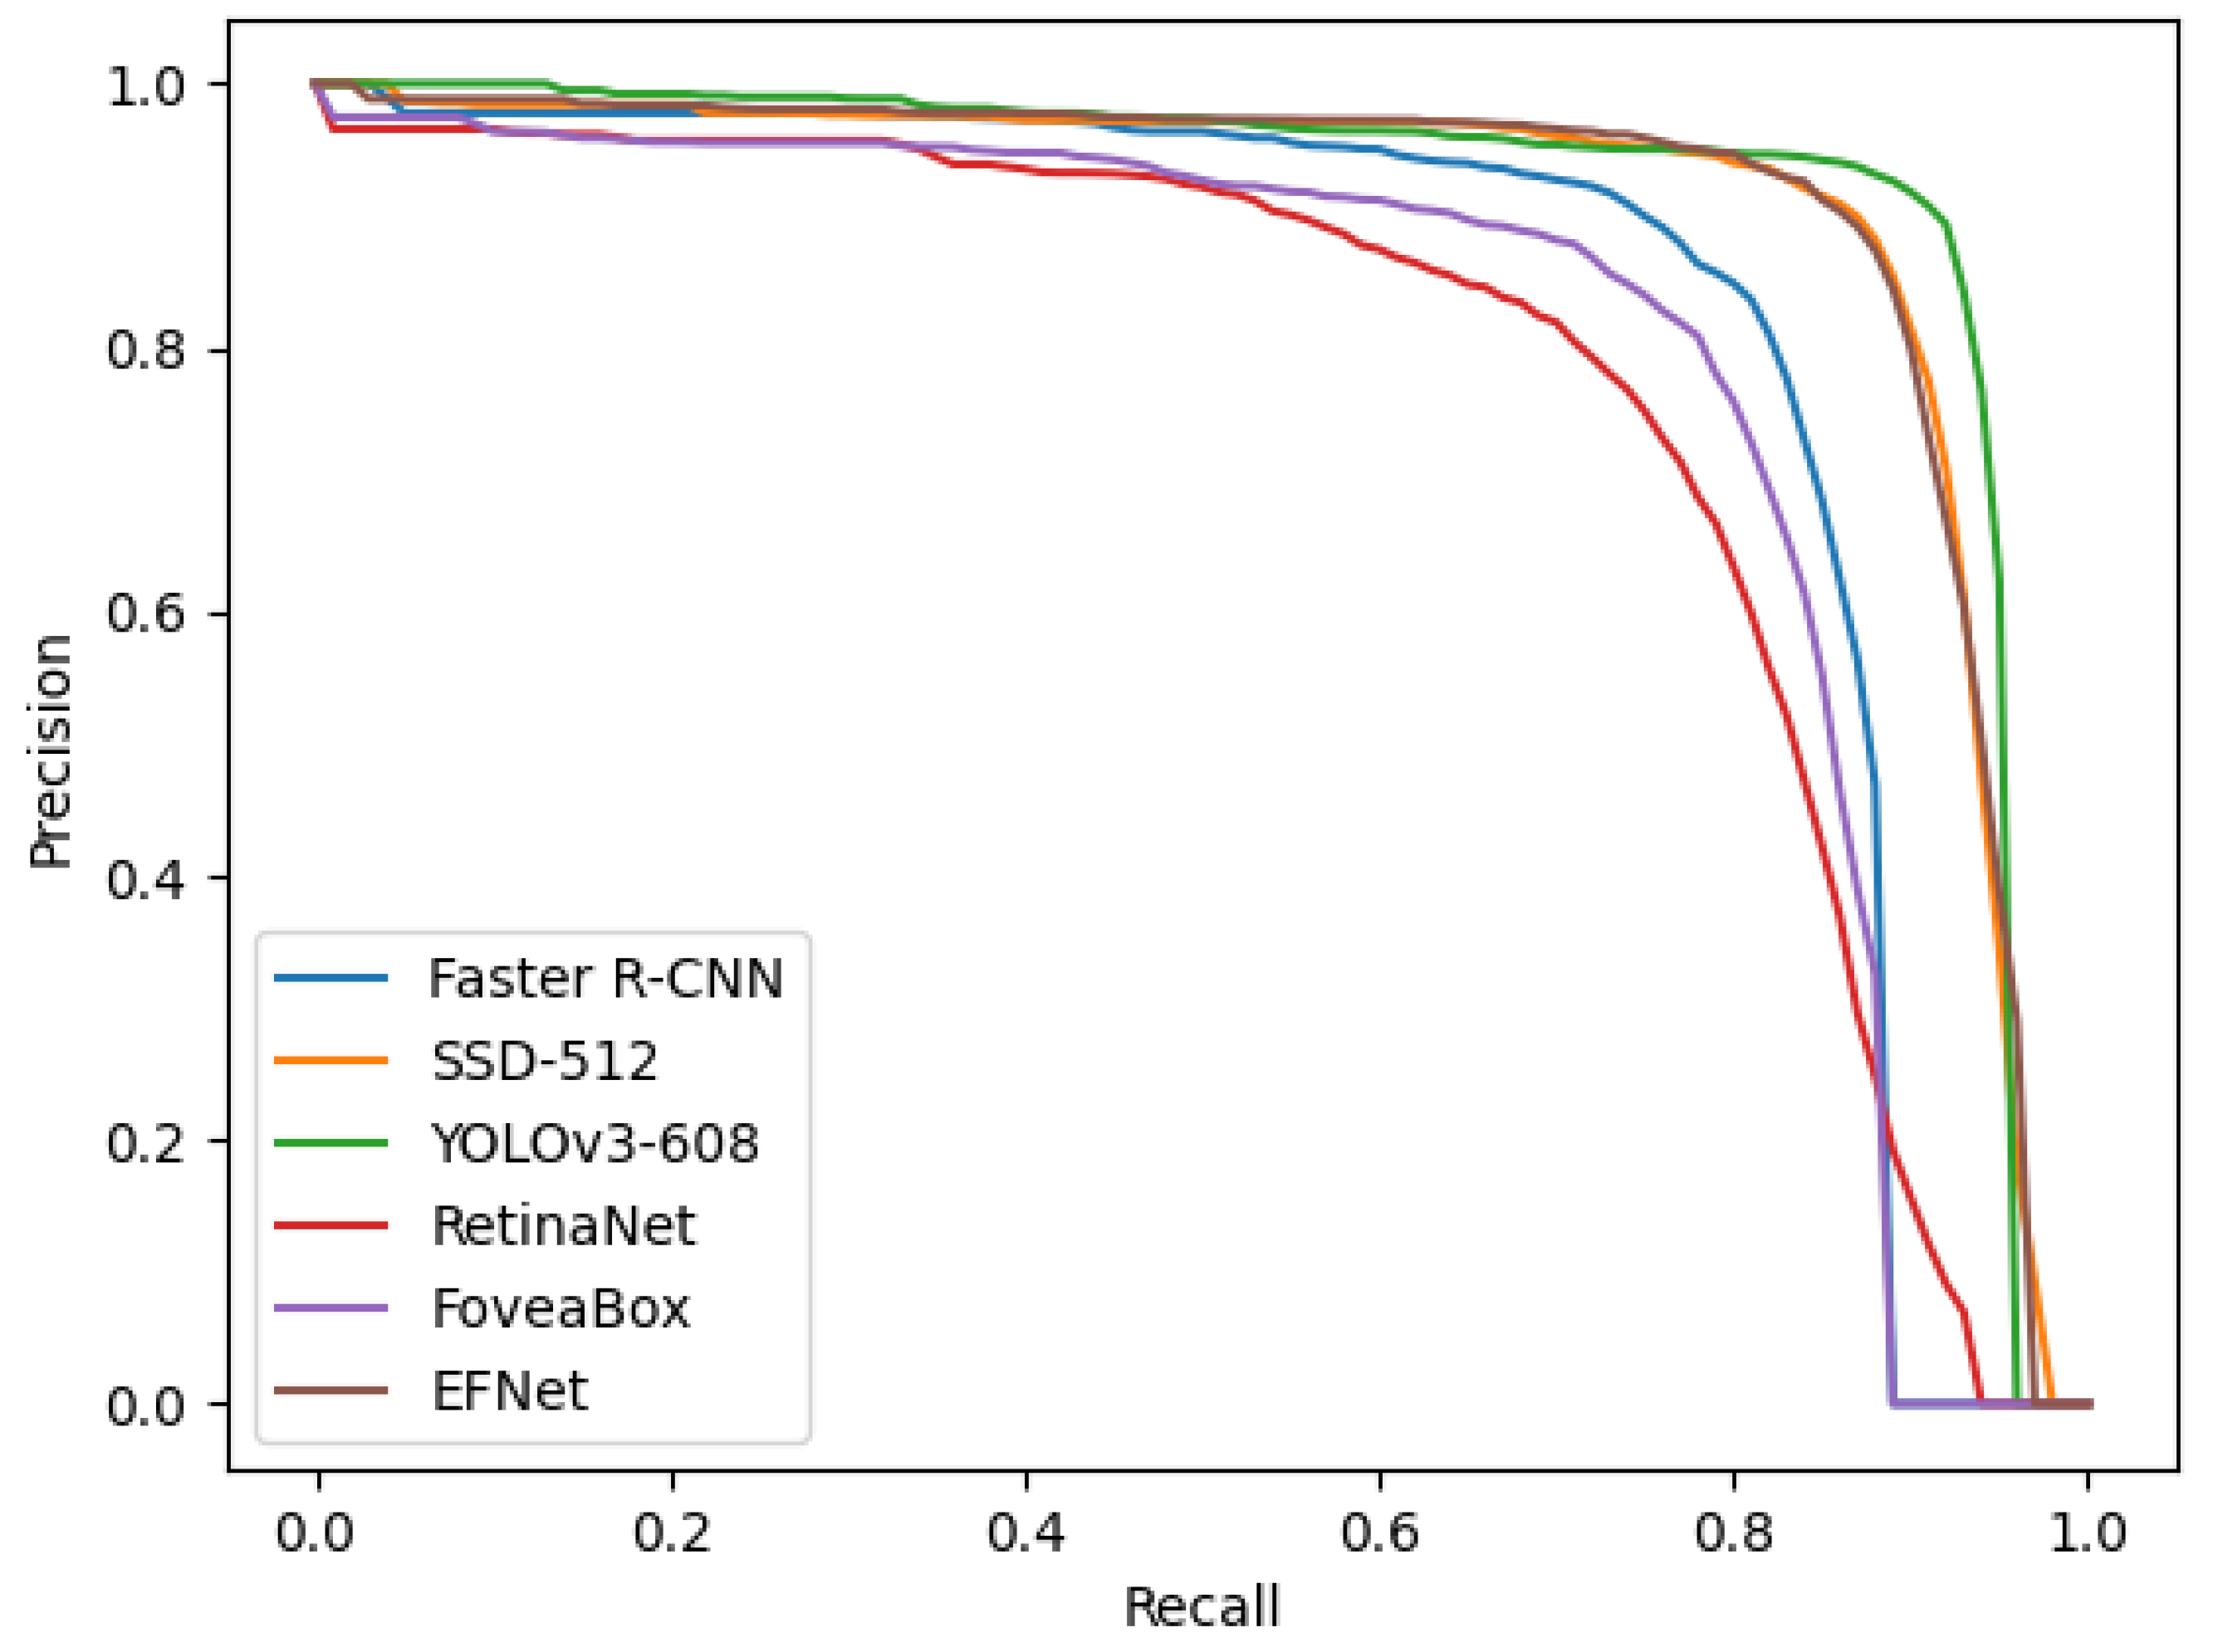
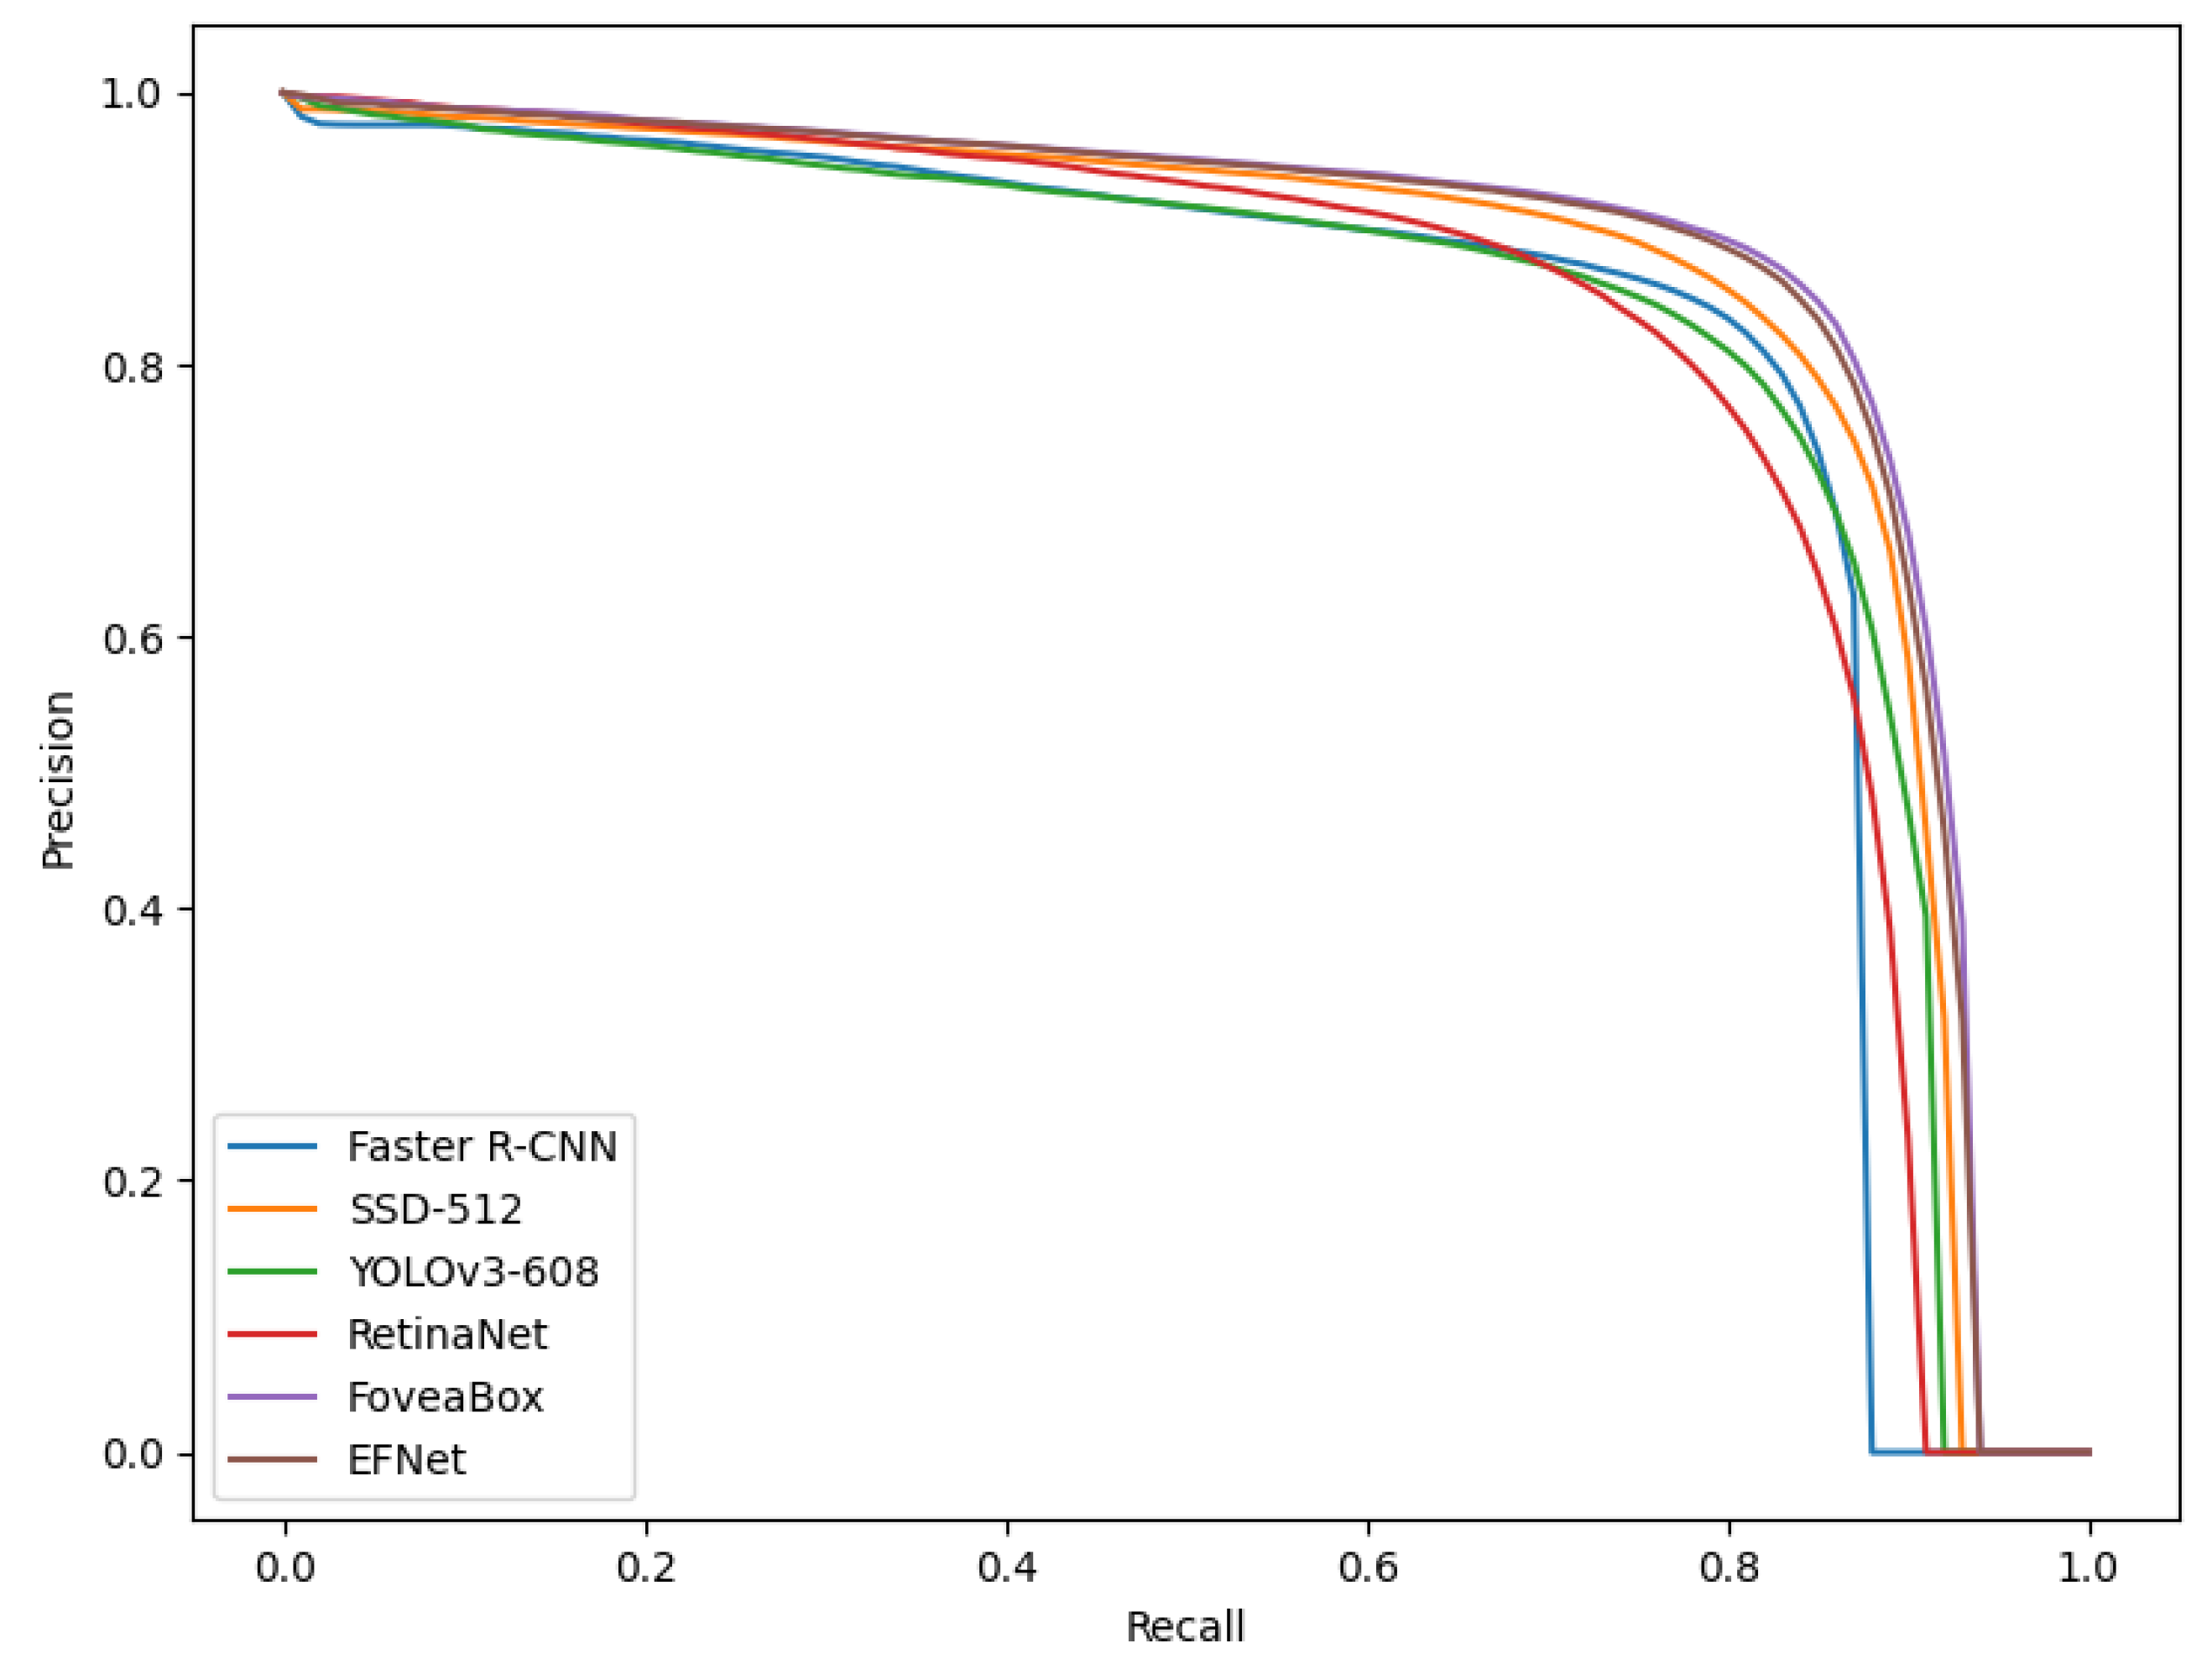
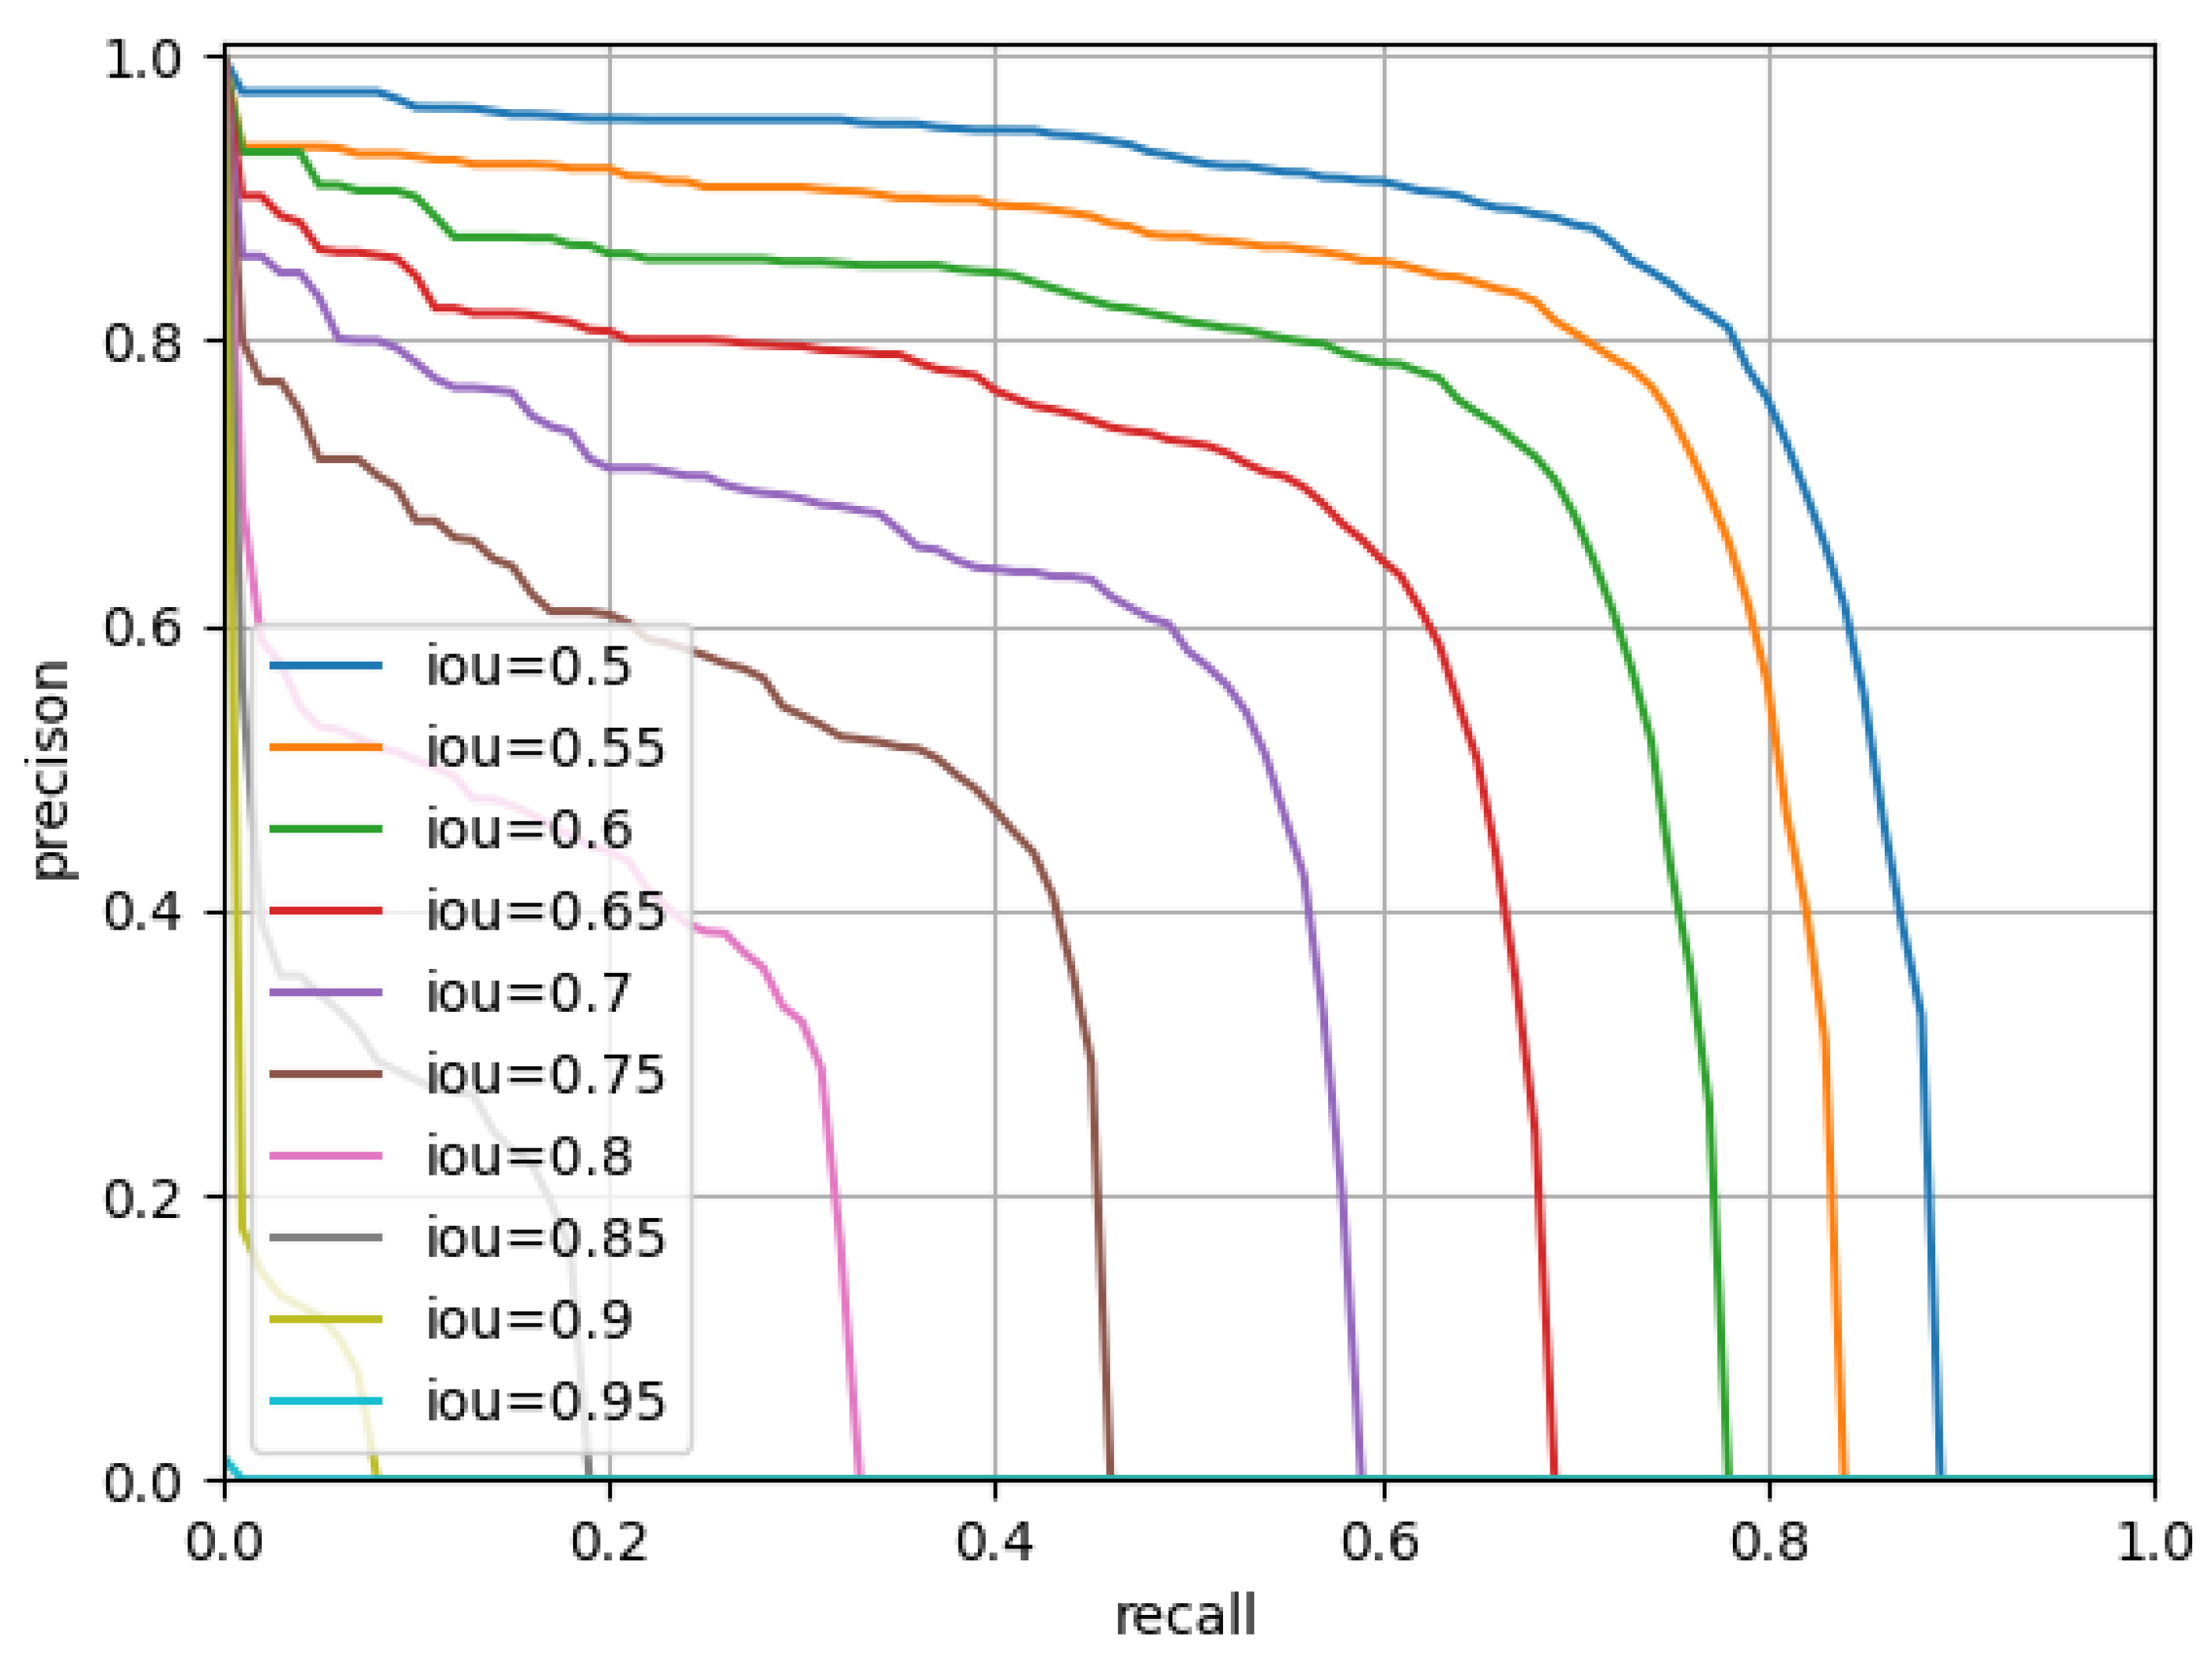
The two central foveae possess the complementary mechanism. The experimental results in three public datasets for object detection in remote sensing images demonstrates the effectiveness of the proposed architecture and method.
The remaining sections of this paper are organized as follows. Some related works are reviewed in Section 2. The proposed methodology is introduced in Section 3. Section 4 shows the experimental results. A discussion follows in Section 5. Finally, Section 6 includes our conclusion.

2. Related Work

2.1. The Mechanism of Eagle Eye

The eagle possesses extremely keen vision which can be used to locate prey. Once the prey is found, the eagle will quickly track the prey until it is captured [62,63,64,65]. The eagle’s keen vision is inseparable from its foveae. The density of photoreceptors in an eagle’s foveae is several times higher than that of human eyes. The resolution of an eagle’s eyes is positively correlated with the density of photoreceptors [66].
An eagle has two foveae in each eye, one deep and one shallow. The deep fovea has higher visual acuity than the shallow fovea. Figure 1 shows the structure of an eagle’s eyes and the two foveae. Since each eagle eye has two central fovea and their observation directions are different, the field of vision (FOV) of the eagle eye is very large. The FOV of the eagle eye in the horizontal direction (excluding the blind area) can reach 260 degrees. In the vertical direction, the FOV of the eagle eye also can reach 80 degrees. In the process of predation, the flight path of the eagle is generally not straight because the eagle is usually far away from the prey during predation, which requires the eagle’s side vision [67]. Therefore, the eagle can easily observe rabbits on the ground from thousands of meters in the air. Inspired by the eagle’s eyes, Abimael et al. [68] designed a parallel structure with two CNN submodules to detect moving objects. The authors claimed that the one CNN was used to perceive the context from videos, and the other CNN was used to focus on the small objects or details.
However, the foveae of eagles cannot observe objects at the same time. Rather, they constantly switch from one to another, and the deep foveae observe objects on the side, while the shallow foveae observe objects on the front.
The switch mechanism of FOV is more like a cascade structure, not a parallel structure. Moreover, the eagle’s viewpoint is similar to the remote sensing observation such as used by aircraft or satellites. Hence, the eagle-eye mechanism can give us some inspiration to explore a possible method of parallel structure for remote sensing object detection.

2.2. The Attention Module of CBAM

The attention mechanism is the most frequently used technique to improve semantic object saliency [53]. To suppress the characteristics of a complex background, an improved attention region proposal network (A-RPN) was used to predict the object’s location. As shown in Figure 2, the feature maps are fed into the convolutional block attention module (CBAM) network [56].
The CBAM is composed of two complementary modules, including a channel attention module and a spatial attention module. These modules can suppress the features of a complex background and highlight the features of objects. Among them, the channel attention module focuses on what the object is by assigning greater weight to channels containing more object information and smaller weight to channels containing more background information.
In Figure 2, the input feature maps are denoted as F R C × H × W . After the channel attention module, the channel attention map M c R C × 1 × 1 will be obtained, and the input feature F is weighted by M c to obtain refinement feature F . The spatial attention map M s R 1 × H × W will then be obtained through the spatial attention module. The final output F will be calculated by multiplying M s ( F ) and feature F . These formula derivations are as follows:
F M c ( F ) F ,
F M s ( F ) F ,
where ⊗ represents the multiplication of the corresponding elements of the matrix, C represents the number of channels for the input feature, and W and H represent the width and height of the feature map.
The channels with useful object feature information will be selected, while the spatial attention module can tell the network where the objects are and helps the network locate objects in the feature maps. First, feature F was obtained after a 3 × 3 convolution of the input feature map. Next, feature F will be obtained by the CBAM. Therefore, the A-RPN can carry out more accurate object classification and position regression. The CBAM is regarded as a universal module and can easily be connected to the convolutional blocks.

3. The Proposed Methodology

In this section, the proposed eagle-eye fovea network (EFNet) will be introduced in detail. The architecture of the EFNet is shown in Figure 3. First, the whole network architecture is introduced in Section 3.1. The structures of the two main components are introduced in Section 3.2 and Section 3.3, respectively. The object classification and the box prediction are introduced in Section 3.3.1 and Section 3.3.2.

3.1. Network Architecture

Inspired by the two central foveae of eagle eyes and the precision conversion mechanism, we developed a similar vision network for object detection in remote sensing images. The proposed EFNet consists of two eagle-eye central foveae: front central fovea (FCF) and rear central fovea (RCF). The framework of the proposed methodology is shown in Figure 3. For an image, the feature maps will be obtained through a backbone network which is added to an attention module CBAM. This module, as the FCF, will be used to improve the saliency of the candidate objects in the feature pyramid networks (FPN). The FoveaBox, as the RCF, is used to propose the most possible object areas which will be used for classification and box prediction.
It was introduced in Section 2.1 that eagles cannot use both foveae to simultaneously observe objects, but they can switch between the two foveae at any time. The deep fovea is used to observe objects on the side, and the shallow fovea is used to observe objects on the front. This mechanism can be regarded as the cascade mechanism. Inspired by this mechanism, the FCF and RCF are also a cascade distribution. Therefore, these two central foveae are designed to possess the complementary ability for object detection in remote sensing images.

3.2. Front Central Fovea

In this subsection, we will introduce the structure of the front central fovea (FCF). It is verified that CBAM is possessing universal applicability across different architectures and different tasks and can be seamlessly integrated into other CNN architectures to enhance the network. Therefore, the CBAM is integrated into the Resnet block [69] in our structure, shown in Figure 4.
The channel attention module focuses on what the object is. The average pooling ( A v g P o o l ) and maximum pooling ( M a x P o o l ) are utilized to extract two kinds of features denoted as F a v g c and F m a x c . When these features are fed into the middle shared network layer and applied in the shared network layer behind F a v g c and F m a x c , respectively, the corresponding elements of the two features will be obtained. Then, the channel attention map M c R C × 1 × 1 is obtained by sigmoid activation function as follows:
M c ( F ) = σ ( M L P ( A v g P o o l ( F ) ) + M L P ( M a x P o o l ( F ) ) ) = σ ( W 1 ( W 0 ( F a v g c ) ) + W 1 ( W 0 ( F m a x c ) ) ) ,
where σ represents the sigmoid function, W 0 C / r × C , and W 1 C × C / r . The M L P represents the multi-layer perceptron of the shared network. The features between W 0 and W 1 are processed by the ReLU. Finally, M c ( F ) is multiplied by its input features to obtain a fine feature map F adjusted by channel attention.
The spatial attention module focuses on where the object is, i.e., the spatial location of the defect on the input feature map. The input of spatial attention is the output F of the channel attentional power module, and the feature map is obtained through average pooling and maximum pooling F a v g s R 1 × H × W and F m a x s R 1 × H × W . Using a 7 × 7 convolution kernel and sigmoid function, the new space attention feature map M s is obtained as follows:
M s ( F ) = σ ( f 7 × 7 ( [ A v g P o o l ( F ) ; M a x P o o l ( F ) ] ) ) = σ ( f 7 × 7 ( [ F a v g s ; F m a x s ] ) ) ,
where the σ denotes the sigmoid activation function, and f 7 × 7 is the 7 × 7 convolution kernel.

3.3. Rear Central Fovea

The rear central fovea is described in this subsection, and this module mainly refers to the FoveaBox [70]. The FoveaBox is an accurate, flexible, completely anchor-free object-detection framework. Unlike previous anchor-based methods, the FoveaBox directly learns the possibility of an object’s existence and bounding box coordinates without reference to anchor points. This is achieved by: (a) class-sensitive semantic maps that predict the object possibility; (b) generating bounding boxes for each location that might contain an object. As a result, the rear central fovea of the framework mainly utilizes the setting of the FoveaBox. The FoveaBox has five feature levels which derive subnets P l ( l = 3 , 4 , , 7 ) , respectively, and each level output feature map with scale 1 2 l . Due to the wide range of object scales, the FoveaBox adopts different levels to predict objects of different sizes. The dimensions of the seven levels are set as S l = 4 l S 0 , which range from 32 2 to 512 2 . S 0 = 16 ( l = 3 , 4 , , 7 ) . To control the overlapping area between different levels, parameter η is added to adjust the scales of different levels. By adjusting parameters [ S l η 2 , S l η 2 ] , one object may be detected at multiple levels.
The object prediction performs in each single FPN level. Two branch networks of the object prediction network are shown in Figure 5. Two branch networks are adopted for the different levels. One is for predicting categories, and the other is for predicting boundary boxes. The output of the classification subnet is W × H × C (C is the count of the feature level channels), and the output of the box prediction subnet is W × H × 4 . Next, the non-maximum suppression (NMS) is adopted for each category with a threshold 0.5. Finally, 100 predictions with the highest score are selected for each image.

3.3.1. Object Classification

It is difficult to allocate positive and negative samples when the method is anchor-free, so the multi-level prediction can be used to solved or effectively reduce to the problem of object overlap. The anchor-based methods need to calculate the Intersection over Union ( I o U ) based on the positive and negative samples. As an anchor-free method, the FoveaBox does not need to calculate I o U . The FoveaBox directly maps ground-truth to the feature maps of the corresponding level. The formula is as follows:
x 1 = x 1 2 l , y 1 = y 1 2 l , x 2 = x 2 2 l , y 2 = y 2 2 l , c x = x 1 + 0.5 ( x 2 x 1 ) , c y = y 1 + 0.5 ( y 2 y 1 ) ,
where ( x 1 , y 1 , x 2 , y 2 ) is a valid box of the ground-truth, and 2 l is the down sampling factor. While ( x 1 , y 1 , x 2 , y 2 ) is the mapping box of the target feature pyramid P l , ( c x , c y ) is the center position the mapping box.
In addition, not all regions corresponding to ground-truth are positive samples, as shown in the Figure 5. Although the ship is large, the real positive sample is the red area in the middle, which is also the essence of FoveaBox. As a result, a shrunk factor σ is introduced, which can dynamically set the positive sample areas according to the parameters as follows:
x 1 p o s = c x 0.5 ( x 2 x 1 ) σ ,
y 1 p o s = c y 0.5 ( y 2 y 1 ) σ ,
x 2 p o s = c x + 0.5 ( x 2 x 1 ) σ ,
y 2 p o s = c y + 0.5 ( y 2 y 1 ) σ .
where ( x 1 p o s , y 1 p o s , x 2 p o s , y 2 p o s ) is the positive area by shrunk factor σ . For the negative sample, the authors set σ 2 . In the experiments, σ 1 = 0.3 and σ 2 = 0.4 . The areas between 0.3 and 0.4 are not involved in the training stage. Since the negative samples and the positive samples are unbalanced, focal loss is utilized in the training stage.

3.3.2. Box Prediction

In the box prediction, the transformation function is utilized to carry out the coordinate transformation as follows:
t x 1 = log 2 l ( x + 0.5 ) x 1 z ,
t y 1 = log 2 l ( y + 0.5 ) y 1 z ,
t x 2 = log x 2 2 l ( x + 0.5 ) z ,
t y 2 = log y 2 2 l ( y + 0.5 ) z ,
where z = S l . The ( x 1 , y 1 , x 2 , y 2 ) are the ground-truth, and ( t x 1 , t y 1 , t x 2 , t y 2 ) stands for the prediction output. The smooth L1 loss is used for the box prediction.

4. Experiments and Results

4.1. Dataset

Three publicly available object-detection datasets of remote sensing images are used to evaluate the proposed methods in the experiments. Some examples of the DIOR, HRRSD, and AIBD are shown in Figure 6.
The first dataset is DIOR [71] which is a large-scale benchmark dataset for remote sensing object detection. The DIOR is sampled from Google Earth and released by the Northwestern Polytechnical University, China. The dataset contains 23,463 images and 20 object classes with 192,472 instances. The 20 object categories are airplane, baseball field, basketball court, airport, bridge, chimney, expressway service area, dam, expressway toll station, ground track field, harbor, golf course, overpass, stadium, storage tank, ship, tennis court, vehicle, train station, and windmill. The spatial resolutions of the images range from 0.5 m to 30 m, and the image scale is 800 × 800 pixels. This dataset possesses four characteristics: (1) large number of object instances and images; (2) various object scales; (3) different weathers, imaging conditions, seasons, etc.; (4) high intra-class diversity and inter-class similarity.
The second dataset is HRRSD [72] which was released by the University of Chinese Academy of Sciences in 2019. The HRRSD contains 21,761 image samples obtained from Google Earth and Baidu map, with spatial resolution ranging from 0.15 m to 1.2 m. The count of the object instances is 55,740 covering 13 object categories. The categories are separately airplane, baseball diamond, crossroad, ground track field, basketball court, bridge, ship, storage tank, harbor, parking lot, tennis court, T junction, and vehicle. The highlight of the dataset is the balanced samples across categories, with nearly 4000 for each category. In addition, the sample count of the train subset is 5401, and those of the validation subset and the test subset are 5417 and 10,943. The ‘train-val’ subset is the union set of the train subset and the validation subset.
The third dataset is AIBD which is specially self-annotated for the task of building detection. The AIBD which was first introduced in [73] contains a single object category: building. The sample scale of the samples is 500 × 500 , and the total count of the samples is 11,571, with the same number of annotation files. Based on the COCO metric, the building instances are divided into large-scale instances, medium-scale instances, and small-scale instances. The counts of the large-scale instances, medium-scale instances, and small-scale instances are 16,824, 121,515, and 51,977, respectively. The color characteristics are distinct from each other with tremendously different backgrounds. The pixel number of the buildings ranges from tens to hundreds of thousands. The geometric shapes of the instances are diversiform and consist of some irregular shapes, such as U-shape, T-shape, and L-shape. The original images of AIBD are from the Inria Aerial Image Data (https://project.inria.fr/aerialimagelabeling/, accessed on 1 August 2020) which are mainly used for semantic segmentation. Five urban cities are selected for both train set and test set, and about 81 km 2 areas with 36 image tiles are selected for each city. The train set and the test set both contain 180 image tiles covering 405 km 2 . The image resolution of the image tiles is 5000 × 5000 with 0.3 m geographic resolution.

4.2. Evaluation Metrics

The Average Precision ( A P ) and its derivative metrics are adopted to quantitatively evaluate the proposed method. The A P is a comprehensive metric in the task of object detection and based on the p r e c i s i o n and r e c a l l as Equations (14) and (15).
p r e c i s i o n = T P T P + F P ,
r e c a l l = T P T P + F N ,
where the terms TP, FP, and FN are true positives, false positives, and false negatives, respectively. The terms TP, FP, and FN are calculated from the Intersection over Union ( I o U ) between the bounding boxes of ground-truth and the bounding boxes of prediction as follows:
I o U = B p r e d B g t B p r e d B g t ,
where B p r e d denotes the bounding box of prediction, and B g t is the bounding box of ground-truth.
The standard COCO metrics, including A P , A P 50 , A P 75 , A P s , A P m , and A P l , are briefly reported in Table 1. For the detection of multi-category objects, the A P usually denotes mean average precision ( m A P ) which is obtained by the average of different category A P s.

4.3. Experimental Setup

The comparative algorithms include general object-detection algorithms and domain algorithms of remote sensing. Some general object-detection algorithms are Faster R-CNN [44], SSD [74], YOLO [75], RetinaNet [76], and FoveaBox [70]. Among them, the Faster R-CNN [44] is the typical representative of the two-stage method, while the SSD [74], YOLO [75], RetinaNet [76] are the representatives of the single-stage method. In addition, the FoveaBox [70] is an anchor-free method. Some domain algorithms of remote sensing are RICAOD [77], RIFD-CNN [31], RICNN-finetuning [30], HRCNN-regression [72], and FRCNN TC [73]. The general object-detection algorithms are performed on all of the testing datasets. Because it is difficult to obtain the released codes, some experimental results of the domain algorithms are mainly cited from existing references.
The percentages of train set, validation set, and test set of DIOR are 0.25 , 0.25 , and 0.5 , respectively However, the train set and validation set of HRRSD and AIBD are jointly used to train models. The main comparison experiments are based on the mmdetection platform (https://github.com/open-mmlab/mmdetection, accessed on 13 June 2021). The platform possesses four Nvidia GeForce RTX 2080 GPUs. The setting of hyper-parameters for the comparative methods in the mmdetection is summarized in Table 2.

4.4. Results and Analysis

In this section, the experimental results are shown in detail. Some qualitative examples of the EFNet on three datasets are separately presented in Figure 7, Figure 8 and Figure 9. The TPs, FPs, and FNs are indicated by green, red, and yellow boxes, respectively. Those object instances with small-size and dense appearance could be falsely detected, such as vehicles, ships, and so on, whereas those objects that possess relatively fixed appearance characteristics, such as the airplanes or storage tanks, are rarely misdetected or missed. For example, the top instance with a red rectangle in Figure 7 is misdetected as a bridge; it is actually an overpass. Although the AIBD contains a single category, the variation within the class is huge. We can see that the detected results are mostly satisfying, not only for common rectangle buildings, but also for the buildings with irregular shape. The scales of the building instances also change tremendously.
The quantitative results of the comparative methods are respectively shown in Table 3, Table 4 and Table 5. The A P and A P 50 are the primary metrics for the experimental results. Those existing results from other references correspond to A P 50 . For the DIOR with 20 categories, the best results of A P and A P 50 are achieved by SSD-512 with 0.509 A P and 0.769 A P 50 . The second place is achieved by the Faster R-CNN. The EFNet is the third place with 0.359 A P and 0.604 A P 50 . For the HRRSD with 13 categories, the best results of A P and A P 50 are achieved by Faster-RCNN with 0.632 and 0.910. The second place is achieved by the EFNet with 0.622 A P and 0.907 A P 50 . On the one-class AIBD, the best results of A P and A P 50 are also achieved by the Faster-RCNN with 0.520 and 0.869. The second place is achieved by the EFNet with 0.517 A P and 0.864 A P 50 . Although the best results are mostly achieved by the Faster-RCNN of the general object-detection method, it can be demonstrated that the proposed EFNet is a promising method that has a strong ability to perform the object detection of remote sensing images. The EFNet is much better than FoveaBox and is superior to most domain algorithms of remote sensing.
The PR curves of the comparative methods are separately shown in Figure 10, Figure 11 and Figure 12. Only one representative category was selected from each dataset. These curves reveal that the AP performance of a single category could be significantly different from the AP performance of the whole dataset. That is to say, the AP scores of one method can be better in some categories but worse in other categories. The DIOR and HRRSD are multi-category datasets, so the detailed APs of different categories by EFNet on DIOR and HRRSD are summarized in Table 6 and Table 7. On the DIOR, the APs of different categories are diverse. The categories of airplane, tennis court, baseball field, and chimney have comparatively higher APs scores above 0.600, while those of dam, bridge, harbor, and train station have comparatively lower APs scores, below 0.200. However, the distributions of APs on HRRSD are better than DIOR. The comparatively higher APs scores on HRRSD are achieved by airplane, ground track field, storage tank, and tennis court, and all of the APs are above 0.700. Correspondingly, the comparatively higher APs scores on HRRSD belong to the categories of bridge, parking lot, T junction, and basketball court. In addition, we selected one category for each dataset to show the PR curves as the different IoUs between the predicted boxes and the ground-truths, respectively, in Figure 13, Figure 14 and Figure 15. These PR curves are calculated by the EFNet. The category basketball court is selected for the DIOR, while the category bridge is selected for the HRRSD. The AIBD contains only a single category building, so the PR curves on AIBD are based on building instances.

5. Discussion

In this section, we will discuss some concerned questions and the future improvements. From the experimental results above, we can find that the proposed framework can be well-used for both multi-category datasets and a single category dataset. The results also reveal that the vision attention mechanism with two foveae modules is beneficial to object detection and can promote the development of the interpretation of the remote sensing observation images.

5.1. Effects of the Data Complexity

From the experiment results, we can find that the comparatively higher APs scores are usually obtained by the instances in which apparent shapes are close to their ground-truths. In contrast, the instances that have large ratios of length to width usually receive lower APs scores. The bounding boxes of the instances with large ratios of length to width contain much background of large areas, which reduces the feature discrimination of the objects. On the whole, the quantitative results on HRRSD are the highest among the three testing datasets, while the lowest is DIOR. More categories in DIOR can make the processing much more difficult than with the HRRSD and AIBD. Although the AIBD has only one class, the instance count and the within-class scatter are large. Therefore, the quantitative results on AIBD are lower than HRRSD.

5.2. Effects of the Data Annotations

The annotations of testing datasets are not accurate enough, which may cause some problems in quantitative scores. For example, the top instance with the red rectangle in Figure 7 is misdetected as a bridge, while the label of ground-truth shows it is an overpass. In fact, it is more reasonable to assign multiple labels to this object instance because one overpass can also be regarded as a bridge at another time. Therefore, these shortcomings caused by the manual annotation strategy should be noted.

5.3. Limitations and Future Improvements

The experimental results demonstrate that the proposed method is effective in remote sensing object detection. However, the proposed method fails to surpass the general Faster R-CNN [44] in the quantitative comparison. One of the biggest limitations of the proposed method is the lack of optimal quantitative scores. In addition, the internal interpretability problem between the FCF and the RCF is another issue, which is common in the field of deep learning. Moreover, the Faster R-CNN is a two-stage method, and the calculation cost is relatively high. Therefore, how to improve the internal network interpretability and the ability of real-time processing of the proposed framework are two research topics in the future.

6. Conclusions

In this paper, we propose an eagle-eye fovea network (EFNet) for remote sensing object detection. This is inspired by the vision attention mechanism and the cascade attention mechanism of eagle eyes. The core modules of the EFNet are the front central fovea (FCF) and the rear central fovea (RCF). These two foveae have complementary characteristics. The FCF mainly aims to learn the candidate object knowledge based on the channel attention and the spatial attention, while the RCF mainly aims to predict the refined objects with two subnetworks without anchors. The results reveal that the vision attention mechanism with two foveae modules is beneficial to object detection. The EFNet can be used for both multi-category datasets and a single category dataset, which is qualitatively and quantitatively demonstrated by the experimental results on the three datasets.

Author Contributions

Conceptualization, K.L., J.H. and X.L.; methodology, K.L., J.H. and X.L.; software, K.L. and J.H.; validation, J.H., K.L. and X.L.; formal analysis, J.H.; investigation, K.L.; resources, K.L.; data curation, J.H.; writing—original draft preparation, K.L.; writing—review and editing, J.H.; visualization, K.L.; supervision, J.H.; project administration, K.L.; funding acquisition, X.L. All authors have read and agreed to the published version of the manuscript.

Funding

This work was supported by the National Key Research and Development Program of China under Grant 2018AAA0102201, and the National Natural Science Foundation of China (No. 61871470), and also the Basic Research Strengthening Program of China under Grant 2020-JCJQ-ZD-015-00-02.

Institutional Review Board Statement

Not applicable.

Informed Consent Statement

Not applicable.

Data Availability Statement

Not applicable.

Conflicts of Interest

The authors declare no conflict of interest.

References

  1. Zhao, Y.; Ren, H.; Cao, D. The Research of Building Earthquake Damage Object-Oriented Change Detection Based on Ensemble Classifier with Remote Sensing Image. In Proceedings of the IEEE International Geoscience and Remote Sensing Symposium, IGARSS, Valencia, Spain, 22–27 July 2018; pp. 4950–4953. [Google Scholar]
  2. Li, X.; Zhang, X.; Huang, W.; Wang, Q. Truncation Cross Entropy Loss for Remote Sensing Image Captioning. IEEE Trans. Geosci. Remote Sens. 2021, 59, 5246–5257. [Google Scholar] [CrossRef]
  3. Zhao, Z.Z.; Wang, H.T.; Wang, C.; Wang, S.T.; Li, Y.Q. Fusing LiDAR Data and Aerial Imagery for Building Detection Using a Vegetation-Mask-Based Connected Filter. IEEE Geosci. Remote Sens. Lett. 2019, 16, 1299–1303. [Google Scholar] [CrossRef]
  4. Antelo, J.; Ambrosio, G.; Gonzalez, J.; Galindo, C. Ship Detection and Recognitionin High-resolution Satellite Images. In Proceedings of the IEEE International Geoscience and Remote Sensing Symposium, IGARSS, University of Cape Town, Cape Town, South Africa, 12–17 July 2009; pp. 514–517. [Google Scholar]
  5. Harvey, N.R.; Porter, R.B.; Theiler, J. Ship detection in satellite imagery using rank-order grayscale hit-or-miss transforms. In Proceedings of the Visual Information Processing XIX, Orlando, FL, USA, 6–7 April 2010; Volume 7701, p. 770102. [Google Scholar]
  6. Xu, J.; Fu, K.; Sun, X. An Invariant Generalized Hough Transform Based Method of Inshore Ships Detection. In Proceedings of the International Symposium on Image and Data Fusion, Tengchong, China, 9–11 August 2011; pp. 1–4. [Google Scholar]
  7. Liu, G.; Sun, X.; Fu, K.; Wang, H. Aircraft Recognition in High-Resolution Satellite Images Using Coarse-to-Fine Shape Prior. IEEE Geosci. Remote Sens. Lett. 2013, 10, 573–577. [Google Scholar] [CrossRef]
  8. Yao, X.; Han, J.; Guo, L.; Bu, S.; Liu, Z. A coarse-to-fine model for airport detection from remote sensing images using target-oriented visual saliency and CRF. Neurocomputing 2015, 164, 162–172. [Google Scholar] [CrossRef]
  9. Capizzi, G.; Sciuto, G.L.; Wozniak, M.; Damasevicius, R. A Clustering Based System for Automated Oil Spill Detection by Satellite Remote Sensing. In Proceedings of the Artificial Intelligence and Soft Computing—15th International Conference, ICAISC, Zakopane, Poland, 12–16 June 2016; pp. 613–623. [Google Scholar]
  10. Li, X.; Chen, M.; Nie, F.; Wang, Q. Locality Adaptive Discriminant Analysis. In Proceedings of the Twenty-Sixth International Joint Conference on Artificial Intelligence, IJCAI 2017, Melbourne, Australia, 19–25 August 2017; pp. 2201–2207. [Google Scholar]
  11. Li, X.; Zhang, H.; Wang, R.; Nie, F. Multiview Clustering: A Scalable and Parameter-Free Bipartite Graph Fusion Method. IEEE Trans. Pattern Anal. Mach. Intell. 2022, 44, 330–344. [Google Scholar] [CrossRef] [PubMed]
  12. Zhang, Z.; Warrell, J.; Torr, P.B.T. Proposal generation for object detection using cascaded ranking SVMs. In Proceedings of the IEEE Computer Society Conference on Computer Vision and Pattern Recognition, Colorado Springs, CO, USA, 20–25 June 2011; pp. 1497–1504. [Google Scholar]
  13. Uijlings, J.R.R.; van de Sande, K.E.A.; Gevers, T.; Smeulders, A.W.M. Selective Search for Object Recognition. Int. J. Comput. Vis. 2013, 104, 154–171. [Google Scholar] [CrossRef] [Green Version]
  14. Liu, Z.; Wang, H.; Weng, L.; Yang, Y. Ship Rotated Bounding Box Space for Ship Extraction From High-Resolution Optical Satellite Images With Complex Backgrounds. IEEE Geosci. Remote Sens. Lett. 2016, 13, 1074–1078. [Google Scholar] [CrossRef]
  15. Morillas, J.R.A.; Garcia, I.C.; Zölzer, U. Ship detection based on SVM using color and texture features. In Proceedings of the IEEE International Conference on Intelligent Computer Communication and Processing, ICCP, Cluj-Napoca, Romania, 3–5 September 2015; pp. 343–350. [Google Scholar]
  16. Konstantinidis, D.; Stathaki, T.; Argyriou, V.; Grammalidis, N. Building Detection Using Enhanced HOG-LBP Features and Region Refinement Processes. IEEE J. Sel. Top. Appl. Earth Obs. Remote. Sens. 2017, 10, 888–905. [Google Scholar] [CrossRef] [Green Version]
  17. Brekke, C.; Solberg, A. Oil spill detection by satellite remote sensing. Remote Sens. Environ. 2005, 95, 1–13. [Google Scholar] [CrossRef]
  18. Sun, H.; Sun, X.; Wang, H.; Li, Y.; Li, X. Automatic Target Detection in High-Resolution Remote Sensing Images Using Spatial Sparse Coding Bag-of-Words Model. IEEE Geosci. Remote Sens. Lett. 2012, 9, 109–113. [Google Scholar] [CrossRef]
  19. Cheng, M.; Zhang, Z.; Lin, W.; Torr, P.H.S. BING: Binarized Normed Gradients for Objectness Estimation at 300fps. In Proceedings of the IEEE Conference on Computer Vision and Pattern Recognition, CVPR, Columbus, OH, USA, 23–28 June 2014; pp. 3286–3293. [Google Scholar]
  20. Tong, S.; Kang, S.; Shi, B.; Chen, J. A ship target automatic recognition method for sub-meter remote sensing images. In Proceedings of the International Geoscience and Remote Sensing Symposium, IGARSS, Guangzhou, China, 4–6 July 2016; pp. 1258–1261. [Google Scholar]
  21. Shi, Z.; Yu, X.; Jiang, Z.; Bo, L. Ship Detection in High-Resolution Optical Imagery Based on Anomaly Detector and Local Shape Feature. IEEE Trans. Geosci. Remote Sens. 2014, 52, 4511–4523. [Google Scholar]
  22. Zhang, W.; Sun, X.; Fu, K.; Wang, C.; Wang, H. Object Detection in High-Resolution Remote Sensing Images Using Rotation Invariant Parts Based Model. IEEE Geosci. Remote Sens. Lett. 2014, 11, 74–78. [Google Scholar] [CrossRef]
  23. Liu, G.; Zhang, Y.; Zheng, X.; Sun, X.; Fu, K.; Wang, H. A New Method on Inshore Ship Detection in High-Resolution Satellite Images Using Shape and Context Information. IEEE Geosci. Remote Sens. Lett. 2014, 11, 617–621. [Google Scholar] [CrossRef]
  24. Gu, W.; Lv, Z.; Hao, M. Change detection method for remote sensing images based on an improved Markov random field. Multim. Tools Appl. 2017, 76, 17719–17734. [Google Scholar] [CrossRef]
  25. Li, X.; Zhang, X.; Yuan, Y.; Dong, Y. Adaptive Relationship Preserving Sparse NMF for Hyperspectral Unmixing. IEEE Trans. Geosci. Remote Sens. 2022, 60, 1–16. [Google Scholar] [CrossRef]
  26. Fu, K.; Chen, Z.; Zhang, Y.; Sun, X. Enhanced Feature Representation in Detection for Optical Remote Sensing Images. Remote Sens. 2019, 11, 2095. [Google Scholar] [CrossRef] [Green Version]
  27. Ding, K.; He, G.; Gu, H.; Zhong, Z.; Xiang, S.; Pan, C. Train in Dense and Test in Sparse: A Method for Sparse Object Detection in Aerial Images. IEEE Geosci. Remote Sens. Lett. 2022, 19, 1–5. [Google Scholar] [CrossRef]
  28. Chen, Y.; Liu, Q.; Wang, T.; Wang, B.; Meng, X. Rotation-Invariant and Relation-Aware Cross-Domain Adaptation Object Detection Network for Optical Remote Sensing Images. Remote Sens. 2021, 13, 4386. [Google Scholar] [CrossRef]
  29. Yuan, Y.; Zhang, Y. OLCN: An Optimized Low Coupling Network for Small Objects Detection. IEEE Geosci. Remote Sens. Lett. 2021, 19. [Google Scholar] [CrossRef]
  30. Cheng, G.; Zhou, P.; Han, J. Learning Rotation-Invariant Convolutional Neural Networks for Object Detection in VHR Optical Remote Sensing Images. IEEE Trans. Geosci. Remote Sens. 2016, 54, 7405–7415. [Google Scholar] [CrossRef]
  31. Cheng, G.; Han, J.; Zhou, P.; Xu, D. Learning Rotation-Invariant and Fisher Discriminative Convolutional Neural Networks for Object Detection. IEEE Trans. Image Process. 2019, 28, 265–278. [Google Scholar] [CrossRef] [PubMed]
  32. Wu, X.; Hong, D.; Tian, J.; Chanussot, J.; Li, W.; Tao, R. ORSIm Detector: A Novel Object Detection Framework in Optical Remote Sensing Imagery Using Spatial-Frequency Channel Features. IEEE Trans. Geosci. Remote Sens. 2019, 57, 5146–5158. [Google Scholar] [CrossRef] [Green Version]
  33. Courtrai, L.; Pham, M.T.; Lefèvre, S. Small Object Detection in Remote Sensing Images Based on Super-Resolution with Auxiliary Generative Adversarial Networks. Remote Sens. 2020, 12, 3152. [Google Scholar] [CrossRef]
  34. Bashir, S.M.A.; Wang, Y. Small Object Detection in Remote Sensing Images with Residual Feature Aggregation-Based Super-Resolution and Object Detector Network. Remote Sens. 2021, 13, 1854. [Google Scholar] [CrossRef]
  35. Zhang, W.; Wang, S.; Thachan, S.; Chen, J.; Qian, Y. Deconv R-CNN for Small Object Detection on Remote Sensing Images. In Proceedings of the IEEE International Geoscience and Remote Sensing Symposium, IGARSS, Valencia, Spain, 22–27 July 2018; pp. 2483–2486. [Google Scholar]
  36. Liu, W.; Ma, L.; Wang, J.; Chen, H. Detection of Multiclass Objects in Optical Remote Sensing Images. IEEE Geosci. Remote Sens. Lett. 2019, 16, 791–795. [Google Scholar] [CrossRef]
  37. Wang, P.; Sun, X.; Diao, W.; Fu, K. FMSSD: Feature-Merged Single-Shot Detection for Multiscale Objects in Large-Scale Remote Sensing Imagery. IEEE Trans. Geosci. Remote Sens. 2020, 58, 3377–3390. [Google Scholar] [CrossRef]
  38. Yang, X.; Yan, J.; Feng, Z.; He, T. R3Det: Refined Single-Stage Detector with Feature Refinement for Rotating Object. In Proceedings of the Thirty-Fifth AAAI Conference on Artificial Intelligence, AAAI, Thirty-Third Conference on Innovative Applications of Artificial Intelligence, IAAI, The Eleventh Symposium on Educational Advances in Artificial Intelligence, EAAI, Virtual Event, 2–9 February 2021; pp. 3163–3171. [Google Scholar]
  39. Han, W.; Kuerban, A.; Yang, Y.; Huang, Z.; Liu, B.; Gao, J. Multi-Vision Network for Accurate and Real-Time Small Object Detection in Optical Remote Sensing Images. IEEE Geosci. Remote Sens. Lett. 2022, 19, 1–5. [Google Scholar] [CrossRef]
  40. Zhang, X.; Zhu, K.; Chen, G.; Tan, X.; Zhang, L.; Dai, F.; Liao, P.; Gong, Y. Geospatial Object Detection on High Resolution Remote Sensing Imagery Based on Double Multi-Scale Feature Pyramid Network. Remote Sens. 2019, 11, 755. [Google Scholar] [CrossRef] [Green Version]
  41. Zhang, S.; He, G.; Chen, H.B.; Jing, N.; Wang, Q. Scale Adaptive Proposal Network for Object Detection in Remote Sensing Images. IEEE Geosci. Remote Sens. Lett. 2019, 16, 864–868. [Google Scholar] [CrossRef]
  42. Wang, G.; Zhuang, Y.; Chen, H.; Liu, X.; Zhang, T.; Li, L.; Dong, S.; Sang, Q. FSoD-Net: Full-Scale Object Detection From Optical Remote Sensing Imagery. IEEE Trans. Geosci. Remote Sens. 2022, 60, 1–18. [Google Scholar] [CrossRef]
  43. Teng, Z.; Duan, Y.; Liu, Y.; Zhang, B.; Fan, J. Global to Local: Clip-LSTM-Based Object Detection from Remote Sensing Images. IEEE Trans. Geosci. Remote Sens. 2022, 60, 1–13. [Google Scholar] [CrossRef]
  44. Ren, S.; He, K.; Girshick, R.; Sun, J. Faster R-CNN: Towards Real-Time Object Detection with Region Proposal Networks. In Proceedings of the Advances in Neural Information Processing Systems, NIPS, Montreal, QC, Canada, 7–12 December 2015; pp. 91–99. [Google Scholar]
  45. Wang, J.; Ding, J.; Guo, H.; Cheng, W.; Pan, T.; Yang, W. Mask OBB: A Semantic Attention-Based Mask Oriented Bounding Box Representation for Multi-Category Object Detection in Aerial Images. Remote Sens. 2019, 11, 2930. [Google Scholar] [CrossRef] [Green Version]
  46. Zhu, Y.; Du, J.; Wu, X. Adaptive Period Embedding for Representing Oriented Objects in Aerial Images. IEEE Trans. Geosci. Remote Sens. 2020, 58, 7247–7257. [Google Scholar] [CrossRef] [Green Version]
  47. Zhang, Y.; Zheng, X.; Yuan, Y.; Lu, X. Attribute-Cooperated Convolutional Neural Network for Remote Sensing Image Classification. IEEE Trans. Geosci. Remote Sens. 2020, 58, 8358–8371. [Google Scholar] [CrossRef]
  48. Xu, Y.; Fu, M.; Wang, Q.; Wang, Y.; Chen, K.; Xia, G.S.; Bai, X. Gliding Vertex on the Horizontal Bounding Box for Multi-Oriented Object Detection. IEEE Trans. Pattern Anal. Mach. Intell. 2021, 43, 1452–1459. [Google Scholar] [CrossRef] [PubMed] [Green Version]
  49. Chen, X.; Ma, L.; Du, Q. Oriented Object Detection by Searching Corner Points in Remote Sensing Imagery. IEEE Geosci. Remote Sens. Lett. 2022, 19, 1–5. [Google Scholar] [CrossRef]
  50. Al-Najjar, H.A.H.; Kalantar, B.; Pradhan, B.; Saeidi, V.; Halin, A.A.; Ueda, N.; Mansor, S. Land Cover Classification from fused DSM and UAV Images Using Convolutional Neural Networks. Remote Sens. 2019, 11, 1461. [Google Scholar] [CrossRef] [Green Version]
  51. Zhang, J.; Xing, M.; Xie, Y. FEC: A Feature Fusion Framework for SAR Target Recognition Based on Electromagnetic Scattering Features and Deep CNN Features. IEEE Trans. Geosci. Remote Sens. 2020, 59, 2174–2187. [Google Scholar] [CrossRef]
  52. Wang, Q.; Liu, S.; Chanussot, J.; Li, X. Scene Classification With Recurrent Attention of VHR Remote Sensing Images. IEEE Trans. Geosci. Remote Sens. 2019, 57, 1155–1167. [Google Scholar] [CrossRef]
  53. Huang, Z.; Chen, H.X.; Liu, B.Y.; Wang, Z. Semantic-Guided Attention Refinement Network for Salient Object Detection in Optical Remote Sensing Images. Remote Sens. 2021, 13, 2163. [Google Scholar] [CrossRef]
  54. Dong, Y.; Chen, F.; Han, S.; Liu, H. Ship Object Detection of Remote Sensing Image Based on Visual Attention. Remote Sens. 2021, 13, 3192. [Google Scholar] [CrossRef]
  55. Song, Z.; Sui, H.; Wang, Y. Automatic ship detection for optical satellite images based on visual attention model and LBP. In Proceedings of the IEEE Workshop on Electronics, Computer and Applications, Ottawa, ON, Canada, 8–9 May 2014; pp. 722–725. [Google Scholar]
  56. Woo, S.; Park, J.; Lee, J.; Kweon, I.S. CBAM: Convolutional Block Attention Module. In Proceedings of the 15th European Conference Computer Vision, ECCV, Munich, Germany, 8–14 September 2018; Volume 11211, pp. 3–19. [Google Scholar]
  57. Wang, C.; Bai, X.; Wang, S.; Zhou, J.; Ren, P. Multiscale visual attention networks for object detection in VHR remote sensing images. IEEE Geosci. Remote Sens. Lett. 2019, 16, 310–314. [Google Scholar] [CrossRef]
  58. Yang, X.; Yang, J.; Yan, J.; Zhang, Y.; Zhang, T.; Guo, Z.; Sun, X.; Fu, K. SCRDet: Towards More Robust Detection for Small, Cluttered and Rotated Objects. In Proceedings of the IEEE/CVF International Conference on Computer Vision, ICCV, Seoul, Korea, 27 October–2 November 2019; pp. 8231–8240. [Google Scholar]
  59. Sun, P.; Chen, G.; Shang, Y. Adaptive Saliency Biased Loss for Object Detection in Aerial Images. IEEE Trans. Geosci. Remote Sens. 2020, 58, 7154–7165. [Google Scholar] [CrossRef]
  60. Yang, X.; Yan, J.; Yang, X.; Tang, J.; Liao, W.; He, T. SCRDet++: Detecting Small, Cluttered and Rotated Objects via Instance-Level Feature Denoising and Rotation Loss Smoothing. arXiv 2020, arXiv:2004.13316. [Google Scholar]
  61. Liu, K.; Huang, J.; Xu, M.; Perc, M.; Li, X. Density saliency for clustered building detection and population capacity estimation. Neurocomputing 2021, 458, 127–140. [Google Scholar] [CrossRef]
  62. Zhao, G.; Duan, H. Progresses in biological eagle-eye vision technology. Zhongguo Kexue Jishu Kexue 2017, 47, 514–523. [Google Scholar] [CrossRef]
  63. Tucker, V.A. The Deep Fovea, Sideways Vision and Spiral Flight Paths in Raptors. J. Exp. Biol. 2000, 203, 3745–3754. [Google Scholar] [CrossRef] [PubMed]
  64. Gaffney, M.F.; Hodos, W. The visual acuity and refractive state of the American kestrel (Falco sparverius). Vis. Res. 2003, 43, 2053–2059. [Google Scholar] [CrossRef] [Green Version]
  65. Li, X.; Chen, M.; Nie, F.; Wang, Q. A Multiview-Based Parameter Free Framework for Group Detection. In Proceedings of the Conference on Artificial Intelligence, Melbourne, Australia, 19–25 August 2017; pp. 4147–4153. [Google Scholar]
  66. Bettega, C.; Campioni, L.; María, D.M.D.; Louren?O, R.; Penteriani, V. Brightness Features of Visual Signaling Traits in Young and Adult Eurasian Eagle-Owls. J. Raptor Res. 2013, 47, 197–207. [Google Scholar] [CrossRef] [Green Version]
  67. Potier, S.; Bonadonna, F.; Kelber, A.; Duriez, O. Visual acuity in an opportunistic raptor, the chimango caracara (Milvago chimango). Physiol. Behav. 2016, 157, 125–128. [Google Scholar] [CrossRef] [PubMed]
  68. Guzmán-Pando, A.; Chacon Murguia, M.I. DeepFoveaNet: Deep Fovea Eagle-Eye Bioinspired Model to Detect Moving Objects. IEEE Trans. Image Process. 2021, 30, 7090–7100. [Google Scholar] [CrossRef] [PubMed]
  69. He, K.; Zhang, X.; Ren, S.; Sun, J. Deep Residual Learning for Image Recognition. In Proceedings of the IEEE Conference on Computer Vision and Pattern Recognition, CVPR, Las Vegas, NV, USA, 27–30 June 2016; pp. 770–778. [Google Scholar]
  70. Kong, T.; Sun, F.; Liu, H.; Jiang, Y.; Shi, J. FoveaBox: Beyond Anchor-based Object Detector. arXiv 2019, arXiv:1904.03797. [Google Scholar]
  71. Li, K.; Wan, G.; Cheng, G.; Meng, L.; Han, J. Object Detection in Optical Remote Sensing Images: A Survey and A New Benchmark. arXiv 2019, arXiv:1909.00133. [Google Scholar] [CrossRef]
  72. Zhang, Y.; Yuan, Y.; Feng, Y.; Lu, X. Hierarchical and Robust Convolutional Neural Network for Very High-Resolution Remote Sensing Object Detection. IEEE Trans. Geosci. Remote Sens. 2019, 57, 5535–5548. [Google Scholar] [CrossRef]
  73. Liu, K.; Jiang, Z.; Xu, M.; Perc, M.; Li, X. Tilt Correction Toward Building Detection of Remote Sensing Images. IEEE J. Sel. Top. Appl. Earth Obs. Remote Sens. 2021, 14, 5854–5866. [Google Scholar] [CrossRef]
  74. Liu, W.; Anguelov, D.; Erhan, D.; Szegedy, C.; Reed, S.E.; Fu, C.Y.; Berg, A.C. SSD: Single Shot MultiBox Detector. In Proceedings of the European Conference Computer Vision, ECCV, Amsterdam, The Netherlands, 11–14 October 2016; Volume 9905, pp. 21–37. [Google Scholar]
  75. Redmon, J.; Divvala, S.K.; Girshick, R.B.; Farhadi, A. You Only Look Once: Unified, Real-Time Object Detection. In Proceedings of the IEEE Conference on Computer Vision and Pattern Recognition, CVPR, Las Vegas, NV, USA, 27–30 June 2016; pp. 779–788. [Google Scholar]
  76. Lin, T.Y.; Goyal, P.; Girshick, R.; He, K.; Dollár, P. Focal Loss for Dense Object Detection. IEEE Trans. Pattern Anal. Mach. Intell. 2020, 42, 318–327. [Google Scholar] [CrossRef] [Green Version]
  77. Li, K.; Cheng, G.; Bu, S.; You, X. Rotation-Insensitive and Context-Augmented Object Detection in Remote Sensing Images. IEEE Trans. Geosci. Remote Sens. 2018, 56, 2337–2348. [Google Scholar] [CrossRef]
  78. Law, H.; Deng, J. CornerNet: Detecting Objects as Paired Keypoints. In Proceedings of the European Conference Computer Vision, ECCV, Munich, Germany, 8–14 September 2018; pp. 765–781. [Google Scholar]
  79. Dong, Z.; Li, G.; Liao, Y.; Wang, F.; Ren, P.; Qian, C. CentripetalNet: Pursuing High-Quality Keypoint Pairs for Object Detection. In Proceedings of the IEEE/CVF Conference on Computer Vision and Pattern Recognition, CVPR, Seattle, WA, USA, 14–19 June 2020; pp. 10516–10525. [Google Scholar]
Figure 1. The structure of eagle eye with two foveae [62].
Remotesensing 14 01743 g001
Figure 2. The architecture of the CBAM.
Remotesensing 14 01743 g002
Figure 3. The architecture of the proposed methodology. The proposed framework mainly contains two attention modules: front central fovea (FCF) and rear central fovea (RCF). The FCF and RCF are complementary for object detection.
Remotesensing 14 01743 g003
Figure 4. This diagram shows the position where the CBAM module is integrated with the ResBlock [69]. The CBAM is applied to the convolution output of each block.
Remotesensing 14 01743 g004
Figure 5. Two branch networks of the object prediction network.
Remotesensing 14 01743 g005
Figure 6. Examples of the three experimental datasets. The examples from top row to bottom row, respectively, belong to the DIOR [71], HRRSD [72], and AIBD [73].
Remotesensing 14 01743 g006
Figure 7. Qualitative examples on DIOR by EFNet. The TPs, FPs, and FNs are indicated by green, red, and yellow boxes, respectively.
Remotesensing 14 01743 g007
Figure 8. Qualitative examples on HRRSD by EFNet. The TPs, FPs, and FNs are indicated by green, red, and yellow boxes, respectively.
Remotesensing 14 01743 g008
Figure 9. Qualitative examples on AIBD by EFNet. The TPs, FPs, and FNs are indicated by green, red, and yellow boxes, respectively.
Remotesensing 14 01743 g009
Figure 10. The PR curves of category basketball court for comparative methods on DIOR. These curves are the different IoUs between predicted boxes and ground-truths.
Remotesensing 14 01743 g010
Figure 11. The PR curves of category bridge for comparative methods on HRRSD. These curves are the different IoUs between predicted boxes and ground-truths.
Remotesensing 14 01743 g011
Figure 12. The PR curves of category building for comparative methods on AIBD. The AIBD contains only one building category. These curves are the different IoUs between predicted boxes and ground-truths.
Remotesensing 14 01743 g012
Figure 13. The PR curves of category basketball court on DIOR. The basketball court is one of the categories of DIOR. These curves are achieved by the EFNet as the different IoUs between the predicted boxes and the ground-truths.
Remotesensing 14 01743 g013
Figure 14. The PR curves of category bridge on HRRSD. The bridge is one of the categories of HRRSD. These curves are achieved by the EFNet as the different IoUs between the predicted boxes and the ground-truths.
Remotesensing 14 01743 g014
Figure 15. The PR curves of category building on AIBD. The AIBD contains only one category: building. These curves are achieved by the EFNet as the different IoUs between the predicted boxes and the ground-truths.
Remotesensing 14 01743 g015
Table 1. The explanations of the COCO metrics.
A P :AP at IoU = 0.50:0.05:0.95 (average over IoU thresholds).
A P 50 :AP at IoU = 0.50 (equally to PASCAL VOC metric).
A P 75 :AP at IoU = 0.75 (much strict metric).
A P s :AP for small objects which areas are smaller than 32 2 .
A P m :AP for medium objects which areas are between 32 2 and 96 2 .
A P l :AP for large objects which areas are bigger than 96 2 .
Table 2. The hyper-parameter setting of the comparative methods.
MethodLearning RateDecayMomentumClassification LossBounding Box LossOptimizer
Faster-RCNN [44]0.020.00010.9CrossEntropyL1lossSGD
YOLOv3-608 [75]0.0010.00050.9CrossEntropyMSELossSGD
SSD-512 [74]0.0020.00050.9CrossEntropySmoothL1SGD
RetinaNet [76]0.010.00010.9FocalLossL1LossSGD
FoveaBox [70]0.010.00010.9FocalLossSmoothL1SGD
EFNet0.010.00010.9FocalLossSmoothL1SGD
Table 3. Object-detection results of comparative methods on DIOR.
MethodBackbone AP AP 50 AP 75 AP s AP m AP l
RICAOD [77]VGG16/0.509////
RIFD-CNN [31]VGG16/0.561////
Faster R-CNN [44]Resnet500.4350.6920.4580.0710.2680.544
SSD-512 [74]VGG160.5090.7690.5550.0660.3260.622
YOLOv3-608 [75]Darknet530.3390.6670.3000.0460.2260.410
RetinaNet [76]Resnet500.3320.5550.3390.0250.2080.427
FoveaBox [70]Resnet500.3090.5330.3130.0230.2050.379
EFNetResnet500.3590.6040.3650.0360.2390.442
Table 4. Object-detection results of comparative methods on HRRSD.
MethodBackbone AP AP 50 AP 75 AP s AP m AP l
RICNN-finetuning [30]AlexNet/0.482////
HRCNN-regression [72]AlexNet/0.514////
Faster R-CNN [44]Resnet500.6320.9100.7360.3570.5500.612
SSD-512 [74]VGG160.5270.8730.5740.0950.4210.517
YOLOv3-608 [75]Darknet530.5100.8900.5290.0800.4030.504
RetinaNet [76]Resnet500.5960.8930.6770.1090.4920.574
FoveaBox [70]Resnet500.6180.9040.7060.1840.5180.587
EFNetResnet500.6220.9070.7170.1240.5350.602
Table 5. Object-detection results of comparative methods on AIBD.
MethodBackbone AP AP 50 AP 75 AP s AP m AP l
Faster R-CNN [44]Resnet500.5200.8690.5660.3540.5560.549
SSD-512 [74]VGG160.4660.8320.4820.3480.5040.517
YOLOv3-608 [75]Darknet530.4180.8140.3860.3140.4540.421
RetinaNet [76]Resnet500.4480.8140.4410.3230.4910.484
CornerNet [78]Hourglass1040.3400.5560.3640.1490.4570.328
CentripetalNet [79]Hourglass1040.4790.8180.5040.3600.5150.553
FRCNN TC [73]Resnet500.5150.8610.5480.3830.5450.602
FoveaBox [70]Resnet500.5130.8630.5480.3950.5510.537
EFNetResnet500.5170.8640.5560.4000.5550.540
Table 6. The APs of different categories by EFNet on the dataset DIOR.
CategoryAPCategoryAPCategoryAP
airplane0.646airport0.217baseball field0.744
basketball court0.524bridge0.088chimney0.659
dam0.160Expressway-Service-area0.247ship0.330
golffield0.281groundtrackfield0.393harbor0.084
overpass0.203Expressway-toll-station0.347stadium0.235
storagetank0.592tenniscourt0.737trainstation0.077
vehicle0.332windmill0.280
Table 7. The APs of different categories by EFNet on the dataset HRRSD.
CategoryAPCategoryAPCategoryAP
bridge0.493tennis court0.739T junction0.476
airplane0.701parking lot0.399harbor0.679
ground track field0.786vehicle0.654basketball court0.431
storage tank0.807crossroad0.606baseball diamond0.630
ship0.682
Publisher’s Note: MDPI stays neutral with regard to jurisdictional claims in published maps and institutional affiliations.

