Article

Predicting Sugarcane Harvest Date and Productivity with a Drone-Borne Tri-Band SAR

1
School of Electrical and Computer Engineering, University of Campinas—UNICAMP, Campinas 13083-852, Brazil
2
School of Agricultural Engineering, University of Campinas—UNICAMP, Campinas 13083-875, Brazil
3
Directed Energy Research Centre, Technology Innovation Institute, Abu Dhabi P.O. Box 9639, United Arab Emirates
4
National Institute for Space Research—INPE, São José dos Campos 12227-010, Brazil
5
Radaz Indústria e Comércio de Produtos Eletrônicos Ltda., São José dos Campos 12244-000, Brazil
6
São Martinho SA, Sao Paulo 14850-000, Brazil
*
Author to whom correspondence should be addressed.
Remote Sens. 2022, 14(7), 1734; https://doi.org/10.3390/rs14071734
Submission received: 27 January 2022 / Revised: 1 March 2022 / Accepted: 3 March 2022 / Published: 4 April 2022

Abstract

:
This article presents a novel method for predicting the sugarcane harvesting date and productivity using a three-band imaging radar. Taking advantage of working with a multi-band radar, this system was employed to estimate the above-ground biomass (AGB), achieving a root-mean-square error (RMSE) of 2 kg m−2 in sugarcane crops, which is an unprecedented result compared with other works based on the Synthetic Aperture Radar (SAR) system. By correlating the field measurements of the ripening index (RI) with the AGB measurements by radar, an indirect estimate of the RI by the radar is obtained. It is observed that the AGB reaches its maximum approximately 280 days after planting and the maximum RI, which defines the harvesting date, approximately 360 days after planting for the species IACSP97-4039. Starting from an AGB map collected by the radar, it is then possible to predict the harvesting date and the corresponding productivity with competitive average errors of 8 days and 10.7%, respectively, with three months in advance, whereas typical methods employed on a test site achieve an average error of 30 days with three months in advance. To the best of our knowledge, it is the first time that a multi-band radar is employed for productivity prediction in sugarcane crops.

Graphical Abstract

1. Introduction

Agriculture plays an essential role in economic development, so efficient management and monitoring of crops are essential to achieving maximum productivity [1]. In particular, sugarcane is an important crop worldwide, especially in Brazil due to its multiple uses such as sugar, ethanol, biodegradable products, energy generation, and food for animal production [2].
The sugarcane harvest in Brazil for the 2020/21 season is estimated at 665.1 million tons [3], making this country the largest producer in the world for two consecutive years. In Brazil, sugarcane production is one of the most important activities in the agricultural sector, which in 2020 reached 4.44% of the total Gross Domestic Product (GDP) [4].
The productivity estimation provides information from which sugarcane companies can optimize harvesting schedules and agricultural planning for sugarcane crops. Sugarcane productivity depends on different factors; among those are the interactions between climate variations and their phenological phases. For instance, water stress causes a reduction in carbon dioxide assimilation rates, leaf area size, and growth rate, leading to a decrease in the final stalk height of sugarcane [5], so periodic monitoring is crucial for proper crop management. Besides, the Ripening Index (RI), which is based on the metabolization of soluble solids and is strongly correlated with the optimal harvesting date in sugarcane crops [6], intense fieldwork based on destructive analysis is also necessary for a correct determination. Biometric parameters and productivity monitoring through traditional techniques based on sampling and destructive analysis involves extensive fieldwork, which is costly and time-consuming, so remote sensing plays an important role as an emerging alternative. One of the disadvantages of having an adequate description of biometric parameters through techniques based on sampling and destructive analysis is related to the number of necessary samples that must be obtained, which is generally high [7]. Thus, the main advantage of remote sensing methods is the possibility of fast data acquisition from large areas with high spatial resolution.
The first applications of remote sensing were based on optical images. However, in recent years, the application of Synthetic Aperture Radar (SAR) systems in remote sensing have gained importance, providing useful and complementary information to optical sensors [8]. SAR systems have been commonly transported onboard satellites and airplanes, and, in the last decades, large fixed-wing unmanned aerial vehicles (UAV) have also been used for SAR imaging [9,10]. Recently, lightweight multirotor drones (<25 kg) have become very popular, and their ability to carry imaging payloads raised the possibility of using them to transport small SAR systems [11,12,13]. Compared to those carried by satellite or aircraft, drone-borne SAR systems are an economically feasible solution that offers high spatial resolution and a short revisit time, making them useful in novel operations for low altitudes, like city surveillance, local crop monitoring, and buried object detection, among others. A considerable amount of works aiming at the development of drone-borne SAR systems have been proposed, although, in most cases, these are still in the initial testing phases. Dill et al. describe the development of a lightweight multimode ultra-high frequency, ultra-wideband (UHF-UWB) radar module for drone-based operations [14]. The first experiments were carried out under well-controlled conditions using a linear motion axis, demonstrating that the proposed system is a promising alternative for detecting landmines. Deguchi et al. developed a radar system mountable on a multi-copter type drone operating in the Ku band [15]. Data collected with the drone-borne SAR system flying at 30 m height were processed with a frequency-domain azimuth compression algorithm, resulting in SAR images where three corner reflectors were clearly identified. Additionally, Frey and Werner presented processing results computed from repeat-pass SAR data acquired onboard a UAV [16]. They employed a time-domain back-projection algorithm to process the data acquired from an L band SAR system, confirming the feasibility of UAV-borne repeat-pass SAR interferometry and SAR tomography in the L band. Lort et al. [17] presented a fully polarimetric SAR system at X band integrated into a UAV multi-copter platform. This system was used to produce interferograms, in which an autofocus step was necessary due to the flight instabilities. Schartel et al. [18] developed a functional multi-copter-based SAR system in the L band to detect metallic tripwires, achieving promising results for a scenario with light vegetation.
For sugarcane crops, the monitoring of biometric parameters has been previously researched using SAR or optical systems data. Concerning SAR systems, C and L band SAR data for monitoring sugarcane AGB show that the C band backscattering presents a saturation at 35-ton ha−1 and could be useful for a short period [19,20]. In contrast, L band backscattering does not show any evidence of saturation in sugarcane monitoring. Additionally, Lin et al. [21] proposed a method to estimate the sugarcane leaf area index (LAI) using ENVISAT polarimetric data. In other studies, sugarcane height was estimated using C band backscattering information at different polarizations and angles of incidence [22], with good results up to 150 cm in height. Other works are focused on estimating the AGB in different crops such as corn, canola, soybean, and wheat [23,24,25]. Some attempts to estimate AGB for different crop types using different frequency bands found a saturation point dependent on the employed band. The C band has a saturation point typically at 5–7 kg m−2 [26], while the L band presents saturation between 10–15 kg m−2 [27], and other authors suggest a saturation point around 10–30 kg m−2 for the P band [28].
As for optical systems, techniques were developed to map and identify sugarcane crops [29]. In recent years, methods for AGB estimation based on drone-borne systems have been proposed, although most of them work with AGB values of less than 3 kg m−2 and in small coverage areas. Maimaitijiang et al. explored the potential of spectral information derived from RGB images of unmanned aerial systems (UAS) for AGB estimation in soybean crops [30]. Another method for estimating AGB in winter wheat was developed by Yue et al. [31], in which the mapping was performed by both a hyperspectral sensor and an RGB digital camera mounted on a UAV. Sinde-González et al. [32] determined the AGB of three types of forages under differentiated fertilizer treatments using an RGB camera mounted on a UAV. Swayze et al. [33] investigated the influence of flight parameters on the Phantom 4 Pro UAS using different heights, camera angles, and flight patterns to monitor height and trunk diameter applied to forest protection systems using an RGB sensor. Poley et al. synthesized 46 studies from the peer-reviewed literature oriented to AGB estimation using UAS-mounted optical sensors, concluding that AGB estimation with RGB data offers excellent results with higher accuracy than multispectral or hyperspectral data [34]. Methods based on Light Detection and Ranging (LiDAR) systems have also been proposed. Masjedi et al. [35] attempted to estimate the sorghum biomass using information collected by a LiDAR system integrated into a UAV platform. Another work based on a LiDAR system mounted on an aircraft for biomass estimation was presented by Du et al. [36], analyzing common reed crops.
According to the reviewed literature, SAR systems have great potential for biometric parameters estimation in different crops, achieving promising results. In this context, this work develops a different approach for sugarcane AGB estimation and a novel methodology for productivity and harvesting date prediction based on multiband radar data. For this purpose, a multiband drone-borne SAR system was employed for surveying an experimental area at the School of Agricultural Engineering of the University of Campinas (UNICAMP) and a test site located at Iracemápolis, Brazil, carrying out several square survey flights along time. AGB estimation is based on the weighting of backscattering information obtained from different bands of the drone-borne SAR system. This unprecedented multiband approach–combining L, P, and C bands–permits us to overcome the typical saturation problem presented in most previous works and to collect the complete data of crops over time. Additionally, the novel methodology for harvesting date and productivity prediction in sugarcane crops is developed using the data from the test site. This methodology is based on the judicious use of an AGB curve obtained exclusively from the experimental area.
The remainder of this paper is divided as follows: Section 2 presents the proposed model to estimate AGB, the proposed methodology for harvesting date and productivity prediction, a brief description of the experimental and test sites, the methodology used to collect the reference data, the data acquisition plan for the drone-borne SAR system, and the procedures for data processing. Section 3 shows the experimental results, consisting of the validation of the AGB estimation method and the harvesting date and productivity prediction methodology results. Finally, a discussion of the results is presented in Section 4, and the conclusions in Section 5.

2. Materials and Methods

This work presents a harvesting date and productivity prediction methodology for sugarcane crops based on survey campaigns carried out by the drone-borne SAR system. For this procedure, one of the most important aspects is to calculate a representative AGB curve that describes the AGB behavior over time, which, in this case, is estimated from radar data. Regarding the AGB estimation, this is determined by weighting the backscattering information of three frequency bands–L, P, and C–of a drone-borne SAR system to take advantage of the effectiveness of each one in different ranges of AGB values.

2.1. SAR System

The methodology presented here uses backscattering results from a drone-borne SAR system described in [37,38], operating in three bands—P, L, and C—and using four channels: two interferometric C band antennas (VV polarization), one P band antenna, and one L band antenna, the last two in HH polarization. Table 1 presents the main radar acquisition parameters for the three operational bands.
Data collected during the survey flights were processed with a time-domain back-projection algorithm to construct complex-valued SAR images, which represent a measure of the scene reflectivity [39]. Such an algorithm offers advantages over frequency domain algorithms, such as built-in georeferentiation and motion compensation, however, previous knowledge of the time-varying position of the antenna and the three-dimensional position of the mapped terrain or Digital Elevation Model (DEM) is required [38]. The SAR images were radiometrically corrected considering the distance between the platform and the illuminated target, the bidirectional antenna pattern [40], and the number of pulses used to construct the synthetic aperture by the back-projection algorithm. For the SAR images’ absolute calibration, corner reflectors with known theoretical radar cross-section (RCS) were used and located over the illuminated scene. The absolute calibration methodology used in this work is the integral method [41], which uses pixels from the radiometrically corrected SAR images corresponding to the corner reflector and the pixels from the areas adjacent to the reflector.

2.2. Investigation Stage

This section presents the description of an experimental area, the main concepts involved in obtaining the measured and estimated AGB data, and how this information can be related to the productivity prediction are presented.

2.2.1. Experimental Area

The experimental area of 10 × 40 m2 is located at the School of Agricultural Engineering at the University of Campinas (FEAGRI–UNICAMP), at 22°49′12″ S, 47°03′42″ W. Figure 1 shows a sugarcane crop planted in this area. The sugarcane type is IACSP97-4039, which has a nominal cycle of 12 months. Approximately 340 sugarcane plants were planted on 7 July 2019, distributed in seven lines separated by 1.5 m and 0.75 m between plants. Table 2 shows the days when the data collection campaign for biometric measurements and SAR surveys were performed. The sugarcane crop was harvested on 1 July 2020, 360 days after planting.

2.2.2. Sugarcane AGB Measurement

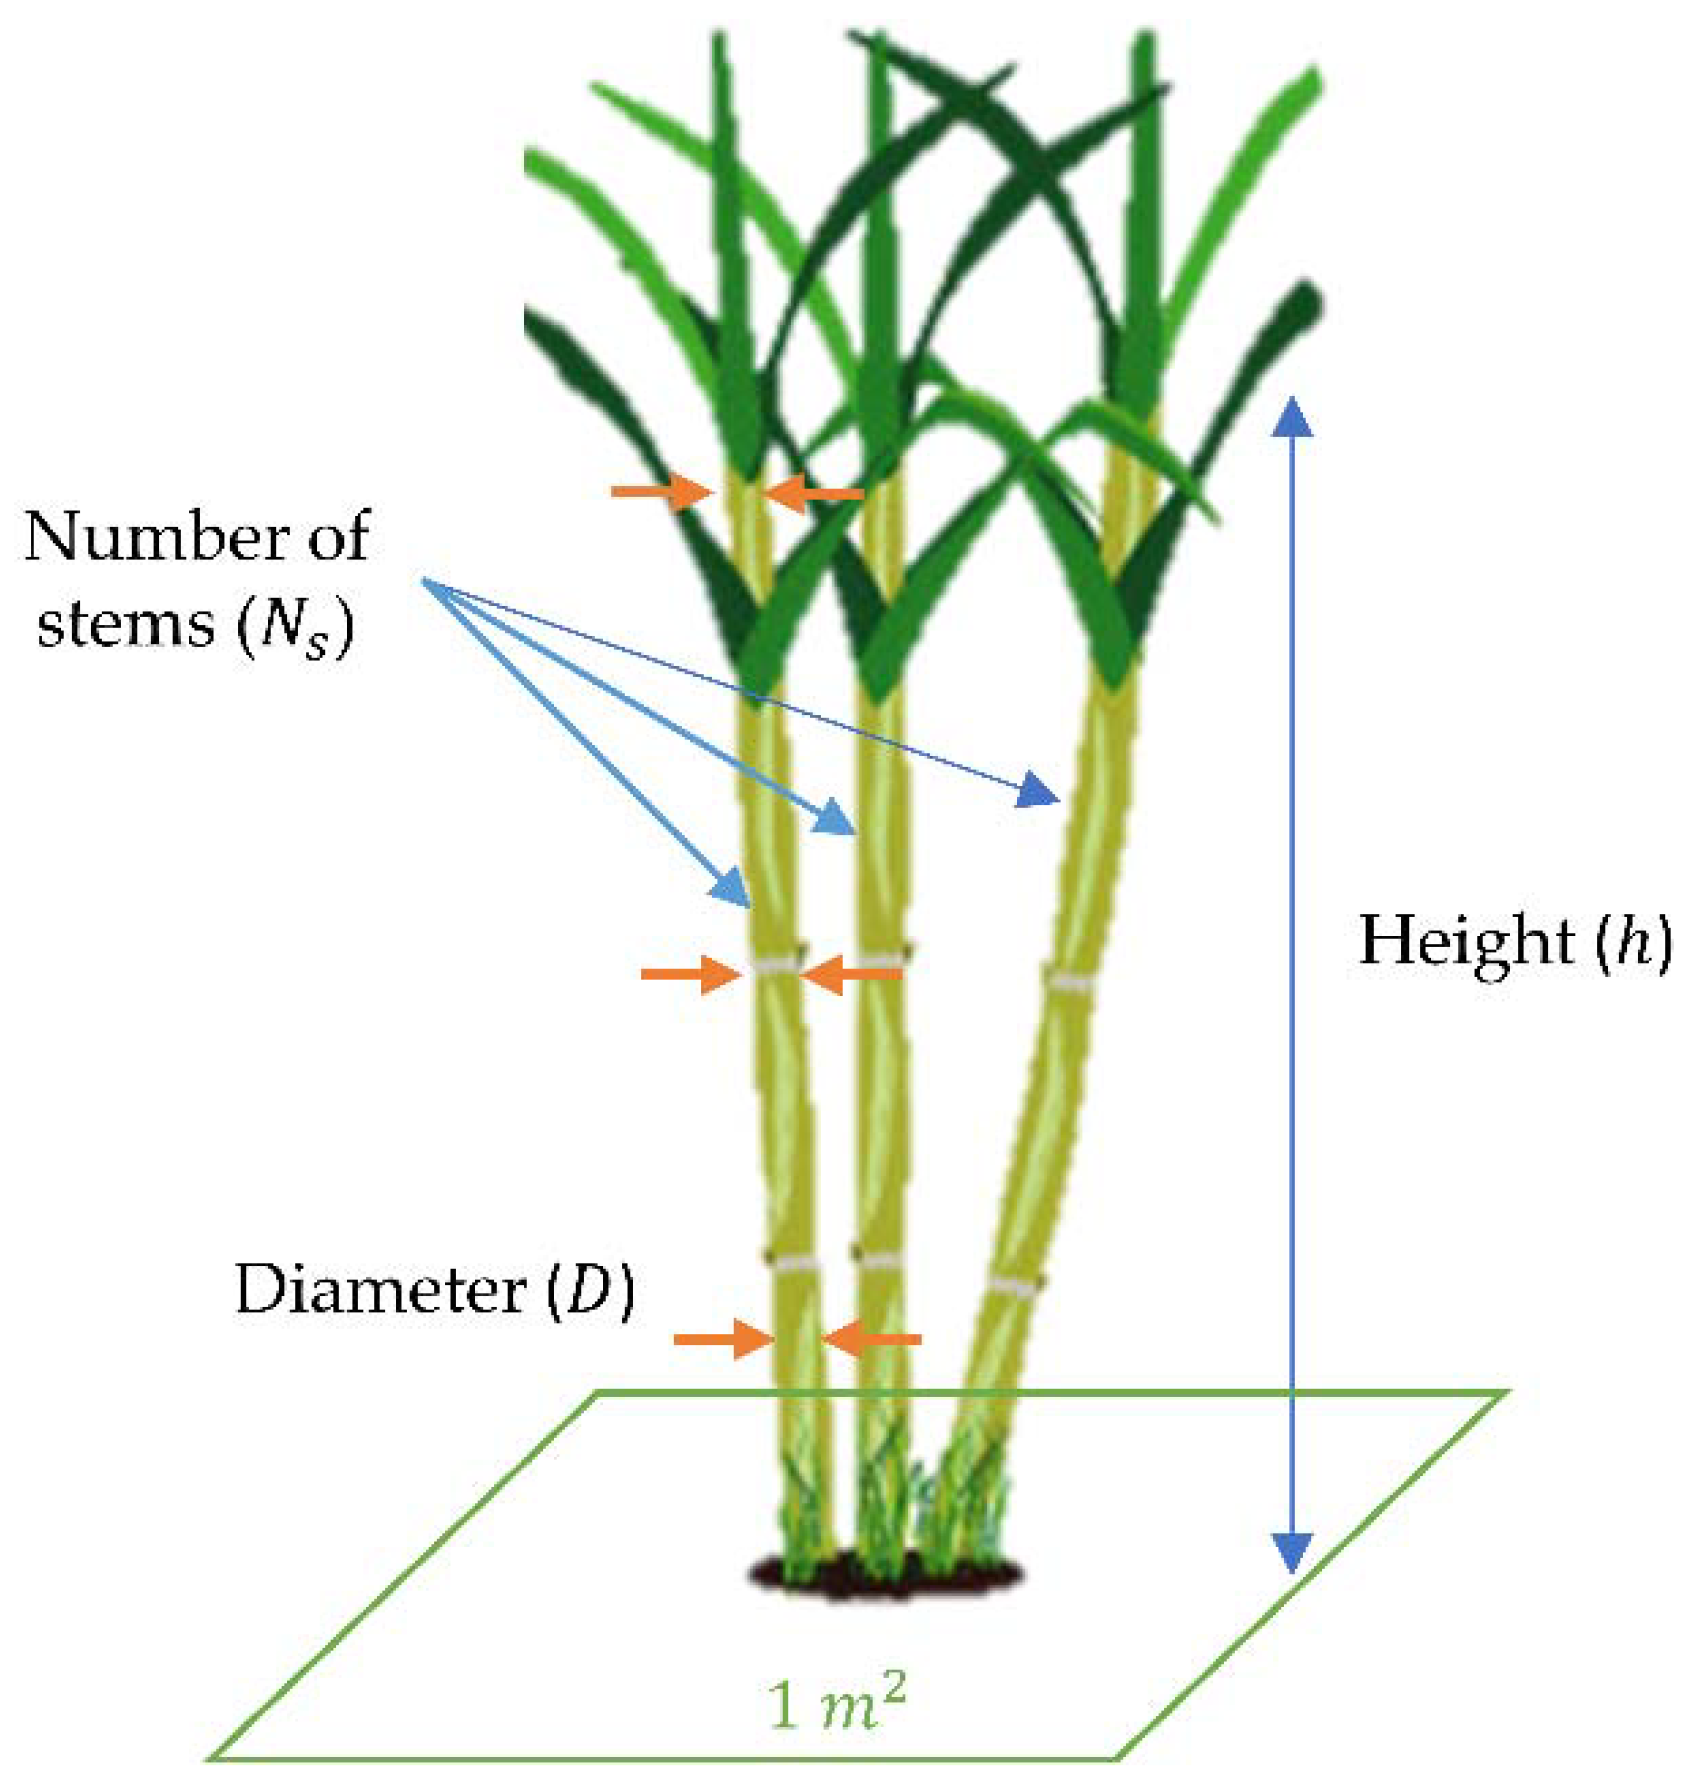
The methodology described in [42] was applied to calculate the measured AGB of sugarcane crops as reference data. Biometric parameters, illustrated in Figure 2, such as height, diameter, and the number of stems, were collected for each sugarcane plant. N s is the total number of stems in an area of 1 m2.
A stem with medium height is selected in this 1 m2 area as a representative from which the height h (m) and the diameters at the base, middle, and top of the stem can be measured. The final diameter D (m) is obtained by averaging those three measurements. A model with a Spearman’s correlation of 0.95 [43] is then employed to calculate the measured AGB by biometric parameters A G B m ,
A G B m = π D 2 4 h × N s × ρ × 0.977 d x ,
where d x (m) is the space between crop lines; destructive analysis was performed in a few stems to calculate the stem density ρ (kg m−3). The sugarcane harvesting was carried out on 1 July 2020, when all the plants were weighed to calculate the harvested AGB. Measured AGB obtained from Equation (1) was used as reference data to develop the proposed AGB estimation method.
Sugarcane biometric measurements were collected from 19 December 2019 to 12 May 2020. The campaigns of 1 and 17 June 2020 were not considered for biometric measurements due to a lodging problem in the experimental area.

2.2.3. Ripening Index Measurement

The ideal harvesting date for sugarcane crop can be defined as the day on which the plantation reaches its maximum metabolization of soluble solids, measured on a °Brix scale. A destructive analysis is necessary to determine the RI, which is defined as the ratio of the metabolization of soluble solids measured at the top and at the node close to the ground level. Sugarcane reaches its ideal cut-off point when 0.85 < RI < 1.00 [6].
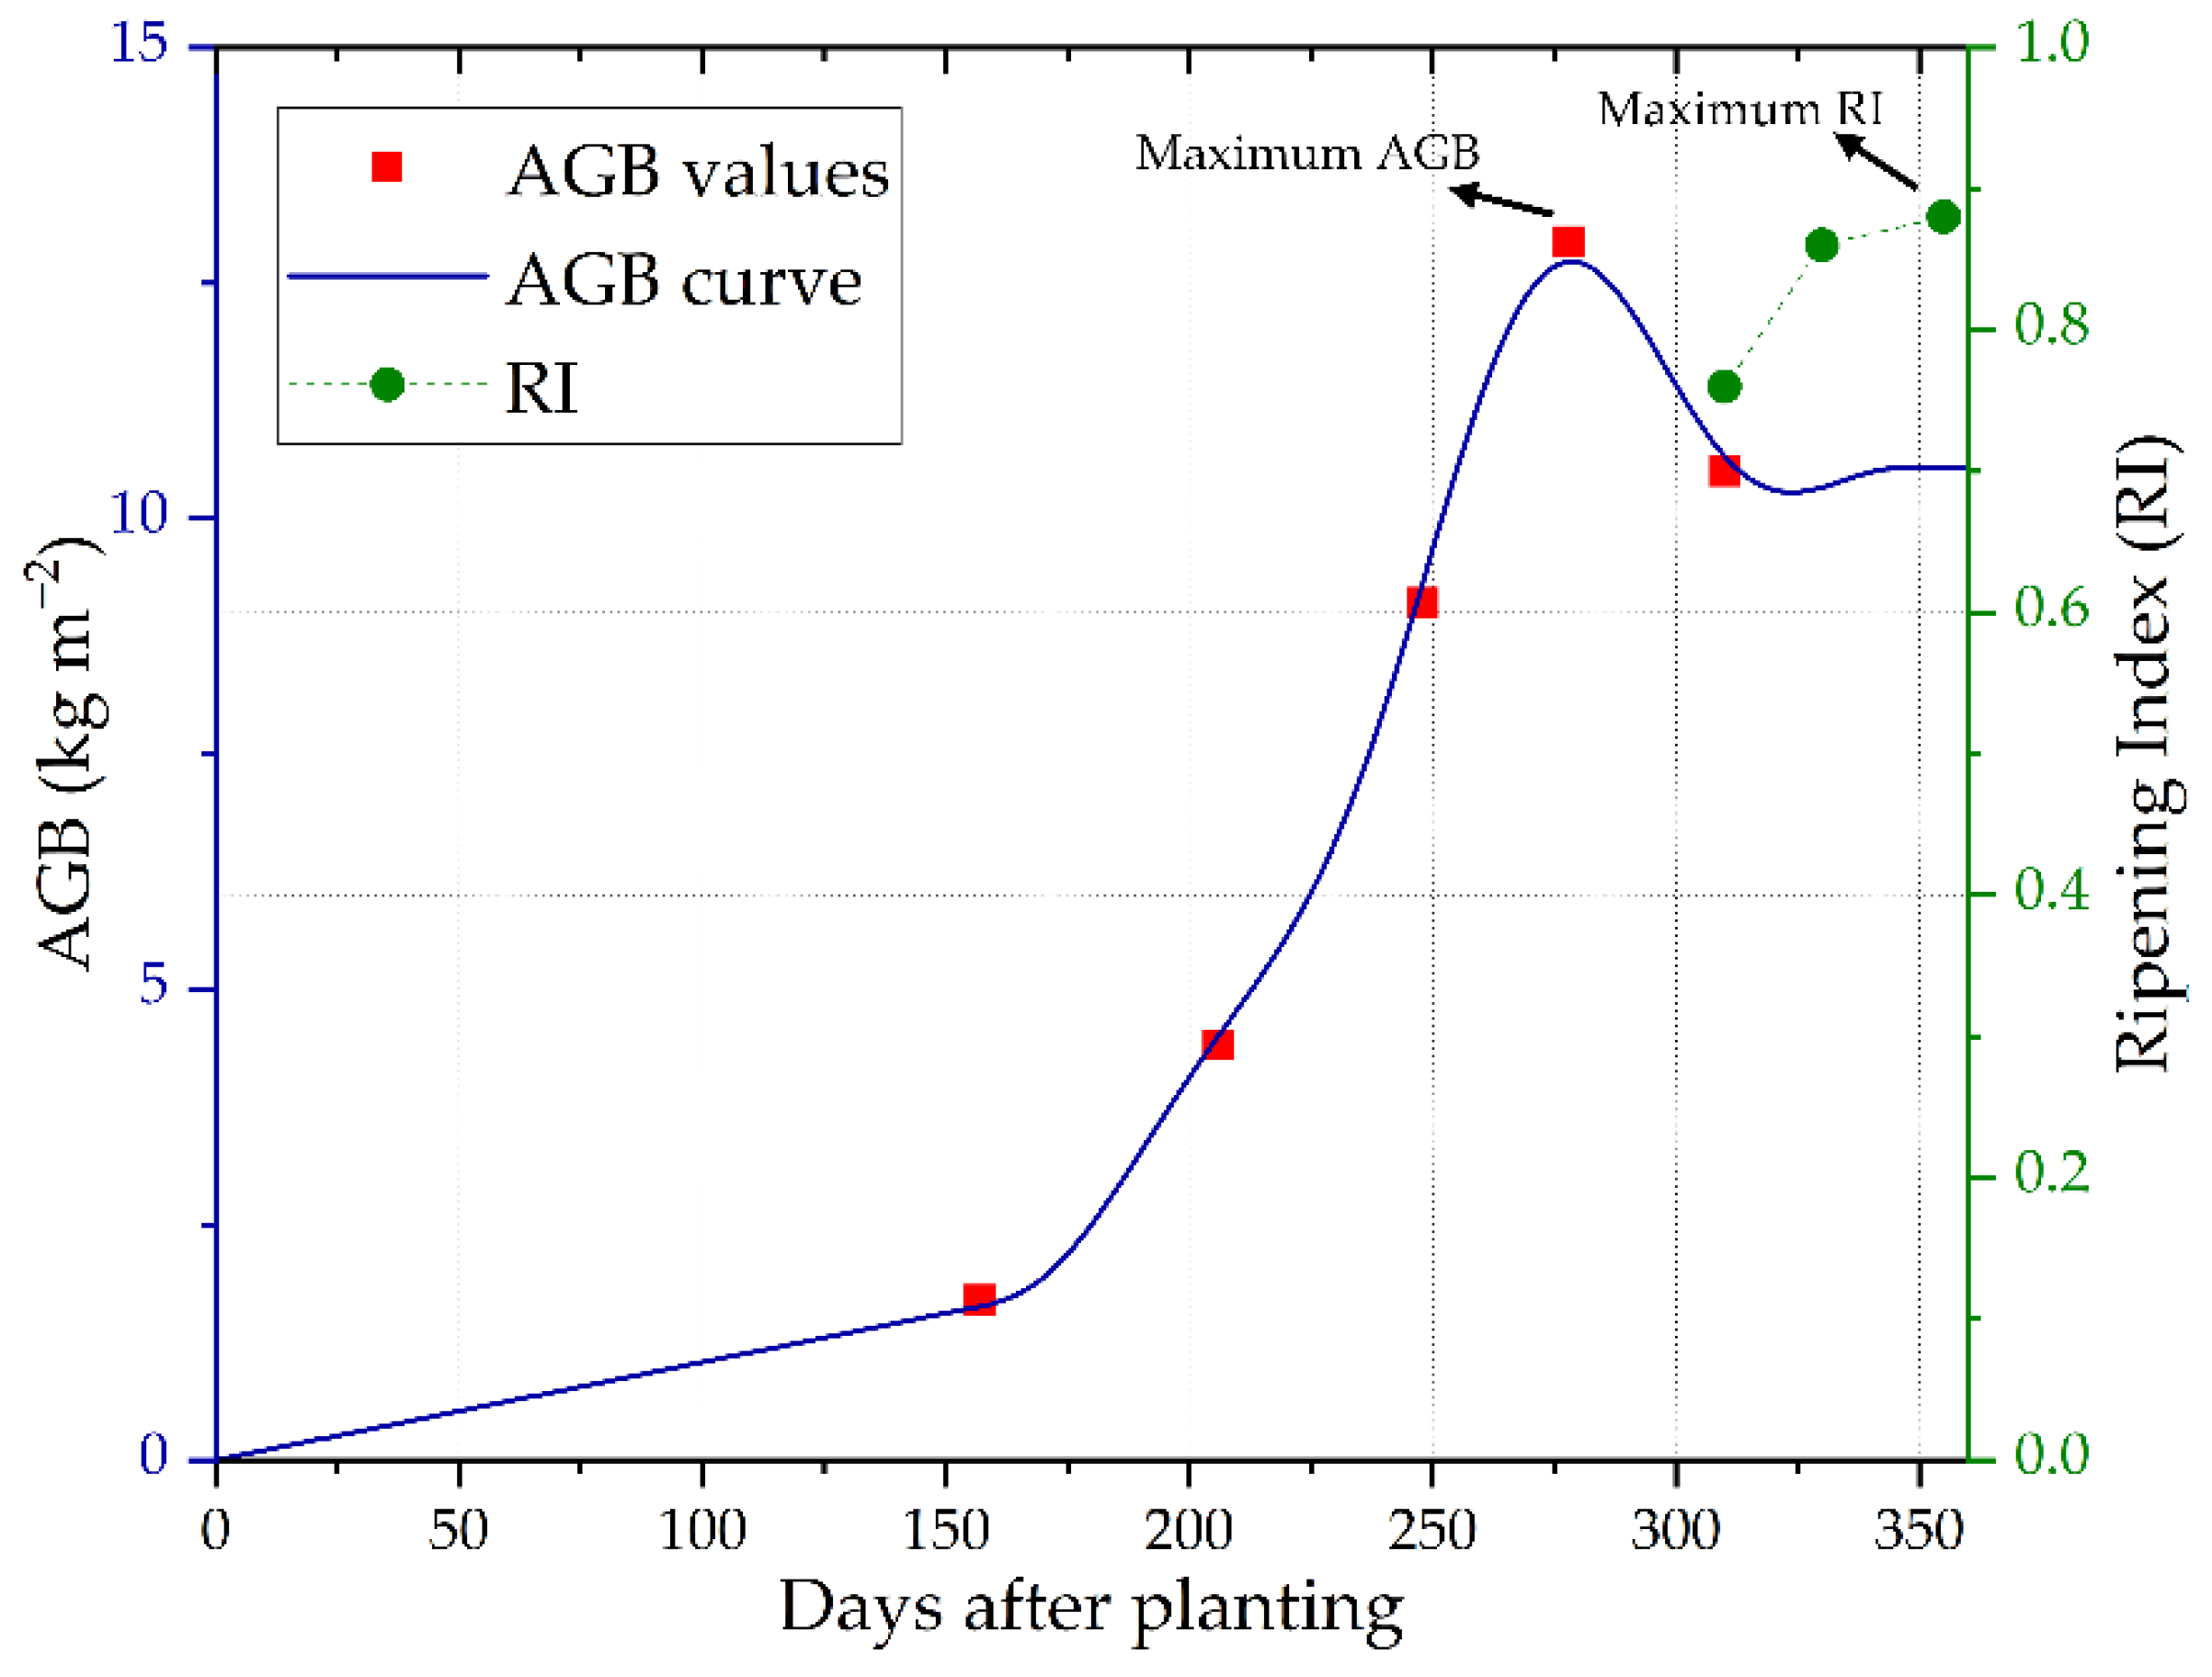
The sugarcane RI in the experimental area was evaluated using a manual refractometer in a few plants to establish the appropriate harvesting date based on the Brix ratio obtained in the last node at the top and in the fourth node above the ground level [44]. Figure 3 presents the sugarcane RI and measured AGB from the experimental area, and an AGB curve obtained from the interpolation of measured AGB values. From the values shown in Figure 3, it is possible to infer that the sugarcane crop reaches the maximum AGB on day 280. From this point on, the sugarcane plants begin to metabolize sugars, reaching and stabilizing at the maximum RI on day 360, approximately 80 days after the maximum AGB, when the optimal harvesting date is accomplished.
Although the destructive procedure is highly accurate, it demands intensive fieldwork, and a portable refractometer or a remote laboratory is needed to analyze the collected juice at different stalk points. Moreover, due to the dimensions of the sugarcane farms, only a limited number of samples can be taken since it is a destructive analysis. Additionally, AGB can be estimated from radar data. Therefore, it is possible to indirectly predict when the maximum value of RI will be achieved by the direct estimation of the AGB. The advantage of using the estimated AGB from radar data is the increased sampling density since estimations could be taken on a regular grid with 20 cm spacing, compared to the under-sampling limitation of the RI measurement.

2.2.4. Sugarcane AGB Estimation

The methodology to estimate AGB from radar data can be represented as a block diagram, as shown in Figure 4. This methodology is divided into two parts: first, the information obtained from each frequency band– σ L , σ P , and σ C –is analyzed individually to create single-band AGB models (green blocks), and finally, these AGB models– B L ( σ L ) , B P ( σ P ) and B C ( σ C ) –are weighted according to their efficiency in different ranges of AGB values to generate a final model for the AGB estimation– A G B e ( σ L , σ P , σ C ) .

Single-Band AGB Models

The first attempt for AGB estimation is based on the independent analysis of each frequency band available on the drone-borne SAR system. Calibrated SAR images and backscattering values from L, P, and C bands were obtained as explained in Section 2.1 and the measured AGB was used as reference data, as described in Section 2.2.2.
Since the electromagnetic wave penetration in crops is different for each frequency band, each one presents different saturation points [26,27,28]. Based on that, the three frequency bands available on the drone-borne SAR system were independently analyzed to estimate single-band AGB models to evaluate each band’s performance in different stages of crop growth and take advantage of the characteristics of each one of them.
The experimental area was then surveyed to estimate the single-band AGB models. Measured AGB and representative backscattering values for each frequency band— σ L , σ P , and σ C —were calculated over the experimental area. The information was analyzed using a scatter plot of the backscattering for each band versus the measured AGB. Such an analysis provides information on the backscattering behavior for each frequency band as a function of the measured AGB, making it possible to estimate trends and saturation points. Finally, using a curve-fitting procedure, the single-band AGB models— B L ( σ L ) , B P ( σ P ) and B C ( σ C ) —are estimated.

Band-Weighted AGB Model

The band-weighted AGB model presented in this section takes advantage of the drone-borne SAR system effectiveness in different ranges of AGB, avoiding possible saturation points. The single-band AGB models are weighted to produce the final estimated AGB model, as described in Figure 4. The methodology adopted is the weighted-arithmetic average, where the weighting is based on the error functions for each band [45].
Table 3 shows three ranges of AGB values used to evaluate each single-band model, which is defined based on the saturation of each band according to the literature [26,27,28]. The root-mean-square error (RMSE) for each frequency band in the three ranges— e L 1 , 2 , 3 , e P 1 , 2 , 3 and e C 1 , 2 , 3 —are calculated by comparing the measured and estimated AGB.
Then, a curve-fitting procedure using polynomial functions and the RMSE values from each single-band AGB model is used to estimate the error functions— e L ( B L ) , e P ( B P ) and e C ( B C ) . Finally, the band-weighted AGB model, A G B e ( σ L , σ P , σ C ) , is obtained by weighting the AGB estimation of each band, considering the error functions [45], as shown in Figure 4:
A G B e ( σ L , σ P , σ C ) = B L ( σ L ) w L ( σ L ) + B P ( σ P ) w P ( σ P ) + B C ( σ C ) w C ( σ C ) w L ( σ L ) + w P ( σ P ) + w C ( σ C )   ,
where w L ( σ L ) , w P ( σ P ) and w C ( σ C ) are weighting functions, defined as:
w L ( σ L ) = 1 ( e L ( σ L ) ) 2   ,
w P ( σ P ) = 1 ( e P ( σ P ) ) 2   ,
w C ( σ C ) = 1 ( e C ( σ C ) ) 2   .

2.3. Adjustment Stage

This section describes the necessary adjustments of the data obtained in the experimental area so that they can be applied in a test site. This is necessary because the nominal cycles of sugarcane plants in the experimental area and test site are different.

2.3.1. Test Site

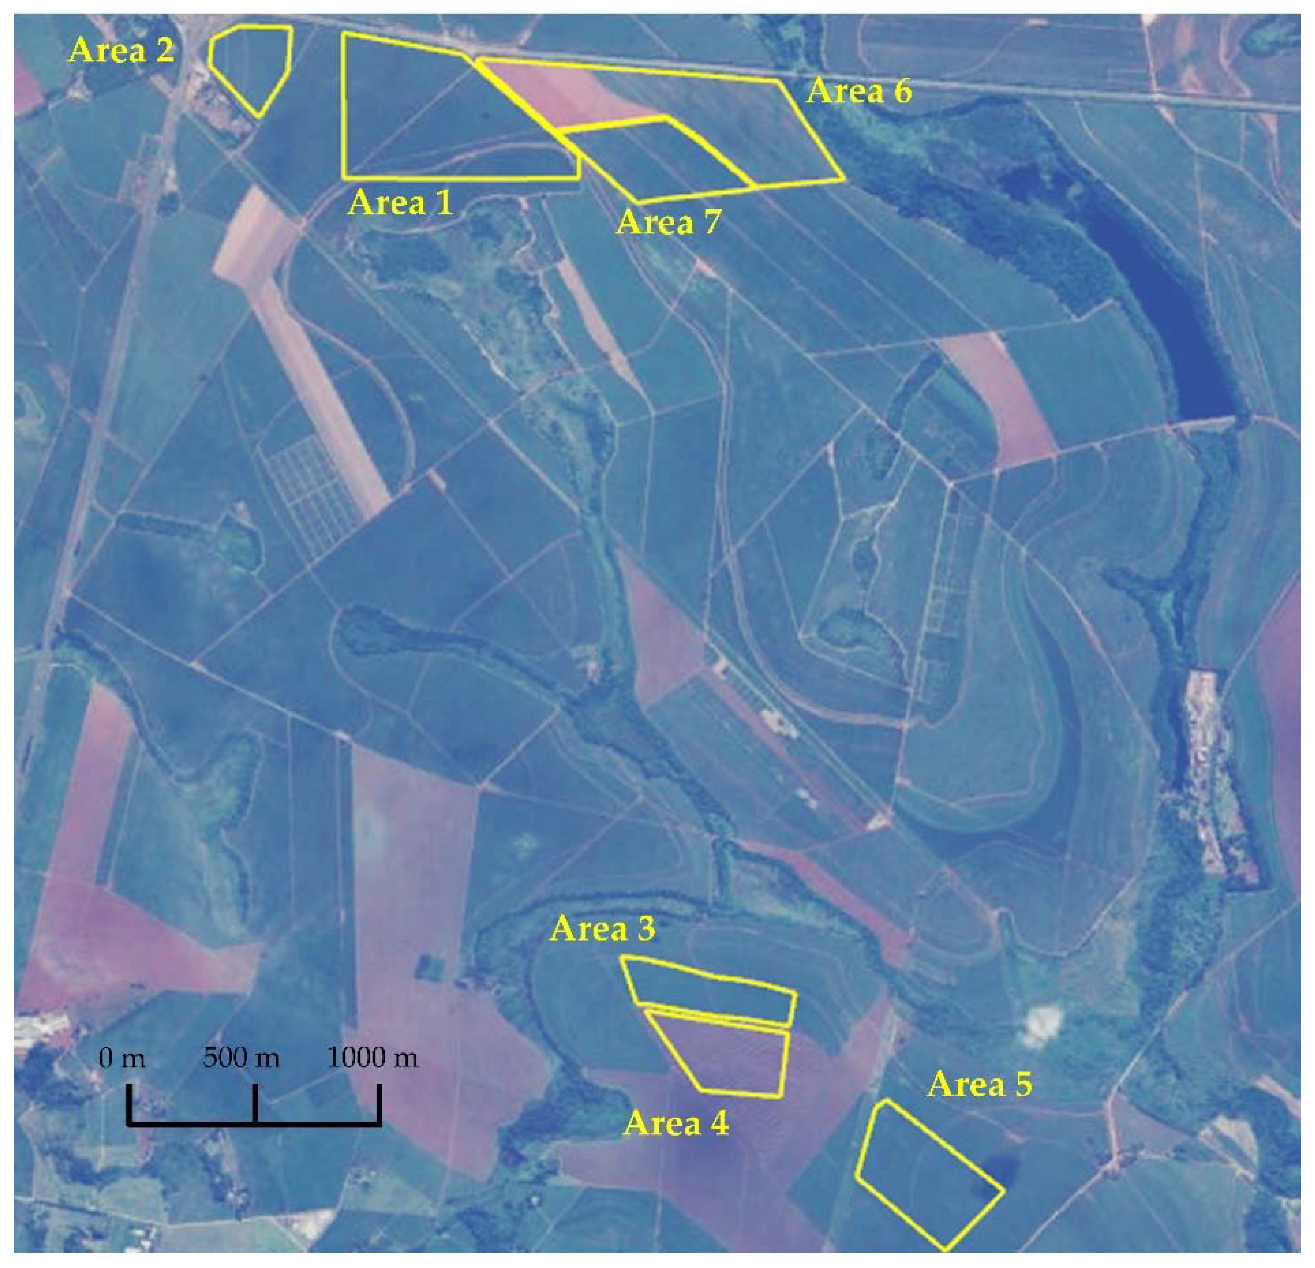
The test site, shown in Figure 5, is located on a sugarcane farm in Iracemápolis, São Paulo, Brazil. The monitored sugarcane crop is the RB975952 type, which has a nominal cycle of 18 months, estimated productivity of 12.5 kg m−2 at the first harvest, and less than 7 kg m−2 after the 4th harvest. The test site was divided into 7 areas with different harvest seasons.
The survey flights and biometric measurements occurred on 9 April 2020 for areas 1 through 5 of the test site and 16 July 2020 for areas 1, 6, and 7. All SAR surveys were performed with linear flight paths. Areas 2 and 4 were harvested on 15 July 2020, and areas 6 and 7 were harvested on 7 October 2020.

2.3.2. AGB Curve Adjustment

From the estimated AGB in the experimental area, shown in Figure 3, it is possible to obtain a proposed AGB curve. Because the sugarcane types planted in the experimental area and the test site are different, it is necessary to scale this AGB curve.
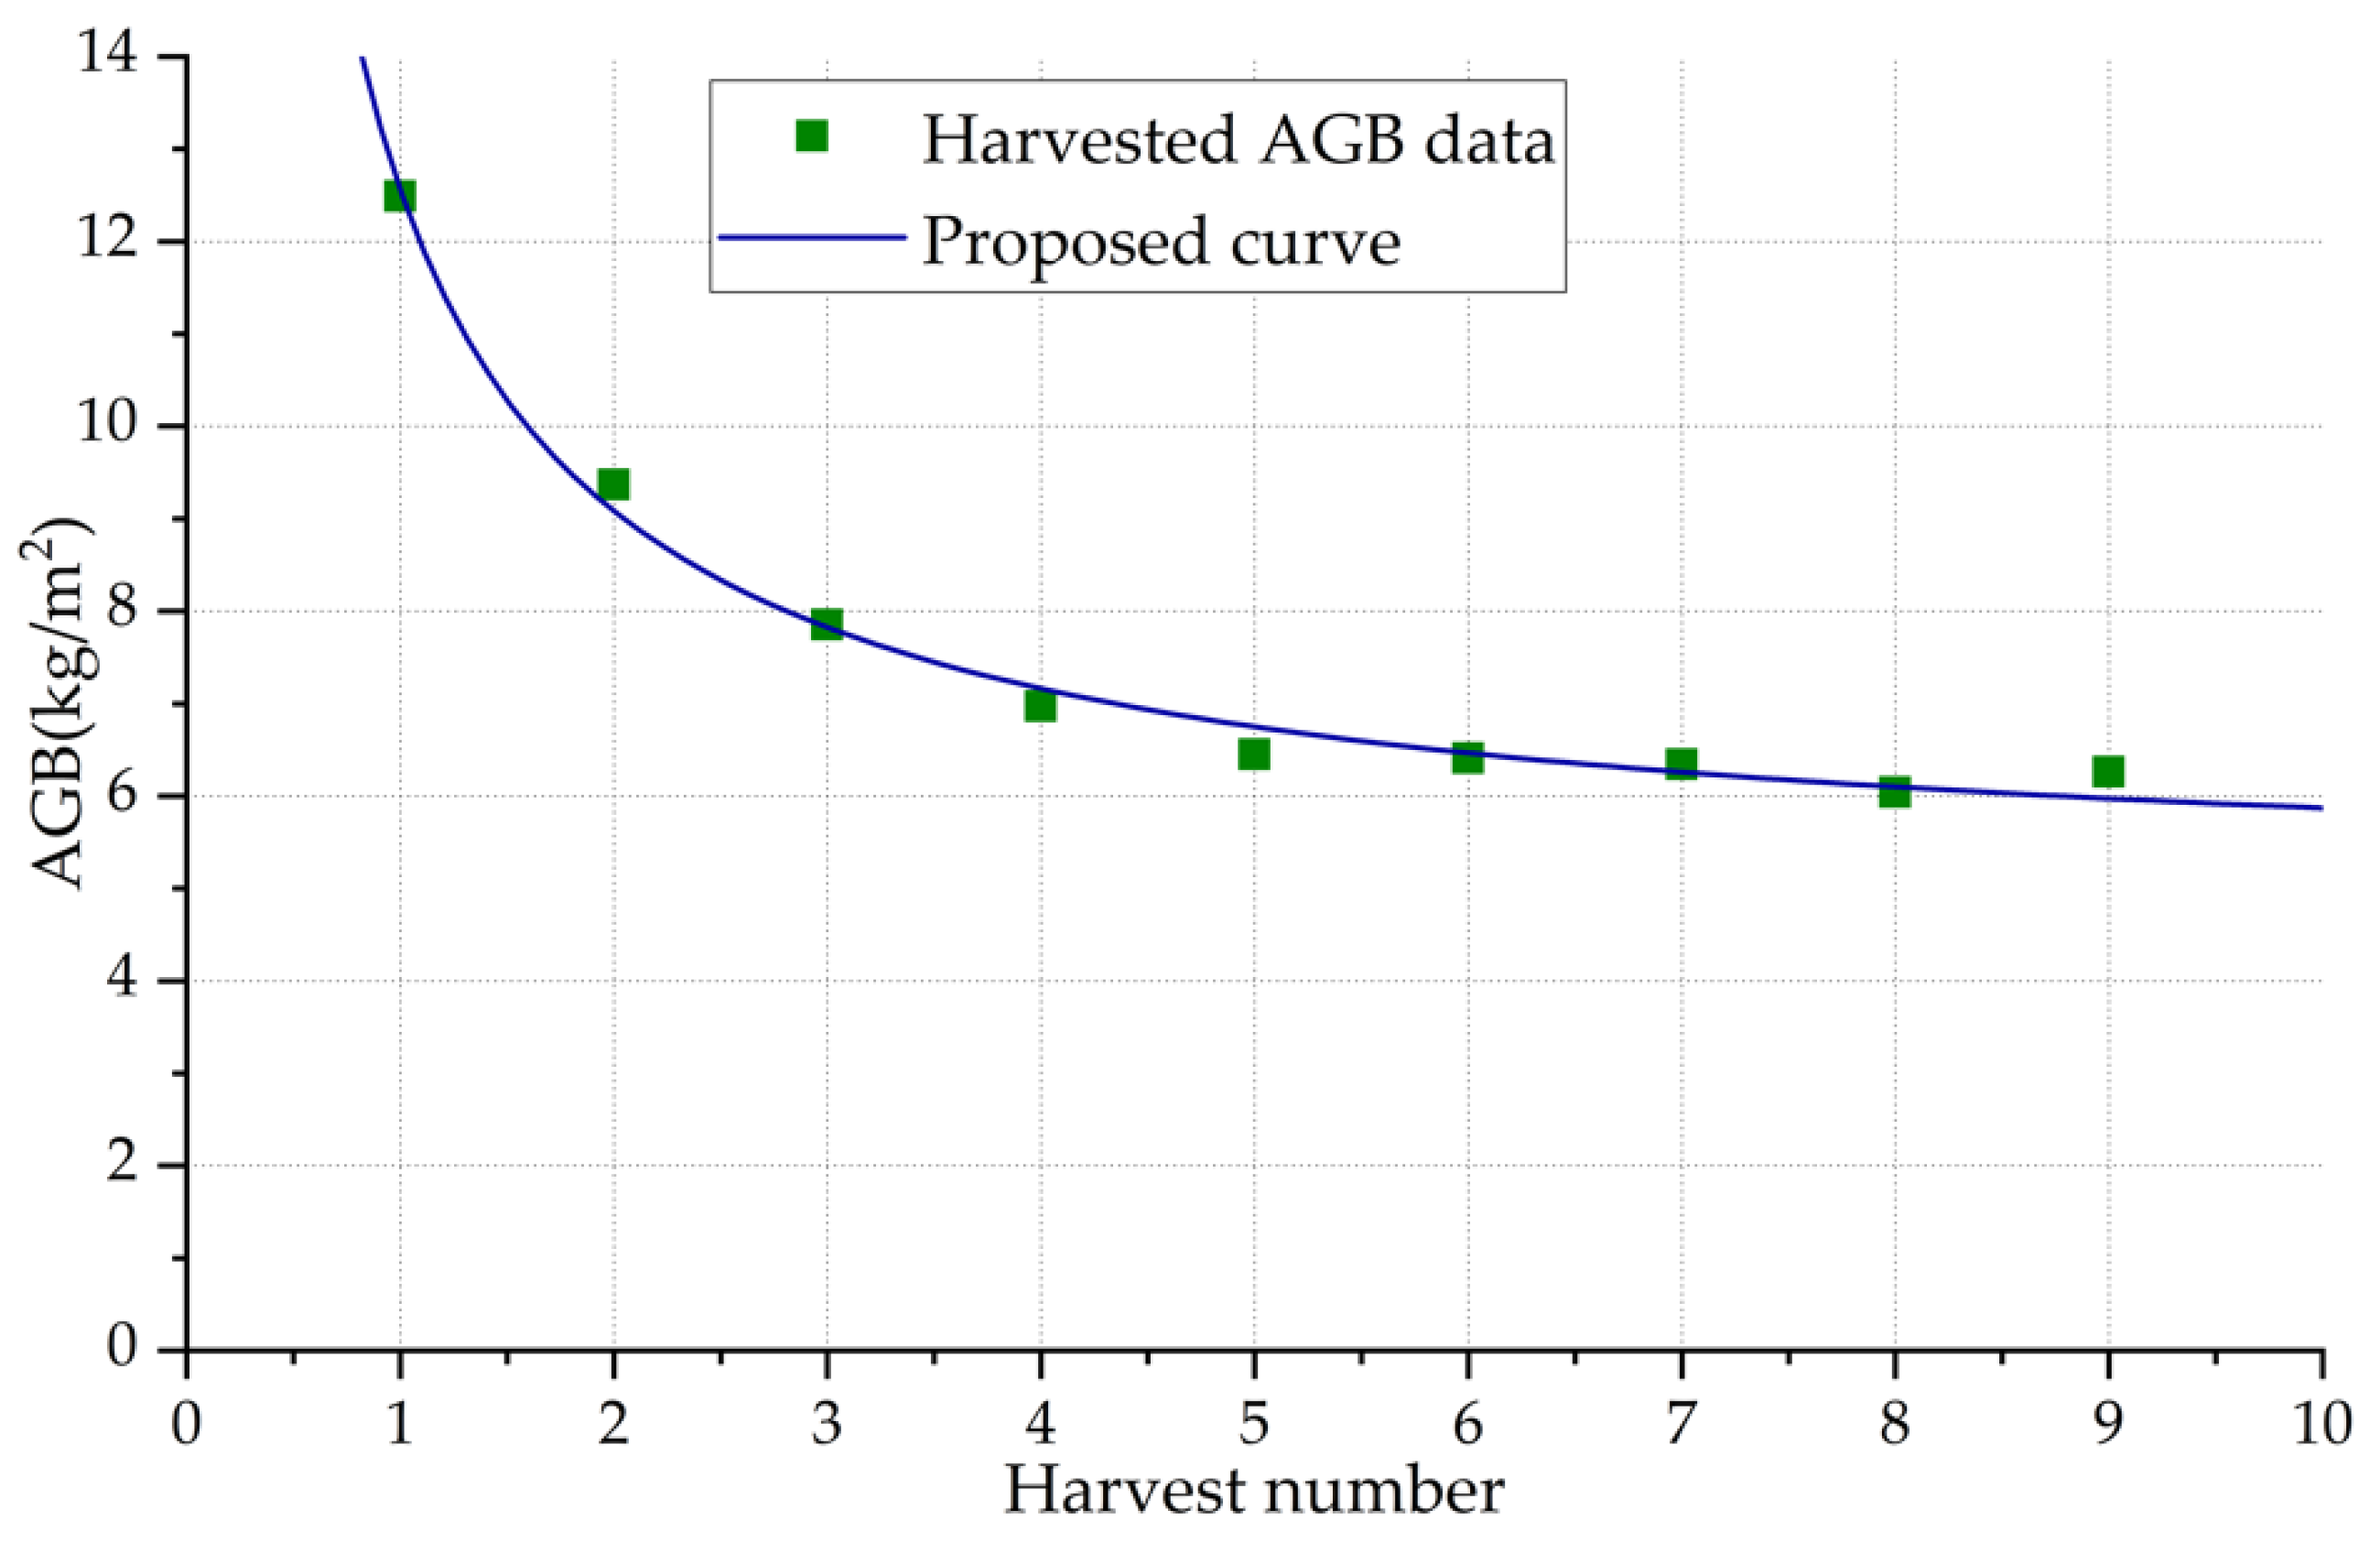
The sugarcane type planted in the test site has a life cycle of 18 months, while the life cycle in the experimental area is 12 months, so the AGB curve needs to be scaled in time. In addition, unlike the experimental area, the test site presents crops from different harvest seasons, which directly influences the final productivity. For this reason, historical data of the harvested AGB also need to be taken into account to scale the AGB curve in amplitude. Historical data about the sugarcane test site areas over the last 10 years provided by farm supervisors is displayed in Table 4 and plotted in Figure 6.
Since productivity decreased exponentially over the seasons, as can be seen in Figure 6, an exponential function can be used to model the productivity of the test site. The curve c(s), calculated using the MATLAB Curve Fitting Toolbox, is defined as:
c ( s ) = 7.776 s 0.8545 + 4.784 ,
where s is the harvest season. The data in Table 4 is used to scale the amplitude of the AGB curve from the experimental area and adapt it to the areas of the test site.

2.4. Prediction Stage

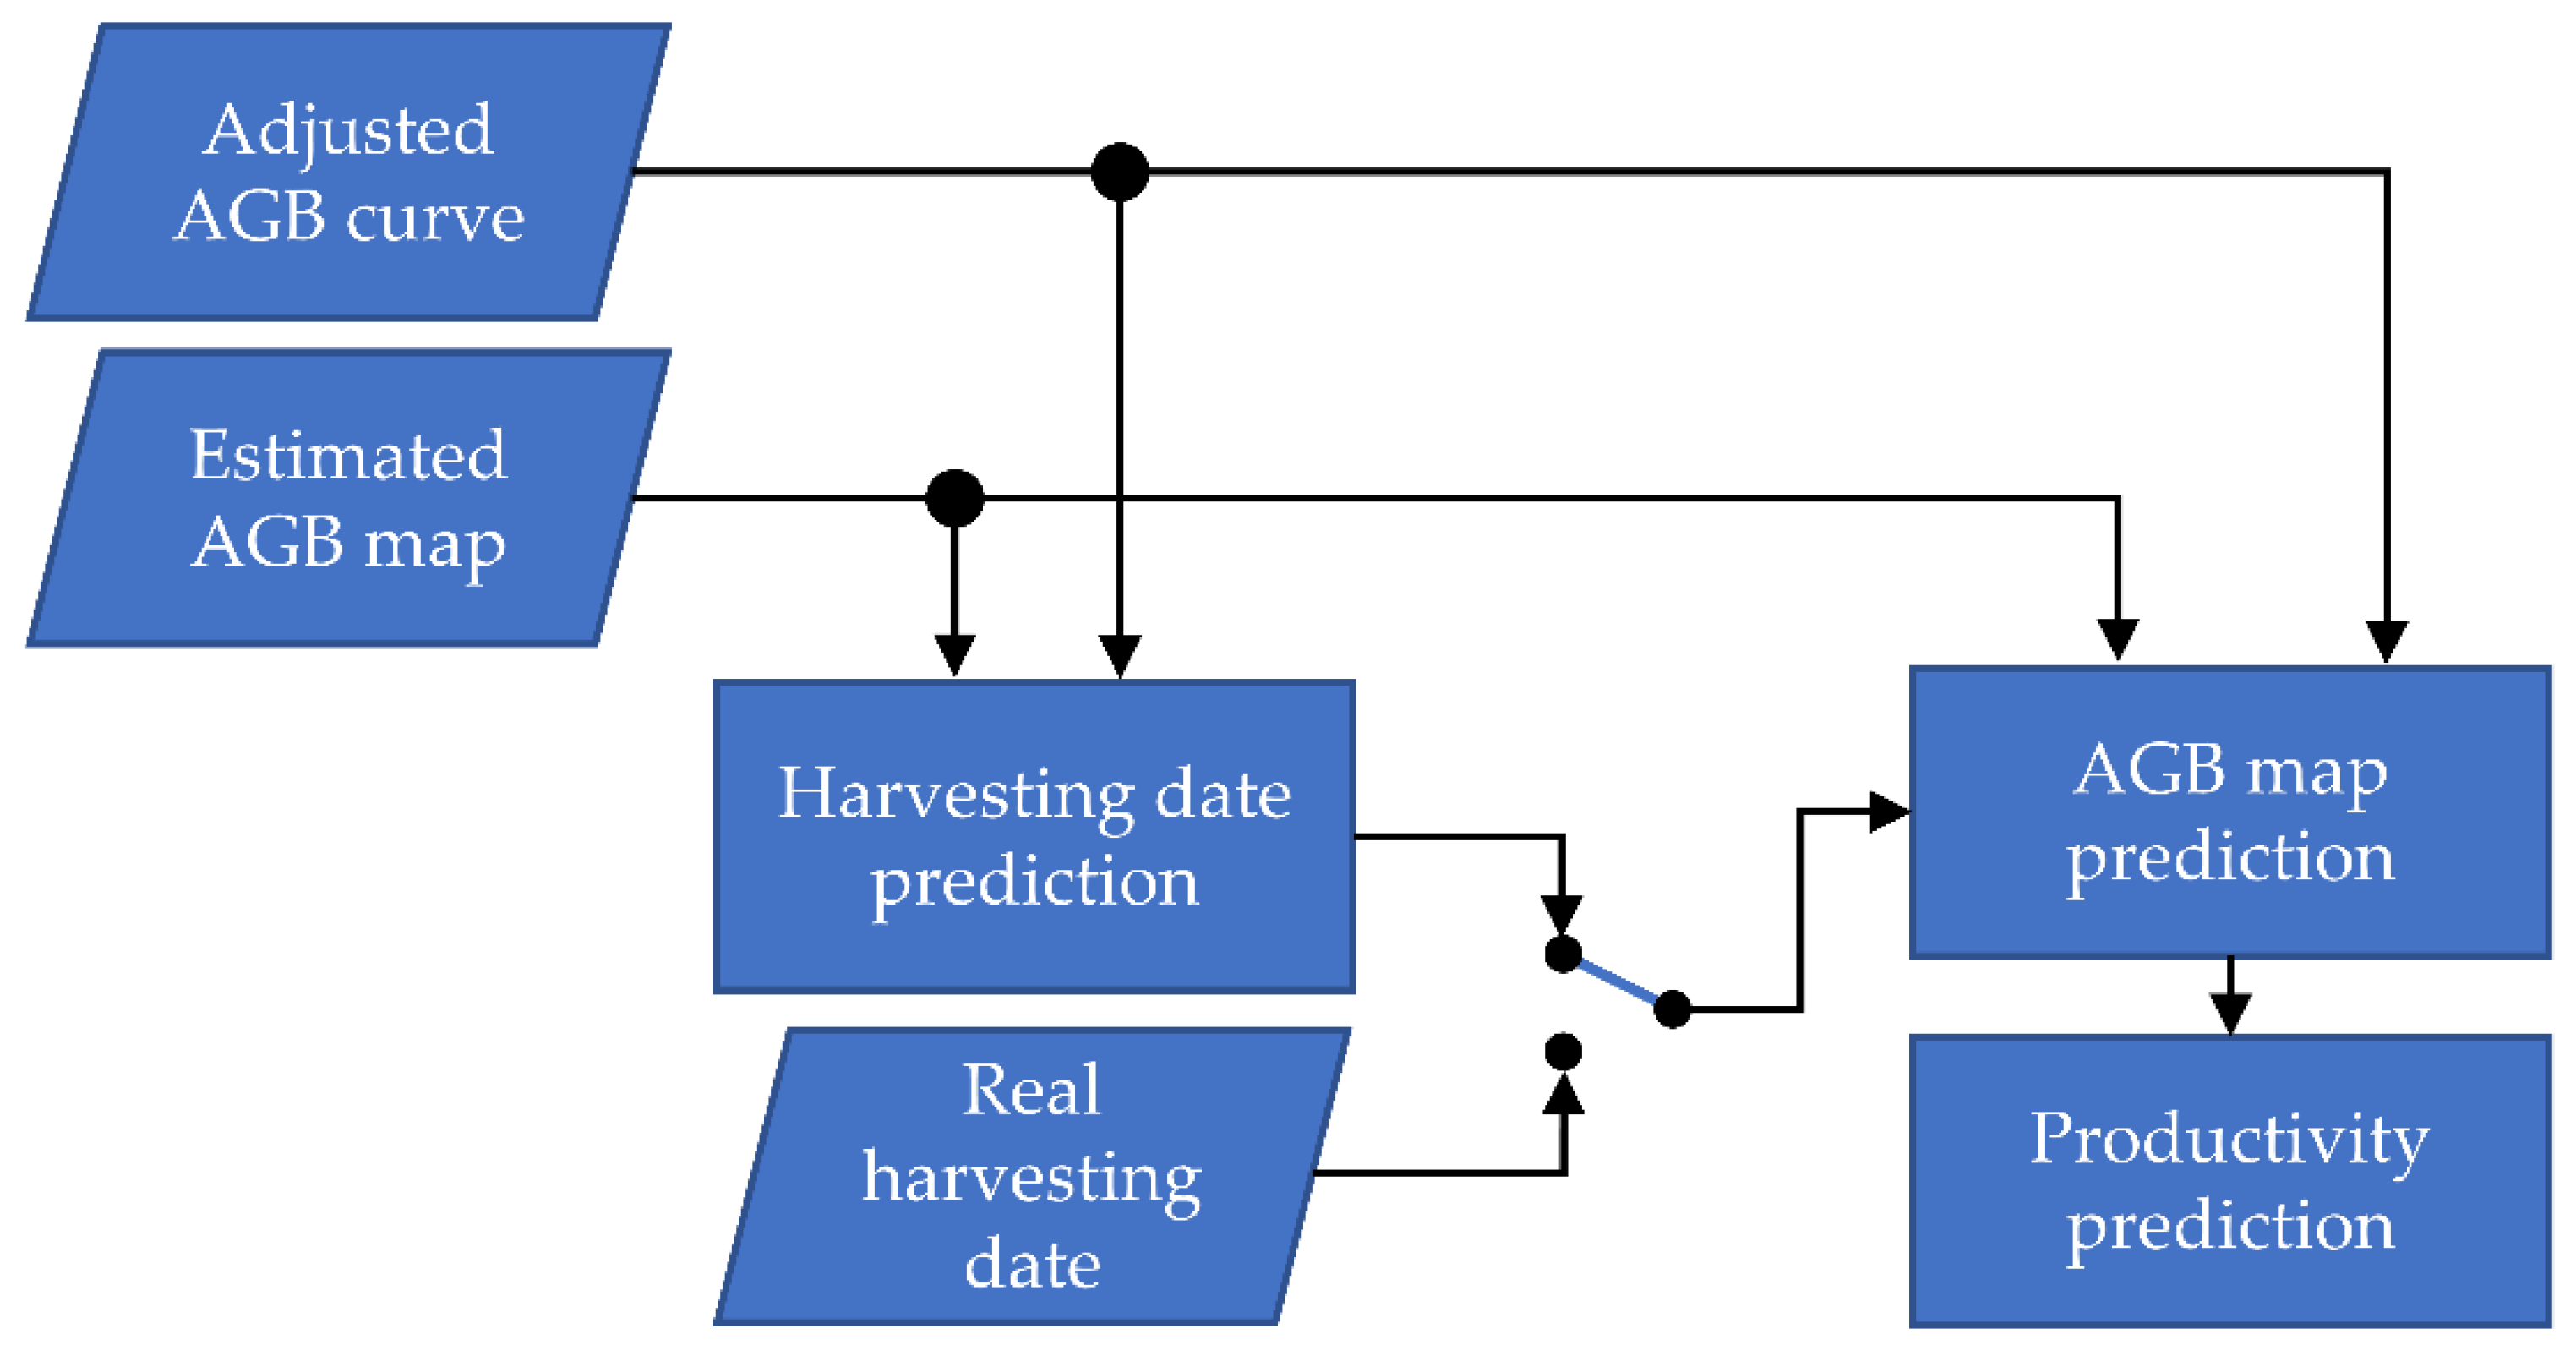
This section describes the methods for the harvesting date and productivity prediction in sugarcane crops of the test site. The procedure is illustrated in Figure 7, where the adjusted AGB curve is obtained according to Section 2.3 and the estimated AGB map is based on the method described in Section 2.2.4. This information is employed to obtain the harvesting date and the AGB map prediction.
Next, an estimated AGB map of an area of the test site and the corresponding adjusted AGB curve, which varies according to the harvest season, are considered as examples to describe the prediction methods.

2.4.1. Harvesting Date Prediction

The estimated AGB map is analyzed to obtain a histogram of days according to the corresponding AGB curve. This procedure is carried out by taking the AGB value of each pixel, calculating the corresponding day after planting using the AGB curve, and storing the information in a histogram. This procedure, illustrated in Figure 8, is performed pixel-by-pixel until a final histogram is obtained.
The day after planting of the analyzed area is calculated as the day corresponding to the maximum histogram value. Finally, the remaining days for the predicted harvesting date, when the RI is expected to be maximum, are calculated by subtracting 360 days (or 540 days for the test area) and the day after planting of the analyzed area.

2.4.2. Productivity Prediction

From the estimated AGB map and the corresponding AGB curve, a predicted AGB map is obtained through a pixel-by-pixel procedure, as shown in Figure 8. In this procedure, the pixel AGB value of the estimated AGB map is associated with their corresponding day after planting according to the AGB curve. Then, a time interval is added to the obtained day after planting to calculate the predicted pixel AGB value. The time interval considered can be the days remaining for the predicted harvest or real harvesting date. The predicted productivity corresponding to the analyzed area is obtained as the average value of the predicted AGB map.

3. Results

3.1. Imaging SAR

The SAR data of each frequency band, presented in Table 2, were processed as described in Section 2.1 to generate radiometrically corrected SAR images. DEM information of the mapped area was freely obtained from Shuttle Radar Topography Mission (SRTM) data [46]. Then, 40 control points located around the experimental area and measured with a differential GNSS system were used to correct the DEM. This adjustment was carried out to improve the DEM information provided by the SRTM, which was collected with a sampling of only 30 m. Finally, the procedure described in Section 2.1 was employed for the absolute calibration, using two 0.5 m edge corner reflectors and one corner reflector with 0.6 m side length in each monitoring survey. Each processed SAR image depicts a 300 × 300 m2 area, with 20 cm sampling in both directions. To reduce the SAR images speckle, a moving average filter of 1.5 × 1.5 m2 was applied.

3.2. AGB Estimation

The three-band backscattering values were calculated over the experimental area using the calibrated and radiometrically corrected SAR images acquired by the drone-borne SAR system performing a square flight. The acquired dataset was divided into 75% for training and 25% for validation. The training dataset was employed to calculate the single-band AGB models and the weighted-band AGB model, and the validation dataset was employed for adjustment.

3.2.1. Single-Band AGB Models

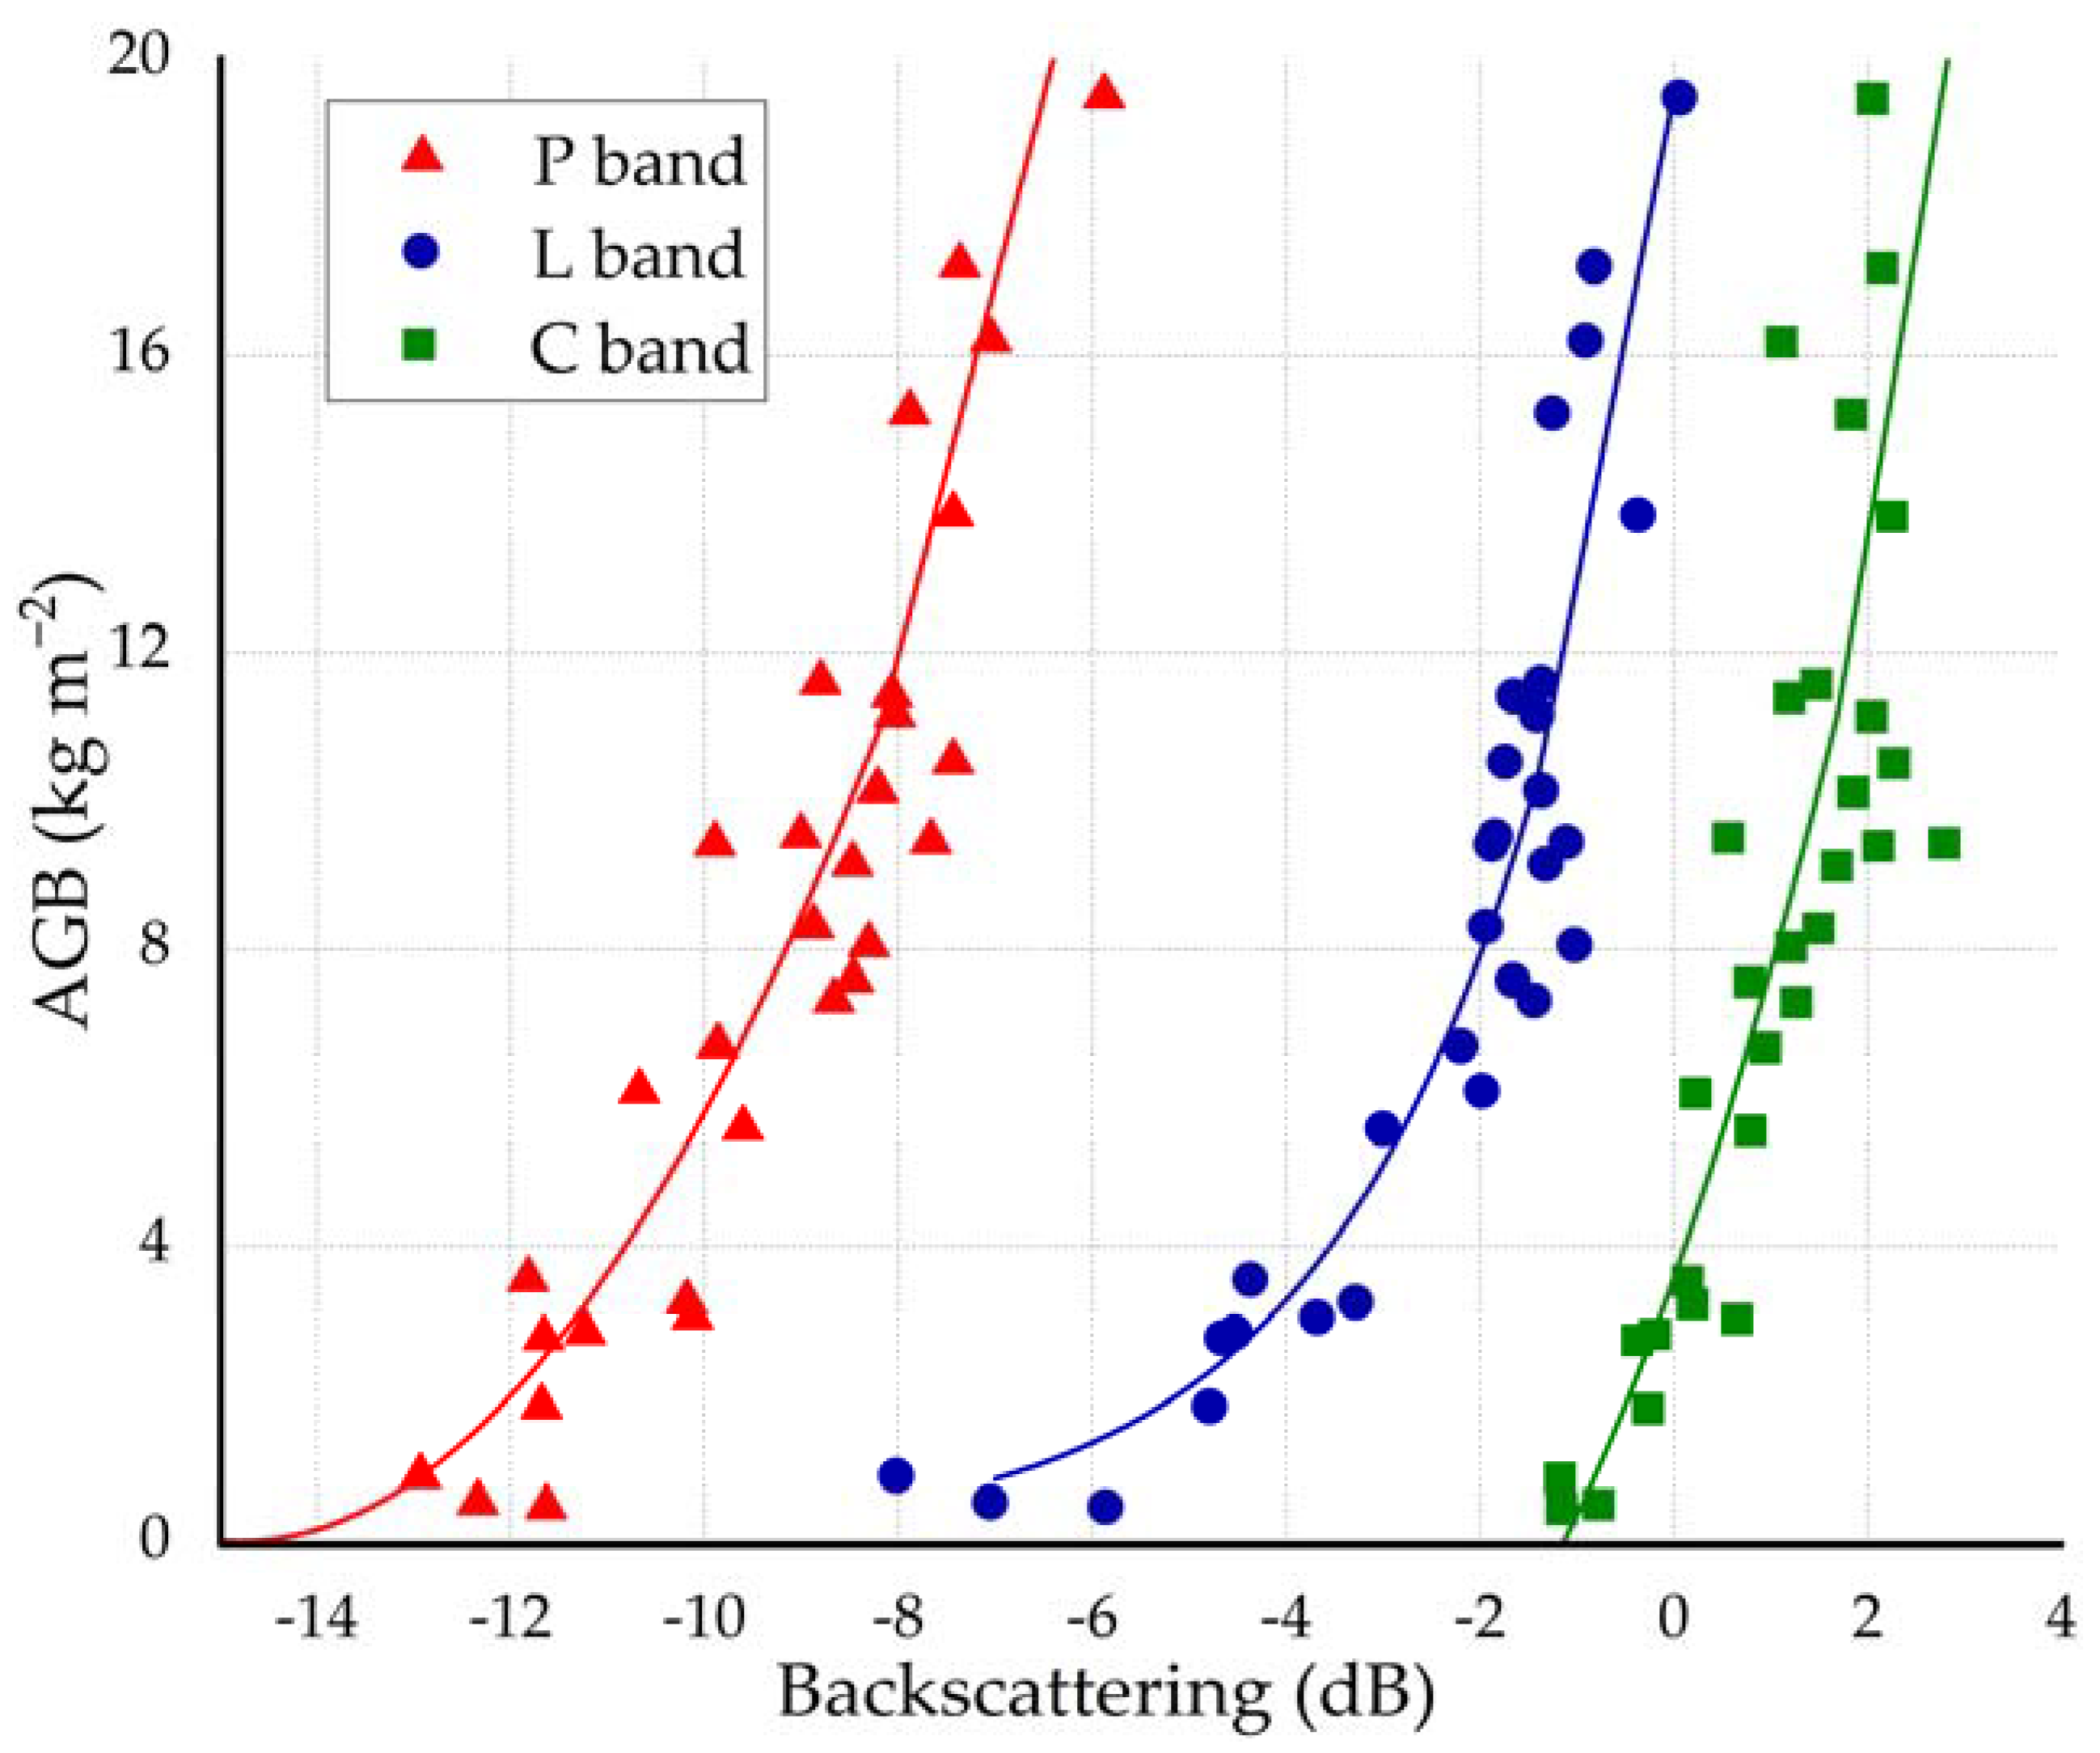
Figure 9 presents the backscattering results versus measured AGB using the training dataset from 19 December 2019 to 12 May 2020.
According to Figure 9, the C band response has a saturation close to 8 kg m−2. For AGB values higher than 8 kg m−2, the C band backscattering error is higher than 2 dB and does not allow an AGB estimation accuracy better than 3 kg m−2. The L band information has similar behavior to the C band and its saturation threshold is about 12 kg m−2. P band, on the other hand, does not appear to have a saturation point, presenting a linear trend for higher AGB. To calculate the single-band models, piecewise-defined equations based on exponential functions and second-degree polynomials were used due to the saturation and changes in trend between the measured AGB and backscattering values. Applying a curve-fitting method, the measured AGB for each frequency can be expressed as:
B L ( σ L ) = {       19.15 e 0.4413 σ L , | σ L < 1.4 d B 6.55 σ L + 19.50 , | σ L 1.4 d B   ,
B P ( σ P ) = { 0.25 ( σ P ) 2 + 7.43 σ P + 55.01 , | σ P < 8.2 d B 5.02 σ P + 52.15 , | σ P 8.2 d B   ,
B C ( σ C ) = { 0.49 ( σ C ) 2 + 3.678 σ C + 3.57 , | σ C < 1.7 d B 7.77 σ C 1.98 , | σ C 1.7 d B   ,
An RMSE of 1.94 kg m−2 was achieved for the L band model, 2.11 kg m−2 for the P band model, and 3.46 kg m−2 for the C band model. Furthermore, the R2 for each model was 0.89, 0.84, and 0.55 for B L ( σ L ) , B P ( σ P ) and B C ( σ C ) , respectively. Additionally, the coefficient of determination for each model for the validation dataset were 0.88, 0.82, and 0.45 for B L ( σ L ) , B P ( σ P ) and B C ( σ C ) , respectively, presenting a proper fit.

3.2.2. Band-Weighted AGB Model

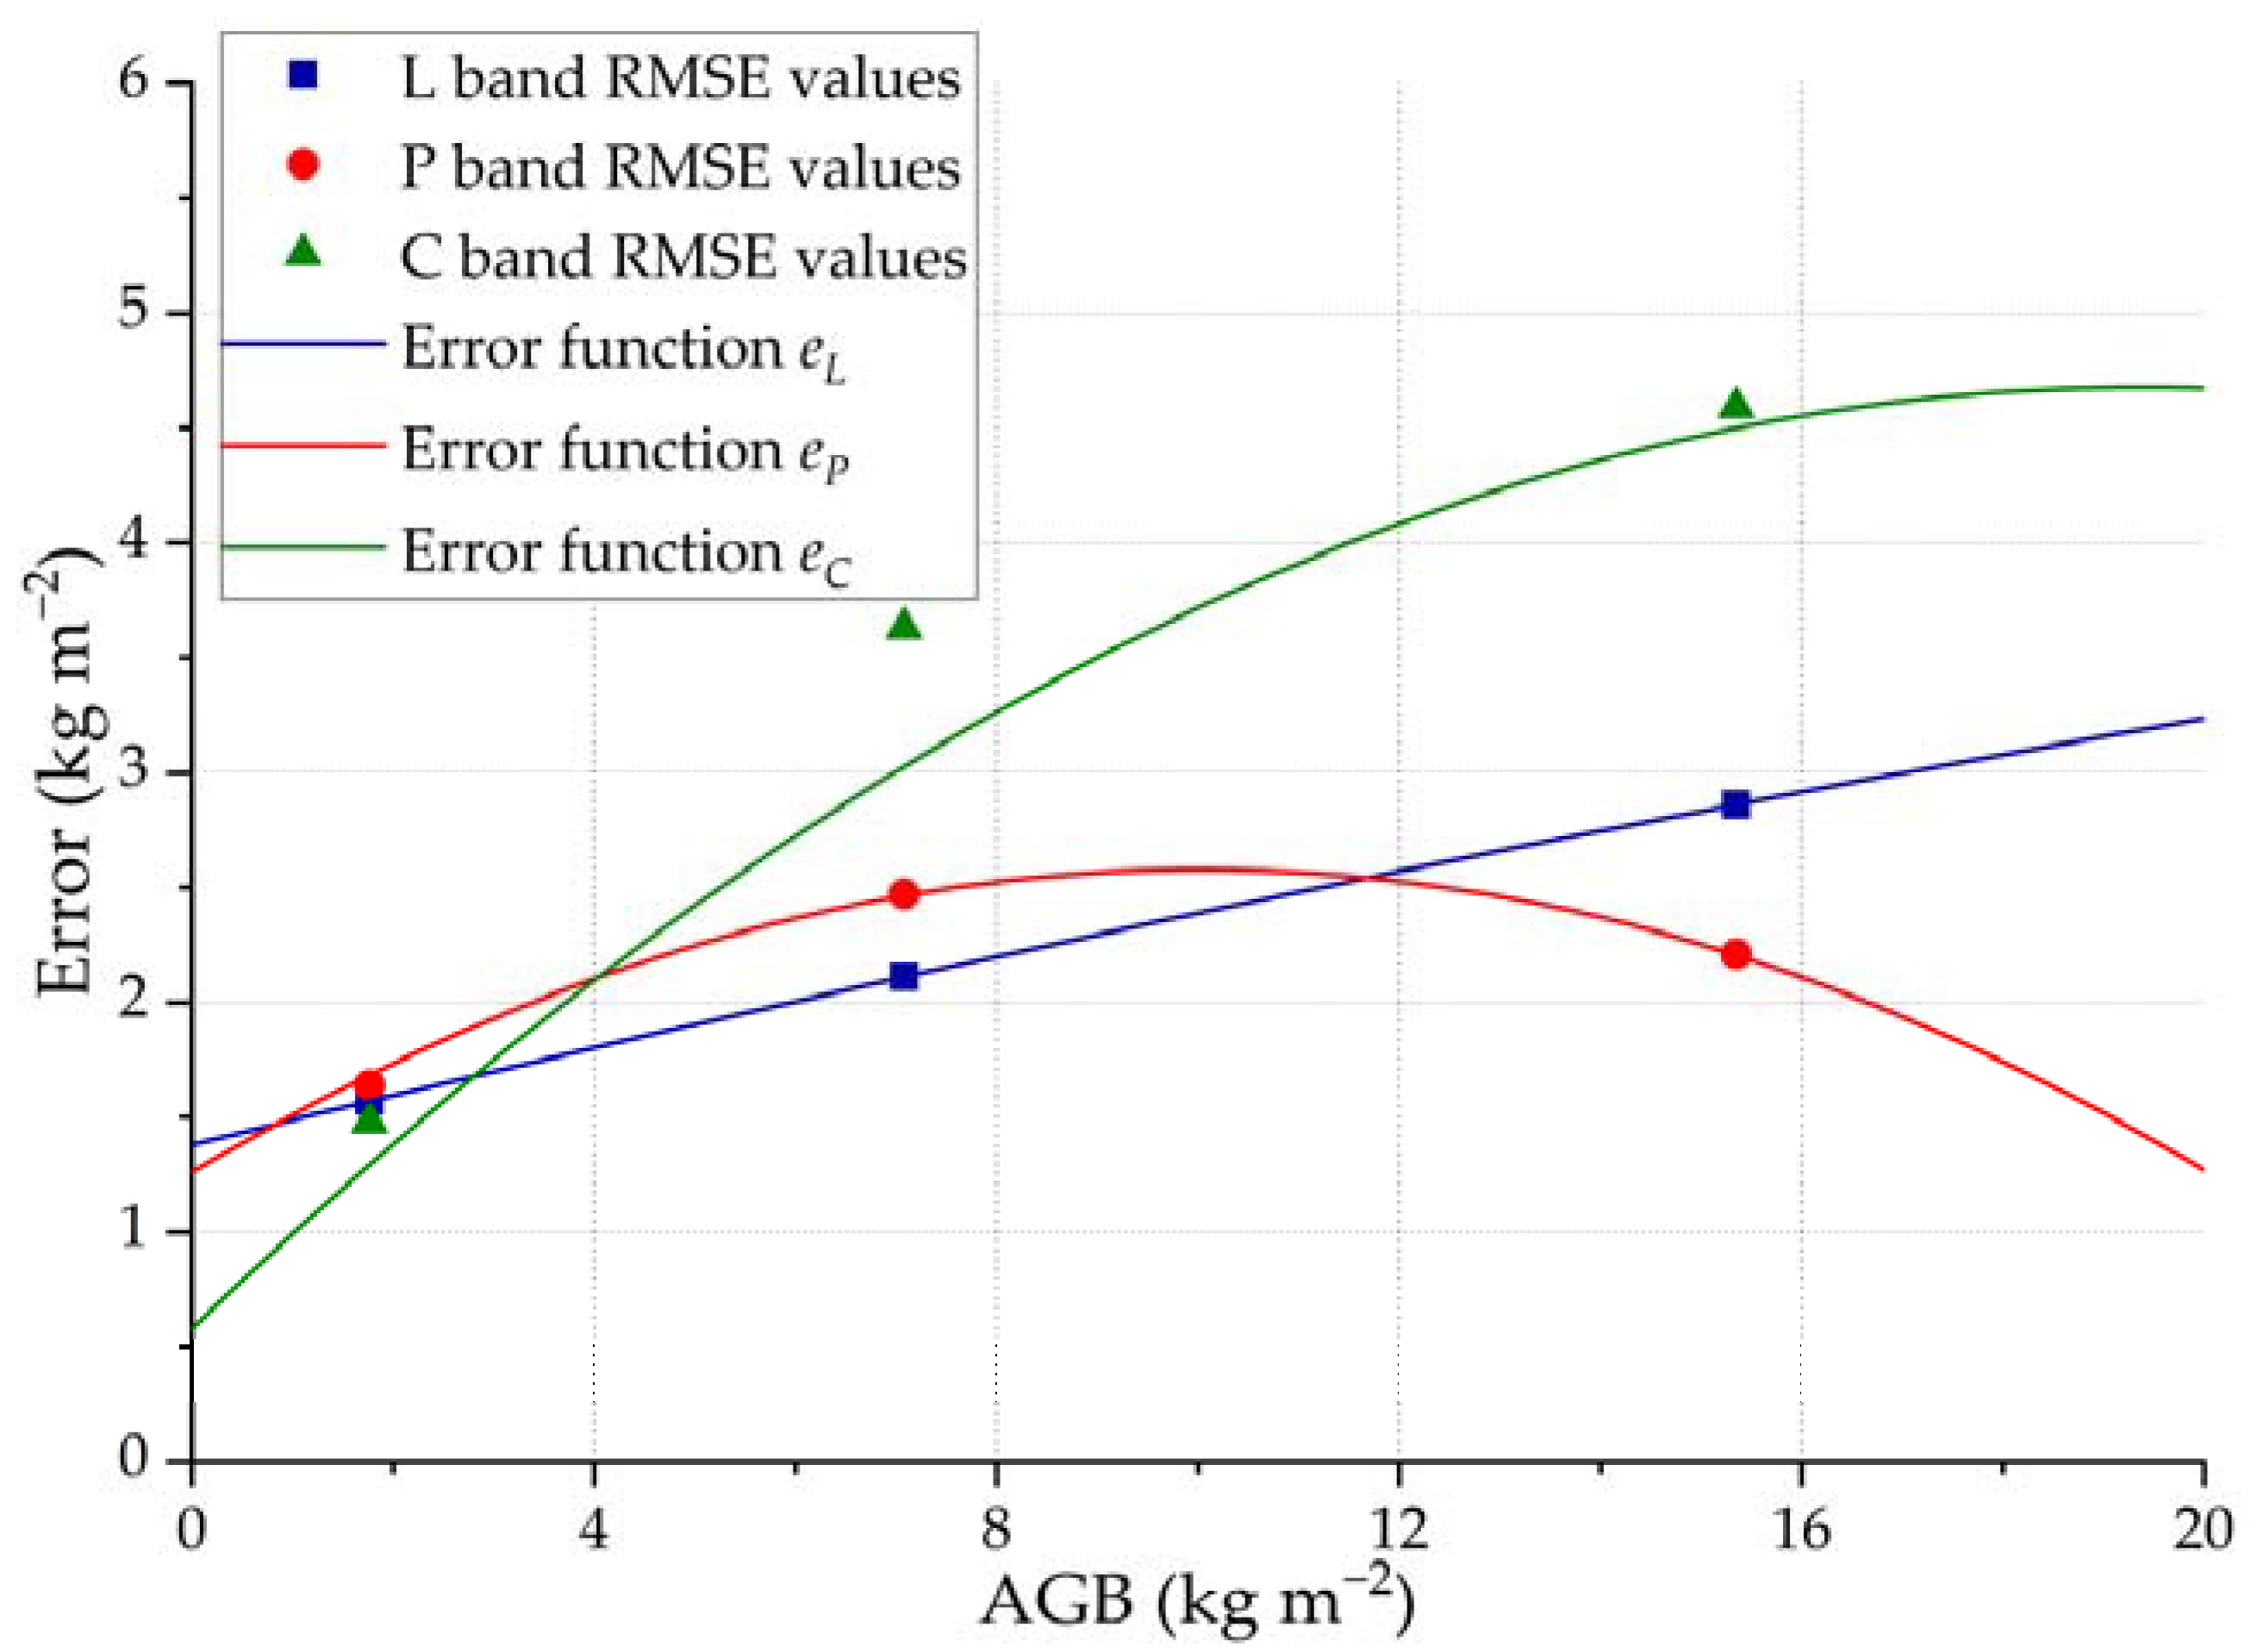
The RMSE criteria and the measured AGB were used to evaluate each single-band AGB model, as described in Section 2.2.4. These results were obtained considering the training dataset. The RMSE values for B L ( σ L ) , B P ( σ P ) , and B C ( σ C ) were calculated over different ranges of AGB and are displayed in Table 5, where it is possible to observe that the models B C ( σ 0 C ) , B L ( σ 0 L ) , and B P ( σ 0 P ) have the lowest RMSE in the ranges 1, 2, and 3, respectively.
Such results show that each single-band model presents better performance in different AGB ranges, which will be exploited in the weighted multi-band model. Figure 10 shows the RMSE values presented in Table 5.
Figure 10 also shows error functions that were estimated from each band RMSE results presented in Table 5. When determining these error functions, it was required that e C ( B C ) should be the function with the lowest error values in Range 1, e L ( B L ) in Range 2, and e P ( B P ) in Range 3. Second-order curve-fitting equations were chosen to model the error functions, and can be expressed as:
e L ( B L ) = 0.00081 B L 2 + 0.1089 B L + 1.38 ,
e P ( B P ) = 0.01313 B P 2 + 0.2631 B P + 1.26 ,
e C ( B C ) = 0.01090 B C 2 + 0.4226 B C + 0.5801 .
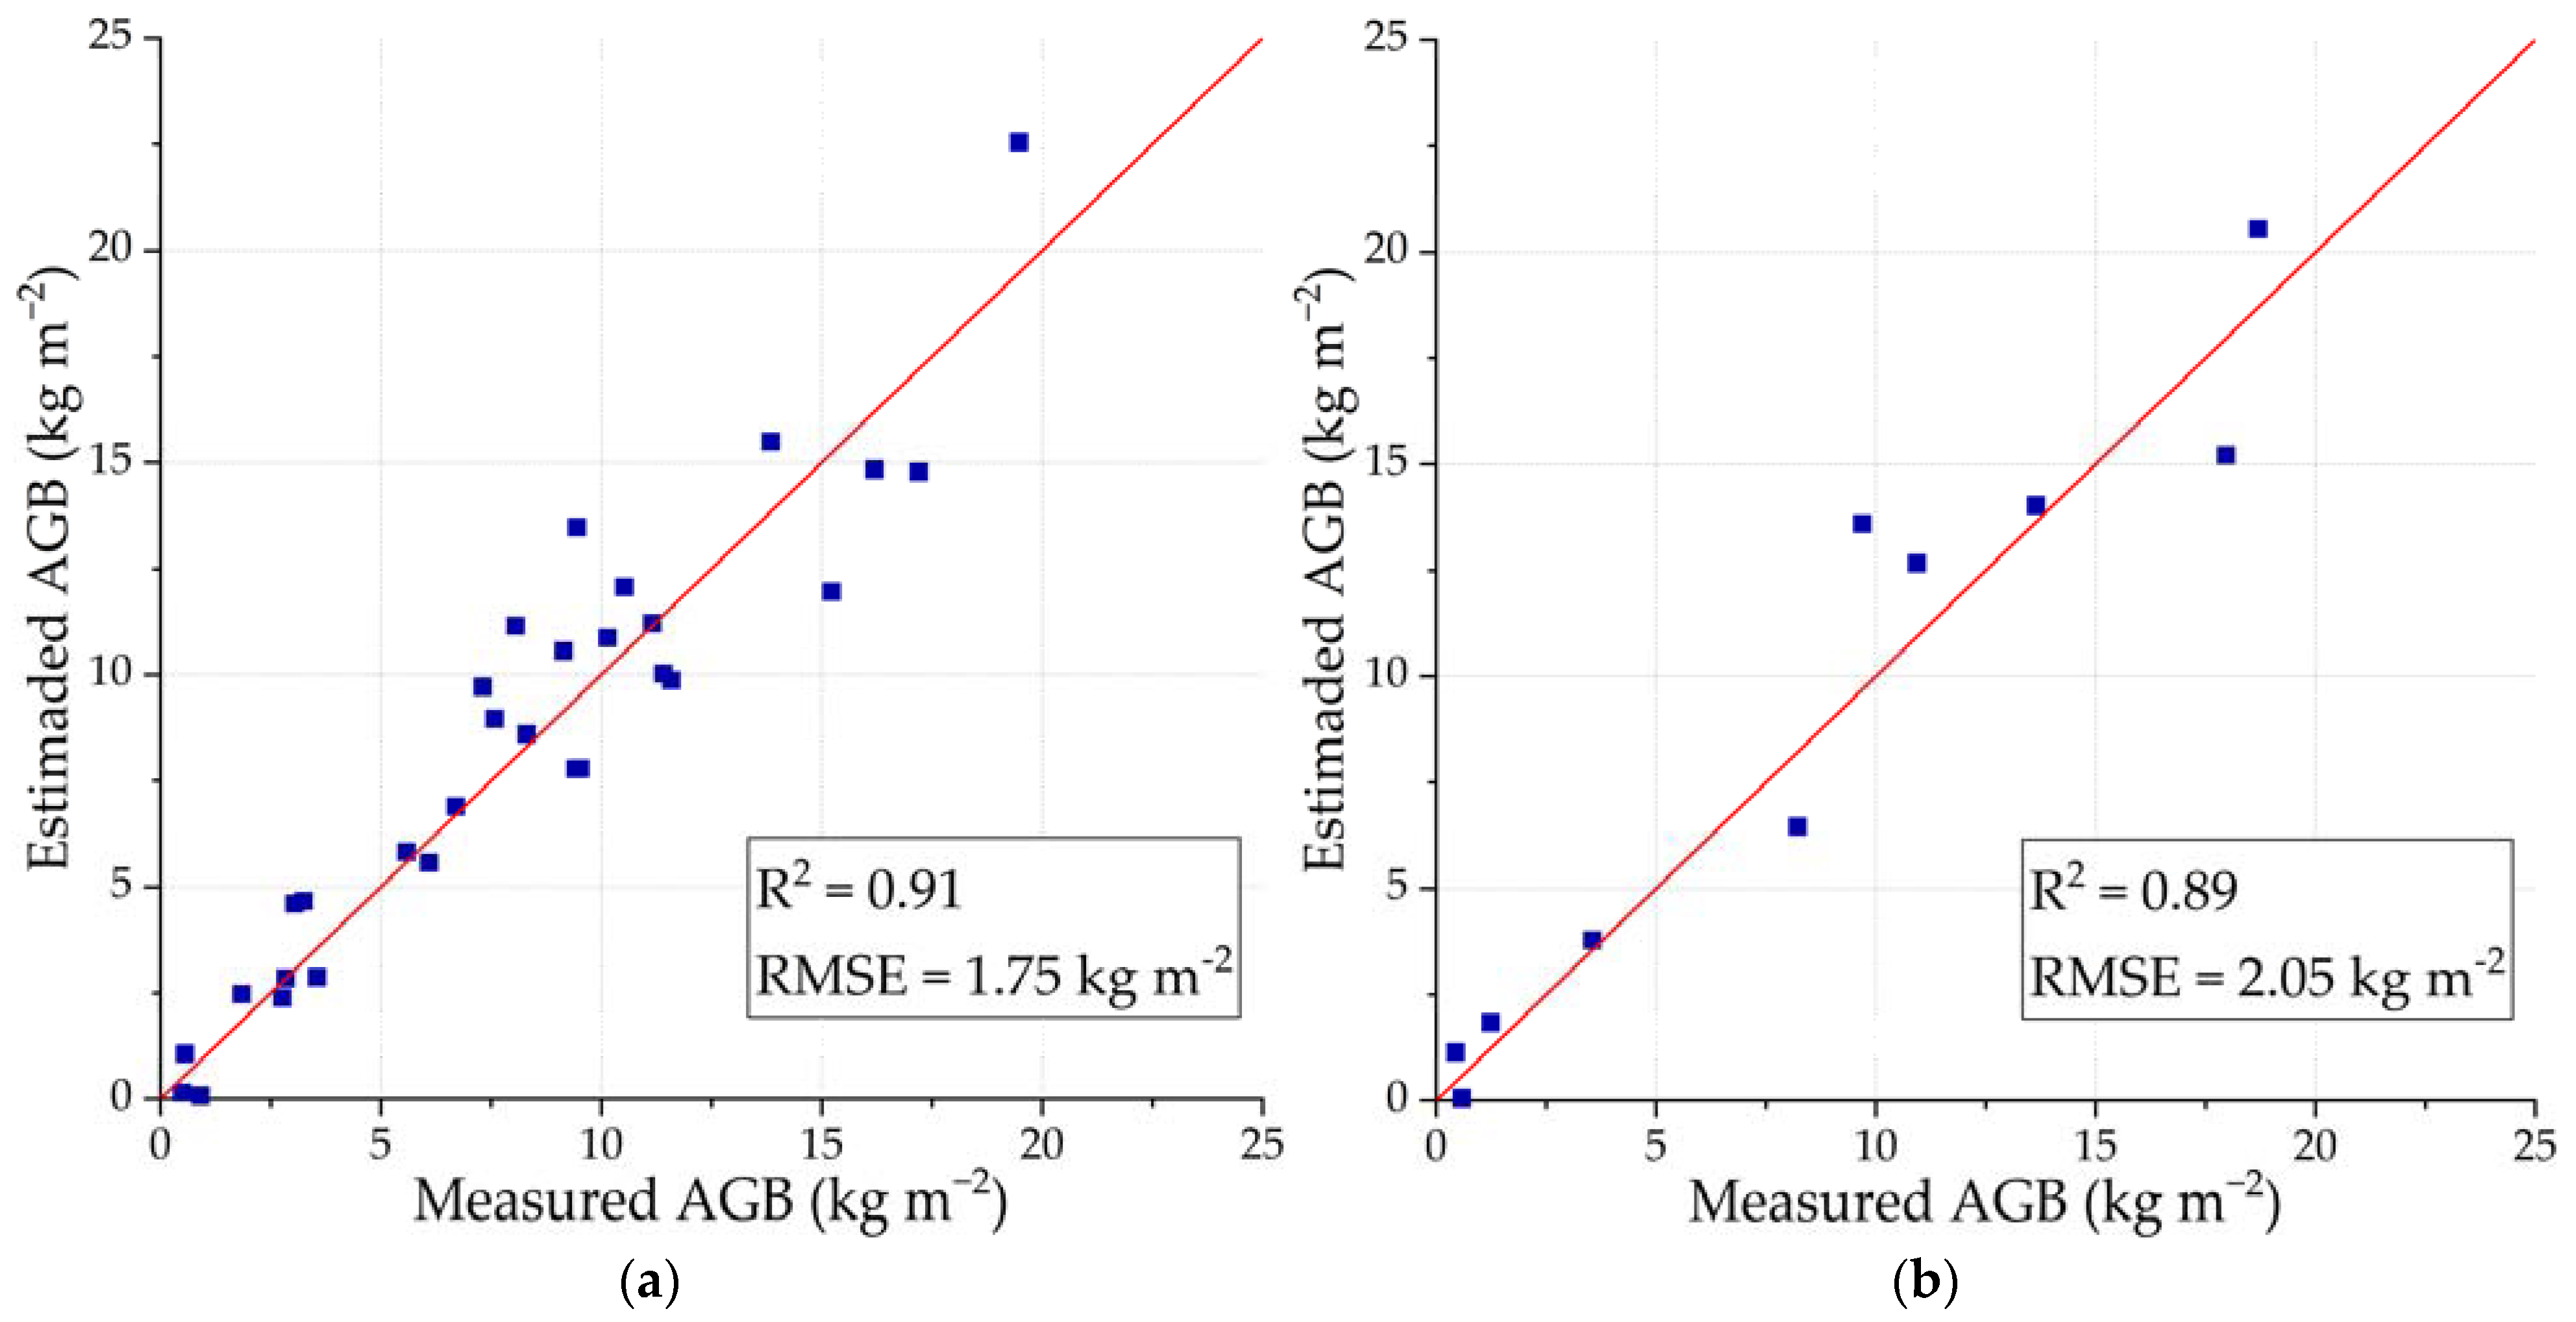
These error functions are used to weight the single-band AGB models to finally obtain A G B e ( σ L , σ P , σ C ) , according to Equations (2)–(5). The weighted-band AGB model achieved an RMSE of 1.75 kg m−2 and an R2 of 0.91 for the training dataset. For the validation dataset, an RMSE of 2.05 kg m−2 and an R2 of 0.89 were achieved. Figure 11 shows estimated AGB versus measured AGB for training and validation datasets.
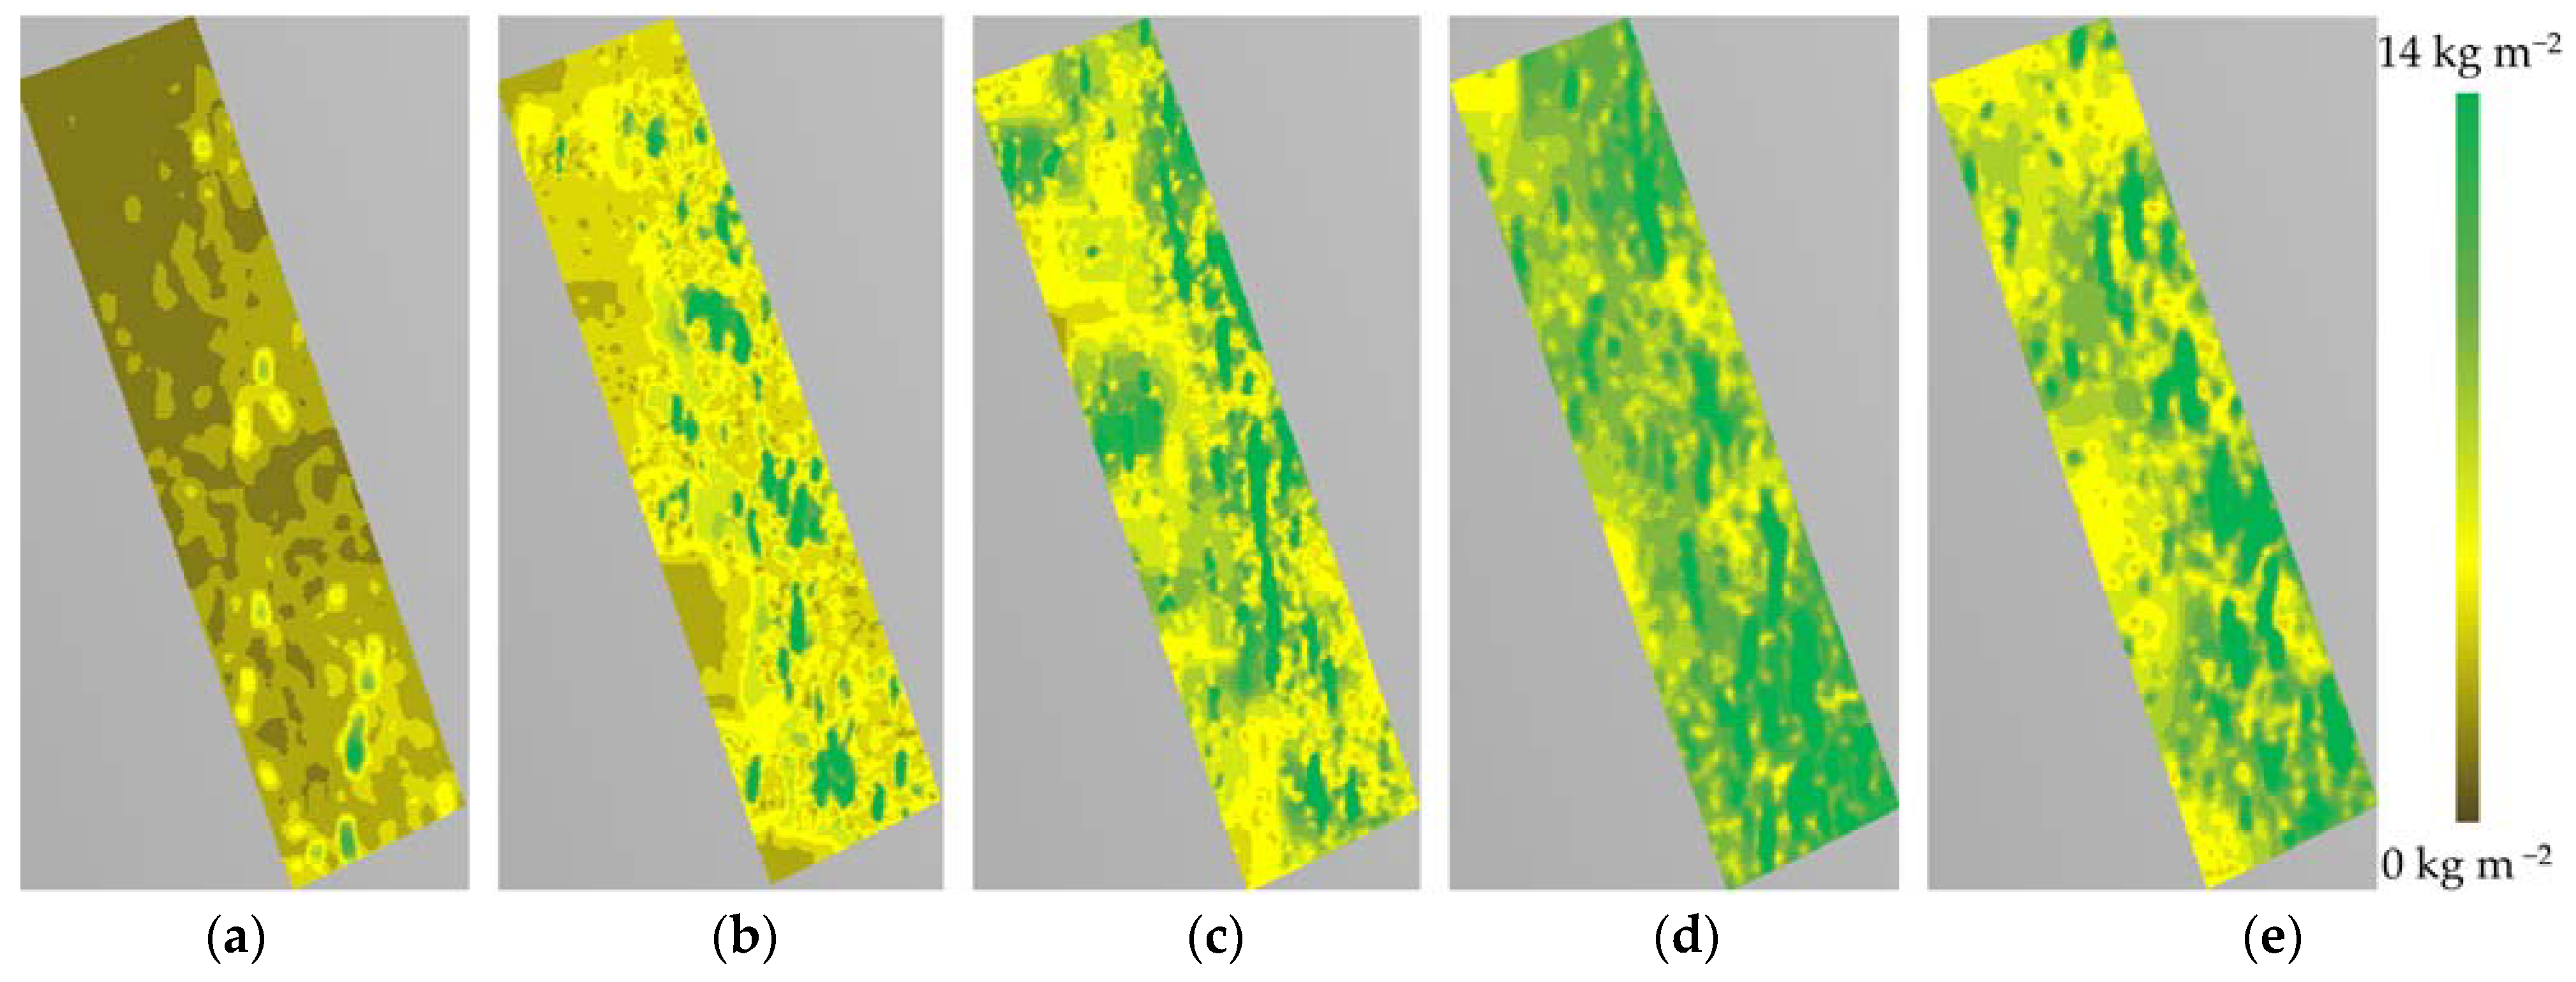
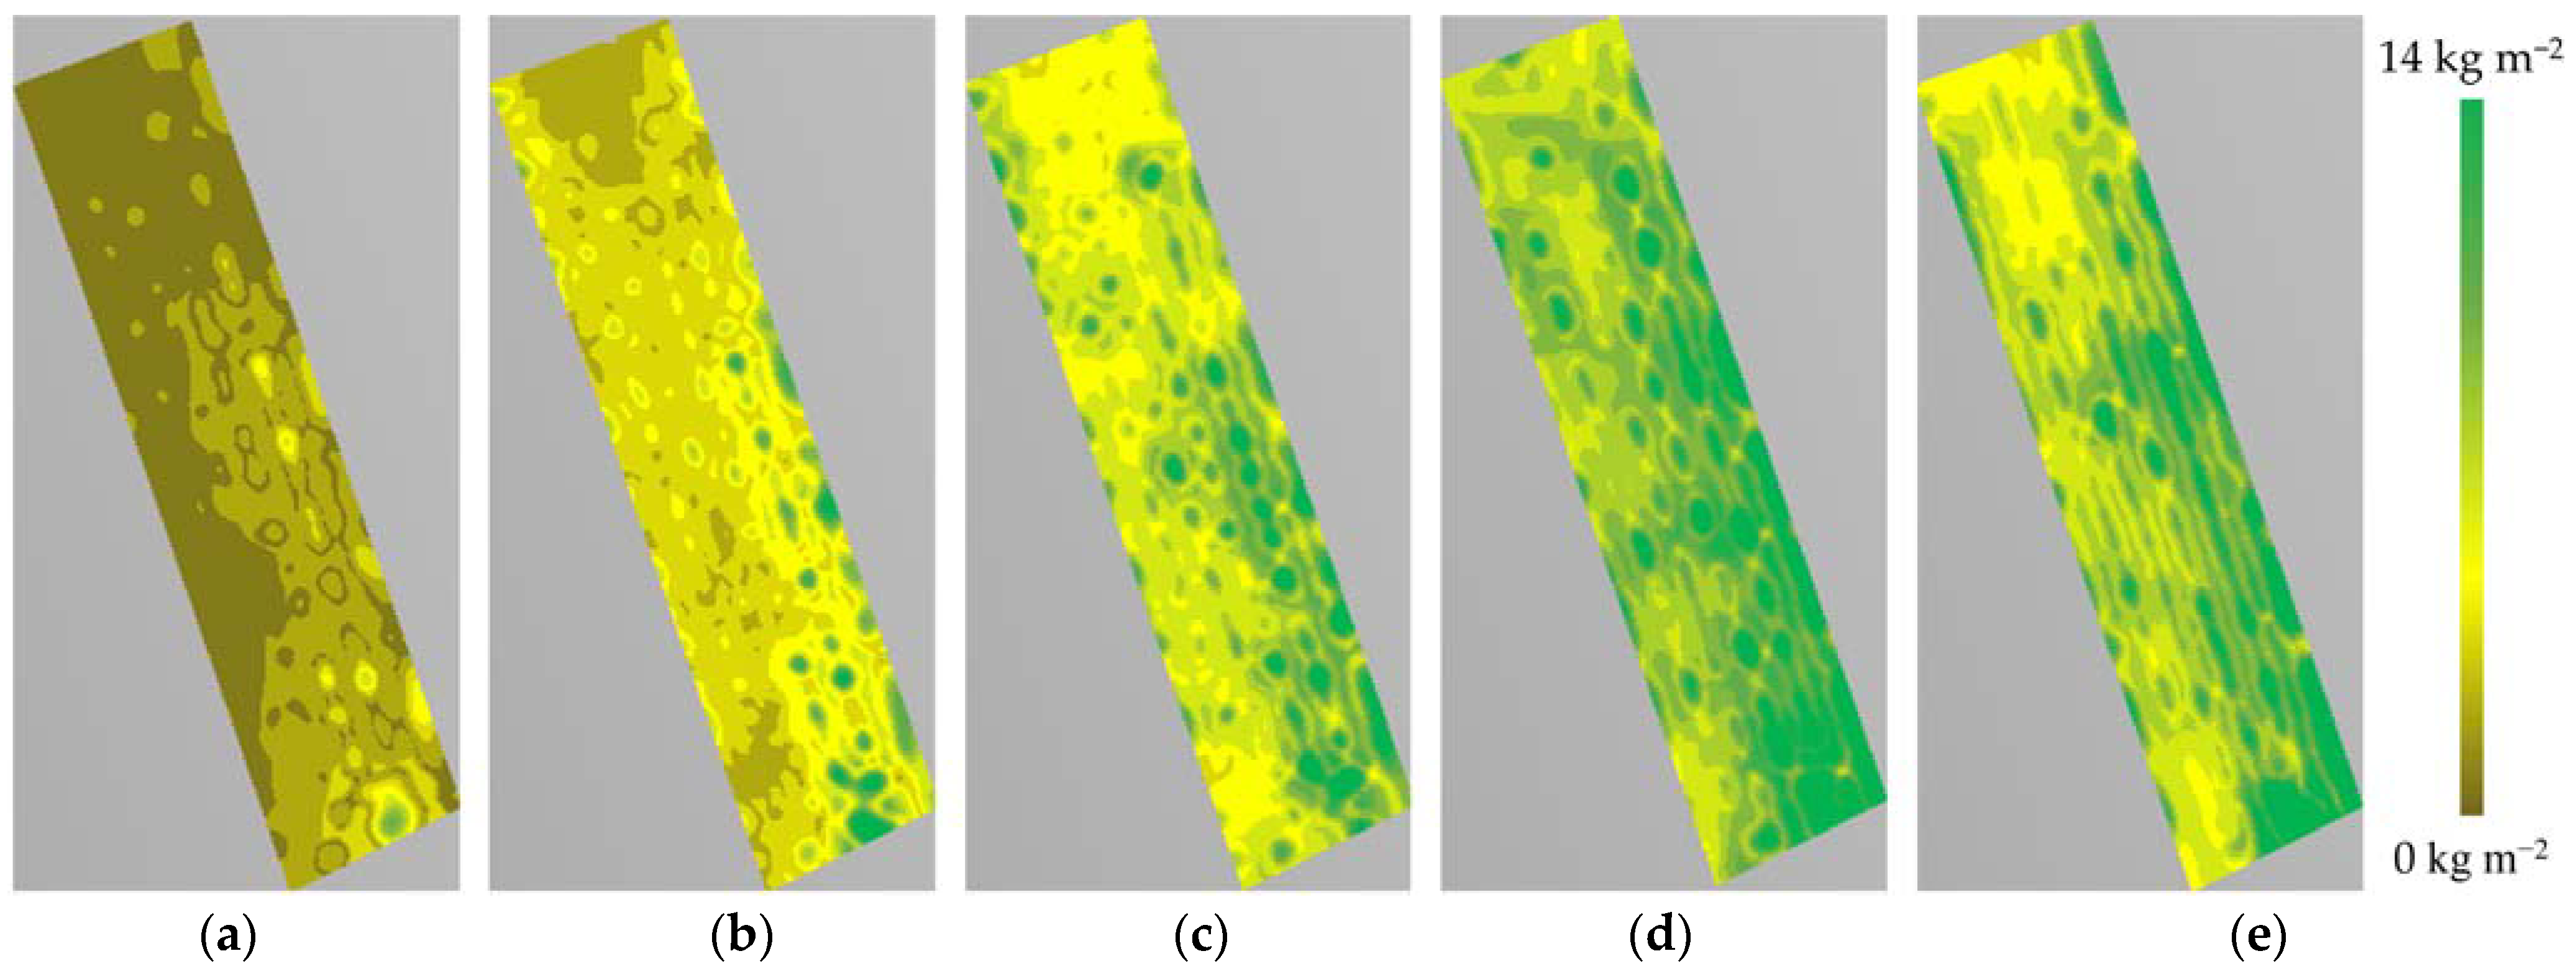
Estimated AGB maps of the experimental area over time are generated from the L, P, and C band SAR images and the weighted-band AGB model. The measured AGB of each plant in the experimental area was interpolated to generate the respective measured AGB maps. Figure 12 and Figure 13 show the estimated and measured AGB maps from 19 December 2019 to 12 May 2020.
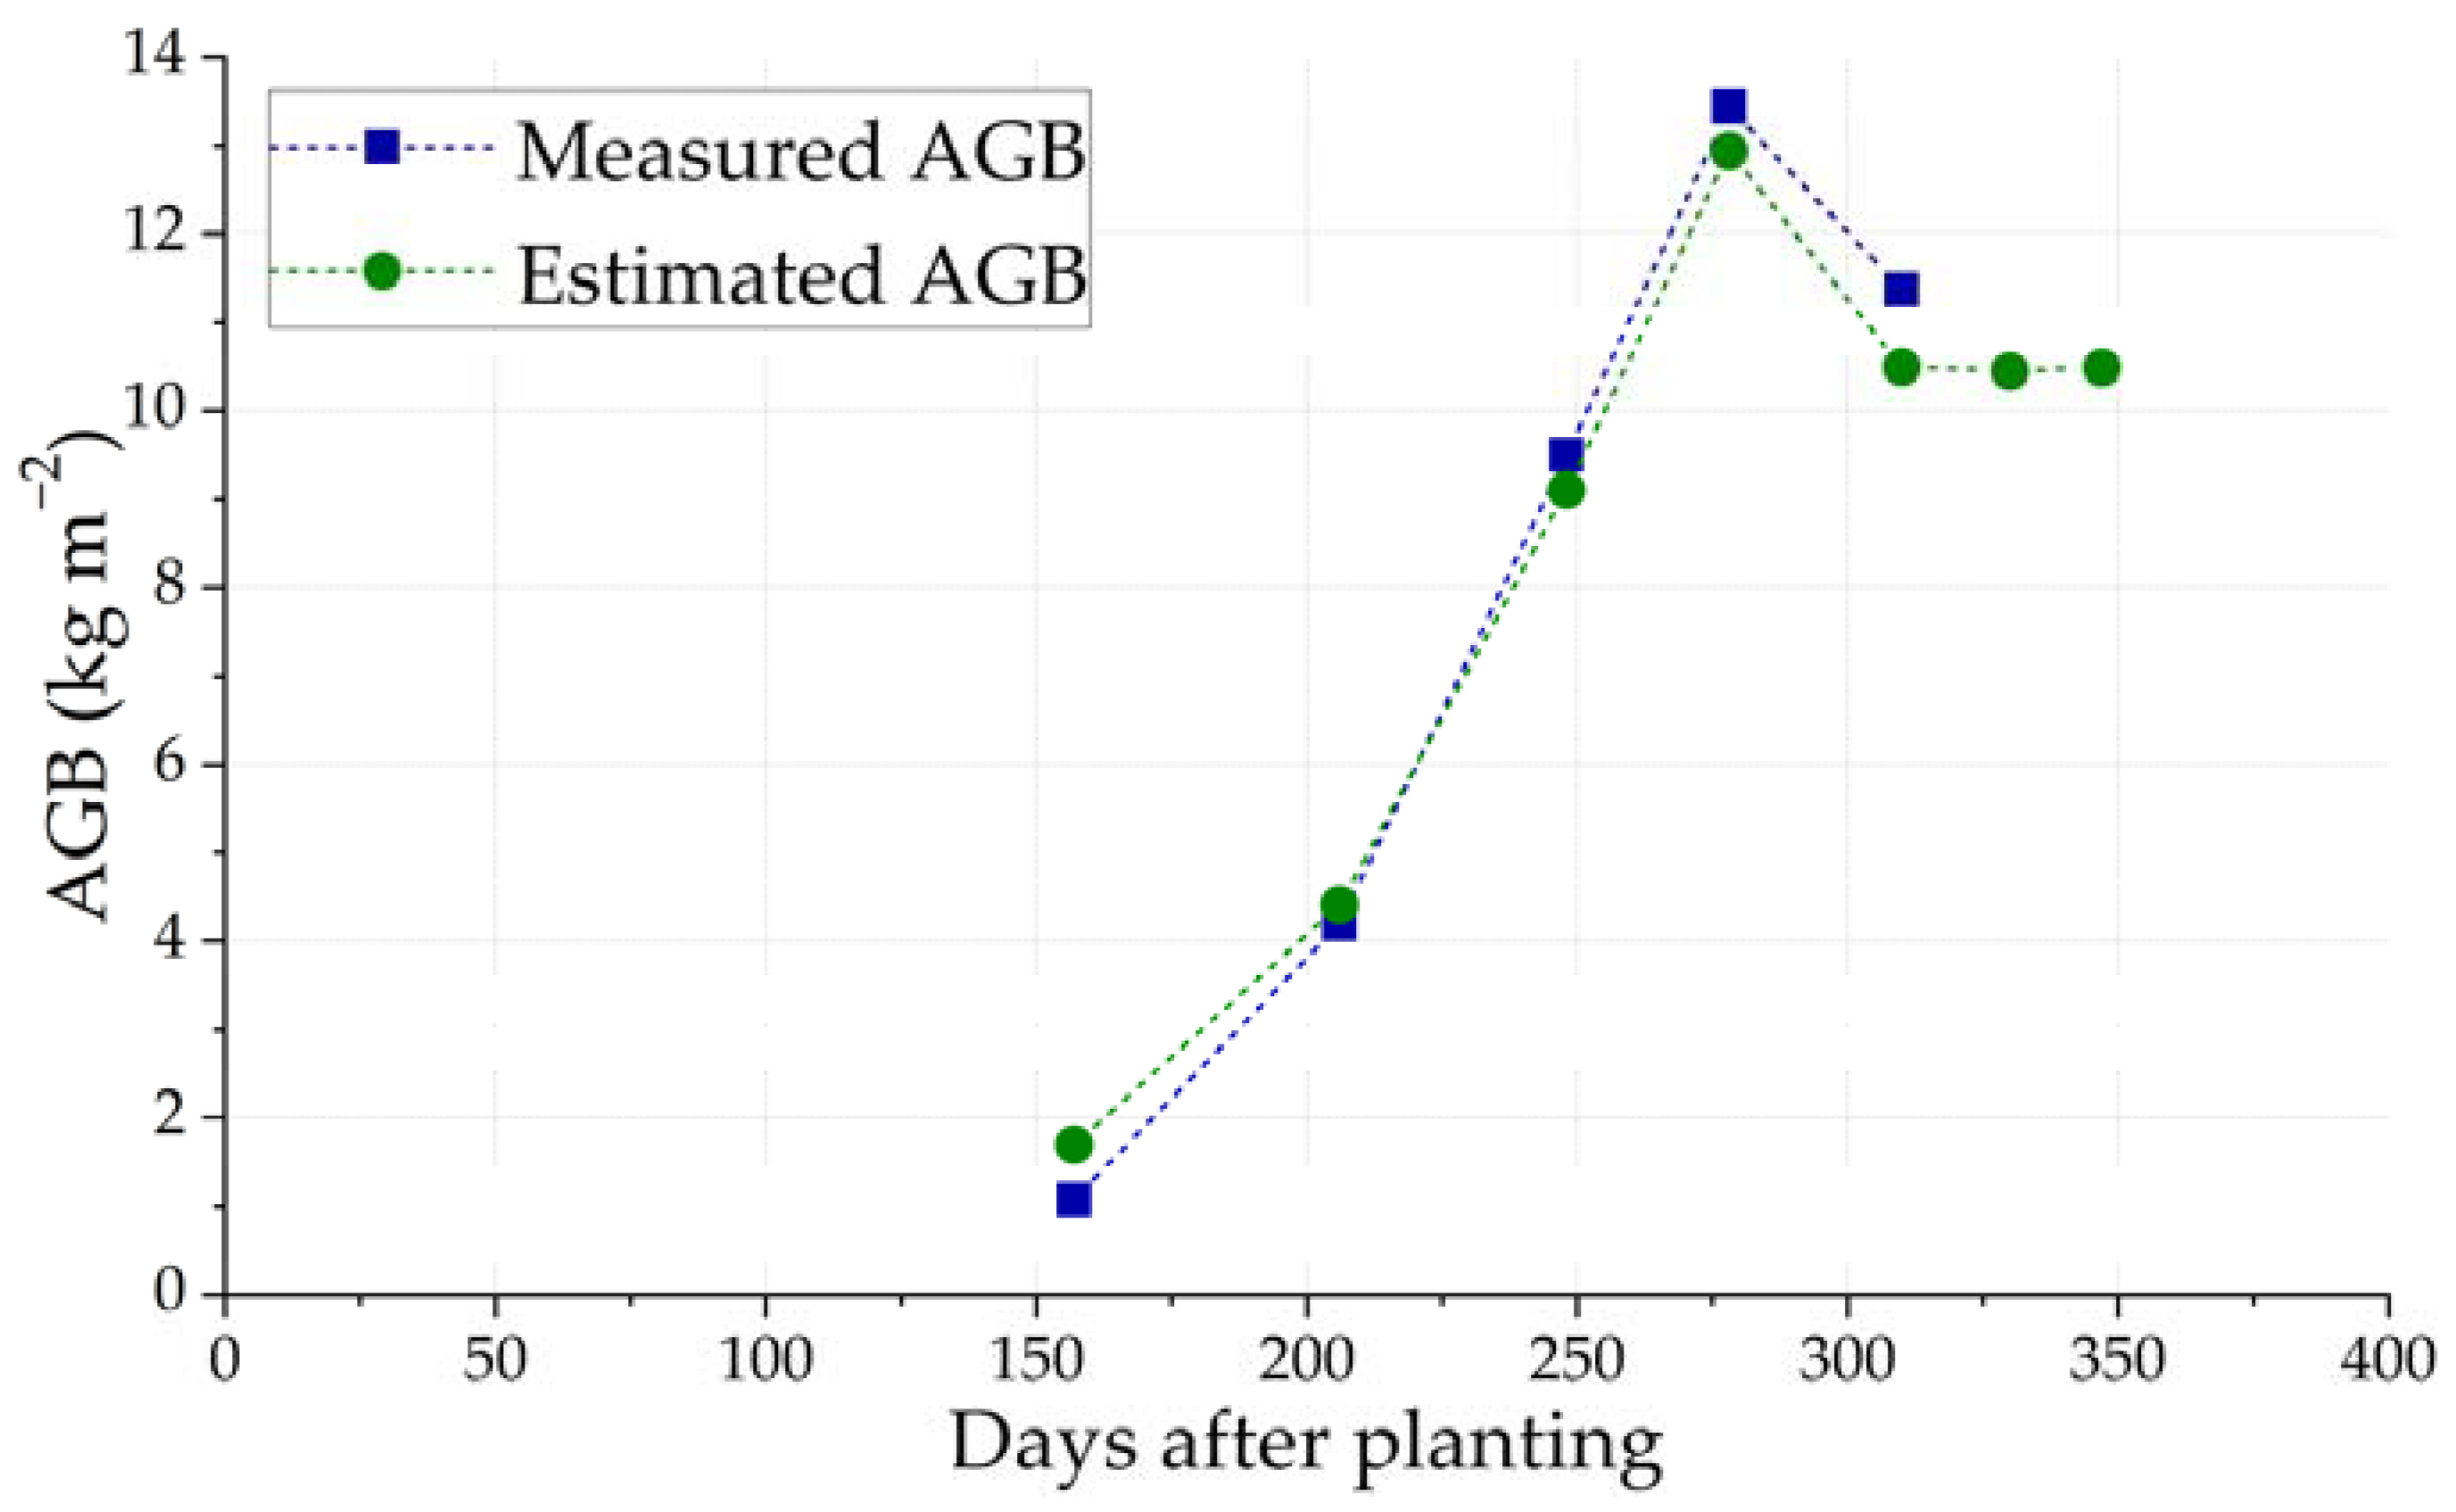
Figure 14 presents the average AGB based on the estimated and measured AGB maps throughout the time, retrieved from the maps plotted in Figure 12 and Figure 13.
Due to the similarity between the measured and estimated AGB, as observed in Figure 14 and manifested in the obtained RMSE and R2 values, the estimated AGB could be used to obtain an AGB curve characteristic of the experimental area.

3.2.3. Test Site

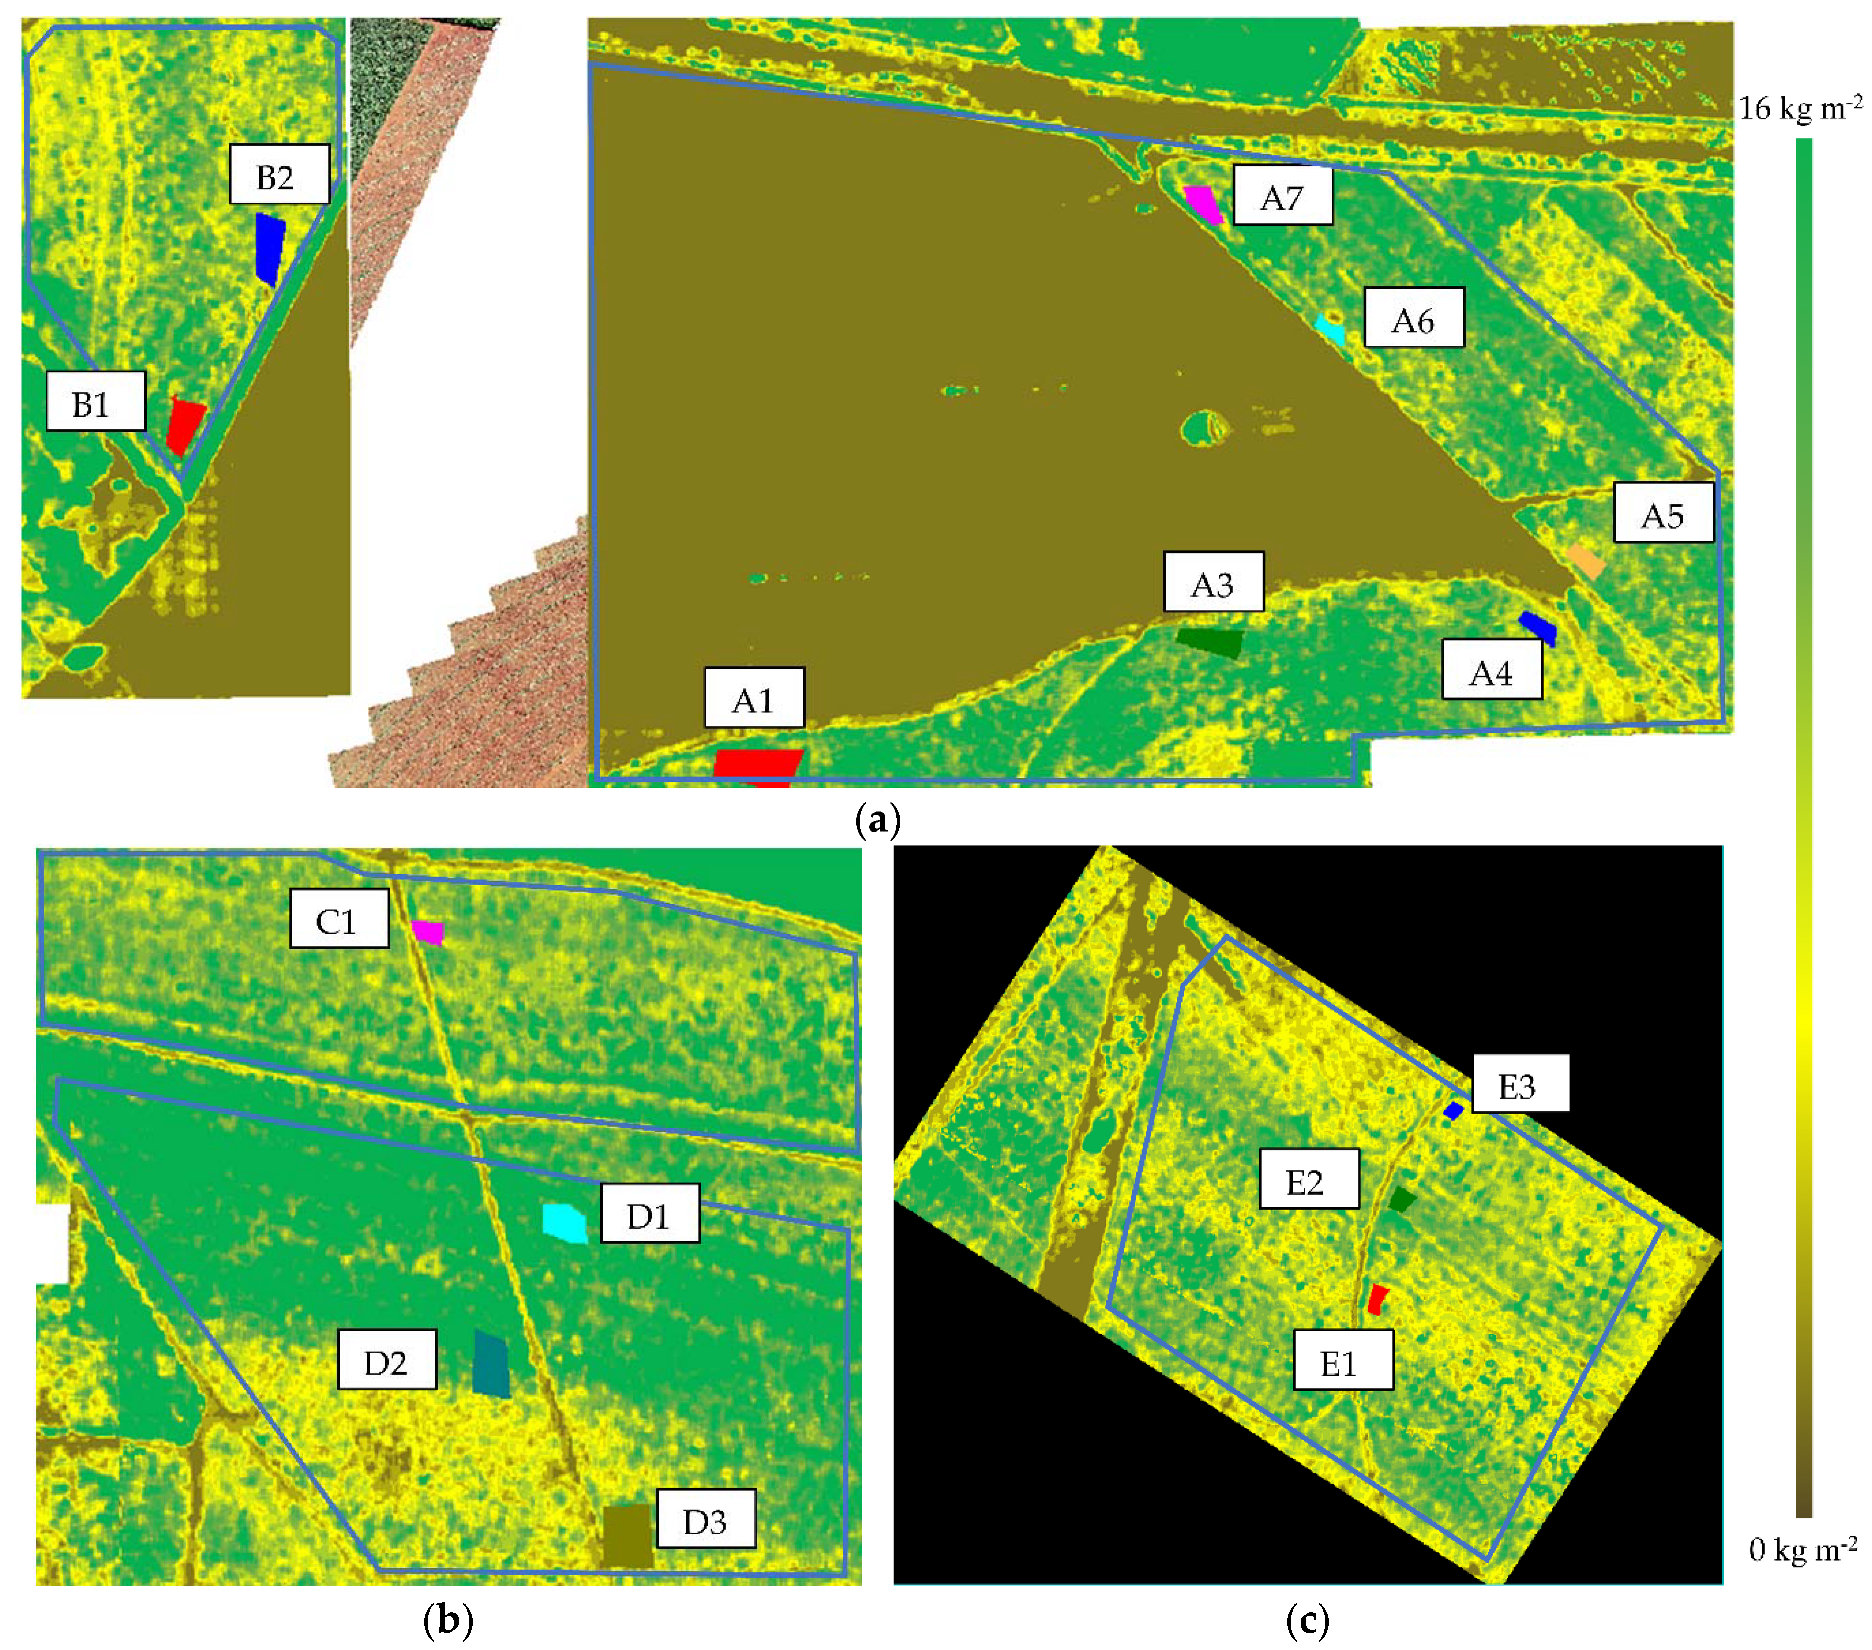
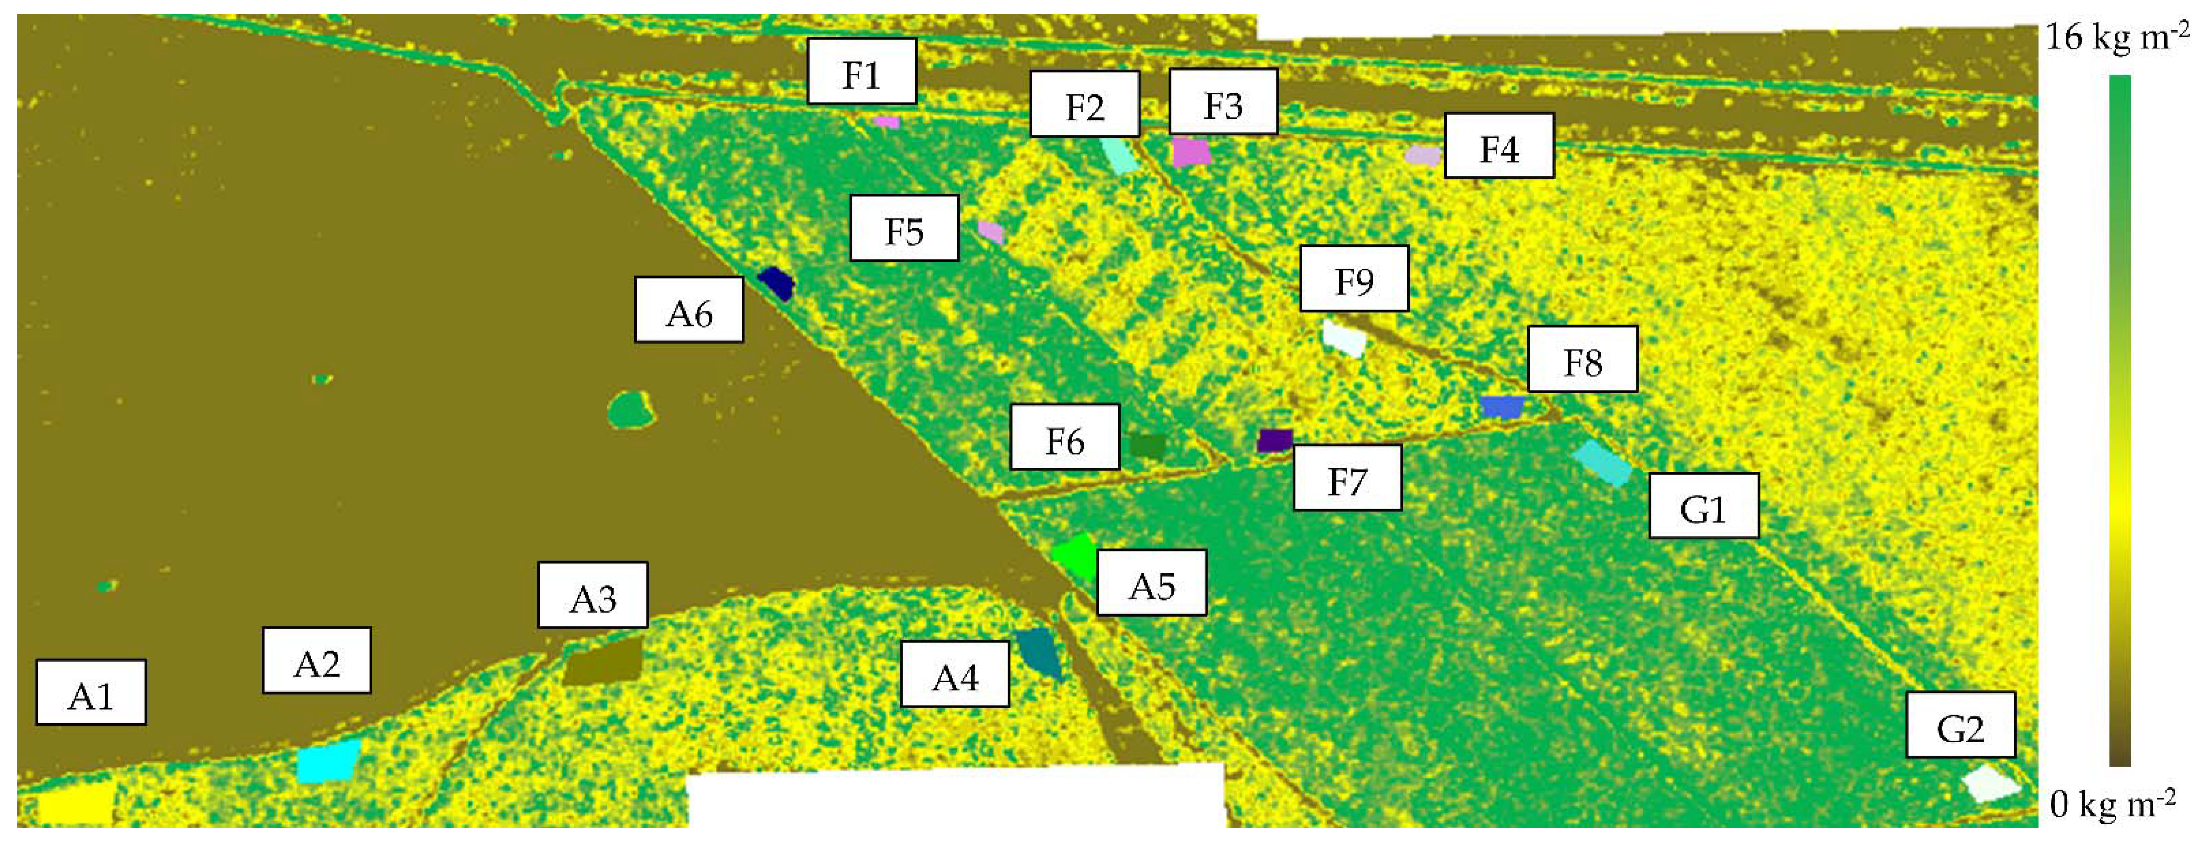
Survey flights were carried out over areas 1 through 5 in the test site on 9 April 2020, and the estimated AGB maps were generated using the band-weighted AGB model. In order to evaluate the results, biometric measurements were taken in 15 sections over areas 1 through 5 to provide the measured AGB. Figure 15 shows the estimated AGB maps for the surveyed areas with the 15 sections indicated.
Figure 16 shows a comparison between measured and estimated AGB for the 15 sections indicated in Figure 15.
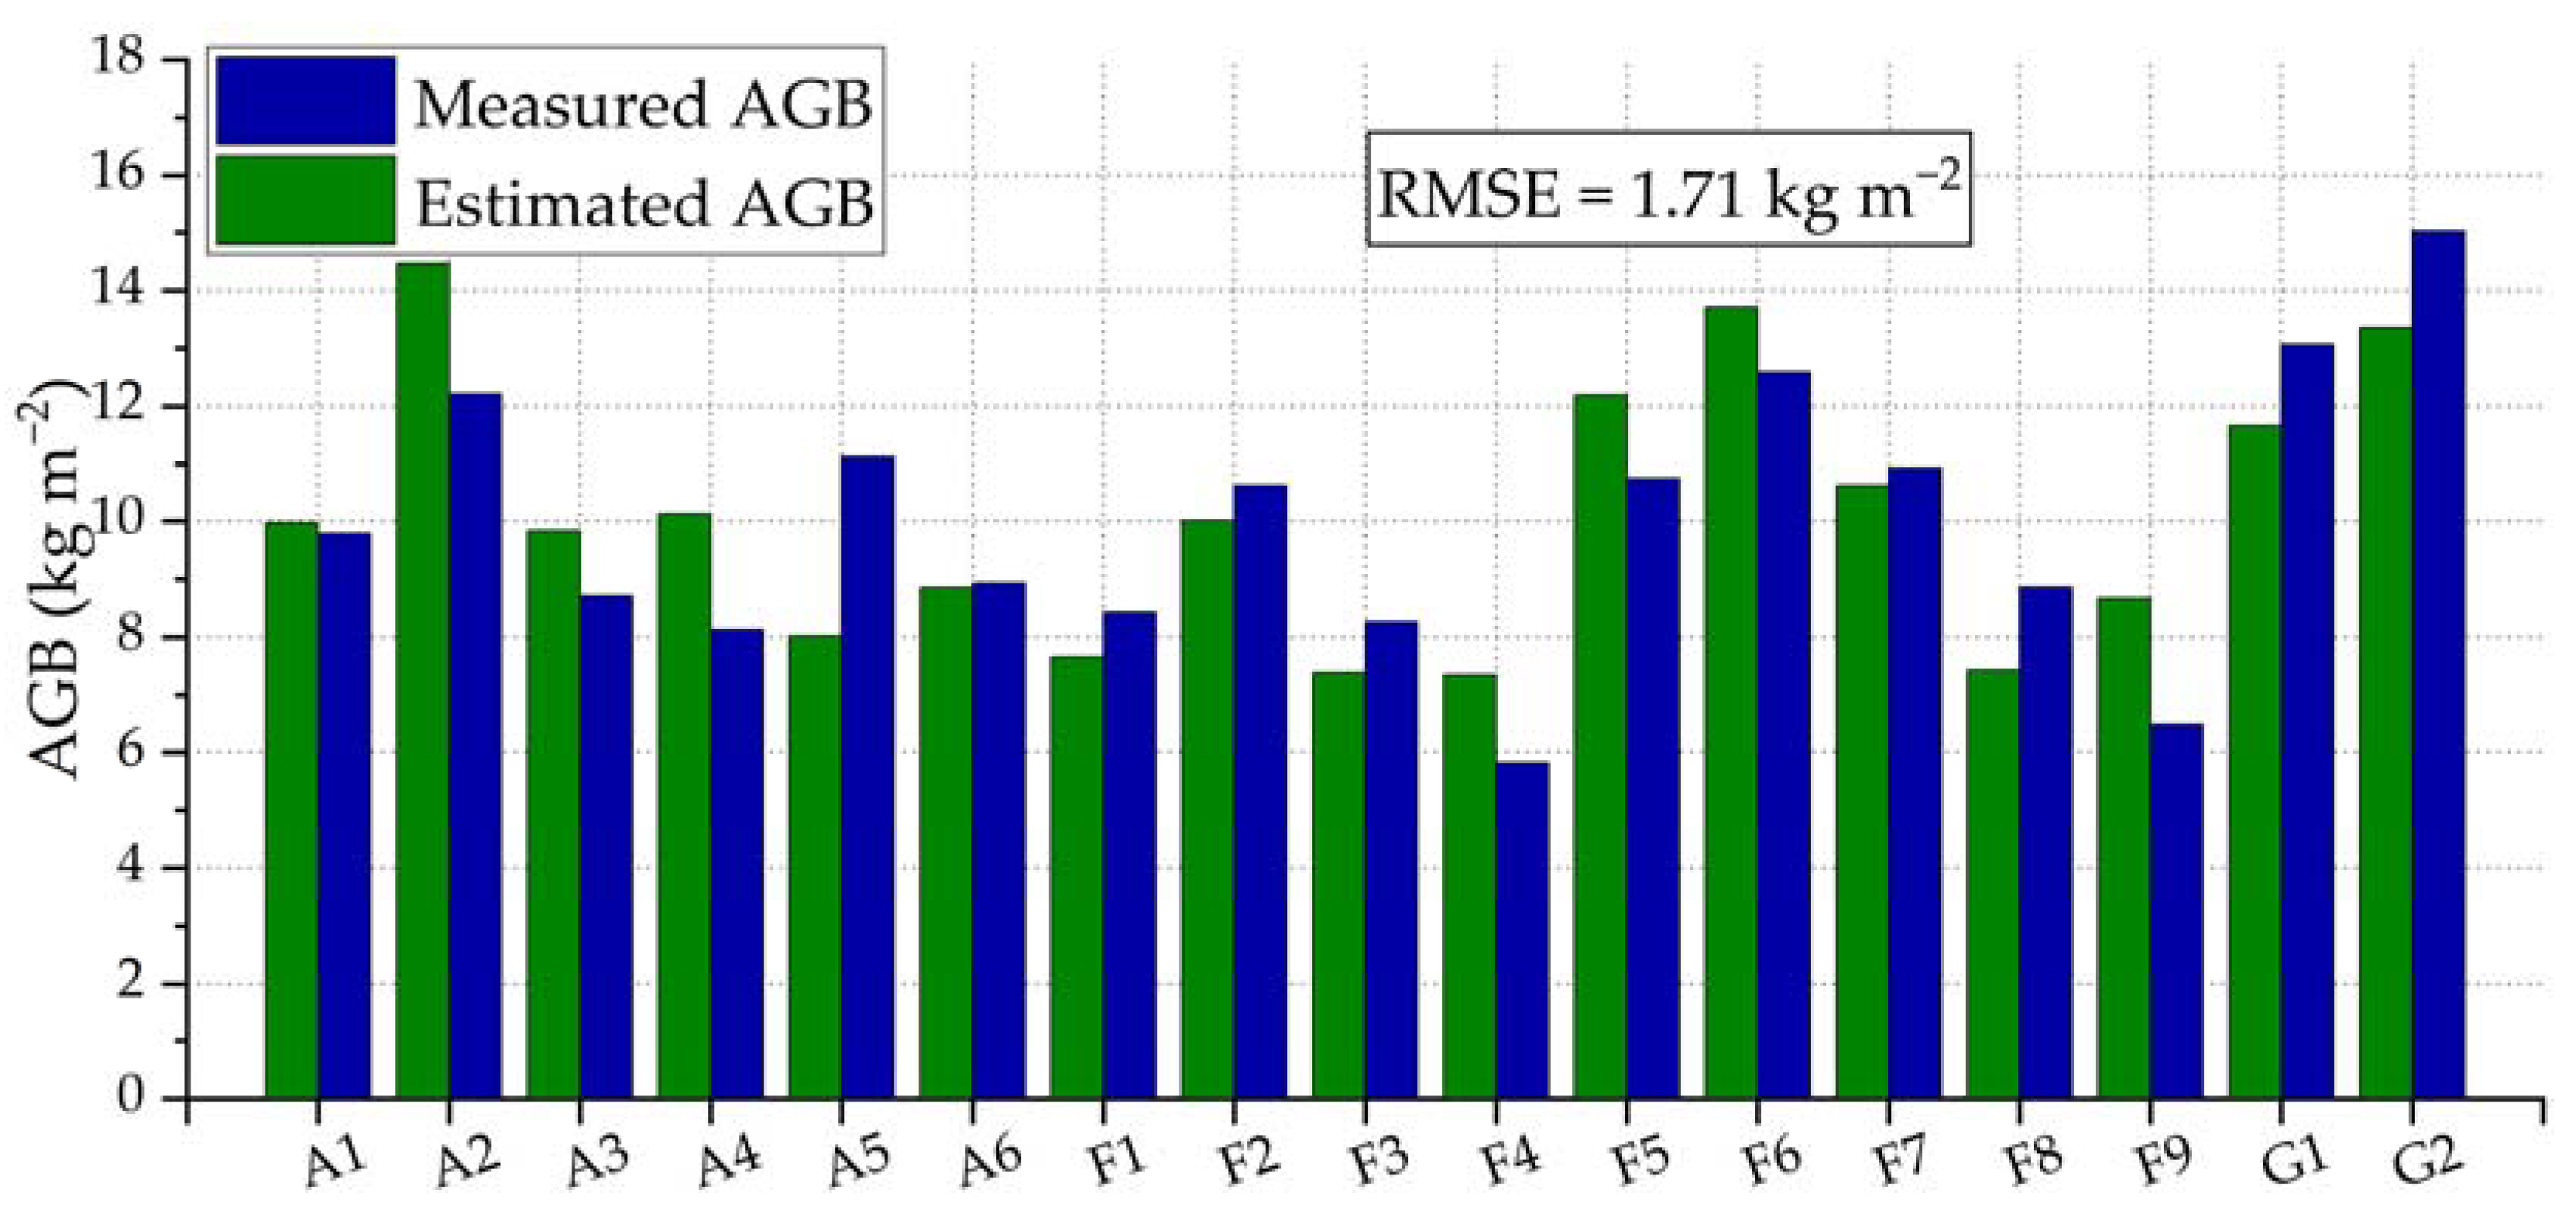
Additional survey flights were carried out on 16 July 2020 over areas 1, 6, and 7, and measured AGB was also obtained in 17 selected sections. The estimated AGB map generated by the band-weighted AGB model, as well the 17 selected sections, are shown in Figure 17.
Figure 18 presents the comparison between measured and estimated AGB for the section displayed in Figure 17.

3.3. AGB Curve Adjustment

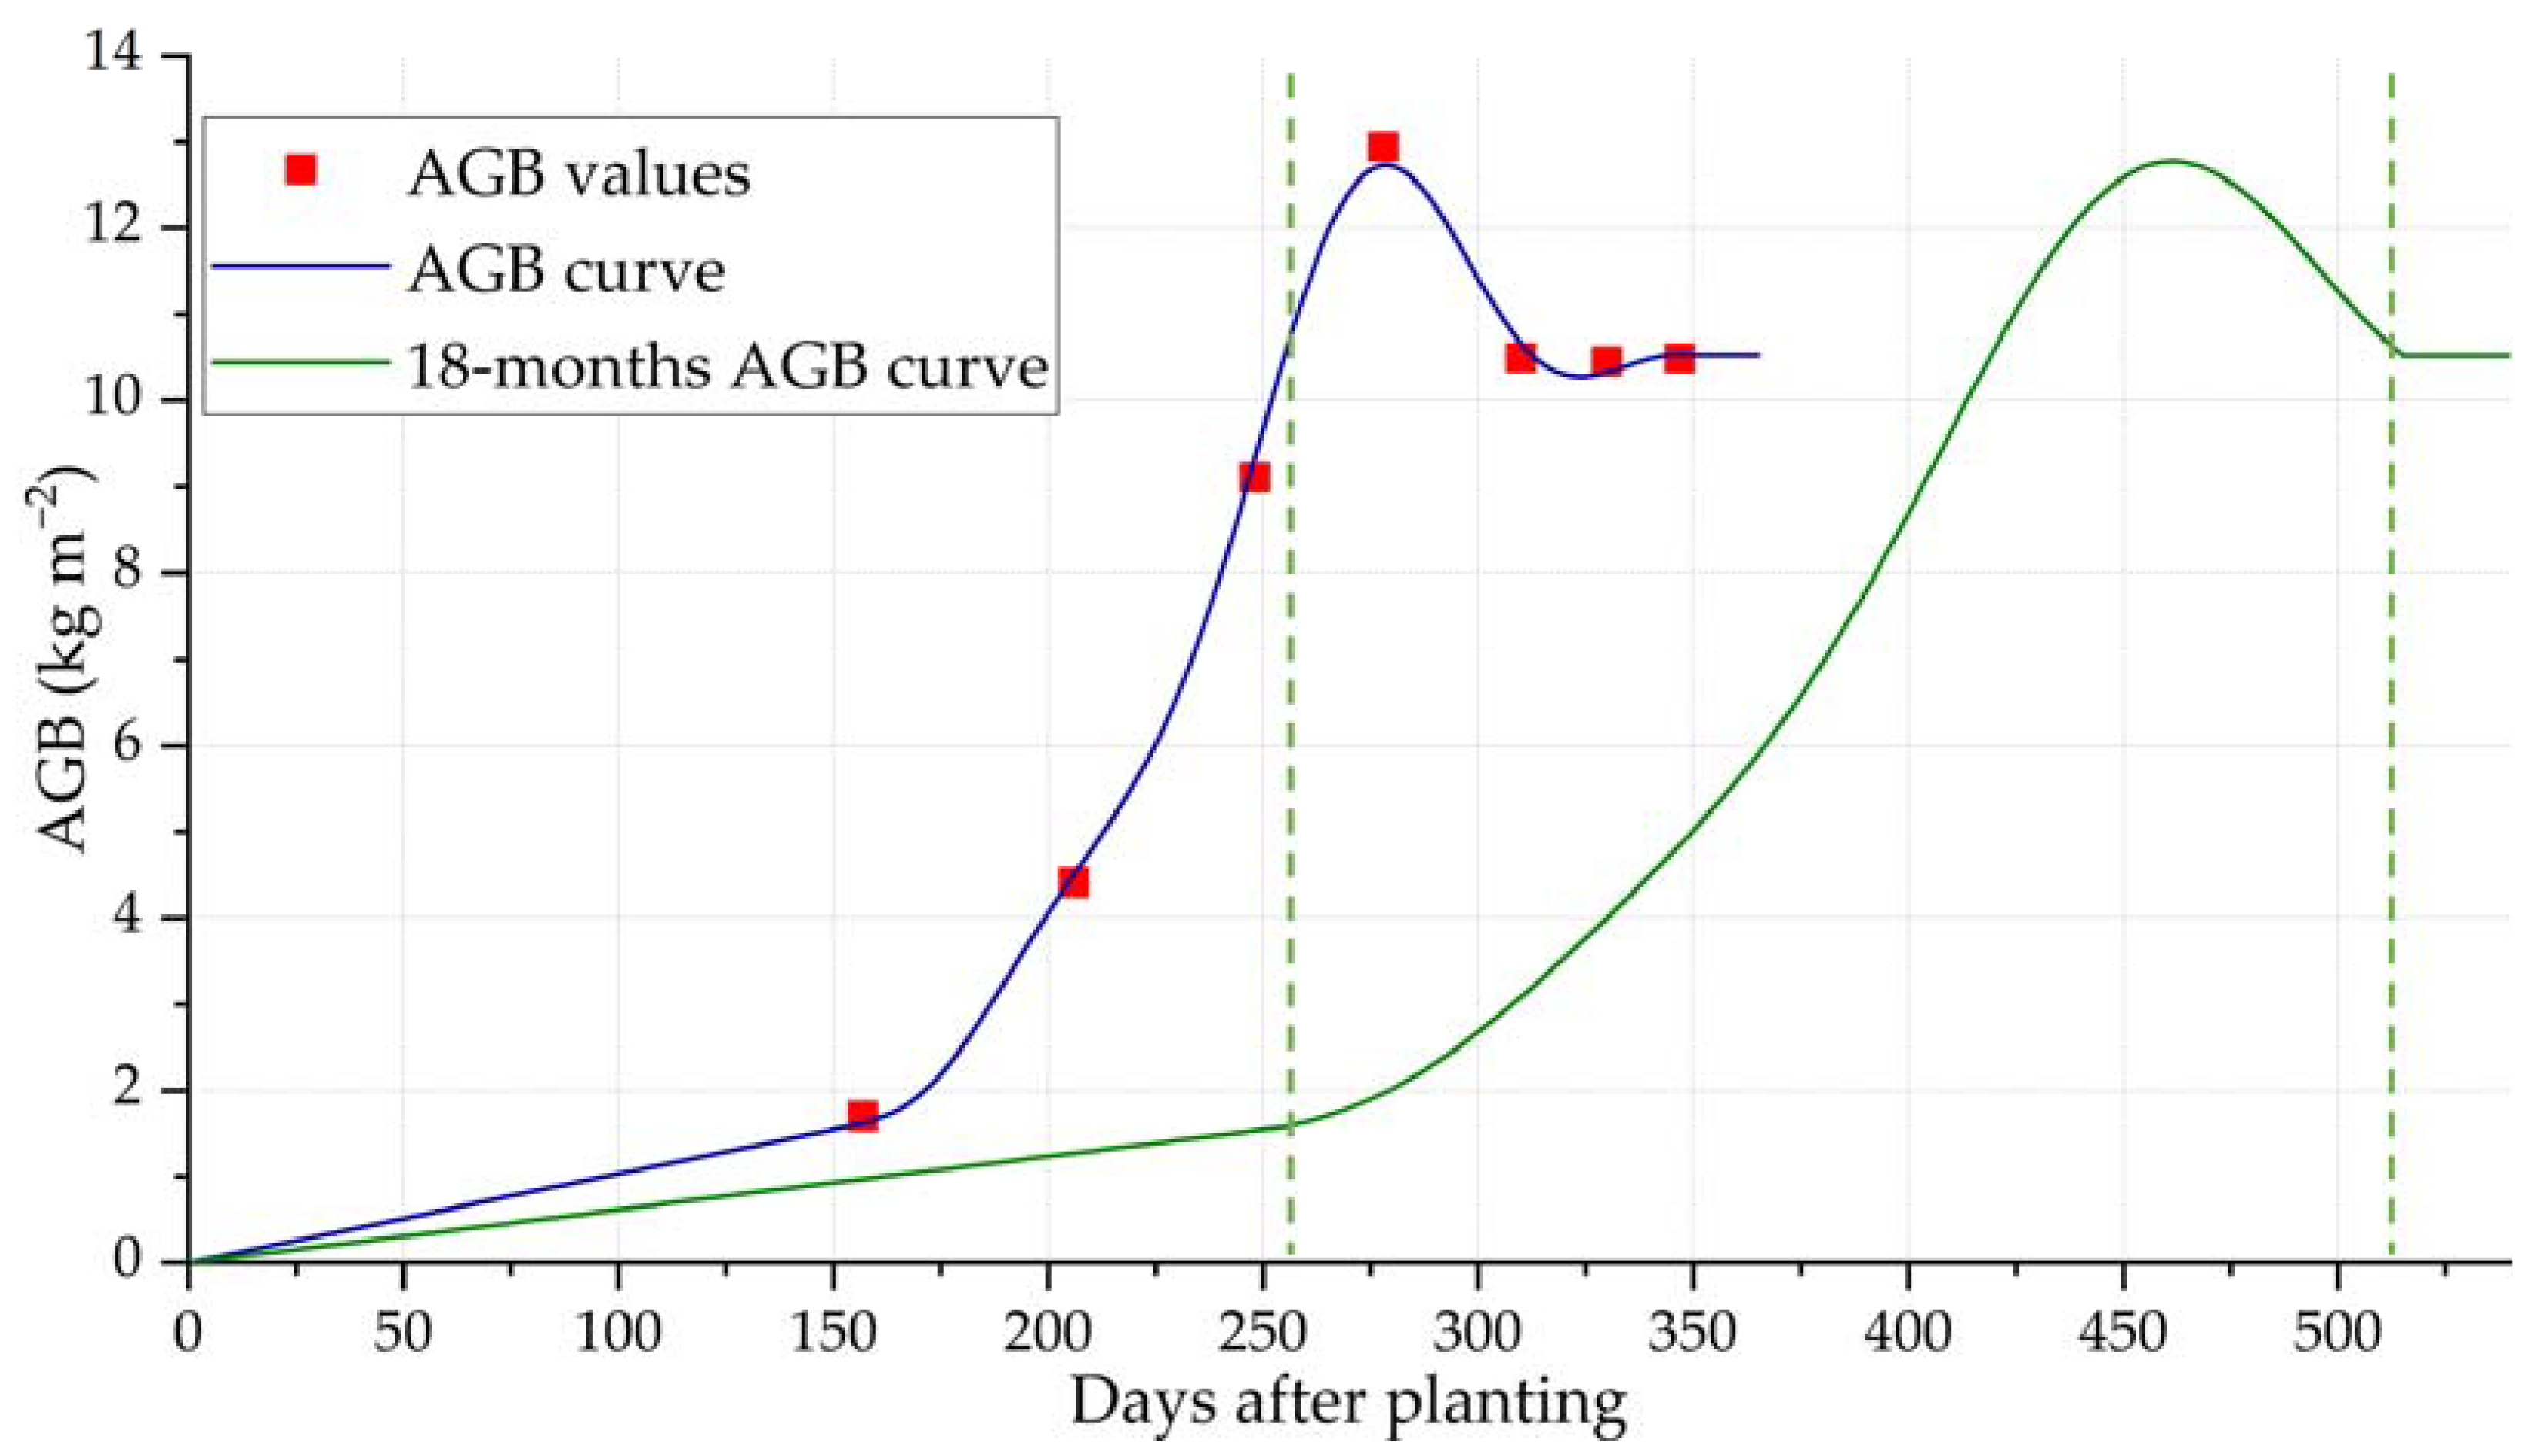
Figure 19 shows the estimated AGB obtained in the experimental area (red) and the corresponding 12-month sugarcane AGB curve (blue). Due to the difference between the sugarcane type in the experimental area and test site, the red dots in Figure 19, corresponding to the experimental area, were scaled over time considering the change from 12 months to 18 months. Based on this scale, a proposed 18-month sugarcane AGB curve, a c g ( d ) , for the test site (green) was obtained.
In this time scaling, the amplitude of the AGB curve remained constant. The 18-month sugarcane AGB curve a c g ( d ) could be described as follows:
a c g ( d ) = { 0.00928 d ,                                                       d < 255                 a c f ( d ) ,                                     d 255   &   d < 515 10.53 ,                                                                       d 515 ,                  
where a c f ( d ) is a Fourier series with eight elements expressed as:
a c f ( d ) = 4.63 + 5.97 cos ( w d + 2.88 ) + 1.96 cos ( 2 w d 0.51 ) + 0.06 cos ( 3 w d + 2.37 ) + 0.74 cos ( 4 w d + 2.11 ) + 0.65 cos ( 5 w d 1.28 ) + 0.49 cos ( 6 w d + 1.60 ) + 0.32 cos ( 7 w d 1.80 ) + 0.23 cos ( 8 w d + 1.08 ) ,
with w = 0.0064 constant and d the number of days after planting.
In order to obtain the final 18-month sugarcane model, an amplitude scaling procedure was performed using Equation (6), which is based on Table 2. Function a c g ( d ) is scaled to consider the harvest season of the analyzed sugarcane crop. The final 18-month sugarcane AGB curve depends on the days after planting and the harvest season:
a c ( d , s ) = 1 c N a c g ( d ) c ( s ) ,
where c N = 10.53 is the normalization factor and s is the harvest season.

3.4. Prediction Methods

The estimated and harvested AGB in test site areas 2, 4, 6, and 7 were considered to verify the productivity and harvesting date prediction methodology. The aim was to predict the production values of each area at their harvesting dates using only the estimated AGB maps and the 18-month sugarcane AGB curve for the corresponding harvest season of the area.

3.4.1. Harvesting Date Prediction

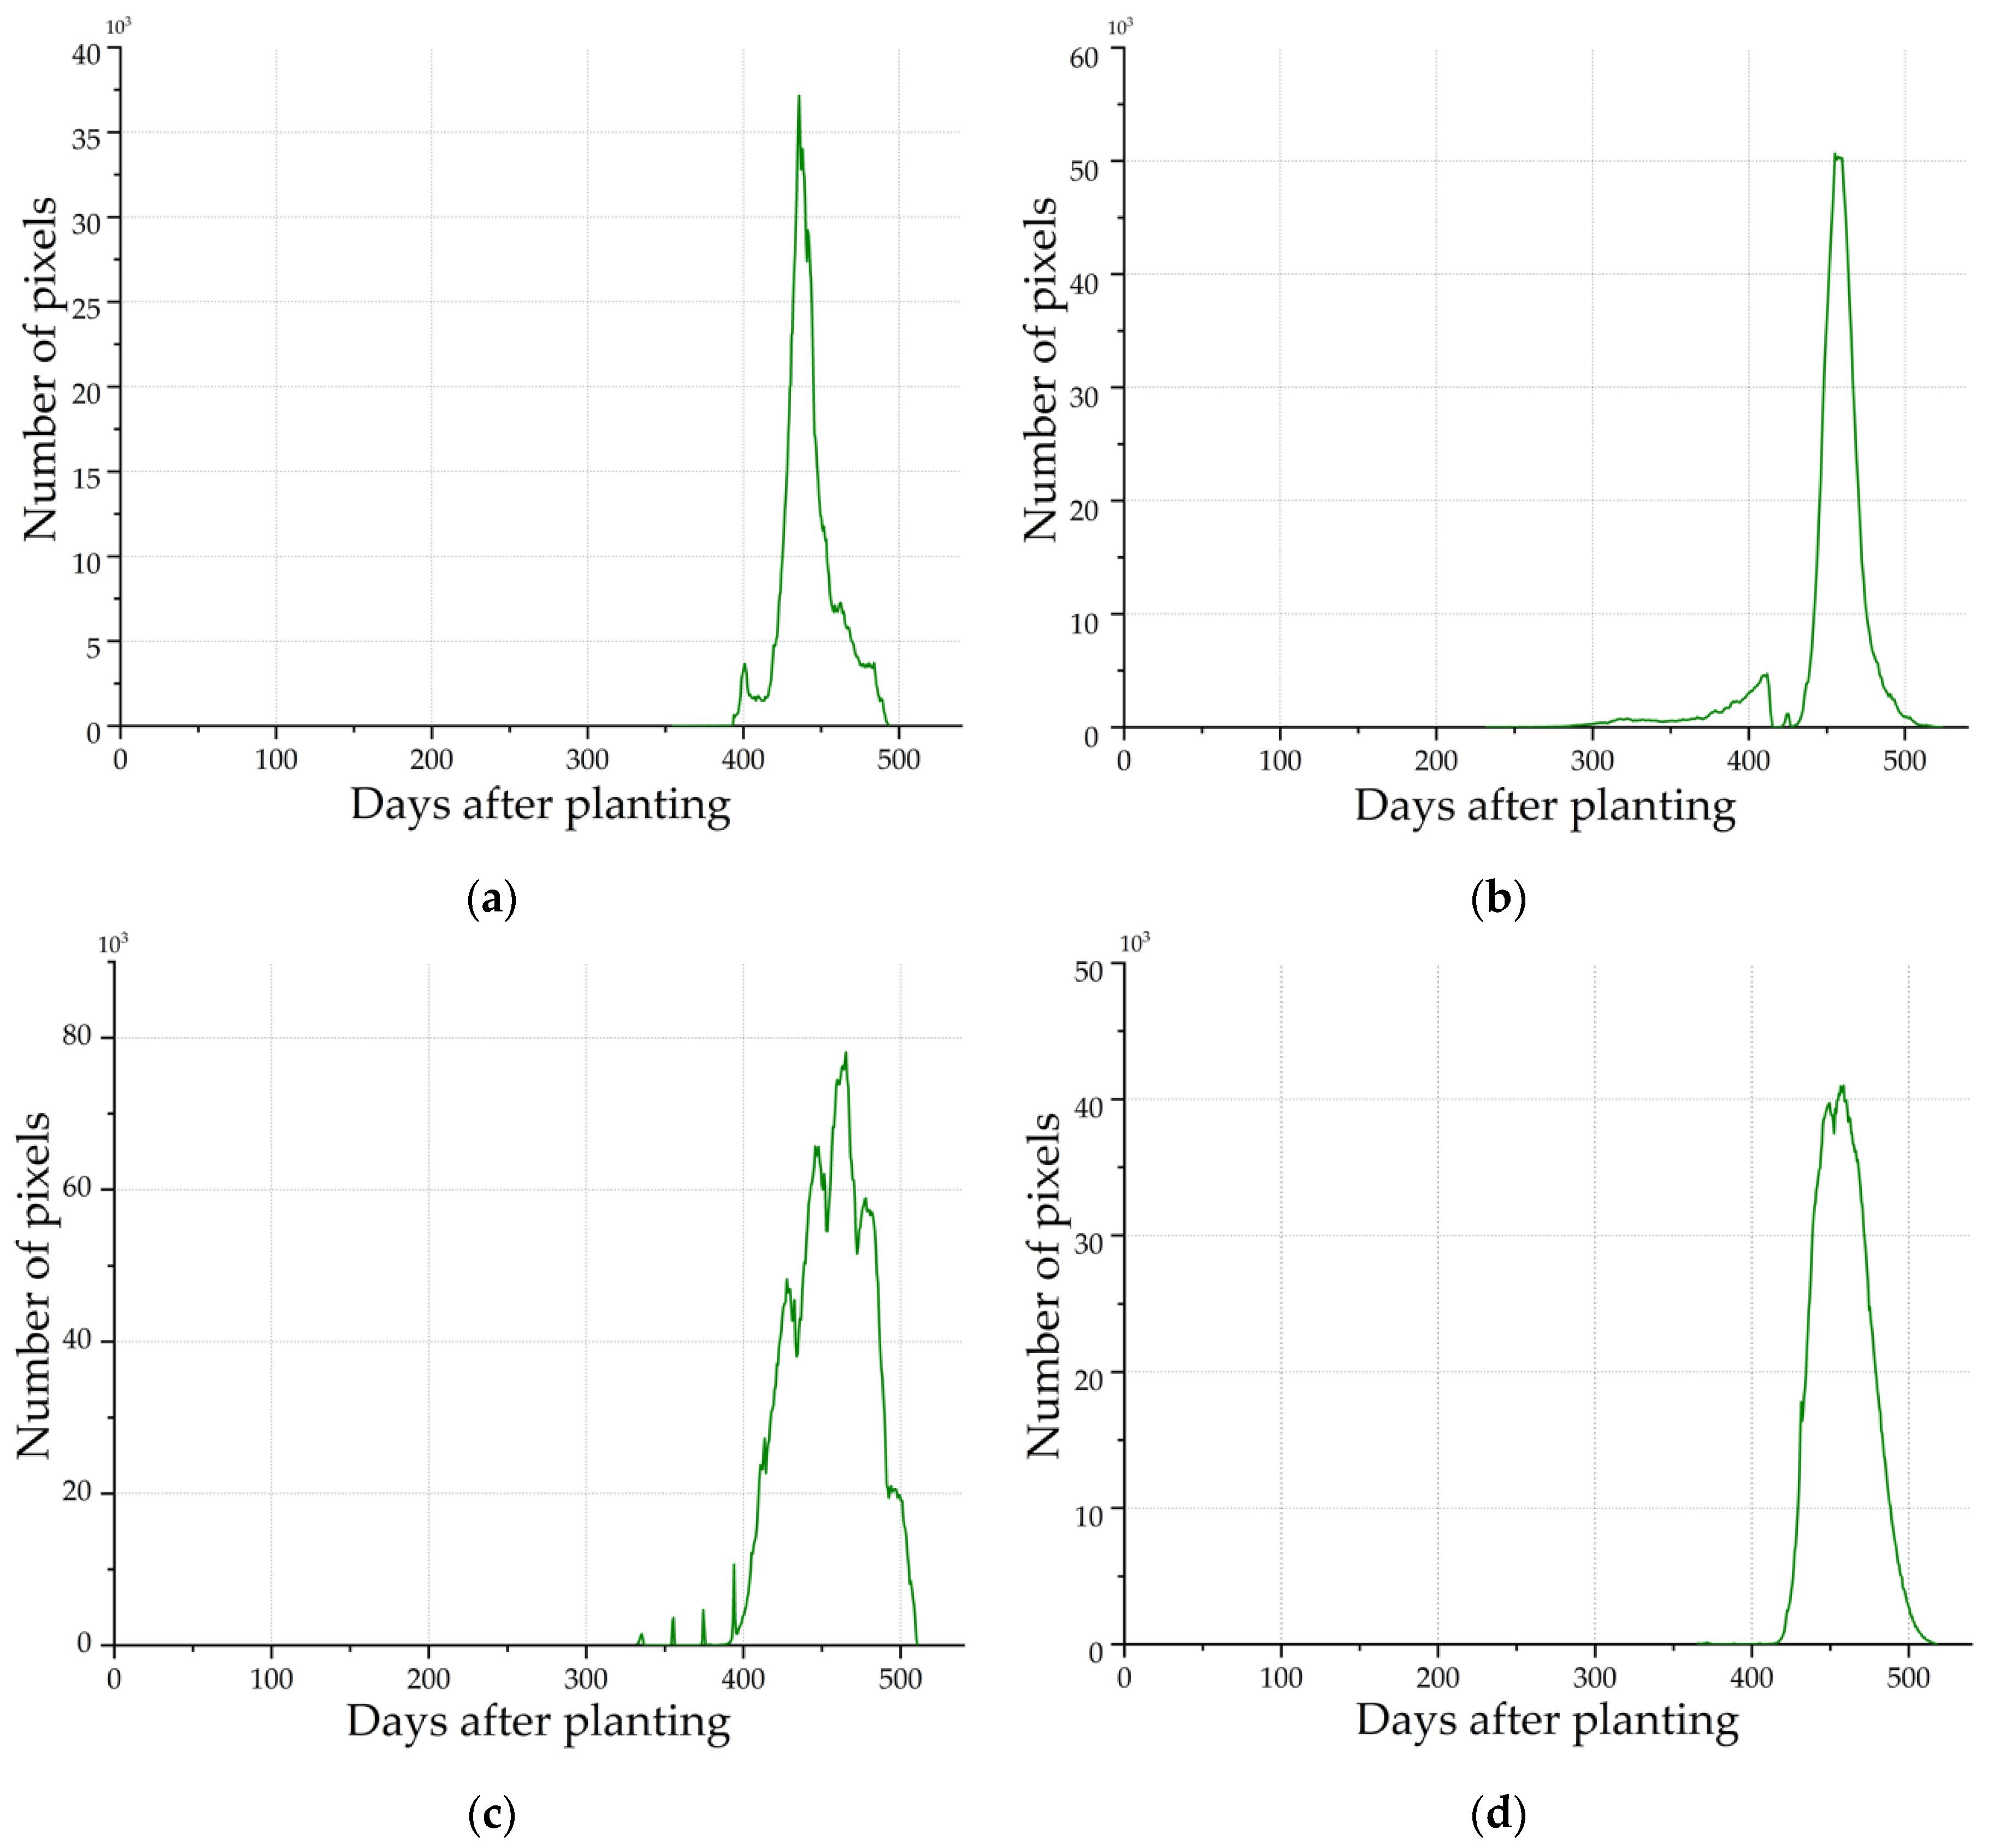
To predict the harvesting date of each area, histograms were obtained using the a c ( d , 1 ) , a c ( d , 3 ) , a c ( d , 4 ) , and a c ( d , 9 ) functions and the estimated AGB maps of areas 2, 4, 6, and 7 from 9 April and 16 July 2020, and applying the method described in Section 2.4.1. The resulting histograms are presented in Figure 20.
The estimated days after planting for areas 2, 4, 6, and 7 are, respectively, 433, 455, 465, and 454. The predicted date for optimal harvesting is calculated by subtracting those values from 540 days. The results (107, 85, 75, and 86 days) correspond to the predicted harvesting dates of 25 July 2020, for area 2, 3 July 2020, for area 4, 30 September 2020, for area 6 and 11 October 2020, for area 7.
According to their experience and monitoring of the areas, the managers of the test site chose the harvesting dates aiming at the highest productivity and sugarcane quality. The chosen dates, which are considered as reference, were 15 July 2020 for areas 2 and 4, and 7 October 2020 for areas 6 and 7. Finally, the average error between the predicted and the chosen dates is 8 days.

3.4.2. Productivity Prediction

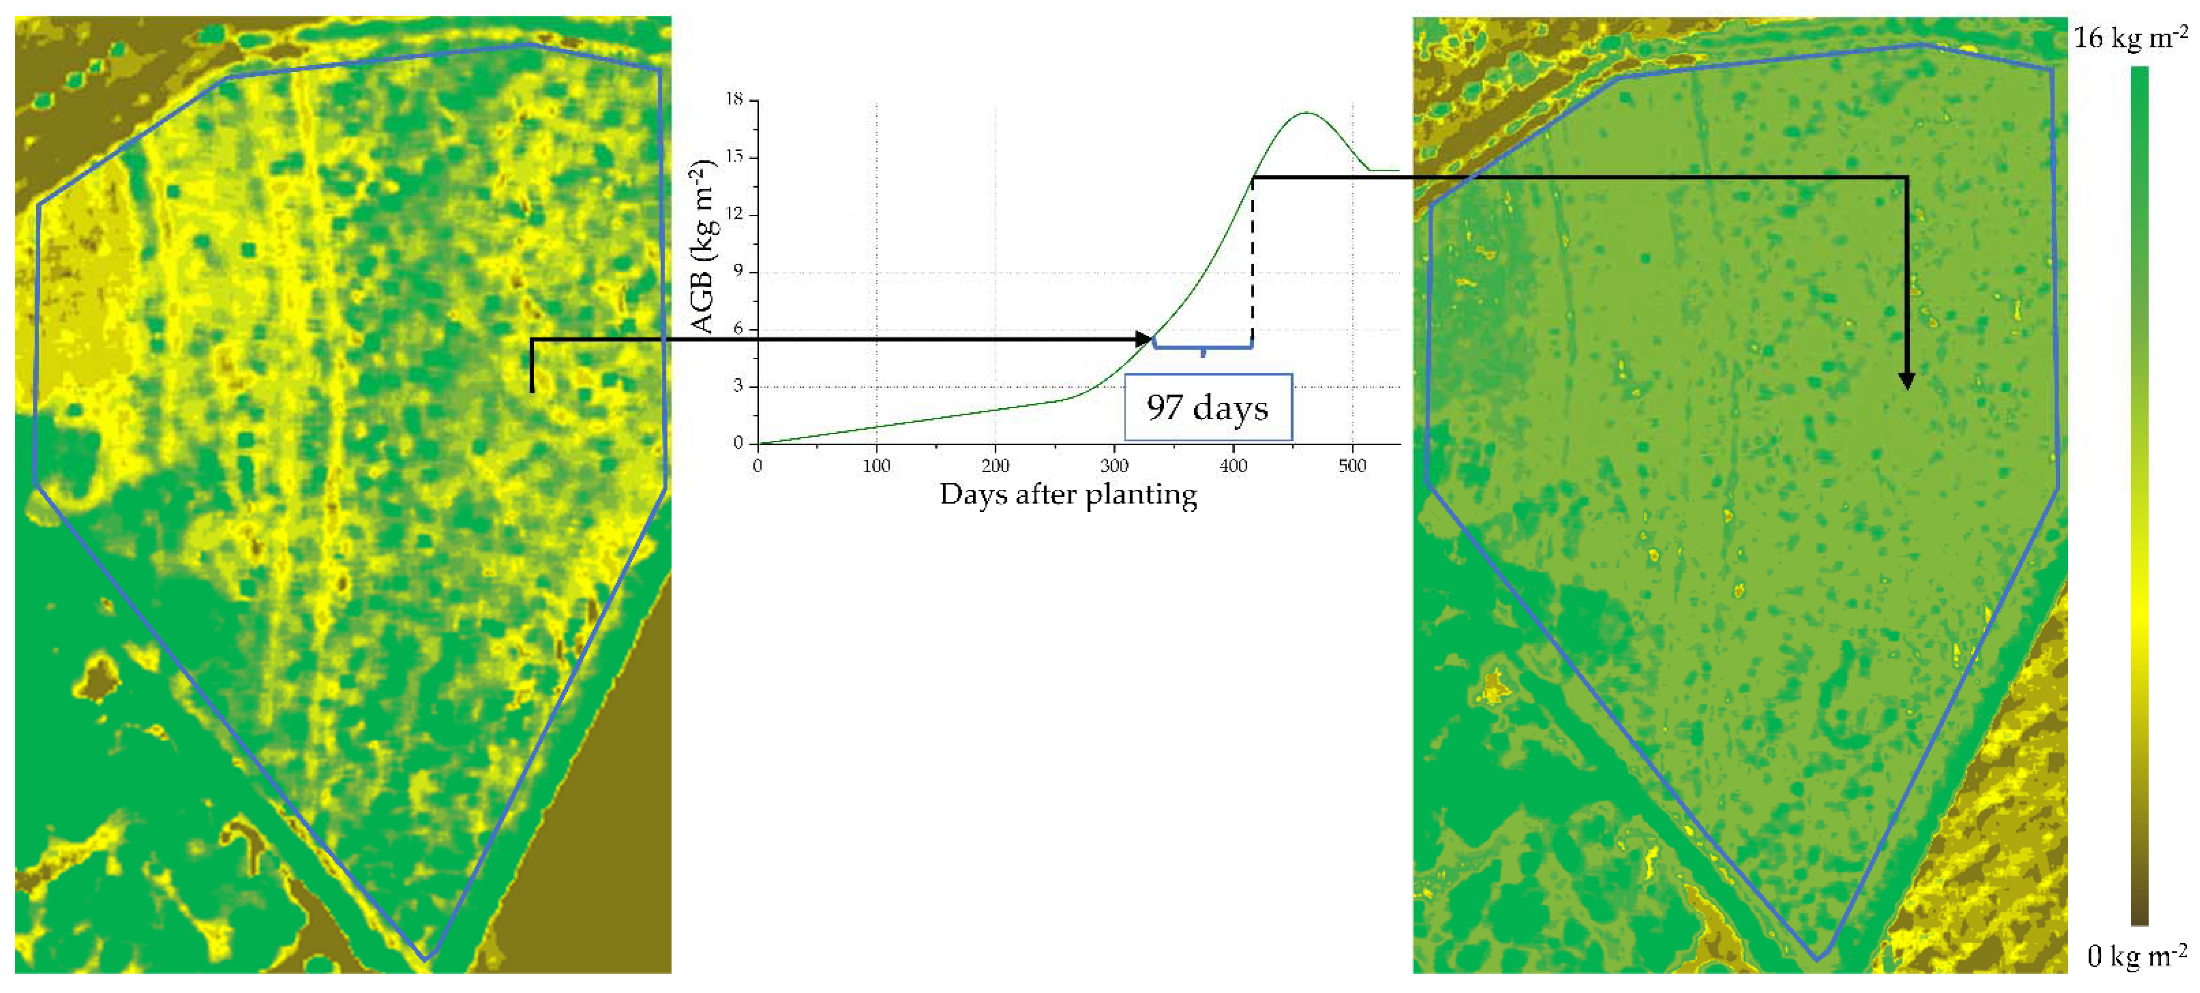
The harvest season of each area, ac ( d , 1 ) and ac ( d , 4 ) and the estimated AGB maps, are used to generate the predicted AGB maps corresponding to the real harvesting date for areas 2 and 4, respectively. The time interval is 97 days (from 9 April to 15 July 2020). Similarly, ac ( d , 9 ) and ac ( d , 3 ) are used to generate the predicted AGB maps of areas 6 and 7, respectively, using the corresponding time interval of 82 days (from 16 July 2020 to 7 October 2020). Figure 21 shows an example of how a c ( d , 1 ) is applied on a pixel-by-pixel process to produce the predicted AGB map from the estimated AGB map of area 2 on 9 April 2020.
Table 6 shows the predicted AGB based on the predicted AGB maps for the test site areas 2, 4, 6, and 7, and the harvested AGB. The average error obtained with the methodology for productivity prediction is 10.7%.

4. Discussion

4.1. Comparision of AGB Estimation Methods

Concerning the single-band AGB models, R2 results of 0.89, 0.84, and 0.55 were obtained for the training dataset and 0.88, 0.82, and 0.45 for the validation dataset in the L, P, and C bands, respectively. The similarity between the R2 values of the training and validation datasets shows the robustness of the approach described in this research. The effectiveness of the L band over the C band is consistent with what is described by Laneve et al. [20], where different phenological stages of sugarcane crops were analyzed. In addition, Molijn et al. [19] concluded that the C HH band presents a saturation of 3.5 kg m−2 when monitoring sugarcane crops with the RADARSAT-2, which is half the value found in this research. Another saturation point at a sugarcane height of 150 cm was found by Baghdadi et al. [22], although in this case, data from TerraSAR-X was used. Furthermore, Molijn et al. [19] mentioned that, despite the limited number of available images, no saturation point was found for the L HH band up to 11 kg m−2 for sugarcane crops, similar to results presented here. In other articles, Hosseini et al. [25] obtained an R2 higher than what is obtained in this research (0.83 over 0.48) when estimating AGB in corn crops with the C HH band, although the maximum value of calculated AGB was 1 kg m−2. All mentioned publications used single-band SAR systems, reaching different saturation points depending on the employed band. The three-band radar presented here covers the features of the X, L, and C bands from satellite-borne systems and adds the unique characteristics given by the P band and the much higher spatial resolution.
The final band-weighted AGB model resulted in a lower RMSE and a higher R2 than the single-band AGB models. This weighting technique was chosen because it allows the model to emphasize the contribution of each frequency band according to its performance in different ranges of AGB and to take advantage of its efficiency in different phenological stages of the sugarcane. For future works, it is recommended to test different approaches based on deep learning to take advantage of the three bands of the drone-borne SAR system. The final band-weighted AGB model has an R2 of 0.89 for the validation dataset, which is higher than the R2 obtained by Shi et al. [47], where a value of 0.63 was reached for sugarcane productivity estimation with a drone-borne optical system. Other works based on drone-borne optical systems were proposed for estimating AGB in different crops: Wang et al. [48] achieved an R2 of 0.89 when estimating AGB in rice crops; Han et al. [49] obtained R2 of 0.94 in corn crops; and Yue et al. [31], 0.93 in winter wheat crops. These works obtained R2 values close to our band-weighted model, but they worked with AGB values less than 3 kg m−2. Another key difference is that they carried out mapping surveys at up to 60 m height, strongly limiting the coverage area. Additionally, some studies based on LiDAR achieved good results [35,36], presenting limitations with short and dense vegetation and overcoming them by the fusion of LiDAR and hyperspectral data [50].
The estimated and measured AGB were used to generate AGB maps of the experimental area, as shown in Figure 12 and Figure 13. A moving average filter of 1.5 m × 1.5 m was applied over the SAR images to generate these maps. Higher AGB can be seen on the right-side than on the left-side in Figure 12 and Figure 13. Moreover, the decrease in AGB on 12 May 2020 is also perceptible, making the maps in Figure 12d and Figure 13d the ones with the highest average values. Finally, according to Figure 14, the band-weighted AGB model overestimates the AGB in the first two campaigns; however, the AGB calculated by biometric measurements is higher in the last surveys days.
The test site was also surveyed with the drone-borne SAR system. Two survey campaigns were carried out and resulted in an RMSE of 1.39 kg m−2 (Figure 16) and 1.71 kg m−2 (Figure 18) for AGB estimation. These RMSE results have values close to that obtained in the experimental area, demonstrating the robustness of the proposed model against other scenarios. Furthermore, the lowest RMSE value was obtained in the 9 April 2020 survey than the 16 July 2020 survey, suggesting that the final model has higher precision for lower ranges of AGB.

4.2. Comparision of Prediction Methods

The test site was also employed to test the harvesting date and productivity prediction methodology. The average error achieved for the productivity prediction is 10.7%. Besides that, the estimated day after planting corresponding to the maximum RI was employed together with the 18-month sugarcane AGB curve for the harvesting date prediction, achieving an average error of 8 days. In this scenario, no meteorological conditions and other external factors were considered. More comparisons with a wide range of plantation ages and harvest seasons are necessary to improve the Equations (15)–(18).
The average error obtained for the harvesting date prediction is greater than that obtained by Stasolla et al. [51]; however, that work carried out an automatic detection instead of predicting the harvesting date. Furthermore, Priya et al. [52] presented a method for the productivity prediction in sugarcane crops with an error of 2.5% for a training dataset and 8.85% for a validation dataset, lower than the error obtained in our proposal. It should be noted that, unlike what is proposed in this work, Priya et al. used information on temperature, precipitation, and humidity in their methodology. With respect to other crops, Iizumi et al. [53] proposed a methodology based on statistical data of temperature and precipitation for productivity prediction in rice, corn, and wheat crops, obtaining satisfactory results in only 36% of the cases studied.

5. Conclusions

This work presents a novel methodology for predicting sugarcane harvesting date and productivity based on electromagnetic images acquired by a 3-band drone-borne SAR system operating in the L, P, and C bands and performing square flight tracks. The band-weighted AGB model based on a multiband approach allowed us to monitor the sugarcane crops over time avoiding saturation problems and achieving unprecedented results compared with other works based on the SAR system.
The harvesting date and productivity prediction methodology are based only on the indirect RI estimation via AGB, without considering meteorological conditions or other external factors. The methodology was tested in four regions within the test area, resulting in an average error of 10.7% and 8 days for the productivity and the harvesting date prediction, respectively. Although the results are promising, future works are expected to consider external factors to improve the predictions.
Operating simultaneously in the L, P, and C bands, the drone-borne SAR system offers a wide range of information. In the future, the use of fully polarized bands can be employed, in addition to a greater number of surveys, especially for prediction methodologies. Additionally, different techniques based on machine learning can be evaluated to further improve the estimates. We expect a reduction of the productivity prediction average error to less than 2%, considering those improvements.
To the best of our knowledge, the drone-borne radar methodology for AGB estimation and the related harvest date and productivity prediction methodology presented here are novel and display high resolution and unparalleled accuracy for sugarcane crops. This can be suitable for farms, where a long-term and precise prediction of harvest date and productivity are necessary, taking advantage of the drone-borne radar capability to perform a daily survey coverage of around 500 ha.

Author Contributions

Conceptualization, G.O. and H.E.H.-F.; investigation, methodology, software, and validation, G.O., M.S.A., J.A.G., V.C., L.S.B. and F.C.; validation, J.Y., D.L. and R.C.; formal analysis and writing, G.O., M.S.A., J.A.G., L.P.O., V.C., F.C. and L.F.M.; supervision, review, and funding acquisition, L.P.O., B.T., D.L., L.H.G. and H.E.H.-F. All authors have read and agreed to the published version of the manuscript.

Funding

This research was funded by government agencies CAPES, CNPq, and the São Paulo State agency FAPESP, under the contracts PITE 2017/19416-3 and PIPE 2018/00601-8.

Institutional Review Board Statement

Not applicable.

Informed Consent Statement

Not applicable.

Data Availability Statement

Not applicable.

Acknowledgments

The authors would like to thank the Directed Energy Research Centre (DERC) at Technology Innovation Institute (TII), Abu Dhabi, UAE, for the financial support.

Conflicts of Interest

The authors declare no conflict of interest.

References

  1. Shi, Y.; Ji, S.; Shao, X.; Tang, H.; Wu, W.; Yang, P.; Zhang, Y.; Ryosuke, S. Framework of SAGI agriculture remote sensing and its perspectives in supporting national food security. J. Integr. Agric. 2014, 13, 1443–1450. [Google Scholar] [CrossRef]
  2. Gilio, L.; Moraes, M. Sugarcane industry’s socioeconomic impact in São Paulo, Brazil: A spatial dynamic panel approach. Energy Econ. 2016, 58, 27–37. [Google Scholar] [CrossRef]
  3. Conab. Acompanhamento da Safra Brasileira Cana-de-Açúcar. V. 7, Safra 2019/20, n. 2, Segundo Levantamento; Conab: Brasília, Brazil, 2020. [Google Scholar]
  4. The World Bank. Agriculture, Forestry and Fishing, Value Added (% of GDP)—Brazil. Available online: https://data.worldbank.org/indicator/NV.AGR.TOTL.ZS?locations=BR (accessed on 24 October 2020).
  5. Caetano, J.M.; Casaroli, D. Sugarcane yield estimation for climatic conditions in the center of state of Goiás. Rev. Ceres Viçosa 2017, 64, 298–306. [Google Scholar] [CrossRef] [Green Version]
  6. Cesnik, R.; Miocque, J. Melhoramento da Cana-de-Açúcar; Embrapa: Brasília, Brazil, 2004; ISBN 8573832827. [Google Scholar]
  7. Engelbrecht, J.; Kemp, J.; Inggs, M. The phenology of an agricultural region as expressed by polarimetric decomposition and vegetation indices. In Proceedings of the IEEE International Geoscience and Remote Sensing Symposium, Melbourne, Australia, 21–26 July 2013; pp. 1–4. [Google Scholar]
  8. Richards, M.; Scheer, J.; Holm., W. Principles of Modern Radar: Basic Principles; Scitech Publishing, Inc.: Raleigh, NC, USA, 2010; ISBN 9781891121524. [Google Scholar]
  9. Tsunoda, S.; Pace, F.; Stence, J.; Woodring, M.; Hensley, W.; Doerry, A.; Walker, B. Lynx: A high-resolution synthetic aperture radar. In Proceedings of the 2000 IEEE Aerospace Conference Proceedings, Big Sky, MT, USA, 25 March 2000; pp. 51–58. [Google Scholar]
  10. Koo, V.; Chan, Y.; Vetharatnam, G.; Chua, M.; Lim, H.; Lim, S.; Thum, C.; Lim, T.; Ahmad, Z.; Mahmood, K.; et al. A new unmanned aerial vehicle synthetic aperture radar for environmental monitoring. Prog. Electromagn. Res. 2012, 122, 245–268. [Google Scholar] [CrossRef] [Green Version]
  11. Li, C.; Ling, H. Synthetic aperture radar imaging using a small consumer drone. In Proceedings of the IEEE International Symposium on Antennas and Propagation, Vancouver, BC, Canada, 19–24 July 2015; pp. 685–686. [Google Scholar]
  12. Li, C.; Ling, H. High-resolution, downward-looking radar imaging using a small consumer drone. In Proceedings of the IEEE International Symposium on Antennas and Propagation, Fajardo, PR, USA, 26 June–1 July 2016; pp. 2037–2038. [Google Scholar]
  13. Yan, J.; Guo, J.; Lu, Q.; Wang, K.; Liu, X. X-band mini SAR radar on eight-rotor mini-UAV. In Proceedings of the IGARSS, Beijing, China, 10–15 July 2016; pp. 6702–6705. [Google Scholar]
  14. Dill, S.; Schreiber, E.; Engel, M.; Heinzel, A.; Peichl, M. A drone carried multichannel synthetic aperture radar for advanced buried object detection. In Proceedings of the RadarConf, Boston, MA, USA, 22–26 April 2019; pp. 1–6. [Google Scholar]
  15. Deguchi, T.; Sugiyama, T.; Kishimoto, M. Development of SAR system installable on a drone. In Proceedings of the EUSAR, online, 29 March–1 April 2021; pp. 1–3. [Google Scholar]
  16. Frey, O.; Werner, C. UAV-borne repeat-pass SAR interferometry and SAR tomography with a compact L-band SAR system. In Proceedings of the EUSAR, online, 29 March–1 April 2021; pp. 1–4. [Google Scholar]
  17. Lort, M.; Aguasca, A.; López-Martínez, C.; Martínez, T. Initial Evaluation of SAR Capabilities in UAV Multicopter Platforms. IEEE J. Sel. Top. Appl. Earth Obs. Remote Sens. 2018, 11, 127–140. [Google Scholar] [CrossRef] [Green Version]
  18. Schartel, M.; Burr, R.; Mayer, W.; Waldschmidt, C. Airborne Tripwire Detection Using a Synthetic Aperture Radar. IEEE Geosci. Remote Sens. Lett. 2020, 17, 262–266. [Google Scholar] [CrossRef]
  19. Molijn, R.A.; Ianini, L.; Rocha, J.V.; Hanseen, R.F. Sugarcane productivity mapping through C-Band and L-Band SAR and optical satellite imagery. Remote Sens. J. 2019, 11, 1109. [Google Scholar] [CrossRef] [Green Version]
  20. Laneve, G.; Marzialetti, P.; Luciani, R.; Fusilli, L.; Mulianga, B. Sugarcane biomass estimate based on SAR imagery: A radar system comparison. In Proceedings of the IGARSS, Fort Worth, RX, USA, 23–28 July 2017; pp. 1–4. [Google Scholar]
  21. Lin, H.; Chen, J.; Pei, Z.; Zhang, S.; Hu, X. Monitoring sugarcane growth using ENVISAT ASAR data. IEEE Trans. Geosci. Remote Sens. 2009, 47, 2572–2580. [Google Scholar] [CrossRef]
  22. Baghdadi, N.; Todoroff, P.; Zribi, M. Multitemporal observations of sugarcane by TerraSAR-X sensor. In Proceedings of the IEEE International Geoscience and Remote Sensing Symposium, Vancouver, BC, Canada, 24–29 July 2011; pp. 1401–1404. [Google Scholar]
  23. Gao, S.; Niu, Z.; Huang, N.; Hou, X. Estimating the Leaf Area Index, height and biomass of maize using HJ-1 and RADARSAT-2. Int. J. Appl. Earth Obs. Geoinf. 2013, 24, 1–8. [Google Scholar] [CrossRef]
  24. Wiseman, G.; McNairn, H.; Homayouni, S.; Shang, J. RADARSAT-2 polarimetric SAR response to crop biomass for agricultural production monitoring. IEEE J. Sel. Top. Appl. Earth Obs. Remote Sens. 2014, 7, 4461–4471. [Google Scholar] [CrossRef]
  25. Hosseini, M.; McNairn, H.; Mitchell, S.; Davidson, A.; Robertson, L.D. Combination of optical and SAR sensors for monitoring biomass over corn fields. In Proceedings of the IGARSS, Valencia, Spain, 22–27 July 2018; pp. 5952–5955. [Google Scholar]
  26. Nizalapur, V.; Jha, C.; Madugundu, R. Estimation of above ground biomass in Indian tropical forested area using multi-frequency DLR-EASR data. Int. J. Geomat. Geosci. 2010, 1, 167–178. [Google Scholar]
  27. Shugart, H.H.; Saatchi, S.; Hall, F.G. Importance of structure and its measurement in quantifying function of forest ecosystems. J. Geophys. Res. 2010, 115, 1–16. [Google Scholar] [CrossRef]
  28. Bombelli, A.; Balzter, H.; Avitabile, V.; Marchesini, L.B. BIOMASS Assessment of the Status of the Development of the Standards for the Terrestrial Essential Climate Variables; Global Terrestrial Observing System: Rome, Italy, 2009. [Google Scholar]
  29. Oliveira, G. Produtividade de Biomassa de Cana-de-Açúcar em Função dos íNdices de Vegetação Utilizando Técnicas de Monitoramento Remoto. Master’s Thesis, São Paulo State University, São Paulo, Brazil, 2015. [Google Scholar]
  30. Maimaitijiang, M.; Sagan, V.; Sidike, P.; Maimaitiyiming, M.; Hartling, S.; Peterson, K.; Maw, M.; Shakoor, N.; Mockler, T.; Fritschi, F. Vegetation index weighted canopy volume model (CVMVI) for soybean biomass estimation from unmanned aerial system-based RGB imagery. J. Photogramm. Remote Sens. 2019, 151, 27–41. [Google Scholar] [CrossRef]
  31. Yue, J.; Feng, H.; Jin, X.; Yuan, H.; Li, Z.; Zhou, C.; Yang, G.; Tian, Q. A comparison of crop parameters estimation using images from UAV-mounted snapshot hyperspectral sensor and high-definition digital camera. Remote Sens. 2018, 10, 1138. [Google Scholar] [CrossRef] [Green Version]
  32. Sinde-Gonzáles, I.; Gil-Docampo, M.; Arza-Garcia, M.; Grefa-Sanchez, J.; Yanez-Simba, D.; Perez-Guerrero, P.; Abril-Porras, V. Biomass estimation of pasture plots with multitemporal UAV-based photogrammetric surveys. Int. J. Appl. Earth Obs. Geoinf. 2021, 101, 102355. [Google Scholar] [CrossRef]
  33. Swayze, N.; Tinkham, W.; Vogeler, J.; Hudak, A. Influence of flight parameters on UAS-based monitoring of tree height, diameter, and density. Remote Sens. Environ. 2021, 263, 112540. [Google Scholar] [CrossRef]
  34. Poley, L.; McDermid, G. A systematic review of the factors influencing the estimation of vegetation aboveground biomass using unmanned aerial systems. Remote Sens. 2020, 12, 1052. [Google Scholar] [CrossRef] [Green Version]
  35. Masjedi, A.; Crawford, M. Prediction of sorghum biomass using time series UAV-based hyperspectral and LiDAR data. In Proceedings of the IGARSS, Waikoloa, HI, USA, 26 September–2 October 2020; pp. 3912–3915. [Google Scholar]
  36. Du., Y.; Wang, J.; Lin, Y.; Liu, Z.; Yu, H.; Yi, H. Estimating the aboveground biomass of phragmites australis (common reed) based on multi-source data. In Proceedings of the IGARSS, Valencia, Spain, 22–27 July 2018; pp. 9241–9244. [Google Scholar]
  37. Moreira, L.; Castro, F.; Góes, J.A.; Bins, L.; Teruel, B.; Fracarolli, J.; Castro, V.; Alcântara, M.; Oré, G.; Luebeck, D.; et al. A drone-borne multiband DInSAR: Results and Applications. In Proceedings of the RadarConf, Boston, MA, USA, 22–26 April 2019; pp. 1–6. [Google Scholar]
  38. Oré, G.; Alcântara, M.S.; Góes, J.A.; Oliveira, L.P.; Yepes, J.; Teruel, B.; Castro, V.; Bins, L.S.; Castro, F.; Luebeck, D.; et al. Crop Growth Monitoring with Drone-Borne DInSAR. Remote Sens. 2020, 12, 615. [Google Scholar] [CrossRef] [Green Version]
  39. Moreira, A.; Prats-Iraola, P.; Younis, M.; Krieger, G.; Hajnsek, I.; Papathanassiou, K. A tutorial on synthetic aperture radar. IEEE Geosci. Remote Sens. Mag. 2013, 1, 6–43. [Google Scholar] [CrossRef] [Green Version]
  40. Castro, F.H. Antenas para Radar de Abertura Sintética Embarcado em Drone. Master’s Thesis, University of Campinas, São Paulo, Brazil, 2018. [Google Scholar]
  41. Gray, A.L.; Vachon, P.W.; Livingstone, C.E.; Lukowski, T.I. Synthetic aperture radar calibration using reference reflectors. IEEE Trans. Geosci. Remote Sens. 1990, 28, 374–383. [Google Scholar] [CrossRef]
  42. Magro, F.; Takao, G.; Camargo, P.; Takamatsu, S. Biometria em Cana-de-Açúcar; Universidade de São Paulo, Escola Superior de Agricultura Luiz de Queiroz: Butanta, Brazil, 2011. [Google Scholar]
  43. Molijn, R.A.; Ianini, L.; Rocha, J.V.; Hanssen, R.F. Ground reference data for sugarcane biomass estimation in Sao Paulo state, Brazil. Sci. Data 2018, 5, 180150. [Google Scholar] [CrossRef] [PubMed]
  44. Gravois, K.; Orgeron, A. Estimating Brix Values to Improve Sugarcane Quality; LSU Ag. Center, Pub. 2888, 8/15; LSU AgCenter: Baton Rouge, LA, USA, 2020. [Google Scholar]
  45. Terr, D. Weighted Mean. From MathWorld—A Wolfram Web Resource. Available online: https://mathworld.wolfram.com/WeightedMean.html (accessed on 16 November 2020).
  46. Farr, T.; Rosen, P.; Caro, E.; Crippen, R.; Duren, R.; Hensley, S.; Kobrick, M.; Paller, M.; Rodriguez, E.; Roth, L.; et al. The shuttle radar topography mission. Rev. Geophys. 2007, 45, 1–33. [Google Scholar] [CrossRef] [Green Version]
  47. Shi, L.; Hu, S.; Zha, Y. Estimation of sugarcane yield by assimilating UAV and ground measurements via ensemble Kalman filter. In Proceedings of the IGARSS, Valencia, Spain, 22–27 July 2018; pp. 1–4. [Google Scholar]
  48. Wang, Y.; Zhang, K.; Tang, C.; Cao, Q.; Tian, Y.; Zhu, Y.; Cao, W.; Liu, X. Estimation of rice growth parameters based on linear mixed-effect model using multispectral images from fixed-wing unmanned aerial vehicles. Remote Sens. 2019, 11, 1371. [Google Scholar] [CrossRef] [Green Version]
  49. Han, L.; Yang, G.; Dai, H.; Xu, B.; Yang, H.; Feng, H.; Li, Z.; Yang, X. Modeling maize above-ground biomass based on machine learning approaches using UAV remote-sensing data. Plant Methods 2019, 15, 10. [Google Scholar] [CrossRef] [PubMed] [Green Version]
  50. Wang, C.; Nie, S.; Xi, X.; Luo, S.; Sun, X. Estimating the biomass of maize with hyperspectral and LiDAR data. Remote Sens. 2017, 9, 11. [Google Scholar] [CrossRef] [Green Version]
  51. Stasolla, M.; Neyt, X. Applying Sentinel-1 time series analysis to sugarcane harvest detection. In Proceedings of the IGARSS, Yokohama, Japan, 24 July–2 August 2019; pp. 1–4. [Google Scholar]
  52. Priya, S.; Suresh, K. A study on pre-harvest forecast of sugarcane yield using climatic variables. Stat. Appl. 2009, 7, 1–8. [Google Scholar]
  53. Iizumi, T.; Shin, Y.; Kim, W.; Kim, M.; Choi, J. Global crop yield forecasting seasonal climate information from a muli-model ensemble. Clim. Serv. 2018, 11, 13–23. [Google Scholar] [CrossRef]
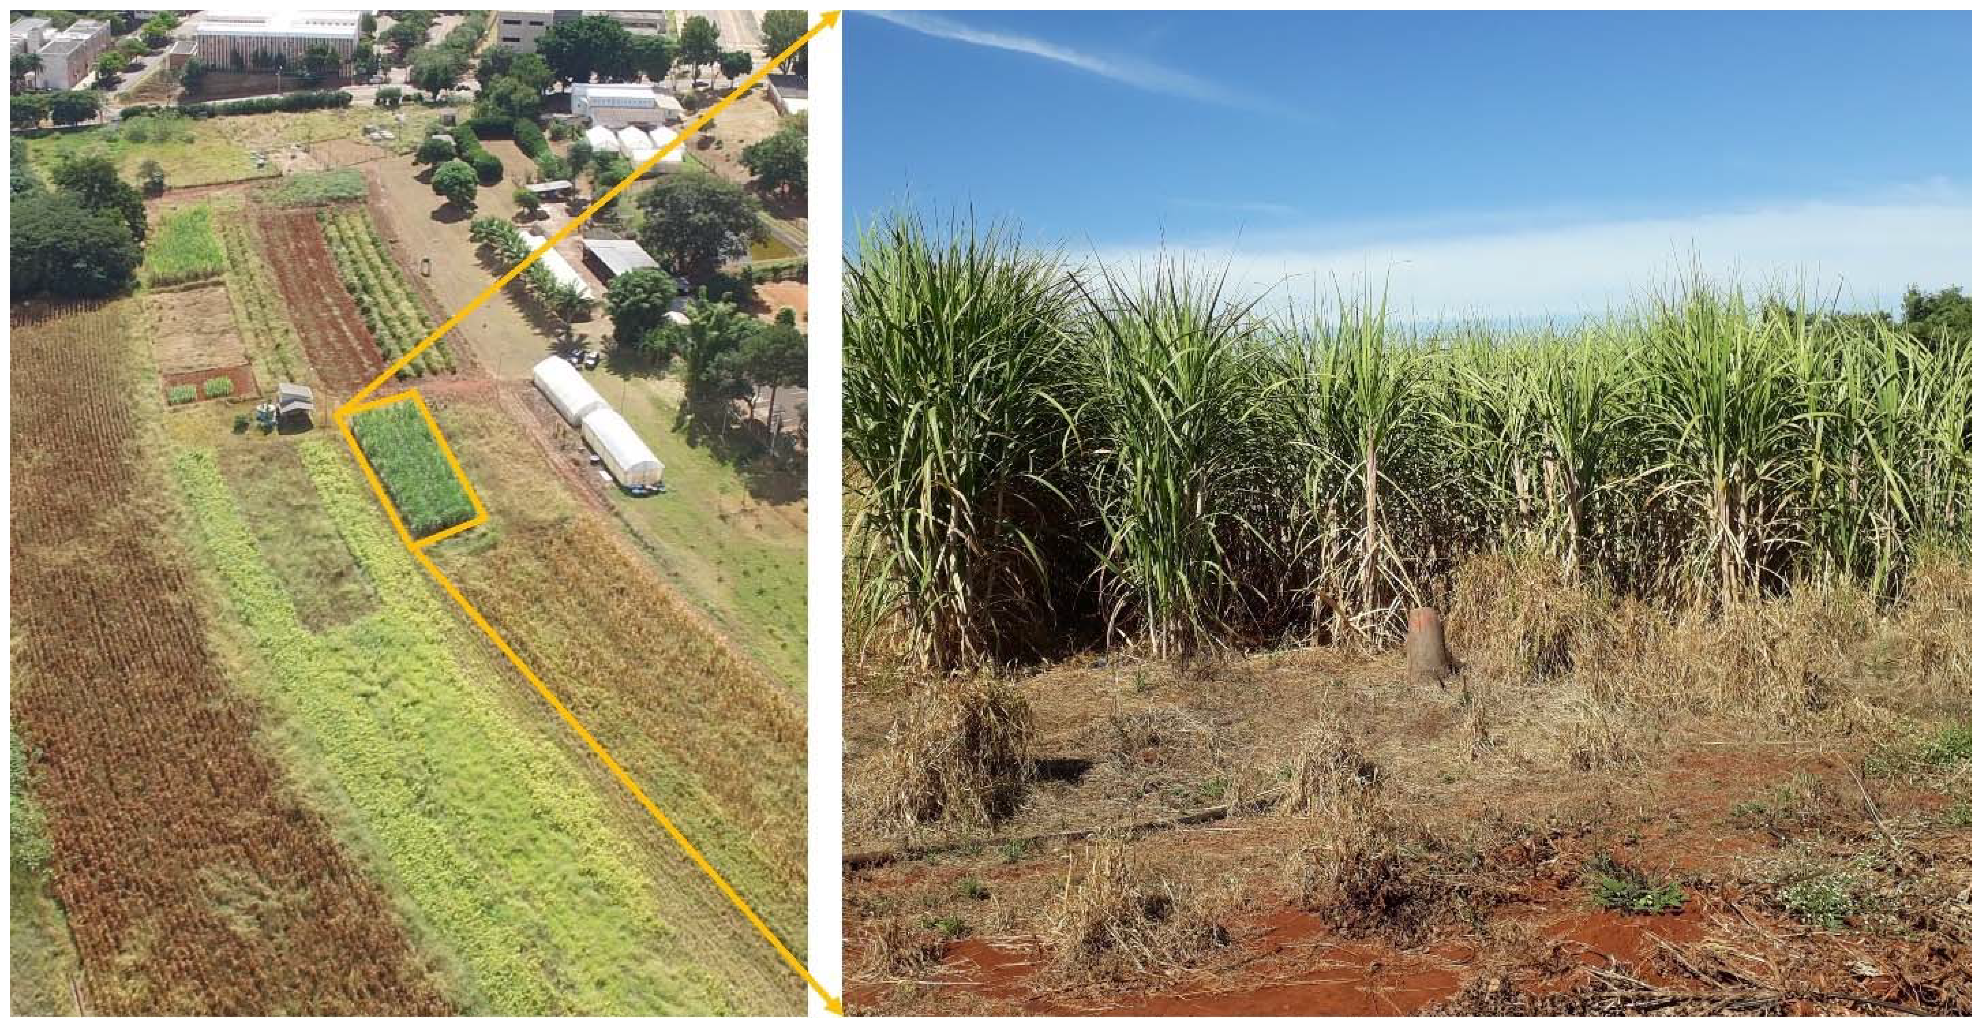
Figure 1. General view of the experimental area with a sugarcane crop.
Remotesensing 14 01734 g001
Figure 2. Representation of biometric parameters in a sugarcane plant.
Remotesensing 14 01734 g002
Figure 3. Measured above-ground biomass (AGB) and ripening index (RI) of the experimental area.
Remotesensing 14 01734 g003
Figure 4. Block diagram for the AGB estimation.
Remotesensing 14 01734 g004
Figure 5. Test site–general view.
Remotesensing 14 01734 g005
Figure 6. Harvested AGB and a proposed fitting curve.
Remotesensing 14 01734 g006
Figure 7. General diagram of the prediction methods.
Remotesensing 14 01734 g007
Figure 8. Example of how a histogram is obtained from an estimated AGB map. Left: AGB map. Center: AGB curve. Right: Histogram.
Remotesensing 14 01734 g008
Figure 9. Backscattering of the P, L, and C bands versus measured AGB.
Remotesensing 14 01734 g009
Figure 10. Error functions and RMSE values for the L, P, and C bands as a function of the measured AGB.
Remotesensing 14 01734 g010
Figure 11. Estimated AGB vs. measured AGB of the experimental area. (a) Training dataset. (b) Validation dataset.
Remotesensing 14 01734 g011
Figure 12. Estimated AGB maps by the band-weighted AGB model from (a) 19 December 2019, (b) 25 January 2020, (c) 4 March 2020, (d) 10 April 2020, (e) 12 May 2020.
Remotesensing 14 01734 g012
Figure 13. Measured AGB maps from (a) 19 December 2019, (b) 25 January 2020, (c) 4 March 2020, (d) 10 April 2020, and (e) 12 May 2020.
Remotesensing 14 01734 g013
Figure 14. Measured AGB data and estimated AGB data by the band-weighted AGB model along time.
Remotesensing 14 01734 g014
Figure 15. Estimated AGB maps. (a) Areas 1 and 2. (b) Areas 3 and 4. (c) Area 5.
Remotesensing 14 01734 g015
Figure 16. Comparison between the measured and estimated AGB. Data from 9 April 2020.
Remotesensing 14 01734 g016
Figure 17. Estimated AGB maps for the survey flights on 16 July 2020, over test-site areas 1, 6, and 7 and the 17 selected sections.
Remotesensing 14 01734 g017
Figure 18. Comparison between measured and estimated AGB based on data collected on 16 July 2020.
Remotesensing 14 01734 g018
Figure 19. AGB curve based on the AGB values of the experimental area and the 18-month sugarcane AGB curve. The dotted lines indicate the limit of the piecewise-defined function.
Remotesensing 14 01734 g019
Figure 20. Histograms of areas (a) 2, (b) 4, (c) 6, and (d) 7.
Remotesensing 14 01734 g020
Figure 21. Representation of how the predicted AGB map of area 2 (right side map) is obtained from the corresponding estimated AGB map of 9 April 2020 (left side map) by carrying out a pixel-by-pixel process based on a c ( d , 1 ) . The blue line delimits area 2.
Remotesensing 14 01734 g021
Table 1. Main radar acquisition parameters for the L, P, and C bands.
Radar ParametersL BandP BandC Band
Carrier wavelength22.8 cm70.5 cm5.6 cm
Bandwidth150 MHz50 MHz200 MHz
PolarizationHHHHVV
Antenna gain9.4 dB8.2 dB12.1 dB
Antenna aperture in azimuth58.5°55.9°32.5°
Antenna aperture in elevation79.8°69.3°51.3°
Drone average speed2 m/s2 m/s2 m/s
Drone average height120 m120 m120 m
Table 2. Dates of surveys carried out in the experimental area.
Survey DatesDays after Planting
12 December 2019165
25 January 2020202
4 March 2020241
10 April 2020278
12 May 2020310
1 June 2020330
17 June 2020346
Table 3. Root-mean-square error (RMSE) evaluation of single-band AGB models in different ranges of AGB.
BandRange 1:
[0 to 4 kg m−2]
Range 2:
[4 to 11 kg m−2]
Range 3:
[11 to 21 kg m−2]
L   band :   B L ( σ L ) e L 1 e L 2 e L 3
P   band :   B P ( σ P ) e P 1 e P 2 e P 3
C   band :   B C ( σ C ) e C 1 e C 2 e C 3
Table 4. History of harvested AGB per harvest season.
Sugarcane Harvest SeasonHarvested AGB
1st harvest season12.49 kg m−2
2nd harvest season9.37 kg m−2
3rd harvest season7.85 kg m−2
4th harvest season6.97 kg m−2
5th harvest season6.45 kg m−2
6th harvest season6.41 kg m−2
7th harvest season6.34 kg m−2
8th harvest season6.04 kg m−2
9th harvest season6.26 kg m−2
Table 5. RMSE results when evaluating each single-band model in different ranges of AGB.
BandRange 1:
[0 to 4 kg m−2]
Range 2:
[4 to 11 kg m−2]
Range 3:
[11 to 21 kg m−2]
Overall:
[0 to 21 kg m−2]
L   band :   B L ( σ L ) 1.57 kg m−22.11 kg m−22.86 kg m−21.94 kg m−2
P   band :   B P ( σ P ) 1.64 kg m−22.47 kg m−22.21 kg m−22.11 kg m−2
C   band :   B C ( σ C ) 1.48 kg m−23.63 kg m−24.59 kg m−23.46 kg m−2
Table 6. Harvested and predicted AGB on test site areas 2, 4, 6, and 7.
AreaHarvested AGB (kg m−2)Predicted AGB (kg m−2)Harvest Season
Area 214.42 15.23 1st
Area 47.077.99 4th
Area 65.36 6.01 9th
Area 79.77 10.973rd
Publisher’s Note: MDPI stays neutral with regard to jurisdictional claims in published maps and institutional affiliations.