Abstract
High-accuracy, long-time-series and large-scale land classification mapping are essential for assessing the evolutionary patterns of land systems and developing sustainability studies. In this paper, using Google Earth Engine (GEE) and Landsat satellite remote sensing images, based on the Random Forest (RF) algorithm, we carried out remote sensing classification to obtain a year-by-year land use/cover data set in Vietnam over the past 21 years (2000–2020). Further applying principal component analysis and multiple linear regression methods, we examined the spatio-temporal characteristics, dynamic changes and driving mechanisms of land use change. The results show the following: (1) The RF classification algorithm supported by the GEE can quickly and accurately obtain a land use/cover data set. The overall classification accuracy is 0.91 ± 0.01. (2) The land cover types in Vietnam are dominated by woodland and cropland, with an area share of 54.62% and 37.90%, respectively. In the past 20 years, the area of built-up land has increased the most (+93.49%), followed by the area of water bodies (+54.19%), while the area of woodland has remained almost unchanged. (3) The expansion of built-up land is driven by regional economic development; the area changes in cropland, water bodies and woodland are influenced by both national economic development and climate change. The results of the study provide a basis for assessing land use policies in Vietnam and a reference methodological framework for rapid land mapping and analysis in other countries in the China–Indochina Peninsula.
1. Introduction
Land Use/Land Cover Change (LULC) is one of the most direct results of climate change and human activities on the Earth’s surface systems [1]. LULC not only profoundly affects land surface energy balance, carbon and water cycles and species diversity [2,3,4,5], but also has strong links to local ecosystem services, food security and socioeconomic sustainability. Therefore, it is of great scientific importance to comprehensively grasp and monitor the spatial distribution and dynamic changes in surface cover, which is basic research into an important element of global environmental change. Since the 1990s, the International Geosphere-Biosphere Programme (IGBP) and the International Human Dimensions Programme on Global Environmental Change (IHDP) have jointly initiated the Land Use/Land Cover Change (LULC) core research project [6], and land use/cover change monitoring, driving mechanisms and effects on regional economies and climate have become key research directions in geography, ecology and geoeconomics [7,8,9].
Before 2015, most global land cover data products had a resolution of 300–1000 m, with low regional accuracy and spatial consistency of 53–57%, generally. Spatial detail was insufficient to meet the needs of applications, such as global and regional land use analysis and climate change simulation [10]. In 2014, Chinese scholars developed the first global 30-metre resolution land cover data product—GlobeLand30 [11,12,13]. The product is valued by researchers for its wide spatial extent, high resolution and free sharing [14]. However, there are still many manual interventions in GlobeLand30 products, which make it difficult to extract and compare land cover information on an interannual scale [15]. At the regional scale, the study of high precision and faster land use/land cover mapping methods and the development of a spatio-temporal continuous LULC database remain the motivation for scholars to research regional LULC evolution patterns, driving mechanisms and climate and ecological environmental effects.
Regional-scale land use/cover classification and mapping are mainly carried out with the help of satellite remote sensing image data, and can be broadly classified into several method types, such as image segmentation, unsupervised classification, supervised classification and deep learning. Currently, the more commonly used LULC classification algorithms include minimum distance classification (MDC) [16], maximum likelihood classification (MLC) [17], random forest algorithm (RF) [15], classification and regression tree (CART) [18] and support vector machine algorithm (SVM) [19,20]. Of these, RF is an integrated classifier based on the combination of multiple CART, as a result of its nonparametric nature, ability to handle dimensionality and overfitting [21]. RF algorithms have a higher classification accuracy compared with other algorithms and are widely used in the field of satellite remote sensing land mapping [22,23,24].
However, limited by the computing power and storage space of remote sensing platforms, RF-based land cover classification could only rely on limited band data from multispectral data for a long time, with few applications of the full range of satellite band data. Few studies have considered other environmental background data and human activity characteristics, such as the normalized difference vegetation index (NDVI), normalized difference water index (NDWI), digital elevation model (DEM) and the nighttime light index. In recent years, the rapid development of satellite remote sensing big data and cloud computing technology represented by Google Earth Engine (GEE) has provided a new platform for global and regional land cover/use research. GEE combines data collection and download with powerful spatial analysis and processing capabilities, not only providing global time-series satellite maps and other ancillary data (such as digital elevation models and weather and climate data), but also integrating algorithms for processing large amounts of satellite data to easily meet the major needs of processing remote sensing data, which are widely used in studies of vegetation cover, settlement and population and urban development [25]. In this context, based on the GEE platform, exploiting the potential of the RF algorithm to fuse long time series and full elements of satellite surface parameters features have become an important direction for regional LULC exploration research.
In Vietnam, due to the limitations of basic data and large-scale processing capabilities, past LULC studies have mainly explored land use/cover change processes at smaller spatial scales and shorter time scales using the manual visual interpretation method, and few studies have explored land use/cover change and its driving mechanisms over long time periods on a national scale. Disperati and Virdis analyzed the land use change in Tam Giang-Cau Hai Lagoon, central Vietnam, from 1965 to 2014, using Landsat MSS/TM/ETM+ satellite imagery with the help of computer-aided visual interpretation. They found that urban areas have encroached on peri-urban agricultural areas, while aquaculture has spread into agricultural land and lagoons; scattered vegetation in hilly areas was replaced by woodlands [26]. Van et al. analyzed the mangrove vegetation area change in Mui Ca Mau, Vietnam, from 1953 to 2011, with the help of aerial photographs and satellite images, and found that the mangrove areas showed a trend of a sharp decline in the first period and a slow increase in the later period, using the year 1992 as the boundary [27]. These trends were mainly influenced by war, overexploitation and land management policies. In summary, existing studies only focus on regional-scale land use/cover dynamics, and lack national-scale, high-precision, automated spatio-temporal continuous land use/cover data sets, in addition to comprehensive studies on land use change dynamics and analysis of driving mechanisms.
To address the above issues, this study proposes the use of GEE to achieve high-precision and long-term national-scale land use/cover mapping of Vietnam based on summer Landsat 5/7/8 image data and other parameters, such as EVI, NDVI, NDWI, SRTM3 data and the global nighttime light index, during the period 2000–2020; furthermore, it applies principal component analysis and multiple linear regression methods to explore the influence of economic development and regional climate factors on land use/cover change processes in the study area. We attempt to answer the following three questions:
- (1)
- How can we achieve high-accuracy, high-precision land use mapping over long time series across Vietnam?
- (2)
- What are the spatial patterns and evolution of land use/cover change in Vietnam during the period 2000–2020?
- (3)
- What are the key factors driving land use/cover change in Vietnam during the period 2000–2020?
2. Materials and Methods
2.1. Study Area
Vietnam is located in the eastern part of the China–Indochina Peninsula (8°10′–23°24′ N, 102°09′–109°30′ E), bordering Guangxi and Yunnan, China, in the north, and Laos and Cambodia in the west, with a long and narrow land area of approximately 33 × 104 km2 (Figure 1). The region has a tropical monsoon climate with high temperatures and rainfall, with an average annual temperature of approximately 24 °C and an average annual rainfall of 1500–2000 mm. In the north, there are four seasons: spring, summer, autumn and winter; in the south, there are two distinct rainy and dry seasons, with most areas having a rainy season from May to October and a dry season from November to April.
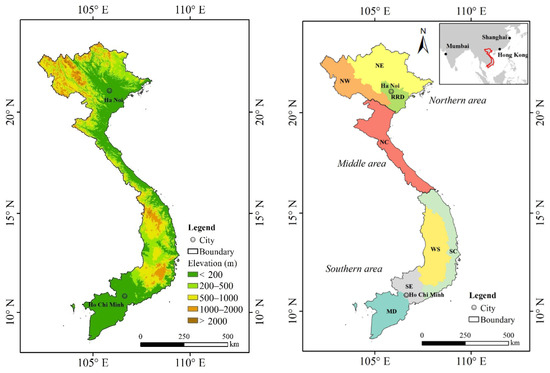
Figure 1.
Location, topography and main provinces of Vietnam.
The study area has a long and narrow terrain. Three-quarters of the area consists of mountains and plateaus. The northern and northwestern parts are high mountains and plateaus. The eastern coast is plain with low and flat terrain, a dense network of rivers, and an elevation of approximately 3 m.
According to geographical divisions, Vietnam can be divided into the northern area, middle area and southern regions. In detail, it can be divided into 8 parts: northeastern provinces (NE), northern and central provinces (NC), northwestern provinces (NW), Mekong Delta (MD), Red River Delta (RRD), southeastern provinces (SE), southern and central provinces (SC) and western provinces (WS).
2.2. Data Sets
The satellite remote sensing information sources used for land cover mapping in this study are as follows: Landsat 5/7/8 image data, EVI, NDVI, NDWI index data, SRTM3 data and global night light products of the study area, year-by-year during the period 2000–2020.
Before 2013, we used Landsat 5/7 image data, including 6 bands: B1 (0.45–0.53 μm), B2 (0.52–0.60 μm), B3 (0.63–0.69 μm), B4 (0.76–0.90 μm), B5 (1.55–1.75 μm) and B7 (2.08–2.35 μm). After 2013, we used Landsat 8 data, including 9 bands: B1 (0.43–0.45 μm), B2 (0.45–0.51 μm), B3 (0.53–0.59 μm), B4 (0.64–0.67 μm), B5 (0.85–0.88 μm), B6 (1.57–1.65 μm), B7 (2.11–2.29 μm), B10 (10.6–11.19 μm) and B11 (11.50–12.51 μm). Specific data we used are USGS Landsat 5 Level 2, Collection 2, Tier 1; USGS Landsat 7 Level 2, Collection 2, Tier 1; and USGS Landsat 8 Level 2, Collection 2, Tier 1. The data level of processing is level 2 and the Landsat Collection Tier is Tier 1. All of them have a spatio-temporal resolution of 30 m and 16 days. In order to improve the classification accuracy of woodland and water body cover areas, the study also used EVI, NDVI and NDWI data, which were derived from Landsat 5/7/8 Collection 8-day composites [28].
To improve the recognition accuracy from the perspective of elevation, this study also used SRTM3 (Shuttle Radar Topography Mission Version 3), with a spatial resolution of 30 m, which was jointly measured and produced by the National Aeronautics and Space Administration (NASA) and the National Imagery and Mapping Agency (NIMA).
To improve the accuracy of the classification of built-up land, the study also used two nighttime light products: DMSP-OLS Nighttime Lights Time Series during the period 2000–2011 from the Defense Meteorological Satellite Program (DMSP), and NPP-VIIRS Day/Night Band (DNB) during the period 2012–2020 from the Suomi National Polar-Orbiting Partnership (Suomi NPP), with spatial resolutions of 900 and 450 m, respectively.
To establish the high-confidence training sample and validation sample data set required by the RF model, this study referred to the principles of “multi-source consistency” and “time-series stability” [15,29] and used multi-phase and multi-source land cover products. Specifically, we used GlobCover in 2000, 2010 and 2020 [30] with a spatial resolution of 300 m derived from http://due.esrin.esa.int/page_globcover.php (accessed on 5 March 2022), and the GlobeLand30 in 2000, 2010 and 2020 [31] with a spatial resolution of 30 m derived from http://globeland30.org/home_en.html (accessed on 5 March 2022).
In order to analyze the impact of climate change and human activities on regional land cover, this research also collected meteorological data and regional social development data.
The meteorological data (2000–2020) were mainly day-by-day rainfall data from PERSIANN-CDR [32] with a spatial resolution of 0.25 radians. From the period 2000–2020, we summed the rainfall amount for the whole year and summer (July–September) to obtain the annual and summer rainfall data, respectively. Finally, the 2 values we obtained refer to annual and summer rainfall amounts for each year. These procedures were conducted in the GEE platform.
Regional economic and social development data, including population, gross domestic product and other indicators, were obtained from https://data.worldbank.org.cn/country/vietnam?view=chart (accessed on 5 March 2022); the specific data items obtained are as follows: total population, rural population, urbanization rate, gross domestic product (GDP), manufacturing value added, industrial value added and agricultural value added.
All of the base data sets were integrated into the GEE platform and can be used directly, except for GlobCover, GlobeLand30 and regional socioeconomic statistical yearbook data (Supplementary Table S1).
2.3. Mapping Methods
2.3.1. Overall Technical Process
The overall technical process can be divided into 4 steps (Figure 2).
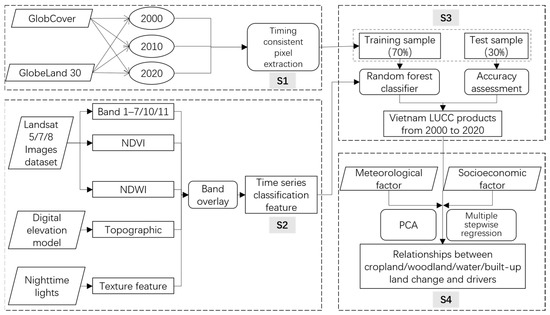
Figure 2.
Technical flowchart of land use/land cover mapping and driving mechanism analysis.
- (1)
- Based on Landsat satellite images and related auxiliary data, such as EVI, NDVI, NDWI and Nighttime Light Index, using the method of image synthesis and cloud masking under the support of GEE, we obtained year-by-year cloud-free and shadow-free synthetic image data of Vietnam from 2000 to 2020.
- (2)
- Based on the principle of “multi-source consistency” and “time-series stability” of multi-source land cover products, we selected sample points with no change in land use/cover type, deployed RF models to train and validated sample points and extracted land cover information of sample points.
- (3)
- Using 70% of the sample points as training points, combined with the synthetic images year-by-year, RF model training was carried out to interpret the land use/cover result data set. The remaining 30% of the sample points were used as validation sample points to evaluate the accuracy of classification results.
- (4)
- Based on climate change and regional economic social development factors, we determined the categories of land use/cover change drivers via principal component analysis and applied multiple linear regression methods to quantitatively determine the contribution of each driver.
2.3.2. Preparation of Long Time Series Satellite Images
With the support of the GEE platform, we used cloud mask and image synthesis methods to produce cloud-free composite images based on SR (surface radiation) images during the period 2000–2020. Specifically, referring to the built-in cloud mask method in GEE, we constructed the function to mask clouds based on the pixel_qa band of Landsat 5/7/8 SR (surface radiation) data. Bits 3 and 5 in the pixel_qa band are cloud shadow and cloud, respectively. Both flags should be set to zero, indicating clear conditions. We replaced and supplemented each year’s low-quality pixels with data from the previous and following year using the median synthesis method to produce the best available pixel image synthesis, resulting in an annual cloud-free image data set for the summers during the period 2000–2020.
For the nighttime imagery, we used the built-in algorithms “ee.reduceResolution” and “ee.reproject” for nighttime imagery to aggregate smaller pixels into a larger pixel and force the image to be computed in a given projection (EPSG:4326) and resolution (30 m, same with Landsat data).
2.3.3. Construction of Sample Data Set
Automated satellite remote sensing supervised classification usually requires a certain number of model training samples and validation samples. Traditional studies generally use manual visual interpretation to obtain training and validation sample points. However, for a large geographical unit such as Vietnam, it is very difficult to obtain enough samples by manual visual interpretation, which will cost a large amount of labor and time, and cannot achieve the purpose of automated and fast mapping. In order to solve the above problems, this study implemented a highly reliable and automated method for training and validation sample point selection and attribute extraction based on the principles of “multi-source consistency” and “time-series stability” [15,29].
The specific steps are as follows:
- (1)
- The main land use types in the study area were cropland, woodland, water bodies and built-up land; however, there are very few and extremely scattered wetlands, shrub and grassland types. Therefore, we only focused on the four main types. We unified the land cover classification system of GlobeLand30 and GlobCover products and reclassified the land cover types in Vietnam into four categories (Table 1), specifically cropland, woodland, water bodies and built-up land.
 Table 1. The category of land use/land cover in Vietnam.
 - (2)
- The GlobeLand30 (2000, 2010 and 2020) and GlobCover (2000, 2010 and 2020) data sets were overlaid to select pixels with identical land cover type definitions in the multi-source and multi-period data products.
- (3)
- To avoid the risk of sample bias (over-representation of correct or incorrect points), a stratified random sampling method (“stratifiedSample” algorithm in GEE) was used to randomly deploy sample points in the above target image elements. A total of 2000 sample points were deployed in this paper, with 1400 (70%) as training points and 600 (30%) as validation points (Figure 3). This same sample data set was applied for each year.
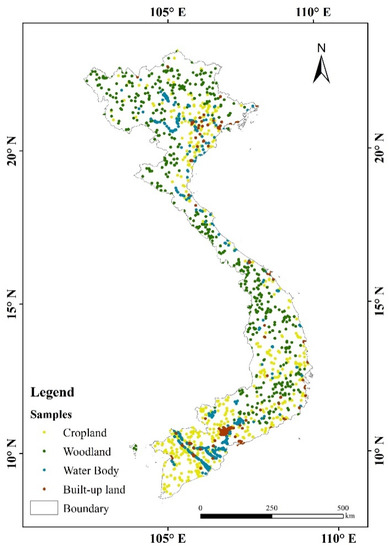 Figure 3. Distribution of sample points in the study area.
2.3.4. Random Forest Method
Random forest (RF) is a data mining method and a potential machine learning method based on the idea of integrated learning by building a large number of decision trees and applying a voting mechanism to the decision results. Specifically, first, the bootstrap sampling technique is used to extract N training sets from the original data set; then, a decision tree (“forest”) is built for each training set, and each decision tree is independent and unrelated to each other; when new samples are input, each decision tree is judged separately; finally, voting is used to decide the category of the new samples. When a new sample is an input, each decision tree is judged separately, and the class of the new sample is decided by voting.
As the RF algorithm optimizes the decision accuracy by combining the results of multiple decision trees, the RF algorithm usually has better accuracy than traditional automated classification algorithms; at the same time, the algorithm can make the training and classification processes highly parallelized. Especially when the sample features are of high dimensionality, the model can still run efficiently and reduce the overfitting phenomenon [22], which further improves the overall prediction performance of the model. The parameters of random forest methods in GEE include the number of decision trees, the number of variables per split, the fraction of input to bag per tree, the maximum number of leaf nodes and the randomization seed. In this article, we trialed many parameter settings and recorded the accuracy, and found a balance between operational efficiency and the highest operational accuracy for the following parameter settings: number of decision trees: 120; the number of variables per split: the square root of the number of variables; the fraction of input to bag per tree: 0.5; maximum number of leaf nodes in each tree: no limit; randomization seed: 0.5.
In total, there are 4 land use classes used in this study, namely cropland, woodland, water bodies and built-up lands. We obtained a land classification map for each year, containing four land use types using random forest classification under the GEE platform. Then, we used the Tabulate Area tool of ArcGIS10.2 software to calculate the area of each land use type. After that, we obtained 4 area values for each land use type every year from 2000 to 2020.
2.3.5. Evaluation of LULC Data Accuracy
In order to evaluate the sample point construction method under the principle of “multi-source consistency” and “time-series stability”, and to confirm whether these methods are capable of automating long-time series and high-accuracy land use/cover mapping tasks, we evaluated the results of the land use/cover data set from 2000 to 2020 year-by-year based on the accuracy assessment ideas proposed by Olofsson [33]. The classification accuracy was assessed using the confusion matrix (CM) method, a widely used approach based on the comparison of the RF classification mapping outputs with the known reference data (ground truth values) [34,35]. The confusion matrix was obtained using the built-in algorithm “errorMatrix” in the GEE platform. Some specific accuracy metrics were derived from the following matrix: Overall Accuracy (OA) through the built-in algorithm “accuracy”, Producer’s Accuracy (PA) (also known as “recall”) through the built-in algorithm “producersAccuracy”, and User’s Accuracy (UA) (also known as “precision”) through the built-in algorithm “.consumersAccuracy”.
The confusion matrix represents the relationship between the known reference data (ground truth values) on each land use/cover type and the corresponding results of the classification process; user accuracy represents the frequency that the classifications on the map will appear on the ground; and producer accuracy represents the proportion of the results of each classification judged correctly on the map to the total observed values.
2.3.6. Principal Components Analysis
We introduced several socioeconomic and natural climate indicators to analyze the drivers of land use change, but there may be strong correlations (expressing similar information) between different indicators. Therefore, principal components analysis was first applied to filter the variables in this study.
Principal components analysis (PCA) is a multivariate statistical method to examine the correlation between multiple variables, which replaces the original variables with a new set of mutually uncorrelated composite indicators by regrouping several indicators with a certain correlation. The core idea is to reduce the dimensionality of the variable data set, while preserving the information of the variable data set variation as much as possible. This is performed via the orthogonal transformation of a series of potentially correlated variables into a new set of linearly ordered uncorrelated variables, with the top few variables retaining most of the variation in the original variables [36]; the transformed set of new variables is called principal components and is applied in the subsequent analysis.
In total, 9 variables (total summer rainfall, total annual rainfall, total population, agricultural population, urbanization rate, gross domestic product, manufacturing value added, industrial value added and agriculture value added) (Supplementary Table S2) were input into the PCA to obtain the principal component. We collected each data set year-by-year during the period 2000–2020 in the pre-processing. The principal component analysis was performed with the support of SPSS.
2.3.7. Multiple Regression Model
Multiple linear regression refers to regression analysis with two or more independent variables. In fact, in the study of practical problems, the change in the dependent variable is often affected by several important factors. At this time, it is necessary to use two or more influencing factors as independent variables to explain the change in the dependent variable, which is more effective and realistic than using only one independent variable for the estimation. The parameter estimation of the multiple regression model is the same as the linear regression equation, and the least square method is used to solve the parameters under the premise that the sum of squares of the error is required to be the smallest.
The multiple regression model is as follows:
where denote the regression coefficients and β is a constant term.
In the multiple regression analysis, we used various land use/cover type areas as the dependent variables and the principal components as the independent variables to obtain the regression model, the significance level and the R2 of typical land use types. Various land use/cover area values were obtained from RF classification mapping and area calculation process based on ArcGIS software mentioned in Section 2.3.4. Principal components are obtained from PCA based on 9 natural and social indicators, which have been expressed in Section 2.3.6.
The multiple linear regression analysis was performed with the support of R software with the MASS package in the study.
3. Results
3.1. Accuracy Assessment of Mapping Results
With the support of GEE, this study obtained the land use/cover data set of Vietnam for 2000–2020 (spatial resolution of 30 m) using the above method. The overall accuracy of this data set was 0.91 ± 0.02 (Table 2). In terms of different land use types (Table 3) for the period 2000–2020, the user accuracy and producer accuracy of water bodies and built-up land types were relatively high (0.95 ± 0.01 and 0.90 ± 0.01 for water bodies; 0.96 ± 0.01 and 0.95 ± 0.02 for built-up land), but those of cropland and woodland were relatively low (0.82 ± 0.03 and 0.82 ± 0.03 for cropland; 0.89 ± 0.03 and 0.95 ± 0.04 for woodland).
Table 2.
Accuracy assessment of different land use/land cover data sets from 2000 to 2020.
Table 3.
Accuracy assessment of different land use/land cover types.
The results (Table 2 and Table 3) show that the classification accuracy of water bodies and built-up land was high, which may be related to the introduction of additional environmental background data and human activity element data, such as the nighttime light products DEM, and NDWI in this study. Compared with the high accuracy of water bodies and construction land, the classification accuracy of cropland and woodland is relatively poor. The reason is that some croplands are easily misclassified as woodlands (e.g., bush) and wetlands (e.g., paddy land), and some woodlands are easily misclassified as cropland (e.g., bush). (Table 4).
Table 4.
Confusion matrix of validations (round to integers) for land use/land cover data sets over the past 21 years.
3.2. Spatial Distribution and Dynamic Changes
In 2020, woodland and cropland were the main types in the Vietnam region in general (Figure 4). Woodland has the largest distribution area, followed by cropland, with an area share of 54.62% and 37.90%, respectively; water bodies, with 5.20% of the national land area; and the smallest area was built-up land, with only 2.28%.
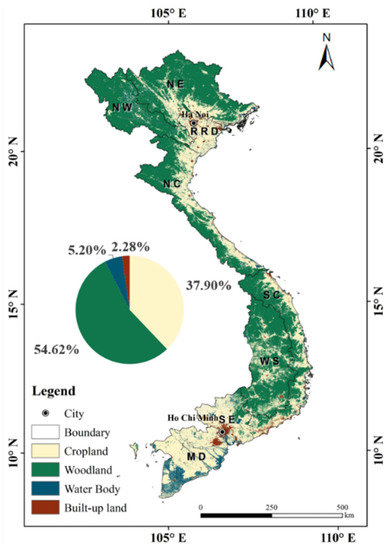
Figure 4.
Land use/land cover map in Vietnam in 2020.
Spatially, cropland is mainly concentrated in the low elevation plains, such as the Mekong River Delta in the south and the Red River Delta in the northeast of the study area; woodland is mainly distributed in the middle-altitude and high-altitude mountains and hilly areas, such as the Giai Song Chao Re mountain in the north of the study area and the Truong Son mountain in the middle and south of the study area; water bodies are mainly distributed in the Red River Delta in the northeast and Mekong River Delta in the south of the study area, including Ca Mau, Bac Lieu and Kien Giang provinces; built-up land is sporadically distributed in the eastern coastal areas, especially in the two major plains in the northeast and south, where there are some large cities distributed, such as Ha Noi and Ho Chi Minh.
During the period 2000–2020, the study area generally showed a decrease in the area of cropland, a significant increase in the area of water bodies and built-up land and an almost constant area of woodland (Figure 5A). The changes were also consistent with the area percentage change in LULC composition (Figure 5B), where the area percentages of water bodies and built-up lands increased; however, that of cropland decreased.
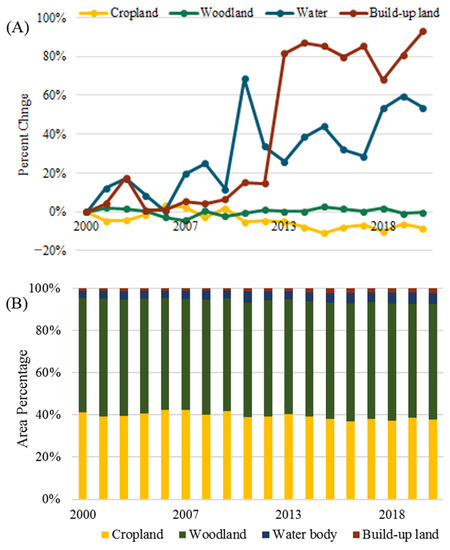
Figure 5.
Change tendencies (A) and area percentages (B) of various land use/land cover types from 2000 to 2020.
Specifically, the largest increase in the study area was built-up land (0.35 × 10⁴ km2, 93.49%). The rapid increase in construction land mainly occurred after 2011. The area of water bodies also showed a continuously increasing trend (0.59 × 10⁴ km2, 54.19%). The area of woodland only showed a slight change. However, the area of cropland showed a general decrease (1.17 × 10⁴ km2, 8.64%). Cropland showed a yearly decrease during the period 2000–2005, a slight increase between 2005 and 2009 and another decrease during the period 2009–2020.
From the year 2000 to 2020, the area of cropland transferred out reached 3.15 × 10⁴ km2, mainly from woodland and water bodies (Table 5), mostly in the southern (Ca Mau, Bac Lieu, Soc Trang, Long An and Dong Nai) and central (Dak Lak and Gia Lai) provinces of the study area, with little distribution in the northern part (Lang Son and Quang Ninh); during the same period, the area of cropland transferred in reached 2.11 × 10⁴ km2, mainly from woodland and water bodies, with the most distribution in the northern (Tuyen Quang, Yen Bai and Thai Nguyen) and south-central areas (Dak Nong, Lam Dong and Ninh Thuan) of the study area; in general, cropland showed a shrinking trend (Figure 6).
Table 5.
Land-use/land cover transfer matrix in Vietnam during the period 2000–2020.
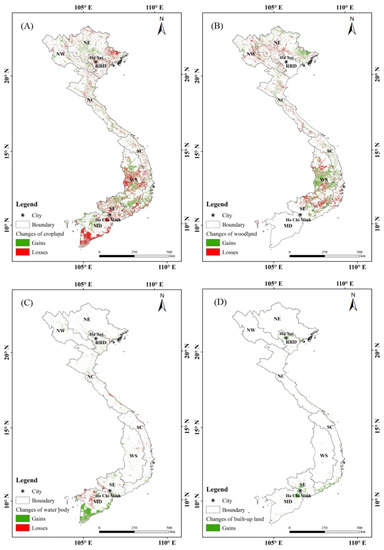
Figure 6.
Spatial distributions of gains/losses of cropland (A), woodland (B), water body (C) and built-up land (D) during the period 2000–2020. Loss indicates that the land cover category was converted to other land cover categories, while gain shows that other land use types were transferred to the given land cover type from 2000 to 2020.
The conversion area of woodland to cropland and water bodies (Table 5) was 1.78 × 10⁴ km2 and was distributed in the northwest (Lao Cai, Yen Bai and Son La) and most of the central part (Dak Nong, Lam Dong and Binh Phuoc) of the study area; the transferred area of woodland land reached 1.89 × 10⁴ km2, mainly from cropland and water bodies, and was mainly distributed in a small part of the south-central parts of the study area (Dak Lak and Gia Lai) (Figure 6); in general, the area of woodland in the study area barely changed.
The transferred out area of water bodies was 0.49 × 10⁴ km2, and the main transferred out types were cropland and built-up land (Table 5), which are mainly distributed in the Mekong River basin in the south of the study area, specifically, An Giang, Dong Thap and Can Tho; the transferred in area of water bodies was 1.07 × 10⁴ km2, and the main transferred in types were cropland and woodland, which are also distributed in the southern parts of Vietnam, including Bac Lieu, Ca Mau and Kien Giang (Figure 6). In general, the area of water bodies in the study area showed an increasing trend.
The area of built-up land transferred in was 0.35 × 10⁴ km2, and the main transfer types were cropland and water bodies (Table 5), which are mainly distributed in the northern parts of the study area (Bac Ninh, Ha Noi and Hung Yen) and the southern core urban areas (Long An, Tien Giang and Binh Duong) (Figure 6).
3.3. Analysis of Driving Mechanism Based on Statistical Relationship
Through principal component analysis, information on the changes in all nine indicators could be concentrated on two principal components (Table 6). The first principal component (F1) is a characterization of economic development, mainly reflecting the changes in the gross domestic product (X6), industrial value added (X8), manufacturing value added (X7), total population (X3) and urbanization rate (X5). The second principal component (F2) is a characterization of regional climate change, mainly reflecting total summer rainfall (X1) and total annual rainfall (X2).
Table 6.
Rotated component matrix of the principal component analysis.
Through multiple linear regression analysis, the statistical relationship model of land area change and the principal components of the driving factors could be obtained (Table 7). Among them, the driving relationship models of cropland, and built-up land passed the significance test, while the driving relationship models of woodland area change did not pass the significance test. The specific models showed the following:
Table 7.
Relationships between land cover change and principal components in different types.
Cropland area showed a negative relationship with economic development (F1) and a positive relationship with climate change (F2). This implies that urban construction accompanying national economic development results in the shrinkage of the cropland area; however, the cropland area in the study area, especially paddy fields, may increase along with increased rainfall due to global climate change, etc.
The area of water bodies was negatively correlated with economic factors (F1) and positively correlated with regional climate components (F2), but was mainly influenced by regional climate change. This suggests that national economic development in Vietnam may result in the encroachment of some traditional water bodies by urban and rural construction sites, but it is clear that this encroachment process will not be a major factor. However, climate change, especially increased rainfall, will result in a significant expansion in the area of densely packed waters in the deltas of the two rivers in the north and south of Vietnam.
There was a very significant positive relationship between urban and rural built-up land area and macroeconomics (F1), and no relationship with climate change. Obviously, this reflects the historical process of the rapid expansion of urban areas with the rapid development of the national economy and the gradual acceleration of the urbanization process in Vietnam.
The area of woodland was negatively correlated with the economy (F1) and positively correlated with climate change, but mainly showed the influence of the remaining climate. This reflects the encroachment of urban development/construction land expansion on traditional woodland, but this encroachment process is not a major factor (R2 = 0.04, p > 0.05). However, climate change (mainly the increase in precipitation) will increase the area of woodland cover within Vietnam.
4. Discussion
Using the GEE platform and the principle of “multi-source consistency” and “time-series stability” to build a sample data set, combined with the random forest machine learning algorithm, this study completed the entire land use/cover mapping task quickly with high accuracy, at a national regional scale in Vietnam. However, the “classification followed by comparison” approach we used probably ignores the continuity of the temporal changes in land use/cover types, which may have led to irregular and jumpy changes in meta-land cover types at different time points [8,15,37,38,39]. This possibly affected the accuracy and credibility of the analysis of land cover change patterns in the study area. On the other hand, constrained by the accuracy of RF classification, this study did not distinguish between natural woodland, scrub woodland and economic woodland among woodland types; open water and wetland in water body types; or dryland and paddy fields in cropland types. This may have led to the land mapping results obtained from the study being too coarse and not precise enough in terms of the land classification system. It should be noted that Landsat 8 replaced Landsat 5/7 after 2013. There are minor differences in sensor features, which may affect the land mapping process supported by the same RF model and parameters. In addition, the authors also carried out accuracy assessment for the land data sets in 2000, 2010 and 2020 based on random verification samples. The results of those validation processes are very close to those presented in Table 4. However, in any case the practice based on 600 “time-series stable” samples shown in this paper is different from the classic method normally supported by random samples. It may be necessary to carry out a comparative study based on two different methods in the future.
The spatial pattern of land use/cover and change trends obtained in this study are generally consistent with the results of previous studies. For example, Minderhoud et al. found that cropland in the Mekong Delta was significantly transformed into built-up land from 1988 to 2009 [40], and Leonardo et al. found a similar trend in the Tam Giang-Cau Hai Lagoon area in the central part of the study area [26]. Muller et al. found that, since the government proposed the intensive agricultural production and forest protection policy in 1992, the forest coverage in the Dak Lak area has shown an increasing trend [41]. Tran et al. found that the area of water bodies in Ca Mau province in the southern part of the study area increased significantly from 1973 to 2011, which was mainly reflected in the development of the aquaculture industry [42]. Our results revealed the temporal dynamics of major land use/cover types over long time periods on national and provincial scales.
In this paper, we applied a combination of principal component analysis and multiple linear regression analysis to determine the combined effects of natural climatic and socioeconomic factors on land use/cover type changes. The area change in built-up land was significantly correlated with macroeconomic indicators, such as population and urbanization growth, which means that some other land types were transformed into built-up land as the urbanization process advanced. This is also consistent with previous findings in the local areas of Vietnam (e.g., Mekong Delta region, Tam Giang-Cau Hai Lagoon region) [26,40]. However, for cropland, woodland, and water bodies, although the multiple regression models of area change with each key factor reached a statistical level of 0.05 overall, specific significant influencing factors were not clarified. This modeling approach based on statistical analysis has limitations. The multiple linear regression method is mainly based on the correlation between factors to measure, which does not imply a strict causal relationship between the independent and dependent variables.
5. Conclusions
To address the key issues of the lack of national-scale, high-precision, automated spatio-temporal continuous land use/cover data sets, and the scarcity of studies on the driving mechanisms of land use change in Vietnam, this study used the GEE platform, based on Landsat satellite imagery and several other important auxiliary data. We applied “multi-source consistency” and “time-series stability” and RF methods to generate a high-precision land use/cover data product in Vietnam during the period 2000–2020. The technical route and modeling approach adopted in this paper are important references for similar studies to be conducted in other regions in the future.
This study found that the land cover types in the Vietnam region are dominated by cropland and woodland, and the area of built-up land and water bodies has increased significantly over the past 20 years; the area of woodland did not show significant changes. The expansion of built-up land is driven by regional economic development, and the area changes in cropland, water bodies and woodland are influenced by both national economic development and climate change. The results of the study have important referential value for analyzing the relationship between land use/cover change and regional economic development and industrial structure in Vietnam. This research helps others gain an understanding of the response processes and mechanisms of regional land systems in the context of global climate change and regional economic and social development, and with promoting sustainable development in the study area.
Supplementary Materials
The following supporting information can be downloaded at: https://www.mdpi.com/article/10.3390/rs14071600/s1, the detailed data introduction uploaded as a DOC file, Table S1: Datasets used in the study; Table S2: Natural and Social indicators used in the PCA.
Author Contributions
Conceptualization, Y.H.; data curation, X.G. and J.Y.; investigation, X.G.; methodology, Y.H.; supervision, Y.H.; writing—original draft, X.G.; writing—review and editing, X.G., J.Y. and Y.H. All authors have read and agreed to the published version of the manuscript.
Funding
This research was supported by the National Natural Science Foundation of China (42130508, 41977421), National Key Research and Development Program of China (2021YFD1300501, 2016YFB0501502) and Strategic Priority Research Program of the Chinese Academy of Sciences (XDA19040301, XDA20010202, XDA23100200).
Institutional Review Board Statement
Not applicable.
Informed Consent Statement
Not applicable.
Data Availability Statement
Not applicable.
Acknowledgments
We would like to express our sincere thanks to the anonymous reviewers, as the comments and suggestions were of great help to improve the quality of this paper.
Conflicts of Interest
The authors declare no conflict of interest.
References
- Lawler, J.J.; Lewis, D.J.; Nelson, E.; Plantinga, A.J.; Polasky, S.; Withey, J.C.; Helmers, D.P.; Martinuzzi, S.; Pennington, D.; Radeloff, V.C. Projected land-use change impacts on ecosystem services in the United States. Proc. Natl. Acad. Sci. USA 2014, 111, 7492. [Google Scholar] [CrossRef] [PubMed] [Green Version]
- Foley, J.A.; DeFries, R.; Asner, G.P.; Barford, C.; Bonan, G.; Carpenter, S.R.; Chapin, F.S.; Coe, M.T.; Daily, G.C.; Gibbs, H.K.; et al. Global consequences of land use. Science 2005, 309, 570. [Google Scholar] [CrossRef] [PubMed] [Green Version]
- Turner, B.L., II; Lambin, E.F.; Reenberg, A. The emergence of land change science for global environmental change and sustainability. Proc. Natl. Acad. Sci. USA 2007, 104, 20666. [Google Scholar] [CrossRef] [PubMed] [Green Version]
- Alkama, R.; Cescatti, A. Biophysical climate impacts of recent changes in global forest cover. Science 2016, 351, 600. [Google Scholar] [CrossRef] [PubMed] [Green Version]
- Fan, Z.; Li, S.; Fang, H. Explicating the mechanisms of land cover change in the New Eurasian Continental Bridge Economic Corridor region in the 21st century. J. Geogr. Sci. 2021, 31, 1403. [Google Scholar] [CrossRef]
- Zhang, Y.; Chen, J.; Chen, L.; Li, R.; Zhang, W.; Lu, N.; Liu, J. Characteristics of land cover change in Siberia based on GlobeLand30, 2000–2010. Prog. Geogr. 2015, 34, 1324. [Google Scholar]
- Dewan, A.M.; Yamaguchi, Y. Land use and land cover change in Greater Dhaka, Bangladesh: Using remote sensing to promote sustainable urbanization. Appl. Geogr. 2009, 29, 390. [Google Scholar] [CrossRef]
- Ye, J.; Hu, Y.; Zhen, L.; Wang, H.; Zhang, Y. Analysis on Land-Use Change and Its Driving Mechanism in Xilingol, China, during 2000–2020 Using the Google Earth Engine. Remote Sens. 2021, 13, 5134. [Google Scholar] [CrossRef]
- Piao, Y.; Jeong, S.; Park, S.; Lee, D. Analysis of Land Use and Land Cover Change Using Time-Series Data and Random Forest in North Korea. Remote Sens. 2021, 13, 3501. [Google Scholar] [CrossRef]
- You-hua, R.A.N.; Xin, L.I.; Ling, L.U. Accuracy Evaluation of the Four Remote Sensing Based Land Cover Products over China. J. Glaciol. Geocryol. 2009, 31, 490. [Google Scholar]
- Bai, W.; Guo, D.; Tian, Q.; Liu, N.; Cheng, W.; Li, L.; Zhang, W.-H. Differential responses of grasses and forbs led to marked reduction in below-ground productivity in temperate steppe following chronic N deposition. J. Ecol. 2015, 103, 1570. [Google Scholar] [CrossRef]
- Jun, C.; Ban, Y.; Li, S. Open access to Earth land-cover map. Nature 2014, 514, 434. [Google Scholar] [CrossRef] [PubMed] [Green Version]
- Chen, J.; Chen, J.; Liao, A.; Cao, X.; Chen, L.; Chen, X.; Peng, S.; Han, G.; Zhang, H.; He, C.; et al. Concepts and Key Techniques for 30 m Global Land Cover Mapping. Acta Geod. Cartogr. Sin. 2014, 43, 551. [Google Scholar]
- Ran, Y.; Li, X. The world’s first comprehensive high-resolution land cover map—Review of China’s 30m resolution global land cover map. Sci. Sin. 2015, 45, 1243. [Google Scholar]
- Hu, Y.; Hu, Y. Land Cover Changes and Their Driving Mechanisms in Central Asia from 2001 to 2017 Supported by Google Earth Engine. Remote Sens. 2019, 11, 554. [Google Scholar] [CrossRef] [Green Version]
- Su, B.; Noguchi, N. Discrimination of Land Use Patterns in Remote Sensing Image Data using Minimum Distance Algorithm and Watershed Algorithm. Eng. Agric. Environ. Food 2013, 6, 48–53. [Google Scholar] [CrossRef]
- Li, G.; Lu, D.; Moran, E.; Hetrick, S. Land-cover classification in a moist tropical region of Brazil with Landsat Thematic Mapper imagery. Int. J. Remote Sens. 2011, 32, 8207. [Google Scholar] [CrossRef] [Green Version]
- Bittencourt, H.R.; Clarke, R.T. Use of classification, and regression trees (CART) to classify remotely-sensed digital images. In Proceedings of the 2003 IEEE International Geoscience and Remote Sensing Symposium, Toulouse, France, 21–25 July 2003; pp. 3751–3753. [Google Scholar]
- Huang, C.; Davis, L.S.; Townshend, J.R.G. An assessment of support vector machines for land cover classification. Int. J. Remote Sens. 2002, 23, 725. [Google Scholar] [CrossRef]
- Shao, Y.; Lunetta, R.S. Comparison of support vector machine, neural network, and CART algorithms for the land-cover classification using limited training data points. Isprs J. Photogramm. Remote Sens. 2012, 70, 78. [Google Scholar] [CrossRef]
- Tassi, A.; Gigante, D.; Modica, G.; Di Martino, L.; Vizzari, M. Pixel- vs. Object-Based Landsat 8 Data Classification in Google Earth Engine Using Random Forest: The Case Study of Maiella National Park. Remote Sens. 2021, 13, 2299. [Google Scholar] [CrossRef]
- Breiman, L. Random forests. Mach. Learn. 2001, 45, 5. [Google Scholar] [CrossRef] [Green Version]
- Dong, J.; Xiao, X.; Menarguez, M.A.; Zhang, G.; Qin, Y.; Thau, D.; Biradar, C.; Moore, B., III. Mapping paddy rice planting area in northeastern Asia with Landsat 8 images, phenology-based algorithm and Google Earth Engine. Remote Sens. Environ. 2016, 185, 142. [Google Scholar] [CrossRef] [PubMed] [Green Version]
- Akar, Ö.; Güngör, O. Classification of multispectral images using Random Forest algorithm. J. Geod. Geoinf. 2012, 1, 105. [Google Scholar] [CrossRef] [Green Version]
- Zhang, D.D.; Zhang, L. Land Cover Change in the Central Region of the Lower Yangtze River Based on Landsat Imagery and the Google Earth Engine: A Case Study in Nanjing, China. Sensors 2020, 20, 2091. [Google Scholar] [CrossRef] [PubMed] [Green Version]
- Disperati, L.; Virdis, S.G.P. Assessment of land-use and land-cover changes from 1965 to 2014 in Tam Giang-Cau Hai Lagoon, central Vietnam. Appl. Geogr. 2015, 58, 48. [Google Scholar] [CrossRef]
- Van, T.T.; Wilson, N.; Thanh-Tung, H.; Quisthoudt, K.; Quang-Minh, V.; Xuan-Tuan, L.; Dahdouh-Guebas, F.; Koedam, N. Changes in mangrove vegetation area and character in a war and land use change affected region of Vietnam (Mui Ca Mau) over six decades. Acta Oecol.-Int. J. Ecol. 2015, 63, 71. [Google Scholar] [CrossRef] [Green Version]
- Chander, G.; Markham, B.L.; Helder, D.L. Summary of current radiometric calibration coefficients for Landsat MSS, TM, ETM+, and EO-1 ALI sensors. Remote Sens. Environ. 2009, 113, 893. [Google Scholar] [CrossRef]
- Hu, Y.; Zhang, Q.; Dai, Z.; Huang, M.; Yan, H. Agreement analysis of multi-sensor satellite remote sensing derived land cover products in the Europe Continent. Geogr. Res. 2015, 34, 1839. [Google Scholar]
- Defourny, P.; Schouten, L.; Bartalev, S.; Bontemps, S.; Cacetta, P.; De Wit, A.; Di Bella, C.; Gérard, B.; Giri, C.; Gond, V. Accuracy Assessment of a 300 m Global Land Cover Map: The GlobCover Experience. 2009. Available online: https://library.wur.nl/WebQuery/wurpubs/fulltext/14725 (accessed on 5 March 2022).
- Chen, J.; Chen, J.; Liao, A.; Cao, X.; Chen, L.; Chen, X.; He, C.; Han, G.; Peng, S.; Lu, M.; et al. Global land cover mapping at 30 m resolution: A POK-based operational approach. ISPRS J. Photogramm. Remote Sens. 2015, 103, 7. [Google Scholar] [CrossRef] [Green Version]
- Ashouri, H.; Hsu, K.-L.; Sorooshian, S.; Braithwaite, D.K.; Knapp, K.R.; Cecil, L.D.; Nelson, B.R.; Prat, O.P. PERSIANN-CDR Daily Precipitation Climate Data Record from Multisatellite Observations for Hydrological and Climate Studies. Bull. Am. Meteorol. Soc. 2015, 96, 69. [Google Scholar] [CrossRef] [Green Version]
- Olofsson, P.; Foody, G.M.; Herold, M.; Stehman, S.V.; Woodcock, C.E.; Wulder, M.A. Good practices for estimating area and assessing accuracy of land change. Remote Sens. Environ. 2014, 148, 42. [Google Scholar] [CrossRef]
- Congalton, R.G. A Review of Assessing the Accuracy of Classifications of Remotely Sensed Data. Remote Sens. Environ. 1991, 37, 35. [Google Scholar] [CrossRef]
- Liu, C.R.; Frazier, P.; Kumar, L. Comparative assessment of the measures of thematic classification accuracy. Remote Sens. Environ. 2007, 107, 606. [Google Scholar] [CrossRef]
- Jolliffe, I.T.; Cadima, J. Principal component analysis: A review and recent developments. Philos. Trans. R. Soc. A-Math. Phys. Eng. Sci. 2016, 374. [Google Scholar] [CrossRef] [PubMed]
- Zhu, Z.; Woodcock, C.E. Continuous change detection and classification of land cover using all available Landsat data. Remote Sens. Environ. 2014, 144, 152. [Google Scholar] [CrossRef] [Green Version]
- Kennedy, R.E.; Yang, Z.; Cohen, W.B. Detecting trends in forest disturbance and recovery using yearly Landsat time series: 1. LandTrendr—Temporal segmentation algorithms. Remote Sens. Environ. 2010, 114, 2897. [Google Scholar] [CrossRef]
- Hu, Y.F.; Dong, Y.; Batunacun. An automatic approach for land-change detection and land updates based on integrated NDVI timing analysis and the CVAPS method with GEE support. ISPRS J. Photogramm. Remote Sens. 2018, 146, 347. [Google Scholar] [CrossRef]
- Minderhoud, P.S.J.; Coumou, L.; Erban, L.E.; Middelkoop, H.; Stouthamer, E.; Addink, E.A. The relation between land use and subsidence in the Vietnamese Mekong delta. Sci. Total Environ. 2018, 634, 715. [Google Scholar] [CrossRef]
- Muller, D.; Zeller, M. Land use dynamics in the central highlands of Vietnam: A spatial model combining village survey data with satellite imagery interpretation. Agric. Econ. 2002, 27, 333. [Google Scholar] [CrossRef]
- Hanh, T.; Thuc, T.; Kervyn, M. Dynamics of Land Cover/Land Use Changes in the Mekong Delta, 1973-2011: A Remote Sensing Analysis of the Tran Van Thoi District, Ca Mau Province, Vietnam. Remote Sens. 2015, 7, 2899. [Google Scholar] [CrossRef] [Green Version]
Publisher’s Note: MDPI stays neutral with regard to jurisdictional claims in published maps and institutional affiliations. |
© 2022 by the authors. Licensee MDPI, Basel, Switzerland. This article is an open access article distributed under the terms and conditions of the Creative Commons Attribution (CC BY) license (https://creativecommons.org/licenses/by/4.0/).