
Identifying the Potential Dam Sites to Avert the Risk of Catastrophic Floods in the Jhelum Basin, Kashmir, NW Himalaya, India


 ,
,  ,
,  ,
,  ,
,  ,
,  and
and
Abstract
:1. Introduction
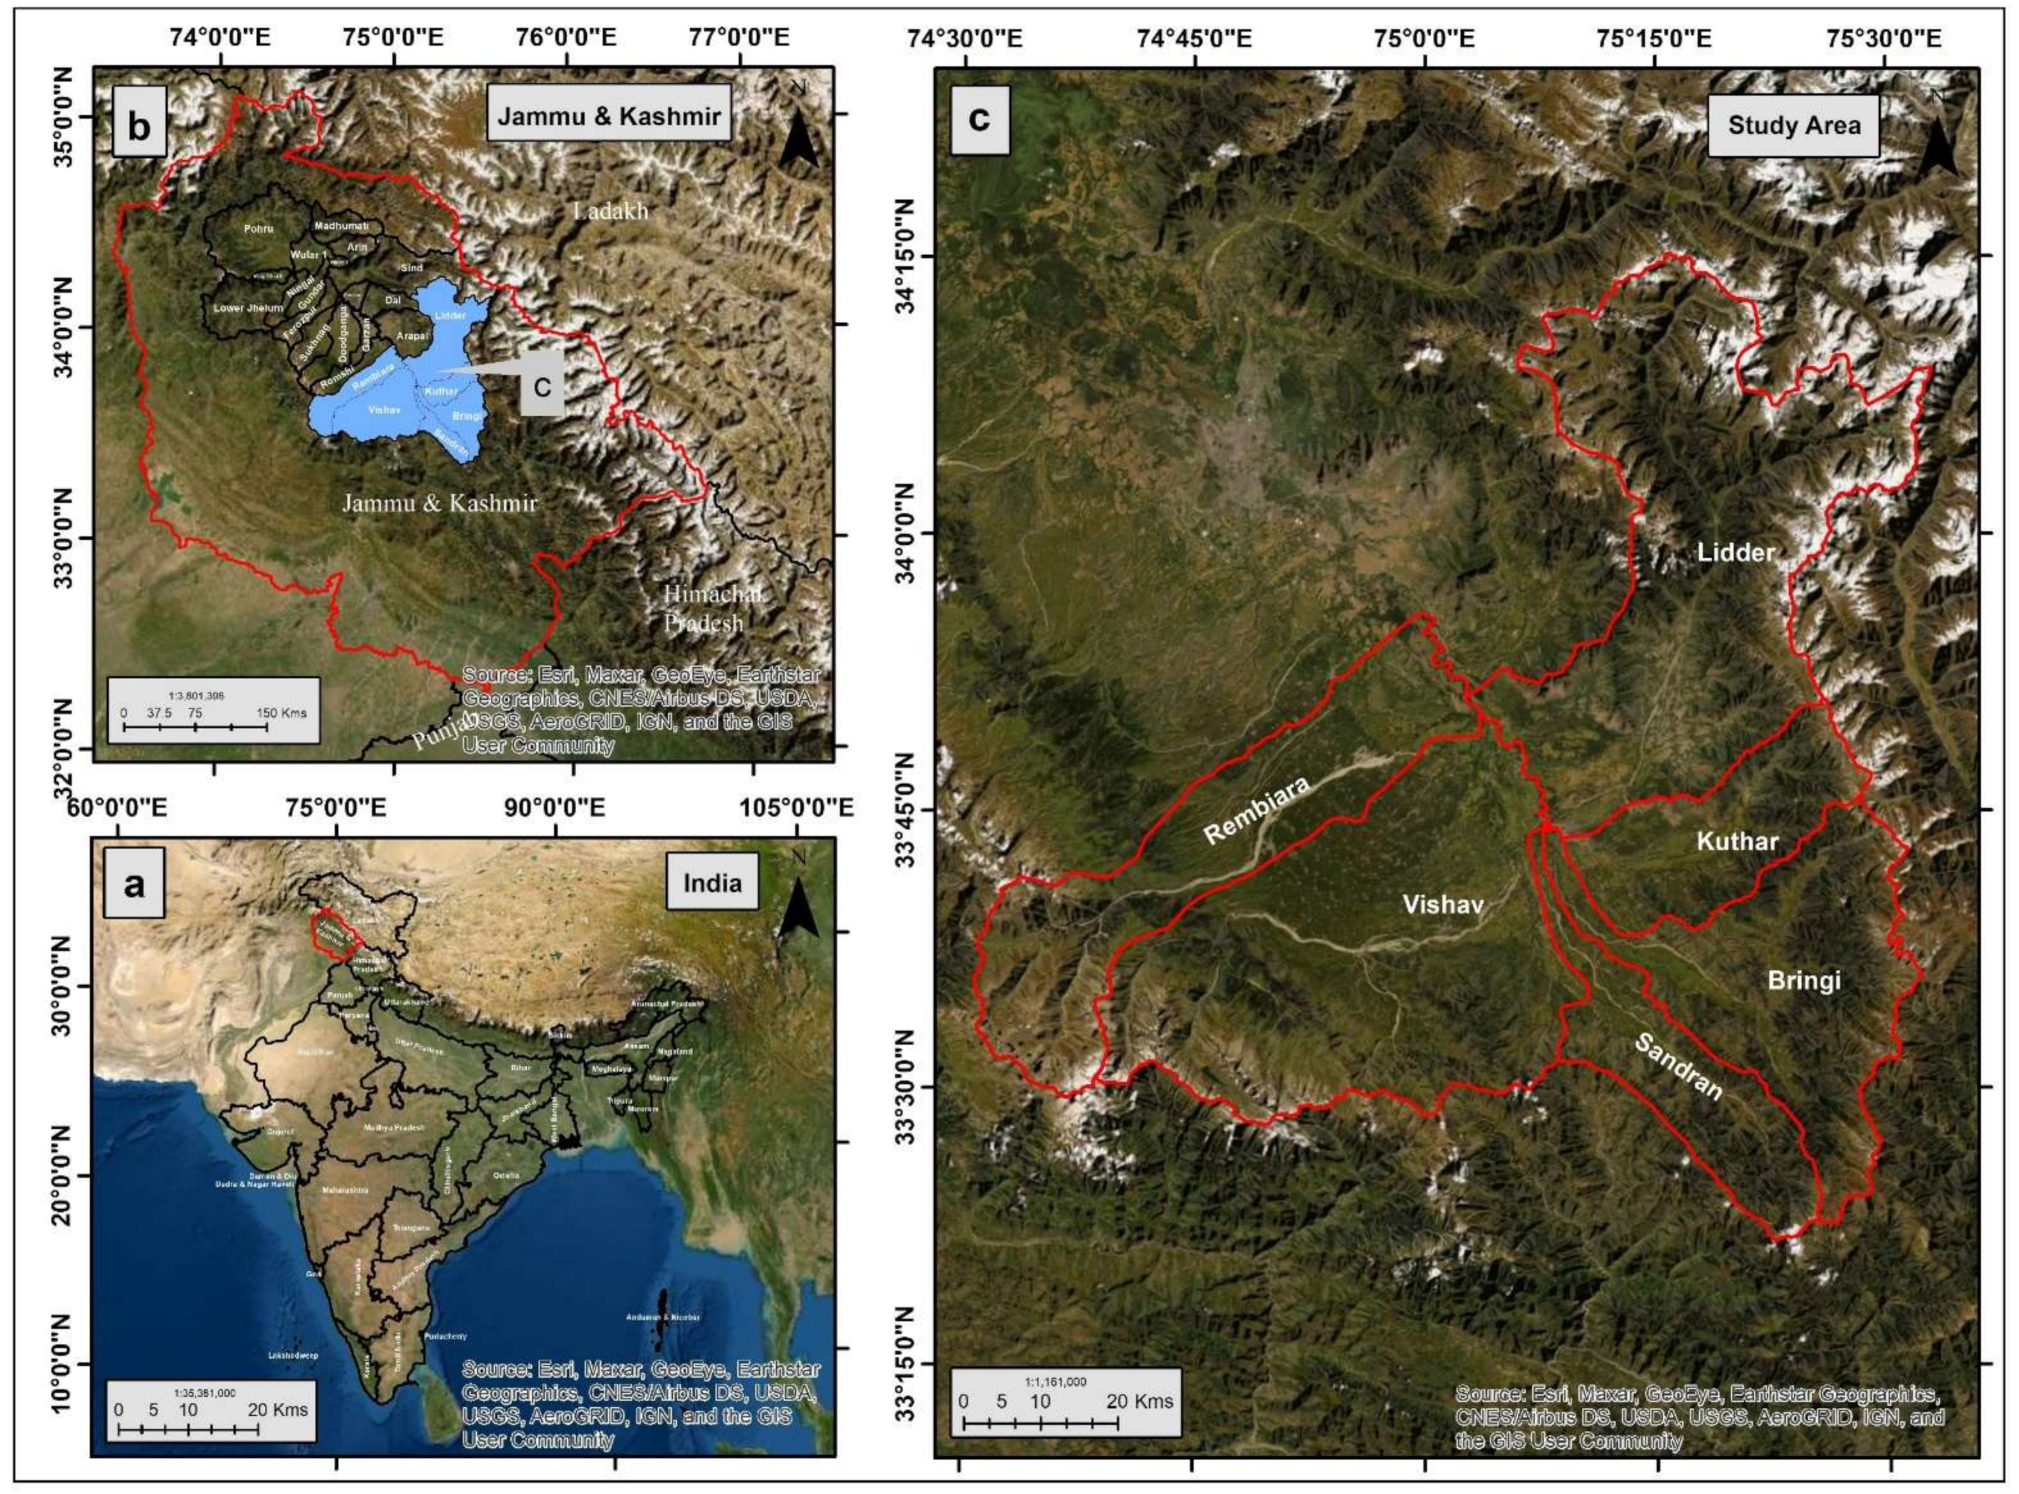
2. Study Area
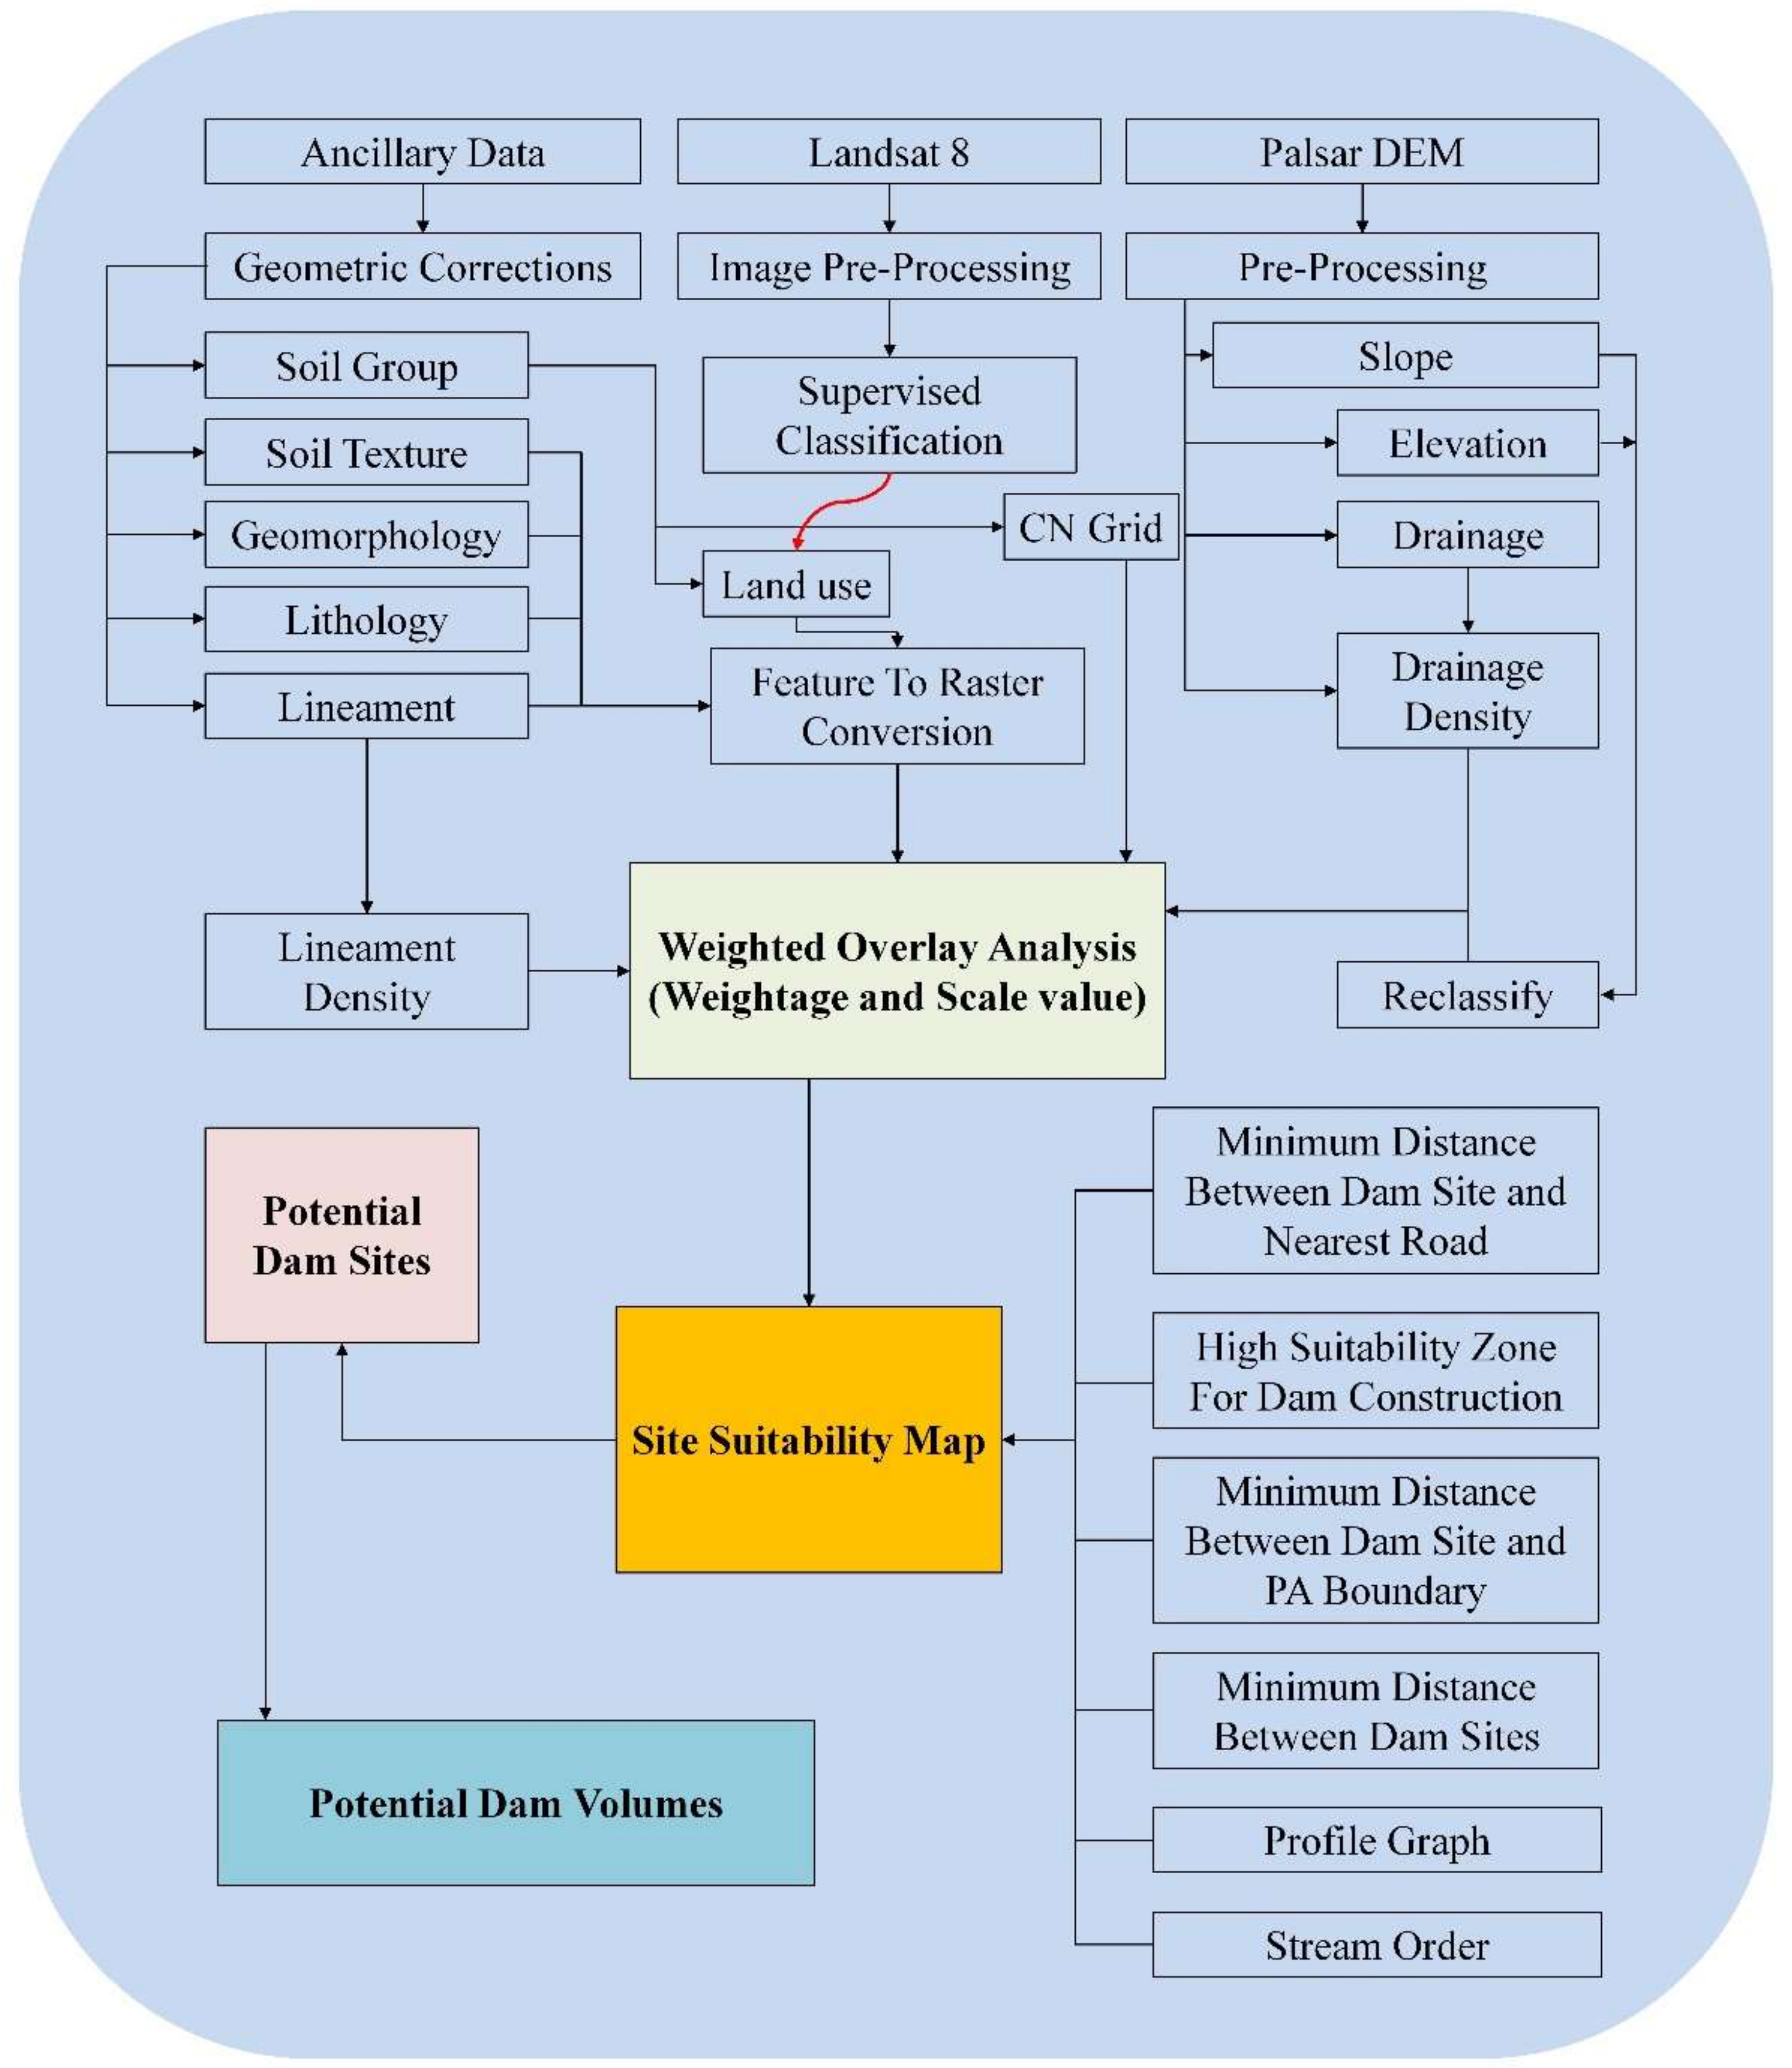
3. Materials and Methods
3.1. Datasets
3.2. Methods
3.2.1. Weighted Overlay Analysis
3.2.2. Determining the Dam Locations
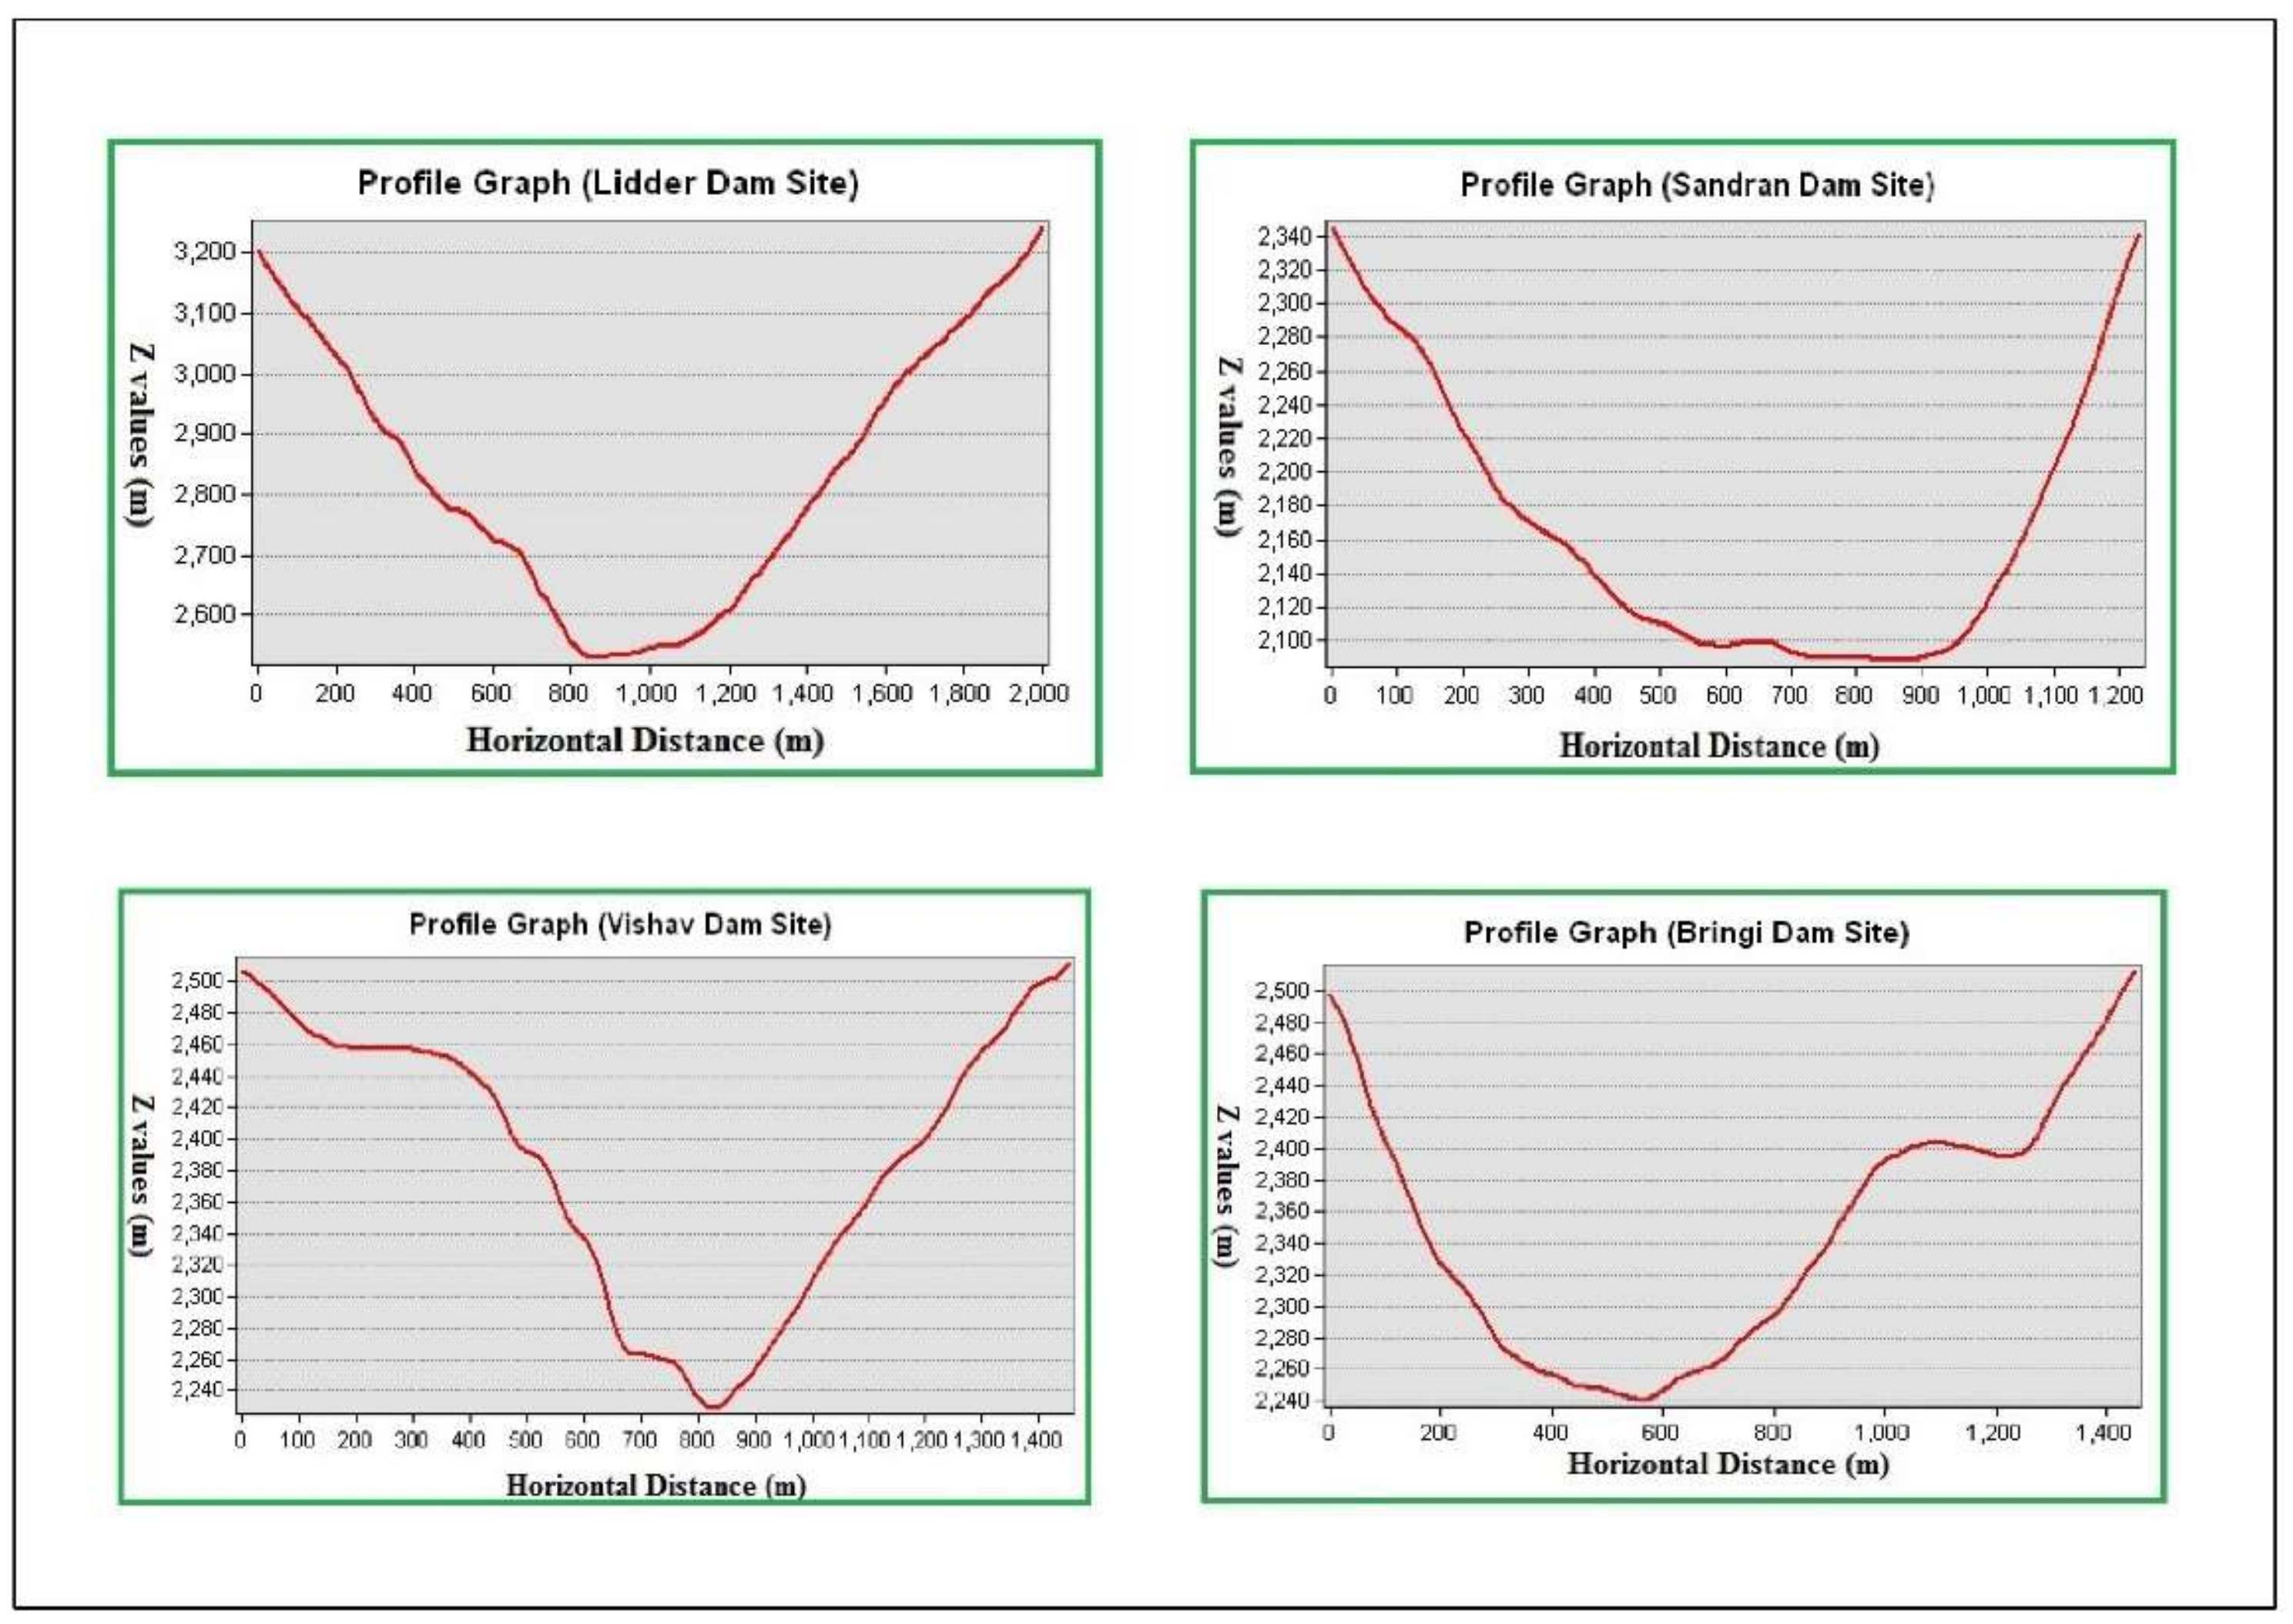
3.2.3. Calculating the Dam Volume
4. Results and Discussion
4.1. Parameter Weightages and Scale Values for MCA
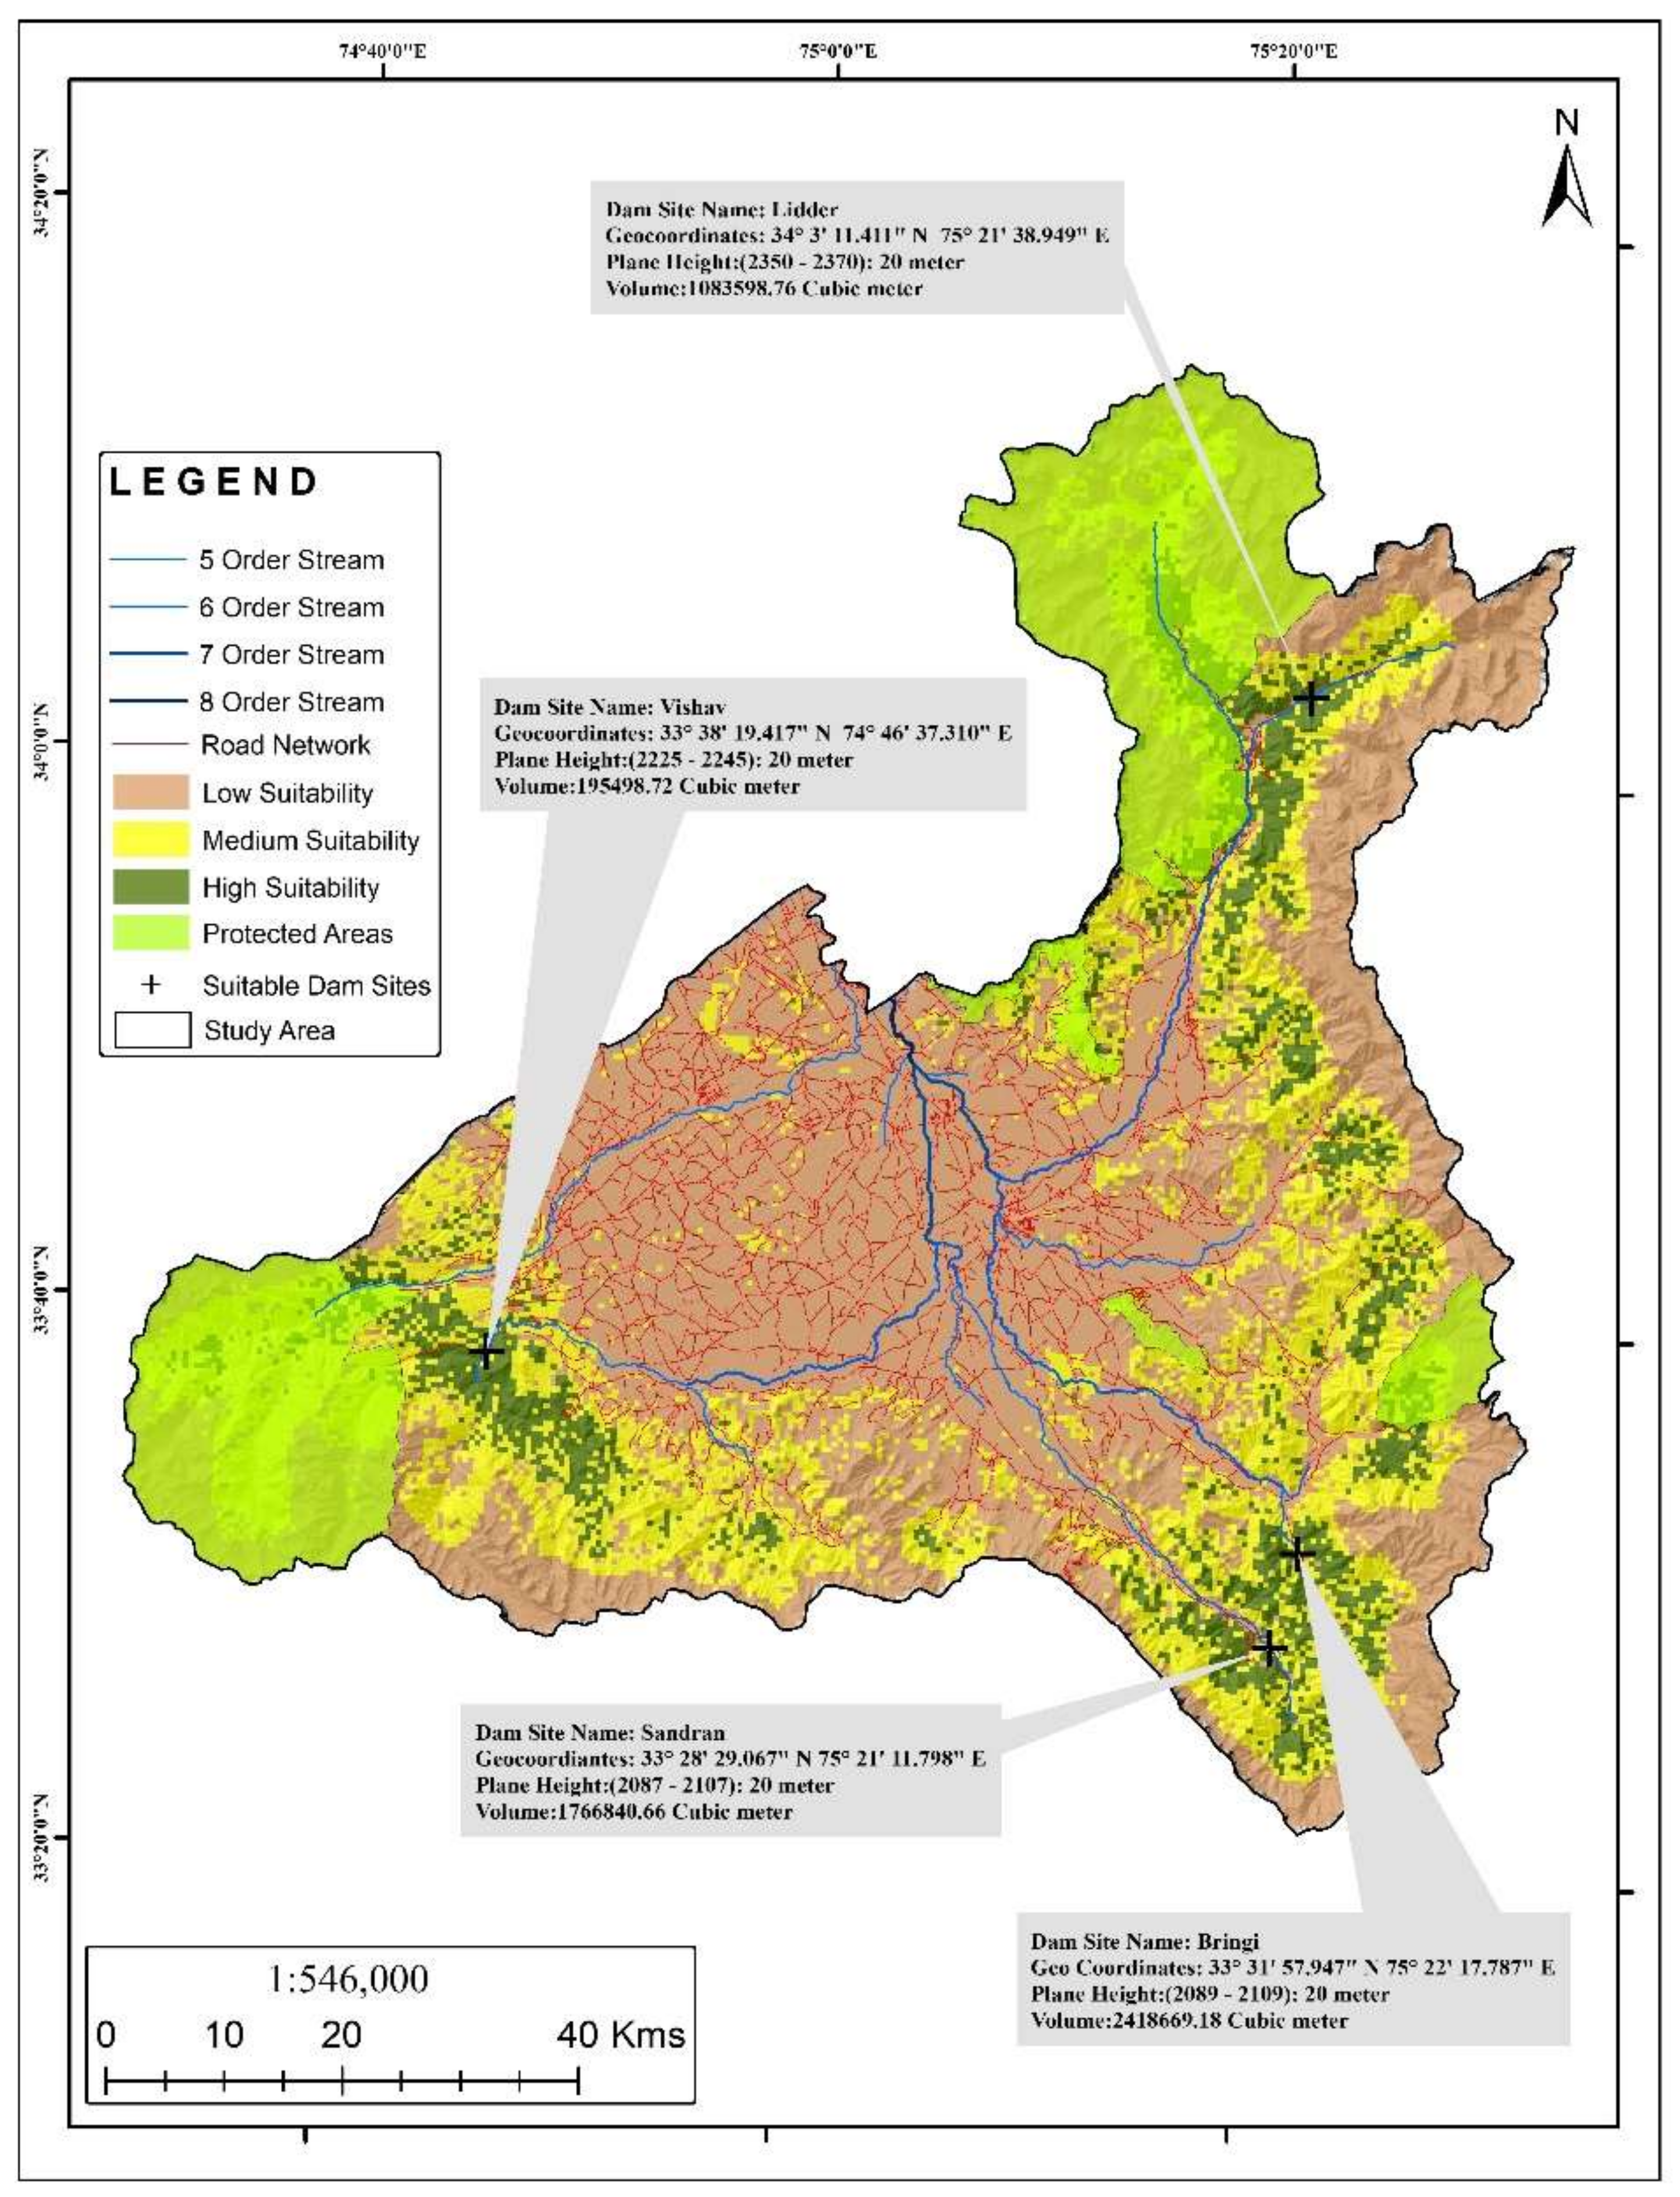
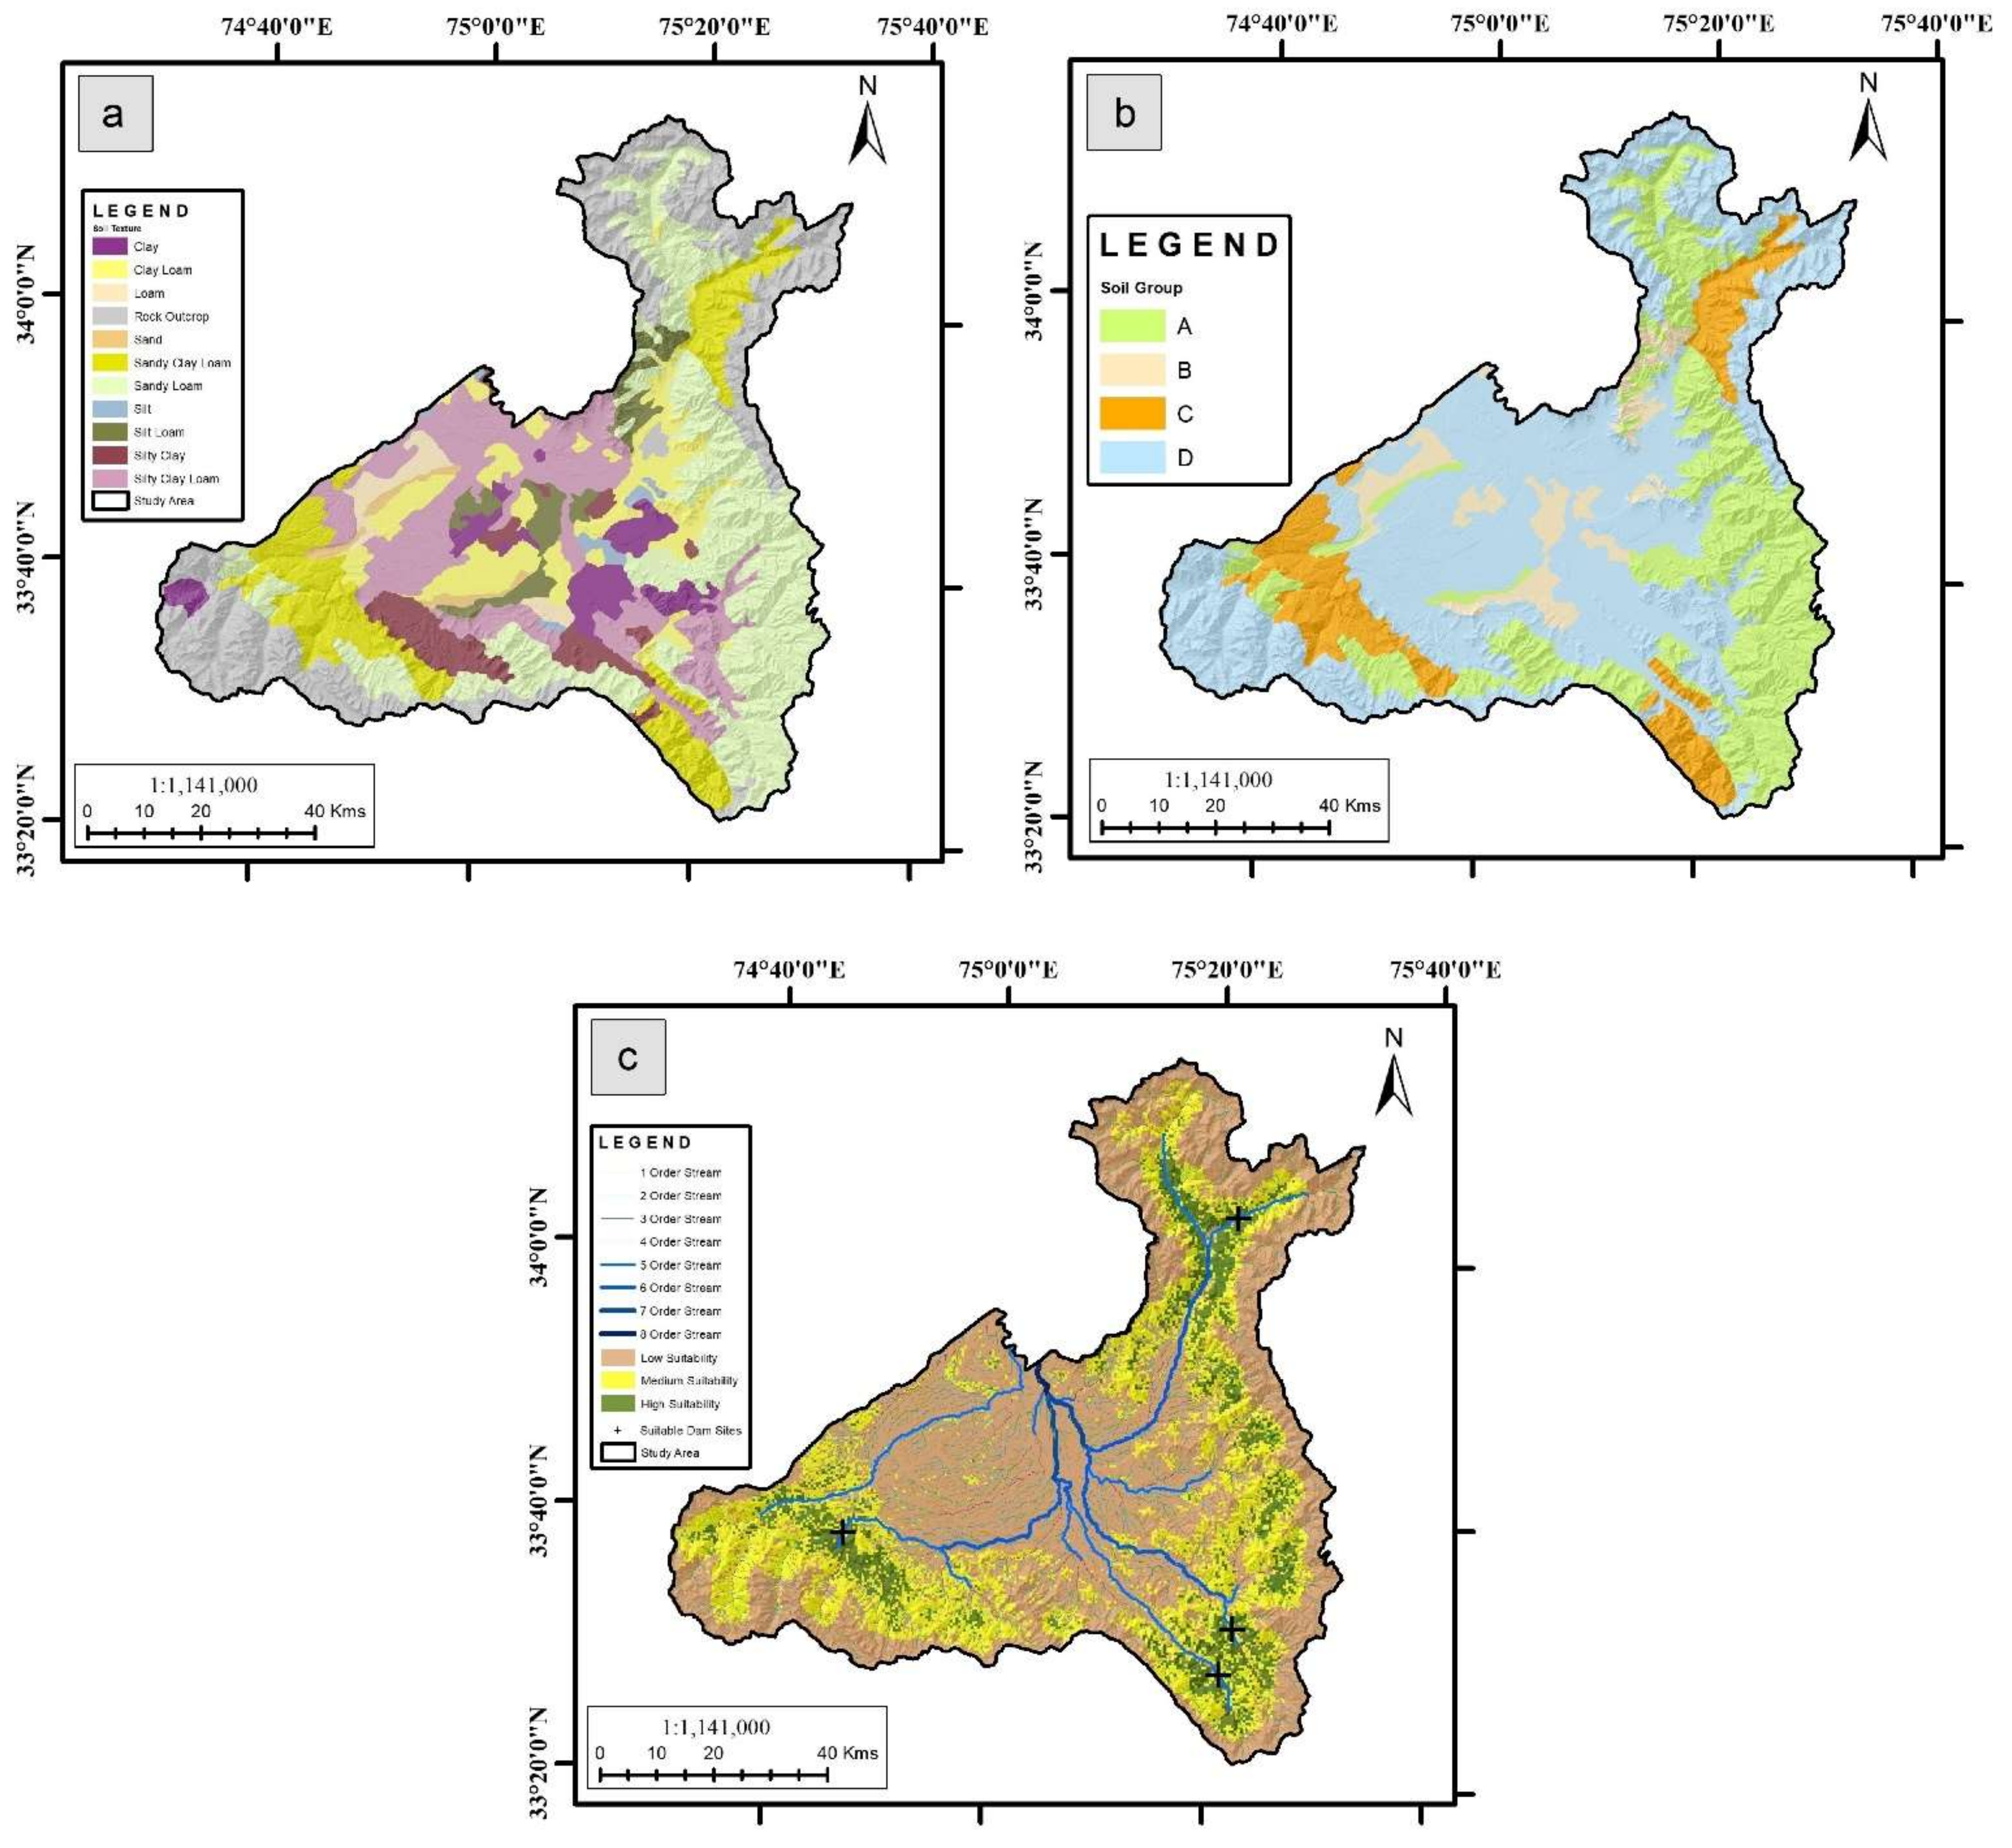
4.2. Suitable Dam Sites
4.3. Volumes of the Dam Sites
4.4. Validation and Open-and-Shut Mechanism for Flood Management
5. Conclusions
Author Contributions
Funding
Institutional Review Board Statement
Informed Consent Statement
Data Availability Statement
Acknowledgments
Conflicts of Interest
References
- Letcher, T. The Impacts of Climate Change: A Comprehensive Study of Physical, Biophysical, Social, and Political Issues; Elsevier: Amsterdam, The Netherlands, 2021. [Google Scholar]
- Kaltenborn, B.P.; Nellemann, C.; Vistnes, I.I. High Mountain Glaciers and Climate Change: Challenges to Human Livelihoods and Adaptation; UNEP, GRID: Arendal, Norway, 2010. [Google Scholar]
- Lala, J.M.; Rounce, D.R.; McKinney, D.C. Modeling the glacial lake outburst flood process chain in the Nepal Himalaya: Reassessing Imja Tsho’s hazard. Hydrol. Earth Syst. Sci. 2018, 22, 3721–3737. [Google Scholar] [CrossRef] [Green Version]
- Youssef, A.M.; Abu-Abdullah, M.M.; AlFadail, E.A.; Skilodimou, H.D.; Bathrellos, G.D. The devastating flood in the arid region a consequence of rainfall and dam failure: Case study, Al-Lith flood on 23th November 2018, Kingdom of Saudi Arabia. Z. Für Geomorphol. 2021, 63, 115–136. [Google Scholar] [CrossRef]
- Youssef, A.M.; Al-Harbi, H.M.; Zabramwi, Y.A.; El-Haddad, B.A. Human-Induced Geo-Hazards in the Kingdom of Saudi Arabia: Distribution, Investigation, Causes and Impacts. Geohazards Caused by Human Activity; Farid, A., Ed.; InTech: Horwich, UK, 2016; pp. 37–61. [Google Scholar]
- Dunn, R.J.; Stanitski, D.M.; Gobron, N.; Willett, K.M.; Ades, M.; Adler, R.; Allan, R.; Allan, R.P.; Anderson, J.; Argüez, A.; et al. Global climate. Bull. Am. Meteorol. Soc. 2020, 101, S9–S127. [Google Scholar] [CrossRef]
- Callaghan, T.V.; Jonasson, S. Arctic terrestrial ecosystems and environmental change. In The Arctic and Environmental Change; CRC Press: Boca Raton, FL, USA, 2019; pp. 59–76. [Google Scholar]
- Kanga, S.; Meraj, G.; Farooq, M.; Singh, S.K.; Nathawat, M.S. Disaster Management in the Complex Himalayan Terrains; Springer: Cham, Switzerland, 2022. [Google Scholar]
- Ali, N.; Alam, A.; Bhat, M.S.; Shah, B. Developing a Hazard Profile of the Kashmir Valley Through Historical Data Analysis for The Period 1900–2020. Nat. Hazards 2021. [Google Scholar]
- Tomar, P.; Singh, S.K.; Kanga, S.; Meraj, G.; Kranjčić, N.; Đurin, B.; Pattanaik, A. GIS-Based Urban Flood Risk Assessment and Management—A Case Study of Delhi National Capital Territory (NCT), India. Sustainability 2021, 13, 12850. [Google Scholar] [CrossRef]
- Akbulut, N.E.; Bayarı, S.; Akbulut, A.; Özyurt, N.N.; Sahin, Y. Rivers of Turkey. In Rivers of Europe; Elsevier: Amsterdam, The Netherlands, 2022; pp. 851–880. [Google Scholar]
- Rafiq, M.; Meraj, G.; Kesarkar, A.P.; Farooq, M.; Singh, S.K.; Kanga, S. Hazard Mitigation and Climate Change in the Himalayas–Policy and Decision Making. In Disaster Management in the Complex Himalayan Terrains; Springer: Cham, Switzerland, 2022; pp. 169–182. [Google Scholar]
- Flash Floods in Uttarakhand, Himachal Pradesh; Over 30 Feared Dead. IBNLive. 5 August 2012. Available online: https://web.archive.org/web/20120806080410/http://ibnlive.in.com/news/flash-floods-hit-uttarakhand-hp-jk-30-dead/278619-3-245.html (accessed on 2 January 2022).
- Shugar, D.H.; Jacquemart, M.; Shean, D.; Bhushan, S.; Upadhyay, K.; Sattar, A.; Schwanghart, W.; McBride, S.; de Vries, M.V.W.; Mergili, M.; et al. A massive rock and ice avalanche caused the 2021 disaster at Chamoli, Indian Himalaya. Science 2021, 373, 300–306. [Google Scholar] [CrossRef] [PubMed]
- Gobiet, A.; Kotlarski, S.; Beniston, M.; Heinrich, G.; Rajczak, J.; Stoffel, M. 21st century climate change in the European Alps—A review. Sci. Total Environ. 2014, 493, 1138–1151. [Google Scholar] [CrossRef] [PubMed]
- Europe Floods: At Least 120 Dead and Hundreds Unaccounted For. Available online: https://www.bbc.com/news/world-europe-57858829 (accessed on 2 January 2022).
- Meraj, G.; Romshoo, S.A.; Yousuf, A.R.; Altaf, S.; Altaf, F. Assessing the influence of watershed characteristics on the flood vulnerability of Jhelum basin in Kashmir Himalaya: Reply to comment by Shah 2015. Nat. Hazards 2015, 78, 1–5. [Google Scholar] [CrossRef]
- Romshoo, S.A.; Bhat, S.A.; Rashid, I. Geoinformatics for assessing the morphometric control on hydrological response at watershed scale in the Upper Indus Basin. J. Earth Syst. Sci. 2012, 121, 659–686. [Google Scholar] [CrossRef] [Green Version]
- Bhat, M.S.; Alam, A.; Ahmad, B.; Kotlia, B.S.; Farooq, H.; Taloor, A.K.; Ahmad, S. Flood frequency analysis of river Jhelum in Kashmir basin. Quat. Int. 2019, 507, 288–294. [Google Scholar] [CrossRef]
- Alam, A.; Bhat, M.S.; Farooq, H.; Ahmad, B.; Ahmad, S.; Sheikh, A.H. Flood risk assessment of Srinagar city in Jammu and Kashmir, India. Int. J. Disaster Resil. Built Environ. 2018, 9. [Google Scholar] [CrossRef]
- Bhatt, C.M.; Rao, G.S.; Farooq, M.; Manjusree, P.; Shukla, A.; Sharma, S.V.S.P.; Kulkarni, S.S.; Begum, A.; Bhanumurthy, V.; Diwakar, P.G.; et al. Satellite-based assessment of the catastrophic Jhelum floods of September 2014, Jammu & Kashmir, India. Geomat. Nat. Hazards Risk 2017, 8, 309–327. [Google Scholar]
- Rather, M.A.; Farooq, M. Remote Sensing & GIS for the Assessment of Flood Affected Population. A Case Study of September 2014 Floods in Kashmir J&K India. Int. J. Eng. Res. 2018, 7, 35–37. [Google Scholar]
- Malik, I.H. Spatial dimension of impact, relief, and rescue of the 2014 flood in Kashmir Valley. Nat. Hazards 2021, 1–19. [Google Scholar] [CrossRef]
- Meraj, G.; Romshoo, S.A.; Yousuf, A.R.; Altaf, S.; Altaf, F. Assessing the influence of watershed characteristics on the flood vulnerability of Jhelum basin in Kashmir Himalaya. Nat. Hazards 2015, 77, 153–175. [Google Scholar] [CrossRef]
- Romshoo, S.A.; Altaf, S.; Rashid, I.; Dar, R.A. Climatic, geomorphic and anthropogenic drivers of the 2014 extreme flooding in the Jhelum basin of Kashmir, India. Geomat. Nat. Hazards Risk 2018, 9, 224–248. [Google Scholar] [CrossRef] [Green Version]
- Meraj, G.; Khan, T.; Romshoo, S.A.; Farooq, M.; Rohitashw, K.; Sheikh, B.A. An integrated geoinformatics and hydrological modelling-based approach for effective flood management in the Jhelum Basin, NW Himalaya. Proceedings 2018, 7, 8. [Google Scholar] [CrossRef] [Green Version]
- Abu-Abdullah, M.M.; Youssef, A.M.; Maerz, N.H.; Abu-AlFadail, E.; Al-Harbi, H.M.; Al-Saadi, N.S. A flood risk management program of Wadi Baysh dam on the downstream area: An integration of hydrologic and hydraulic models, Jizan region, KSA. Sustainability 2020, 12, 1069. [Google Scholar] [CrossRef] [Green Version]
- Mei, X.; Van Gelder, P.H.A.J.M.; Dai, Z.; Tang, Z. Impact of dams on flood occurrence of selected rivers in the United States. Front. Earth Sci. 2017, 11, 268–282. [Google Scholar] [CrossRef]
- Peyravi, M.; Peyvandi, A.A.; Khodadadi, A.; Marzaleh, M.A. Flood in the South-West of Iran in 2019; causes, problems, actions and lesson learned. Bull. Emerg. Trauma 2019, 7, 199. [Google Scholar] [CrossRef]
- Rokaya, P.; Wheater, H.; Lindenschmidt, K.E. Promoting sustainable ice-jam flood management along the Peace River and Peace-Athabasca Delta. J. Water Resour. Plan. Manag. 2019, 145, 04018085. [Google Scholar] [CrossRef]
- Smys, S.; Basar, A.; Wang, H. CNN based flood management system with IoT sensors and cloud data. J. Artif. Intell. 2020, 2, 194–200. [Google Scholar]
- Mohanty, M.P.; Mudgil, S.; Karmakar, S. Flood management in India: A focussed review on the current status and future challenges. Int. J. Disaster Risk Reduct. 2020, 49, 101660. [Google Scholar] [CrossRef]
- Best, J. Anthropogenic stresses on the World’s big rivers. Nat. Geosci. 2019, 12, 7–21. [Google Scholar] [CrossRef]
- Hornberger, G.M.; Perrone, D. Water Resources: Science and Society; Johns Hopkins University Press: Baltimore, MA, USA, 2019. [Google Scholar]
- Smith, L.C. Rivers of Power: How a Natural Force Raised Kingdoms, Destroyed Civilizations, and Shapes Our World; Penguin: London, UK, 2020. [Google Scholar]
- Singh, R.; Patel, S.K.; Tiwari, A.K.; Singh, G.S. Assessment of flood recession farming for livelihood provision, food security and environmental sustainability in the Ganga River Basin. Curr. Res. Environ. Sustain. 2021, 3, 100038. [Google Scholar] [CrossRef]
- Kalambukattu, J.; Kumar, S. Modelling soil erosion risk in a mountainous watershed of Mid-Himalaya by integrating RUSLE model with GIS. Eurasian J. Soil Sci. 2017, 6, 92–105. [Google Scholar] [CrossRef] [Green Version]
- Pokhrel, Y.; Burbano, M.; Roush, J.; Kang, H.; Sridhar, V.; Hyndman, D.W. A review of the integrated effects of changing climate, land use, and dams on Mekong river hydrology. Water 2018, 10, 266. [Google Scholar] [CrossRef] [Green Version]
- Langat, P.K.; Kumar, L.; Koech, R. Monitoring river channel dynamics using remote sensing and GIS techniques. Geomorphology 2019, 325, 92–102. [Google Scholar] [CrossRef]
- Kareem, H. Study of Water Resources by Using 3D Groundwater Modelling in Al-Najaf Region, Iraq. Doctoral Dissertation, Cardiff University, Wales, UK, 2018. [Google Scholar]
- Jamali, A.A.; Randhir, T.O.; Nosrati, J. Site suitability analysis for subsurface dams using Boolean and fuzzy logic in arid watersheds. J. Water Resour. Plan. Manag. 2018, 144, 04018047. [Google Scholar] [CrossRef]
- Noori, A.M.; Pradhan, B.; Ajaj, Q.M. Dam site suitability assessment at the Greater Zab River in northern Iraq using remote sensing data and GIS. J. Hydrol. 2019, 574, 964–979. [Google Scholar] [CrossRef]
- Al-Ruzouq, R.; Shanableh, A.; Yilmaz, A.G.; Idris, A.; Mukherjee, S.; Khalil, M.A.; Gibril, M.B.A. Dam site suitability mapping and analysis using an integrated GIS and machine learning approach. Water 2019, 11, 1880. [Google Scholar] [CrossRef] [Green Version]
- Forzieri, G.; Gardenti, M.; Caparrini, F.; Castelli, F. A methodology for the pre-selection of suitable sites for surface and underground small dams in arid areas: A case study in the region of Kidal, Mali. Phys. Chem. Earth Parts A/B/C 2008, 33, 74–85. [Google Scholar] [CrossRef]
- Raza, M.; Ahmad, A.; Mohammad, A. The Valley of Kashmir a Geographical Interpretations. The Land; Vikas Publishing House: New Delhi, India, 1978; Volume 1. [Google Scholar]
- Meraj, G.; Romshoo, S.A.; Ayoub, S.; Altaf, S. Geoinformatics-based approach for estimating the sediment yield of the mountainous watersheds in Kashmir Himalaya, India. Geocarto Int. 2018, 33, 1114–1138. [Google Scholar] [CrossRef]
- Meraj, G.; Farooq, M.; Singh, S.K.; Islam, M.; Kanga, S. Modeling the sediment retention and ecosystem provisioning services in the Kashmir valley, India, Western Himalayas. Model. Earth Syst. Environ. 2021. [Google Scholar] [CrossRef]
- Shyam, M.; Meraj, G.; Kanga, S.; Farooq, M.; Singh, S.K.; Sahu, N.; Kumar, P. Assessing the Groundwater Reserves of the Udaipur District, Aravalli Range, India, Using Geospatial Techniques. Water 2022, 14, 648. [Google Scholar] [CrossRef]
- Kanga, S.; Singh, S.K.; Meraj, G.; Kumar, A.; Parveen, R.; Kranjčić, N.; Đurin, B. Assessment of the Impact of Urbanization on Geoenvironmental Settings Using Geospatial Techniques: A Study of Panchkula District, Haryana. Geographies 2022, 2, 1–10. [Google Scholar] [CrossRef]
- Altaf, F.; Meraj, G.; Romshoo, S.A. Morphometric analysis to infer hydrological behaviour of Lidder watershed, Western Himalaya, India. Geogr. J. 2013, 2013, 178021. [Google Scholar] [CrossRef]
- Koneti, S.; Sunkara, S.L.; Roy, P.S. Hydrological modeling with respect to impact of land-use and land-cover change on the runoff dynamics in Godavari River Basin using the HEC-HMS model. ISPRS Int. J. Geo-Inf. 2018, 7, 206. [Google Scholar] [CrossRef] [Green Version]
- Shao, Z.; Jahangir, Z.; Muhammad Yasir, Q.; Mahmood, S. Identification of potential sites for a multi-purpose dam using a dam suitability stream model. Water 2020, 12, 3249. [Google Scholar] [CrossRef]
- Njiru, F.M.; Siriba, D.N. Site Selection for an Earth Dam in Mbeere North, Embu County—Kenya. J. Geosci. Environ. Prot. 2018, 6, 113–133. [Google Scholar] [CrossRef] [Green Version]
- Rahman, N.; Awangku, A.; Tai, V.; Mohammad, M.; Haron, S.; Khalid, K.; Rasid, M.; Shariff, S. Site selection of water reservoir based on weighted overlay in arcgis (case study: Bachok Kelantan). Sci. Int. 2021, 33, 135–139. [Google Scholar]
- Adham, A.; Riksen, M.; Ouessar, M.; Ritsema, C.J. A methodology to assess and evaluate rainwater harvesting techniques in (semi-) arid regions. Water 2016, 8, 198. [Google Scholar] [CrossRef] [Green Version]
- Meraj, G.; Kanga, S.; Kranjčić, N.; Đurin, B.; Singh, S.K. Role of natural capital economics for sustainable management of earth resources. Earth 2021, 2, 622–634. [Google Scholar] [CrossRef]
- Meraj, G.; Singh, S.K.; Kanga, S.; Islam, M. Modeling on comparison of ecosystem services concepts, tools, methods and their ecological-economic implications: A review. Model. Earth Syst. Environ. 2022, 8, 15–34. [Google Scholar] [CrossRef]
- Ansari, T.; Kainthola, A.; Singh, K.H.; Singh, T.N.; Sazid, M. Geotechnical and micro-structural characteristics of phyllite derived soil; implications for slope stability, Lesser Himalaya, Uttarakhand, India. Catena 2021, 196, 104906. [Google Scholar] [CrossRef]
- Jasrotia, A.S.; Kumar, R.; Taloor, A.K.; Saraf, A.K. Artificial recharge to groundwater using geospatial and groundwater modelling techniques in North Western Himalaya, India. Arab. J. Geosci. 2019, 12, 1–23. [Google Scholar] [CrossRef]
- Li, Q.B.; Wang, J.Z.; Wang, G.J.; Liu, Q.L.; Yan, C.B.; Hart, M. Evaluation of lithology variations in layered red beds with depth: An example of the Yellow River Guxian Dam, NW China. Lithosphere 2021, 2021, 7866225. [Google Scholar] [CrossRef]
- Srinivas, K.N.S.S.S.; Kishore, P.P.; Rao, D.V. The geological site characterisation of the Mandla region, Eastern Deccan volcanic province, Central India. J. Earth Syst. Sci. 2019, 128, 1–16. [Google Scholar] [CrossRef] [Green Version]
- Qi, J.; Lee, S.; Zhang, X.; Yang, Q.; McCarty, G.W.; Moglen, G.E. Effects of surface runoff and infiltration partition methods on hydrological modeling: A comparison of four schemes in two watersheds in the Northeastern US. J. Hydrol. 2020, 581, 124415. [Google Scholar] [CrossRef]
- Ibrahim, G.R.F.; Rasul, A.; Ali Hamid, A.; Ali, Z.F.; Dewana, A.A. Suitable site selection for rainwater harvesting and storage case study using Dohuk Governorate. Water 2019, 11, 864. [Google Scholar] [CrossRef] [Green Version]
- Hashim, H.Q.; Sayl, K.N. Detection of suitable sites for rainwater harvesting planning in an arid region using geographic information system. Appl. Geomat. 2021, 13, 235–248. [Google Scholar] [CrossRef]
- Adham, A.; Sayl, K.N.; Abed, R.; Abdeladhim, M.A.; Wesseling, J.G.; Riksen, M.; Fleskens, L.; Karim, U.; Ritsema, C.J. A GIS-based approach for identifying potential sites for harvesting rainwater in the Western Desert of Iraq. Int. Soil Water Conserv. Res. 2018, 6, 297–304. [Google Scholar] [CrossRef]
- Mugo, G.M.; Odera, P.A. Site selection for rainwater harvesting structures in Kiambu County-Kenya. Egypt. J. Remote Sens. Space Sci. 2019, 22, 155–164. [Google Scholar] [CrossRef]
- Othman, A.A.; Al-Maamar, A.F.; Al-Manmi, D.A.M.A.; Liesenberg, V.; Hasan, S.E.; Obaid, A.K.; Al-Quraishi, A.M.F. GIS-based modeling for selection of dam sites in the Kurdistan Region, Iraq. ISPRS Int. J. Geo-Inf. 2009, 9, 244. [Google Scholar] [CrossRef] [Green Version]
- Sayl, K.N.; Mohammed, A.S.; Ahmed, A.D. February. GIS-based approach for rainwater harvesting site selection. IOP Conf. Ser. Mater. Sci. Eng. 2020, 737, 012246. [Google Scholar]
- Alam, S.; Borthakur, A.; Ravi, S.; Gebremichael, M.; Mohanty, S.K. Managed aquifer recharge implementation criteria to achieve water sustainability. Sci. Total Environ. 2021, 768, 144992. [Google Scholar] [CrossRef]
- Aly, M.M.; Refay, N.H.; Elattar, H.; Morsy, K.M.; Bandala, E.R.; Zein, S.A.; Mostafa, M.K. Ecohydrology and flood risk management under climate vulnerability in relation to the sustainable development goals (SDGs): A case study in Nagaa Mobarak Village, Egypt. Nat. Hazards 2022, 1–29. [Google Scholar] [CrossRef]


| S. No | Data | Source | Details |
|---|---|---|---|
| 1 | Landsat 8 2018 Satellite Data | https://earthexplorer.usgs.gov/ (accessed on 31 February 2021) | 30-m spatial resolution |
| 2 | ALOS-PALSAR DEM | Downloaded from Alaska Satellite Facility (ASF) Distributed Archive Center | 12.5-m spatial resolution |
| 3 | Geological maps (1969) | Geological Survey of India | 1:250,000 |
| 4 | Soil maps | National Bureau of Soil Survey and Land Use Planning (NBSS&LUP) | 1:500,000 |
| 5 | Protected area (PA) Boundaries | Generated under the Protected Area Network Mapping Project | GPS-based field survey |
| Class * | F | SH | PS | AC | AP | BU | WL | SG | W | Row Total | Accuracy |
|---|---|---|---|---|---|---|---|---|---|---|---|
| F | 32 | 2 | 34 | 94.11 | |||||||
| SH | 40 | 4 | 44 | 90.90 | |||||||
| PS | 30 | 30 | 100.00 | ||||||||
| AC | 4 | 28 | 32 | 87.50 | |||||||
| AP | 2 | 35 | 37 | 94.59 | |||||||
| BU | 40 | 3 | 43 | 93.02 | |||||||
| WL | 3 | 25 | 28 | 89.28 | |||||||
| SG | 10 | 10 | 100.00 | ||||||||
| W | 20 | 20 | 100.00 | ||||||||
| Column Total | 34 | 40 | 34 | 32 | 37 | 43 | 28 | 10 | 20 | 278 | |
| Accuracy | 94.11 | 100.00 | 88.23 | 87.50 | 94.59 | 93.02 | 89.28 | 100.00 | 100.00 |
| S. No | Layers | Classes | Weights | Scale Value | Site Suitability |
|---|---|---|---|---|---|
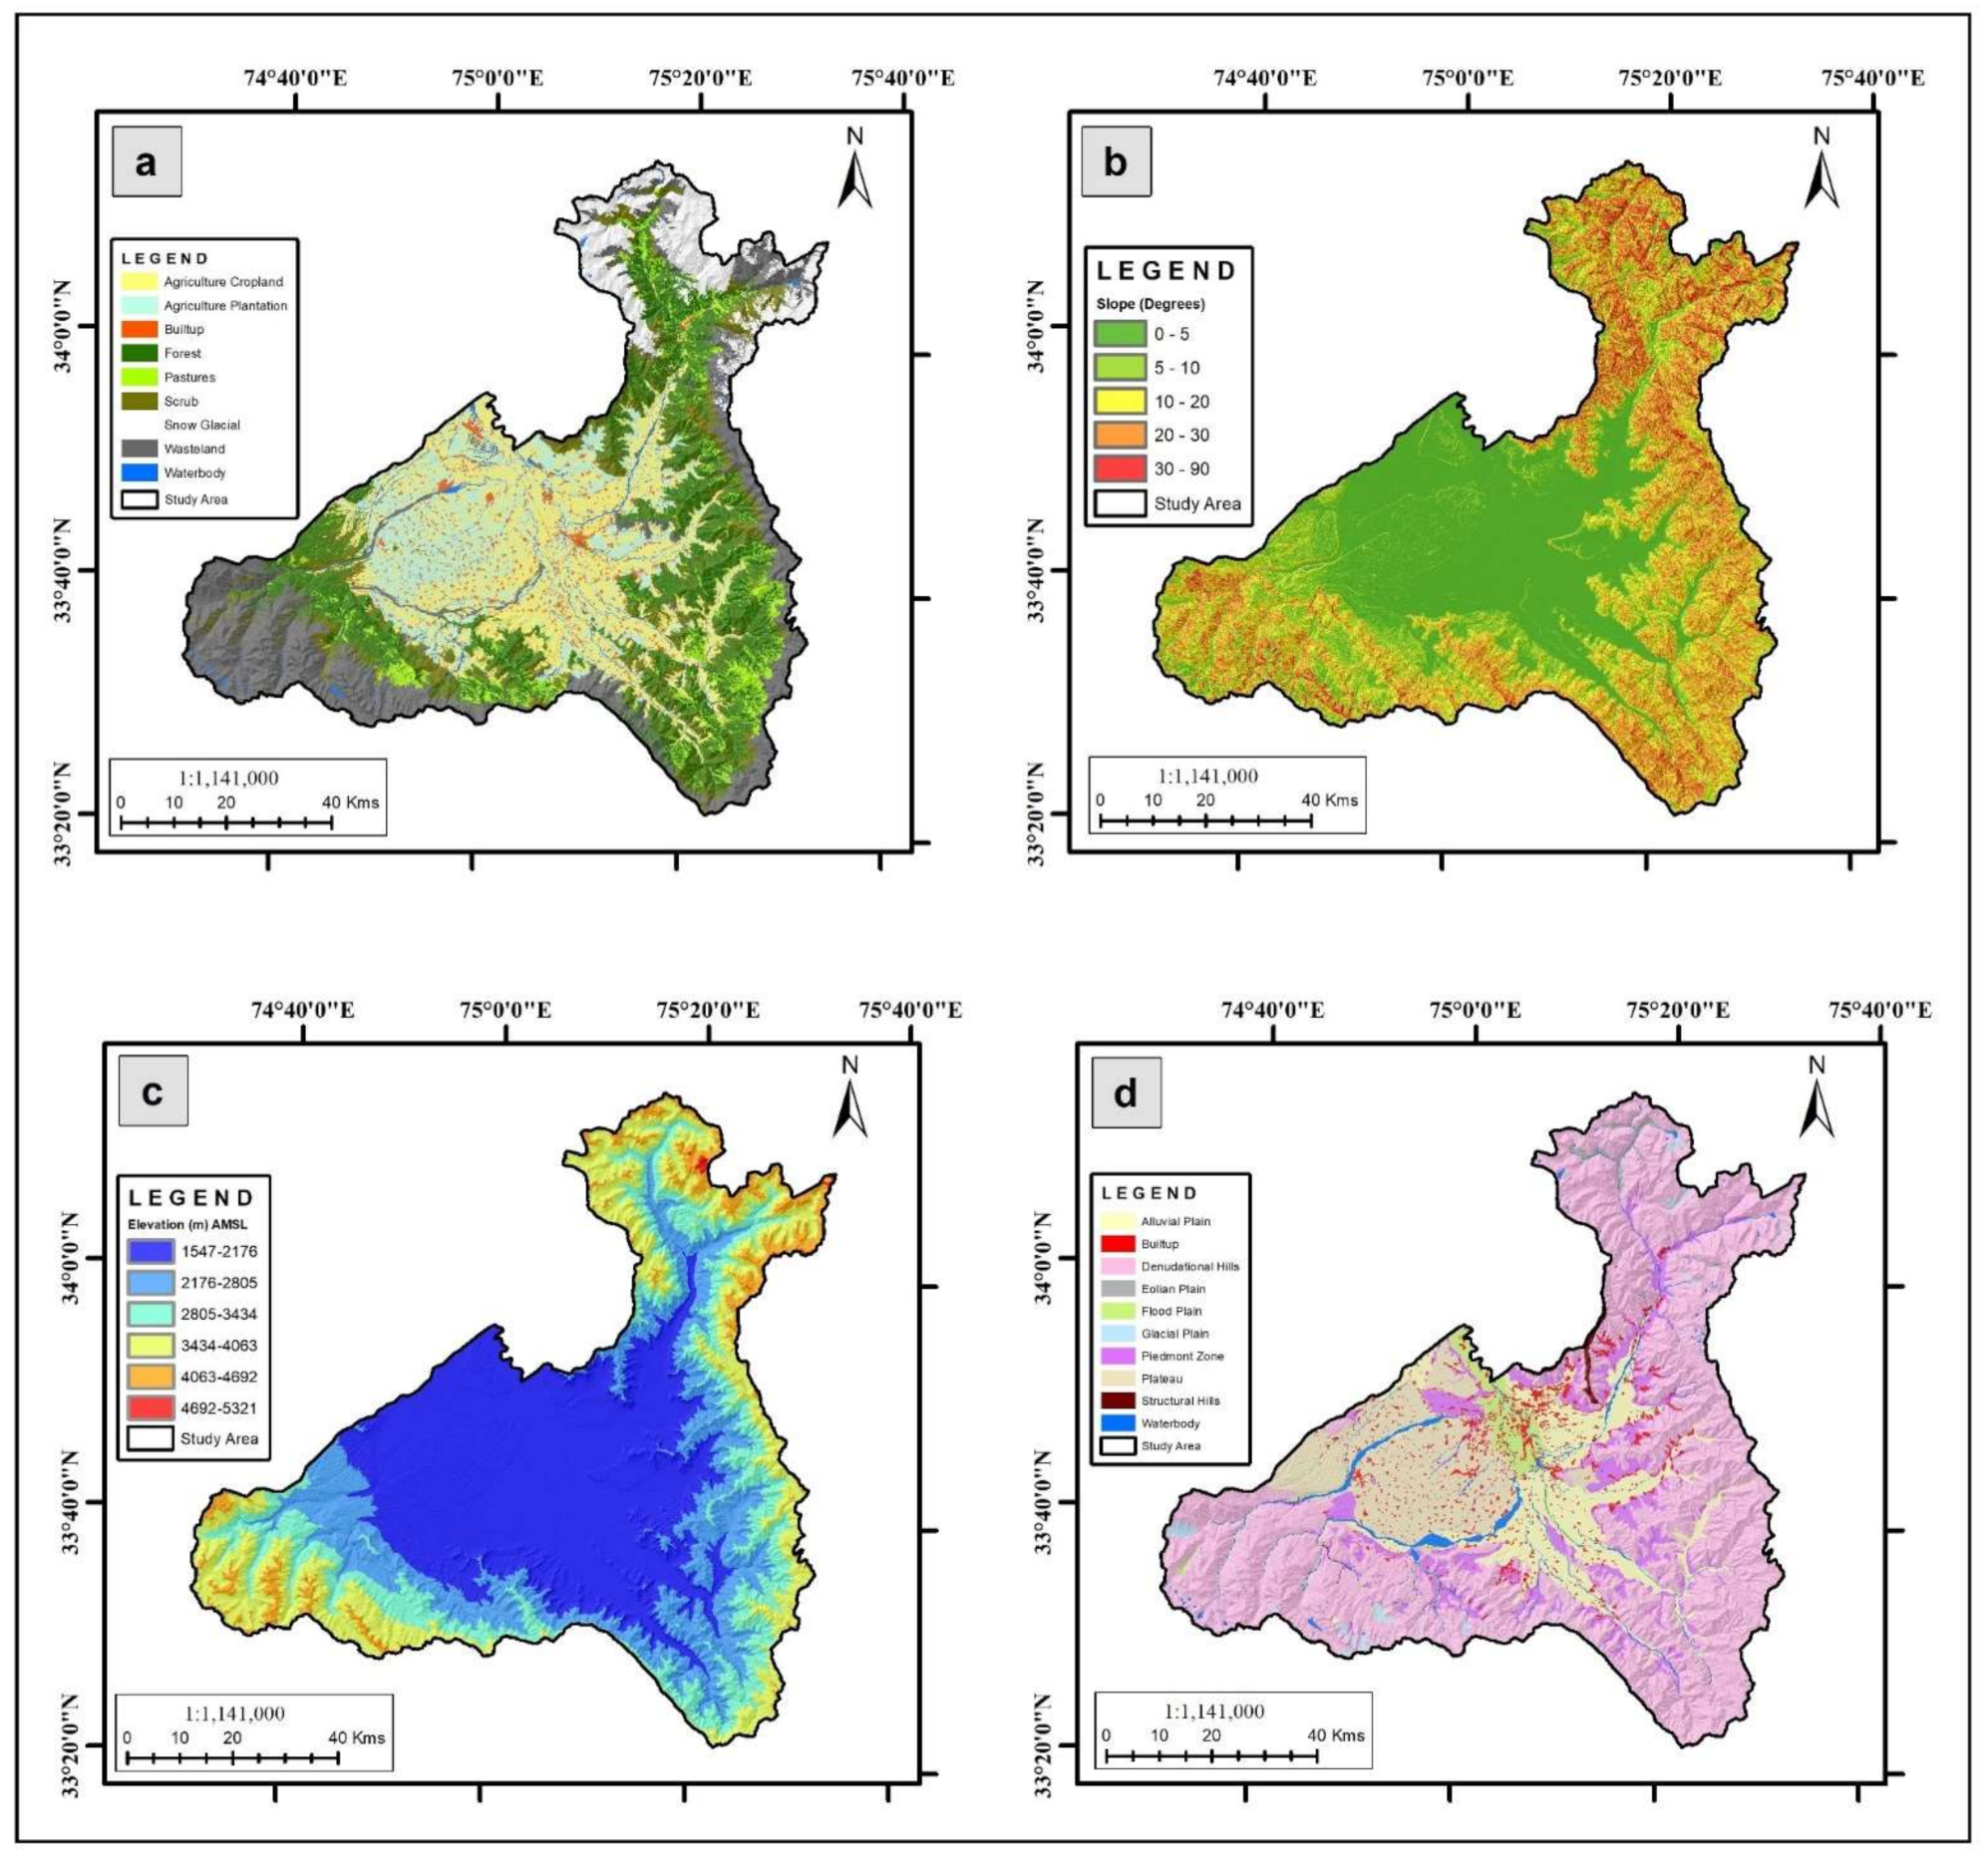
| 1 | LULC | Agriculture Cropland | 15% | 2 | Low |
| Agriculture Plantation | 3 | Low | |||
| Built-up | 3 | Low | |||
| Scrub | 9 | High | |||
| Forest | 4 | Medium | |||
| Pasture | 5 | Medium | |||
| Wasteland | 7 | High | |||
| Water | Restricted | Nil | |||
| Snow Glacial | Restricted | Nil | |||
| 2 | Slope (degrees) | 0–5 | 10% | 7 | High |
| 5–10 | 5 | Medium | |||
| 10–20 | 3 | Low | |||
| 20–30 | 2 | Low | |||
| 30–90 | 1 | Low | |||
| 3 | Elevation (m) | 1547–2176 | 10% | 9 | High |
| 2176–2805 | 7 | High | |||
| 2805–3434 | 5 | Medium | |||
| 3434–4063 | 3 | Low | |||
| 4063–4692 | 2 | Low | |||
| 4692–5321 | 1 | Low | |||
| 4 | Geomorphology | Alluvial plain | 15% | 9 | High |
| Flood plain | 9 | High | |||
| Eolian plain | 2 | Low | |||
| Glacial plain | Restricted | Nil | |||
| Piedmont zone | 8 | High | |||
| Plateau | 4 | Medium | |||
| Denudational hill | 1 | Low | |||
| Structural hills | 1 | Low | |||
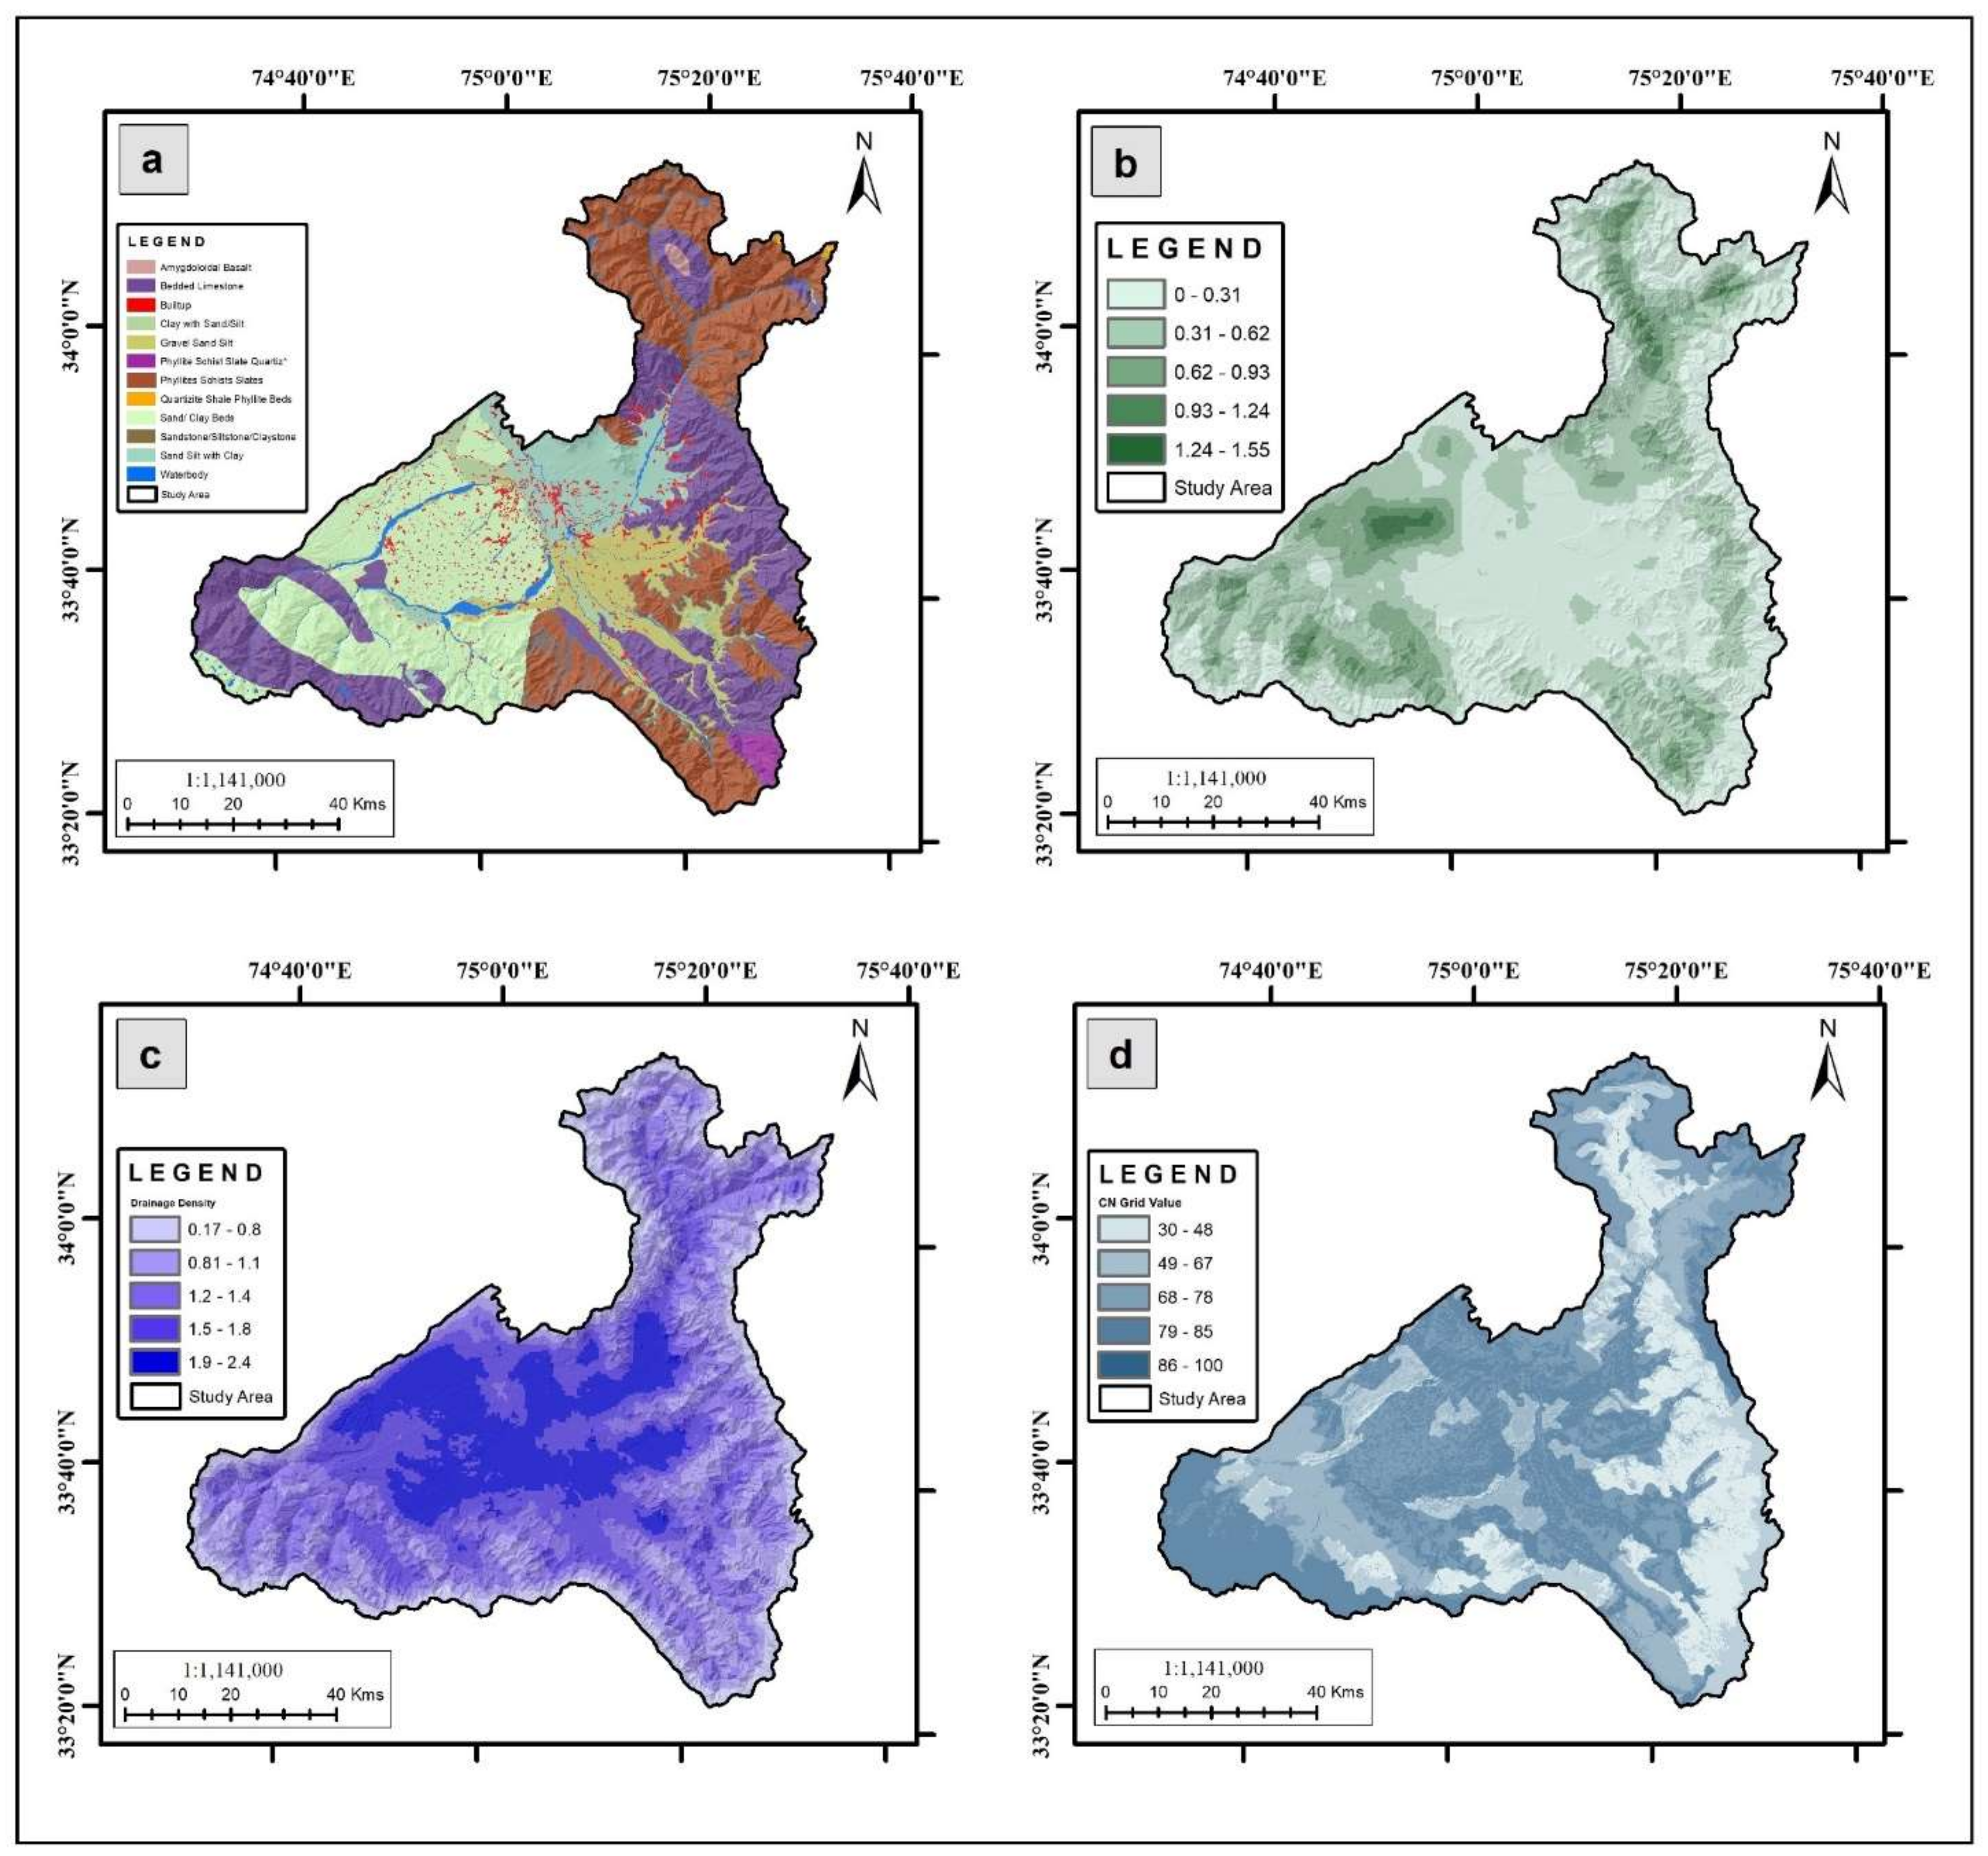
| 5 | Lithology | Amygdaloidal Basalt | 10% | 9 | High |
| Bedded Limestone | 3 | Low | |||
| Phyllite Schist Slate Quartizite Bed | 5 | Medium | |||
| Phyllite Schist Slate Bed | 2 | Low | |||
| Quartizite Shale Phyllite Bed | 8 | High | |||
| Sandstone Claystone Siltstone Bed | 4 | Medium | |||
| Alluvium | 1 | Low | |||
| 6 | Lineament Density | 0–0.31 | 10% | 9 | High |
| 0.31–0.62 | 7 | High | |||
| 0.62–0.93 | 5 | Medium | |||
| 0.93–1.24 | 2 | Low | |||
| 1.24–1.55 | 1 | Low | |||
| 7 | Drainage Density | 0.17–0.8 | 10% | 1 | Low |
| 0.81–1.1 | 2 | Low | |||
| 1.2–1.4 | 4 | Medium | |||
| 1.5–1.8 | 8 | High | |||
| 1.9–2.4 | 9 | High | |||
| 8 | CN Grid Value | 30–48 | 10% | 1 | Low |
| 49–67 | 3 | Low | |||
| 68–78 | 5 | Medium | |||
| 79–85 | 7 | High | |||
| 86–100 | 9 | High | |||
| 9 | Soil Texture | Clay | 10% | 9 | High |
| Sand | 1 | Low | |||
| Silt | 1 | Low | |||
| Loam | 8 | High | |||
| Clay Loam | 7 | High | |||
| Sandy Clay Loam | 6 | Medium | |||
| Sandy Loam | 2 | Low | |||
| Silt Loam | 3 | Low | |||
| Silty Clay | 4 | Medium | |||
| Silty Clay Loam | 5 | Medium | |||
| Rock Outcrop | Restricted | Nil |
| Watershed-Wise Dam Site Location | Elevation Range (m) | Plane Height (m) | Volume (m3) |
|---|---|---|---|
| 2089 | 0 | ||
| 2094 | 87,557.12 | ||
| Bringi | 2089–4339 | 2099 | 485,274.20 |
| 2104 | 1,240,961.47 | ||
| 2109 | 2,418,669.18 | ||
| 2350 | 0 | ||
| 2355 | 6703.41 | ||
| Lidder | 2350–5321 | 2360 | 34,827.21 |
| 2365 | 336,015.74 | ||
| 2370 | 1,083,598.76 | ||
| 2087 | 0 | ||
| 2092 | 21,015.63 | ||
| Sandran | 2087–4091 | 2097 | 216,953.70 |
| 2102 | 800,106.73 | ||
| 2107 | 1,766,840.66 | ||
| 2225 | 0 | ||
| 2230 | 5943.94 | ||
| Vishav | 2225–4614 | 2235 | 34,418.50 |
| 2240 | 95,838.34 | ||
| 2245 | 195,498.72 |
| S. No | Site Name | Elevation (m) | Latitude | Longitude |
|---|---|---|---|---|
| 1 | Bringi | 2195 | 33°30′48.82″N | 75°22′55.40″E |
| 2 | Lidder | 2350 | 34°3′11.411″N | 75°21′38.949″E |
| 3 | Sandran | 2087 | 33°28′29.067″N | 75°21′11.798″E |
| 4 | Vishav | 2225 | 33°38′19.417″N | 74°46′37.310″E |
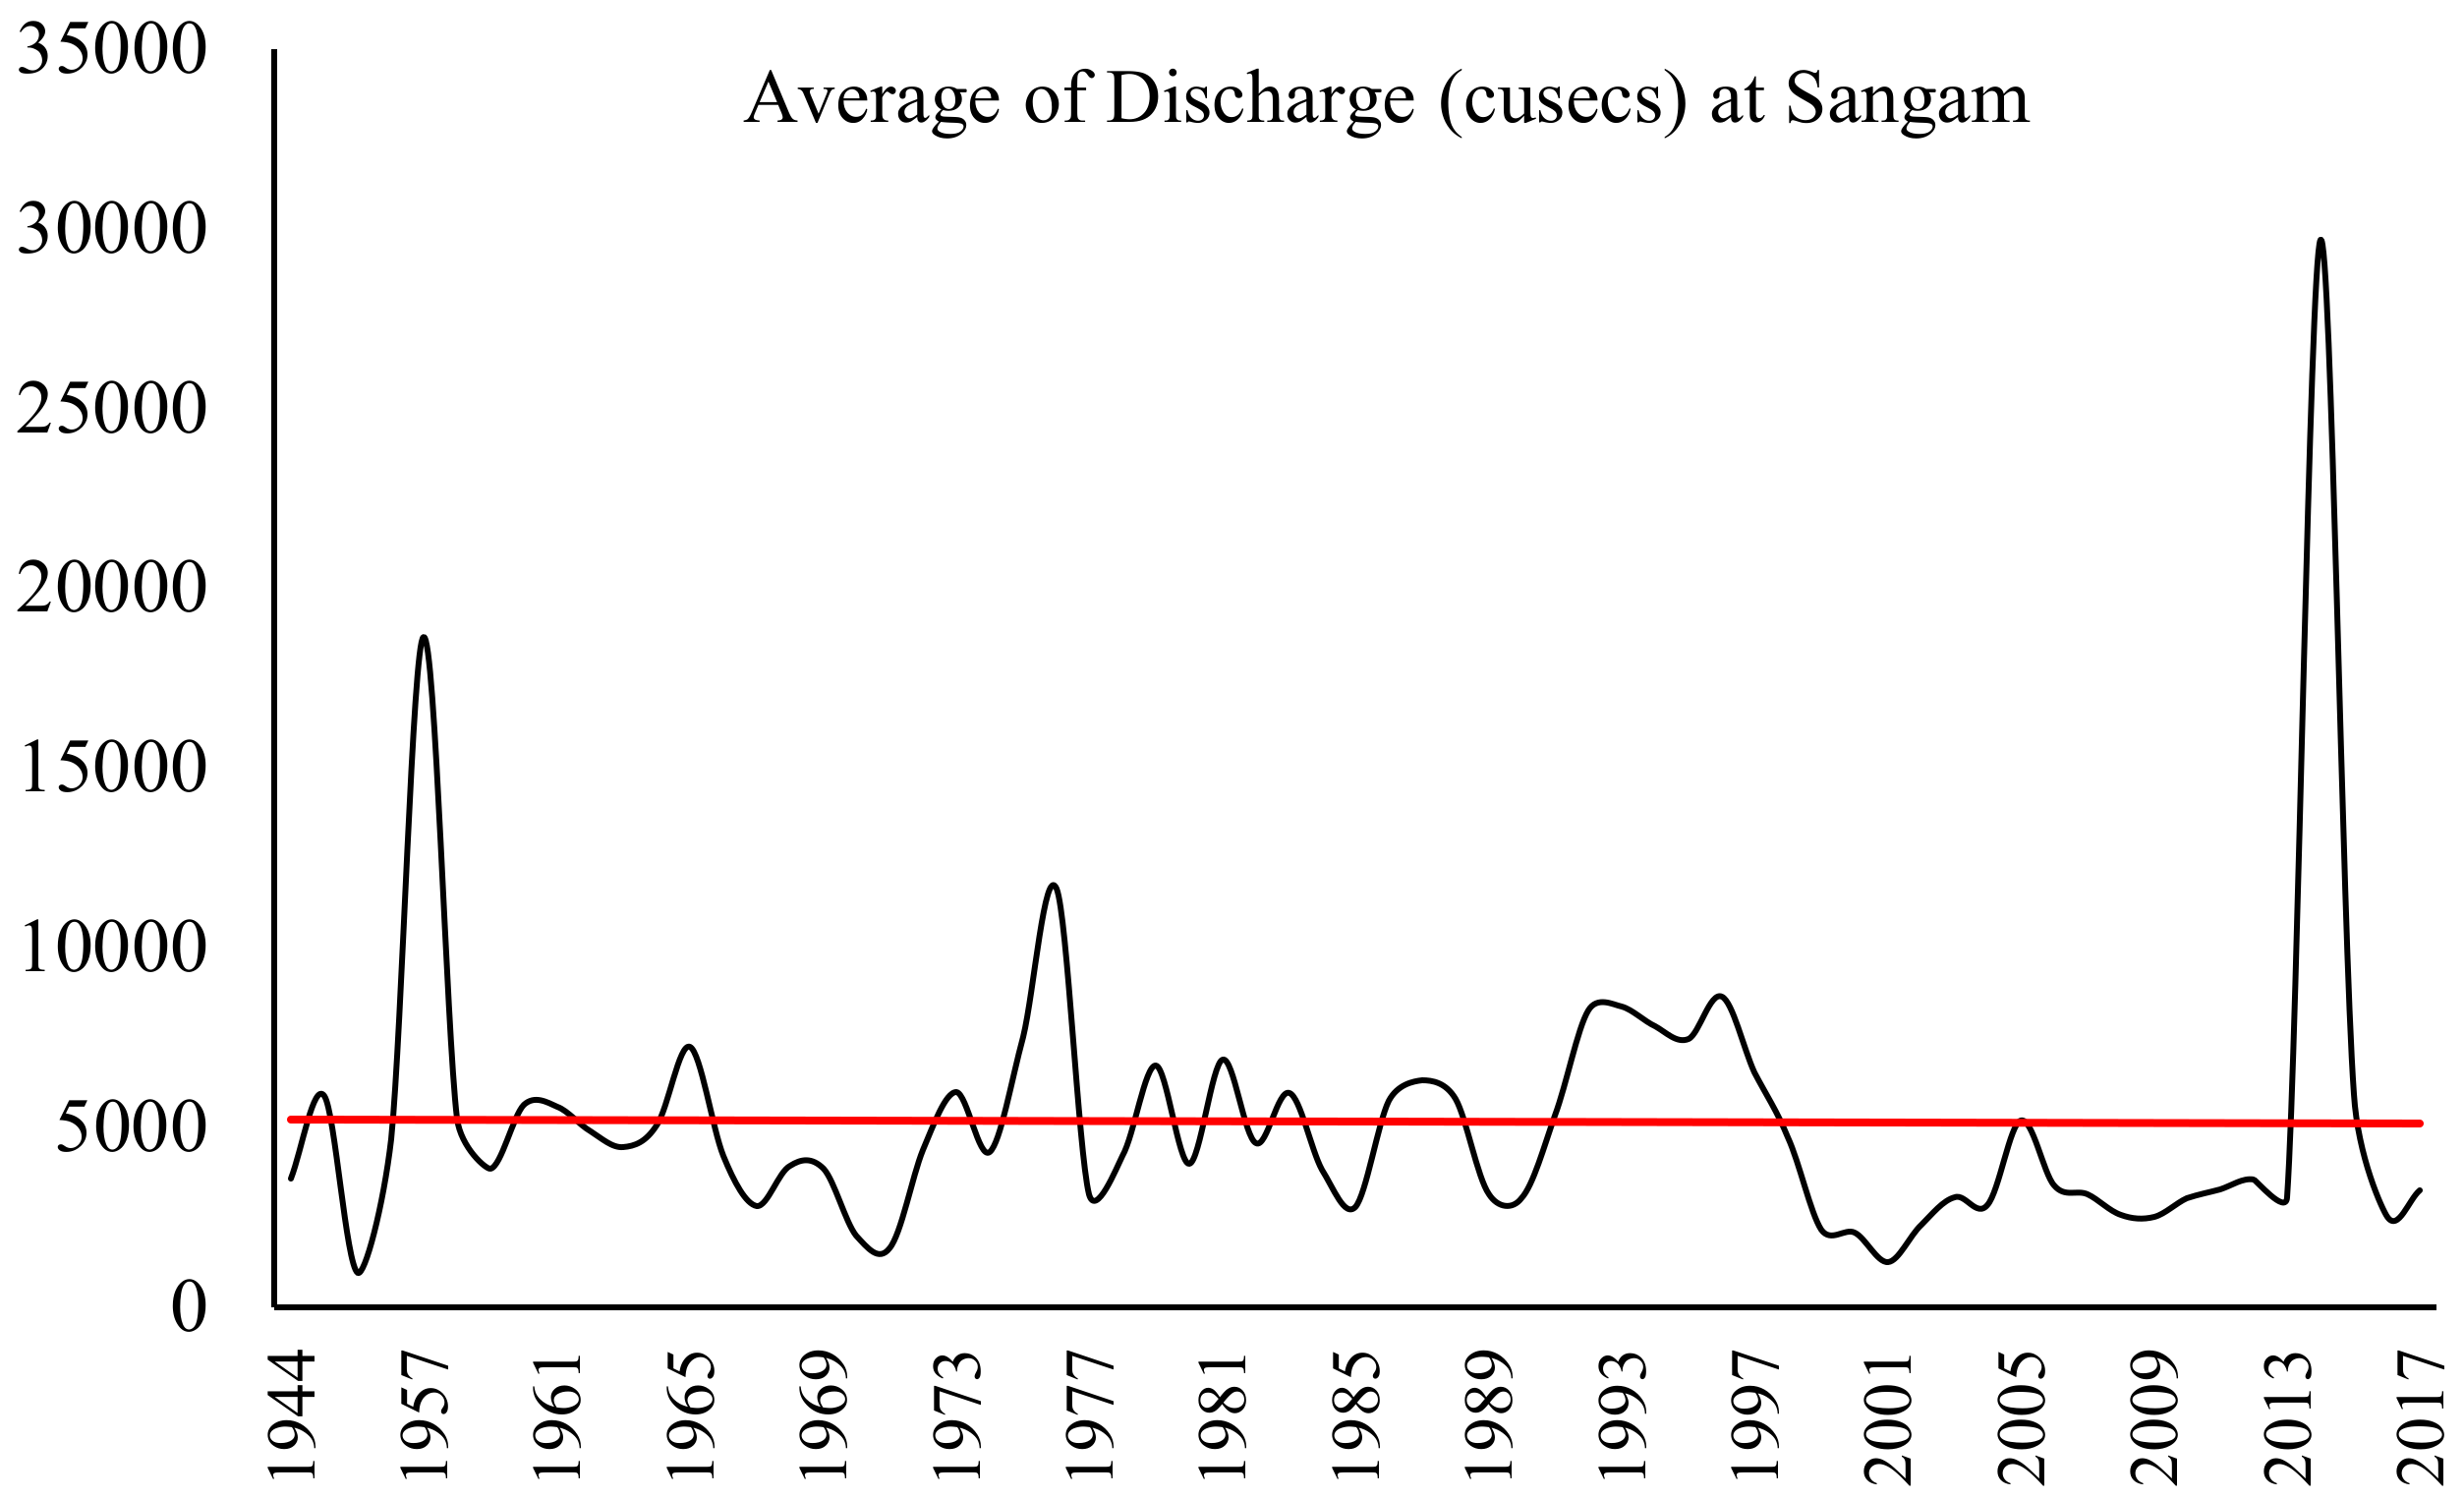
| Dam Location | Date | Volume of Water Generated * (Megalitres, 106) | Capacity of Proposed Dam (Megalitres, 106) | Percent Retained (%) |
|---|---|---|---|---|
| Lidder at Sheshnag | 06-09-2014 | 7154.58 | 1083.6 | 15.15 |
| Bringi | 06-09-2014 | 4368.76 | 2418.67 | 55.36 |
| Sandran | 07-09-2014 | 25,789.78 | 1766.84 | 6.85 |
| Vishaw | 08-09-2014 | 74,809.93 | 195.5 | 0.26 |
Publisher’s Note: MDPI stays neutral with regard to jurisdictional claims in published maps and institutional affiliations. |
© 2022 by the authors. Licensee MDPI, Basel, Switzerland. This article is an open access article distributed under the terms and conditions of the Creative Commons Attribution (CC BY) license (https://creativecommons.org/licenses/by/4.0/).
Share and Cite
Rather, M.A.; Meraj, G.; Farooq, M.; Shiekh, B.A.; Kumar, P.; Kanga, S.; Singh, S.K.; Sahu, N.; Tiwari, S.P. Identifying the Potential Dam Sites to Avert the Risk of Catastrophic Floods in the Jhelum Basin, Kashmir, NW Himalaya, India. Remote Sens. 2022, 14, 1538. https://doi.org/10.3390/rs14071538
Rather MA, Meraj G, Farooq M, Shiekh BA, Kumar P, Kanga S, Singh SK, Sahu N, Tiwari SP. Identifying the Potential Dam Sites to Avert the Risk of Catastrophic Floods in the Jhelum Basin, Kashmir, NW Himalaya, India. Remote Sensing. 2022; 14(7):1538. https://doi.org/10.3390/rs14071538
Chicago/Turabian StyleRather, Muzamil Ahmad, Gowhar Meraj, Majid Farooq, Bashir Ahmad Shiekh, Pankaj Kumar, Shruti Kanga, Suraj Kumar Singh, Netrananda Sahu, and Surya Prakash Tiwari. 2022. "Identifying the Potential Dam Sites to Avert the Risk of Catastrophic Floods in the Jhelum Basin, Kashmir, NW Himalaya, India" Remote Sensing 14, no. 7: 1538. https://doi.org/10.3390/rs14071538
APA StyleRather, M. A., Meraj, G., Farooq, M., Shiekh, B. A., Kumar, P., Kanga, S., Singh, S. K., Sahu, N., & Tiwari, S. P. (2022). Identifying the Potential Dam Sites to Avert the Risk of Catastrophic Floods in the Jhelum Basin, Kashmir, NW Himalaya, India. Remote Sensing, 14(7), 1538. https://doi.org/10.3390/rs14071538