1. Introduction
The global crisis caused by the pandemic emergency has had a strong impact on mobility and has significantly slowed down tourist flows. Consequently, both less known urban and extra-urban archaeological areas, already cut off the major tourist routes, have been further neglected. In this framework, the use of 3D (three-dimensional) digital technologies and new media can represent an effective action of valorization (in the etymological meaning of restoring a public value to an overlooked cultural place) and an alternative solution to keep cultural heritage virtually accessible to everyone. Furthermore, 3D digital cultural heritage offers important opportunities for both cultural institutions and local authorities that can use these resources for tourism, conservation and restoration purposes or for teaching.
Between 2018 and 2019, several digitization and diagnostic activities aimed at the study and valorization of Sicilian sites and museums artifacts were carried out by the CNR-IPCF (National Research Council—Institute for chemical and physical processes, Messina) as part of an interdisciplinary training and skill transfer project called STBIC (Science and Technologies for the Recovery and Use of Cultural Heritage). The ambitious goal of the STBIC project was the training of nine young post-graduate fellows characterized by different backgrounds (from physical chemistry to archaeology) with the aim to make them independent in the management of complex problems related to cultural heritage. The fellows, led by six IPCF researchers with the role of tutor and coordinator [
1], have faced a series of issues related to chemical and physical characterization of materials, 3D modeling, dating, protection, restoration and enhancement. The group of trainees was also provided with a business plan and management concepts. The general project goals were: 1. to study a selection of archaeological finds, historic buildings and paintings, collecting metric and diagnostic data through a combined approach and different techniques (e.g., 3D laser scanning, photogrammetry, thermography, and spectroscopy); 2. to analyze and characterize cultural heritage materials and their state of conservation; 3. to set up a database-based ‘archive’, useful for the different purposes of research, managing, preservation, monitoring and enhancement (e.g., identification of the actions for preservation and/or safety and design of new materials and development of innovative processes); 4. to contribute to the knowledge of the Sicilian Heritage, with particular reference to ‘minor’ and neglected sites and artifacts, through a digitization actions and the creation of appealing media (web-based virtual tour and 3D interactive models).
This paper, specifically, addresses its attention on a single study case: the church of Santa Maria delle Palate, a small building located in the territory of Tusa (Messina), along the path that leads to the Archaeological Area of Halaesa Arconidea. Here, a campaign in situ was carried out in June 2019 with the following aims:
To acquire a detailed 3D model of the building in its present conditions, using a laser-scanning survey;
To analyze the 1600s wall painting preserved inside the church (specifically the composition of pigments), in order to understand the painting technique and the ongoing degradation processes;
To realize a web-based virtual tour able to stimulate visitors’ interest toward this building, often considered of minor importance, compared to the archaeological remains;
To create a database-based informative model through GIS or BIM systems useful at more levels for research as well for the institution that manages the archaeological area.
In the following sections, we describe the complete workflow, focusing on each step from the field acquisition to data processing, integration and sharing. The final outcome is the implementation of a web-shared platform, where expert and inexpert users can virtually access the church through a virtual tour and search for specialized dataset (e.g., measures, analyses results), according to their different needs. In this environment, the model is not only a tool for visualization, but a real container of information, updatable and available anytime and from everywhere. For this reason, more than a virtual museum, it can be considered as an integrated and participative tool capable of improving the state of knowledge, conservation, valorization and dissemination of the building and its contexts; however, we have to point out that the novelty of the work is the creation of a tool of study and valorization as rare as effective for a southern Italy municipality, which can be tested as a case study to evaluate long-term effects on accessibility to cultural places, especially during ordinary events (restoration, closing days) or other unconventional limitations (pandemic). The methods used are now part of the usual diagnostic activity of cultural heritage; as described in this work, they may, however, be easily integrated and used elsewhere in order to obtain tools able to improve access to cultural places.
2. State-of-the-Art
The scientific literature of the last 20 years has clearly demonstrated how the use of multidisciplinary approaches involving different figures coming from humanistic and scientific disciplines can be effective in order to reach a complete knowledge about a specific artifact, building or site, prerequisite for every action aimed at conservation, management and touristic promotions. Moreover, the availability of relevant methodologies based on performing portable instruments for metric documentation and diagnostic [
2,
3,
4] has greatly facilitated the operations of survey in situ as well data analysis and management. For example, several techniques to date have been developed to investigate the internal damages of churches from dynamics identification tests or else with sonic or GPR local tests [
5,
6].
Even Italy, which boasts one of the wider archaeological, architectural and museum asset (including 55 UNESCO “World Heritage” sites) [
7], is gradually trying to promote actions of digitization and diagnostic in order to improve its maintenance, management and accessibility.
For this reason, combined 3D surveys and diagnostic investigations are expected in order to make available digital replicas artifacts/artworks, buildings or sites [
8] and to collect all that information about material composition and ongoing decay. Moreover, we have to put in evidence the importance of specific scientific outcomes in order to enrich 3D models and provide to different users complete ‘informative models’ [
9].
The current most effective automatic survey techniques for the creation of high-resolution models of small artifacts and complex architectures [
10], are based on two complementary technologies: laser (Light Amplification by Stimulated Emission of Radiation) properties or algorithms (for digital photogrammetry) capable of turning set of images into 3D digital models [
11,
12]. The automatic survey is based on devices equipped with active or passive sensors, which are able to measure and record autonomously everything that falls within their “range of action”, providing metric and morphological details. A review of TLS applications to earth science research is presented in work by Telling et al. (2017) [
13] and a complete overview of TLS technology and processing methods is given in Historic England (2018) [
14]. Under this aspect, the IPCF-CNR of Messina can look back on a twenty-year successful experience in the use of terrestrial laser scanners (TLS), laser-arms, digital photogrammetry and self-produced instruments able to capture 360° images switchable into virtual tours.
The last experiences have clearly demonstrated how laser scanner survey has a dual utility for the purpose of understanding the architectural artifact: on the one hand, it allows you to immediately obtain precision metric surveys, innovative graphic returns and three-dimensional models directly from the processed point cloud. On the other hand, the complex point cloud can be considered a non-interpretative and multidimensional “document” of a temporally defined moment. With regards to web-sharing, a number of platforms have been tested as a tool for collaborations, visualization and management; however, we have to point out that this form of heritage valorization is very rare in Sicily. For this reason, it can be a case study in order to evaluate long-term effects on accessibility, especially during particular events (restoration, closing days) or pandemic restrictions, growth of touristic flows and inclusivity.
3. Case Study: The Church of Santa Maria Delle Palate in Tusa (ME)
3.1. Location
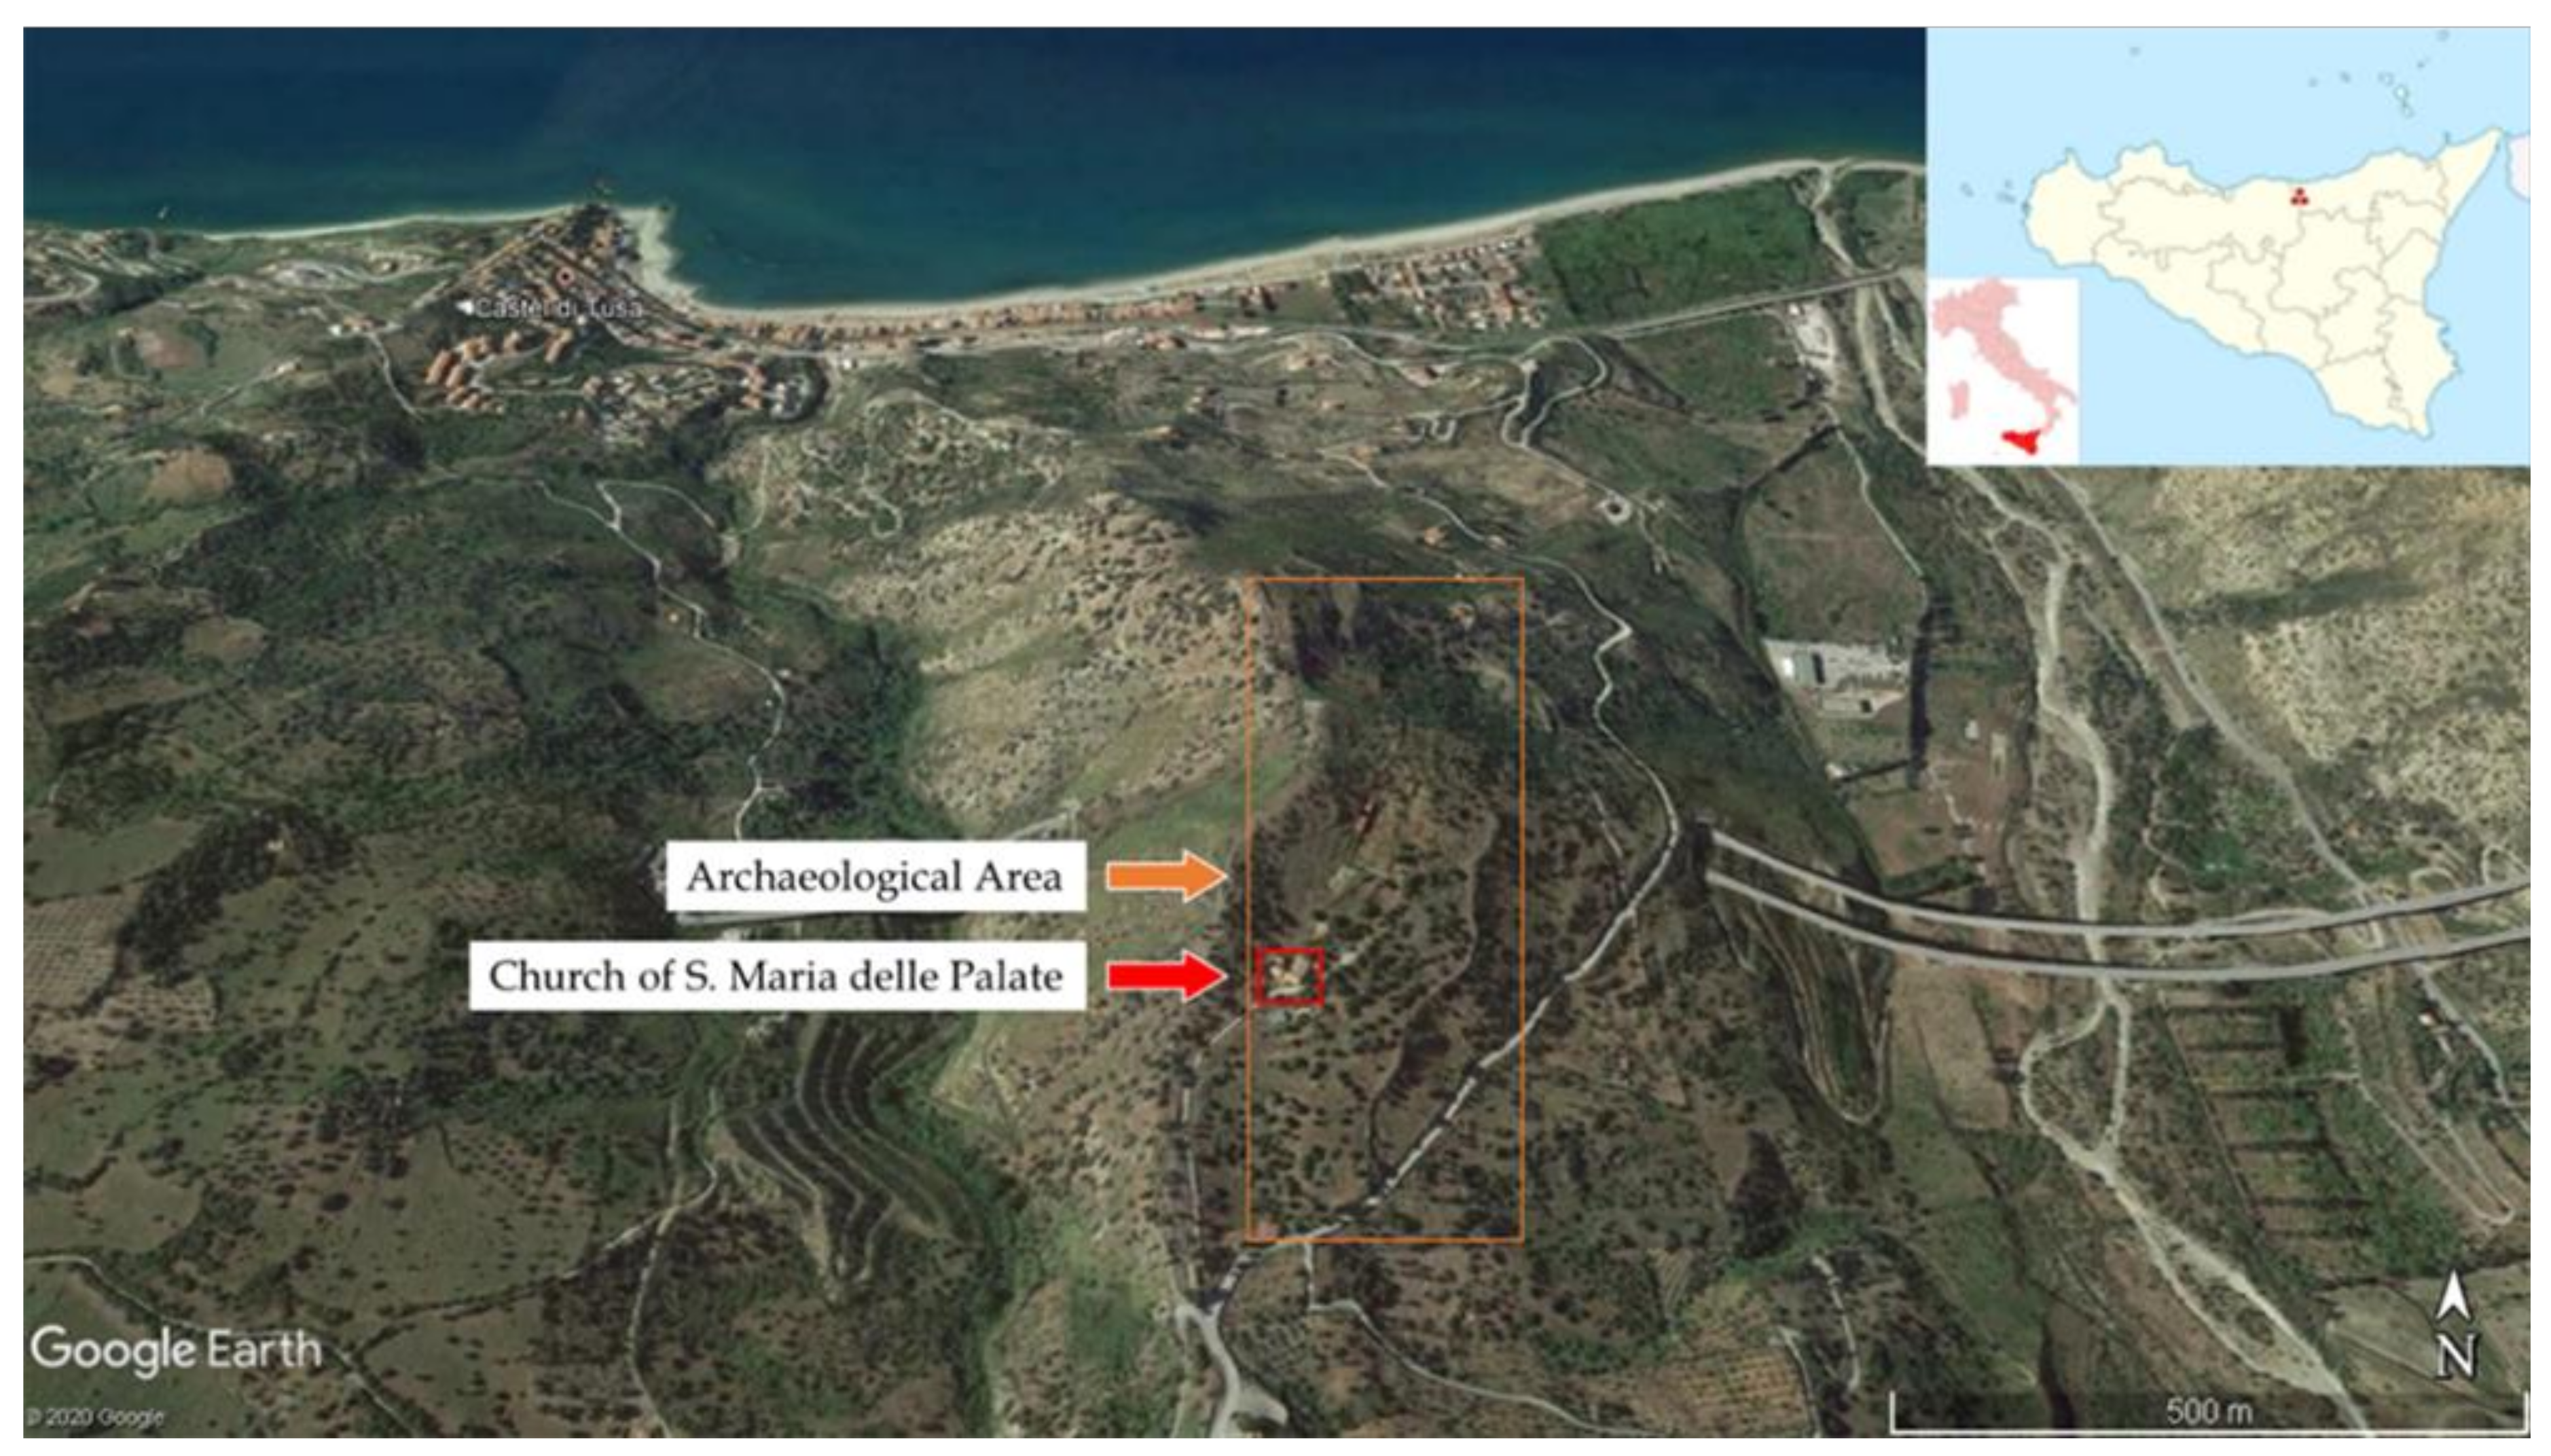
The Church of “Santa Maria delle Palate” is located in the territory of Tusa (37°59′47.17″ N; 14°15′42.67″ E; IGM 1:25.000, F. 260 I NO, 251 II SO), a small Municipality of Sicily halfway between Palermo and Messina, historically known as
antiqua Tusiae civitas [
15]. The site stands on the top of a hill (240 m a.s.l.), 1.5 km south of the coast, overlooking the Tyrrhenian Sea and the surrounding area (
Figure 1). The church, placed on the south-eastern side of the hill along the path toward the excavations of Halaesa, includes some expositive galleries (an
Antiquarium and a
Lapidarium). These have been set up inside one of the rural buildings belonging to a 19th-century fortified farm, which took the place of the oldest and partly destroyed Benedictine monastery built in the Norman age (1061–1194).
3.2. Historical Context
Tusa is a town rich in history, well-known by the presence of the Archaeological Area of
Halaesa Arconidea, which has a fair annual flow of tourists. Since 2016, the archaeological site is subject of a research project, carried out as a collaboration between the University of Oxford and the University of Messina [
16].
The Sicilian-Greek city (according to Diodorus Siculus 14.16.1-4) was established in 403 BC by Archonides, a tyrant of the nearby Sicilian center of Herbita, located between
Cephaloedium (modern Cefalù) and
Calacte (modern Caronia). Its strategic position for trade on the north coast immediately determined the importance of the site, which became a bulwark against a possible advancement of the Carthaginians. This importance is testified by the monumental evidence still visible on the top of the hill, as the agora, the wall fortification and the famous temple of Apollo, brought to light by the excavation activities carried out from 1950s until today [
17]. In the early phases of the First Punic War (264–241 BC), Halaesa was the first Sicilian city to go over to Rome (Diod. Sic. 23.4.1), action thanks to which it gained the status of civitas
libera ac immunis—i.e., autonomous and free of taxes [
18] when the Province of Sicily was established. At the time of Verre (73–71 BC) the city is considered, with Catania and Finziade, one of the main centers for loading and sorting the cereal products of the island, as testified by M.T. Cicero, who also emphasizes the role of its port (Verr. 2.185, 3.192) and by the archaeological evidence dating back to second and first century B.C.
Under Augustus, the city gained the status of a latin municipium, and during the imperial times, it started to suffer a gradual decline; for Strabo Halaesa is already a village. A partial destruction determined from natural events, is indicated in the 4th century AD, even if the permanent abandonment of the site can be dated back to the 10th century AD, with the Arab conquest of the island and the following foundation of the modern center of Tusa. In the twelfth century, the ruins of Halaesa, definitively abandoned for two or three centuries, must still have been visible, but of the ancient city, the name was already lost. After the abandonment, the ruins of the city were subject to systematic spoliations to recover construction material; therefore, in the late Middle Ages, the ruins of Halaesa are still a tangible presence devoid of identity.
3.3. The Building
Among the structure preserved in the site, the church of St. Maria is the only one that survived after the abandonment of the site dating back to 10th century. The term “Palate” (
Balate/Palati/Palazzi) has more interpretation: the first could be linked with the proximity to the archaeological ruins of the Sicilian-Greek city [
19,
20]; the second may derive from a popular tradition according to which pilgrims, praying inside the church, could acquire as many years of indulgence as there were the grains of sand that could be contained in a shovelful. A Greek inscription, preserved in a copy dating in 1559, seems to refer to a Byzantine phase where the bishop Tobias remembers a not well-specified construction that he built, perhaps between the end of the 6th and the beginning of the 7th century AD. The building is mentioned by the ancient sources as
Sancta Maria de palatio seu palati, perhaps from the proximity with the church complex built in the Norman age; it is mentioned again in a legal document dating back to the Norman age (a diploma of the year 1123), which generically refers to a church dedicated to
St. Maria in the territory of Tusa [
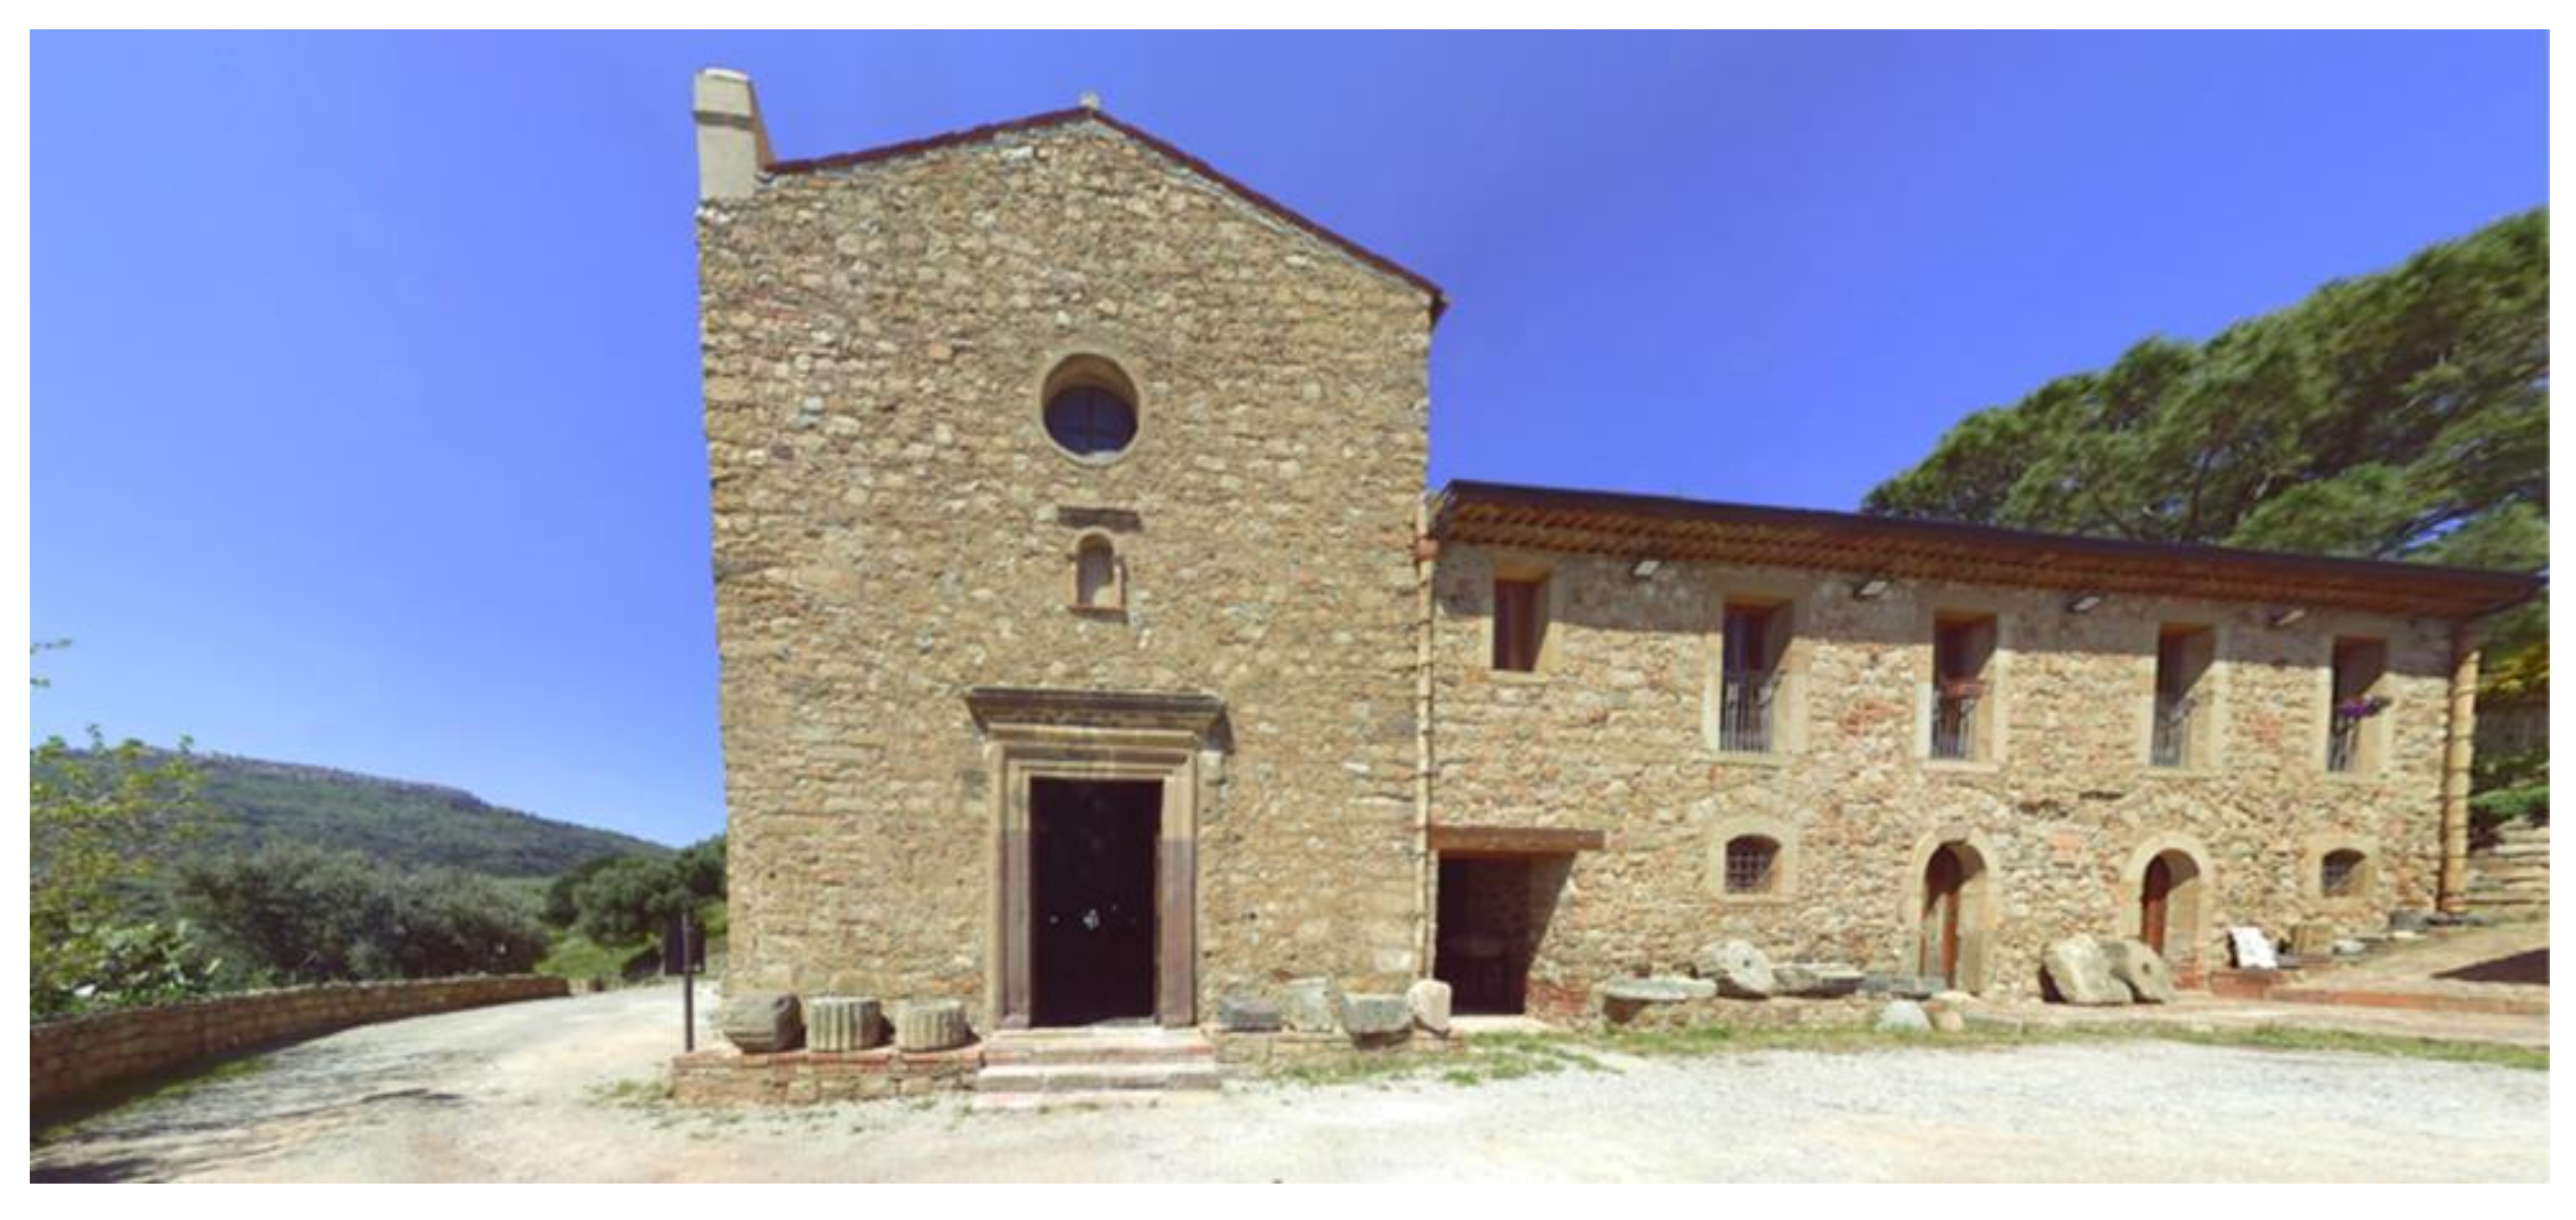
21]. According to the ancient documentation, thus, the earliest ecclesiasticals (no longer preserved) would have been built as part of a monastic complex established by Saint Gregory between 563 and 575, when new monasteries were founded in Sicily to host the religious expelled from their communities because they were not willing to subordinate themselves to the Church of the East. From the architectural point of view, nothing is unfortunately known also about the Byzantine and Norman phases: for the first, it is possible to hypothesize the presence of the apse oriented to the east, while for the second, the addition of the cloister and the Benedictine monastery (12th century). The adjoining building complex (
Figure 2) was built on the ruins of the Norman monastery and on the part of the cloister, which was to develop towards the east.
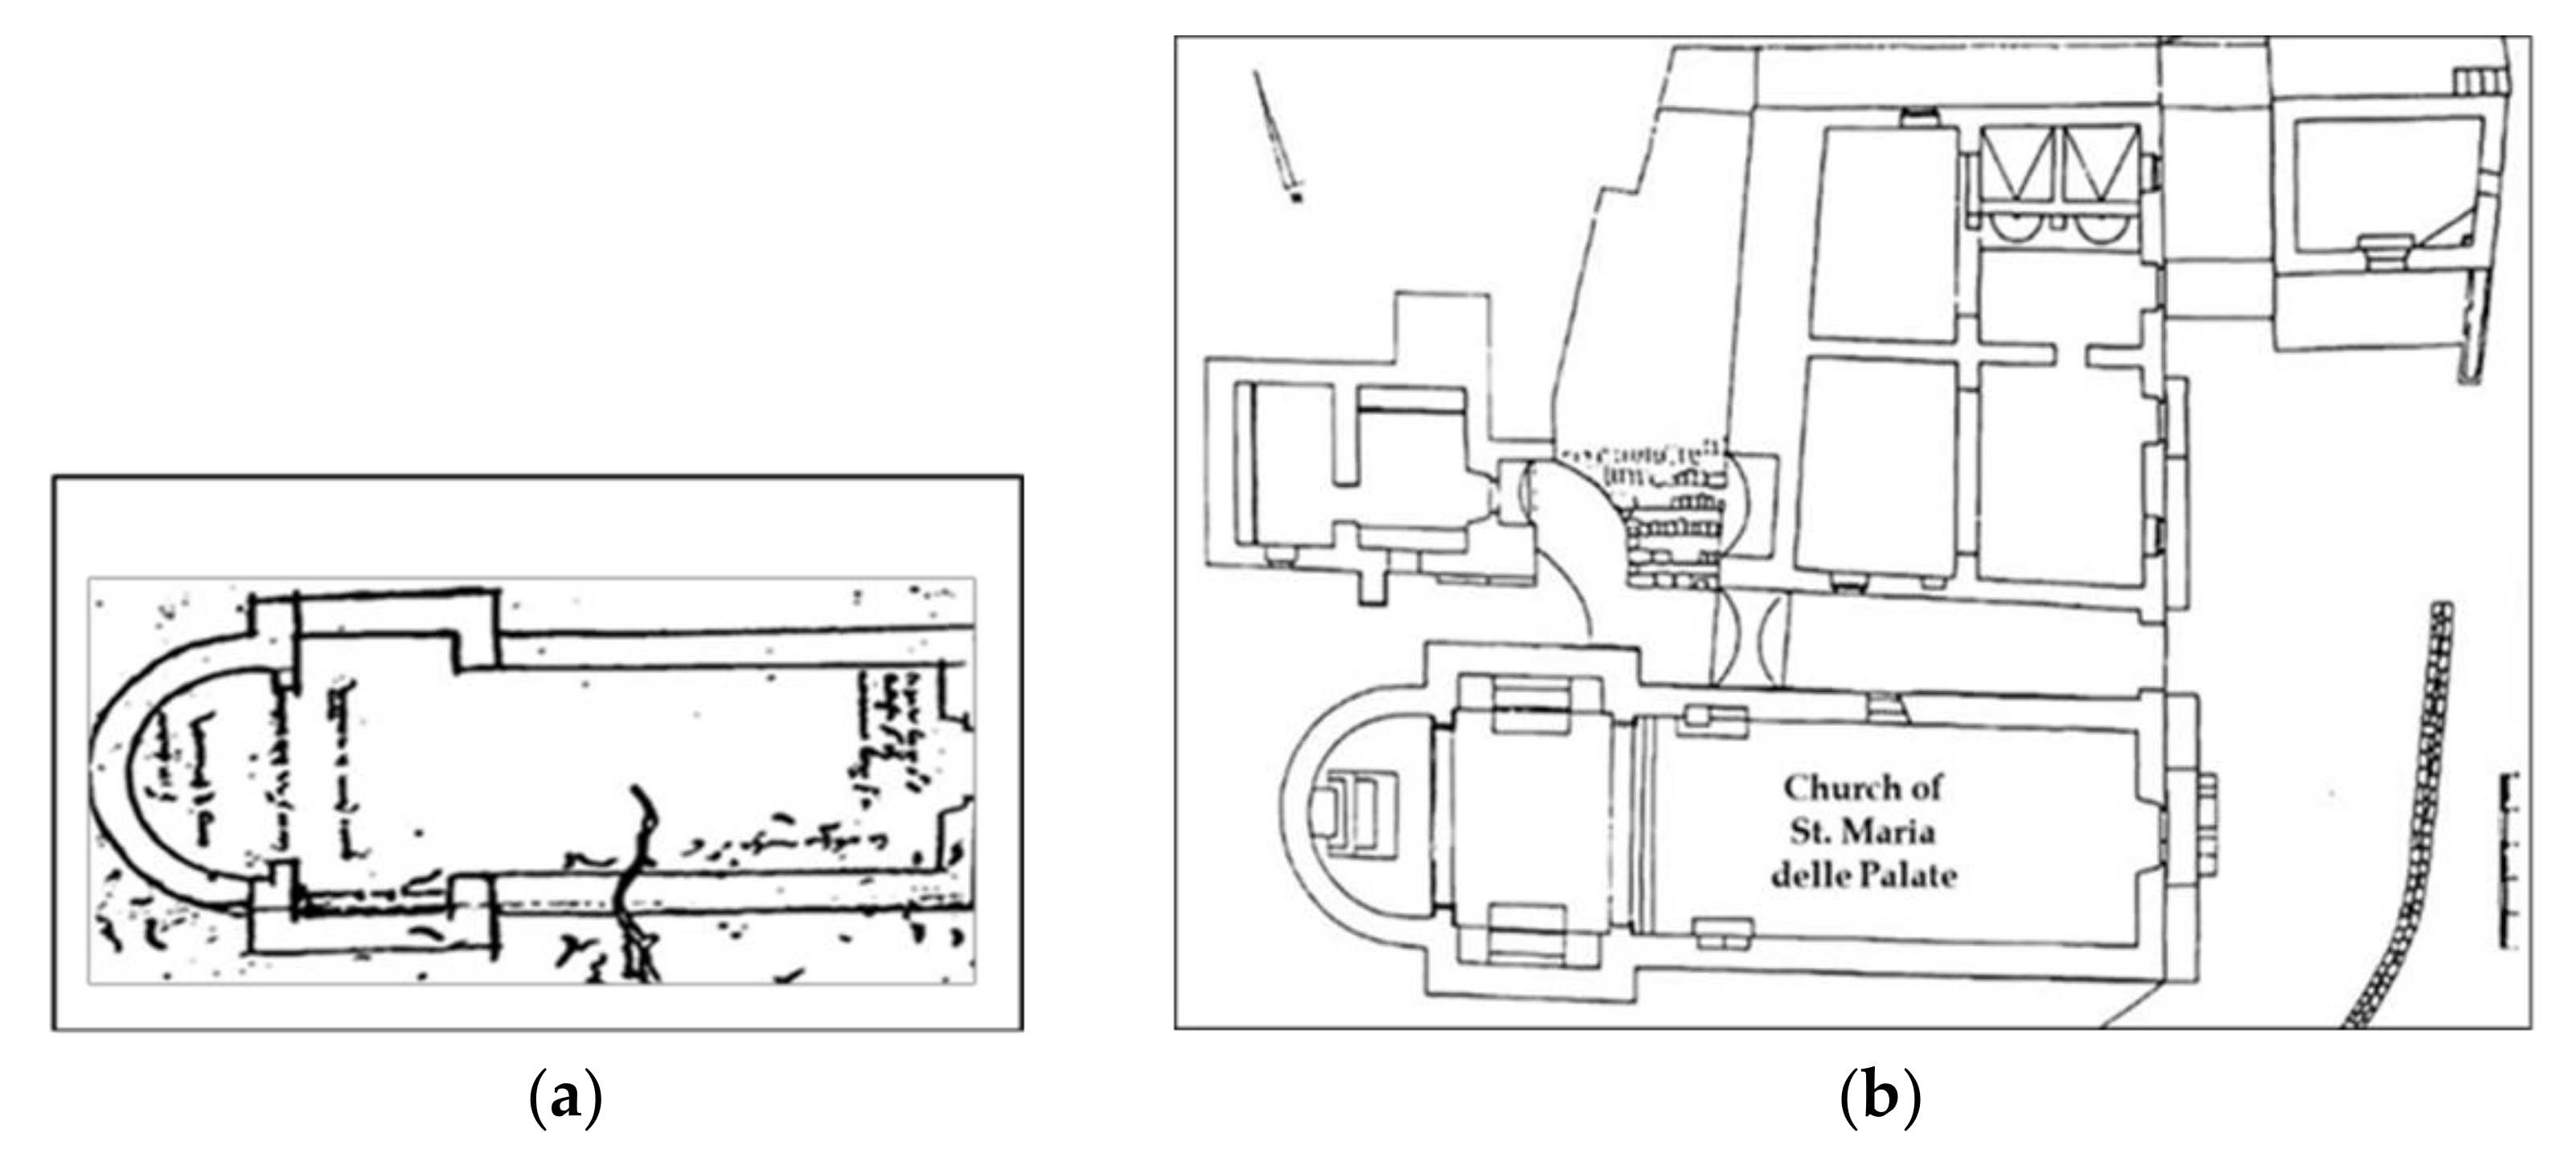
The original structure was subjected to a series of interventions throughout the centuries, all testified by documents. The first, carried out by the architect Pasqualino Scaluni in 1551 (plan in
Figure 3a), has slightly modified the transept and apse (
Figure 3b). The others, for consolidation, have been performed, respectively, by the bishop of Patti between 1734 and 1753, by the Genio Civile of Messina in 1978, and last by the Messina Regional Centre for Cultural Sites, between 2018 and 2019.
A wall painting, probably representing St. Francis in the act of receiving the stigmata is preserved on the left wall of the unique aisle of the church (
Figure 4a,b).
4. Methodology
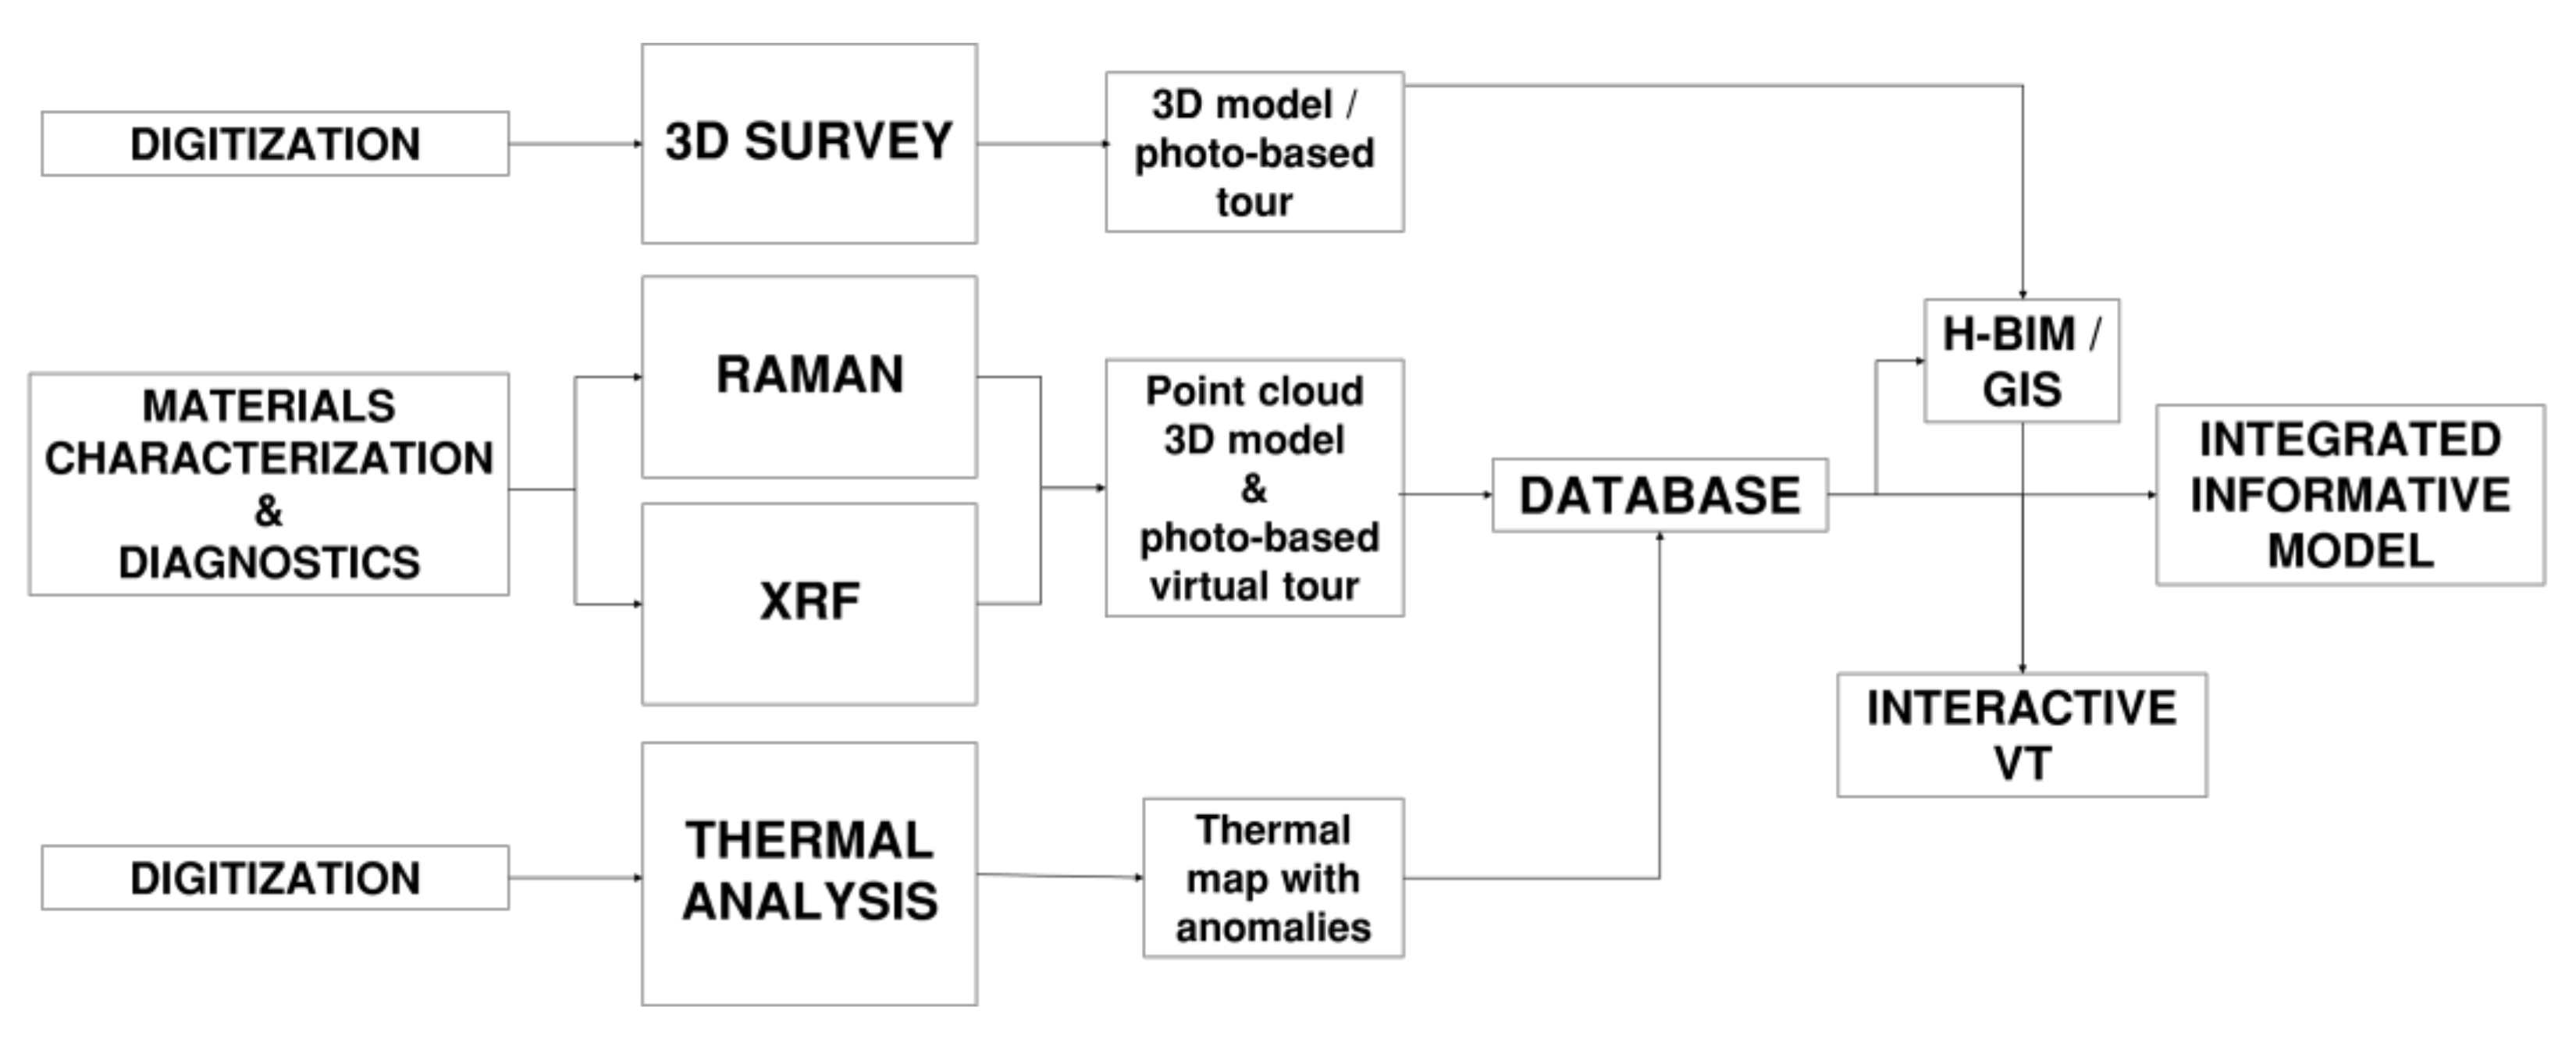
In consideration of the place history and peculiarity of the church, we have carried out a set of thorough investigations consisting of the combination of different techniques: 1. spectroscopy and thermography for the analyses of the wall painting; 2. 3D laser scanning for the survey of the whole church.
Specifically, we have performed periodic non-destructive analyses with an infrared camera before and during the cleaning restoration operations of the wall painting, in order to monitor how the materials respond to continuous environmental variations (exposition to atmospheric agents, heat or light sources) that may damage its integrity. Then, spectroscopic investigations (with X-ray Fluorescence-XRF and Raman Spectrometers) were performed in order to characterize the nature of pigments used and to collect information about the status of conservation. Thus, a thermal map able to enhance, with the thermal anomalies, damaged parts not visible with the naked eye was finally derived. After this step, the terrestrial laser scanning (TLS) measurements were performed in order to obtain metric documentation and virtual reconstruction of both internal and external church spaces: thanks to the 360° photos acquired via an image-based virtual tour for touristic purposes was built up. This product is powered by a 3D point-cloud model, which is linked with a database containing all the information about the building. The flowchart is shown in
Figure 5.
Below are the different techniques performed and the results obtained by each one; prior to the last step are described in single paragraphs.
The final goal is to develop an integrated platform in which expert and non-expert users (e.g., scholars, professionals, administrators and tourists), on separated levels, can enjoy the models and metadata of their specific interest (media, old pictures, results of analyses, etc.).
4.1. Terrestrial Laser Scanning (TLS) Survey
4.1.1. Principles and Instrument
Laser scanning is an active survey technique based on the use of an electro-optical instrument that, through successive scans, allows the detection of an object in its three dimensions. The method is based on the measurement of distances by means of the properties of electromagnetic waves and specifically on laser technology [
23,
24]. Specifically, when a laser beam hits the surface of a given object, its light energy is partly absorbed, partly reflected and partly transmitted; the reflected portion returns to the source, where it is measured by a detector that processes the signal returning spatial coordinates (x, y, z) for each point acquired within a space defined by the instrumental range of action. The set of reflected radiations generates a ‘point cloud model’, from which qualitative and quantitative information can be extracted.
In the field of architectural survey, two types of laser scanners are particularly used: ToF (time-of-flight) and PS (phase shift of modulation or) based scanner. The phase-shift scanner, used for the execution of the survey in Tusa, uses as a signal source a laser diode transmitter that instead of sending discrete signals (as in-flight time technology) generates a continuous wave that is used to modulate the signal, using amplitude modulation. In this technology, the phase difference between the reflected and the emitted wave is used to determine the distance between the instrument and the target.
This instrument used is a FARO Focus 3D S 120, a portable and versatile tripod-mounted device equipped with motorized mechanical parts [
25]. The scanner has a high point acquisition speed, up to 976,000 points/second, reaching a wide field of view (of 360° on the horizontal axis and 300° on the vertical one). It works within an operating range from 0.6 m to 120 m, with an error in the linear distance of ±2 mm, calculated in the distance between 10 m and 25 m between the scanner and the target and a noise (standard deviation of the values from the best-fit plan) variable from 0.6 mm to 10 m with a 90% reflectivity and from 2.2 mm to 25 m with a 10% reflectivity. The scanner is also equipped with a calibrated built-in digital coaxial camera with a resolution of 70 megapixels, which allows you to photograph images with the same reference system of point clouds and associate RGB color values to each point measured.
4.1.2. TLS Data Acquisition
The general workflow can be divided into three main steps:
The geometry of the building has requested preliminary planning of the laser scanning acquisitions in terms of time, coverage and number of the scans. In the first, the scan locations have been preliminarily determined in order to ensure full coverage of the building with enough overlapping between adjacent scans (
Figure 6). The survey has included the internal space and the external perimeter of the church, to which the narrow corridor that separates the church from the neighboring medieval complex was added. The external portions of the roof, not visible from the ground, are not detected. Once the instrument has been positioned, the most suitable scan parameters of quality and resolution (which defines the number of points detected per single scan) have been set via the built-in software.
Given the features of the building, a 1/10 resolution and 4x quality have been set, enabling the acquisition of color photos; it was also decided to minimize as much as possible the number of scans as well to optimize the time of acquisition and accuracy, trying to make at least 60% of overlap between the scans. A total of 27 scans were collected in order to cover the whole scene: 11 inside the church and 16 outside. The two scans positioned in front of the two paintings were acquired with better parameters (1/4) in order to gain a higher resolution on the painting surfaces.
4.1.3. Data Processing
The processing phase took place within the 3D reconstruction laboratory “Ar3Digilab” of the IPCF CNR in Messina. A high-performance workstation, equipped with a graphics card of 4 Gb, Intel(R) Xeon CPU E5-2620 v4 (2.10 Ghz) and 32 GB of RAM, has been used.
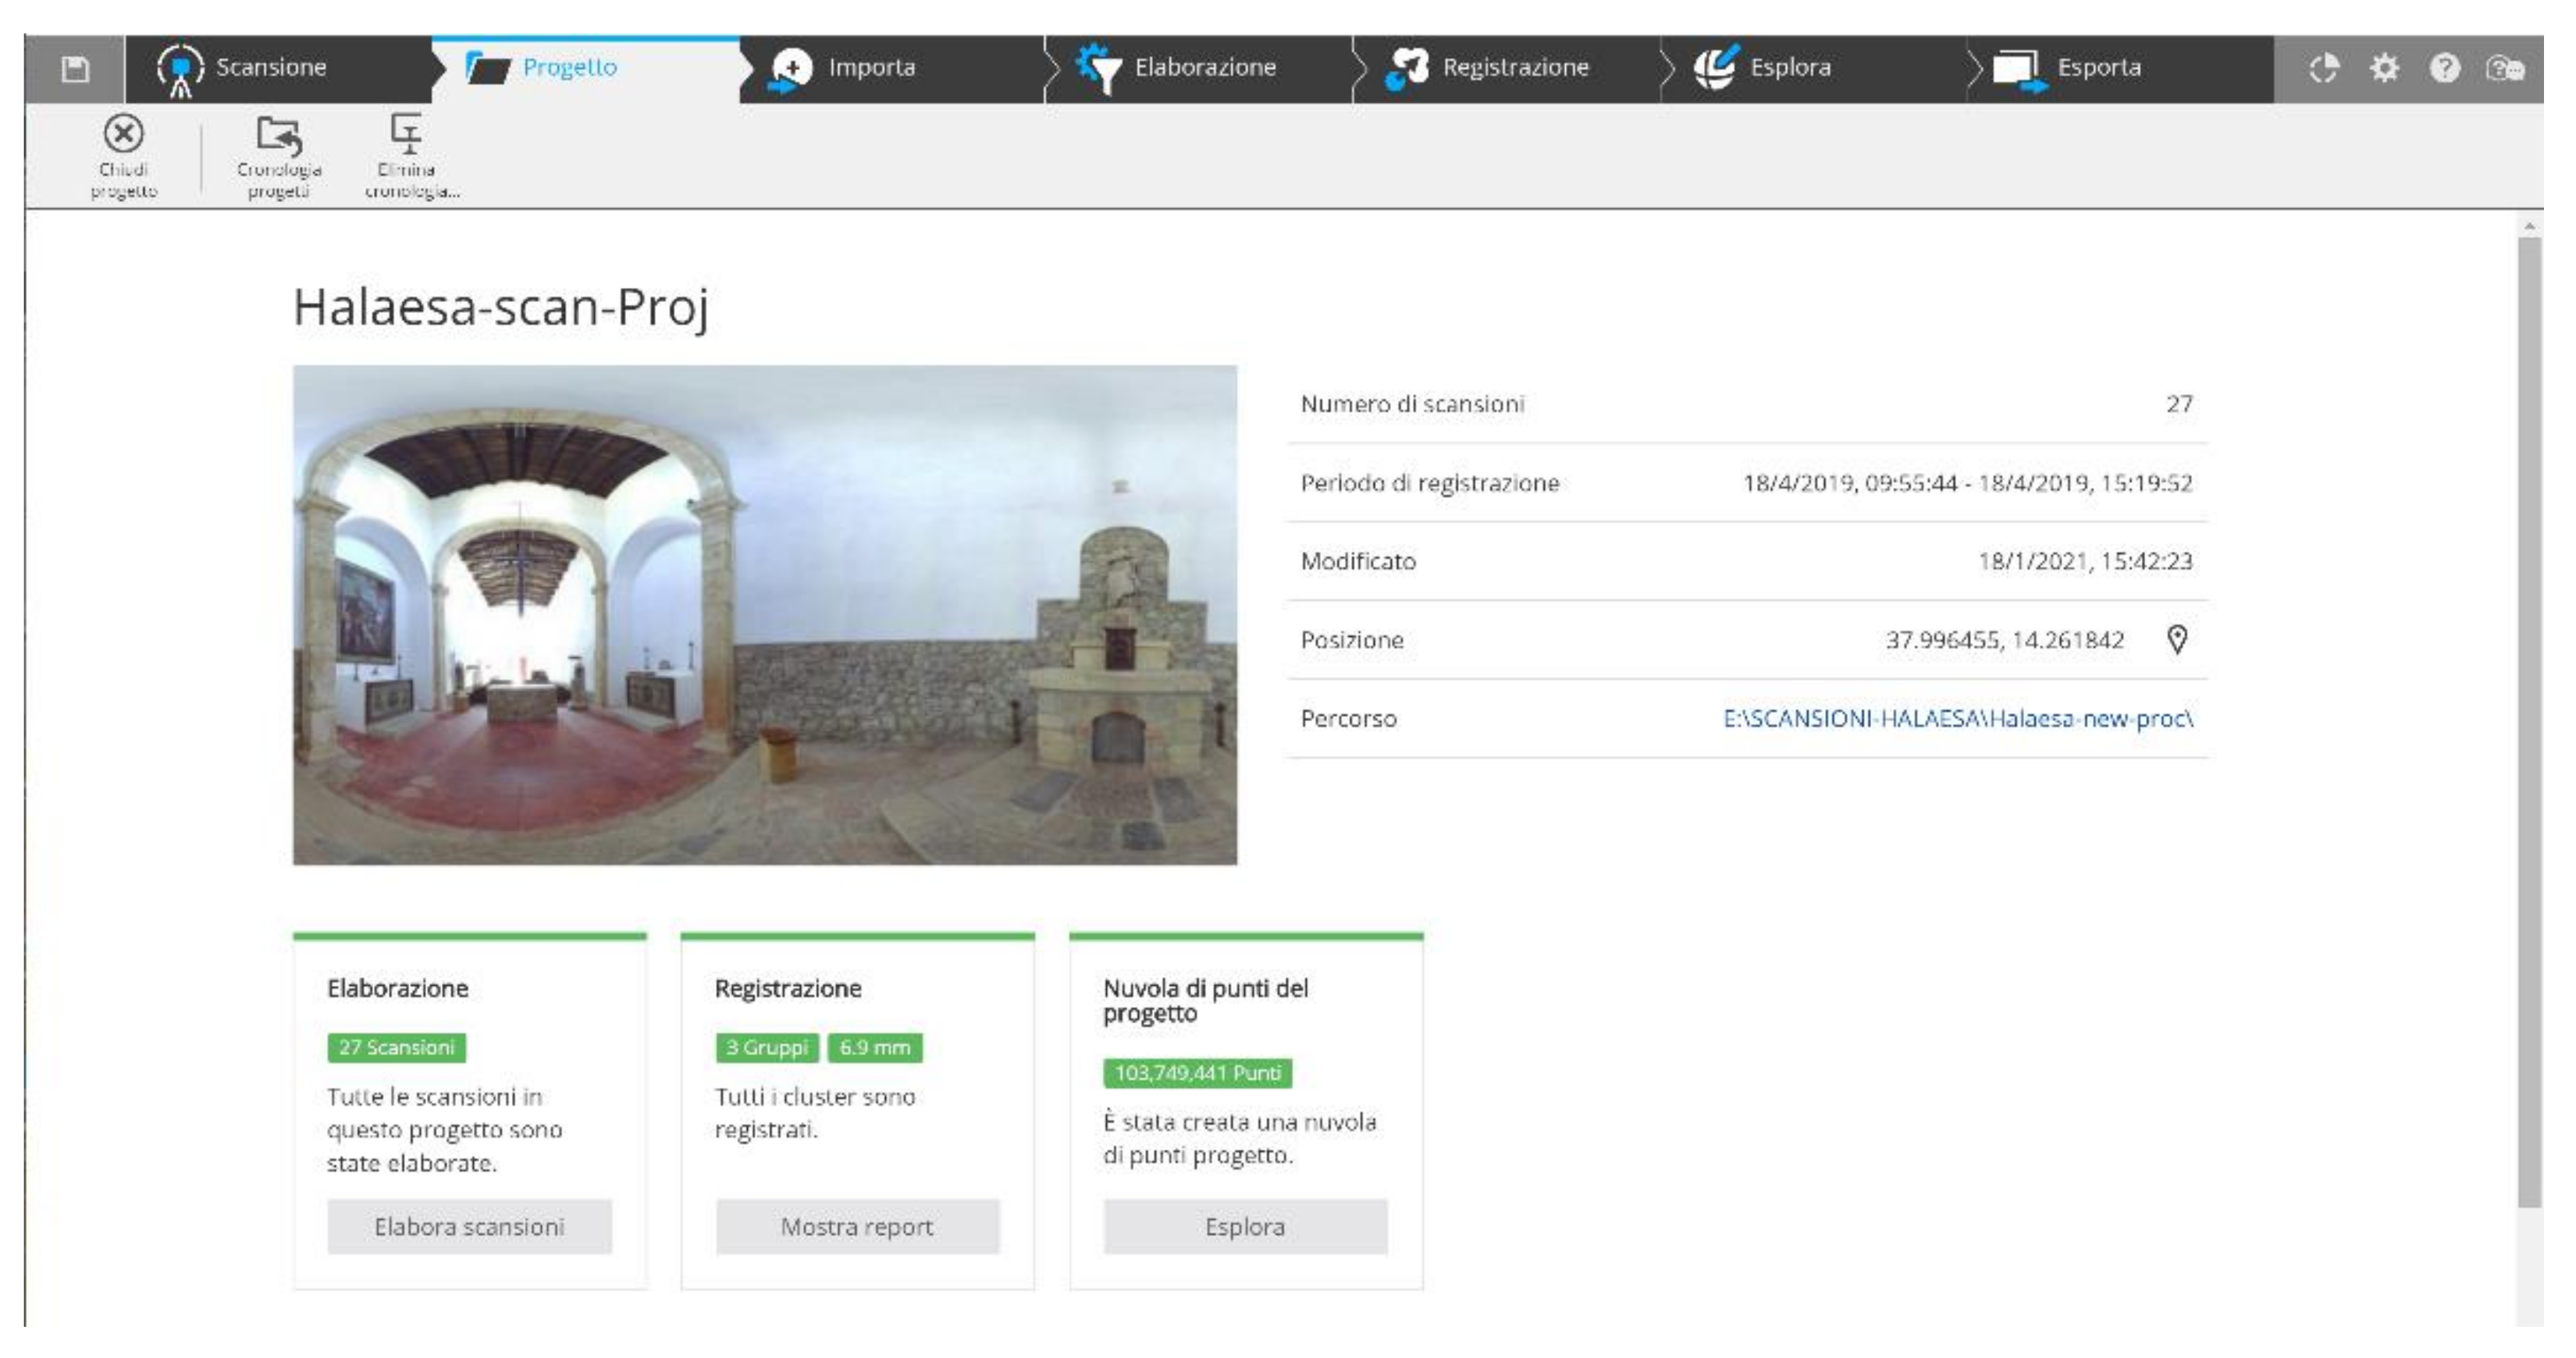
The proprietary software Faro Scene v. 2019.0.0.1457 has been used to register, filter and elaborate the point cloud model [
26]. In Scene (
Figure 7), the 27 “.fls” scan files were processed in order to generate a registered dense cloud of points.
In the first step, automatic filtering was applied for the elimination of points with less reflectance than a given pre-set value that could interfere with the readability and reliability of the geometries obtained. Then, using a specific function, an RGB color value (taken from the 360 pictures recorded from each scan location) has been associated with each point recorded in order to obtain a realistic view of the model. In order to optimize the processing phases, the work environment was customized by grouping the files into three project folders (clusters), which, respectively, contain the scans relating to the exterior and the interior of the structure and other panoramic scans taken from the back hill.
Each cluster has undergone a first approximate manual alignment: the single clouds have been overlapped by the detection of pairs of corresponding points in the common areas between adjacent scans. In this case, reference points (e.g., the edges of the detected space) easily distinguishable both in plan and in the section were chosen. Only at a later time, the automatic registration of the scans was launched according to the following options:
Cloud to cloud (target-less) registration: with this option, very time-consuming, the software analyses the scan points to improve the position of reference objects.
Subsampling: this option subsamples the point cloud in order to have a homogeneous point density; the quality set is medium, with an average point distance equal to 4 cm;
Maximum number of iterations: 30. The maximal number of iterations allowed for the algorithm to find the best solution. The more, the precise the results will be.
Maximum search distance for nearby points: 25 m.
Later, global optimization of the scan’s positions was carried out: in this way, the reduction in the noise compensates the error of the scanner by moving the points to the statistically correct positions, resulting in a more uniform arrangement of points. At the end of this operation, the program generates a report that provides the minimum, maximum error and its deviation. Only when the light turns green and the maximum error falls within the tolerance threshold, the result is considered satisfactory.
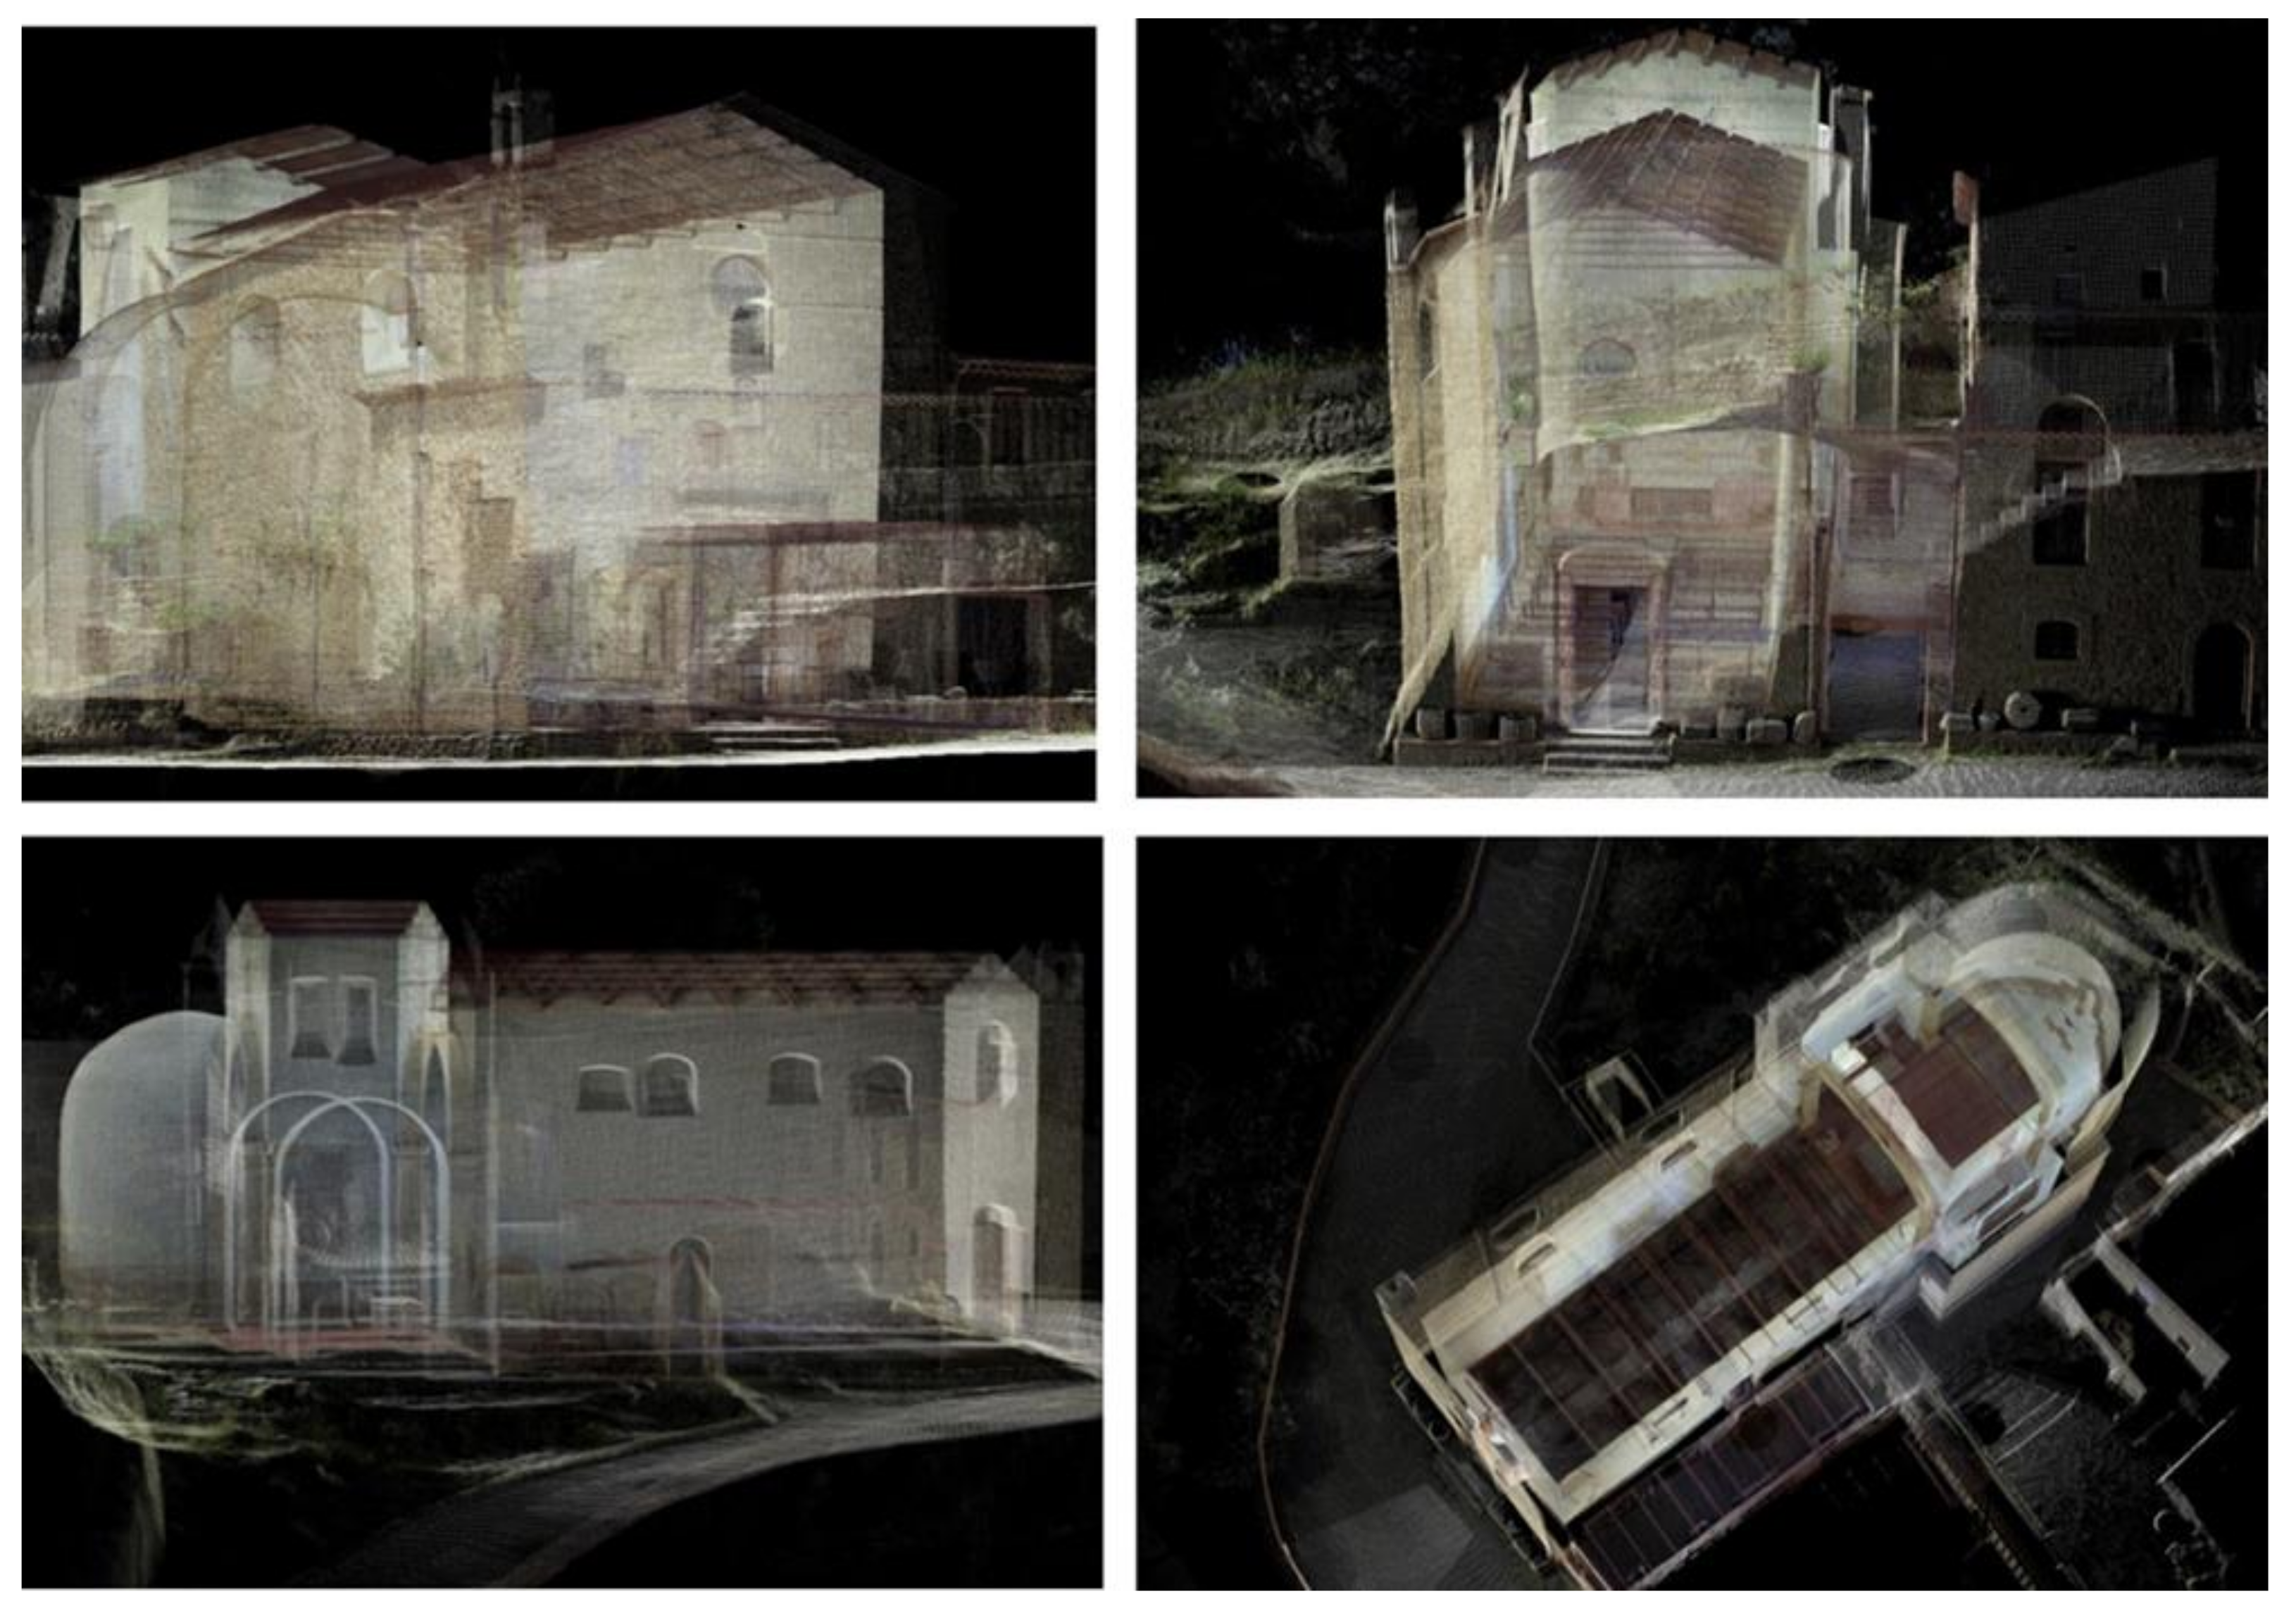
In the next step, a dense cloud project was created (
Figure 8,
Figure 9 and
Figure 10): the model, consisting of 103,749,441 points, was then cleaned from the external elements.
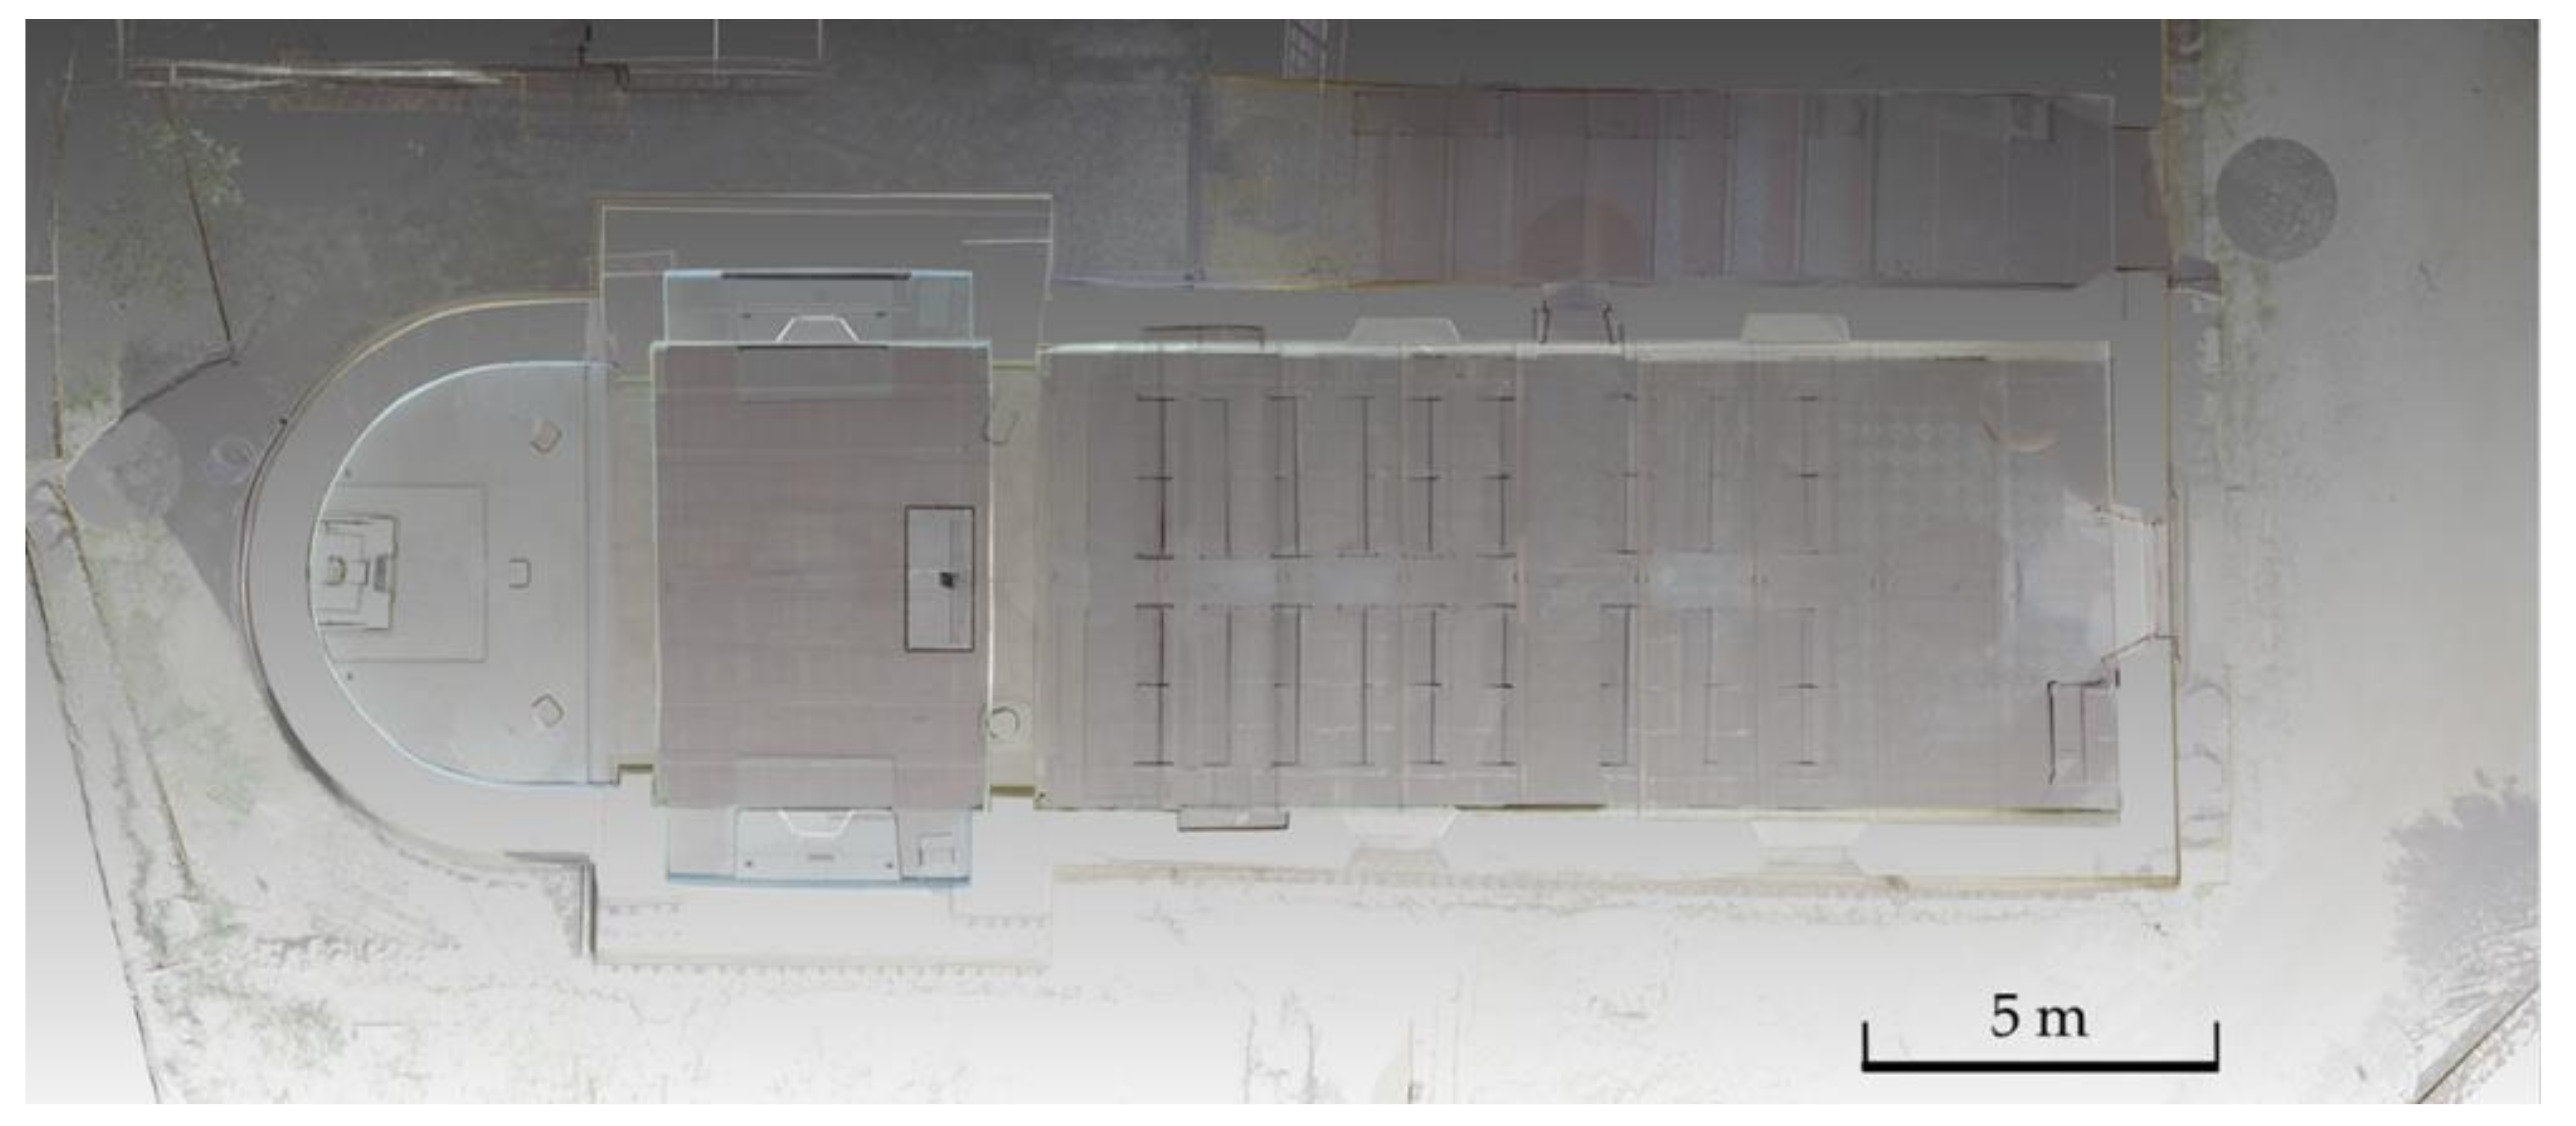
Finally, an “overview map” (a top view overview of the whole scan project) was created through the specific function present in the
workspace in order to generate a plan that can be exported in raster or vector format. The map shows all the scan locations as blue dots (as in
Figure 7). The next phases consisted of the creation of a triangulated mesh, with the addition of color value and the building of texture.
The final model was exported as ordered single scans (.e57 and .rcp format) and project (.isproj and .rcp format).
4.1.4. Preliminary Elaboration for Scan-to-Bim Process
In the further step, the software Autodesk ReCap Pro v. 6.0.0.123 was used in order to manage the point cloud, optimize the model and generate a BIM output; this program, in fact, is able to integrate the information deriving from laser scans within the Autodesk Revit modeling software. At first, each single .rcp file was imported into the software and the settings for the first phase of automatic optimization have been established to further lighten the files. The changes made specifically concerned:
Distance range: points included in the cloud-based on the minimum and maximum scanning distance of the instrument used for the survey.
Intensity range: range of points that are imported based on intensity values (reflection).
Decimation grid: control of the number of points to import by specifying the smallest cubic volume that a single point can occupy. The lower the set value, the better the quality of the point cloud, but the larger the file size.
Cleaning: The noise and disturbance factors, during the data acquisition phase, usually generate distorted objects that do not conform to reality or, in the worst case, unreal objects. This was performed manually by removing the main disturbing elements and unwanted points inadvertently captured from the cloud.
ReCap allowed the creation of a dedicated region, containing all the points to be hidden in the final result. In this way, it was possible to optimize the result obtained as well to reduce the file size. With reference to the final goal of the point cloud, we tried to improve the performance of the output by creating a point cloud management system by dividing it into scan regions. In this way, it was possible to filter the content and convey the view according to different configurations, keeping only the necessary regions active. The creation of scan regions, which can be turned on and off to temporarily hide parts of the cloud, was organized following the Revit model hierarchy.
4.2. X-ray Fluorescence-XRF, Infra-Red and Raman Analyses
The characterization of pigments, binding media and the question of ‘color’ and techniques to obtain them is a wide field of application where combined spectroscopies methods are usually used. The resulting information can be very useful for cultural heritage operators and scholars: the different materials used by artists have a particular chronology and their studies can increase the knowledge about a particular culture or civilization [
27]. From a conservative point of view, the alteration of pigments in wall paintings can be caused by environmental factors according to their peculiar physical–chemical properties and the environmental conditions in which the artworks are conserved. For this reason, a detailed analysis of the conservation state is required to understand the processes which are developing on the painted surface [
28]. In relation to not-movable artworks, in situ measurements are necessary in order to characterize all different areas without a large number of withdrawals [
29,
30]. The application of portable/handheld instrumentation is considered the best strategy to obtain results in situ and complement them with a limited number of samples. In this campaign, whose chemical outcomes have already been published [
31], the knowledge of pigments has been a support to define the technique used by the artist and old restoration [
32,
33].
4.2.1. Instruments
BRAVO handheld Raman spectrometer (Bruker Optik GMBH, Ettlingen, Germany) was used to collect Raman spectra in situ. The instrument uses patented technology (SSE™, sequentially shifted excitation, patent number US8570507B1) and is equipped with two excitation lasers with wavelengths (DuoLaser™) centered at 785 and 853 nm [
34,
35]. The lasers work together to mitigate the fluorescence phenomena and it is not possible to separate them by means of the experimental setup. The spectra have been collected in the 320–3000 cm
−1 range with integration times no longer than 60 s.
The identification of Raman signals was made by comparison with a spectral database of reference materials; however, it is important to highlight that, with BRAVO, we cannot register a signal under 320 cm−1 because of the limit of the detector. For this reason, the pigments with Raman bands less than 300 cm−1 cannot be detected.
Tracer III SD AXS instrument (Bruker Optik GMBH, Ettlingen, Germany) with a rhodium anode (voltage 40 kV and current 11 μA) as the source and a Silicon Drift XFlash
® as the detector has been used to collect the XRF spectra [
36]. Data have been analyzed by using the software ARTAX 7. All the spectra obtained have revealed signals related to the following elements: Argon, Rhodium and Palladium. The argon signal can be ascribed to the presence of this element in the surrounding environment; Rhodium (Rh) and Palladium (Pd) signals are, respectively, generated from the source and slits of the equipment. Moreover, a Compton contribution is recognized from the source scattering with a broad band around 19 keV.
Vertex 70v Fourier Transform-Infrared (FT-IR) spectrometer (Bruker Optik GMBH, Ettlingen, Germany) equipped with a platinum attenuated total reflectance (ATR) module has been used to acquire the attenuated total reflectance (ATR) FT-IR spectra [
37]. Spectra were acquired on the collected samples at 2 hPa in the range 4000–140 cm
−1, with a resolution of 4 cm
−1 and averaging 60 scans. All reflectance spectra have been processed using OPUS 7.5
® branded software; the background is automatically corrected. Each spectrum has been compared with a series of absorption spectra of standard reference pigments and binders.
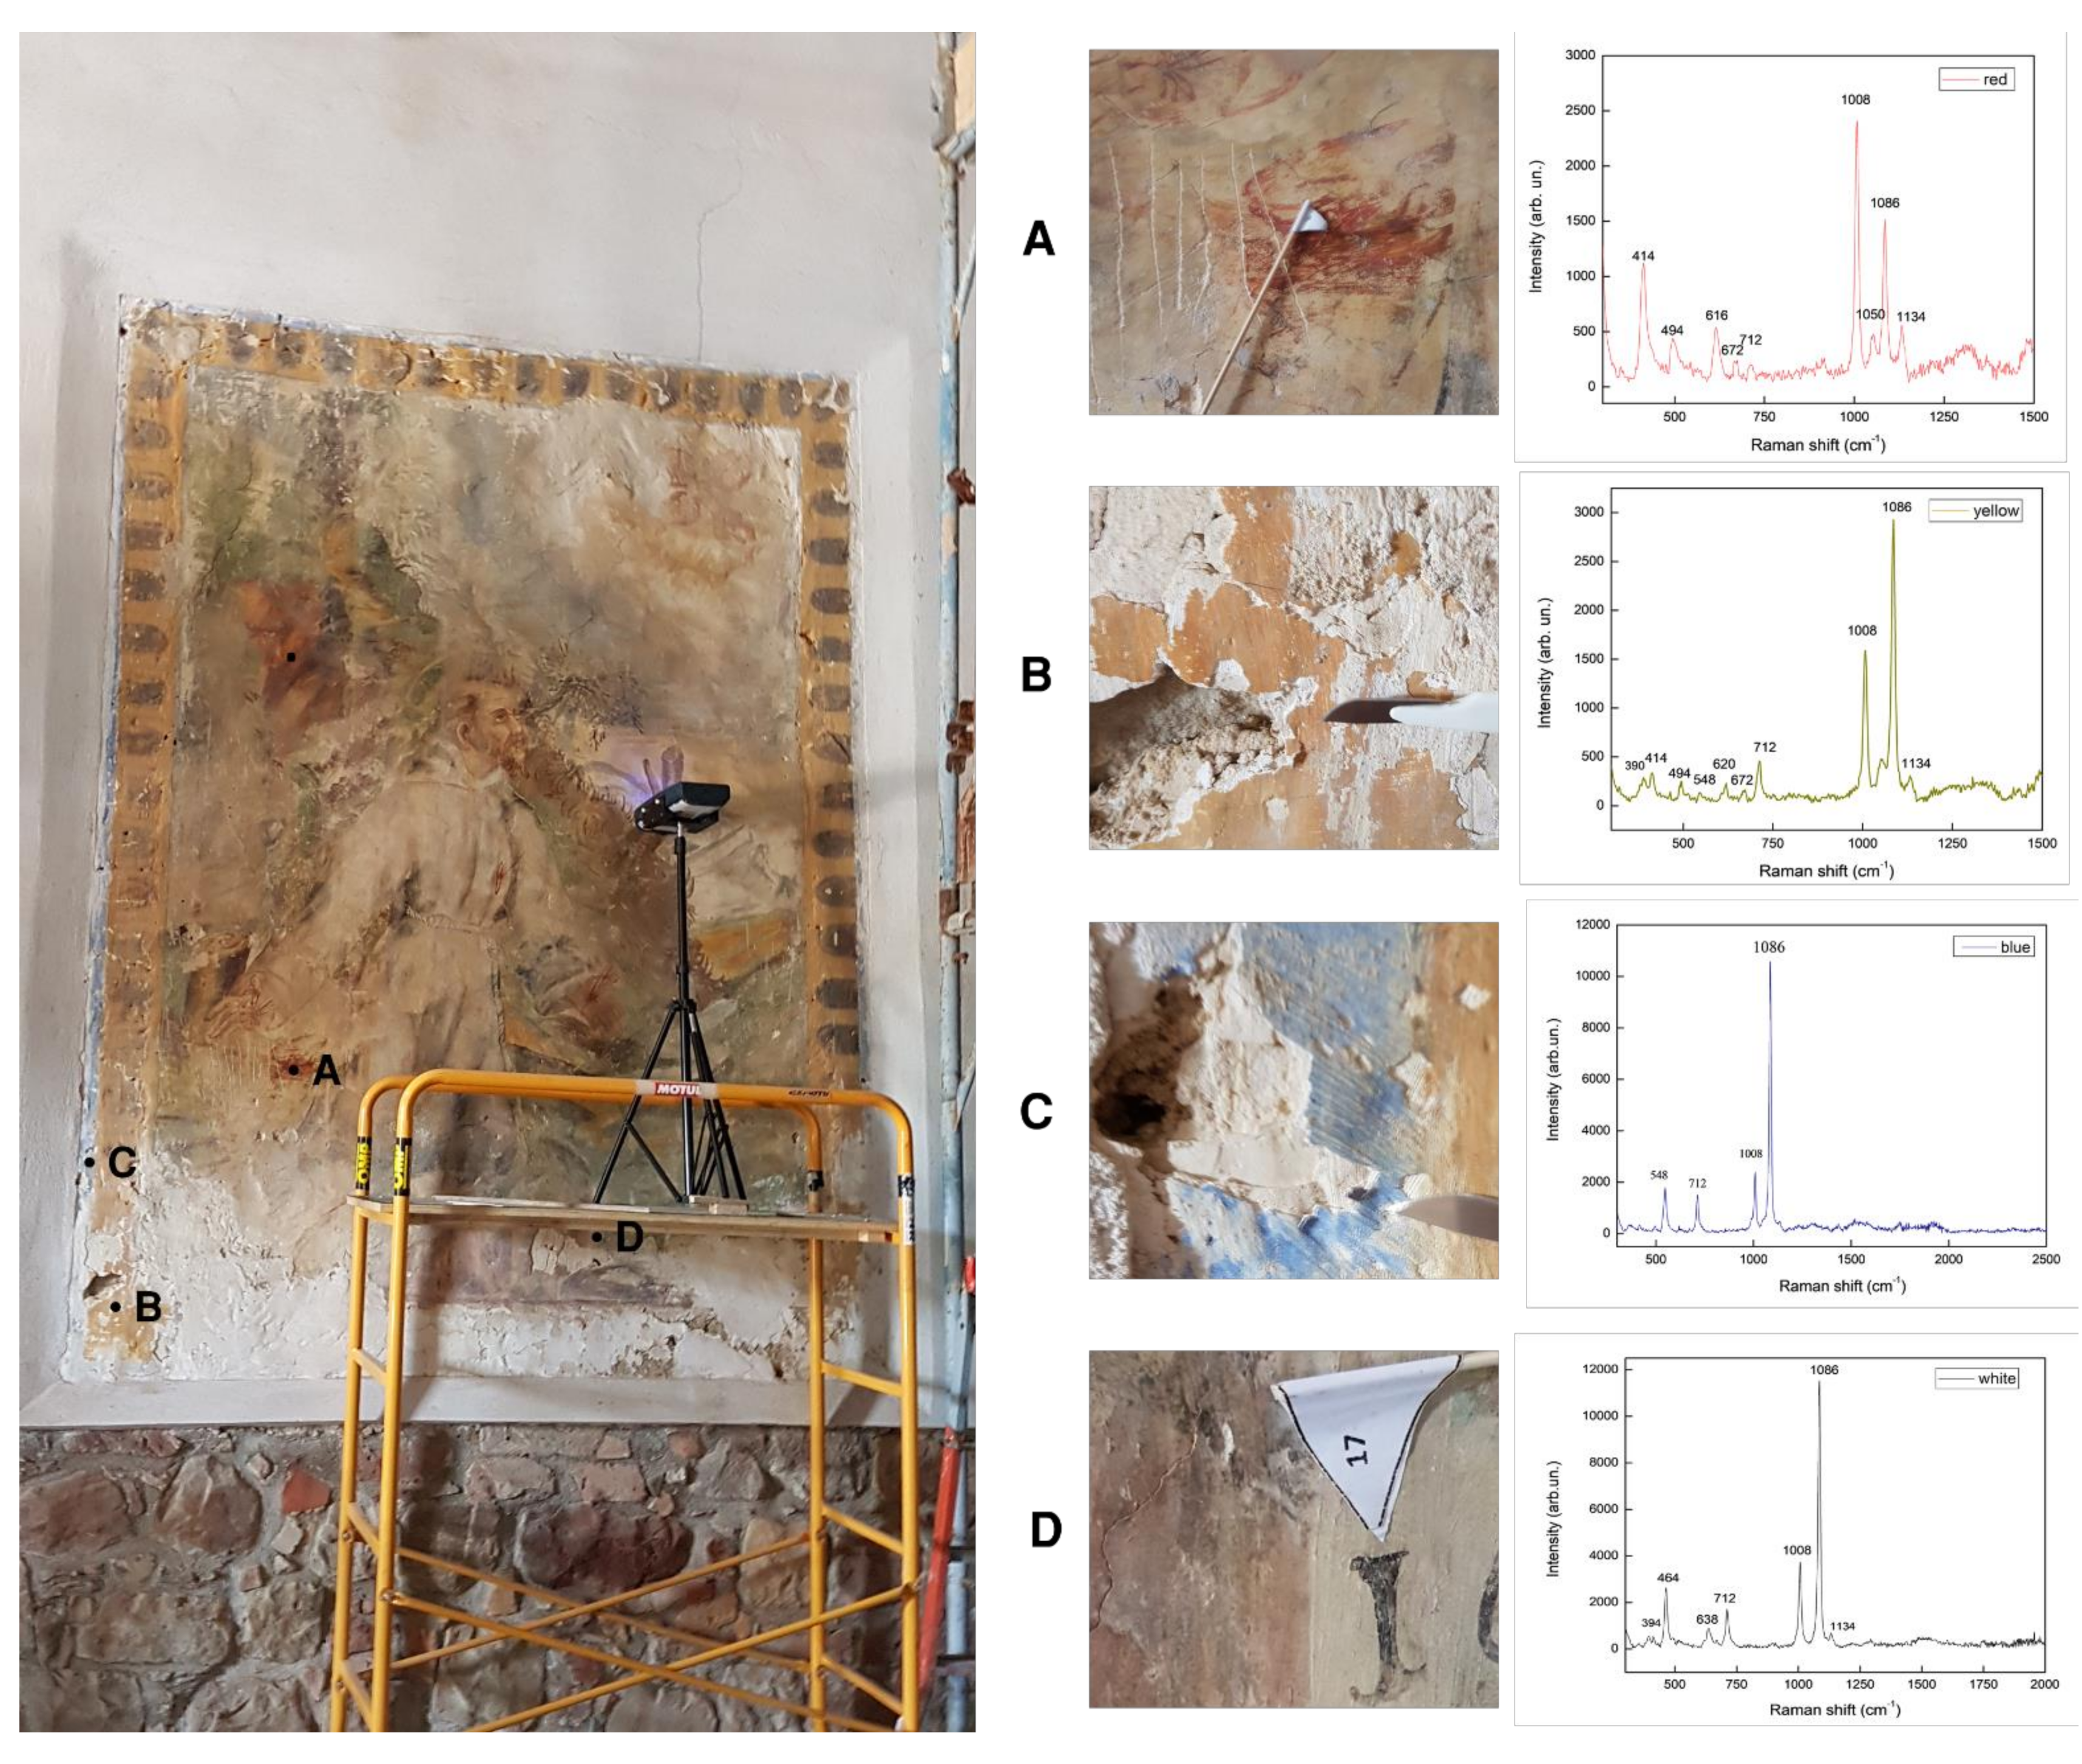
4.2.2. Data Acquisition In Situ
The investigation was performed with portable Raman and XRF spectrometers before the cleaning and restoration interventions. Eighteen points, representing the whole set of pigments, were investigated in situ by positioning the measuring device in front of each correspondent point. The planning of the point to be measured was performed in accordance with the curator of the archaeological site. In
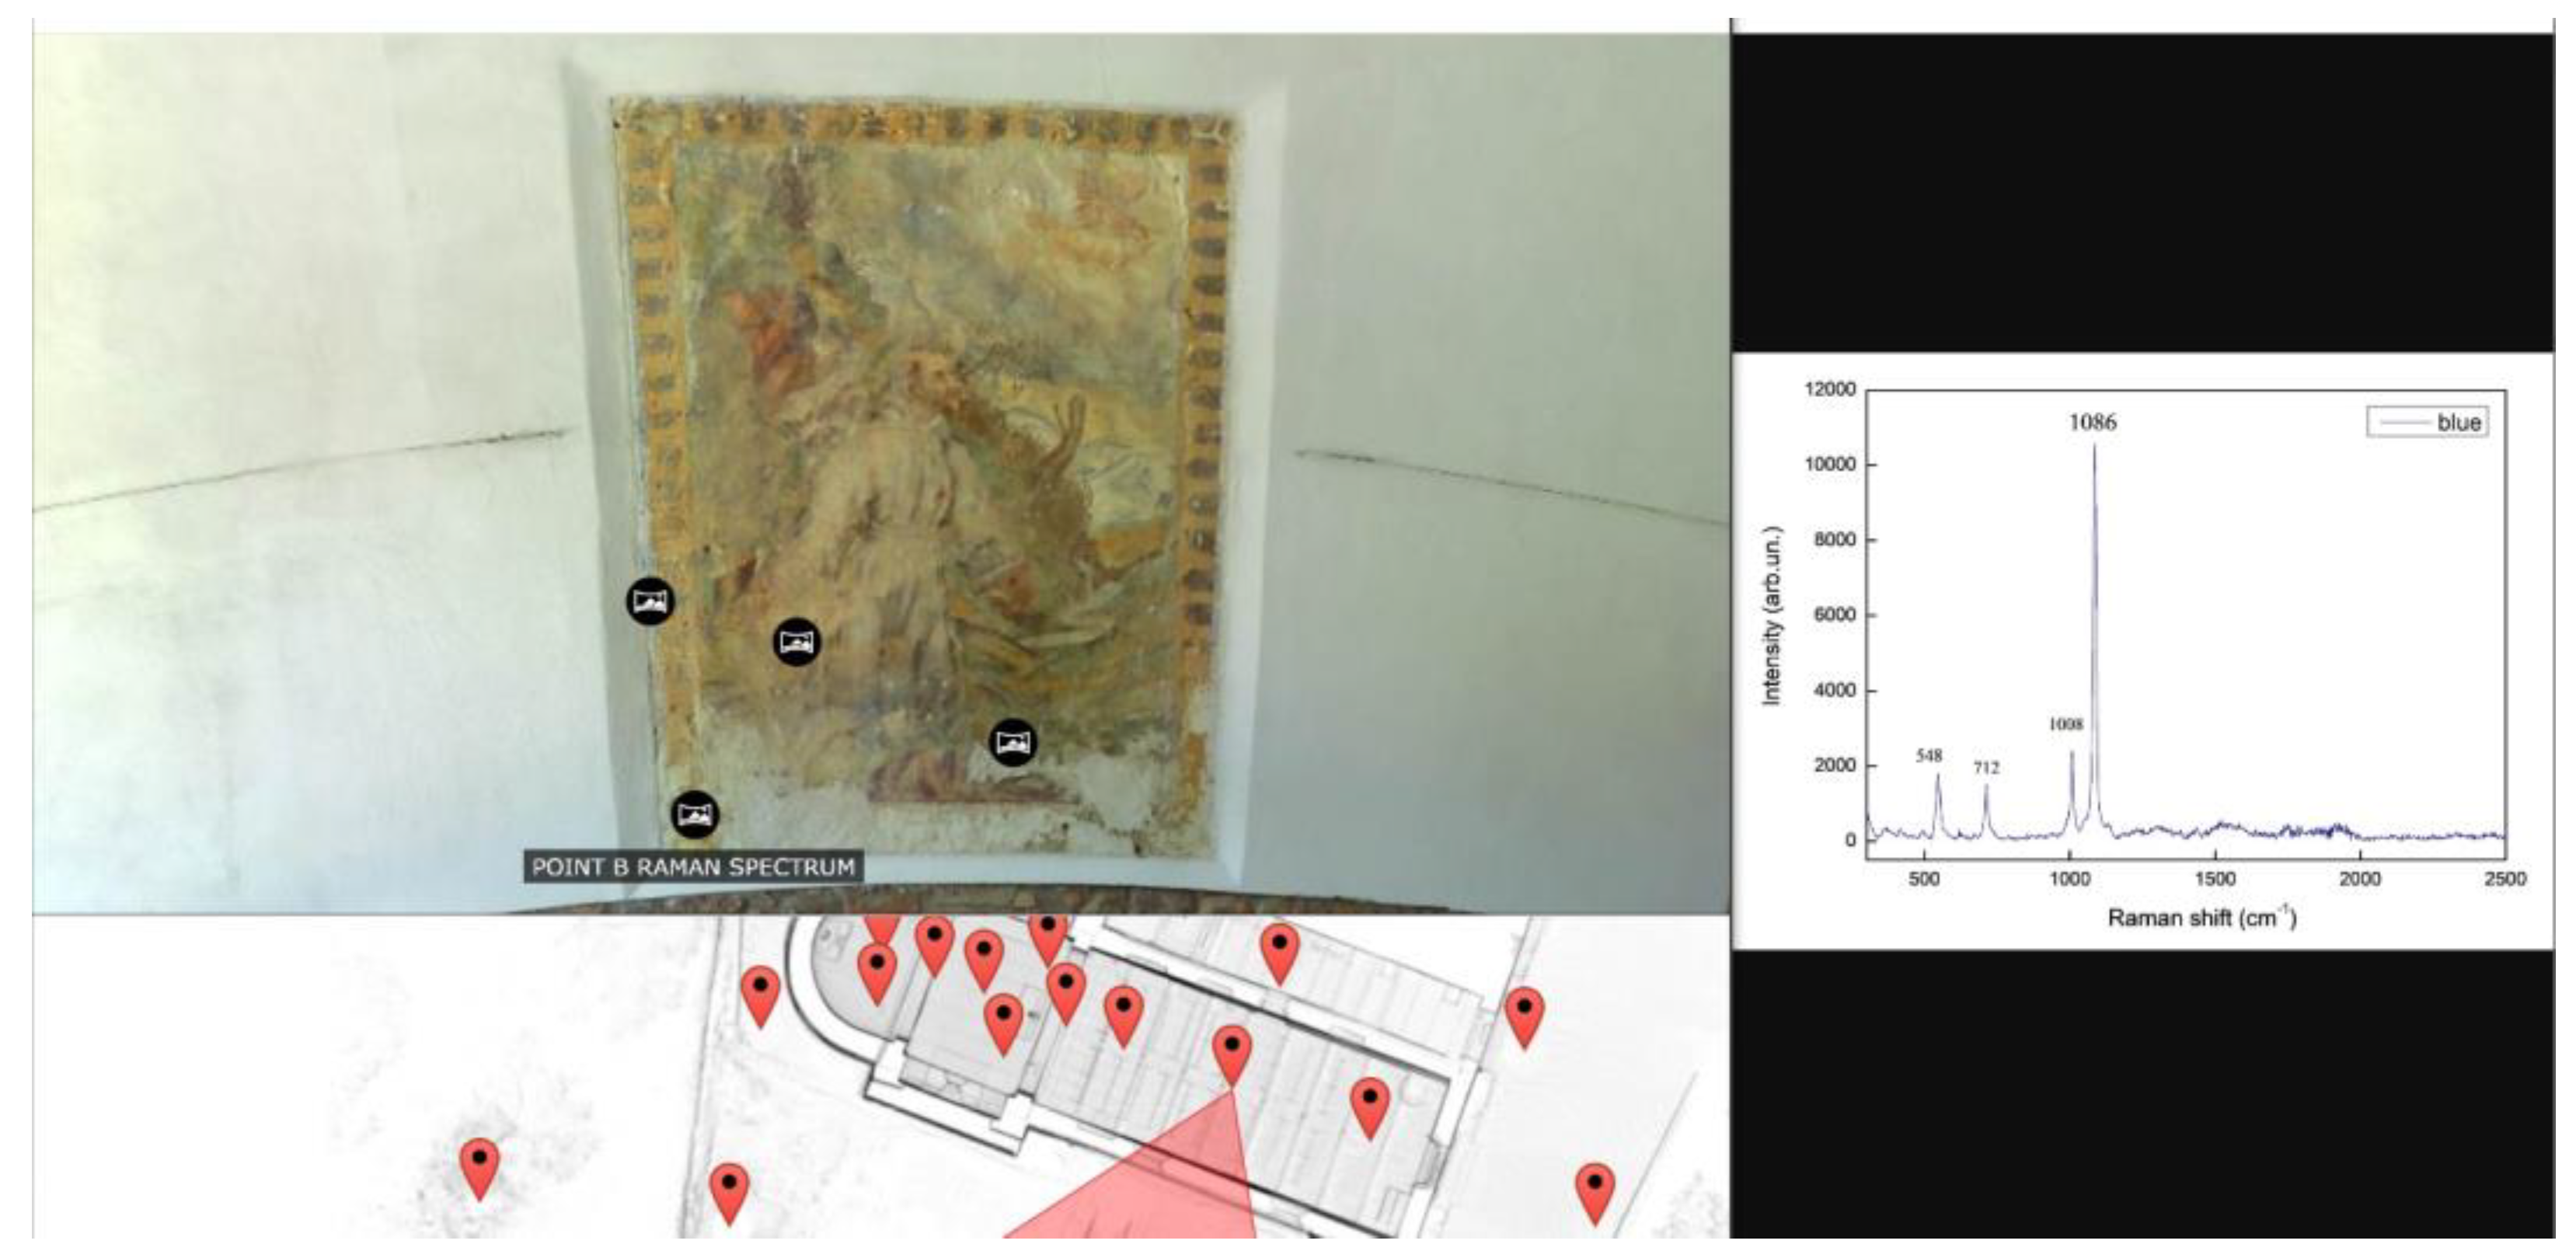
Figure 11, we show as an example the location on the painting of only four representative points objects of the analyses: red (A), yellow (B), blue (C) and white (D).
Finally, sampling was carried out and the withdrawal of some very small fragments of samples were to be analyzed in the laboratory. The results obtained by the latter are reported in the “results” section.
4.3. Infrared (IR) Imaging Analyses
IR thermography, together with the other techniques, can be considered the most effective method for diagnostics [
38,
39]: it is based on the detection of compositional inhomogeneities or microstructural irregularities present on the painted surface that can be caused by the presence of defects such as cracks, flacking, detachment of the pictorial layer and moist areas [
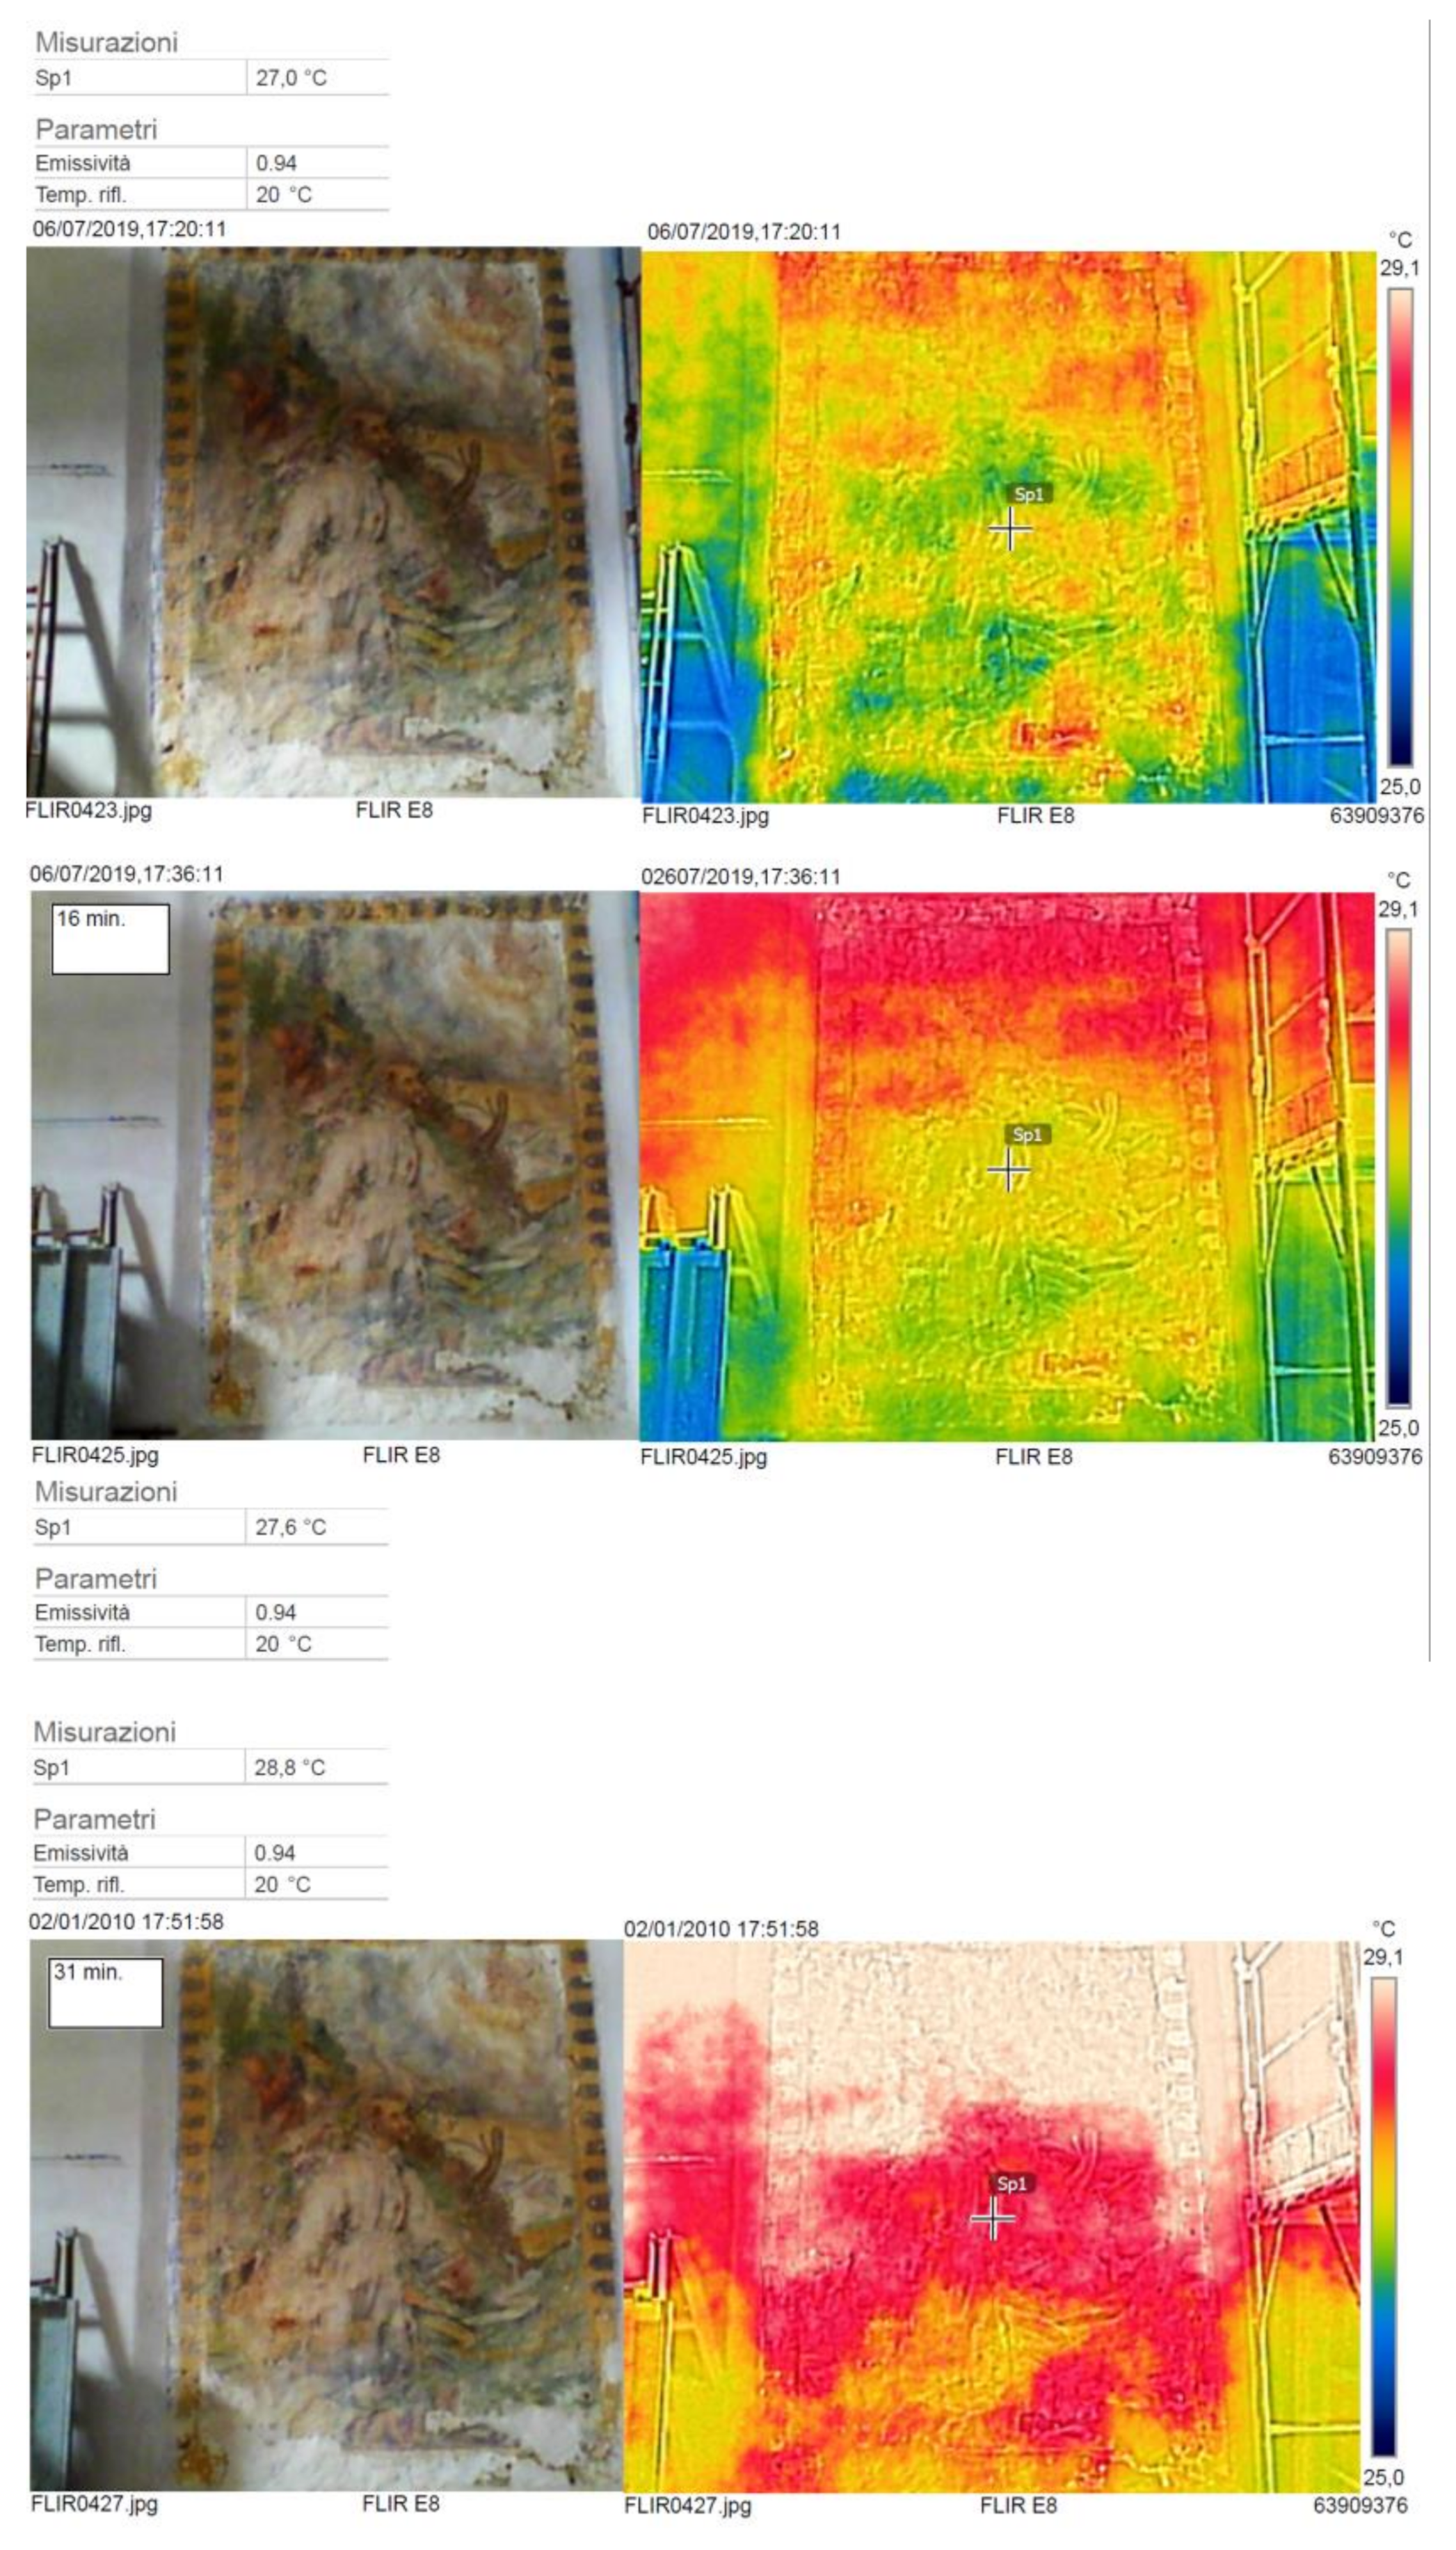
40]. These ‘inhomogeneities’ are revealed by the instrument as anomalies respecting a reference background. When the thermal emission of an object is monitored under natural conditions, it is referred to as passive thermography.
The instrument used is a FLIR E8 thermal imaging camera. The instrument, very performing and lightweight, is characterized by an uncooled microbolometer sensor, which can measure in a range between 7.5 and 13 µm with an infrared spatial resolution of 320 × 240 px. The software allows many interactive imaging options, including merging with a visible image captured by an integral conventional digital camera.
All the acquisitions were performed, passively, without any artificial heating: it means that the infrared signatures derive totally from local environmental conditions. In fact, in some situations, the paintings can be thermally stimulated (heated or cooled) in order to induce a temperature difference between damaged and undamaged areas.
The resulting imagery has been processed using the proprietary software FLIR Tools in order to extract useful information (
Figure 12).
Unfortunately, the application of infrared thermography on painted surfaces is strongly influenced by non-uniform heating and by the emissivity of frescoes surfaces that is determined by the different pigments used. The different measurements carried out made it possible to identify some detached areas in the painted surface. Although not much other information was obtained from this application, the acquisition was important to have comparison data on the state of conservation, to be used during future thermal prospecting. Moreover, this kind of analysis has been integrated with the non-destructive investigation of pigments by using handheld spectroscopic instrumentations (X-ray Fluorescence (XRF) and Raman Spectrometers). For the first time, the wall painting has been studied combining the results given by different techniques; moreover, the diagnostic results have been a valuable support for restorers.
4.4. Media and Virtual Tour
With the occasion of the reopening of the church to the public, it was decided to produce, in addition to the new three-dimensional model, an exploratory tour of the building, useful for a virtual enhancement of the church, often considered a minor attractive compared to the archaeological remains. This idea has already been partially experimented with during a workshop held in Tusa in May 2019, dedicated to the development of the territory through the knowledge and enhancement of the local cultural heritage.
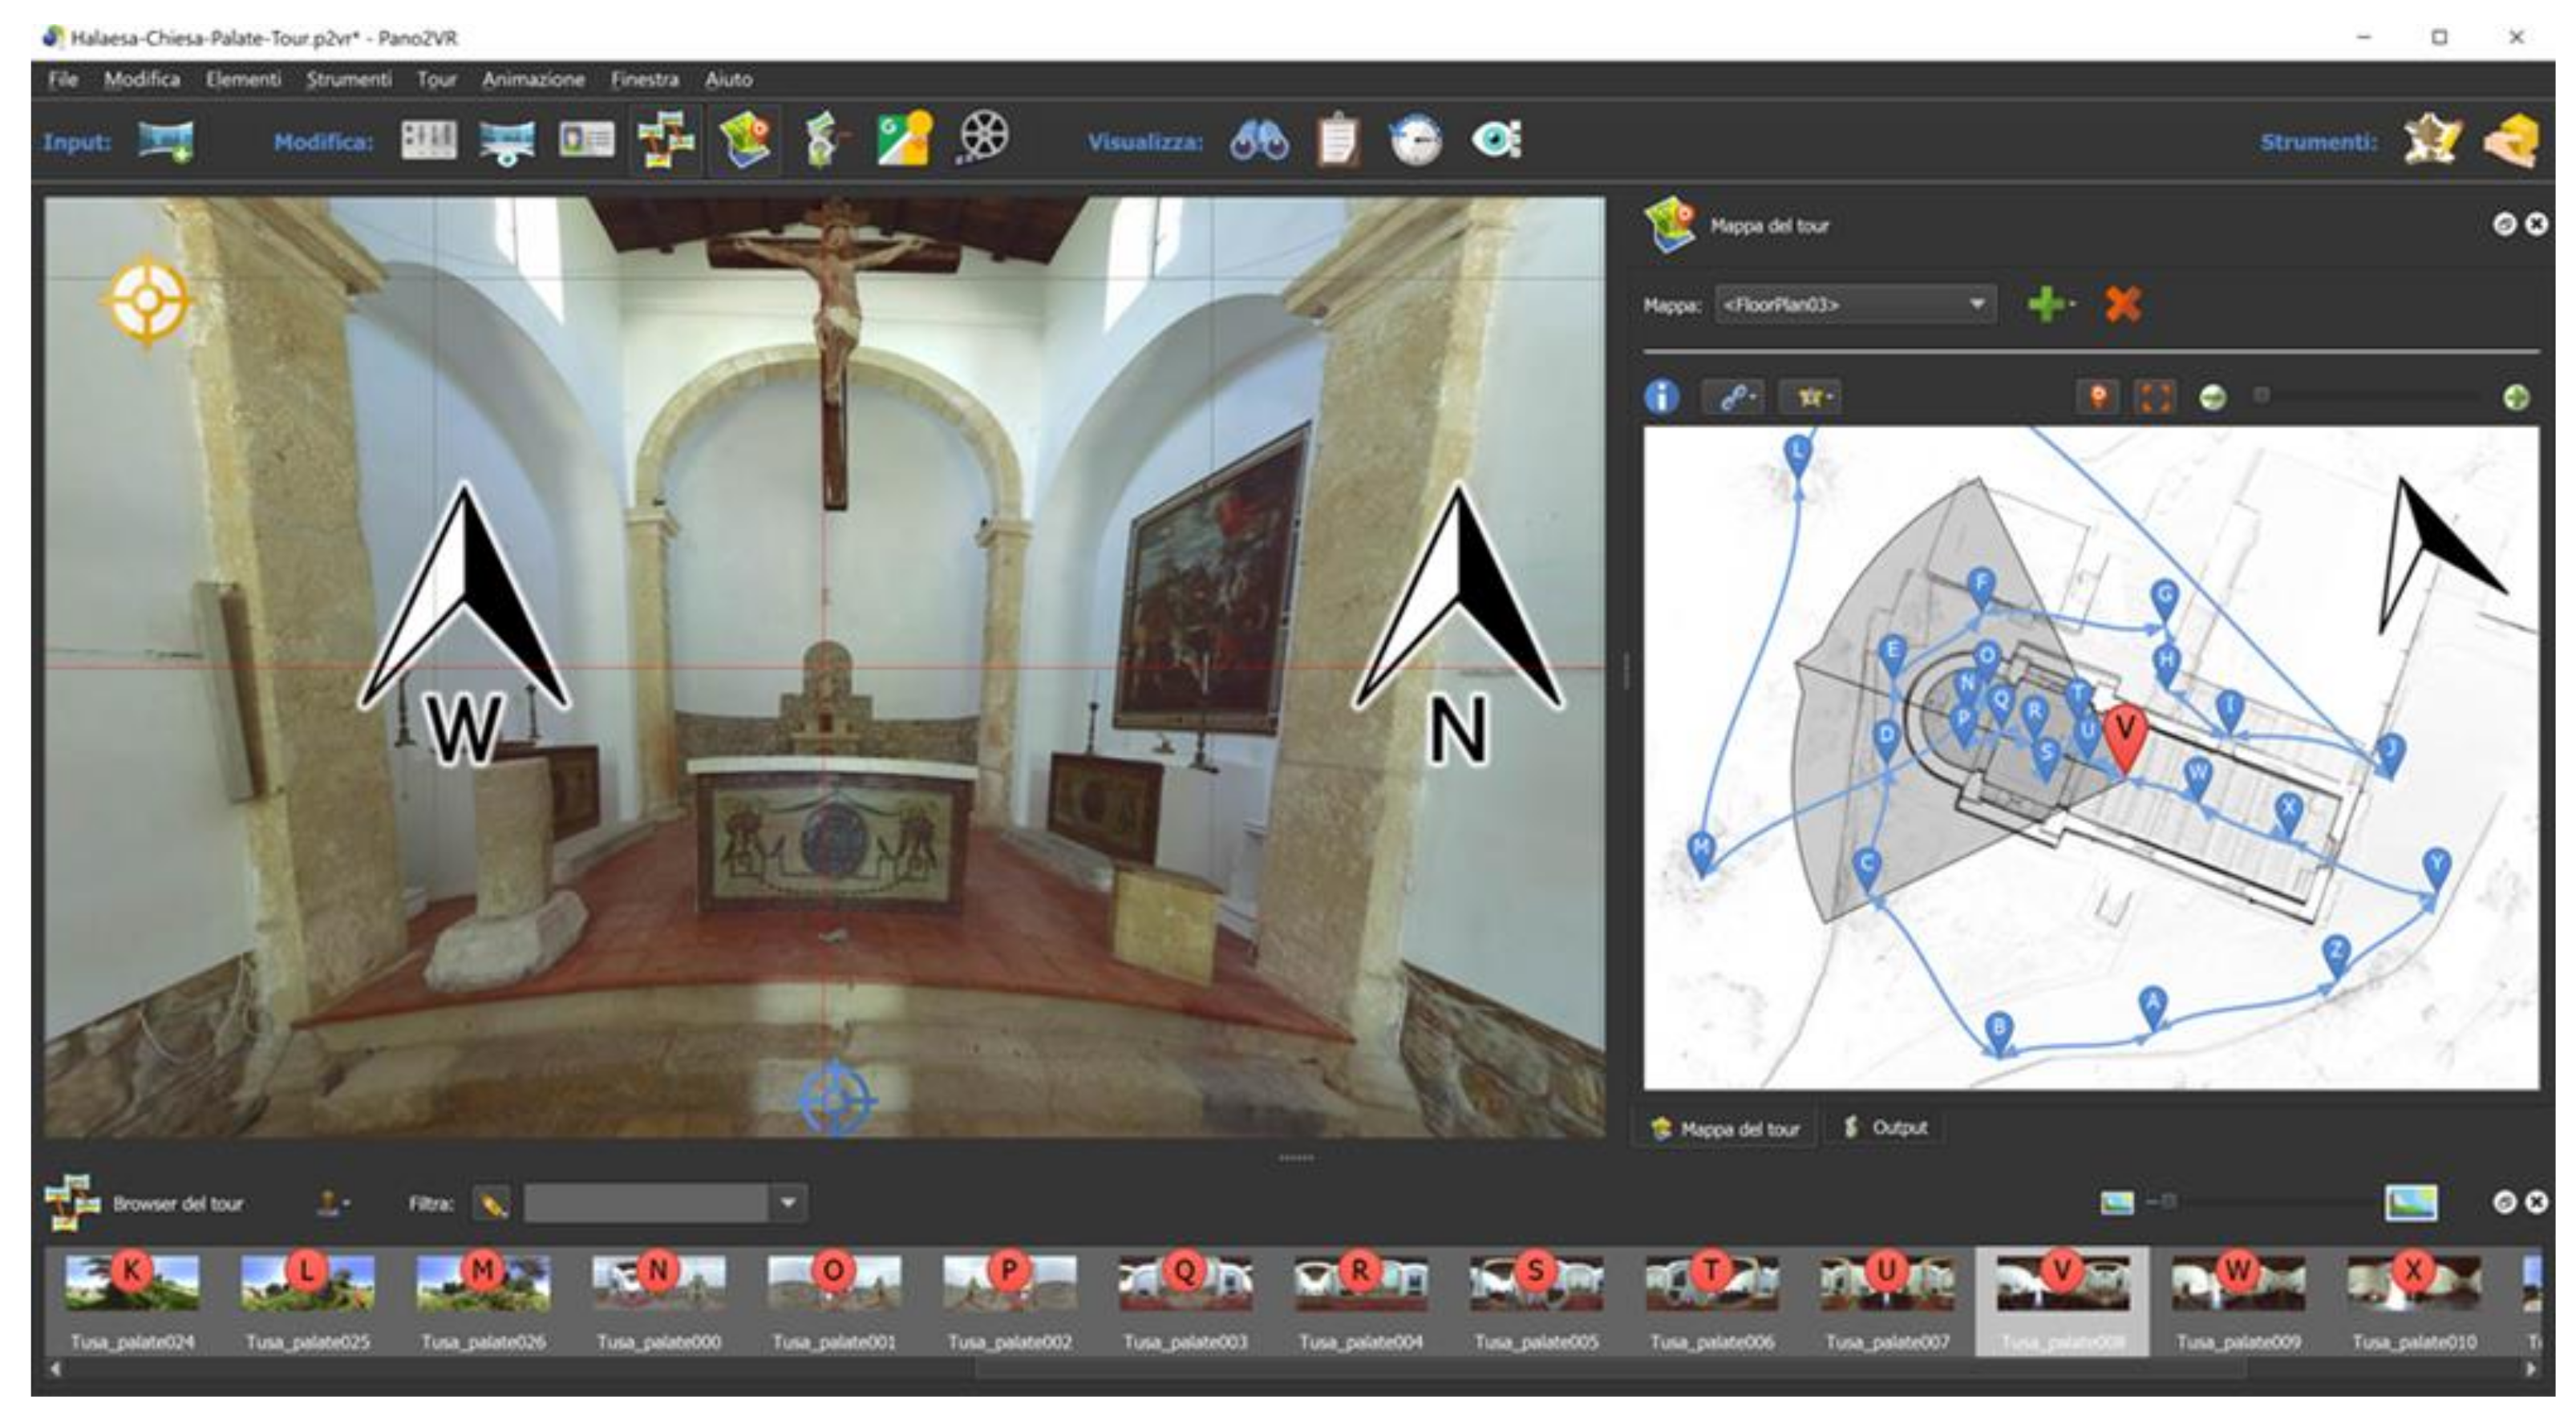
The tour was created with the software Gnome Pano2vr v. 6.0.6, which allows us to import the spherical photos taken by the Faro camera (
Figure 13) and to export the final projects in HTML5.
The virtual tour (accessible from the link
http://wwgis.ipcf.cnr.it/prodotti/tour-SMPalate/index.html, accessed on 15 March 2022) consists of 27 points of observations, derived from scan locations, and a number of interactive points that the user can use in order to obtain information. For example, in correspondence to the wall painting, it is possible to click on specific markers in order to obtain a brief description and the results of the analyses.
An interactive base-map was also added with a twofold scope: to locate the active observation point and to move quickly to another observation point without going through all the tour nodes in sequence. Subsequently, the project was exported in HTML5, a format compatible with web browsers. Once uploaded to a specific server, the tour can be reached from any device (PC, tablet, smartphone, etc.). The VT provides tourists with an opportunity to explore the church from a remote and to move around, inside and outside the monument [
41], interacting with some virtual information panels. (
Figure 14).
The data generated with this study can undoubtedly boast the process of valorization of the site, promoting its accessibility during particular events (e.g., ordinary maintaining works, pandemic emergency, etc.) and inclusivity.
5. Results
5.1. 3D Models
At the end of the process, a detailed virtual model of the whole church was obtained; it consists of a 3D point cloud which includes, beyond the geometry, colorimetric and intensity metadata. The level of accuracy reached (6.9 mm is the geometric average error) can be considered proper in order to be able to plan a multitemporal structural monitoring of the building. The geometric model can be used as the basis from which a number of outputs such as plan (
Figure 10), sections and elevations and other views (
Figure 15) can be extracted, according to different purposes. For example, we have derived precise metric values, useful for an exhaustive analysis of the building. The maximum height of the church’s facade, including the small structure containing the bell, reaches 10.90 m, while the width is 8.21 m; the total length of the building reaches 26.77 m. As for the interior, the nave extends for 16.46 m to the transept, which instead measures in width 8.90 and continues to the apse for 9.60 m. Accurate metric information was also extracted from the church’s decorative apparatus: the 1600s wall painting depicting St. Francis, whose dimensions are 1.90 × 2.60 m, and the altarpiece preserved along the north-eastern side of the nave.
The final overview map has been compared with the previous graphic documentation of the structure [
42]. As we know from different sources, from 1551 until today, the church has not undergone significant architectural changes, an element further confirmed by the comparison between the new plan (
Figure 6 and
Figure 10) with the previous ones (
Figure 3a,b).
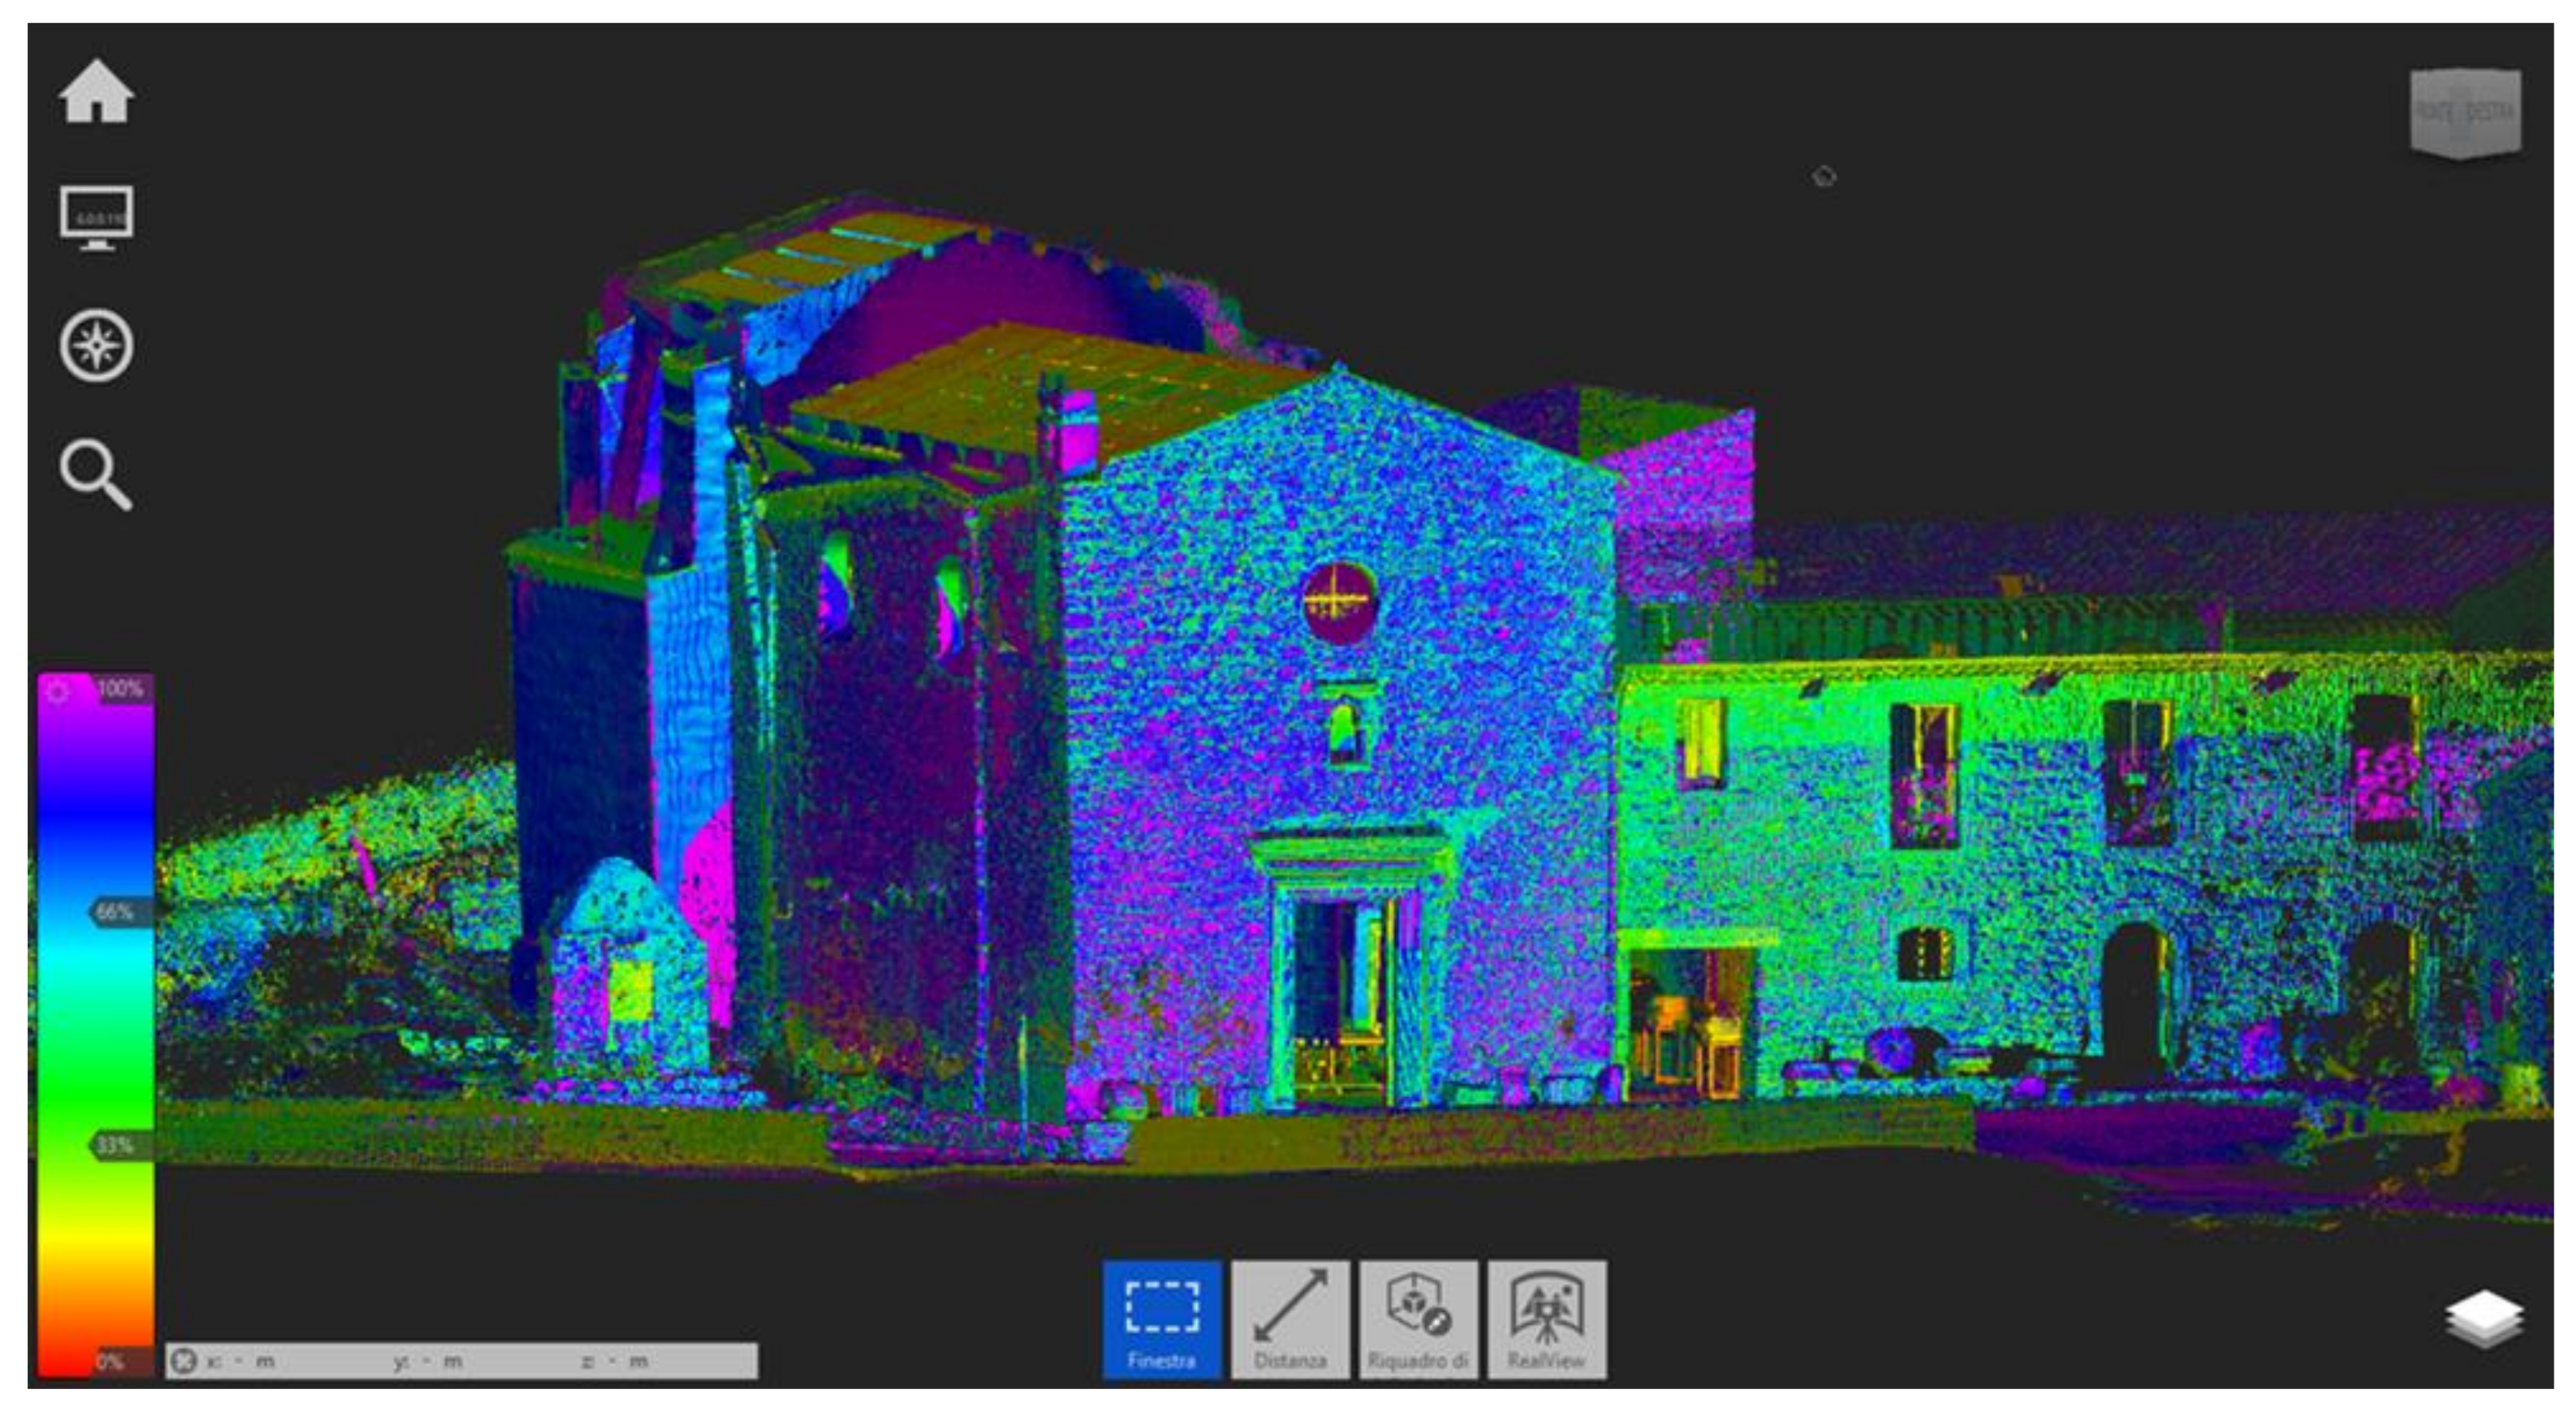
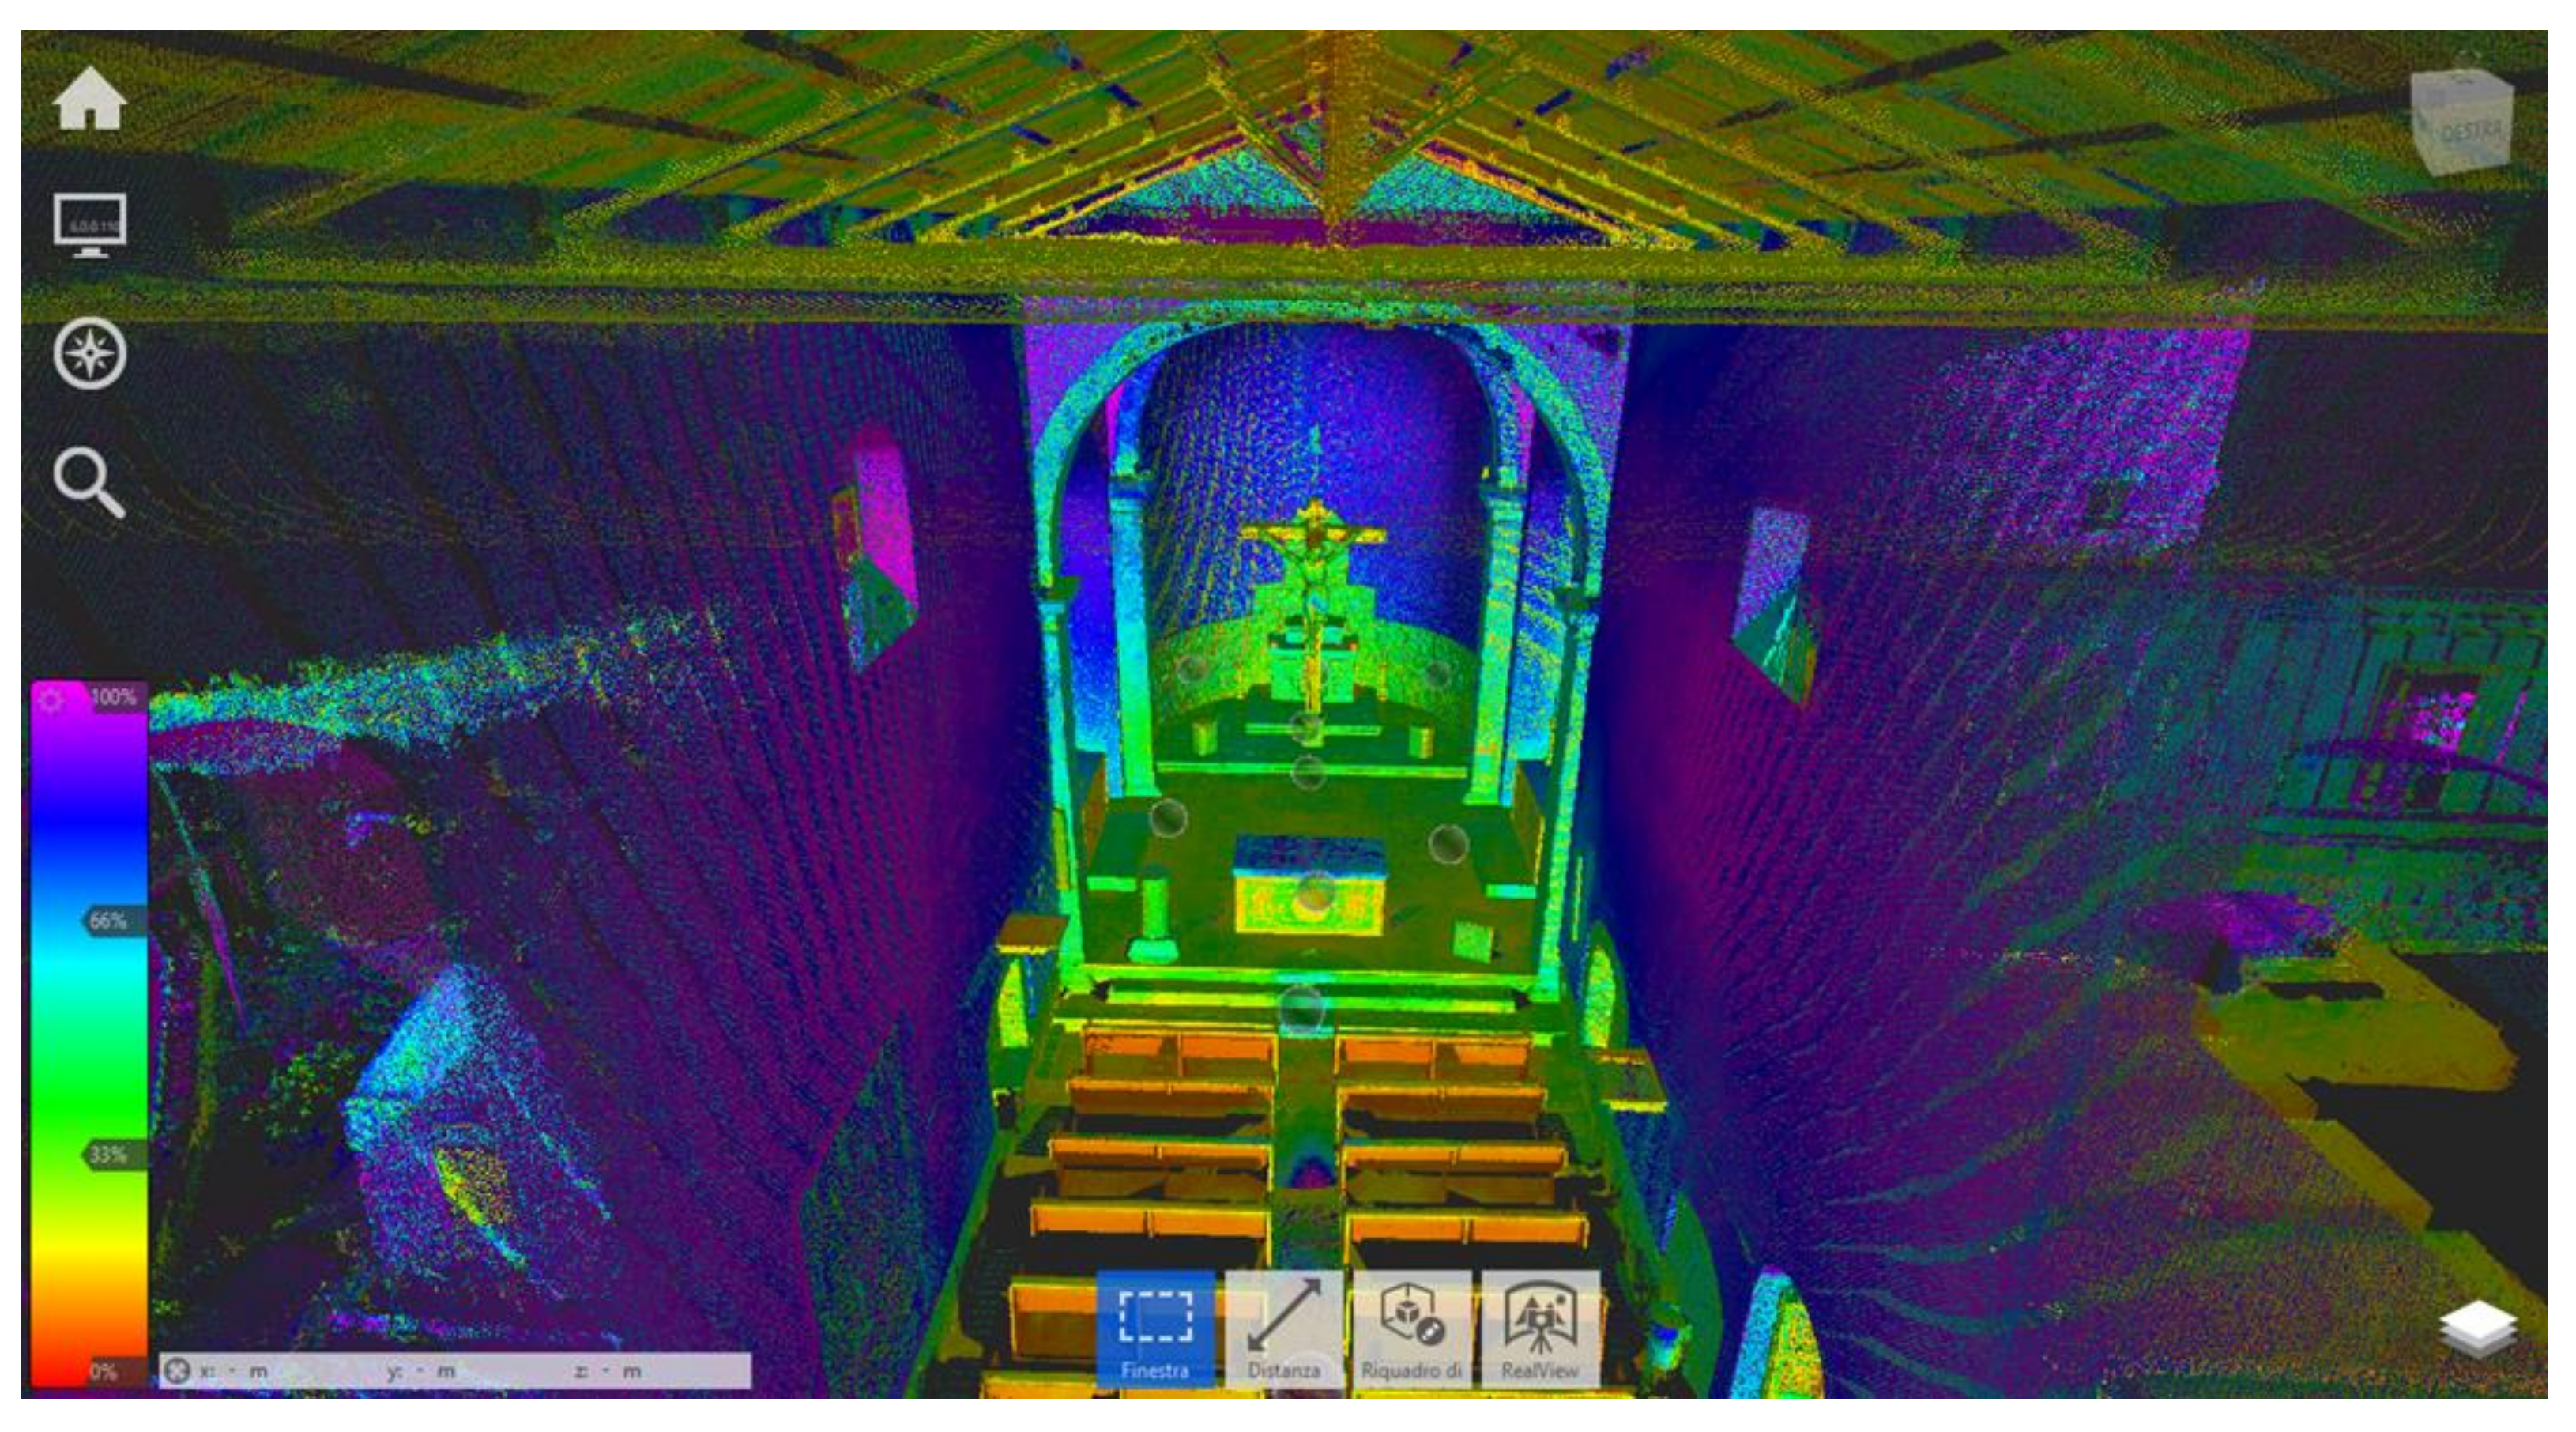
Another interesting output is the lidar intensity map of the building recorded by terrestrial laser scanning systems (
Figure 16 and
Figure 17): these data, a net of the multiple variables as distance and incidence angle, are considered significant measures of the spectral property of scanned objects, which can be used in in the field of degradation and damage detection. For this reason, TLS acquisitions are strongly recommended when restoration actions are needed.
The possibility of having a three-dimensional model available, searchable and implementable at any time, allows us to have a basis for any type of study or detailed analysis, not only concerning the structural or architectural aspects of the building, but also for any restoration and/or consolidation of the architectural and decorative elements.
5.2. Raman and XRF Spectra
All XRF spectra show the signals of calcium (Ca), iron (Fe), sulfur (S) and strontium (Sr). In detail, the calcium is imputable to the presence of calcite (CaCO
3) and/or gypsum (CaSO
4·2H
2O); strontium (Sr) in high quantities indicates the presence of the celestite (SrSO
4), a mineral usually found to be associated with gypsum; iron (Fe) is indicative of pigments of several kinds of iron oxides, ochres that are not expensive and reasonable for this kind of painting. The widespread presence of lead (Pb) in all the analyzed areas, in smaller quantities than calcium, is indicative of the presence of white lead (basic lead carbonate (PbCO
3)2·Pb (OH)
2). Raman spectroscopy proved very useful for red, yellow and blue pigments; the results are in accordance with XRF. In particular, confirm the presence of hematite pigment (414, 494 and 616 cm
−1), gypsum (CaSO
4·2H
2O) are at 597, 670, 1008, 1134, 1620, 3400 and 3530 cm
−1) and calcite (712 and 1086 cm
−1). For more details on XRF and Raman analysis, read reference [
31].
The IR spectra confirmed the presence of calcite and gypsum and showed the presence of calcium oxalate imputable to the biochemical activity of lichens, fungi, algae or bacteria [
43]. The presence of beeswax suggested a contamination by candles used in the church, as an unwanted deposit on the painting [
44,
45,
46]. The more relevant data are presented in our previous paper [
31], while here, we have discussed the results in function of the creation of an integrated platform that includes the church’s 3D model enriched with metadata.
6. Discussion
Some interesting elements have emerged from the wall painting XRF and Raman investigations. The first is that the calcite and gypsum are diffused in the whole pictorial surface. The gypsum could have been the result of a sulphation process [
47], which is an indication of the poorly conserved state of the painting. This result suggests the importance of periodic monitoring of conservation state, which is a basic requirement for the restorer to be able to define the correct restoration phase. Instead, the presence of white lead could be an indication that the technique used for the realization of the painting was “secco”. The pigments identified are mainly ochres; for the red and yellow (or beige), hematite and goethite were identified, respectively. The nature of black is still unknown. Blue pigment consists of lazurite pigment; instead, green is probably based on iron oxide. The white area shows typical bands of calcite, gypsum and celestite usually found associated with gypsum.
For what concerns the 3D survey, we have to point out that the 3D point cloud model can be considered to all intents and purposes a document of a temporally defined status quo, which preserves part of the authentic dimension of the reality from which it derives and allows a comparison with a previous status [
48]. The second interesting aspect is that the 3D point cloud model can be integrated with other data from different sensors. In fact, with a single automatic data acquisition in the field, the TLS system is able to simultaneously return both metric information and qualitative information concerning specific characteristics of the artifacts investigated, such as the reflectance of the surfaces or the color. Through the integration of a photographic sensor, for example, it is possible to automatically associate the three RGB values to each detected point for the unambiguous and precise determination of the color of the surface. With the same principle, it is virtually possible to integrate a sensor for thermographic investigations or one for hyperspectral imaging into the system, etc. The information deriving from the spectroscopic analyses has been used in order to create an informative virtual tour where users can interact with some point of interest in order to obtain information about a specific aspect (
Figure 18).
Three-dimensional survey methods, such as TLS, have proven to be useful for metric documentation and structural monitoring of the buildings as well for their enhancement. The technique is, in fact, suitable for both internal and external scenarios and the unwanted elements can be easily removed in the point cloud processing steps. Moreover, the advantages of the 3D digital models are well demonstrated from the variety and features of their outputs: e.g., meshed derived 2D products preserve the balance between geometry and appearance; the creation of orthoimages and DEM of the vertical and planar sections can support GIS mapping or further analysis. Regarding the integration in BIM environment, we have to take note that the use of this technology in the field of archaeology has not yet been fully investigated, even if especially in the last years, it is increasingly being used for the management and digitization of built heritage through HBIM (Historical Building Information Modeling) models [
49,
50,
51,
52]. Moreover, the 3D representation of irregular wall elements, ancient traces of structures corrupted by natural events or by non-careful safeguarding of the historical heritage, requires a high level of knowledge of the artefact. For this reason, H-BIM models should become more advantageous to archaeology as they offer access to geometric and archaeological information to a wider audience and high levels of interactivity with users [
53].
The further step is addressed to the creation of a multi-temporal 3D geospatial database, which could allow the storage, organization and accessibility to the radiometric and geometric information collected over the years.
7. Conclusions
The work carried out for the church of S. Maria delle Palate and its wall painting was very productive for the achievement of the initial goals: to show how specific actions of digitization, together with the use of new media, can contribute to valorizing ‘marginal’ cultural places, promoting their knowledge and inclusion. The methodology has included three main steps: a 3D survey of the whole building in order to obtain a digital copy and perform structural monitoring; diagnostic investigations (XRF, IR, Raman and thermography); development of an app/platform for multi-level use of data. The 3D survey answered the necessity of high-resolution documentation, made up of a detailed representation of the state of preservation of the evidence.
Beyond the visualization and monitoring purposes, the final 3D models will also be helpful to support the study of the pathologies and the degradation process of the buildings in combination with spectroscopy and periodic IR thermal analyses. The wall painting was, in fact, affected by ongoing degradation processes (the presence of gypsum has been attributed to a sulphation process, an indication of a bad state of preservation) and the detachment of the pictorial layers (recorded by the thermal camera), caused by the formation of air bubbles between the latter and the background. These pathological phenomena, if not fixed in due course, could cause the irreparable destruction of the artifact.
For this reason, a combined use of complementary techniques was useful to increase the knowledge of the artifact as well as to help its protection and raise its informative potential. Thanks to the TLS survey, it was possible to obtain a new updated plan of the church and a virtual tour for the enhancement of the religious building. This technology has proved to be the best solution in order to generate reliable geospatial information, whatever may be the purposes (e.g., research, preservation, outreach), and irrespective of the working platform (e.g., GIS/BIM, 3D analysis programs, 3D modeling programs).
In addition, the set of multi-temporal 2D and 3D models has offered the possibility to update the previous documentation, monitoring the level of conservation and stability of surfaces [
54]. The availability of a geometric survey of historic buildings is a valuable resource for management, as it allows future analyses of the building that require comparisons with the current state. It is therefore a dynamic informative model, updatable and integrable at different times in the life of the historical artifact.
The process analyzed in this work is absolutely applicable to other case studies, as the rules or strategies indicated are well suited to most of the existing buildings in the existing built landscape.
In conclusion, this study has provided an interesting contribution to the knowledge of the church and its wall painting, which had never been studied before.
As the site is placed at the margins of the usual tourist circuits, the case study can represent a benchmark to put a value on the benefit and impact of digitization intervention in attracting tourists and local people. In this regard, a sort of interactive museum powered by virtual tour and augmented reality, available both via web browser and smartphone, is under development; this will help in making the site more accessible and inclusive during unordinary events (e.g., maintenance works, pandemic emergency) and other particular situations.


 ,
, 
