Technical Note

Variability of Longshore Surface Current on the Shelf Edge and Continental Slope off the West Coast of Canada

1
Fisheries and Oceans Canada, Institute of Ocean Sciences, Sidney, BC V8L 4B2, Canada
2
Fisheries and Oceans Canada, Northwest Atlantic Fisheries Centre, St. John’s, NL A1C 5X1, Canada
*
Author to whom correspondence should be addressed.
Remote Sens. 2022, 14(6), 1407; https://doi.org/10.3390/rs14061407
Submission received: 7 February 2022 / Revised: 6 March 2022 / Accepted: 9 March 2022 / Published: 15 March 2022

Abstract

:
The shelf-edge and continental slope current off the west coast of Canada has been monitored at a site off West Vancouver Island since 1985. However, observations at this site may not represent the characteristics of the shelf-edge and slope current off the entire west coast of Canada. Here, we use along-track satellite altimetry data over six transects to investigate the characteristics of the surface geostrophic currents over the shelf edge and continental slope off the west coast of Canada from 1992 to 2020. It is shown that along-track satellite altimetry is well suited for monitoring longshore and climatic variations of the near-surface shelf-edge and slope currents off the west coast of Canada. It is found that the surface current over the shelf edge and slope has different features from the south to the north. While the surface current is poleward in winter and equatorward in summer off South Vancouver Island, it is poleward year-round off the rest of the west coast of Canada. The seasonal current anomalies show longshore correlation significant at the 95% confidence level, except at the North Haida Gwaii transect. The first empirical orthogonal function mode of the seasonal current anomalies is correlated with the longshore wind anomalies both off South Vancouver Island and off Oregon. However, this first mode is not correlated with either the Niño 3.4 index or the Pacific Decadal Oscillation index, though they often show large episodic events during strong El Niño and La Niña years. Consistent with previous findings, the present study indicates that the surface currents over the shelf edge and continental slope off the west coast of Canada are related to regional and remote longshore wind forcing.

1. Introduction

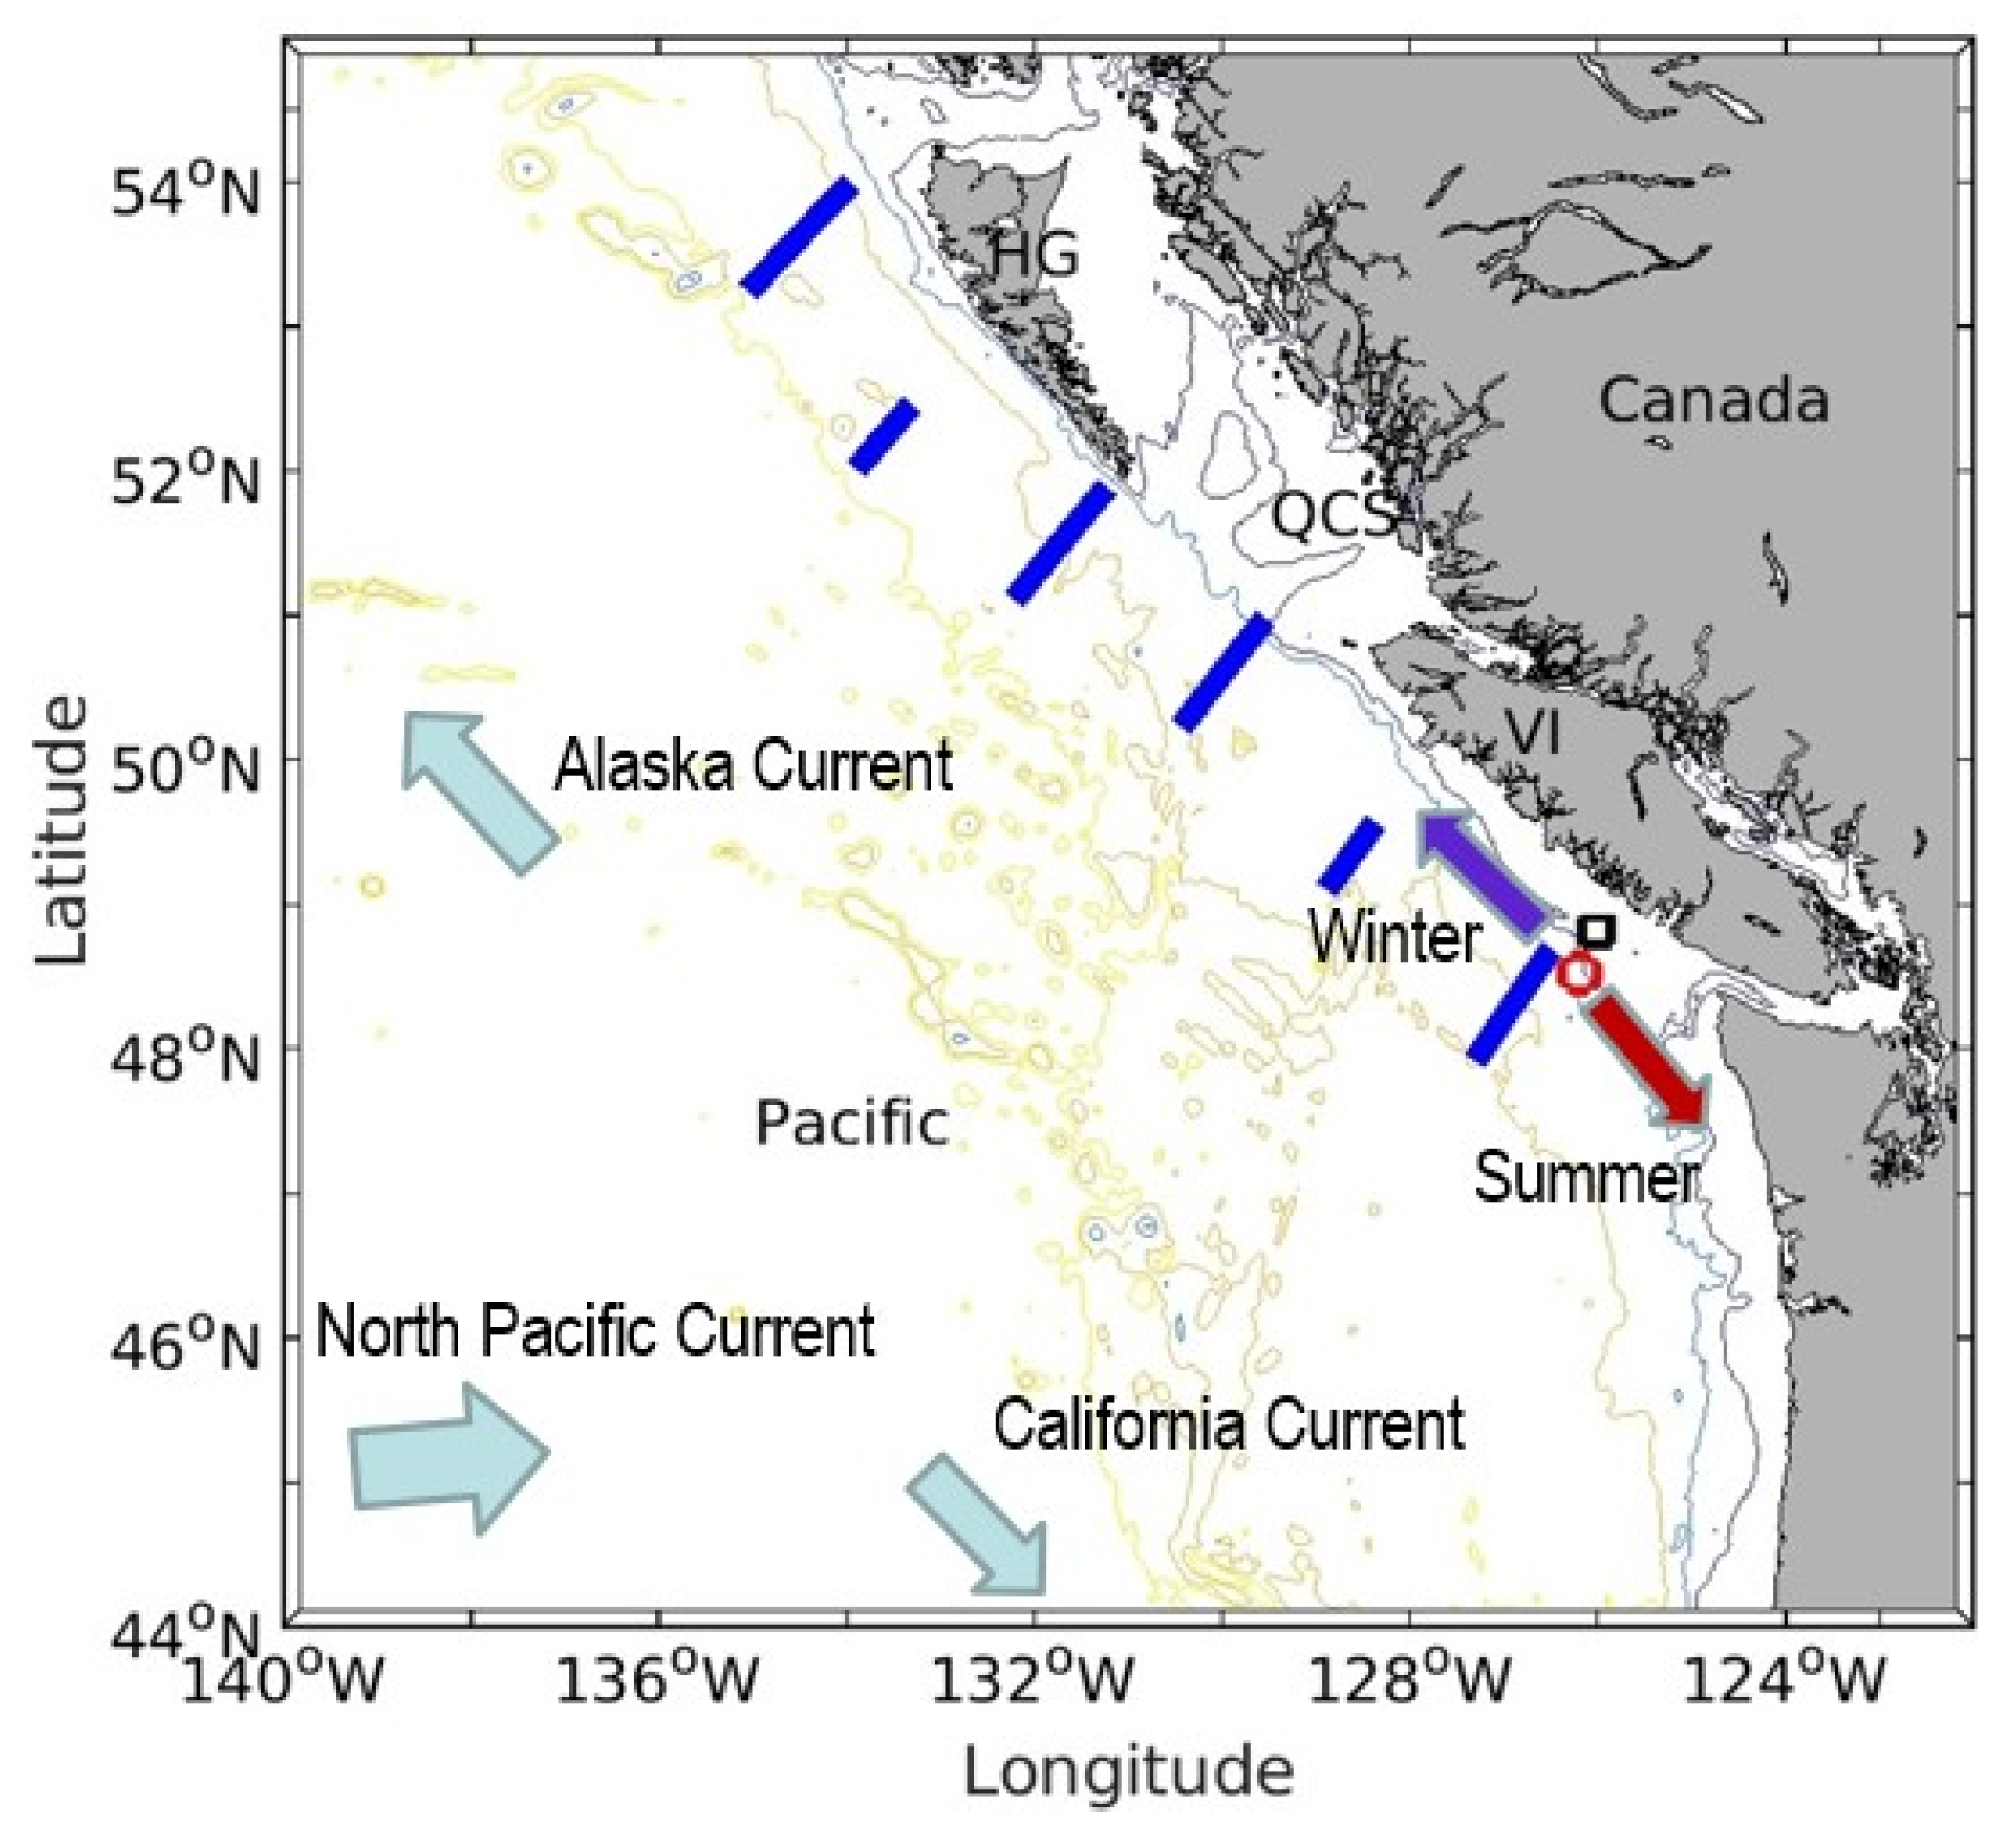
The shelf edge and continental slope off the west coast of Canada are located in the confluence zone of the subpolar gyre and subtropical gyre of the North Pacific. The mid-latitude eastward North Pacific Current bifurcates offshore of the shelf edge to form the equatorward California Current and the poleward Alaska Current (Figure 1). Off South Vancouver Island, the flow on the shelf edge and continental slope is poleward in winter, and becomes equatorward in summer due to upwelling favorable winds [1].
Moored measurements at a long-term (~30 years) monitoring site A1 off West Vancouver Island (Figure 1) show that the near-surface current on the shelf edge has strong interannual variability, with intensified summer equatorward currents during major El Niño events [2]. The moored measurements also indicate a complex vertical structure of the shelf-edge current. However, there are no long-term current data available for the central and northern shelf edges and continental slopes.
Numerical models (e.g., [3]) show that the seasonal reversal of the shelf edge current can be attributed to both regional and remote forcing. They also indicate that the interannual variability of the shelf edge current may be significantly influenced by remote forcing and regional wind patterns, but not much by river runoff.
Gridded satellite altimetry data have been used to study Haida eddies off the west coast of Canada [4]. Nevertheless, along-track altimetry with high spatial resolution has not been used to study the current on the shelf edge and continental slope. In fact, ascending ground tracks of TOPEX/Jason satellites are approximately perpendicular to the shelf-edge and slope current. Therefore, geostrophic currents calculated from along-track sea surface height can well represent surface currents along the shelf edge and continental slope.
In this study, we investigate the near-surface geostrophic current on the shelf edge and continental slope off the west coast of Canada (extended from South Vancouver Island to North Haida Gwaii) using the TOPEX/Jason satellite altimetry data from 1992 to 2020. The main objectives are to demonstrate the feasibility of using satellite altimetry to monitor shelf-edge near-surface currents off the west coast of Canada and to improve our knowledge of alongshore variations of the near-surface geostrophic currents.

2. Materials and Methods

2.1. Satellite Altimetry Data

We use standard 1 Hz along-track altimetric sea surface height data from TOPEX/Poseidon, Jason-1, Jason-2, and Jason-3 (Figure 1). The satellites have an exact repeat cycle of 9.9156 days. The along-track resolution is about 6 km. The altimetric data have a typical root-mean-square error of 2–3 cm [5].
The altimetric sea surface height data are corrected for atmospheric and oceanographic effects by choosing default options in the Radar Altimeter Data System (RADS) database (https://www.star.nesdis.noaa.gov/socd/lsa/RADS.php, accessed 1 March 2022). The altimetric sea surface heights are calculated relative to the European Improved Gravity model of the Earth by New techniques (EIGEN) version 6 geoid height.
Geostrophic surface currents are calculated using 10-day along-track satellite altimetry sea surface height data from October 1992 to December 2020. Six satellite track segments (hereafter called transects) are selected (Figure 1). Typically, these transects are 107 km wide, with two of them 67 km wide due to missing data on the inshore end. The geostrophic surface currents are in the direction normal to the transect (positive poleward) and approximately represent the longshore flow. The calculated geostrophic surface currents are further averaged both seasonally in winter (January–March), spring (April–June), summer (July–September), and fall (October–December) and over-transect. The climatological seasonal cycle is then calculated by averaging seasonal means over the study period for winter, spring, summer, and fall, respectively. Finally, seasonal surface current anomalies are calculated as the differences between the seasonal means and the climatological seasonal cycle.
The error of seasonal surface current anomalies from altimetric measurements is estimated by modifying the method in [6]. A single measurement for the time-varying component of sea surface height has a root-mean-square error of up to 3 cm [5]. Only the sea surface height error at the two end points of a transect affects the error in the calculated geostrophic currents. By assuming these two sea surface height errors are uncorrelated, we can estimate the total error as their root-sum-square, which is 3 multiplied by the square root of 2, i.e., 4.2 cm. Therefore, the sea surface height error translates to a root-sum-square error of 0.042 g/f/d in the calculated geostrophic current anomalies, where d is the transect width, g is the gravitational acceleration, and f is the Coriolis parameter. The error for the seasonal mean current anomalies is then 0.042 g/f/d/n0.5, where n = 9 is the number of cycles in a season. For example, the estimated errors are 4.2 cm/s for a single cycle and 1.4 cm/s for the seasonal current anomalies for the 107 km transects. The corresponding errors are 5.5 cm/s and 1.8 cm/s for the 67 km transects, respectively.

2.2. Surface Wind Data

We use six-hourly surface wind fields from the National Centers for Environmental Prediction (NCEP) Reanalysis 1 (https://psl.noaa.gov/data/gridded/data.ncep.reanalysis.html, accessed 1 March 2022). We also use buoy wind data at 48°50.1′ N and 125°59.9′ W off South Vancouver Island (Figure 1) from Environmental and Climate Change Canada and Fisheries and Oceans Canada (https://www.meds-sdmm.dfo-mpo.gc.ca/isdm-gdsi/waves-vagues/data-donnees/index-eng.asp, accessed 1 March 2022), as well as at 44°40′8″ N and 124°32′46″ W off Oregon from the National Data Buoy Center and the National Oceanic and Atmospheric Administration (NOAA) (https://www.ndbc.noaa.gov/station_page.php?station=46050, accessed 1 March 2022).

2.3. Pacific Decadal Oscillation (PDO) and Niño 3.4 Indices

We use the monthly PDO indices from the National Center for Environmental Information, NOAA (https://www.ncdc.noaa.gov/teleconnections/pdo/, accessed 1 March 2022). We also use the Niño 3.4 index from the National Weather Service, NOAA (https://origin.cpc.ncep.noaa.gov/products/analysis_monitoring/ensostuff/ONI_v5.php, accessed 1 March 2022).

2.4. Current Meter Data

To evaluate the altimetric currents, we use current meter data at 35 m below surface at mooring A1 from 1993 to 2020. The mooring is located at the shelf break, with water depth ~500 m. The current meter data were collected by the Institute of Ocean Sciences, Fisheries and Oceans Canada. The mooring location is closest to the South Vancouver Island transect. Therefore, the flow component perpendicular to the South Vancouver Island transect is derived from the current meter data and compared with the altimetric surface current.

2.5. Statistical Significance of Correlation

The effective number of degrees of freedom that takes into account auto-correlation is used in determining the statistical significance of the correlation coefficient between two variables. If R1 and R2, the lag-1 autoregressive auto-correlation coefficients of the two variables, respectively, are statistically different from zero at the 95% confidence level, then the effective number of degrees of freedom Ne = N(1 − R1R2)/(1 + R1R2), where N is the number of data [7].

3. Results

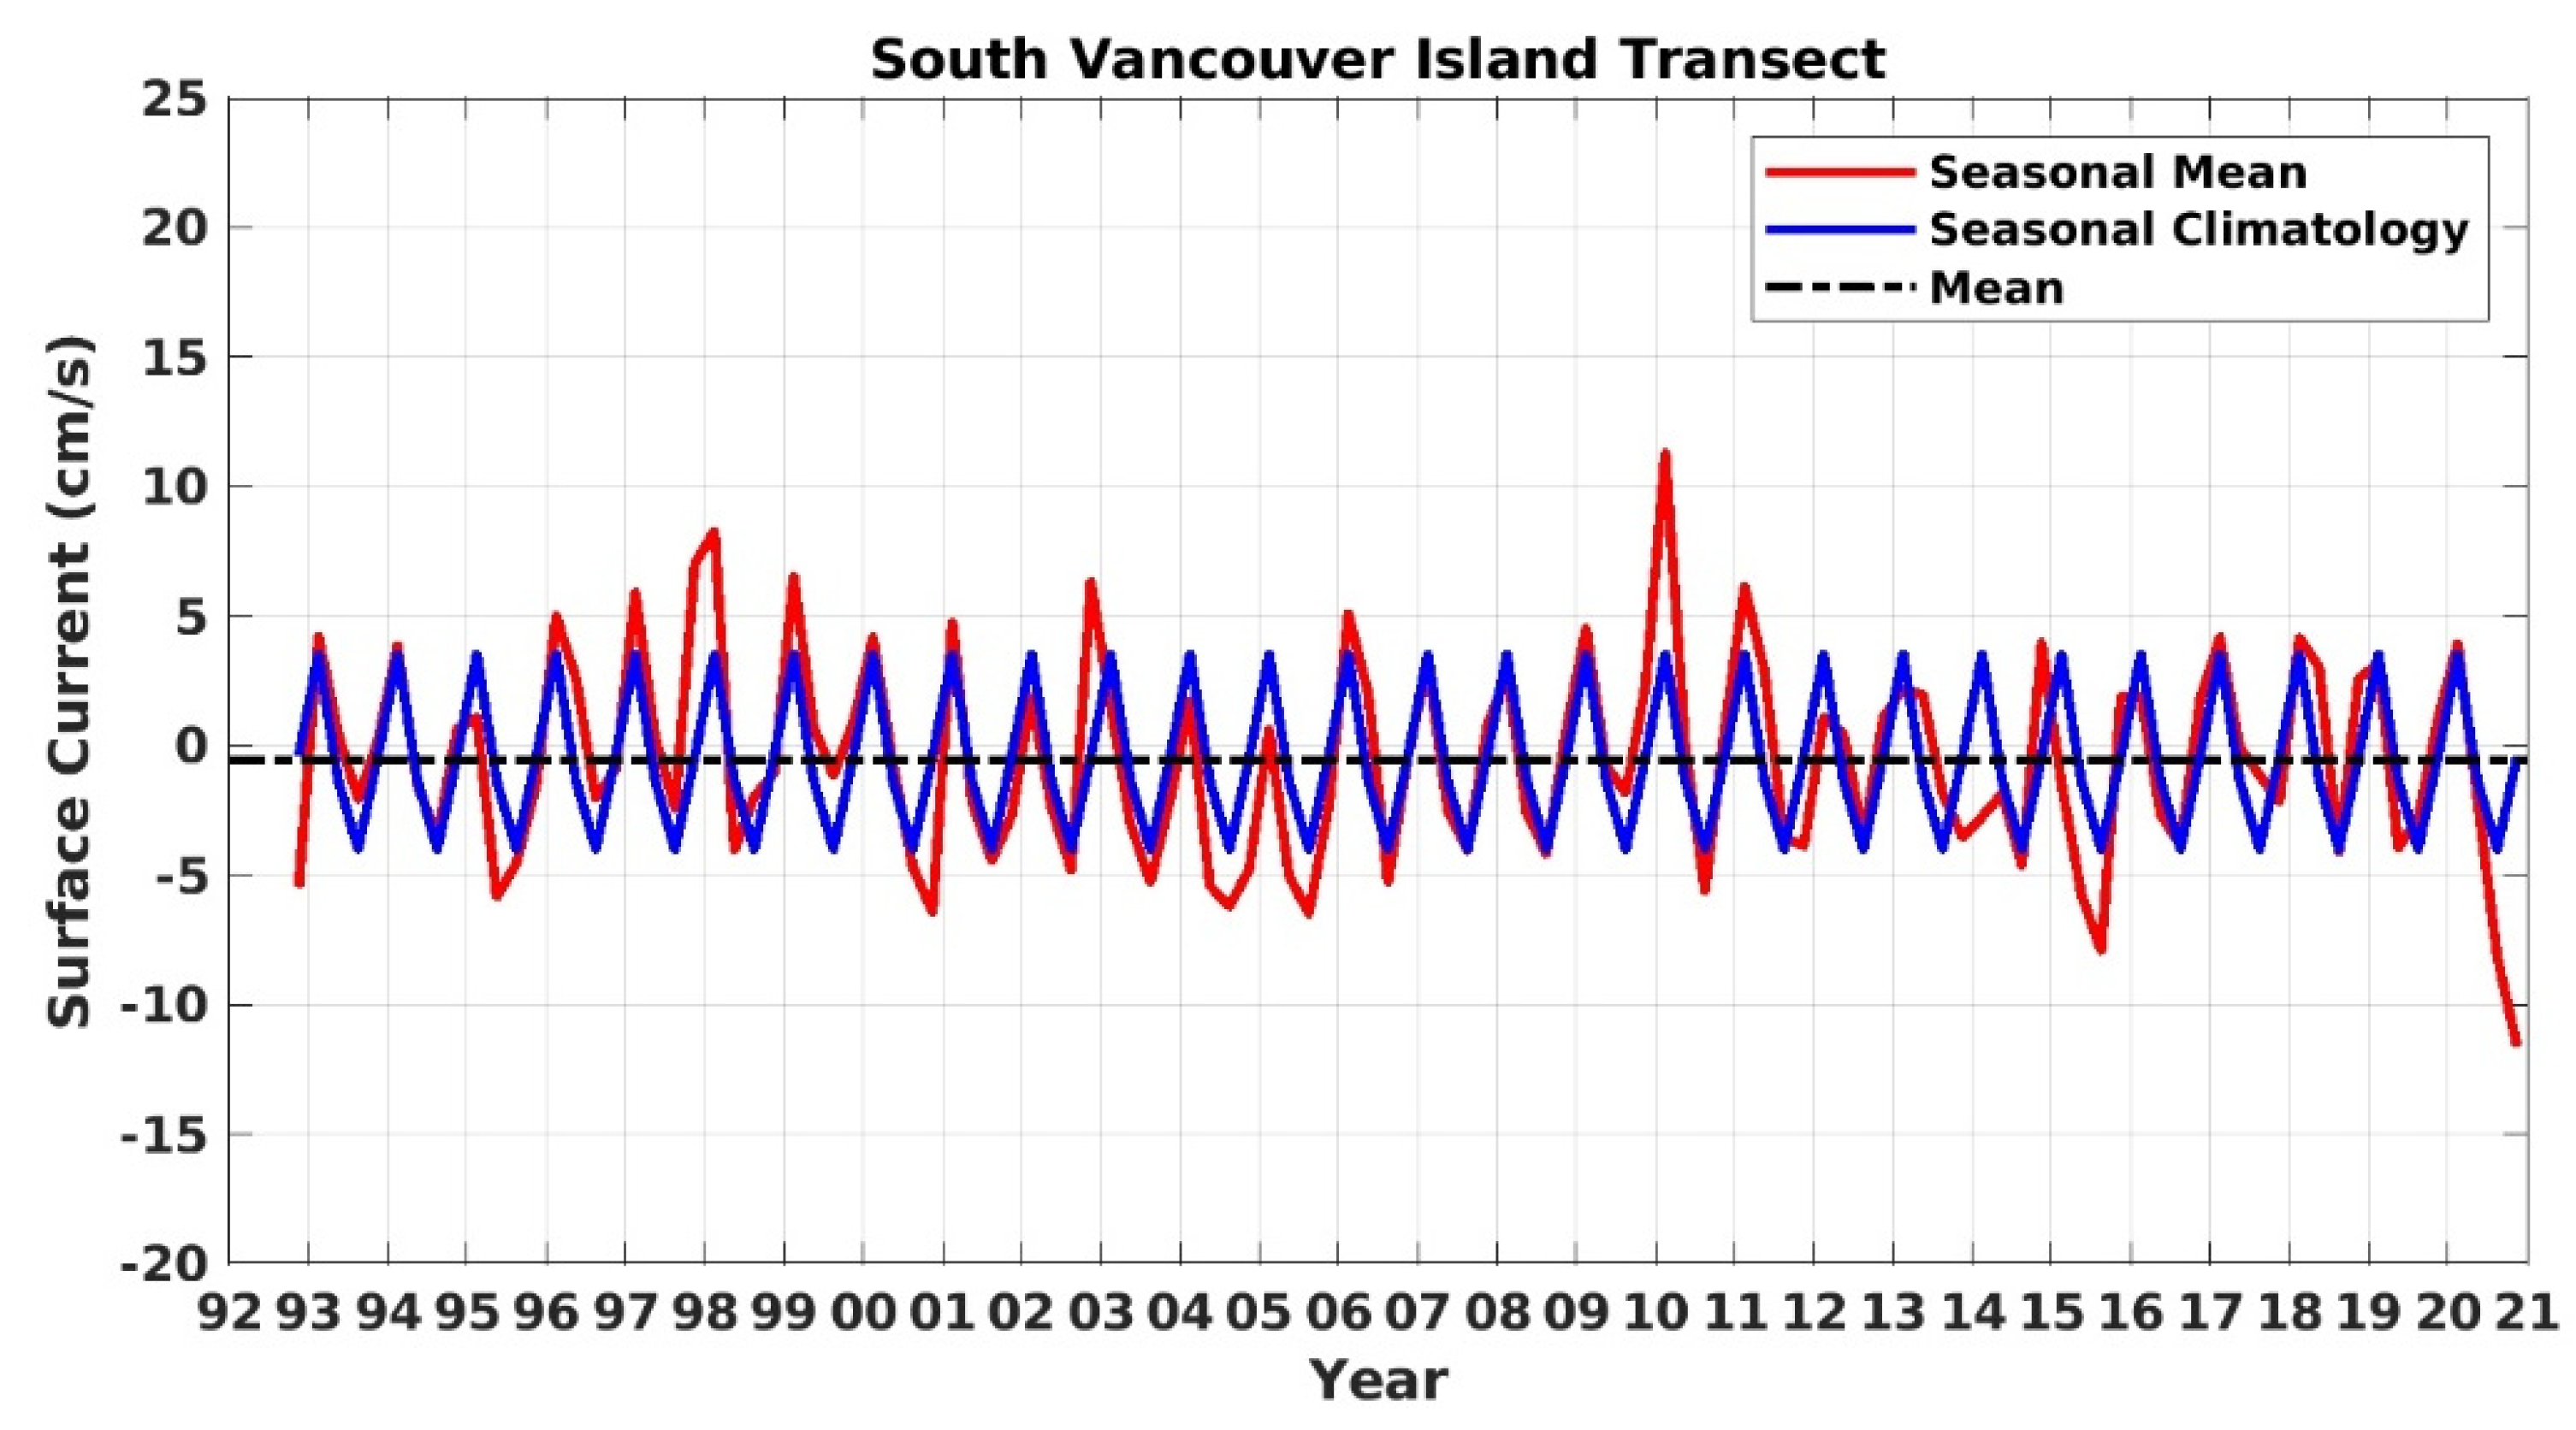
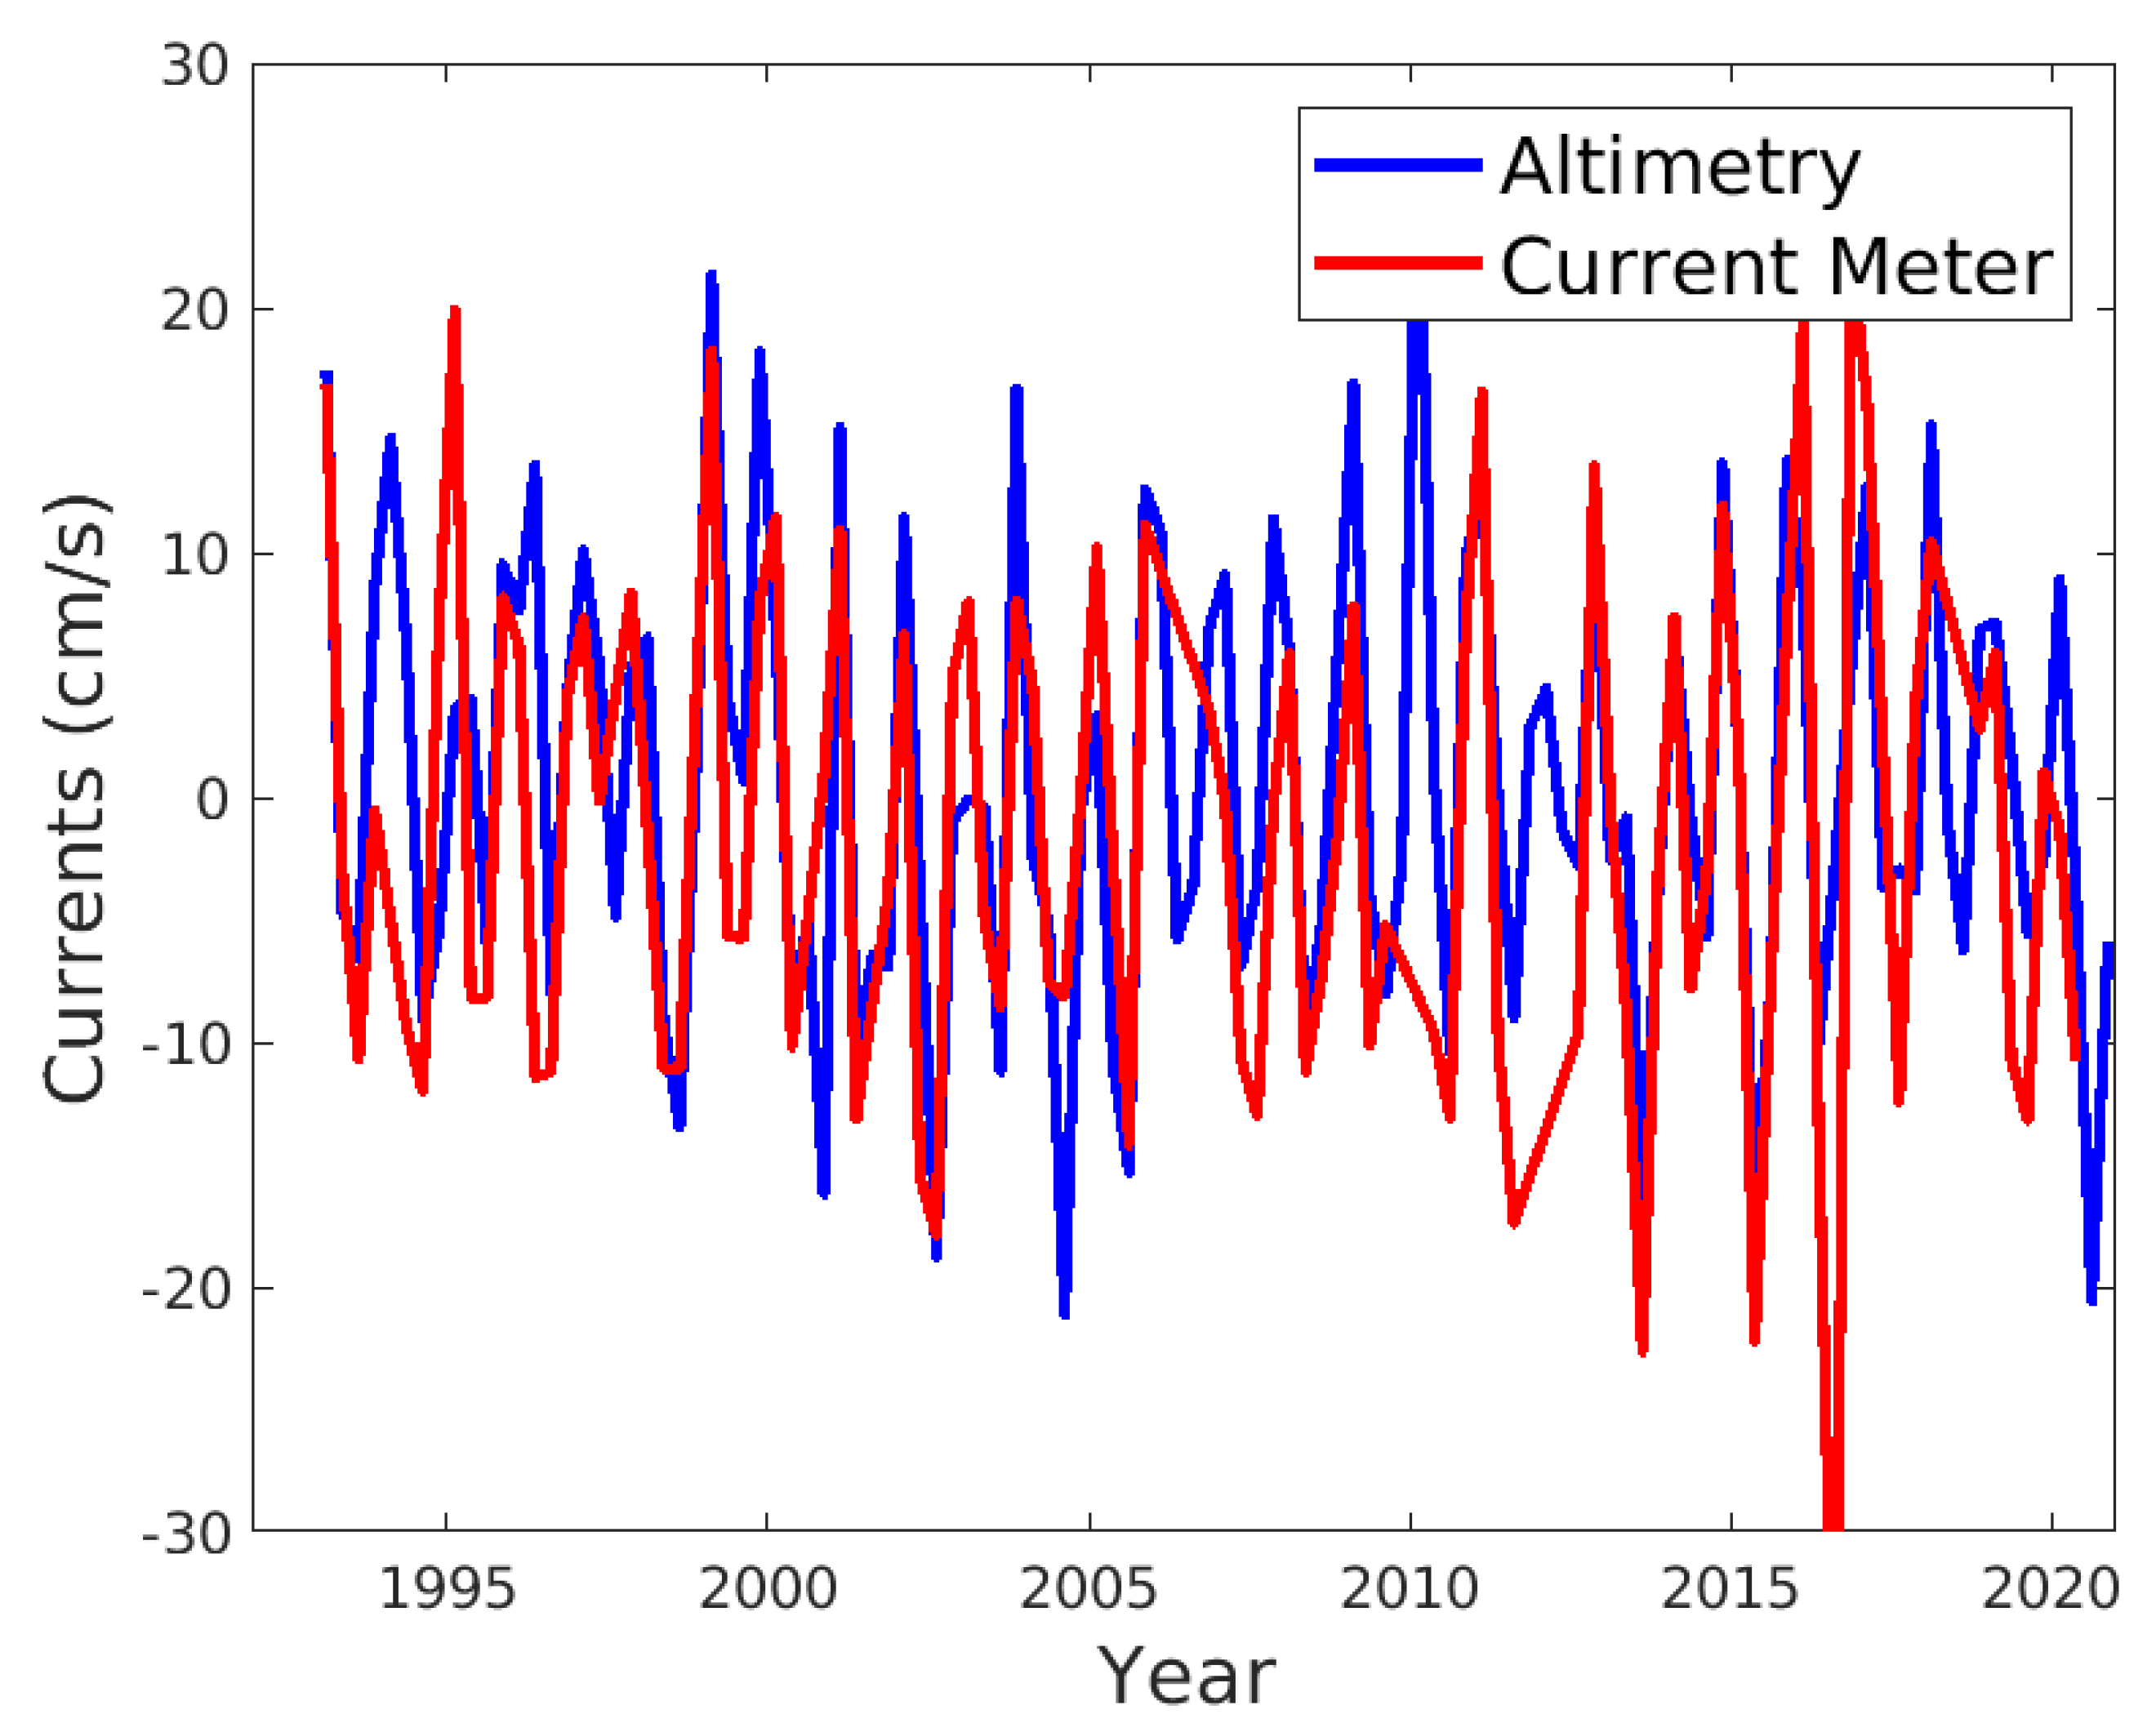
We begin with the evaluation of altimetry-derived surface geostrophic currents against current meter data. To do so, we derive the altimetric currents over a 25 km segment on the shelf-break side of the South Vancouver Island transect. The altimetric currents are compared with the 35 m current meter data at A1 (Figure 2). It is necessary to use the 25 km shelf-break segment so that the altimetric currents represent the shelf-break current like the current meter data. The correlation coefficient between the altimetric currents and current meter data is 0.6, significant at the 99% confidence level. We also look at the ratio of the squared sum of the difference in longshore currents between altimetry and current meter data to the mean squared sum of the longshore currents from current meter data. There is complete agreement if the ratio is 0. The smaller the ratio, the better the agreement is. The ratio is calculated to be 0.76, indicating fair quantitative agreement. Therefore, the two metrics indicate that altimetric currents are reasonably good at representing seasonal and interannual changes in longshore currents.
At the South Vancouver Island transect, the winter surface current is poleward, and the summer surface current is equatorward, with the long-term mean surface current close to zero (Figure 3). The seasonal cycle has a range of 8 cm/s. In contrast, there is a mean poleward flow of about 15 cm/s at the North Vancouver Island transect (
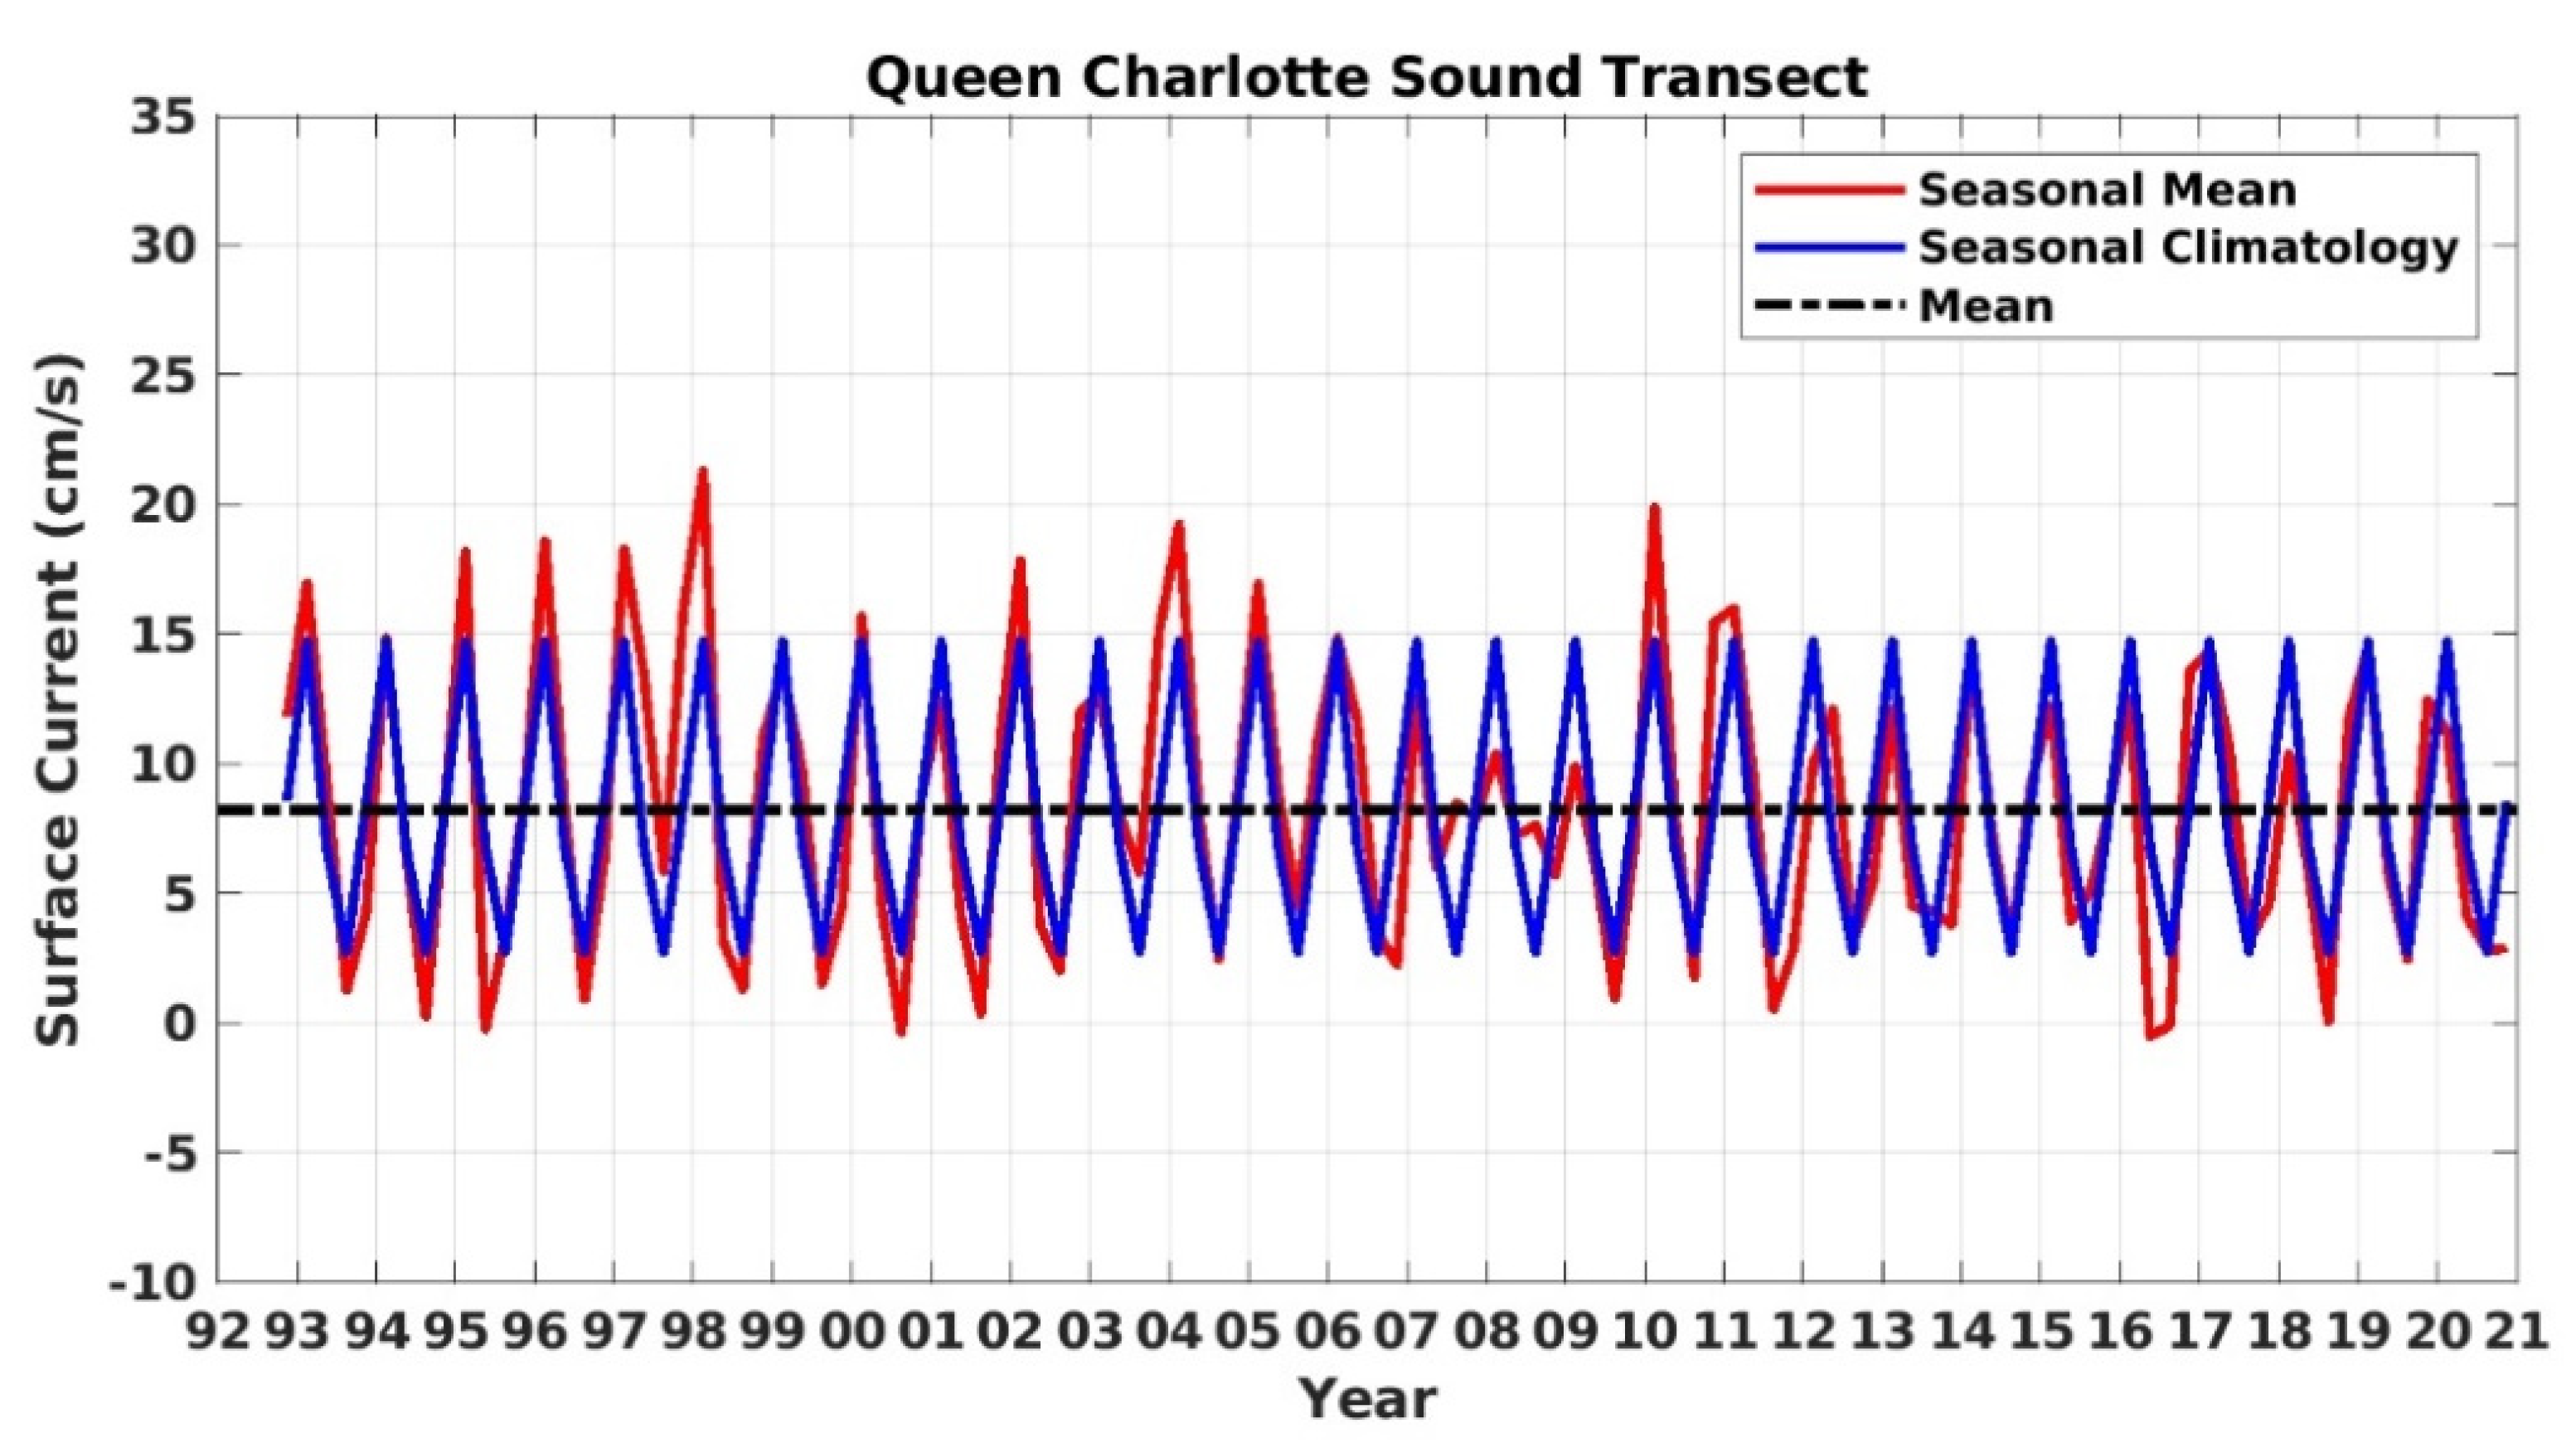
Figure 4). The seasonal cycle has a range of 5 cm/s. The mean flow and seasonal cycle at the Queen Charlotte Sound transect (
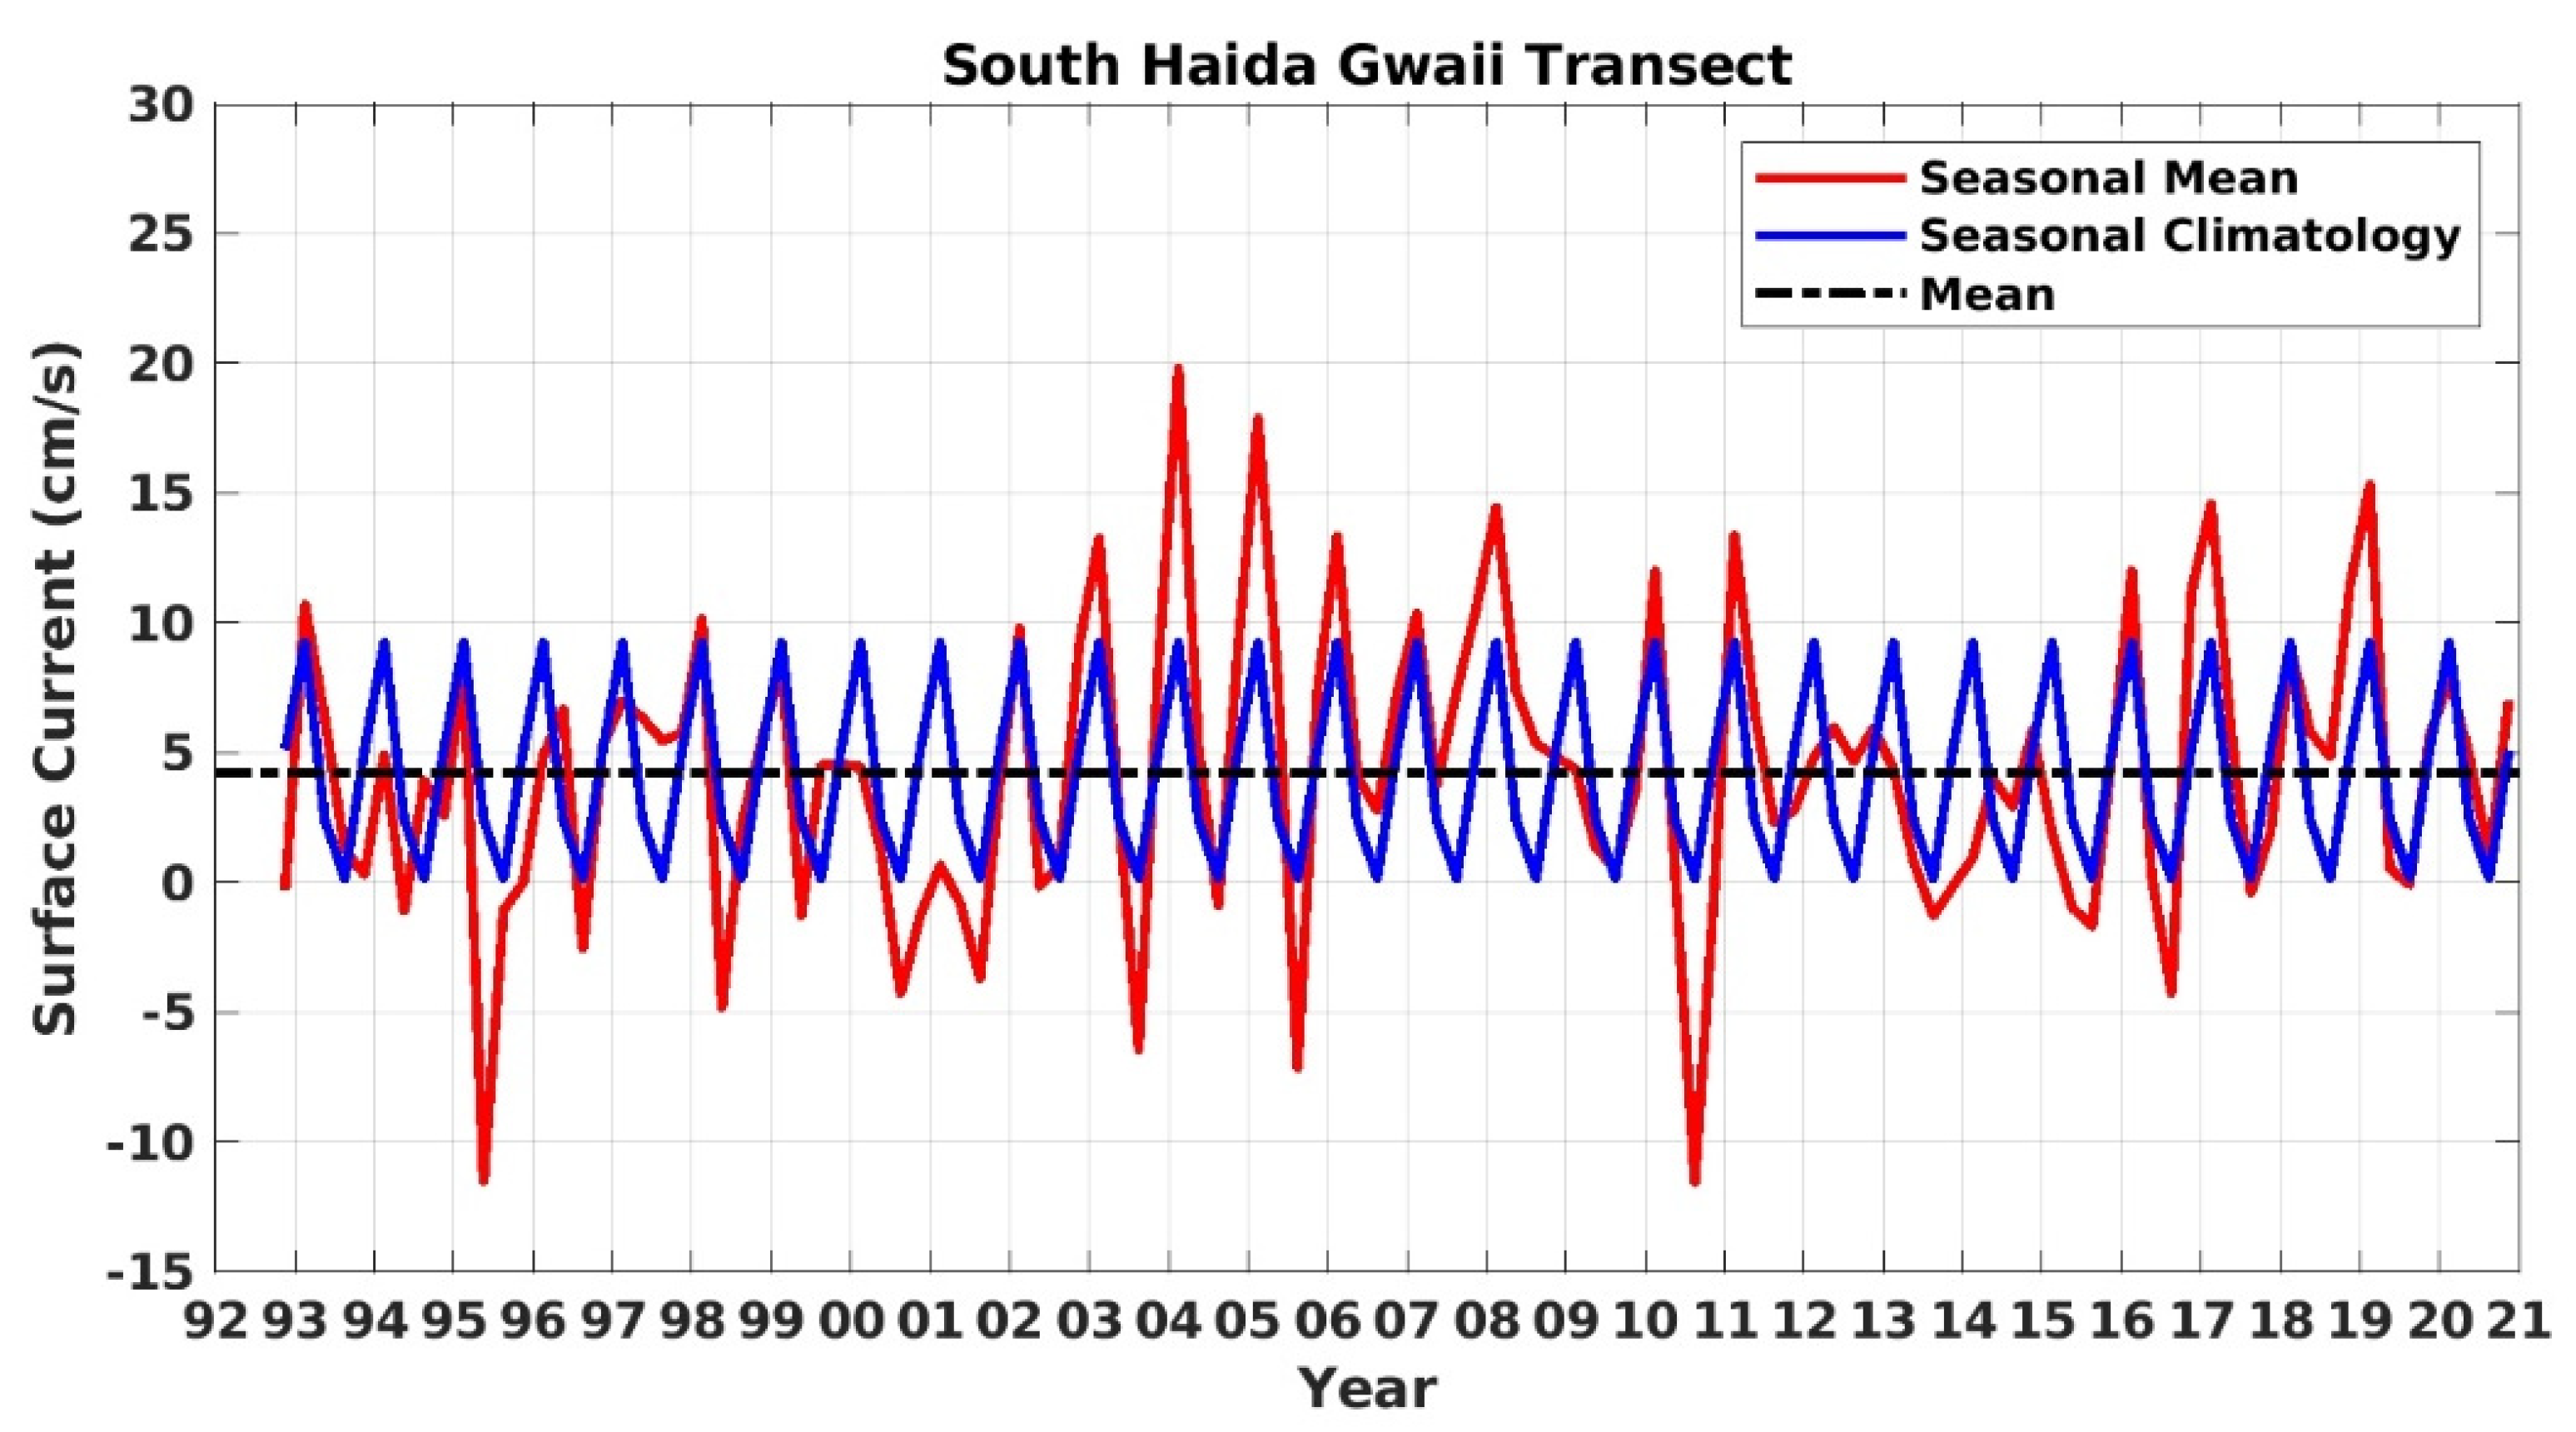
Figure 5), the South Haida Gwaii transect (
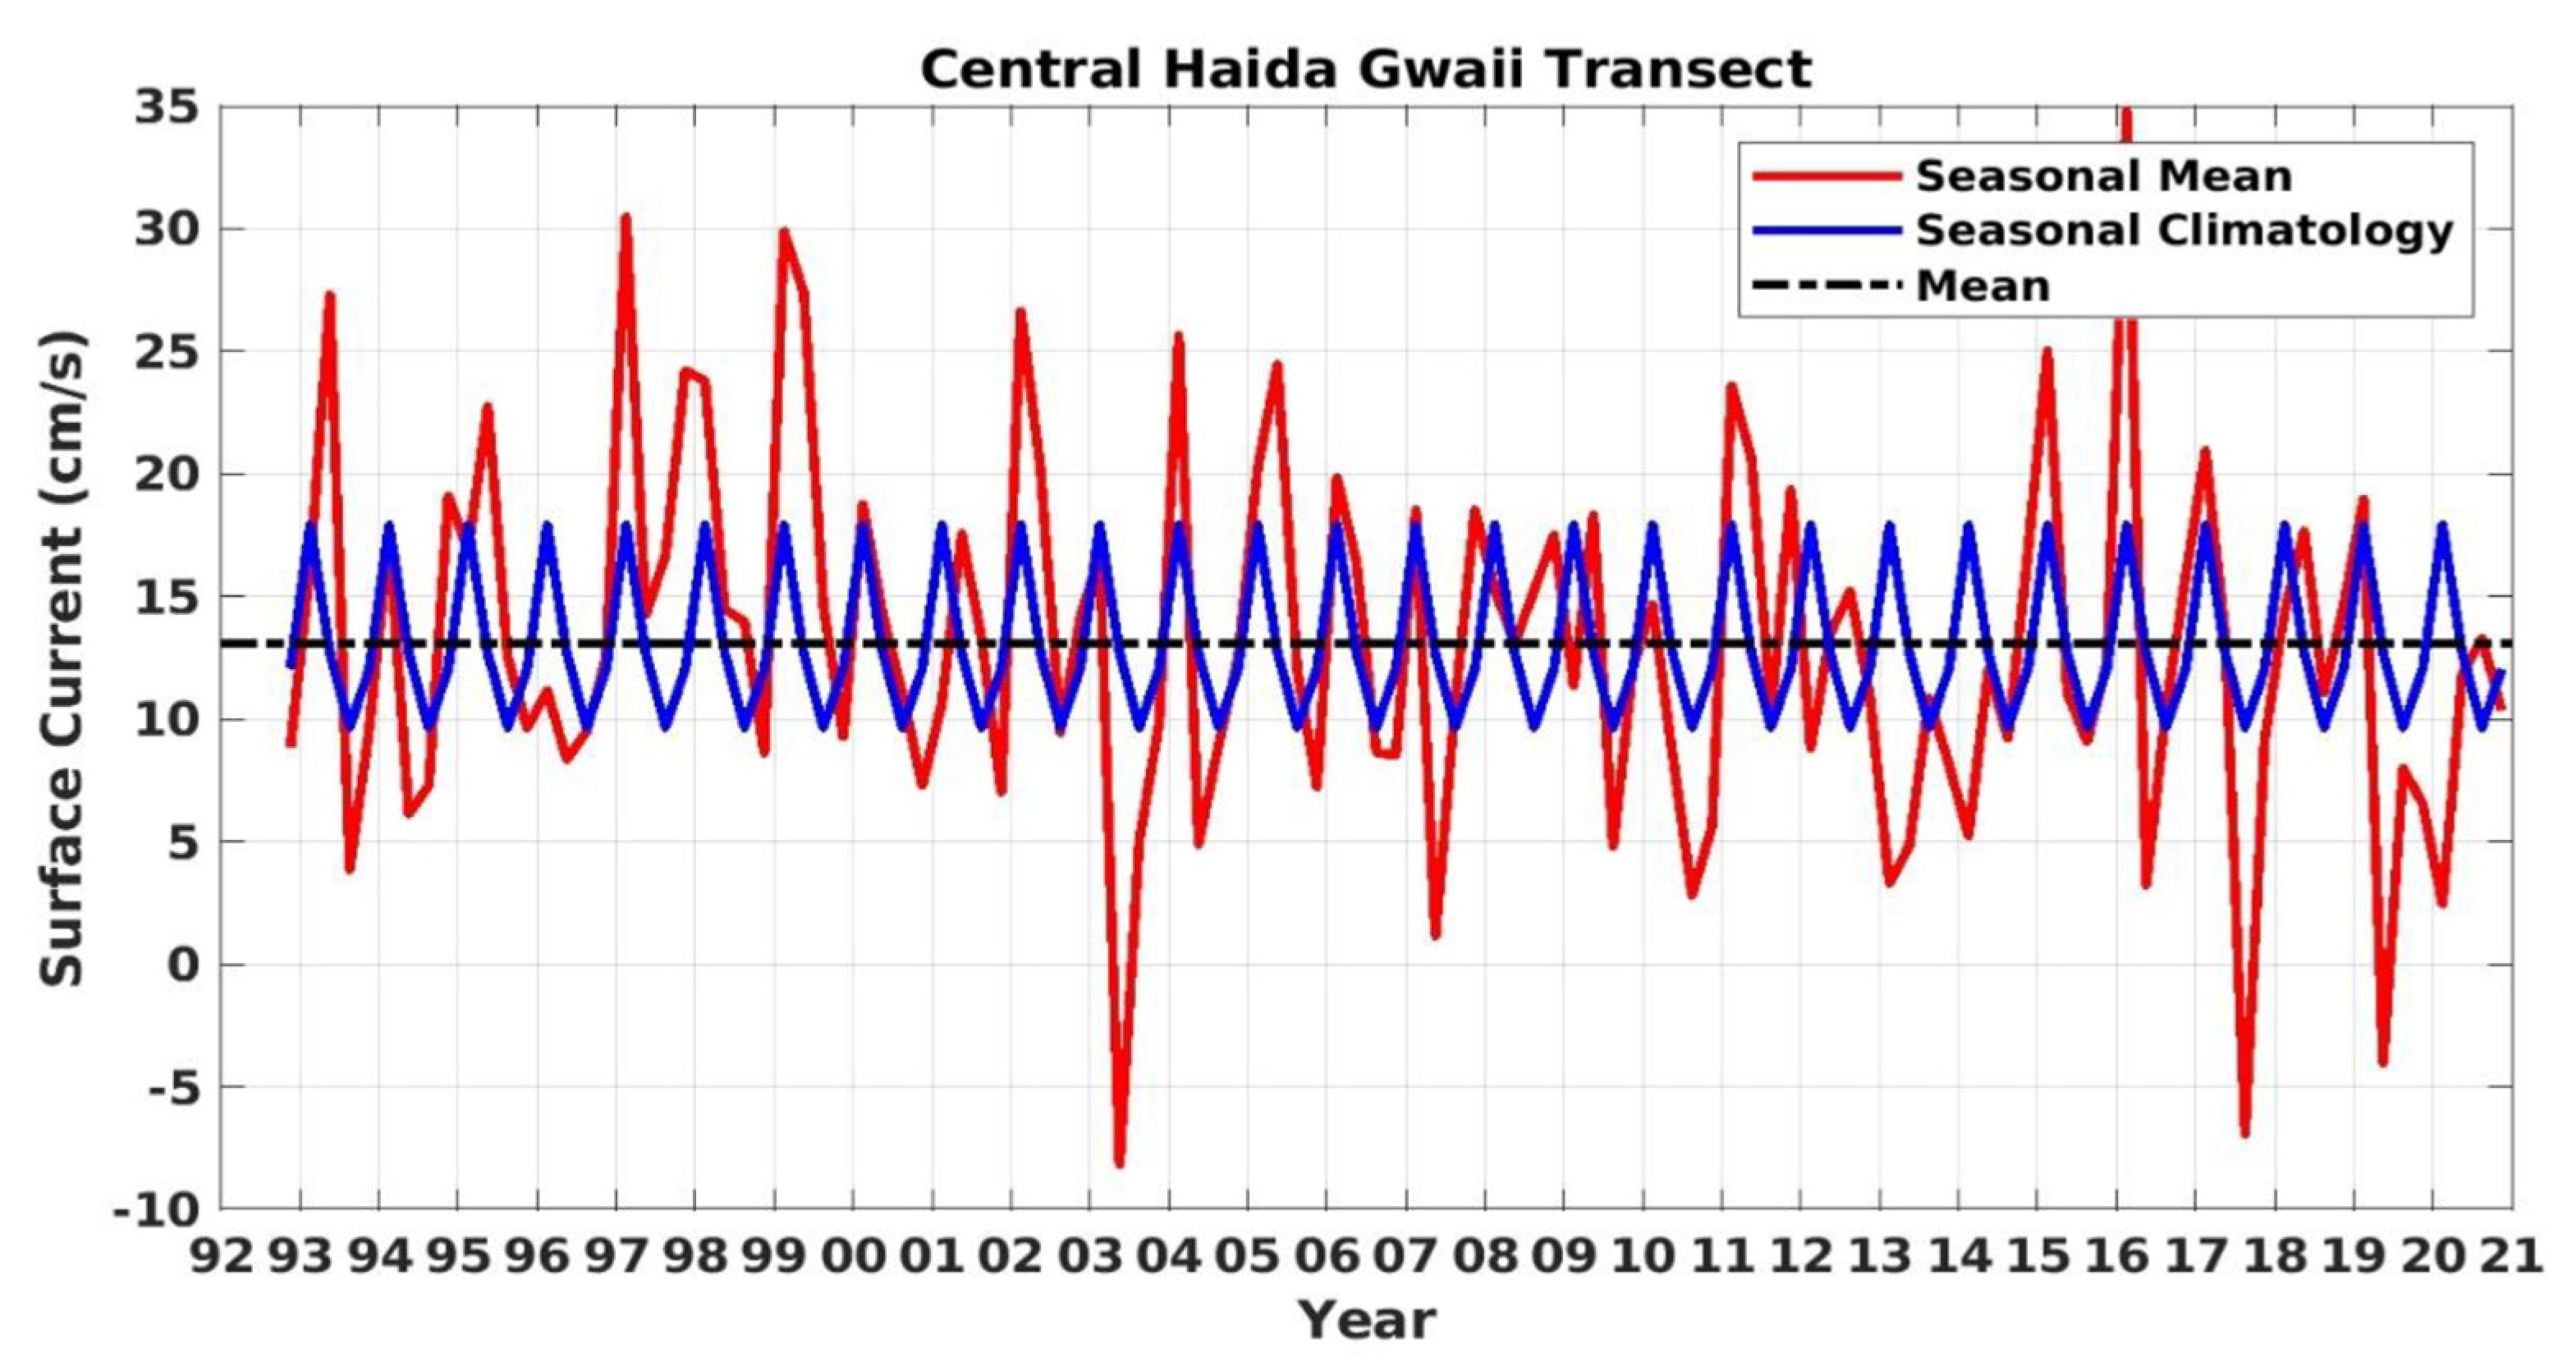
Figure 6), and the Central Haida Gwaii transect (
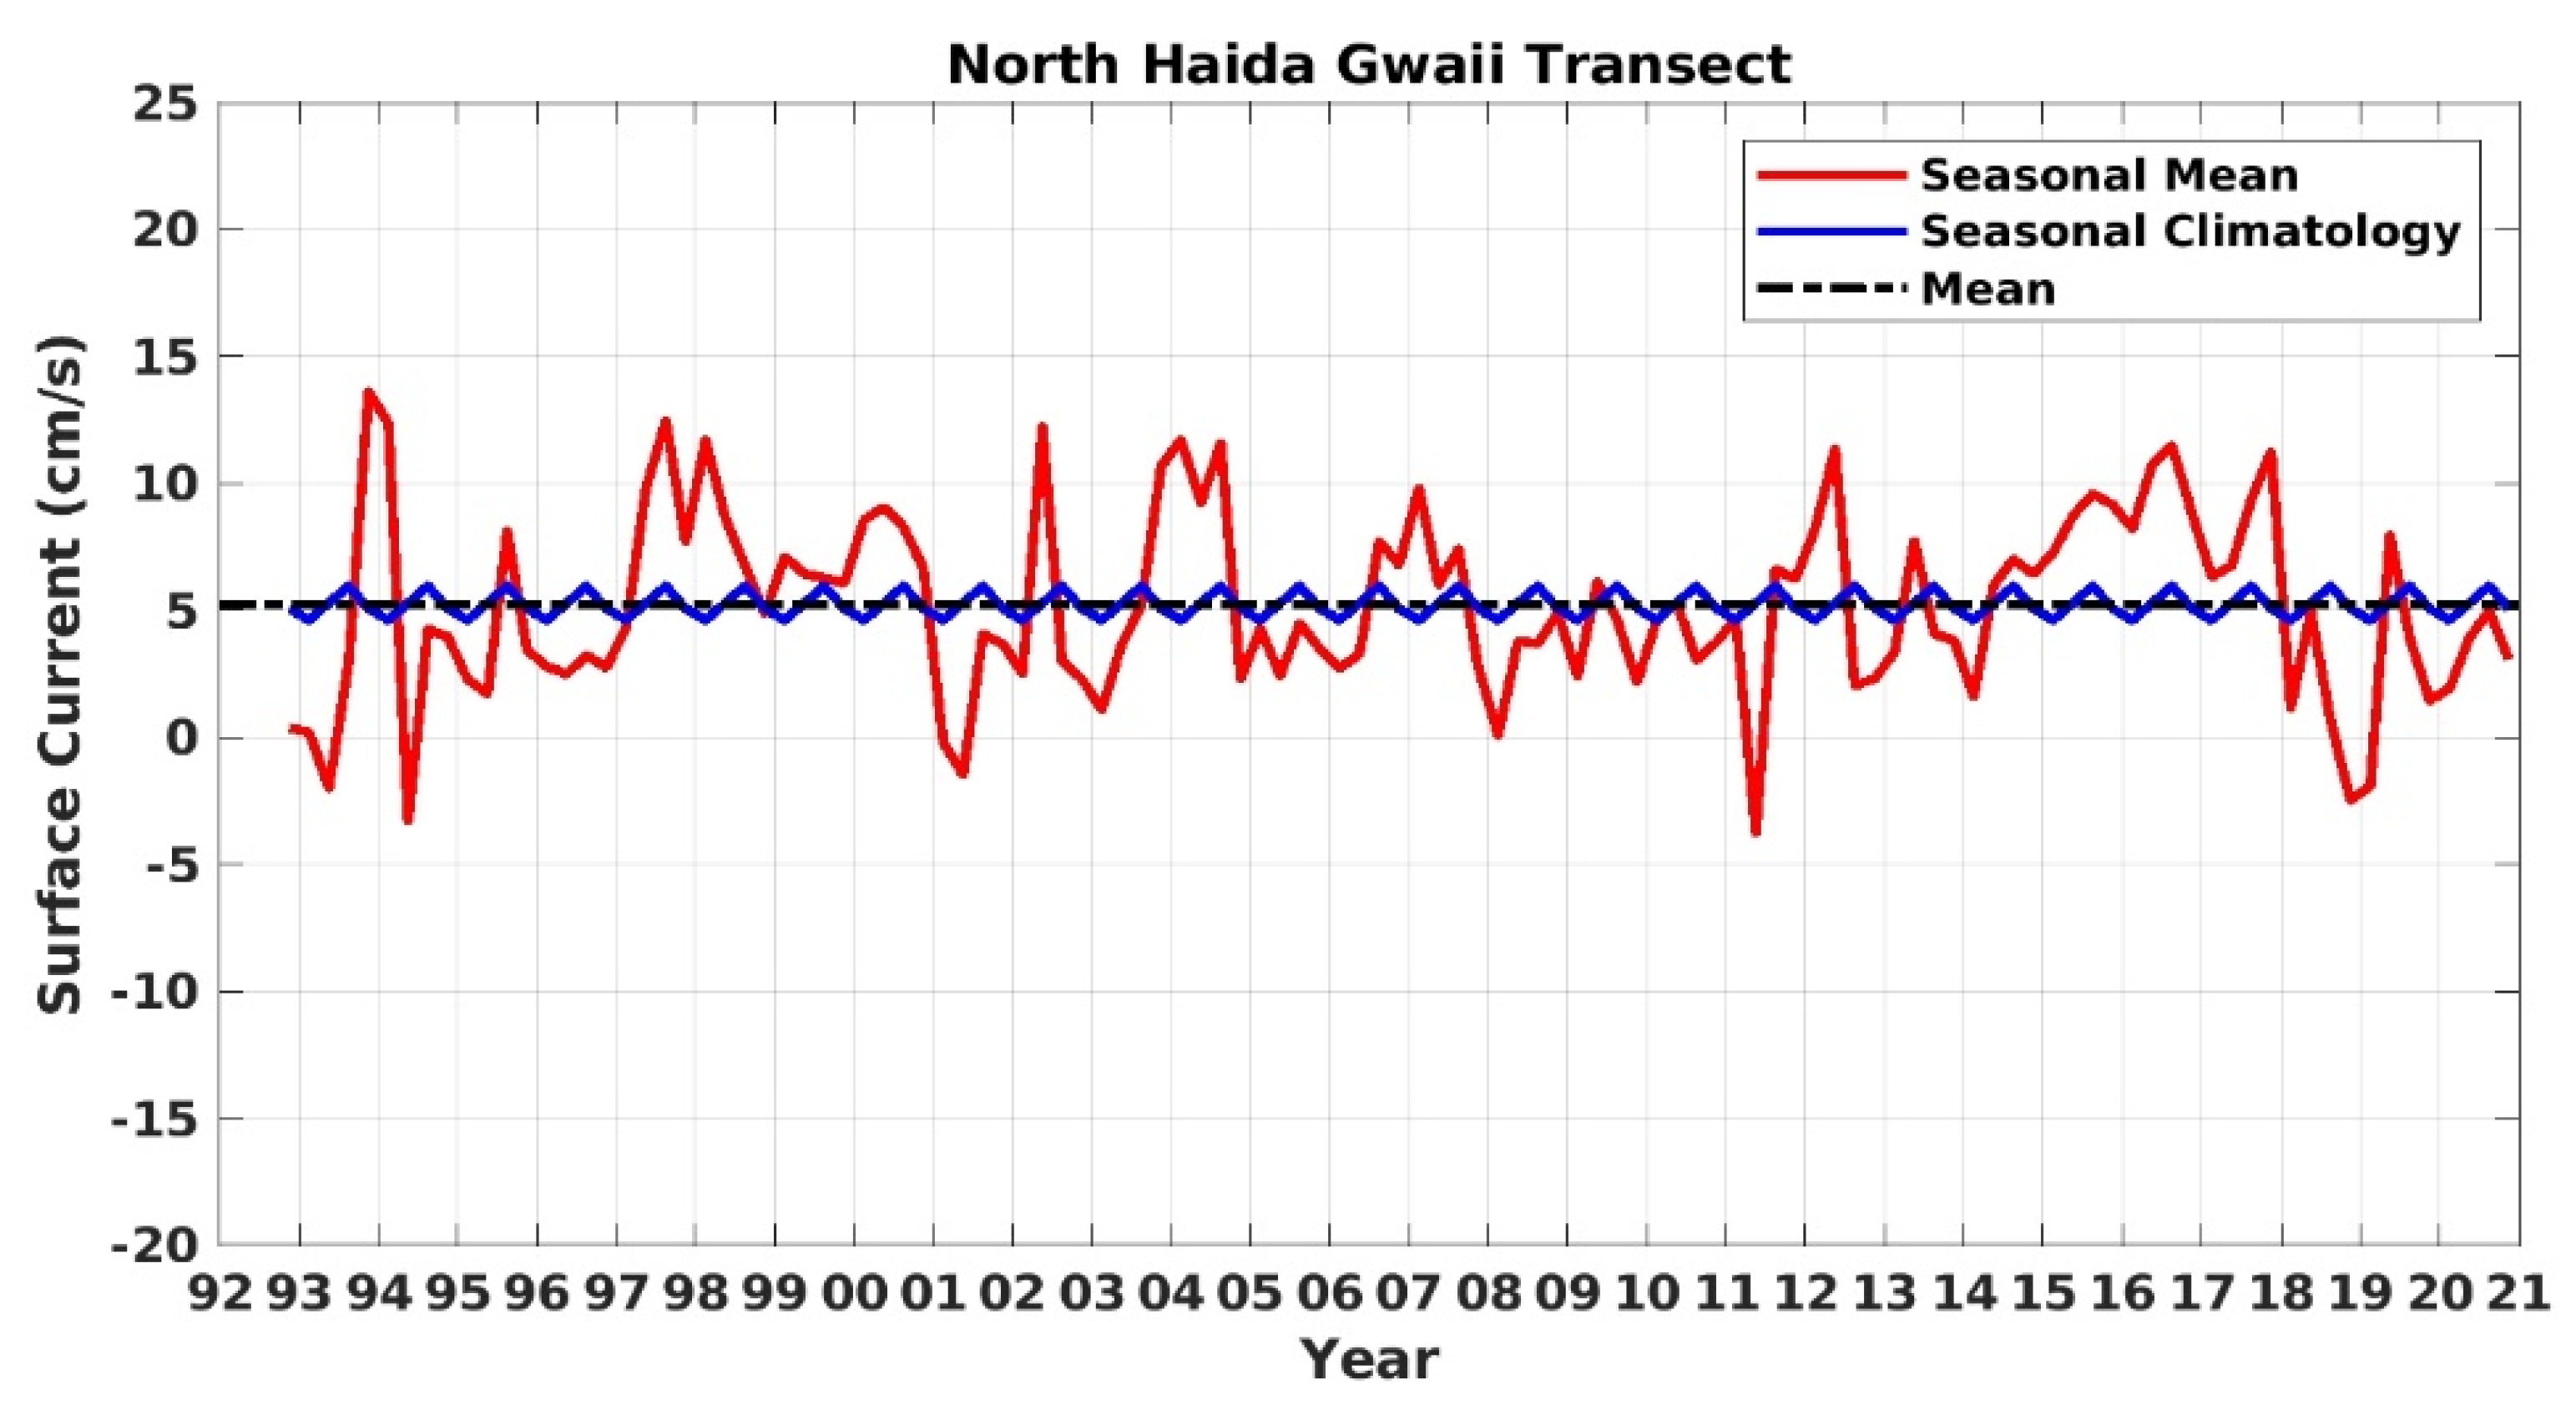
Figure 7) are qualitatively similar to those at the North Vancouver Island transect. At the North Haida Gwaii transect, the mean flow continues to be poleward, but the seasonal cycle diminishes (Figure 8).
There is no apparent long-term trend in the surface current at all transects over 1992–2020 (Figure 3, Figure 4, Figure 5, Figure 6, Figure 7 and Figure 8). In contrast, interannual variations are evident, with large episodic anomalies occurring during El Niño and La Niña years. For example, stronger equatorward surface currents occurred in the summers of 2015 and 2016, and stronger poleward surface currents occurred in the falls of 2015–2016 and 2016–2017 during El Niño. In summer/fall 2020 during La Niña, the equatorward surface current at the South Vancouver Island transect was stronger than normal (Figure 3). The seasonal anomalies at the North Vancouver Island, Queen Charlotte Sound, South Haida Gwaii, and Central Haida Gwaii transects are correlated with those at the South Vancouver Island transect, with the correlation coefficient different from zero at the 95% confidence level (Table 1). Nevertheless, there is no correlation in the seasonal flow anomalies between the North Haida Gwaii transect and the South Vancouver Island transects at the 95% confidence level.
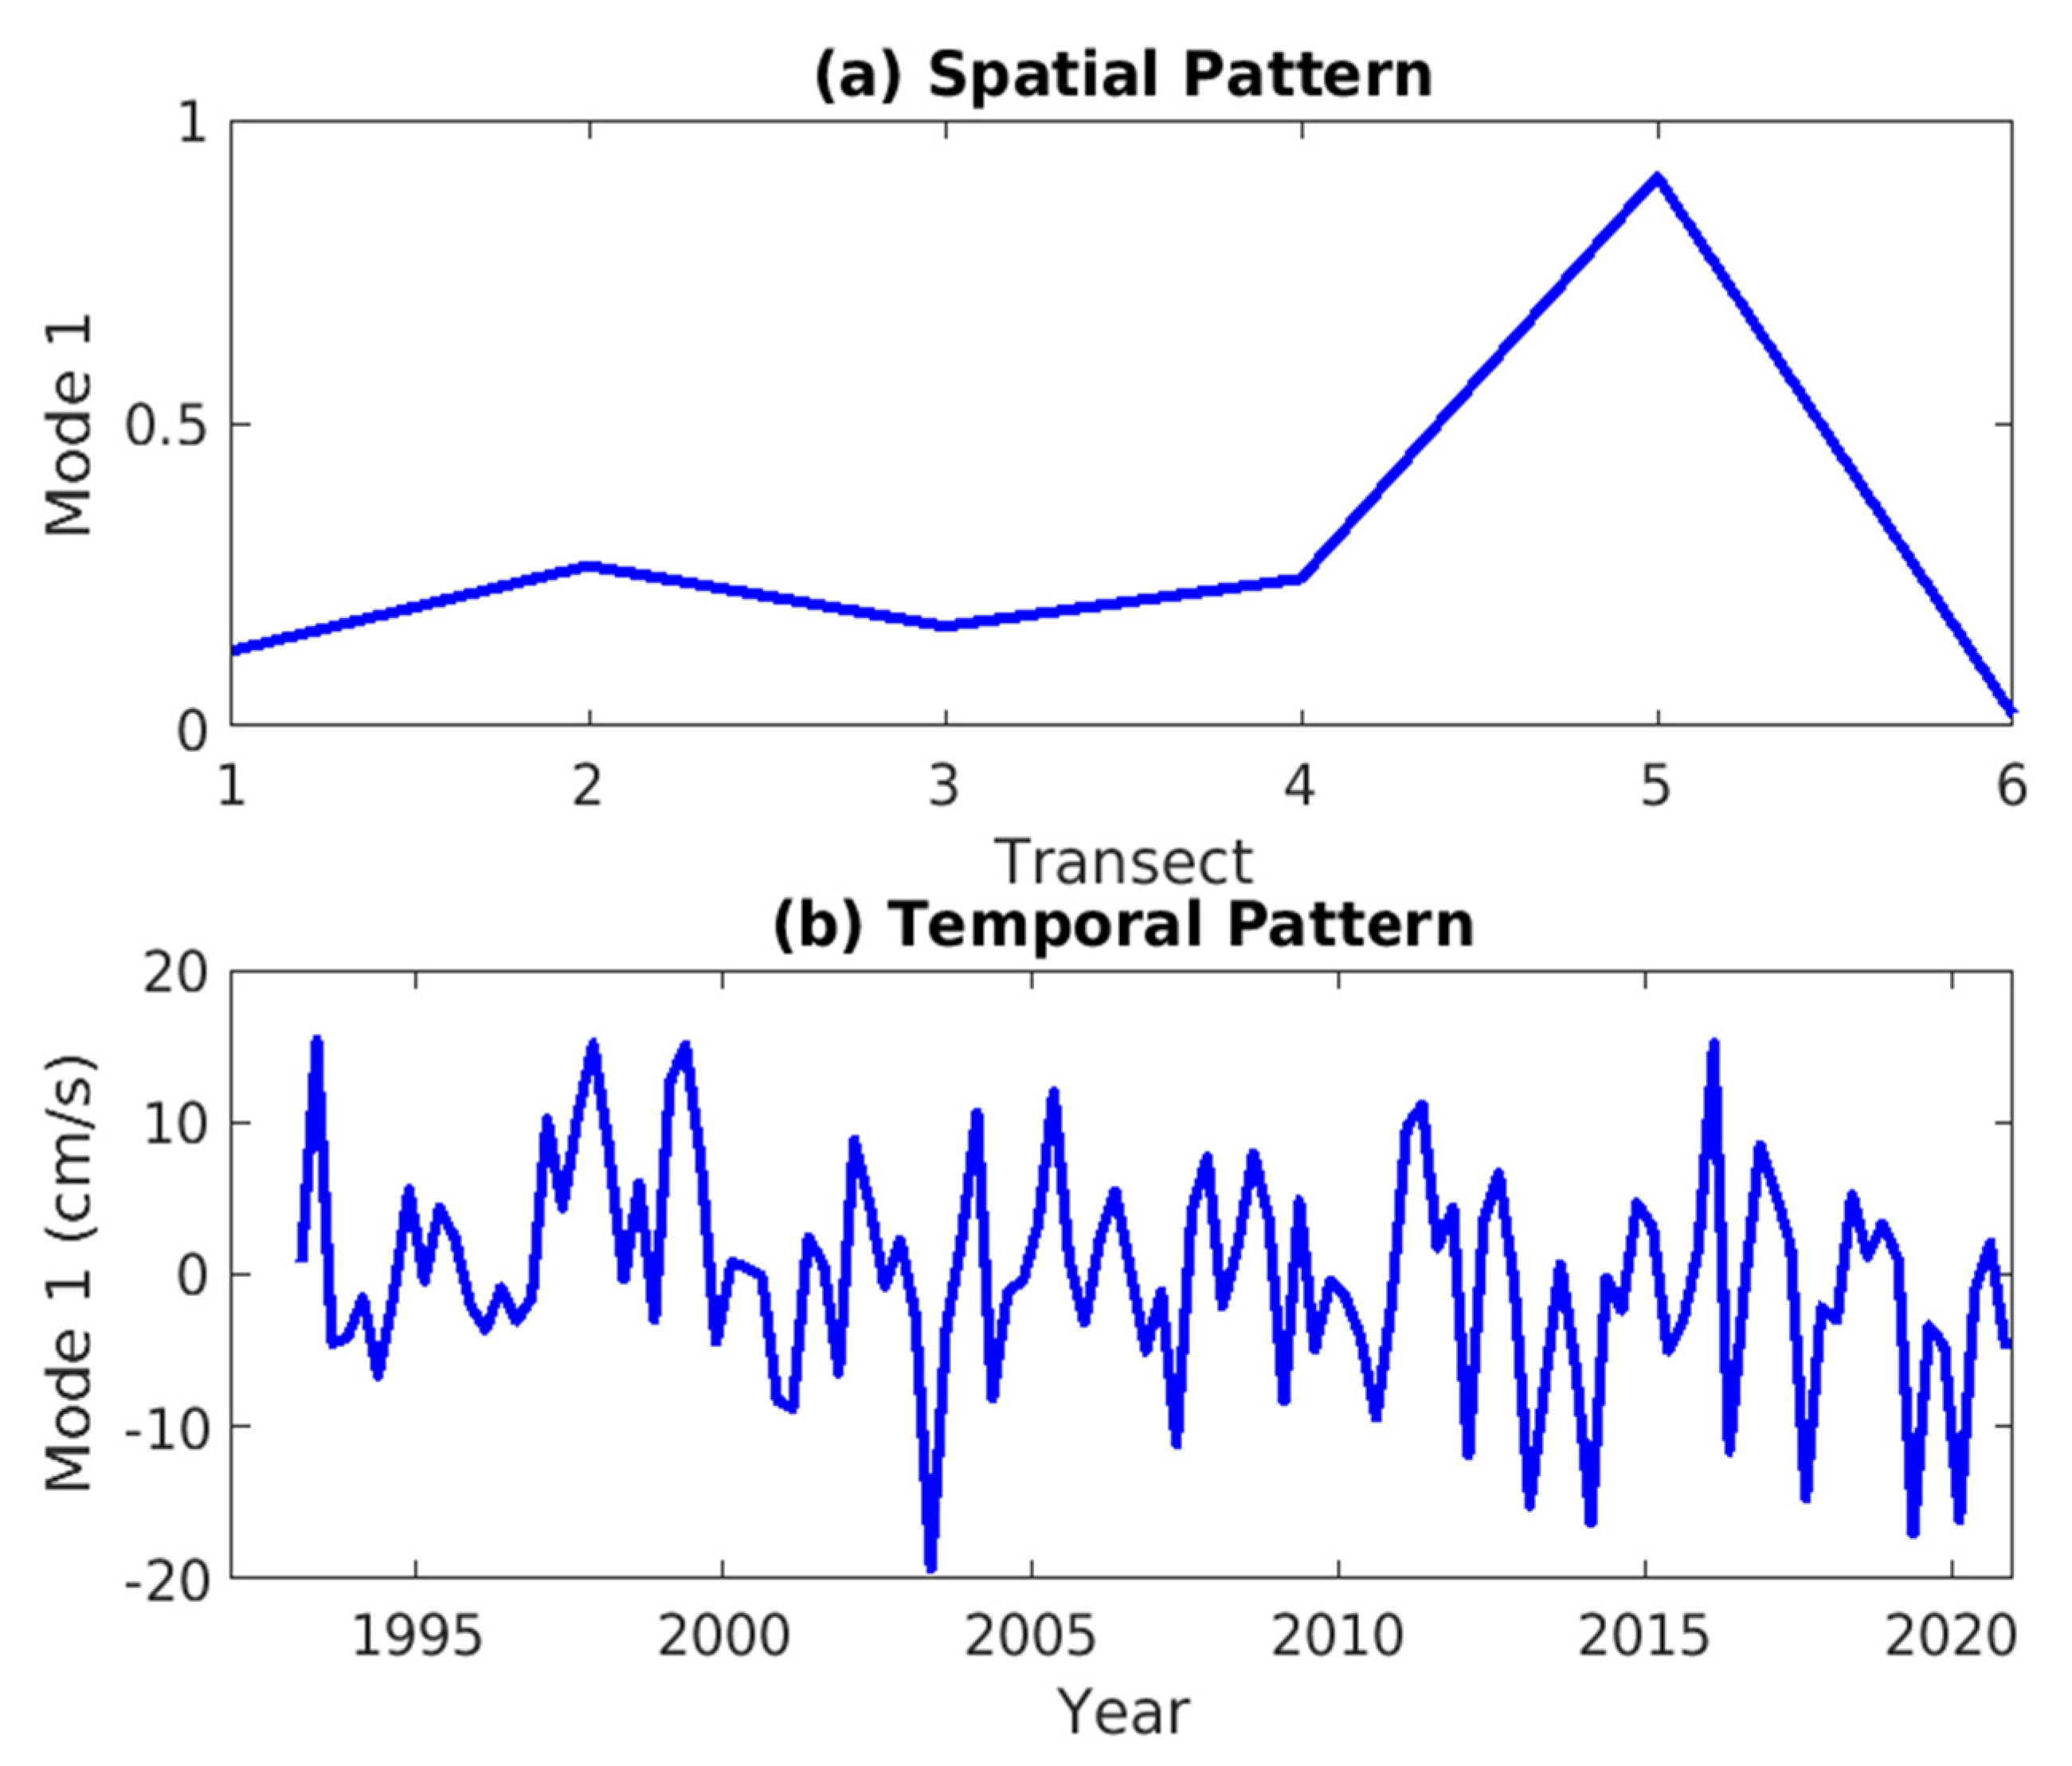
Further, we carried out the Empirical Orthogonal Function (EOF) analysis of the seasonal flow anomalies at the six transects. The first EOF mode accounts for 43% of the total variance. The spatial pattern of the first mode (Figure 9a) represents the continuous shelf-edge flow from the South Vancouver Island transect to the North Haida Gwaii transect. The first-mode time series (
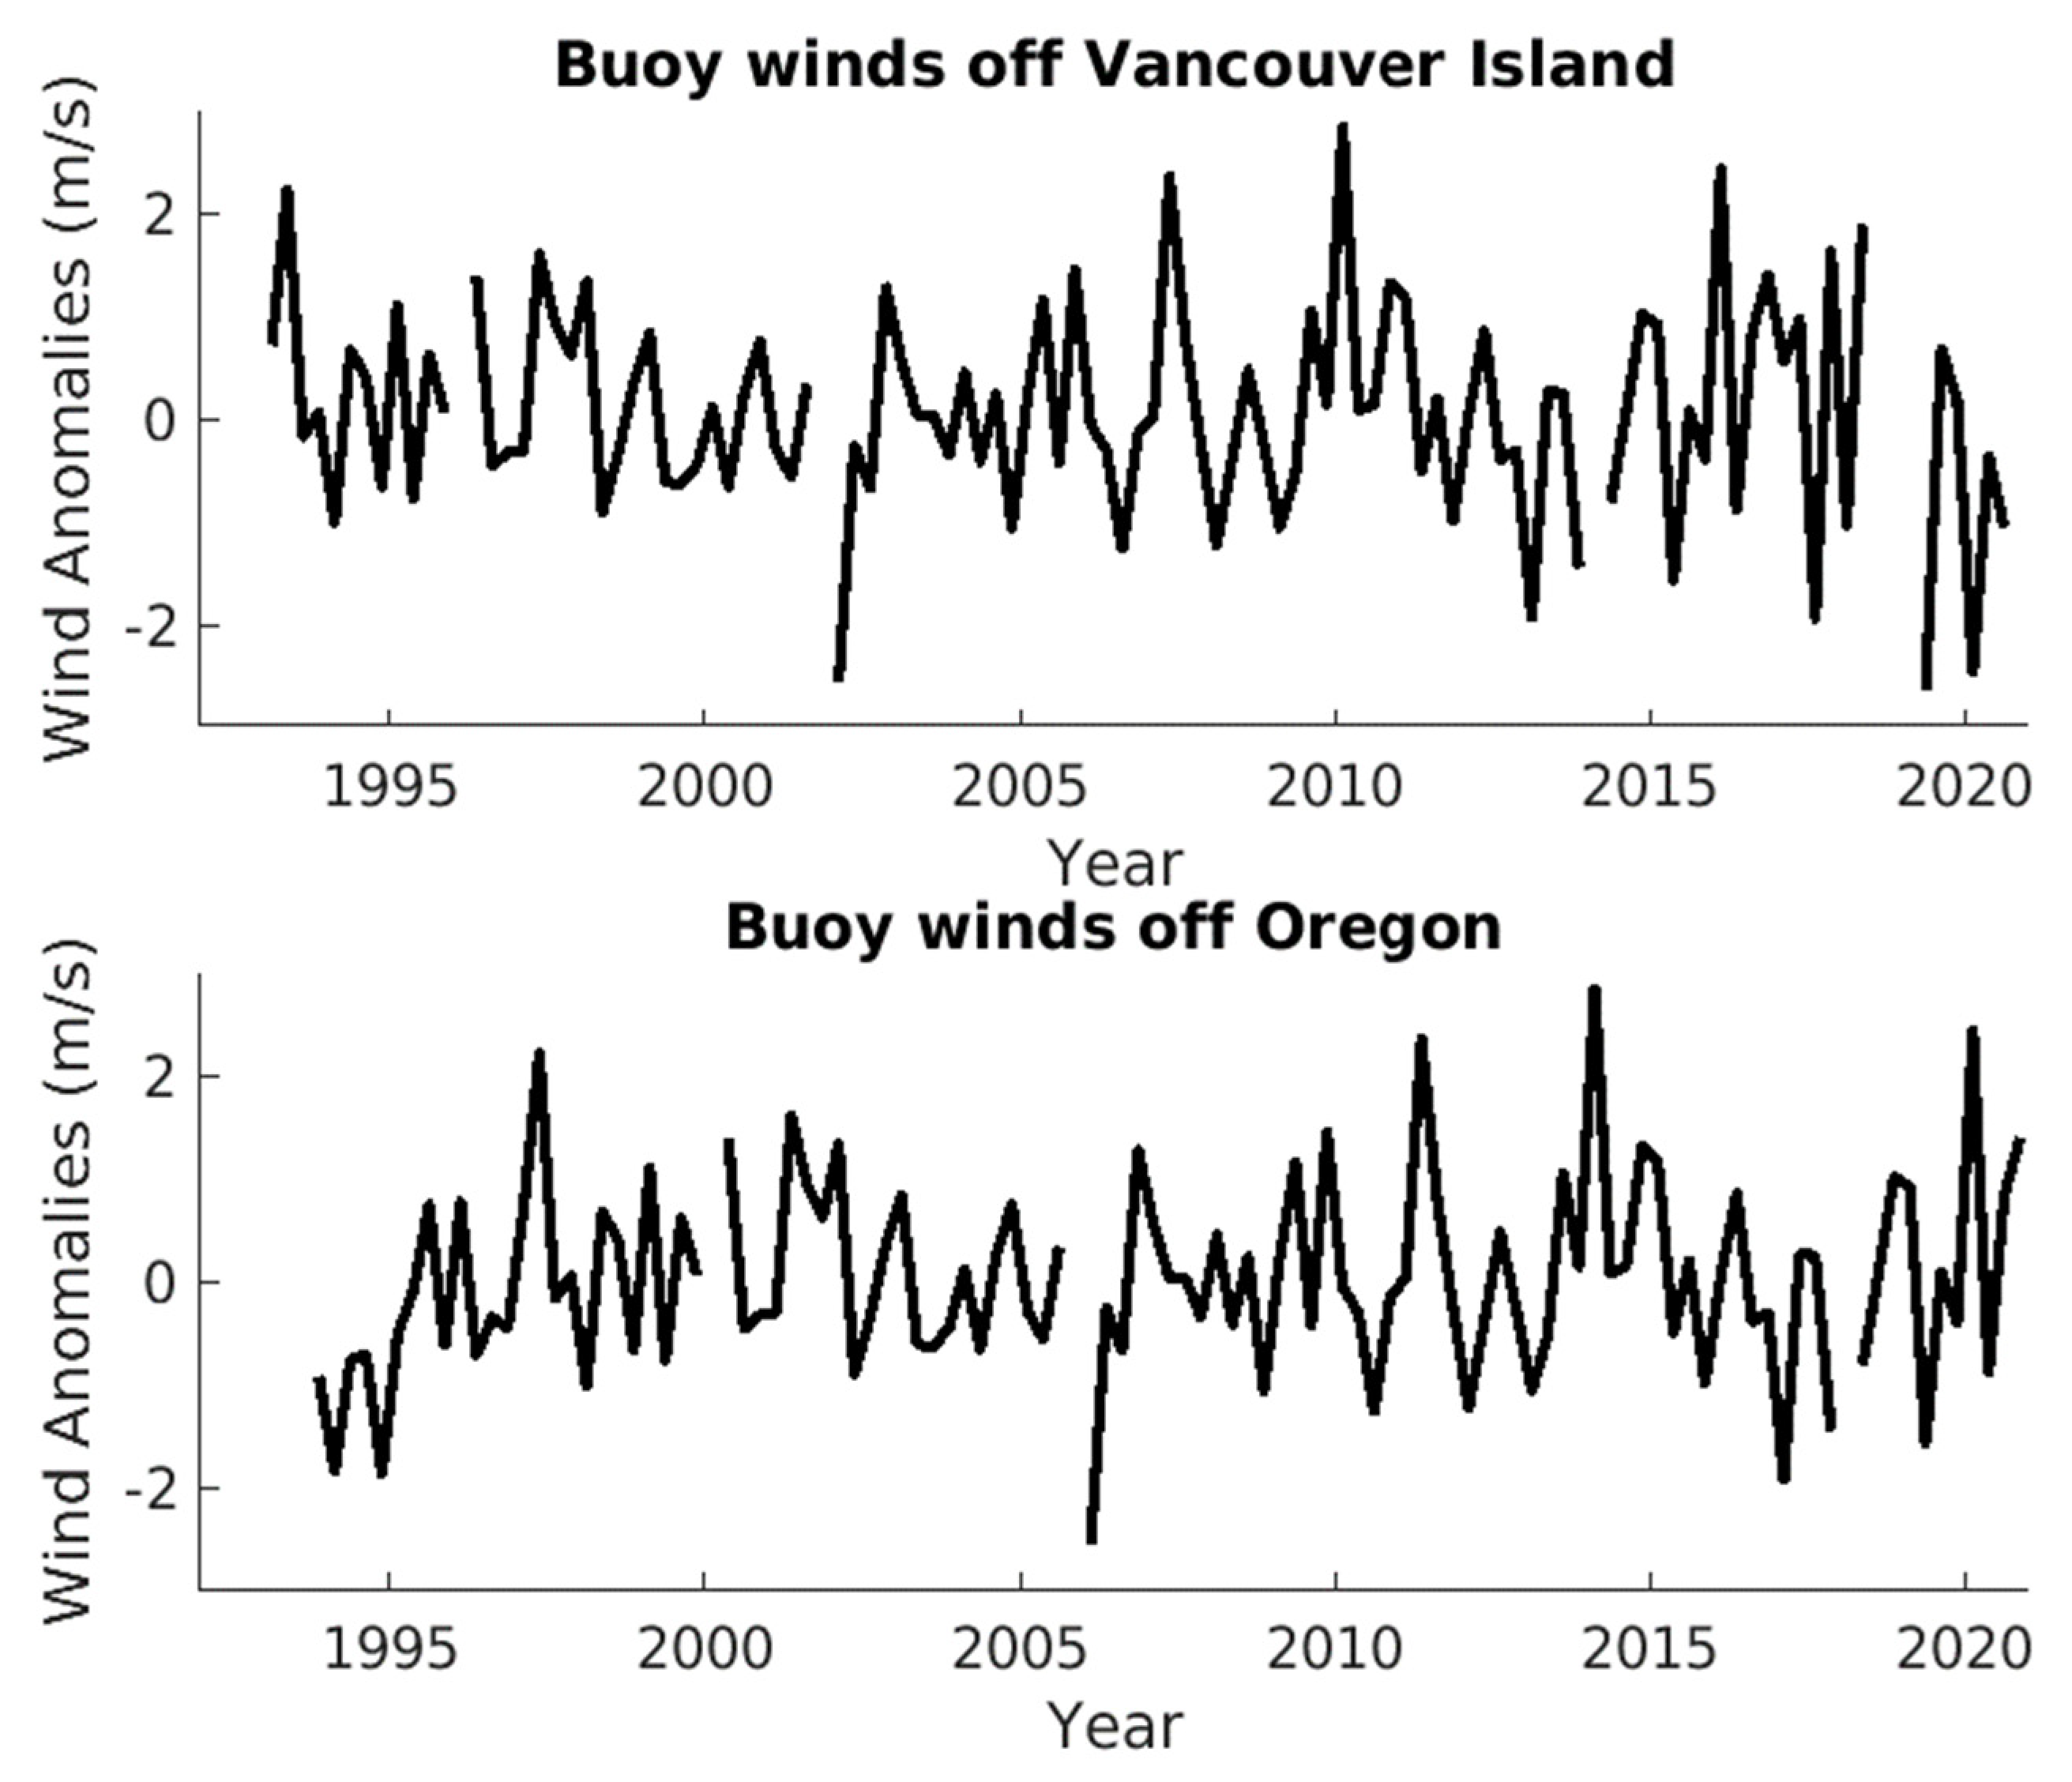
Figure 9b) correlates with the alongshore seasonal wind anomalies off South Vancouver Island and off Oregon (Figure 10, 
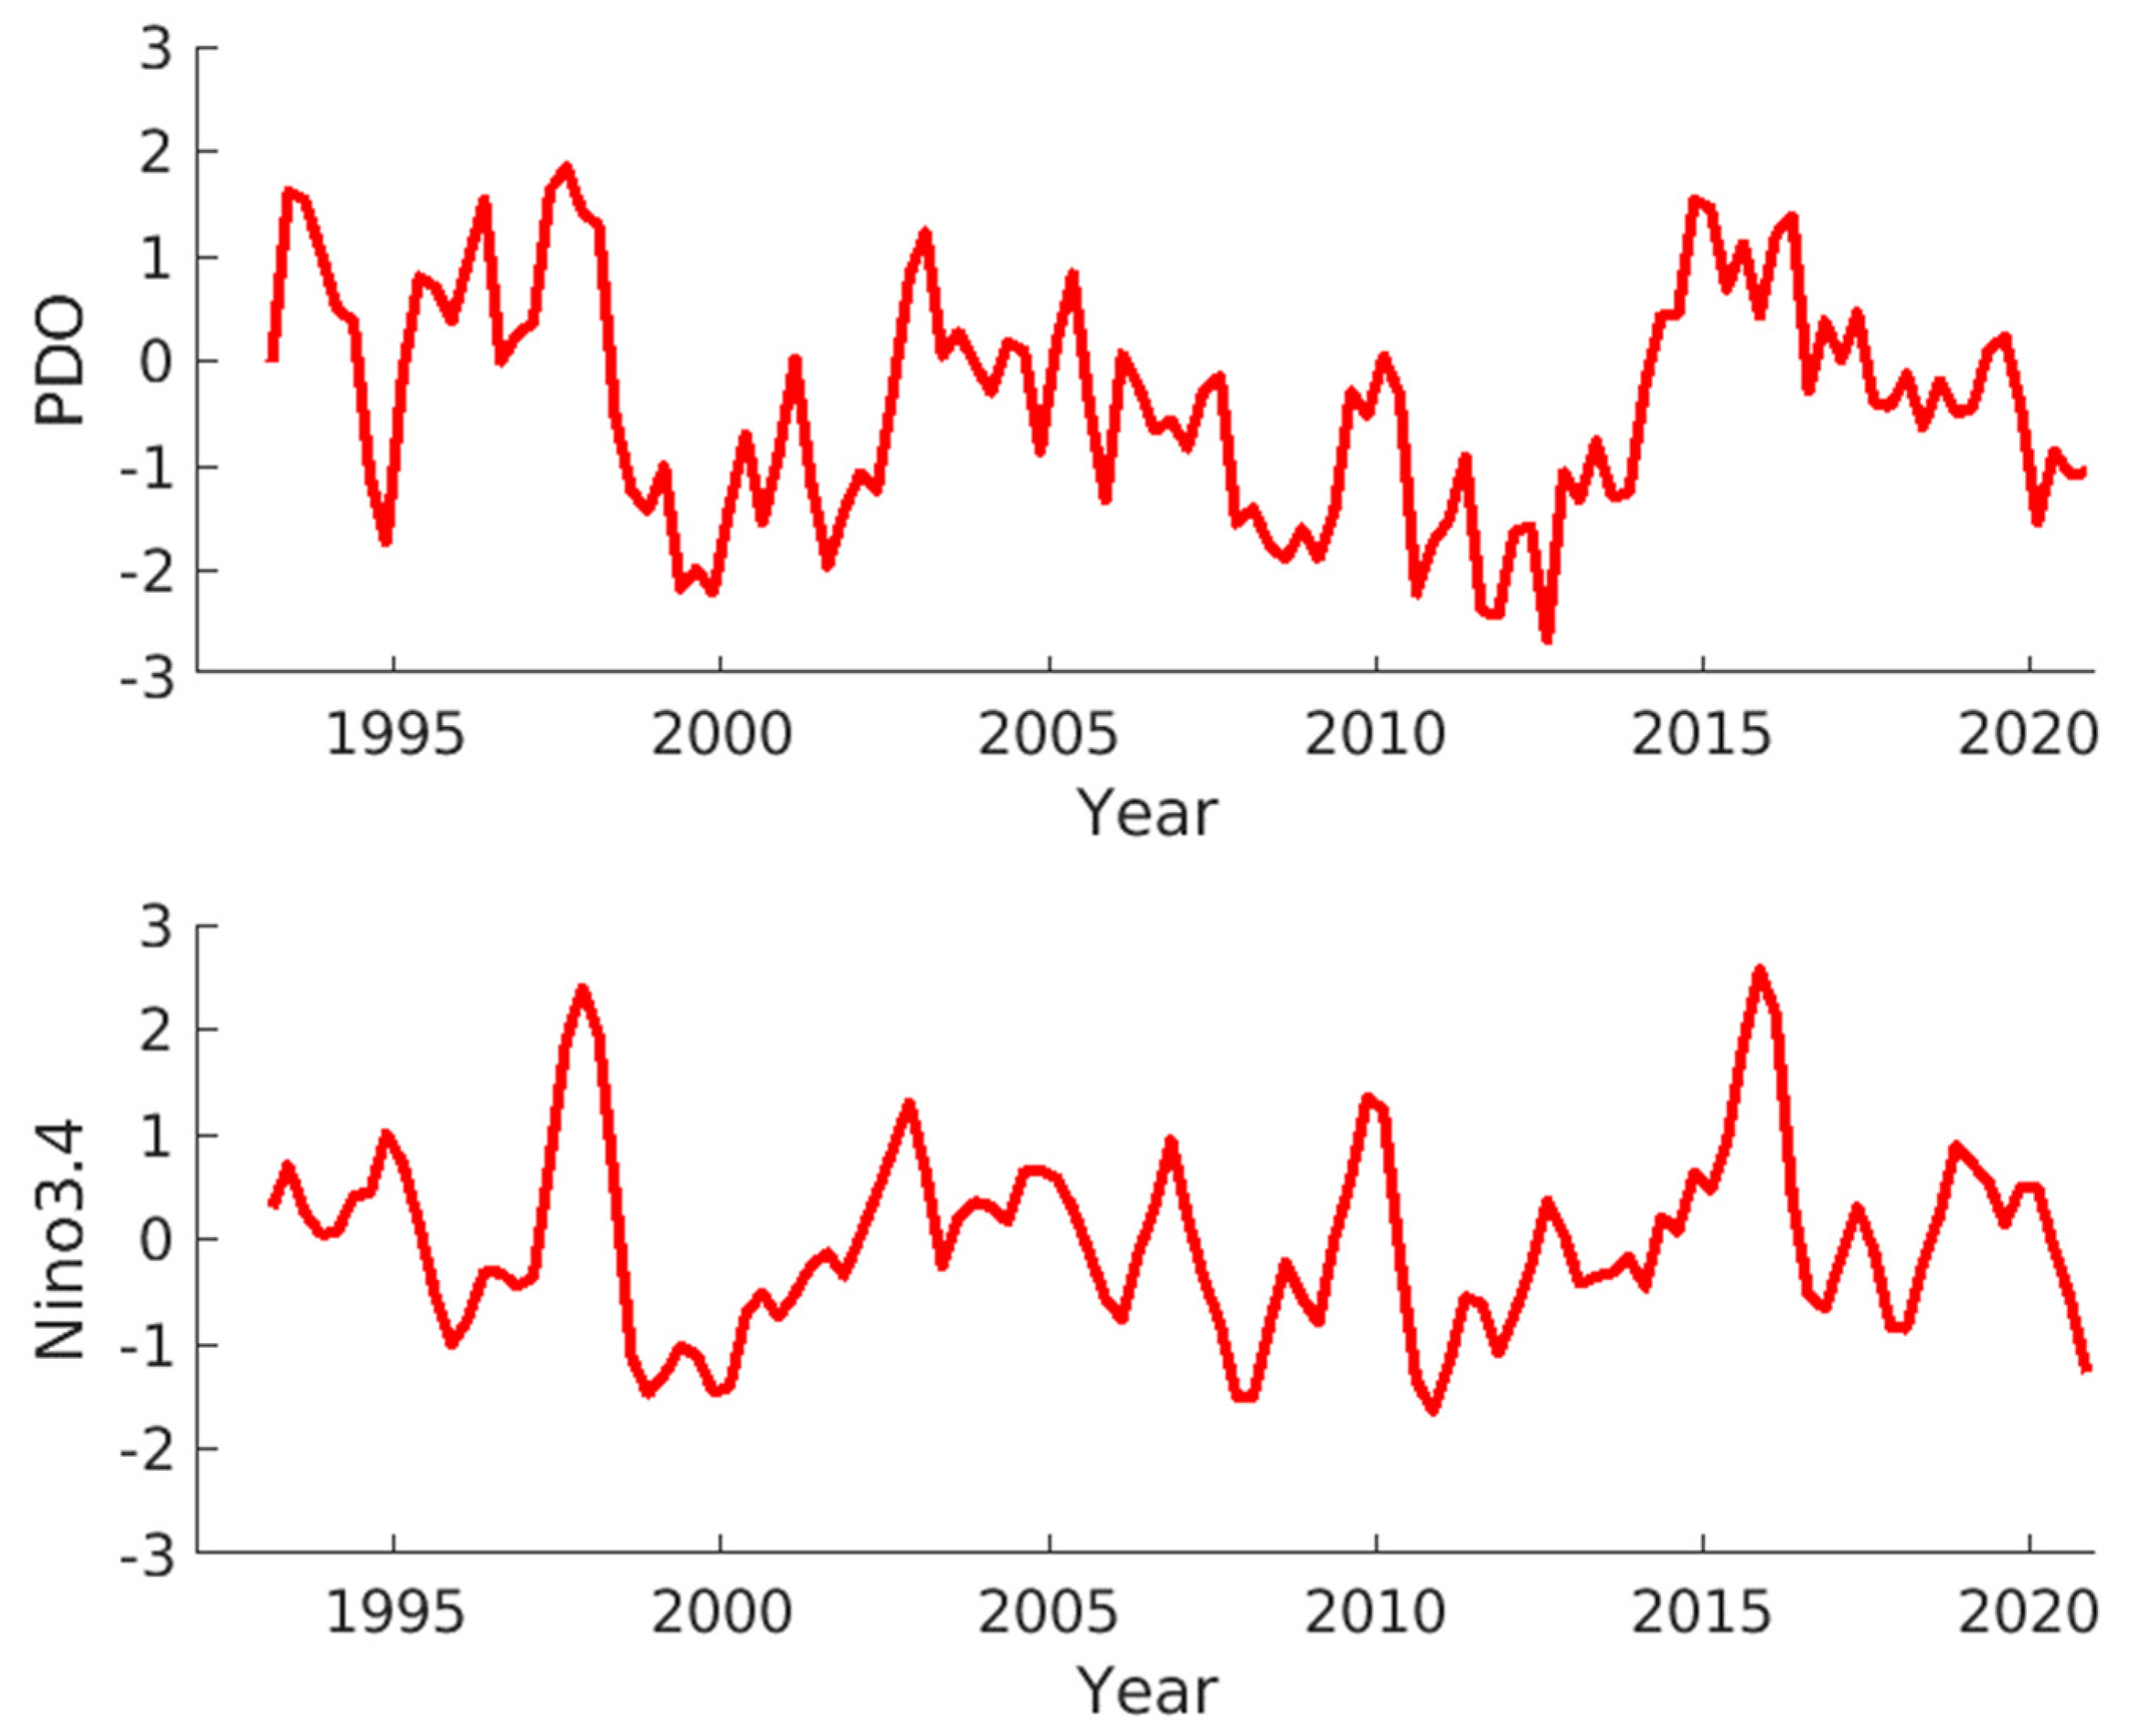
Table 2) at the 95% confidence level respectively, but it does not correlate with either seasonal PDO or seasonal Niño 3.4 indices (Figure 11, Table 2). The longshore currents from current meter data at A1 do not correlate with either of the two indices at the 95% confidence level, supporting the altimetric results. In addition, the second EOF mode accounting for 19% of the total variance has no correlation with either of the two indices, and the same is true for the seasonal current anomalies at the South Vancouver Island transect.

4. Discussion

Earlier studies using current meter data showed that the near-surface (35 m below the sea surface) shelf-edge current at a long-term monitoring site off South Vancouver Island is poleward in winter and equatorward in summer [2,8]. The present altimetry-derived surface currents at the South Vancouver Island transect near the monitoring site show a similar seasonal cycle in phase and magnitude. Furthermore, the altimetric currents show that the mean flow is poleward, except at the South Vancouver Island transect. They also show that the seasonal cycle is a coherent feature at all transects except at the most northern transect, the North Haida Gwaii transect, where the seasonal cycle diminishes.
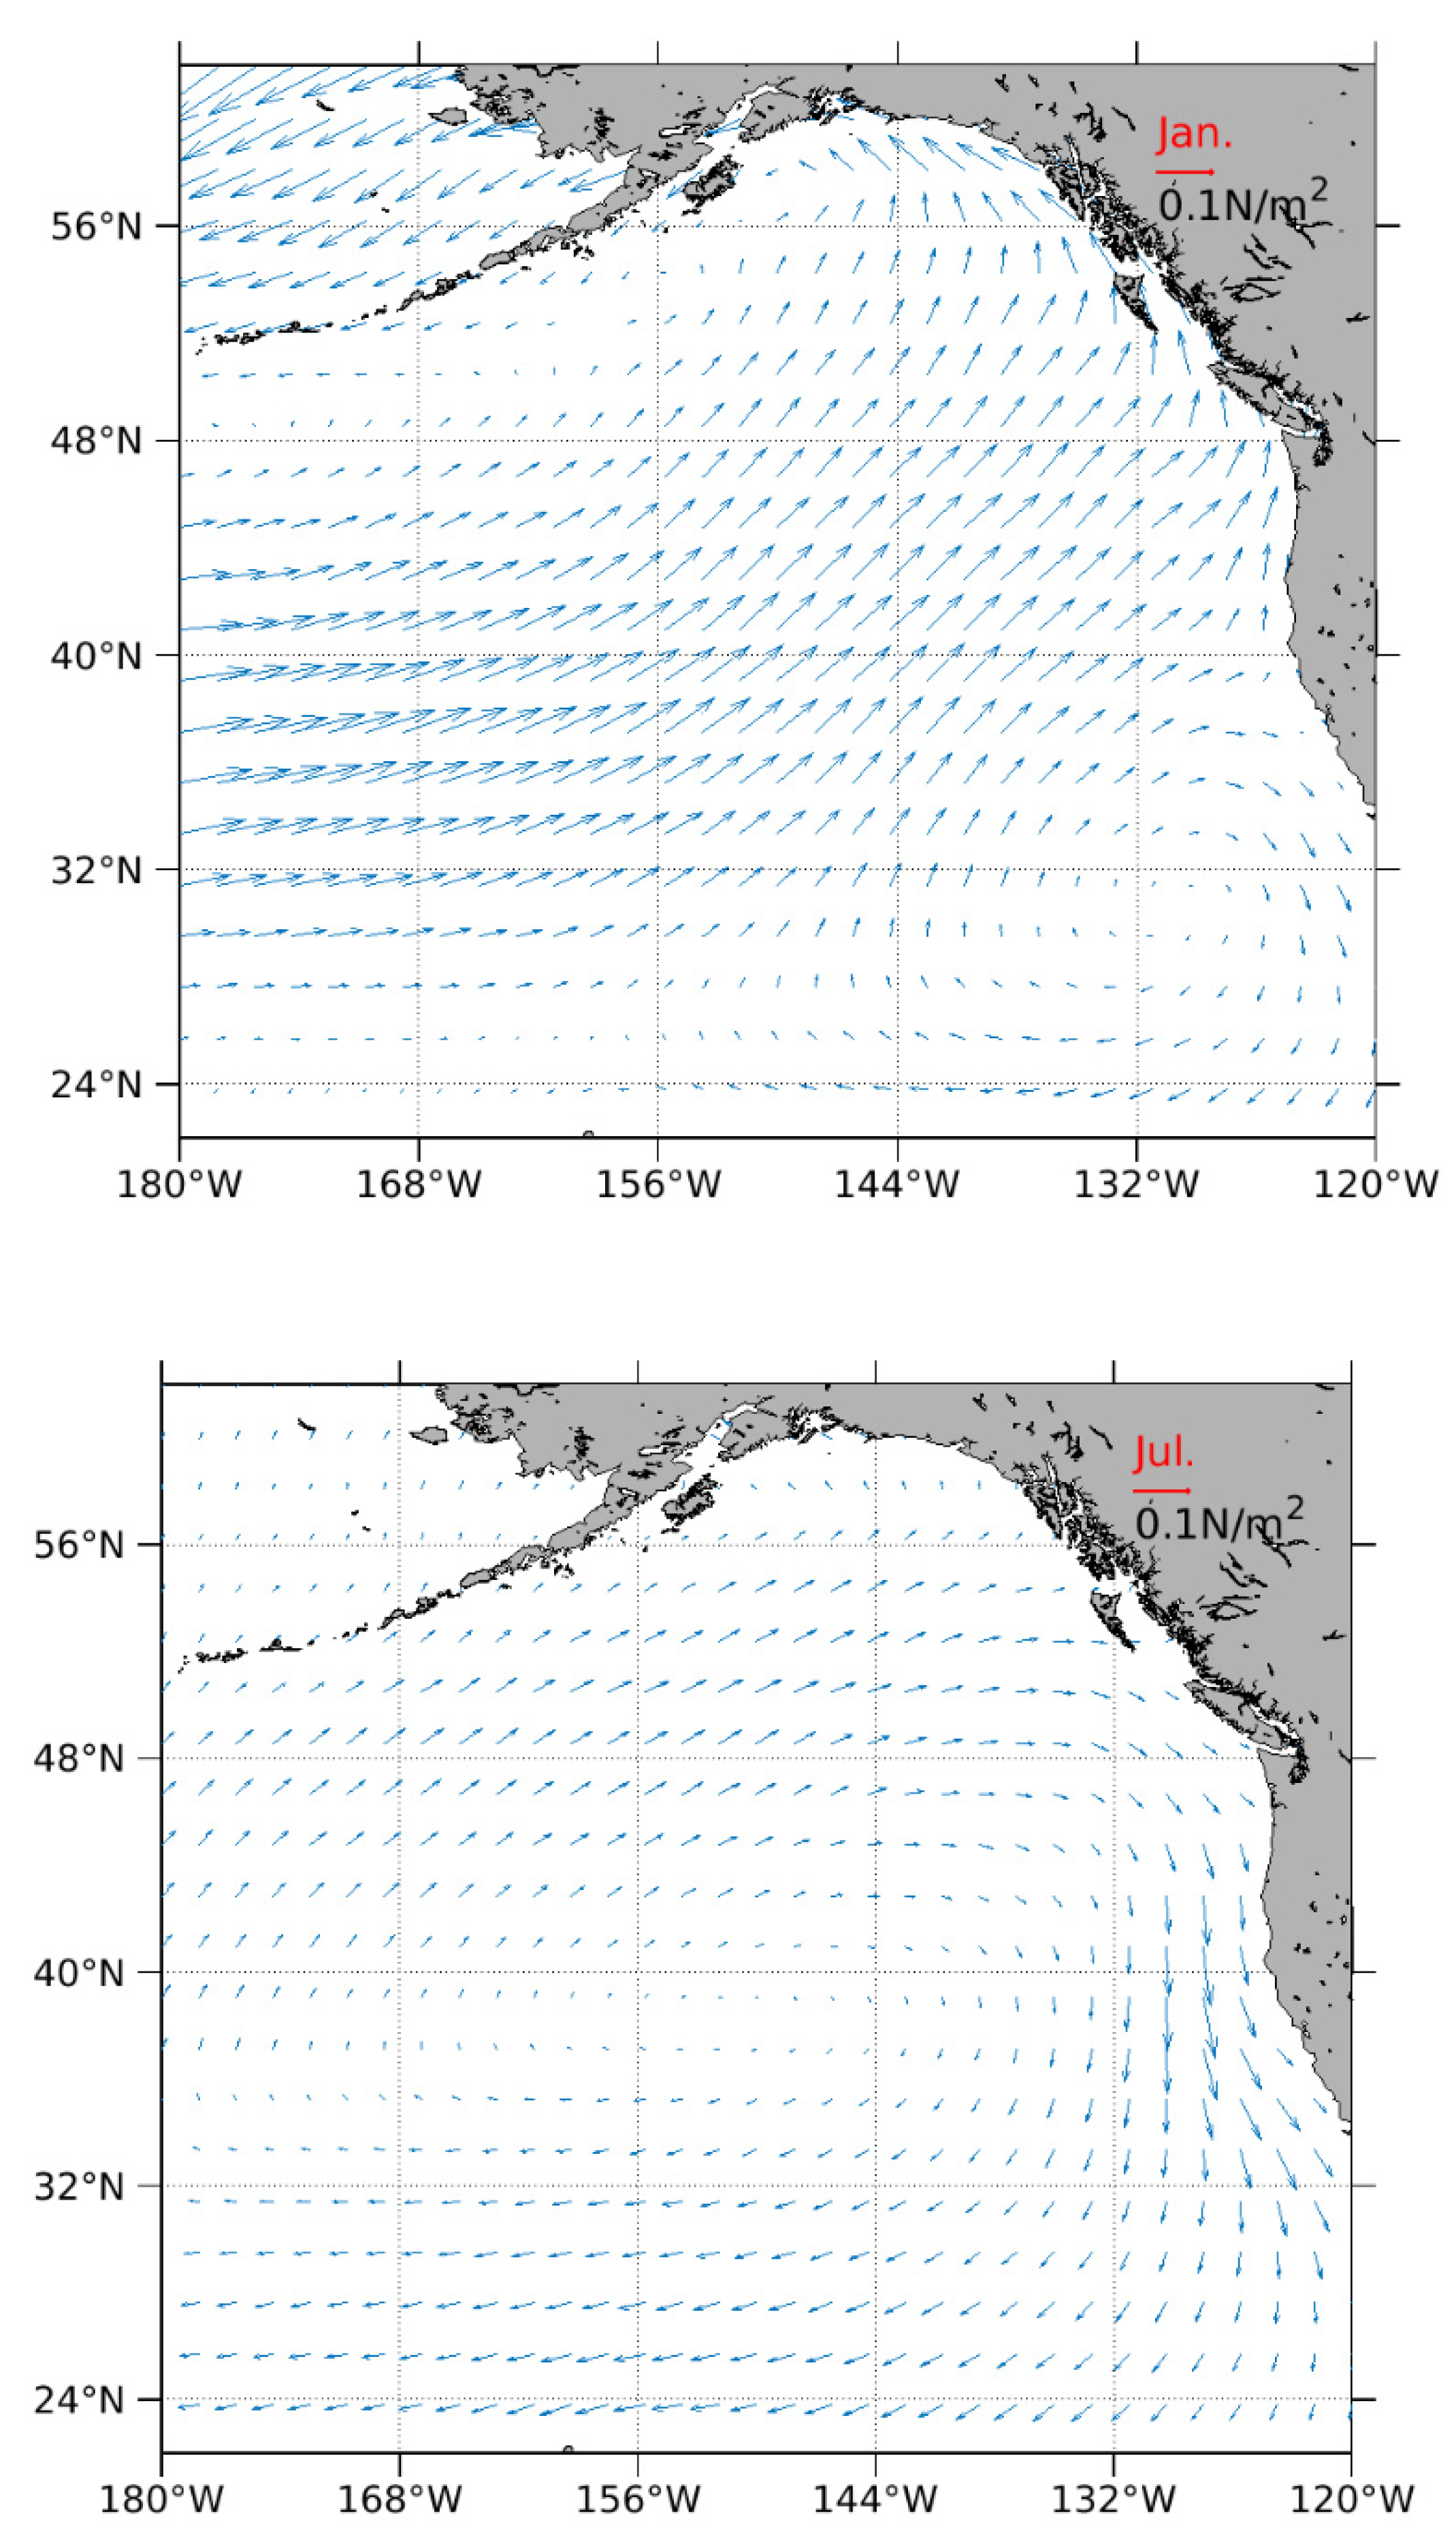
Previous studies have identified that seasonal wind shifts are the main driver for the seasonal changes of the shelf-edge currents off Vancouver Island [1]. In the summer, the upwelling winds dominate, and in the winter, the downwelling winds dominate over the Vancouver Island Shelf (Figure 12). Nevertheless, the alongshore wind distribution is not the same on the entire continental shelf off the western coast of Canada. In the summer, the dominant wind is onshore instead of alongshore in the northern part of the Pacific Canadian Shelf (Figure 12). The weak mean flow over the South Vancouver Island slope and strong poleward flow over the northern continental slope, and the coherent seasonal cycle off the west coast of Canada from satellite altimetry measurements are consistent with the previous finding that the seasonal change of the alongshore wind direction is the main driver for the longshore slope current [1].
The interannual variations in the shelf-edge current off Vancouver Island have been linked to El Niño and La Niña events [2]. The present altimetric results also show significant interannual flow variations at all transects. The large episodic current anomalies at the South Vancouver Island transect during El Niño (e.g., 2015–2016) and La Niña (e.g., 2020) years (Figure 3) are consistent with Hourston and Thomson’s finding based on current meter data [2].
The statistically significant correlation between the first-mode time series of the shelf-edge and continental slope current and the alongshore wind anomalies off the South Vancouver Island coast suggests that the interannual current variation may be partially attributed to the variation in the regional alongshore winds. Likewise, the statistically significant correlation between the shelf edge current and the remote along-shelf winds off the Oregon coast suggests an impact of the remote wind forcing, consistent with Masson and Fine’s [3] findings on the effects of the open boundary forcing from their ocean modeling experiments. The underlying mechanism for the impacts of the remote wind forcing was explained by Battisti and Hickey [9], which showed that a significant portion of the low-frequency variance in the longshore velocity off the Washington and Oregon coasts is accounted for by the propagating first-mode coastally trapped waves forced by remote winds farther south.
Masson and Fine [3] showed that the interannual variations in their model currents are related to both the open boundary forcing outside Pacific Canadian shelf and slope waters and to the regional wind forcing. They further indicated the importance of the eddy variability off Haida Gwaii, which can be related to local winds and freshwater runoffs.
The surface current anomalies at the North Haida Gwaii transect are not correlated with those at the other transects, which suggests that some other factors may be locally dominant. For example, local winds and freshwater runoffs may be important at the North Haida Gwaii transect [3]. Strong mesoscale eddy variability has been found in gridded satellite altimetry data and ocean model simulations [3,4], which can be aliased into interannual variability of the shelf-edge current.
Although our results indicate large episodic anomalies occurred during El Niño and La Niña years, there is no statistically significant correlation between the shelf-edge and slope current anomalies and PDO or between the shelf-edge and slope current anomalies and the Niño 3.4 index, which means that the large-scale climate effect is more complex, possibly depending on how it is manifested regionally through cascading atmospheric, hydrological, and oceanic responses [3].

5. Conclusions

We investigated the longshore variations, seasonal cycle, and interannual changes of the near-surface geostrophic currents along the shelf-edge and continental slope off the west coast of Canada from 1992 to 2020, demonstrating the feasibility of using along-track satellite altimetry data for monitoring the near-surface shelf-edge and slope current. The investigation reveals some different characteristics of the near-surface shelf-edge and slope current from the south to the north.
The surface current is poleward in winter and equatorward in summer off South Vancouver Island, and is poleward year-round at the rest of the transects. The seasonal cycle clearly exists, except at the North Haida Gwaii transect.
The seasonal current anomalies have longshore correlations from the South Vancouver Island transect to the Central Haida Gwaii transect that are significant at the 95% confidence level, except at the North Haida Gwaii transect. They are significantly correlated with the longshore wind anomalies off both South Vancouver Island and Oregon at the 95% confidence level.
The seasonal current anomalies show large episodic changes during strong El Niño and La Niña years. However, they are not correlated with either the Niño 3.4 index or the PDO index at the 95% confidence level.

Author Contributions

Conceptualization, G.H.; methodology, G.H. and N.C.; validation, G.H. and N.C.; formal analysis, G.H. and N.C.; writing—original draft preparation, G.H.; writing—review and editing, G.H. All authors have read and agreed to the published version of the manuscript.

Funding

This research was funded by the Surface Water and Ocean Topography—Canada (SWOT-C) Program, Canadian Space Agency.

Institutional Review Board Statement

Nort Applicable.

Informed Consent Statement

Not Applicable.

Data Availability Statement

Wind fields are from the National Centers for Environmental Prediction (NCEP) Reanalysis 1 (https://psl.noaa.gov/data/gridded/data.ncep.reanalysis.html, accessed 1 March 2022). Buoy wind data are from Environmental and Climate Change Canada and Fisheries and Oceans Canada (https://www.meds-sdmm.dfo-mpo.gc.ca/isdm-gdsi/waves-vagues/data-donnees/index-eng.asp, accessed 1 March 2022) and from the National Data Buoy Center and the National Oceanic and Atmospheric Administration (NOAA) (https://www.ndbc.noaa.gov/station_page.php?station=46050, accessed 1 March 2022). The current metere data can be found in https://www.waterproperties.ca/mainlogin.php?refer=/ (accessed 1 March 2022). The PDO indices are from the National Center for Environmental Information, NOAA (https://www.ncdc.noaa.gov/teleconnections/pdo/, accessed 1 March 2022). The Niño 3.4 indices are from the National Weather Service, NOAA (https://origin.cpc.ncep.noaa.gov/products/analysis_monitoring/ensostuff/ONI_v5.php, accessed 1 March 2022).

Acknowledgments

We thank Roy Hourston for providing wind data and current meter data and Charles Hannah for helpful suggestions.

Conflicts of Interest

The authors declare no conflict of interest.

References

  1. Freeland, H.J.; Crawford, W.R.; Thomson, R.E. Currents along the pacific coast of Canada. Atmos. Ocean 1984, 22, 151–172. [Google Scholar] [CrossRef] [Green Version]
  2. Hourston, R.; Thomson, R. Vancouver Island West Coast shelf break currents, temperatures and wind stress. In State of Physical, Biological and Selected Fisheries Resources of Pacific Marine Ecosystem in 2019; Boldt, J.L., Javoski, A., Chandler, P., Eds.; Canadian Technical Report of Fisheries and Aquatic Sciences; Fisheries and Oceans Canada: Ottawa, ON, Canada, 2020; Volume 3377, 288p. [Google Scholar]
  3. Masson, D.; Fine, I. Modeling seasonal to interannual ocean variability of coastal British Columbia. J. Geophys. Res. Oceans 2012, 117, C10019. [Google Scholar] [CrossRef] [Green Version]
  4. Crawford, W.R.; Cherniawsky, J.Y.; Foreman, M.G.G.; Gower, J.F.R. Formation of the Haida-1998 oceanic eddy. J. Geophys. Res. Ocean. 2002, 107, 3069. [Google Scholar] [CrossRef]
  5. Abdalla, S.; Kolahchi, A.A.; Ablain, M.; Adusumilli, S.; Bhowmick, S.A.; Alou-Font, E.; Amarouche, L.; Andersen, O.B.; Antich, H.; Aouf, L.; et al. Altimetry for the future: Building on 25 years of progress. Adv. Space Res. 2021, 68, 319–363. [Google Scholar] [CrossRef]
  6. Han, G.; Chen, N.; Ma, Z. Is there a north-south phase shift in the surface Labrador Current transport on the interannual-to-decadal scale? J. Geophys. Res. Ocean. 2014, 119, 276–287. [Google Scholar] [CrossRef]
  7. Dean, R.T.; Dunsmuir, W.T.M. Dangers and uses of cross-correlation in analyzing time series in perception, performance, movement, and neuroscience: The importance of constructing transfer function autoregressive models. Behav. Res. Methods 2016, 48, 783–802. [Google Scholar] [CrossRef] [PubMed] [Green Version]
  8. Thomson, R.E.; Krassovski, M.V. Remote alongshore winds drive variability of the California Undercurrent off the British Columbia-Washington coast. J. Geophys. Res. Ocean. 2015, 120, 8151–8176. [Google Scholar] [CrossRef] [Green Version]
  9. Battisti, D.; Hickey, B.M. Application of remote wind-forced coastal trapped wave theory to the Oregon and Washington coasts. J. Phys. Oceanogr. 1984, 14, 887–902. [Google Scholar] [CrossRef]
Figure 1. The study area showing the location of six transects (thick blue segment), a long-term monitoring site A1 (red circle), and a buoy site (black square), as well as bathymetry (200-, 1000-, 2500- and 3000-m isobaths). The altimetry data on each transect are used to calculate the surface current averaged over the transect. HG: Haida Gwaii; QCS: Queen Charlotte Sound; VI: Vancouver Island. The six transects from south to north are the South Vancouver Island transect, the North Vancouver Island transect, the Queen Charlotte Sound transect, the South Haida Gwaii transect, the Central Haida Gwaii transect, and the North Haida Gwaii transect. The schematic mean surface circulation pattern in the Northeast Pacific is depicted (grey arrows), along with the schematic surface shelf-edge flow in summer (red arrow) and winter (blue arrow).
Remotesensing 14 01407 g001
Figure 2. Seasonal-mean longshore currents (positive poleward) at the shelf break. The current data are at 35 m below surface at A1. The altimetry current is the geostrophic surface current over a 25 km segment on the South Vancouver Island transect.
Remotesensing 14 01407 g002
Figure 3. Seasonal-mean longshore geostrophic surface currents (positive poleward) over the continental slope at the South Vancouver Island transect off the British Columbia coast. The currents are averaged over the transect (see Figure 1). Seasonal climatology is calculated by averaging seasonal means over the study period for winter, spring, summer, and fall, respectively. Mean is defined as the mean current averaged over the study period.
Remotesensing 14 01407 g003
Figure 4. Same as Figure 3 but at the North Vancouver Island Transect.
Remotesensing 14 01407 g004
Figure 5. Same as Figure 3 but at the Queen Charlotte Sound Transect.
Remotesensing 14 01407 g005
Figure 6. Same as Figure 3 but at the South Haida Gwaii Transect.
Remotesensing 14 01407 g006
Figure 7. Same as Figure 3 but at the Central Haida Gwaii Transect.
Remotesensing 14 01407 g007
Figure 8. Same as Figure 3 but at the North Haida Gwaii Transect.
Remotesensing 14 01407 g008
Figure 9. The mode-1 EOF spatial (a) and temporal (b) patterns of the seasonal longshore current anomalies. Transects 1 to 6 represent the six transects, in the order from the South Vancouver Island Transect to the North Haida Gwaii Transect.
Remotesensing 14 01407 g009
Figure 10. Seasonal longshore wind anomalies at Buoy 46,206 off South Vancouver Island and 46,050 off Oregon.
Remotesensing 14 01407 g010
Figure 11. Seasonal PDO and Niño 3.4 indices.
Remotesensing 14 01407 g011
Figure 12. Climatological monthly wind stress distribution in January and July. Data are from NCEP.
Remotesensing 14 01407 g012
Table 1. Correlation coefficients between the seasonal anomalies of longshore surface currents at the South Vancouver Island transect and those at the other transects. The values statistically significant at the 95% confidence level are bold.
Transect NameCorrelation Coefficient
North Vancouver Island0.29
Queen Charlotte Sound0.35
South Haida Gwaii0.26
Central Haida Gwaii0.18
North Haida Gwaii−0.04
Table 2. Correlation coefficients between the first EOF mode of the longshore surface current anomalies and potential forcing factors.
Winds off South Vancouver IslandWinds off OregonPDONiño 3.4
0.340.250.060.14
Publisher’s Note: MDPI stays neutral with regard to jurisdictional claims in published maps and institutional affiliations.

