Abstract
Recently, unmanned aerial vehicle (UAV) remote sensing has been widely used in emergency scenarios; the operating mode has transitioned from one UAV to multiple UAVs. However, the current multiple-UAV remote sensing mode is characterized by high labor costs and limited operational capabilities; meanwhile, there is no suitable UAV swarm scheduling method that can be applied to remote sensing in emergency scenarios. To solve these problems, this study proposes a UAV swarm scheduling method. Firstly, the tasks were formulated and decomposed according to the data requirements and the maximum flight range of a UAV; then, the task sets were decomposed according to the maximum flight range of the UAV swarm to form task subsets; finally, aiming at the shortest total flight range of the task subsets and to balance the flight ranges of each UAV, taking the complete execution of the tasks as the constraint, the task allocation model was constructed, and the model was solved via a particle swarm optimization algorithm to obtain the UAV swarm scheduling scheme. Compared with the direct allocation method and the manual scheduling methods, the results show that the proposed method has high usability and efficiency.
1. Introduction
With the increase in global population and changes in social and economic structures, extreme weather and natural disasters have shown a notable upward trend, such that emergency management faces significant challenges [1]. Natural disasters are usually accidental and sudden; therefore, timely and accurate disaster information is highly important for improving the efficiency and quality of rescue attempts [2]. However, conventional manual information acquisition has a long cycle and high cost, such that conforming to the needs of emergency rescue is difficult [3].
The development of remote sensing technology has provided a new method for obtaining disaster information [4]. Satellite remote sensing can provide a wide observation range and enables assessments of large-scale disaster scenarios, but it is also plagued by a slow response time, data quality that is easily affected by bad weather, and complicated data processing, among other issues [5]. Therefore, satisfying the requirements for real-time disaster observations alone remains difficult. Airborne remote sensing is also an important technology for emergency scenarios, characterized by a high operational efficiency and flexibility [6]. During the Wenchuan earthquake in China, the disaster rescue department used helicopters as airborne platforms to acquire remote sensing data on weirs, landslides, and mudslides in the affected areas; this information aided in subsequent disaster rescues [7]. However, airborne remote sensing is easily restricted by airspace control, the geographical environment, cost, and other conditions; therefore, there are many deficiencies in its application.
With progress in automatic control and data processing technologies, rapid development has occurred in unmanned aerial vehicle (UAV) remote sensing [8]. UAV remote sensing has been widely used in land surveys, agriculture, forestry, disaster rescue, national security, and many other fields [9,10,11]. UAVs are fast, flexible, mobile, and operate in real-time, thus enabling the acquisition of remote sensing data with centimeter-level resolution under clouds. This avoids issues associated with satellite and airborne remote sensing, which are easily affected by weather [12]. As UAVs have ground and vehicle takeoff and landing models, they can rapidly respond to the needs of high-risk remote sensing observations in emergency scenarios [13].
The highlighted problem for UAV remote sensing is the low efficiency of a single UAV; therefore, collaboration among multiple UAVs becomes a natural choice. In current remote sensing observation applications, multiple UAVs controlled by corresponding multiple crews generally cooperate with each other. This simple stacking of the UAV quantity can improve the operational efficiency; however, the problem here is that multiple crews require excessive labor. The lack of an accurate collaborative task mechanism causes significant variations in the total flight range undertaken by each UAV and the task completion time is inconsistent. These problems limit the operational capabilities of multiple UAVs [14]. Therefore, in an emergency scenario, unleashing the operational capabilities of multiple UAVs is a key issue in current UAV remote sensing operations.
In the military, UAV swarm networking has been developed and applied by relying on wireless network communications [15]. UAV swarm networking connects each UAV through a wireless network to form a whole unit, thus realizing cooperative control of the UAV swarm, avoiding equipping each UAV with a crew, and significantly reducing labor costs [16]. UAV swarm networking has received widespread attention, and the U.S. Department of Defense Advanced Research Projects Agency (DARPA) has conducted a series of UAV swarm networking research projects since 2000 [17]. The French “Neuron” UAV swarm networking project, by simulating the work of human neurons, can autonomously complete reconnaissance and strike against suspicious targets without ground control [18]. In 2016, China Electronics Technology Corporation (CETC) firstly established a multiple-UAV test prototype in China and verified the cooperative principle of 67 UAVs; in 2017, a flight test of 119 fixed-wing UAVs was completed by CETC [16]. Depending on whether there is a control center, UAV swarm networking can be divided into two categories: central and distributed networking architectures [19]. Central networking is more mature and widely used; therefore, this study was also performed under the central networking architecture.
UAV swarm networking not only reduces the number of crews, but also improves operational efficiency through the allocation of UAVs and tasks, i.e., scheduling of the UAV swarm [20]. UAV swarm scheduling is a method for constructing pairings of UAV tasks under constraints. Its objective is to establish a scientific and reasonable task execution sequence for each UAV based on task information, such as the locations, types, and numbers, by considering the number of UAV swarms and maximum flight range of a UAV.
The UAV swarm scheduling problem can be regarded as a discrete space combinatorial optimization problem under constraints, which falls under the scope of operational research [21]. The key is to establish a mathematically expressible objective function and effectively address the constraints [22]. Considering the task requirements, constraints, and UAV characteristics in a specific scenario, the UAV swarm scheduling problem can be viewed through several classic optimization problem models. The commonly used classic optimization problem models include the multiple traveling salesman problem (MTSP) [23], vehicle routing problem (VRP) [24], mixed-integer linear programming (MILP) [25], and cooperative multiple task assignment problem (CMTAP) [26].
The methods used to solve the UAV swarm scheduling problem include classic optimization methods and heuristic methods [27]. Most classic optimization methods are deterministic search methods, often used for offline task allocation with a small problem scale under a centralized architecture. In contrast to the classic optimization method, the heuristic method does not attempt to traverse the entire search space to obtain the optimal solution; rather, it obtains a feasible solution for the optimization problem in an acceptable time. Most of these methods imitate the phenomenon of natural populations. Commonly used algorithms include the ant colony algorithm (ACO) [28], genetic algorithm (GA) [29], particle swarm optimization algorithm (PSO) [30], and simulated annealing algorithm (SA) [31]. The PSO algorithm is widely used in scientific research and engineering as a simple, general, and robust method.
Currently, the UAV swarm scheduling method is mainly used for military reconnaissance scenarios, emphasizing UAV obstacle avoidance, target identification, and strikes, among others. For example, Jawad et al. proposed a method to reduce unnecessary power consumption of sensors and improve the overall energy consumption, and a congestion control method based on a thin-plate splines technique for maintaining formation and avoiding collisions of UAV swarms, respectively [32,33]. The core of the problem in remote sensing observation for emergency scenarios is the efficient execution of predefined data acquisition tasks, which are based on reciprocal full-coverage operations. Owing to the different number, location, and operational flight range of the tasks, the UAV swarm not only has to consider the distance of different tasks, but also the operational flight range of the tasks, which is no longer a simple multi-agent path planning problem; rather, it is a multi-objective optimal scheduling problem under different weights. Thus, the related results cannot be directly applied to the scheduling of multiple UAVs in emergency scenarios.
In 2020, flooding occurred in Poyang Lake, China; the disaster caused many villages to be flooded, and people’s lives and properties were seriously threatened. We were responsible for the UAV remote sensing observation of dozens of discrete affected villages. We used multiple UAVs to acquire remote sensing data from the affected villages by manual scheduling method. However, we found that this method was inefficient and limited the operational capabilities of the UAVs. We reviewed a lot of literature and did not find a suitable UAV swarm scheduling method that could meet the remote sensing observation requirements of emergency scenarios, so we proposed the UAV swarm scheduling method that is applicable to real-life remote sensing observation of emergency scenarios. Similarly to the objective of reference [33], is the aim is to improve the efficiency of UAV swarms.
The purpose of this study is to construct a multi-objective optimization UAV swarm scheduling method based on a central networking architecture for remote sensing during emergency scenarios. This provides a reference for multiple-UAV remote sensing observations in emergency scenarios.
2. Requirements Analysis
The UAV swarm scheduling problem in remote sensing observation for emergency scenarios refers to the means of creating a set of UAV swarm scheduling schemes that allows each UAV to fully utilize the operational capabilities to acquire remote sensing data from discrete distributed task areas (such as residential areas) in disaster areas of different sizes. The scheduling scheme consists of pairings of UAV tasks.
To facilitate the modeling and solution to the scheduling problem, we divided the complex problem into the following three sub-problems: establishing the constraint relationship between the flight range of the task and the flight capability of the UAV; establishing the constraint relationship between the total flight range of the task set and the flight capability of the UAV swarm; and modeling the task allocation of the UAV swarm and tasks set, so as to fully utilize the operational capabilities of each UAV.
Figure 1 shows a visual representation of this requirement analysis. This demonstrates that a flooding disaster has occurred in a specific place, with discrete distributed residential areas affected by the flood. The emergency rescue department decided to dispatch an emergency remote sensing vehicle loaded with a UAV swarm, composed of UAVs, to conduct remote sensing observations of these residential areas. In Figure 1, the yellow grids represent the tasks; the tasks surrounded by circles can be executed by the UAV swarm once, the red dots are the UAV takeoff and landing points, the delivery vehicle transports the swarm to each UAV takeoff and landing point to carry out tasks (disregarding the time of ground transfer), and each UAV carries out its respective corresponding task.
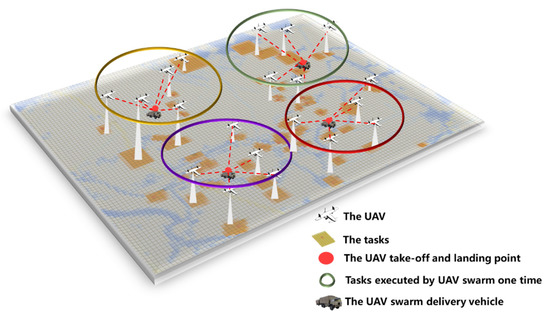
Figure 1.
Visual representation of UAV swarm scheduling for emergency scenarios.
3. Scheduling Method
The UAV swarm scheduling problem for remote sensing observations of emergency scenarios is a multi-objective optimization problem. The complexity of the problem increases rapidly with an increase in the number of UAVs and tasks. Therefore, obtaining the optimal solution within the substantial solution space in a short period is difficult. In contrast, emergency scenarios have high requirements for timeliness; this therefore requires a trade-off between the solution time and effectiveness of the solution. The solution to the complex problem is accomplished by separately solving the above three problems while considering the timeliness of the method. The method is divided into four parts: task formulation, task decomposition, task set decomposition, and task allocation, as shown in Figure 2. Task formulation and decomposition correspond to Problem 1, task set decomposition corresponds to Problem 2, and task allocation corresponds to Problem 3. The details are as follows.
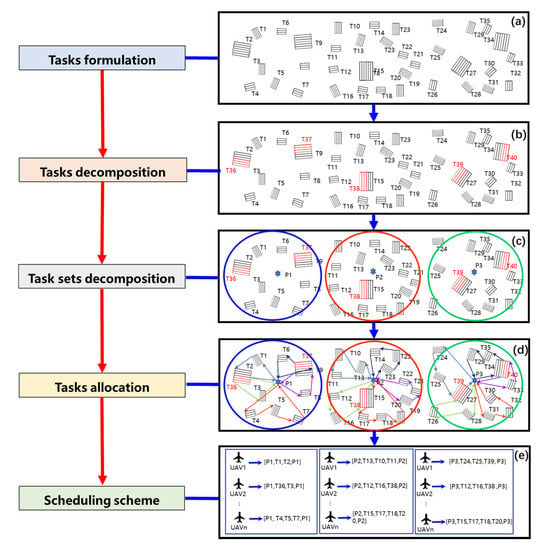
Figure 2.
Flow chart of the UAV swarm scheduling method. (a) Tasks formulation; (b) Tasks decomposition; (c) Task sets decomposition; (d) Tasks allocation; (e) Scheduling scheme.
3.1. Task Formulation
Task formulation refers to the remote sensing data acquisition tasks for the affected residential areas used by the disaster rescue department according to the situation and the need for decision-making support information, consistent with the mode of UAV data acquisition. Specifically, it includes determining the location, coverage, spatial resolution, overlap, operational flight range, and other parameters for each task. Different types of remote sensing sensors have different operational modes and calculation methods for their operational flight ranges. In order to facilitate the analysis, the task was limited to a visible-light mapping task (reciprocal full coverage of the task area) in this study. The operational flight range was determined according to the area coverage, spatial resolution, camera CCD pixel size, overlap, flight altitude, and other parameters for the task area, which was expressed as .
The operational flight range () was calculated as follows:
where is the operational flight range, is the area coverage, is the camera focal length, is the UAV (sensor) flight altitude, is the camera CCD pixel size, is the number of pixels perpendicular to the flight direction, and is the side overlap. The formula derivation process is not detailed here, but can be found in the literature [34].
The task was recorded according to its location, , and operational flight range, , which was denoted as ( was the number of tasks); all tasks were then aggregated to form the initial task set, , as shown in Figure 2a.
3.2. Task Decomposition
Task decomposition has two purposes: first, to ensure that the operational flight range of a task does not exceed the maximum flight range of a UAV, i.e., each task can be executed by a UAV once; second, to refine the task such that the operational capability of each UAV can be fully utilized. Task decomposition is based on the maximum flight range of a UAV. The operational flight range of the task is decomposed by the maximum flight range of the UAV and the weighting factor, and the weighting factor is set to take into account the range consumption of takeoff and landing; the result is rounded up, as follows:
where is the number of decomposed parts of task , is the upward rounding operator, is the operational flight range of task , is the maximum flight range of the UAV, and is the weighting factor, which is (0,1). The smaller the value, the more it can improve UAV operation utilization; however, it also increases the complexity of the calculation. Therefore, in practice, it can be flexibly adjusted.
Current methods of task decomposition include the area-based region segmentation method and the synthesizing UAV performance and area width method. Here, we used the area-based region segmentation method. After determining the number of decomposed parts, the tasks were decomposed such that they were parallel to the long edge of the task coverage. After task decomposition, the task set was updated to the new task set, , as shown in Figure 2b.
3.3. Task Set Decomposition
The purpose of task set decomposition is to decompose and execute the task set multiple times when the total operational flight range of the task set exceeds the maximum flight range of the UAV swarm. The maximum flight range of the UAV swarm is equal to the number of UAVs in the UAV swarm multiplied by the maximum flight range of the UAV:
where is the maximum flight range of the UAV swarm, is the number of UAVs in the swarm, and is the maximum flight range of the UAV.
The total flight range of the task set is equal to the operational flight range of all tasks in the task set, the transit flight range between the different tasks, and between the tasks and the UAV takeoff and landing points, as shown in the following equations:
where is the total flight range of the task set, is the total operational flight range, is the total transit range, is the number of tasks in the task set, is the number of UAVs in the UAV swarm, and and are the minimum and maximum distances between the different tasks and between the tasks and UAV takeoff and landing points, respectively. Shortening the total transit flight range is key to improving the operational efficiency of a UAV swarm.
A greater total flight range for the UAV swarm in a single execution yields enhanced exploitation of the operational capability of the UAV swarm. Based on the quantitative description of the relationship between the total flight range, , of the task set and the maximum range, , of the UAV swarm, we decomposed task set into several task subsets, , by combining the balanced restricted -means clustering method and the geometric median solution method. This generated the UAV takeoff and landing points, , corresponding to the task subsets. The specific steps were as follows.
3.3.1. Number of Task Subsets
Firstly, the number of task subsets was determined for the clustering of task subsets. The number of task subsets was determined by the total flight range of the task set and the maximum flight range of the UAV swarm, using the total flight range of the decomposed task set divided by the maximum range of the UAV swarm, with the result rounded up, based on the following equation:
where denotes the total flight range of the task set, denotes the maximum flight range of the UAV swarm, and denotes the number of task subsets. As the total transit range, , is uncertain (but much smaller than the total operational flight range, ), the initial calculation used the total operational flight range, , instead of the total flight range of task set, .
3.3.2. Clustering of Task Subsets
Task subset was obtained using a balanced restricted -means clustering method, where the value of the cluster (the number of cluster centers) used the number of task subsets, , obtained in Equation (7). Clustering was performed with the location coordinates of the tasks and operational flight range of the tasks as independent variables; the iterative objective was to ensure that the total operational flight range of the tasks within each cluster was balanced, expressed as follows:
Equation (8) is the computation of the operational flight range for each task subset, where is the operational flight range of task subset , is the number of tasks in task set , is the number of tasks in task subset , is the operational flight range of task , and is the decision variable ( is if the task belongs to a specific ; otherwise, it is ). Equation (9) is the objective function of the task subsets clustering, where is the minimized sum of the operational flight range for all task subsets, is the minimization operator, is the number of tasks in the task subset, is the task subset , and is the maximum flight range of the UAV swarm. Equation (10) represents the constraint of task subset clustering, which indicates that the task subset operational flight range should be less than the maximum flight range of the UAV swarm. We used the method described in [35] for balanced restricted k-means clustering.
3.3.3. Location Selection of the UAV Takeoff and Landing Points
After the clustering process, the task set was decomposed into task subsets. Next, the UAV takeoff and landing points were located for each task subset. The purpose of UAV takeoff and landing point selection is to ensure the minimization of the sum of the total transit flight range, so as to reduce unnecessary consumption. The principle is to minimize the sum of the distances from the takeoff and landing points to all tasks included in that task subset, which is referred to as the spatial median point, expressed as follows:
Equation (11) is the objective function for the location selection of the UAV takeoff and landing points, where is the minimized sum of the distances between the takeoff and landing locations and all tasks, is the minimization operator, is the number of tasks within the task subset, is the location of the takeoff and landing points, and denotes the calculated distance. We used the method in [36] to solve this problem and obtain the takeoff and landing locations corresponding to each subset of tasks.
3.3.4. Feasibility Analysis of the Decomposition Scheme
After the task subsets and corresponding locations of the UAV takeoff and landing points were determined, we verified whether the decomposition of the task set was successful. The analysis of the maximum flight range of the UAV swarm helps to calculate all distances based on the positions of the UAV takeoff and landing points corresponding to the tasks, and also helps to derive the upper and lower boundaries of the transit flight range of the task subsets. If the sum of the total operational flight range and the total transit flight range of the task subset is greater than or equal to the maximum flight range of the UAV swarm, the task subset must be re-decomposed, i.e., change the number of task subsets to and then repeat Equations (8)–(11), and vice versa. The solution for the task set decomposition is feasible, as shown in Equation (12). An analysis of the maximum flight range of a UAV is possible if the maximum distances between the different tasks and between the tasks and the UAV takeoff and landing points is greater than half of the maximum flight range of a UAV. In other words, if a UAV could not complete a single task, Equations (8)–(11) were repeated; otherwise, the solution for decomposition was feasible, as shown in Equation (13):
where is the number of task subsets, is the total operational flight range of the task subset, is the total transit flight range of the task subset, is the maximum flight range of the UAV swarm, is the number of UAVs in the UAV swarm, is the number of tasks in the task subset, is the maximum distance between the different tasks and between the tasks and the UAV takeoff and landing points in the task subset, and is the maximum flight range of the UAV.
3.3.5. Formation of Task Subset Decomposition Scheme
After Section 3.3.1, Section 3.3.2, Section 3.3.3 and Section 3.3.4, task subsets, , were finally obtained; each task subset included the tasks to which it belonged and the UAV takeoff and landing points for the task subset.
3.4. Task Allocation
For task subset , the task allocation model was constructed with the shortest total flight range of the task subset and the balanced flight range undertaken by each UAV as the scheduling objectives of the UAV swarm; all tasks within the task subset were executed as constraints.
3.4.1. Scheduling Scheme
The form of the scheduling schemes was as follows:
where is the scheduling scheme, is the task execution sequence of UAV , is the number of UAVs in the swarm, is task , and is the number of tasks undertaken by UAV .
3.4.2. Scheduling Objective Function
Based on the previous analysis, the factors affecting the operational efficiency of a UAV swarm are the total transit flight range and the imbalance in the total flight range of the tasks undertaken by different UAVs. The final completion time of a subset of tasks satisfies the “barrel effect”, i.e., it depends on the UAV that completes the latest tasks. Therefore, to improve the operational efficiency of the UAV swarm, we minimized the total flight range of the UAV swarm (the sum of the total operational flight range and total transit flight range) and equalized the total flight range of each UAV using variance minimization to equalize the total flight range of each UAV.
The total flight range assumed by a UAV was calculated as follows:
where is the total flight range of the UAV , is the total operational flight range of the UAV , is the total transit flight range of UAV , is the number of tasks undertaken by UAV , is task , is the operational flight range of the task, is the geometric distance from task to task , and is the UAV takeoff and landing point. The total transit flight range of the UAV consisted of three parts: (1) the distance from the takeoff and landing point to task , (2) the accumulation of the distances from task to task , and (3) the distance from task to the UAV takeoff and landing point.
The following equation was used to minimize the total flight range of the UAV swarm:
where is the optimization value, is the minimization operator, is the total flight range of UAV , and is the number of UAVs in the swarm.
Equation (20) minimizes the variance of the total flight range undertaken by each UAV:
where is the optimization value, is the average total flight range of all UAVs, and the other parameters are identical to those in Equation (19).
Equation (21) is the comprehensive optimization objective, taking the weighting sum of the two optimizations in Equations (19) and (20):
where is the optimization value, and are identical to that in Equations (19) and (20), and and are the weighting factors; we set the values of and to 0.5 in this study.
3.4.3. Scheduling Constraints
Equation (22) indicates that the total flight range of a UAV is less than its maximum flight range:
where is the total flight range of the UAV and is the maximum flight range of a UAV.
To ensure that each task in the task set was executed only once, the task completion rate was constrained by comparing the difference between the task set in the generated scheduling scheme and the original task subset for verification, requiring that they were exactly equal; the completion rate was then 100%. Each task must be executed in its entirety and only once, which can be expressed as the scheduling scheme and must include each task without duplication, as follows:
where is a task subset and is the task subset in the scheduling scheme.
3.4.4. Particle Swarm Optimization
The particle swarm optimization (PSO) algorithm was proposed by Kennedy et al. in 1995 [30]. Originally conceived to simulate social systems and examine complex social behavior, the PSO algorithm can be used to solve complex optimization problems. In the PSO, individuals, referred to as particles, “flow” through the hyper-dimensional search space; changes in the positions of particles in the search space are based on the psychosocial intention of a particle to successfully surpass other particles. Therefore, the experience or knowledge of neighbors influences the changes in a particle in a swarm; the search behavior of a particle is influenced by the search behavior of other particles in the swarm. The PSO algorithm provides fast computation and easy implementation of the algorithm itself. As the particle swarm migration process is directional, the search process uses the feedback principle and parallel computing technology, which have a higher search efficiency than other algorithms. Task allocation is a discrete variable problem; therefore, the PSO algorithm solves the optimization problem by discretizing the updated velocity and position of the particles. This is completed using the probabilistic rounding method proposed by Miranda [37], where the updated values of the velocity are rounded in proportion to the probability of the distance of each integer in the fetch space.
- Basic algorithm
Here, is denoted as particle , whose position variation is expressed as pairing between task and UAV . The best position it has experienced is denoted as and the index number of the best positions experienced by all particles in the population is denoted as . The velocity of particle is denoted by ; for each generation, is iterated according to Equations (24) and (25):
where is the linear decreasing weight, and are the learning constants, and are random values between 0 and 1, is the optimal position of each particle thus far, and is the optimal position of all particles up to the current occurrence.
During the search, the position of a particle is restricted to the maximum positive and negative ranges; if the position of a particle is beyond the maximum or minimum position, the position of the particle is returned to the maximum or minimum position. Similarly, the velocity of a particle is restricted between the maximum and minimum velocities as follows:
where and are the set maximum positive and negative velocities, respectively, within which the velocity of the particle is restricted.
- Algorithm workflow
In task allocation, the variables were taken as discrete values. When using the PSO algorithm for optimization, discretization of the variables must be performed: the position of the particles must be discretized; in contrast, the updated velocity must also be discretized. When utilizing the PSO algorithm, the requirements for the constraints (i.e., Equations (22) and (23)) must be satisfied. The position of particle movement represents the result of the task allocation represented by that particle. The number of tasks in the task subset is the dimensionality of the particle. The updated velocity of the particle is the variation in the pairings in the UAV task. Therefore, the final positions of the particles in each dimension should be mutually different in the optimization search process of the PSO algorithm, in which multiple iterations were used until the positions of all dimensional variables were different before continuing down the line. The specific steps were as follows:
- Step 1:
- particles were randomly generated and initialized with their positions and velocities; each particle represented a task allocation scheme.
- Step 2:
- The initial task allocation scheme was determined based on the initialized positions.
- Step 3:
- Using O5 as the objective function, the corresponding adaptation value (fitness) of the task allocation scheme was calculated and obtained.
- Step 4:
- The first-particle best position and the global best position were determined based on fitness.
- Step 5:
- The fitness obtained for the first time was considered the optimal fitness of each particle; the optimal fitness (the smallest) among the fitness values of all particles was selected as the global optimal fitness.
- Step 6:
- The velocity and position of each particle were updated according to the particle’s best position and global best position.
- Step 7:
- The fitness was calculated based on the new position.
- Step 8:
- The particle best and global best were updated again.
- Step 9:
- The best solution for this round was determined based on the best particle and global best.
- Step 10:
- Above process was continued until results converge to form the final scheme.
4. Simulation Experiment
4.1. Data and Materials
The effectiveness of the proposed UAV swarm scheduling method was tested through a simulation experiment conducted on the flooding of a delta polder in Poyang Lake, China, in July 2020. Following the flooding of the delta polder area, visible-light data were acquired for 52 affected residential areas. Table 1 lists the data acquisition task information, including the task ID, coordinates (WGS84, N50), and operational flight range. Figure 3 shows the spatial distribution of the tasks.

Table 1.
Data acquisition task information.
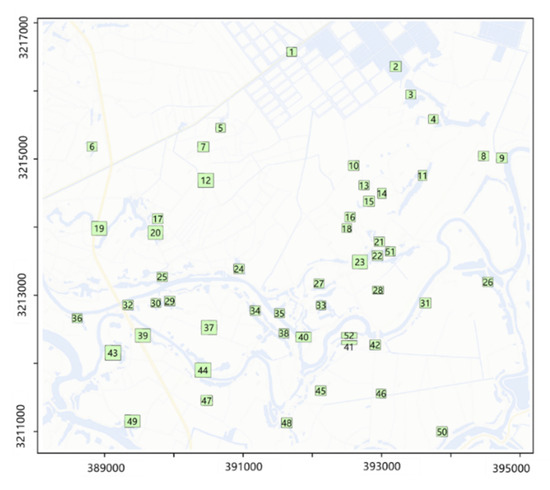
Figure 3.
Spatial distribution of the tasks.
The UAV swarm comprised five UAVs. The flight speed of the UAV was 15 m/s, endurance time was 1 h, the maximum flight range of the UAV was 36 km, and the maximum flight range of the UAV swarm was 180 km. The networking communication system adopted the TD-LTE scheme, as shown in Figure 4.
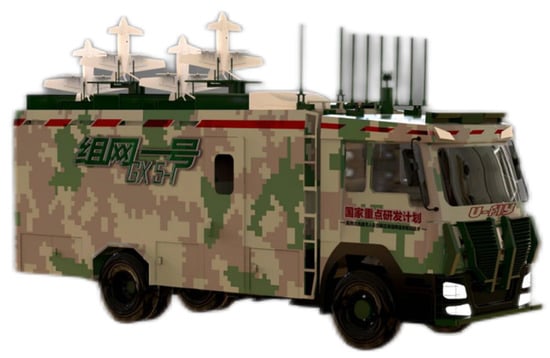
Figure 4.
UAV swarm under a centralized networking architecture.
4.2. Task Decomposition Results
We decomposed the tasks according to the methods in Section 3.2; the value of in Equation (2) was set to 0.2 by pre-testing, such that the original 52 initial tasks were decomposed into 193 new tasks. These new tasks formed a task set, as shown in Figure 5.
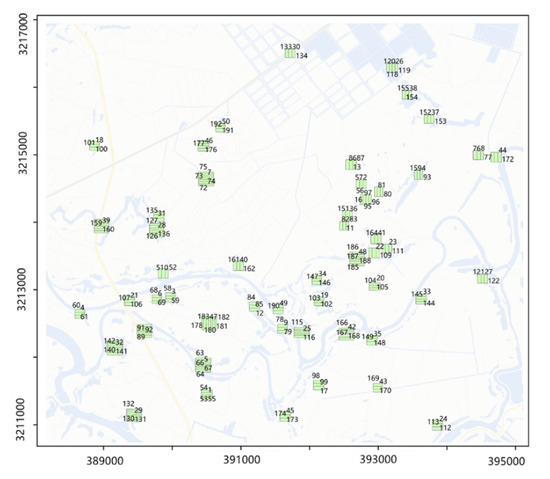
Figure 5.
Results of the task decomposition.
4.3. Task Set Decomposition Results
The aforementioned task set was decomposed using the methods described in Section 3.3; the number of task subsets was eight. For comparison, the same process was performed using generic K-means with a non-task balanced restriction (distance as the objective alone). Figure 6 shows the results of the task set decomposition. Figure 6a shows the results of the task set decomposition directly using the generic k-means; the number of tasks within different task subsets varied significantly. Figure 6b shows the results of task set decomposition based on the task-balanced restricted K-means; the number of tasks within different task subsets was approximately the same.
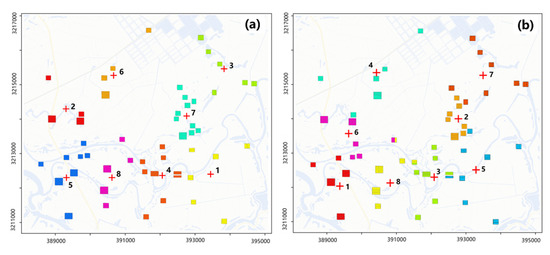
Figure 6.
Results of the (a) generic K-means and (b) task-balanced restricted K-means.
Table 2 lists the results of the task set decomposition for the generic K-means and task-balanced restricted K-means. The variance in the operational flight range between the task subsets for the generic K-means was 46.66 while that of the operational flight range between the task subsets for the balanced restricted K-means was 6.55. Variance is an indicator of the difference in operational flight range in different task subsets. A small value of variance indicates that the task-balanced restricted K-means can balance the operation flight range in different task subsets well, which can ensure that the operational capabilities of the UAV swarm can be fully exploited.

Table 2.
Results of the task set decomposition for the generic K-means and task-balanced restricted K-means.
4.4. Scheduling Scheme Results
The task subsets from the previous section were allocated using the task allocation model in Section 3.4 to form the pairings of the UAV task, which were aggregated to form the scheduling scheme, as listed in Table 3. The scheduling scheme included the task execution sequence of each UAV within each task subset. Based on the execution sequence, the transit flight range was calculated to obtain the total flight range and flight time; the average completion times of different UAVs executing tasks were calculated. In the sequence of task executions in Table 3, 0 represents the UAV takeoff and landing points while the other numbers indicate the number of tasks within each task subset. The operational flight range was the sum of the operational flight range of each task allocated to the UAV. The transit flight range was the sum of the range from the UAV takeoff and landing points to the execution of each task in turn and then back to the UAV takeoff and landing points. The total flight range was the sum of the operational flight range and transit flight range; the flight time indicates the time that was required for the UAV to execute all tasks. The average flight time was the average flight time for all UAVs while the total time was the overall completion time for all task subsets.

Table 3.
Results of the scheduling scheme.
Figure 7 shows the flight trajectories of the UAV swarm. The tasks linked by the same color line represent task sequences executed by the same UAV; the five different colored lines represent the five UAVs. The red crosses represent the UAV takeoff and landing points. The number indicates the different task subsets; a task with the same color indicates that it belongs to the same task subset.
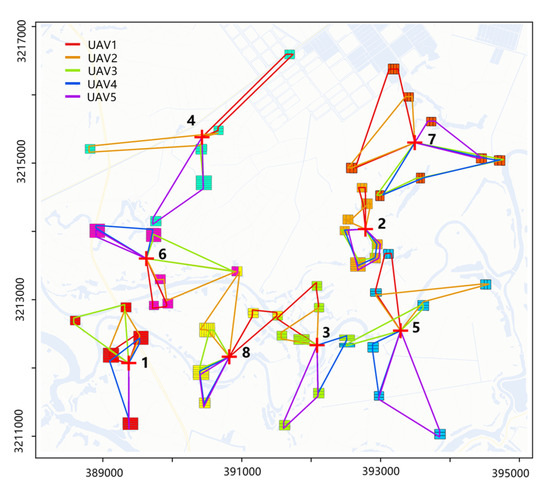
Figure 7.
Flight trajectories of the UAV swarm.
4.5. Comparison Results with the Manual Scheduling Method
To test the usability of the scheduling method, we compared it with the manual scheduling method of five crews (one crew controls a UAV) while the task set was manually decomposed into five task subsets. Here, one crew corresponded to one task subset, which was executed sequentially according to the task number, followed by calculating the total task set completion time. The turnaround time of the ground delivery vehicles was not included in the total time. Without decomposing the tasks, if the total range of a task exceeded the maximum range of a UAV, it was executed multiple times; meanwhile, we assumed that the manual preparation time for the UAV from landing to takeoff was 0.1 h.
Table 4 lists the results obtained by the manual scheduling method. There was significant variability in the completion times of the task subsets, with a maximum completion time of 9.23 h and a minimum completion time of 5.84 h; the average completion time for the entire task set was 7.34 h.

Table 4.
Results obtained via the manual scheduling method.
Figure 8 shows the flight trajectories of the UAVs using the manual scheduling method. The numbers indicate that the task set was decomposed into five subsets. Tasks with the same color indicate that they belonged to the same task subset. Tasks with the same color also represent the task sequences executed by the same UAV; the five different colored lines represent five UAVs. The red crosses represent the UAV takeoff and landing points.
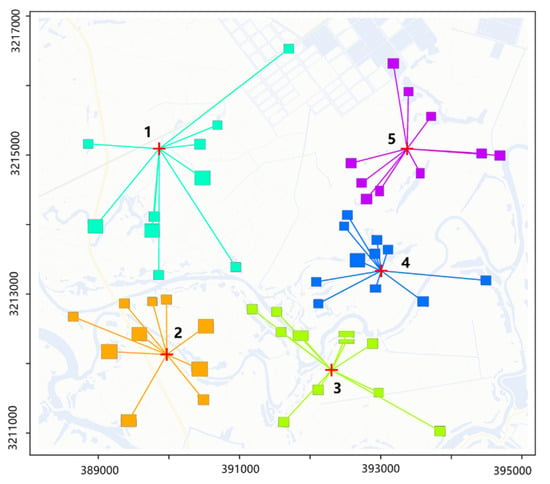
Figure 8.
Flight trajectories of the UAVs based on the manual scheduling method.
Table 5 compares the results of the UAV swarm scheduling method and those of manual scheduling. The operational flight range is the sum of the operational ranges of all tasks in the task set, which is 1206.1 km; The transit flight range is the distances between the different tasks and between the tasks and UAV takeoff and landing points. The smaller the value, the higher the efficiency. It can be seen that the range of the scheduling method is 95.92 km, which saves 16.97% compared with the 115.44 km range of the manual scheduling method. Total flight ranges are the sum of the operational flight range and transit flight range; Total sorties refer to the total number of UAV flights required to complete the task set. It can be seen that the total number of sorties of the scheduling method is 40, which saves 34.43% compared with the manual scheduling method. Flight range refers to the total range of the sorties; the average utilization rate of UAV refers to the real total flight range divided by the workable flight range, which reflects the operational capabilities of a UAV. It can be seen that the algorithm in this paper is 0.9, which is 50% higher than that of the manual scheduling method; it can also be seen that the scheduling method performs better than the manual scheduling method in transit flight range, total sorties and average UAV utilization, which shows the usability of the scheduling method.

Table 5.
Comparison of the UAV swarm scheduling method and manual scheduling.
4.6. Comparison Results with the Direct Allocation Method
In order to evaluate the efficiency of the scheduling method, we chose to compare it with the direct allocation method. Since the scheduling method is designed from the actual requirements of the application scenario, the solution is more complex; for example, the total flight range of the task set exceeds the maximum flight range of the UAV swarm, so it needs to be executed multiple times and the UAV takeoff and landing points are different each time, which are problems that cannot be solved by the direct allocation method. In order to meet the requirements of the direct allocation method, we chose to reduce the complexity of the problem in the experiment in the solution of the direct allocation method, including ignoring the transit flight range between the different tasks, and between the tasks and the UAV takeoff and landing points, ignoring the selection of UAV takeoff and landing points, and only considering the operational flight range of tasks. Meanwhile, according to the experimental results in part 4.4, the execution of the task set requires at least 40 sorties. Therefore, the number of UAVs is expanded to 40, so UAV– also represent UAV–, …, UAV–, respectively. Since the direct allocation method does not consider the transition range, we only take the minimum variance to minimize the total flight range of the UAV swarm as the optimization objective, and use the PSO algorithm in Section 3.4 as the solution algorithm. All conditions are unchanged in the scheduling method solution.
The two methods were tested 10 times, and the test results are shown in Table 6. It can be seen that the shortest convergence time of the direct allocation method is 20.1 s, and the average convergence time is 27.88 s; in contrast, the shortest average convergence time of the scheduling method is 1.11 s, and the average convergence time of the 10 test is 1.32 s. Since the task subsets are operated in parallel, the average convergence time of the task set was calculated. The time required for task set decomposition and the selection of takeoff and landing points is relatively short, so the time was not calculated. It can be seen that, compared with the direct allocation method, the scheduling method shortens the computation time by 93.43% under the condition that the task complexity is reduced to adapt to the direct allocation method. The results show that the scheduling method is more efficient compared to the direct allocation method.

Table 6.
Results data of 10 tests of the direct allocation method and the scheduling method.
Figure 9 shows the best fitness convergence curves of two methods in 10 tests, with the direct allocation method chosen for the 4th test and the scheduling method chosen for the 6th test. In Figure 9, the horizontal coordinate is the iteration time and the vertical coordinate is the fitness value (objective function value), which is restricted between 0 and 1 by linear transformation. It can be seen that the scheduling method can achieve convergence of the fitness values relatively quickly, as shown in Figure 9b–i, while the convergence time of the direct assignment algorithm is relatively slow as shown in Figure 9a. The reason is that the direct allocation method needs to assign 40 UAVs and 193 tasks, while for the scheduling method, after the decomposition of the task set and the selection of the UAV takeoff and landing points, the computational complexity is greatly reduced, so the convergence time is shorter, which also shows the high efficiency of the scheduling method.
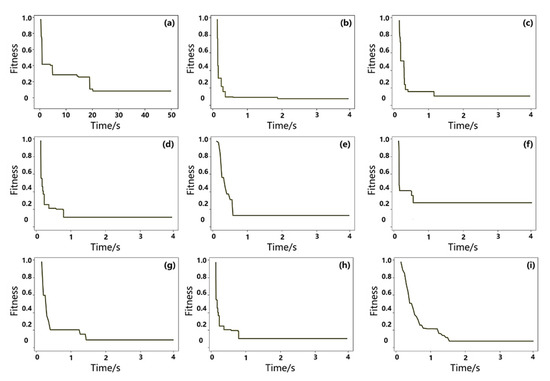
Figure 9.
The best fitness convergence curves of the two methods in 10 tests. (a) is the fitness convergence curve of the direct allocation method; (b–i) are the fitness convergence curves of task subsets 1–8, respectively.
5. Conclusions
In response to a lack of networking and low operational efficiency in multi-UAV operations in remote sensing observations for emergency scenarios, we proposed a UAV swarm scheduling method based on centralized networking architecture. The method establishes the relationship between the remote sensing observation tasks and UAV swarm observation capability. It decomposes the task set with UAV swarm observation capability as the constraint, thus reducing the complexity of UAV task scheduling. This method establishes a relationship between the task and UAV observation capability. Finally, it proposes a task decomposition method to ensure the executability of each task and the overall operational efficiency of the multiple UAVs. The UAV swarm scheduling method uses the total operational range of the task set as the constraint, establishes the task allocation model, and provides a set of procedures for the UAV swarm to carry out remote sensing observations in emergency scenarios.
Further research should include: the selection of UAV landing and takeoff points considering the influence of roads, i.e., the scheduling method should add road constraints; consideration of route planning of mission areas and the risk posed by the collision probability of multiple UAVs in adjacent task areas during flight; consideration of increasing the temporal constraints of missions from mission formulation; and the scheduling method also needs to consider compatibility with different data types, different sensors, and different UAVs.
Author Contributions
Funding acquisition, X.L.; Writing—original draft, J.L.; Writing—review & editing, H.Y. (Huping Ye), H.Y. (Huanyin Yue), Y.W., X.T. and D.W. All authors have read and agreed to the published version of the manuscript.
Funding
This work was funded by the Strategic Priority Research Program of the Chinese Academy of Sciences (No. XDA19050501), National Science and Technology Major Project of China's High Resolution Earth Observation System (No. 21-Y20B01-9001-19/22), the National Natural Science Foundation of China (Nos. 41971359, 41501416), the Scientific Instrument Developing Project of the Chinese Academy of Sciences, , Grant No. YJKYYQ20200010, the National Key Research and Development Program of China (No. 2017YFB0503005), the Key Research and Development Program of Jiangxi province (No. 20212BBG71008), and Tianjin Intelligent Manufacturing Project: Technology of Intelligent Networking by Autonomous Control UAVs for Observation and Application, No. Tianjin-IMP-2.
Institutional Review Board Statement
Not applicable.
Informed Consent Statement
Not applicable.
Data Availability Statement
Publicly available datasets were analyzed in this study. The data supporting the results of this study are available from the corresponding author upon reasonable request.
Conflicts of Interest
The authors declare no conflict of interest.
References
- United Nations. Hyogo Framework for Action: Building the Resilient of Nations and Communities to Disaster. In Proceedings of the World Conference on Disaster Reduction, Kobe, Japan, 18–22 January 2005. [Google Scholar]
- Alexander, D. Natural Disasters; Routledge: Oxfordshire, UK, 2018. [Google Scholar]
- Toya, H.; Skidmore, M. Economic Development and the Impacts of Natural Disasters. Econ. Lett. 2007, 94, 20–25. [Google Scholar] [CrossRef]
- Van, C. Remote Sensing for Natural Disaster Management. Int. Arch. Photogramm. Remote Sens. 2000, 33 Pt 7, 1609–1617. [Google Scholar]
- Poursanidis, D.; Chrysoulakis, N. Remote Sensing, Natural Hazards and the Contribution of Esa Sentinels Missions. Remote Sens. Appl. Soc. Environ. 2017, 6, 25–38. [Google Scholar] [CrossRef]
- Römer, H.; Kersten, J.; Kiefl, R.; Plattner, S.; Mager, A.; Voigt, S. Airborne Near-real-time Monitoring of Assembly and Parking Areas in Case of Large-scale Public Events and Natural Disasters. Int. J. Geogr. Inf. Sci. 2014, 28, 682–699. [Google Scholar] [CrossRef]
- Wang, C.; Zhang, H.; Wu, F.; Zhang, B.; Tang, Y.; Wu, H.; Wen, X.; Yan, D. Disaster Phenomena of Wenchuan Earthquake in High Resolution Airborne Synthetic Aperture Radar Images. J. Appl. Remote Sens. 2009, 3, 31690. [Google Scholar] [CrossRef]
- Nex, F. UAV Photogrammetry for Mapping and 3d Modeling–current Status and Future Perspectives. Int. Arch. Photogramm. Remote Sens. Spat. Inf. Sci. 2011, 38, 25–31. [Google Scholar]
- Bonet, I.; Caraffini, F.; Pena, A.; Puerta, A.; Gongora, M. Oil Palm Detection Via Deep Transfer Learning. In Proceedings of the 2020 IEEE Congress on Evolutionary Computation (CEC), Glasgow, UK, 19–24 July 2020; pp. 1–8. [Google Scholar]
- Yao, H.; Qin, R.; Chen, X. Unmanned Aerial Vehicle for Remote Sensing Applications—A Review. Remote Sens. 2019, 11, 1443. [Google Scholar] [CrossRef] [Green Version]
- Zhang, D.; Liu, J.; Ni, W.; Sun, G.; Zhang, Z.; Liu, Q.; Wang, Q. Estimation of Forest Leaf Area Index Using Height and Canopy Cover Information Extracted from Unmanned Aerial Vehicle Stereo Imagery. IEEE J. Sel. Top. Appl. Earth Obs. Remote Sens. 2019, 12, 471–481. [Google Scholar] [CrossRef]
- Liao, X.; Zhang, Y.; Su, F.; Yue, H.; Ding, Z.; Liu, J. UAVs Surpassing Satellites and Aircraft in Remote Sensing Over China. Int. J. Remote Sens. 2018, 39, 7138–7153. [Google Scholar] [CrossRef]
- Boccardo, P.; Chiabrando, F.; Dutto, F.; Tonolo, F.G.; Lingua, A. UAV Deployment Exercise for Mapping Purposes: Evaluation of Emergency Response Applications. Sensors 2015, 15, 15717–15737. [Google Scholar] [CrossRef] [Green Version]
- Zohdi, T.I. Multiple UAVs for Mapping: A Review of Basic Modeling, Simulation, and Applications. Annu. Rev. Environ. Resour. 2018, 43, 523–543. [Google Scholar] [CrossRef] [Green Version]
- Xiaoning, Z. Analysis of Military Application of UAV Swarm Technology. In Proceedings of the 2020 3rd International Conference on Unmanned Systems (ICUS), Harbin, China, 27–28 November 2020; pp. 1200–1204. [Google Scholar]
- Campion, M.; Ranganathan, P.; Faruque, S. UAV Swarm Communication and Control Architectures: A Review. J. Unmanned Veh. Syst. 2018, 7, 93–106. [Google Scholar] [CrossRef]
- Sanders, A.W. Drone Swarms; US Army School for Advanced Military Studies Fort Leavenworth United States: Fort Leavenworth, KS, USA, 2017. [Google Scholar]
- Duan, H.; Shao, S.; Su, B.; Zhang, L. New development thoughts on the bio-inspired intelligence based control for unmanned combat aerial vehicle. Sci. China Technol. Sci. 2010, 53, 2025–2031. [Google Scholar] [CrossRef]
- Yu, J. When UAVs Have Swarm Intelligence. People’s Dly. 2017, 7, 1. [Google Scholar]
- Zang, C.; Zang, S. Mobility Prediction Clustering Algorithm for Uav Networking. In Proceedings of the 2011 IEEE Globecom Workshops (GC Wkshps), Houston, TX, USA, 5–9 December 2011; pp. 1158–1161. [Google Scholar]
- Edison, E.; Shima, T. Integrated Task Assignment and Path Optimization for Cooperating Uninhabited Aerial Vehicles Using Genetic Algorithms. Comput. Oper. Res. 2011, 38, 340–356. [Google Scholar] [CrossRef]
- Casbeer, D.W.; Holsapple, R.W. Column Generation for a UAV Assignment Problem with Precedence Constraints. Int. J. Robust Nonlinear Control 2011, 21, 1421–1433. [Google Scholar] [CrossRef]
- Bektas, T. The Multiple Traveling Salesman Problem: An Overview of Formulations and Solution Procedures. Omega 2006, 34, 209–219. [Google Scholar] [CrossRef]
- Gendreau, M.; Laporte, G.; Potvin, J. The Vehicle Routing Problem; SIAM: Philadelphia, PA, USA, 2002; pp. 129–154. [Google Scholar]
- Schumacher, C.; Chandler, P.R.; Pachter, M.; Pachter, L.S. Optimization of Air Vehicles Operations Using Mixed-integer Linear Programming. J. Oper. Res. Soc. 2007, 58, 516–527. [Google Scholar] [CrossRef]
- Shima, T.; Rasmussen, S.J.; Sparks, A.G.; Passino, K.M. Multiple Task Assignments for Cooperating Uninhabited Aerial Vehicles Using Genetic Algorithms. Comput. Oper. Res. 2006, 33, 3252–3269. [Google Scholar] [CrossRef]
- Hu, X.; Ma, H.; Ye, Q.; Luo, H. Hierarchical method of task assignment for multiple cooperating UAV teams. J. Syst. Eng. Electron. 2015, 26, 1000–1009. [Google Scholar] [CrossRef]
- Dorigo, M.; Birattari, M.; Stutzle, T. Ant Colony Optimization. IEEE Comput. Intell. Mag. 2006, 1, 28–39. [Google Scholar] [CrossRef]
- Mirjalili, S. Evolutionary Algorithms and Neural Networks; Springer: Berlin/Heidelberg, Germany, 2019; pp. 43–55. [Google Scholar]
- Kennedy, J.; Eberhart, R. Particle Swarm Optimization. In Proceedings of the Icnn’95-Onternational Conference on Neural Networks, Perth, WA, Australia, 27 November–1 December 1995; pp. 1942–1948. [Google Scholar]
- Van laarhoven, P.J.; Aarts, E.H. Simulated Annealing: Theory and Applications; Springer: Berlin/Heidelberg, Germany, 1987; pp. 7–15. [Google Scholar]
- Li, Q.; Liu, X.; Li, R.H.; Feng, Z.; Li, Z.; Zhao, H. Networking Remote Sensing Simulation Track Planning Based on Field Station. J. Geo-Inf. Sci. 2021, 23, 948–957. [Google Scholar]
- Yasin, J.N.; Haghbayan, M.H.; Yasin, M.M.; Plosila, J. Swarm Formation Morphing for Congestion-aware Collision Avoidance. Heliyon 2021, 7, e07840. [Google Scholar] [CrossRef] [PubMed]
- Yasin, J.N.; Mahboob, H.; Haghbayan, M.H.; Yasin, M.M.; Plosila, J. Energy-efficient Navigation of an Autonomous Swarm with Adaptive Consciousness. Remote Sens. 2021, 13, 1059. [Google Scholar] [CrossRef]
- Malinen, M.I.; Fränti, P. Balanced K-means for Clustering. In Proceedings of the Joint IAPR International Workshops on Statistical Techniques in Pattern Recognition (SPR) and Structural and Syntactic Pattern Recognition (SSPR), Joensuu, Finland, 20–22 August 2014; Springer: Berlin/Heidelberg, Germany, 2014; pp. 32–41. [Google Scholar]
- Vardi, Y.; Zhang, C. The Multivariate L1-median and Associated Data Depth. Proc. Natl. Acad. Sci. USA 2000, 97, 1423–1426. [Google Scholar] [CrossRef] [Green Version]
- Miranda, V.; Fonseca, N. Epso-evolutionary Particle Swarm Optimization, a New Algorithm with Applications in Power Systems. In Proceedings of the IEEE/PES Transmission and Distribution Conference and Exhibition, Yokohama, Japan, 6–10 October 2002; pp. 745–750. [Google Scholar]
Publisher’s Note: MDPI stays neutral with regard to jurisdictional claims in published maps and institutional affiliations. |
© 2022 by the authors. Licensee MDPI, Basel, Switzerland. This article is an open access article distributed under the terms and conditions of the Creative Commons Attribution (CC BY) license (https://creativecommons.org/licenses/by/4.0/).