Technical Note

Distinct Susceptibility Patterns of Active and Relict Landslides Reveal Distinct Triggers: A Case in Northwestern Turkey

1
Institute of Hydrogeology, Engineering Geology and Applied Geophysics, Faculty of Science, Charles University, 12843 Prague, Czech Republic
2
Faculty of Geo-Information Science and Earth Observation (ITC), University of Twente, 7514 Enschede, The Netherlands
3
Eurasia Institute of Earth Sciences, Istanbul Technical University, Istanbul 34469, Turkey
*
Author to whom correspondence should be addressed.
Remote Sens. 2022, 14(6), 1321; https://doi.org/10.3390/rs14061321
Submission received: 25 February 2022 / Revised: 2 March 2022 / Accepted: 4 March 2022 / Published: 9 March 2022
(This article belongs to the Topic Natural Hazards and Disaster Risks Reduction)

Abstract

:
To understand the factors that make certain areas especially prone to landslides, statistical approaches are typically used. The interpretation of statistical results in areas characterised by complex geological and geomorphological patterns can be challenging, and this makes the understanding of the causes of landslides more difficult. In some cases, landslide inventories report information on the state of activity of landslides, adding a temporal dimension that can be beneficial in the analysis. Here, we used an inventory covering a portion of Northwestern Turkey to demonstrate that active and relict landslides (that is, landslides that occurred in the past and are now stabilised) could be related to different triggers. To do so, we built two landslide susceptibility models and observed that the spatial patterns of susceptibility were completely distinct. We found that these patterns were correlated with specific controlling factors, suggesting that active landslides are regulated by current rainfalls while relict landslides may represent a signature of past earthquakes on the landscape. The importance of this result resides in that we obtained it with a purely data-driven approach, and this was possible because the active/relict landslide classification in the inventory was accurate.

1. Introduction

Data-driven models can be thought as empirical tools that extract functional relationships from past phenomena to estimate the expected behaviour of the same phenomena in a pre-defined (or ill-defined) future. This framework is commonly referred to as Hutton’s uniformitarian principle, and is more commonly translated as the past is the key to the future [1,2,3]. Hutton first and subsequently Lyell helped to develop and spread the concept of uniformitarianism, replacing the then prevailing idea of catastrophism. Since then, this concept has formed the backbone of any landslide susceptibility study [3].
Landslide susceptibility models (LSM) can be used to predict the spatial occurrence of future landslides by assuming, consistently with the uniformitarian principle, that in any given area, slope failures will occur under the same circumstances and because of the same conditions that caused them in the past. However, this principle may not always hold true [4]. First-failure landslides and reactivations may have different controls, acting both on their triggers and kinematics: think of the peak and residual shear strengths, or the role of strong earthquakes as opposed to aftershocks or rainfall [5]. Changes in material properties also are reflected in morphological changes which, in turn, affect the process dynamics [6].
Uniformitarianism still represents a fundamental component of the literature [7,8,9,10,11,12], albeit the current climate change has led us to question its present-day validity [13]. In fact, data-driven models are generally built upon the effects of past events, which may not inform on the slope response to events of different nature in the future. This topic is hardly addressed in the literature as it requires an understanding not only of the evolution of the triggers, but also of the predisposing or preparatory conditions. These may behave differently in time [4], reflecting changes in mechanical [14], hydrological and hydraulic [15], or thermal conditions [13,16].
Moreover, the complexity of a seismically active area does not help perform a straightforward analysis and interpretation of both the predisposing and triggering factors. This is true, for instance, in Turkey (Figure 1a), where the huge variability and complexity of the territory makes the modelling difficult to tackle. The capability and feature of an existing landslide inventory [17], able to discern relict (termed “inactive” in the inventory) from active landslides, comes to our aid as it could enable the distinction of different processes in place and their drivers. Moreover, especially for active landslides, the definition of the main triggering factors is crucial for the evaluation of economic costs related with the frequency and magnitude of disaster events [18].
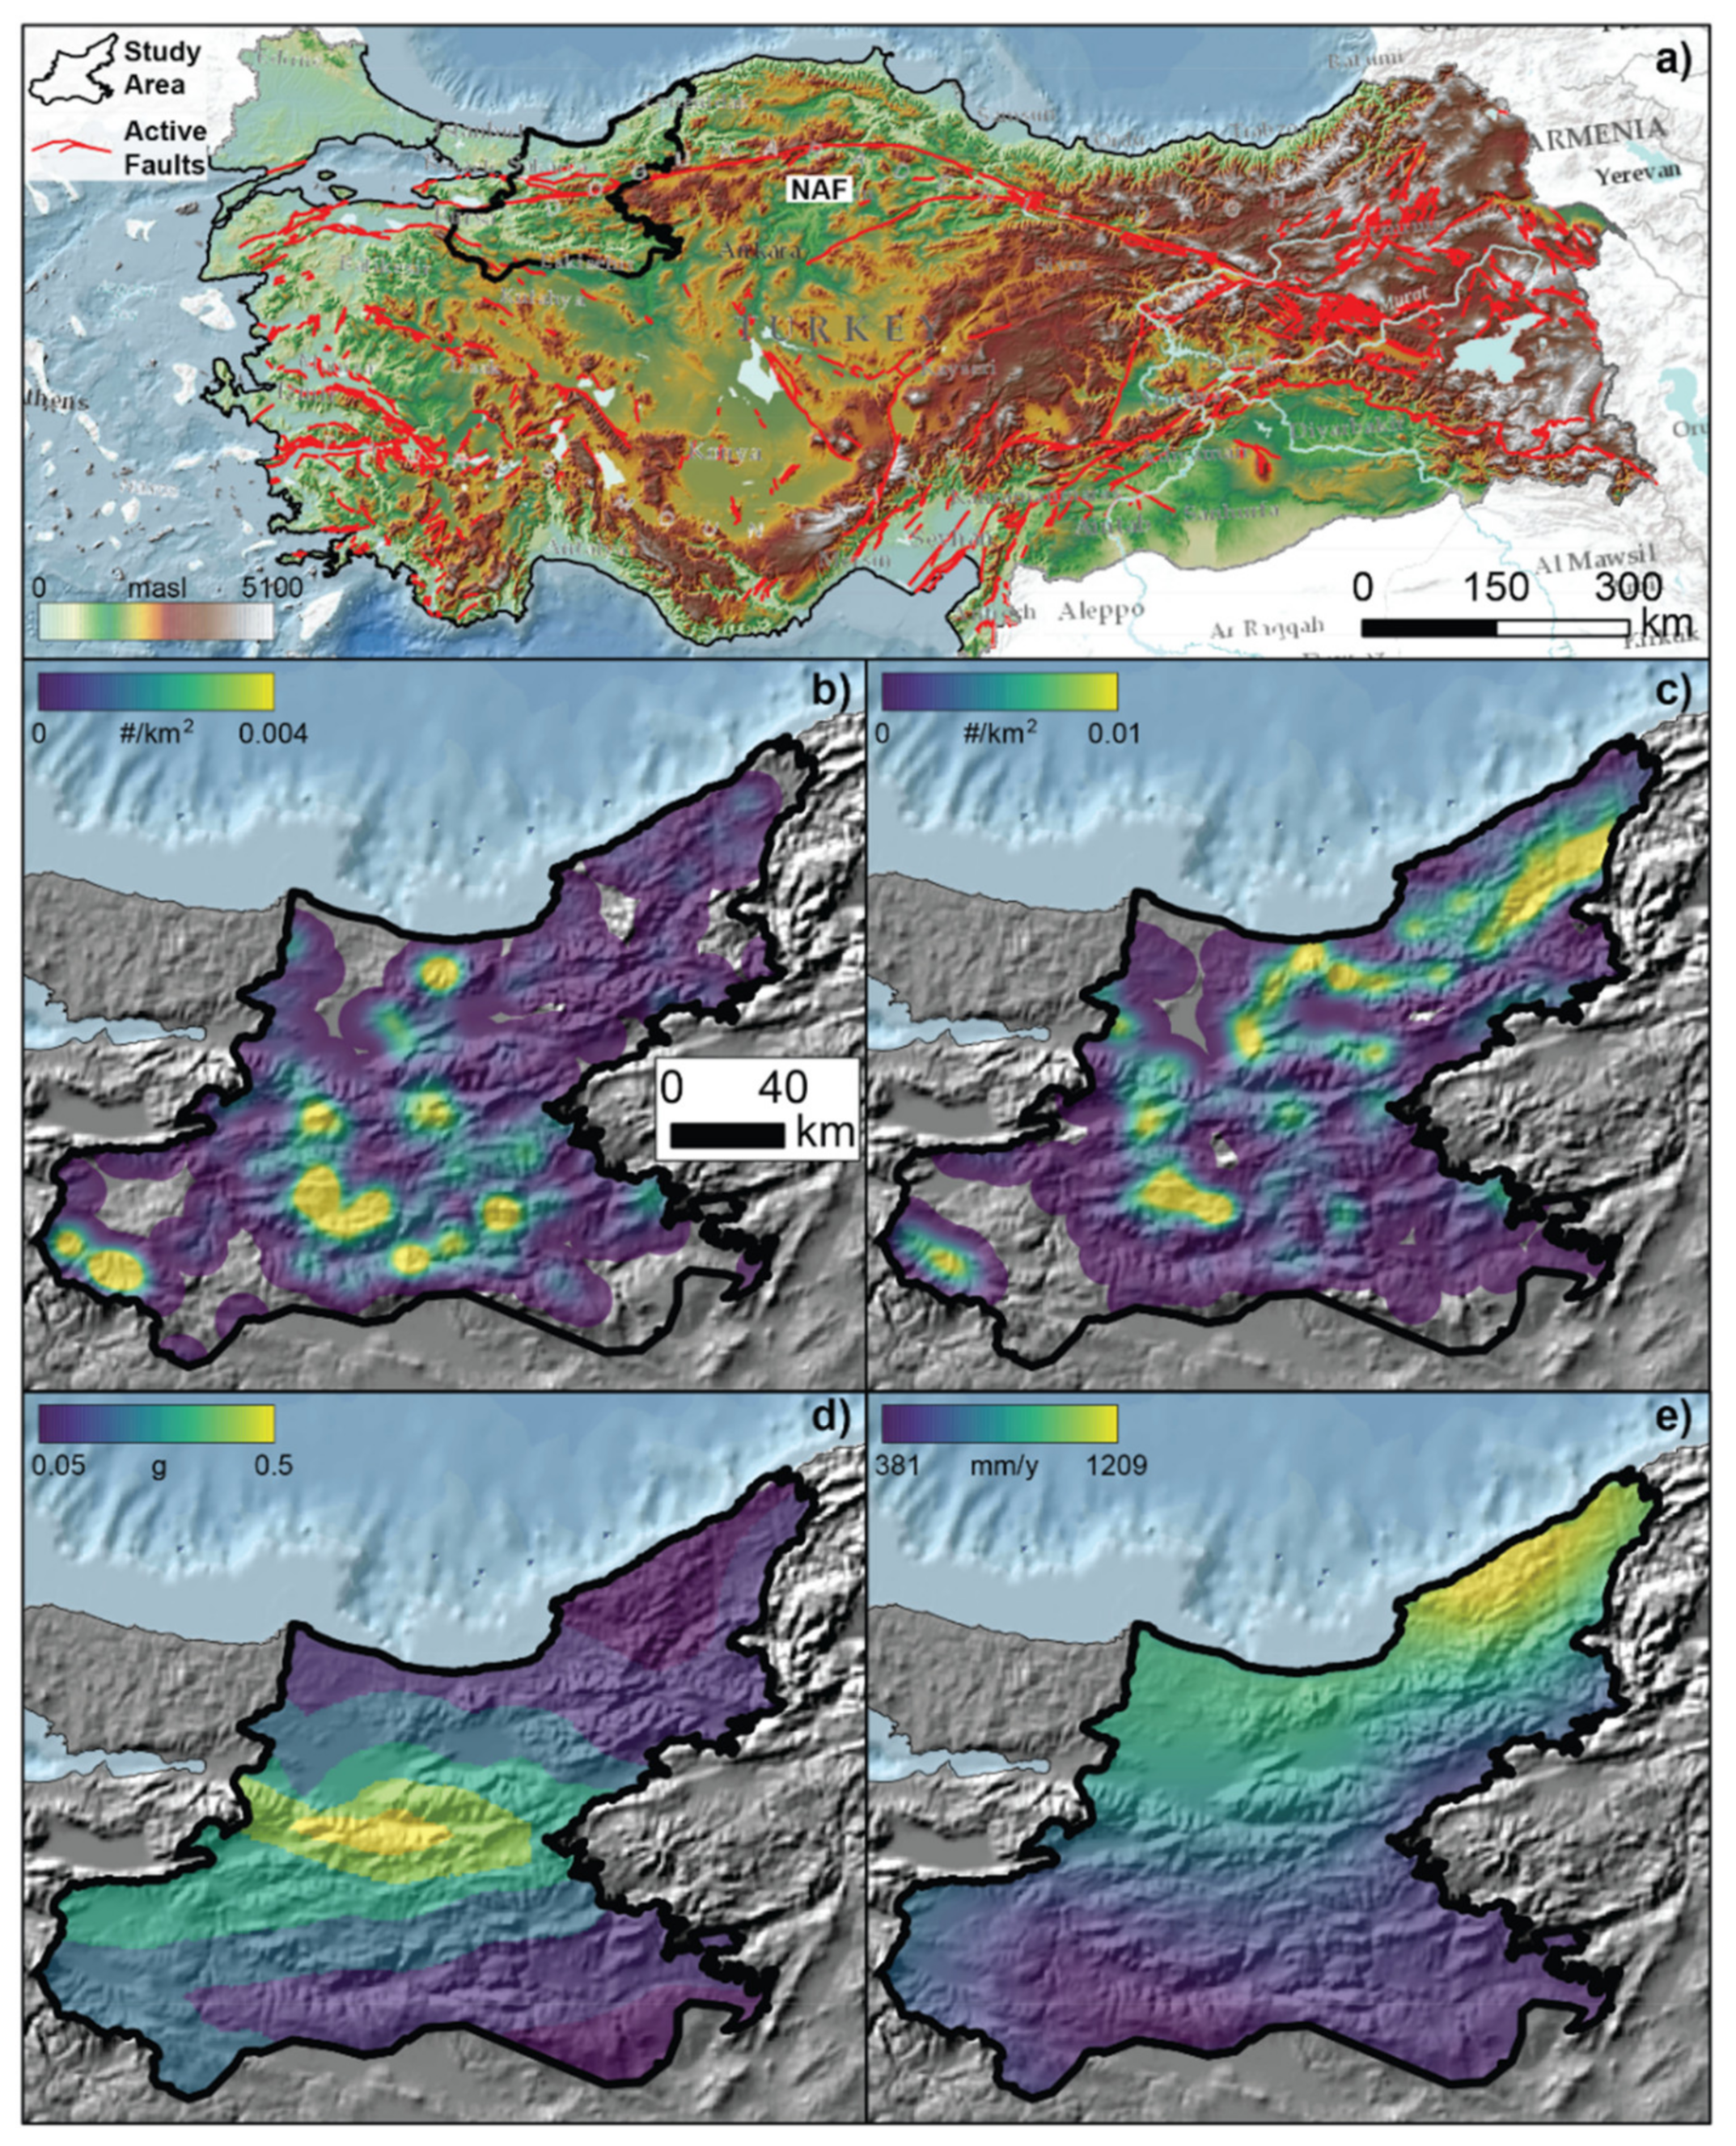
Seismically active areas may contain many landslide bodies. The seismic shaking likely triggers their first movement, while subsequent remobilisations become increasingly related to different triggers and predisposing factors as time goes by [16,19]. Different triggers can also produce distinct patterns in space [20]. In Northwestern Turkey, which we took as our study area, we can discern two sub-areas: the North Anatolian fault region in the southwest, characterised by a higher density of relict bodies, and the region close to the Black Sea in the northeast, richer in active ones (Figure 1b,c). These sub-areas display an attitude of surface processes to be related to distinct triggers: seismicity and rainfall (Figure 1d,e). However, these differences may be difficult to discern in an inventory in which landslide types or activity states or stages are not classified.
The effect of biases in susceptibility modelling has been explored in the literature [21,22,23]. The necessity to operate with an unbiased area [24,25] led us to focus on a specific sector in Northwester Turkey, rich in landslides but not too tectonically complex, and sufficiently geologically and geomorphologically homogeneous.
In terms of modelling approaches, the literature offers many options. We opted for the Generalised Additive Model (GAM; [15,26]), which can explain the spatial distribution of landslides via a family of Bernoulli exponential functions, in which the influence of the covariates can be captured via linear and nonlinear relationships. As such, the approach allows us to display the uncertainties in the estimations, which are intrinsically part of a Bayesian framework [27]. This statistical implementation is utilised here for the first time to investigate relationships between two distinct models covering the same area but differing by a categorical entity (active/inactive landslide). Furthermore, we decided to use Slope Units (SUs) as they are geomorphologically-consistent subdivisions that can be linked with landslide processes and are thus preferrable to grid-based subdivisions [28,29,30,31].

2. Study Area

The geology and geomorphology of Turkey is unique and extremely complex, owing to both past and ongoing processes in place. Various studies exist [32,33,34,35,36], in which the national settings are dissected per geological history and geomorphological processes. Figure 1 displays the large-scale geomorphological and geological features.
The diversity of morphologies derives from a geodynamic environment that is still quite active and determines a variety in outcropping lithologies [35]. Three main landslide-dominated landscapes are recognised, corresponding to the tectonostratigraphically-distinct Western, Central, and Eastern Pontides [37]. The lithological units forming the Pontides vary along the belt, featuring west-east-oriented sub-parallel bands of sedimentary, metamorphic, and igneous rocks. While the western portion is richer in Triassic to Paleogene sedimentary and medium-grade metamorphic outcrops, the central zone comprises Eocene volcaniclastic and sedimentary rocks and Palaeozoic metamorphic rocks, and the eastern zone features Paleogene and Cretaceous plutonic and igneous formations underlying Eocene and Neogene sedimentary and volcanic formations [38].
The portion chosen as our study area (Figure 1) corresponds to the Zonguldak quadrangle in the Western Pontides. Here, the North Anatolian Fault System (NAFS) produced a landform dominated by mountain belts and plateaus. The NAFS is an over 1600 km long, right-lateral strike-slip, active transform fault running along Northern Anatolia in the E–W direction, that also separates the study area in a southern and a northern sector (Figure 1a).
Climatically, the area belongs to the Black Sea climatic region in the north and the continental inner Anatolian climatic region in the southeast [39]. The former receives rainfall throughout the year (>1000 mm mean annual precipitation, up to 2300 mm in its eastern portion) [39]. The north-facing slopes of the coastal mountain belt are comparatively wetter as they intercept the weather fronts, and this is reflected by a relative abundance of landslides (Figure 1e). Precipitation decreases southward, where the Palaeocene-Eocene flysch and Palaeocene-Middle Miocene volcanics are the most landslide-prone units [39].
Figure 1. Identification of the study area in Turkey and the North Anatolian Fault (a); density maps of inactive (b) and active (c) landslides (see Section 2.2 for definitions); Peak Ground Acceleration map (d) from [40]; mean annual precipitation map (e) from [41].
Remotesensing 14 01321 g001

2.1. Mapping Units

We used SUs as terrain partitions characterised by similar hydrological and geomorphological conditions [42]. Each SU has a distinct shape given by the interplay between lithotypes and morphometries, and thus offers morphological and lithological characteristics that can be analysed statistically. An SU-based subdivision is not the only possible choice. In fact, most contributions in the literature opt for a regular lattice or pixel-based subdivisions [3]. These, however, even though they can be expressed at a fine to very-fine resolution, do not reflect any natural characteristics. Conversely, SUs can, better than pixels, represent geomorphological processes (e.g., [43,44]) and, at the same time, reduce the computational burden, especially in models covering large areas (in our case, SU-based calculations are ~100 faster than pixel-based ones).
We used the r.slopeunits software [28]) to generate SUs. Specifically, we subdivided the study area into SUs [28,29,30,45]. We computed 50,104 SUs, covering ~24,000 km2 out of ~29,400 km2 of the study area as we excluded flat areas that are not prone to landslides (Figure 2) [31,46,47].

2.2. Landslides

The landslide inventory was compiled by the General Directorate of Mineral Research and Explorations of Turkey (MTA) and published in 1:25,000 scale for the entire national territory (http://yerbilimleri.mta.gov.tr/, accessed on 1 February 2022). It is a general polygon-based-inventory that carries some complexities because the mapped phenomena are related to a plurality of causes. Thus, the identification of unstable areas should benefit from the use of as many variables as possible to discern the main factors affecting slope stability.
The catalogue [39], within our study area, comprises 4084 active landslides and 1140 inactive landslides. The former are those that were moving at the time of mapping (1997–2003), while the latter could be classified as relict according to the UNESCO Working Party on World Landslide Inventory (1993) [48]. Qualitatively, we notice an abundance of active phenomena in the northeastern area where the climatic influence of the Black Sea is stronger. A less dense but significant presence of landslides can be seen in the southwestern sector (Figure 2).
We extracted the highest point in the landslide polygon to better represent the source material and/or lithology [49,50]. Subsequently, separately for each model, we reported the count of active or inactive landslides within each SU, attributing the presence of landslides to those SUs containing at least one point. Finally, we identified 2822 SUs (X% of SUs) with active phenomena, and 983 (Y%) with inactive phenomena.

3. Modelling Strategy

In a binomial GAM, the data (y) are assumed to be conditionally independent given the linear predictor η:
yi | ηi ∼ Binomial (Ni, pi)
ηi = pi ⁄ (1−pi)
where pi is the binomial probability.
Here, we assume Ni = 1 for all i because we have binary data. The ηi as a function of pi is called the link function, and we describe it using a logit, but we note that other link functions are possible. The linear predictor η is where we put the additive model:
ηi = β1x1,i + ... + βmxm,i + f(Slope) + f(Precipitation),
where βj are the fixed (or linear) effects, with weak priors, describing the linear relationship of the covariates xj. Each f represents a random (or nonlinear) effect with
f ∼ N (0, τ−1)
and τ is a constant. For the two f, we use a spline model, also referred to as Random Walk of the first order (RW1; [51])
A RW1 induces adjacent class dependence among mean slope and precipitation bins, respectively [52]. The whole implementation makes use of the INLA framework [46,47].
To quantitatively compare the inventories of active and inactive landslides, we relied on the effects of the selected covariates. Active and inactive phenomena should present distinct correlations with physical variables owing to changes in predisposing and triggering conditions as well as their values. For instance, active and inactive phenomena could be characterised by distinct distributions of slope angles or vegetation coverage. However, while morphological and climatic factors can change rather rapidly, geological, lithological, and structural factors are not expected to vary over human time scales (in absence of catastrophic events).
Possible multicollinearity issues among covariates (Figure S1) were eliminated by discarding those showing more than 0.75 collinearity with another covariate [53,54,55]. The final list of covariates is reported in Table 1. We preferred covariates that are well known in the literature [3,56], and analysed their linear effects in most cases. We investigated the nonlinear effect of slope and precipitation to better capture the role of gravitative-hydrological processes in landsliding.
For model fitting, we used the whole sets of active and inactive landslides (separately). For validation, we used a tenfold Cross Validation (CV) with mutually exclusive subsets, implying that no SUs are repeated across CV replicates, and thus, there is no autocorrelation [57]. We used the Area Under the Receiving Operating Characteristic Curve (AUC) and the confusion matrix to evaluate the model performance. This is not the only possibility. In fact, new articles suggest a spatial CV with connected packages [58,59,60]. However, this solution is still under discussion [61], which is why we preferred to use a pre-consolidated methodology.
Table 1. List of covariates. L and NL indicate that the linear and nonlinear effects were investigated, respectively. SD stands for standard deviation. All values are calculated within each SU.
NameAbbreviationReferenceUsage in the
Inventory
InactiveActive
Mean slopeSlope[62]NLNL
SD of slopeSlopeσ[62]LL
Mean RainfallPrecipitation[5]NLNL
Mean peak ground accelerationPGAμ[5]LL
Topographic reliefReliefμ[35]LL
Elongation of the SUElongation[46]LL
Mean EastnessESTμ[50]LL
Mean NorthnessNRTμ[50]LL
SD of NorthnessNRTσ[50]LL
SD of planar curvaturePLCσ[63]LL
Mean profile curvaturePRCμ[63]LL
Mean Relative slope position RSPμ[64]LL
SD of Relative slope position RSPσ[64]LL
Mean topographic wetness indexTWIμ[64]LL
SD of topographic wetness indexTWIσ[64]LL
Mean Stream power index SPIμ[65]LL
SD of Stream power index SPIσ[65]LL
Mean Distance to FaultD2Fμ[15]LL
SD of Distance to FaultD2Fσ[15]LL

4. Results

We report the outcomes of the so-called fitting (within sample) and cross-validation (out of sample) procedures. The former is used to interpret the patterns of the explanatory variables, while the latter is a tool for model validation. We then produce two susceptibility maps (that is, two spatial probability maps), one for the active landslides, and one for the relict landslides. These maps are compared with those of a number of explanatory variables, to seek common patterns. It should be stressed that the susceptibility maps are intended as descriptions of past/present phenomena and not as a temporal prediction tool.

4.1. Distinct Patterns of Explanatory Variables

The main tool that we can use to evaluate the extent to which the classification into inactive and active landslides relates to distinct controlling factors is the analysis of the effects of these factors, represented by sets of covariates in the statistical model. We believe, in fact, that inactive and active landslide phenomena should be spatially correlated with physical variables in a distinct way. Predisposing factors that cause landslides must be congruent in inactive as well as in active landslides. Hence, what should stand out the most is that the predisposing factors can change over time.
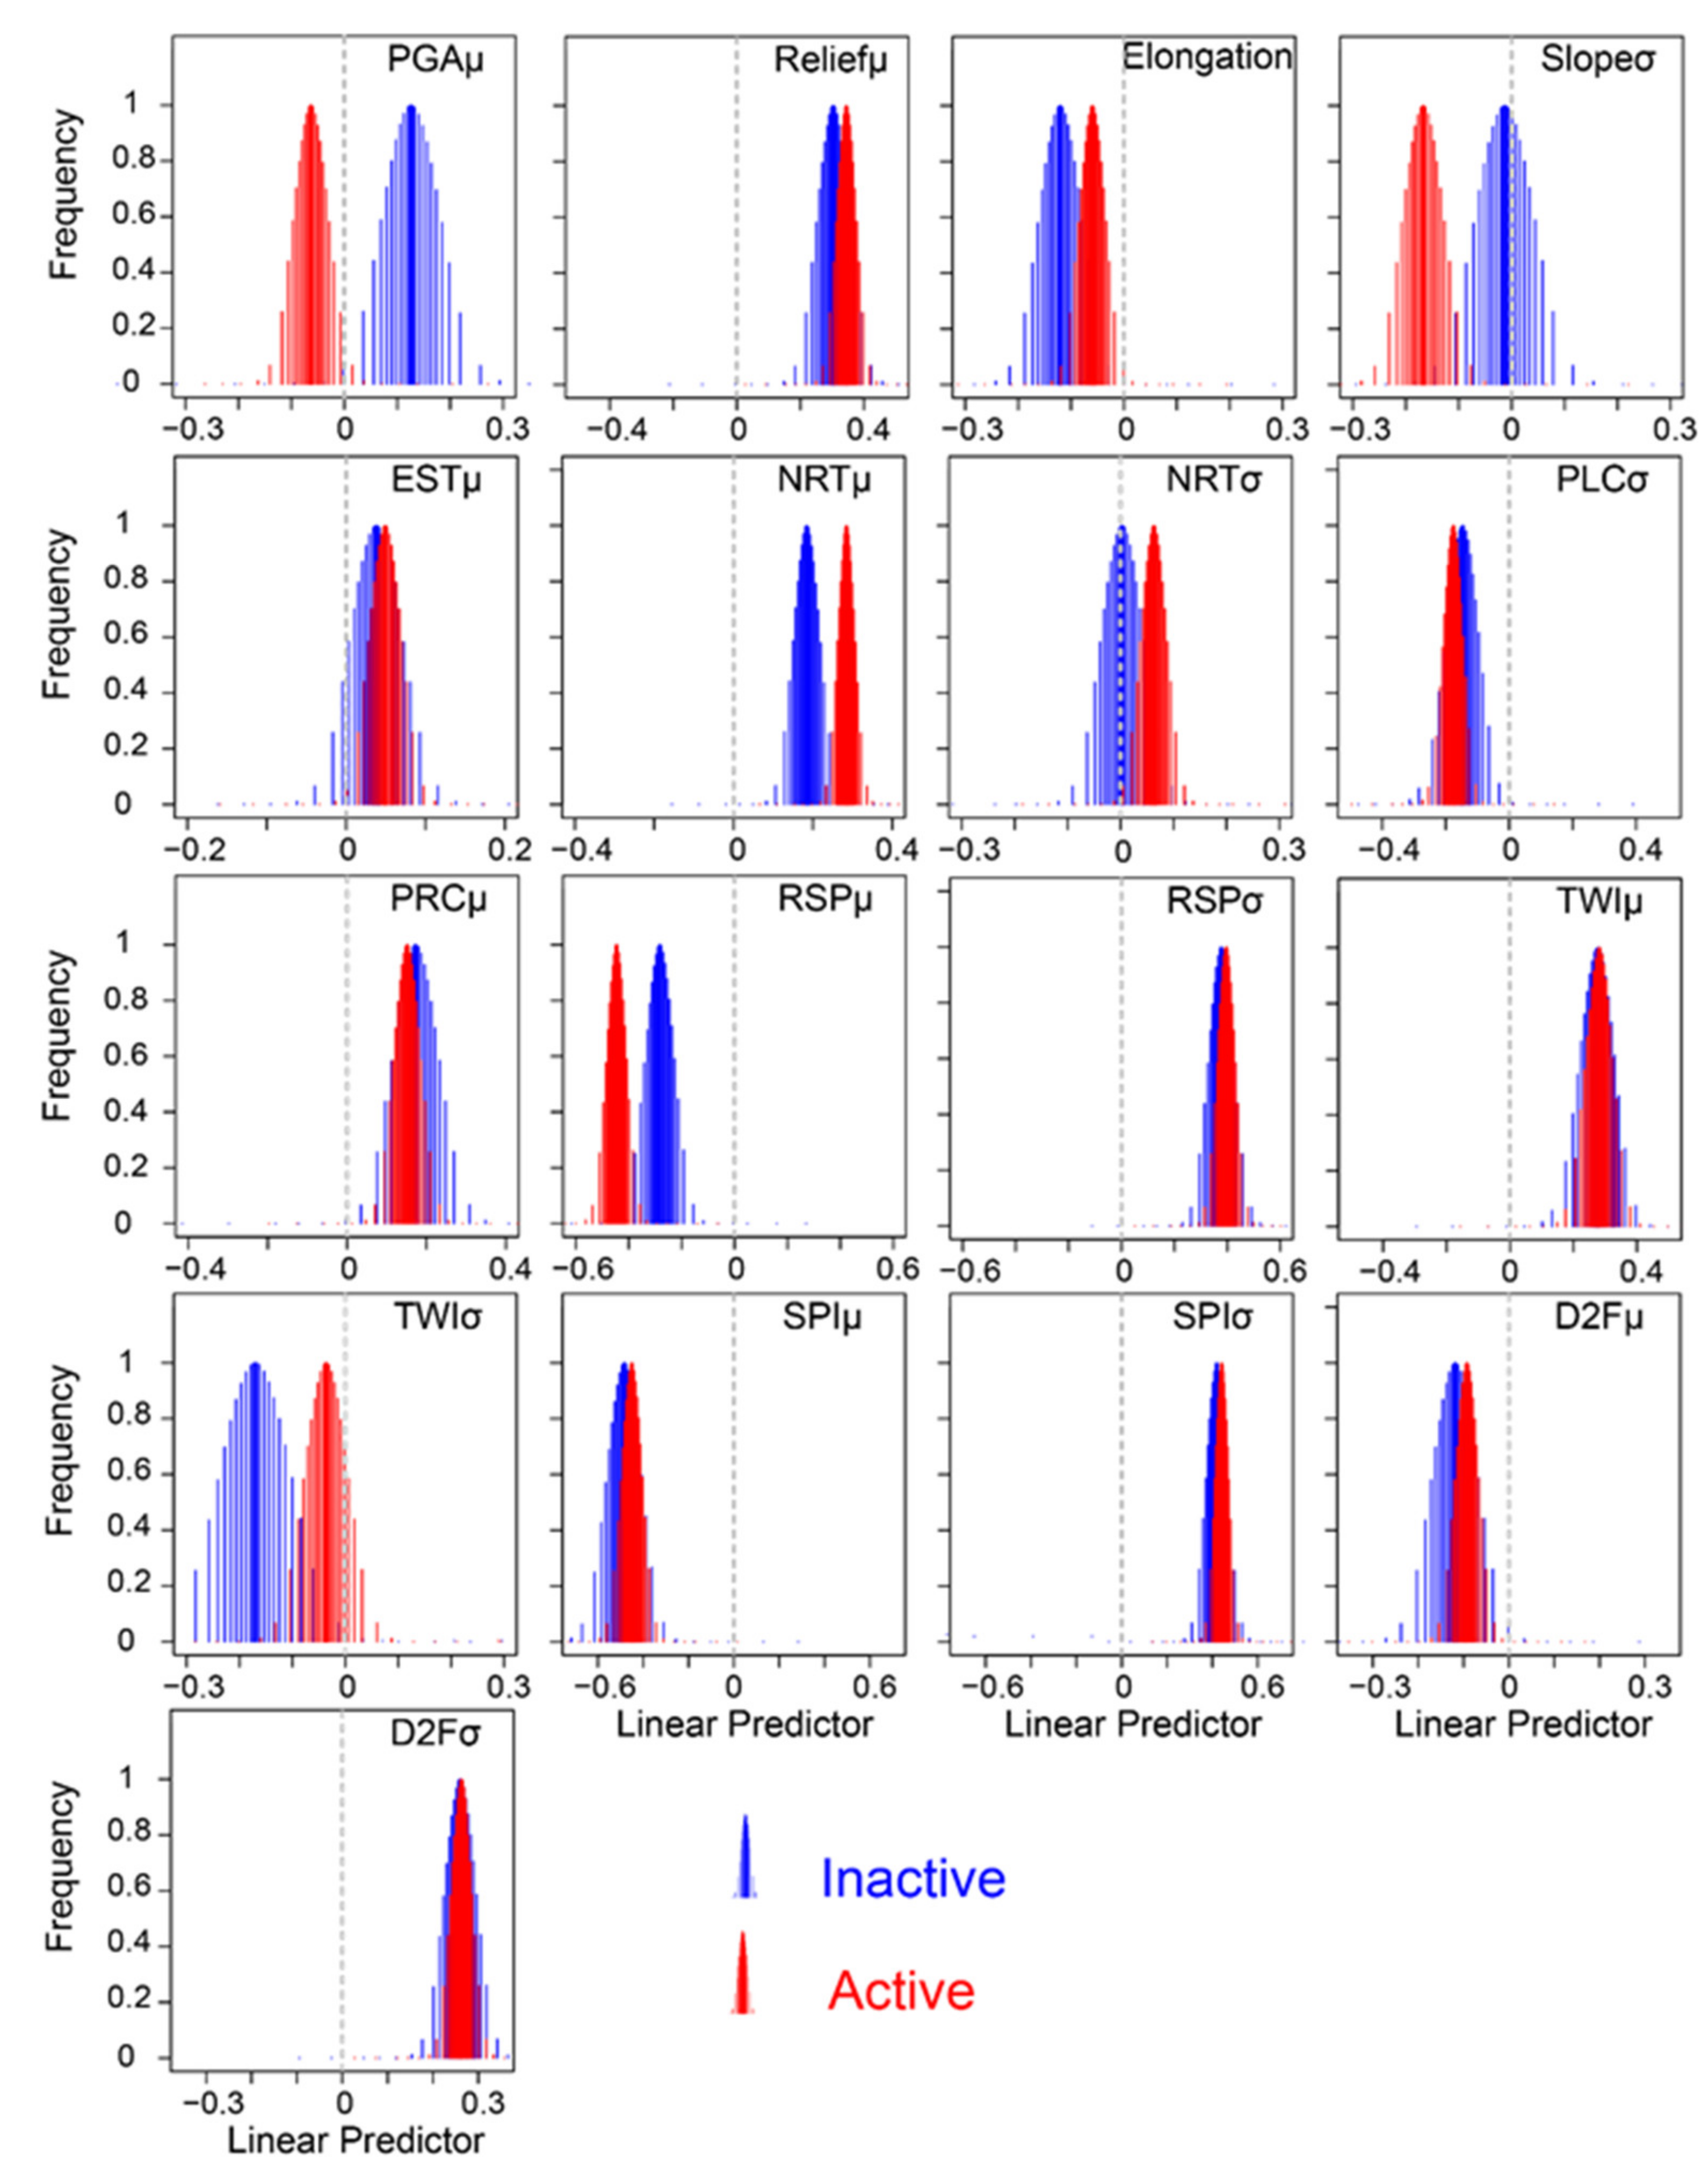
The posterior marginal distributions of the linear effects of each covariate in the models constructed with inactive and, separately, active landslides are displayed in Figure 3. Notably, about half of the covariates exhibit distinct effects in the two models, suggesting that the phenomena featured in the two classes may be controlled by different processes.
Geomorphologically, reasonable patterns are described. The role of Northness is consistent with the distribution of precipitation, which comes from the Black Sea, north of the study area (Figure 1). Negative values of RSPμ are observed in active landslides. Seemingly counterintuitively, PGAμ is positively correlated with inactive landslides. However, this is consistent with the observation [39] that these landslides may be related to historical earthquakes in the NAFS. The elongation of the SUs has a negative effect on both active and inactive landslides, as elongated slopes offer less room for large, deep-seated landslides to form. The average slope negatively correlates with the presence of active landslides, while no correlation is found with inactive ones. For active landslides, this suggests that phenomena on very steep slopes are unlikely; in fact, unstable bodies are quickly removed from steep slopes, while landslide inventories tend to better capture movements over more gentle slopes, which can remain active for a longer time. Hydrological covariates (TWIσ and SPIμ) seem to exert a negative effect in both active and inactive landslides, suggesting their preferential occurrence in the upper portions of catchments. The effect of lithology (Figure S2, Table S1) also shows some differences between the models. For instance, granitoid areas are negatively correlated with active landslides, while the opposite holds true for carbonate rocks.

4.2. Distinct Landslide Triggers

The behaviours of the nonlinear effects of covariates for inactive and active phenomena also are different, as shown in Figure 4. These nonlinear effects clearly point to distinct triggers for inactive and active landslides. In fact, for inactive landslides, neither slope nor precipitation exert significant effects (95% confidence level). For active landslides, positive effects are seen within a certain range of slope angles (10–20°) that could be related to specific materials capable of sustaining prolonged landslides, and for large amounts of annual precipitation (>800 mm/year), capable of frequently triggering or sustaining a variety of movements. On the contrary, in areas with less precipitation, the effect is slightly negative.
In order to validate the result, the out-of-sample performance of the model is investigated. This is done in two steps: the first one involves the use of AUC for each of the considered landslide classes, whereas the second one maintains the same structure but focuses on the summary metrics of confusion matrices.
Figure 5a shows the ROC curves and their AUC values for ten cross-validations for the active and inactive landslide models. The AUC values (~0.8) can be deemed satisfactory and are consistent across the replicates, indicating robustness of the model [66]. The figure (bottom row) also shows the confusion plots of the two models, which are rather similar in both the high ability to detect true positive cases (~90%) and the lower ability to identify the true negative ones (47–50%). Consequently, the error rate (bottom right) is also of similar magnitude (44–50%), and it seems to fail on the stable conditions, together with the ratio between Predicted True Negatives and Observed Negatives.
However, we should remind that the SUs had been calculated only for areas with slope topography, as we excluded the flat areas that are obviously not susceptible to gravitative movements. This could be interpreted as a weakness of the model, but actually facilitates its ability in recognising the instable areas.

4.3. Distinct Susceptibility Maps

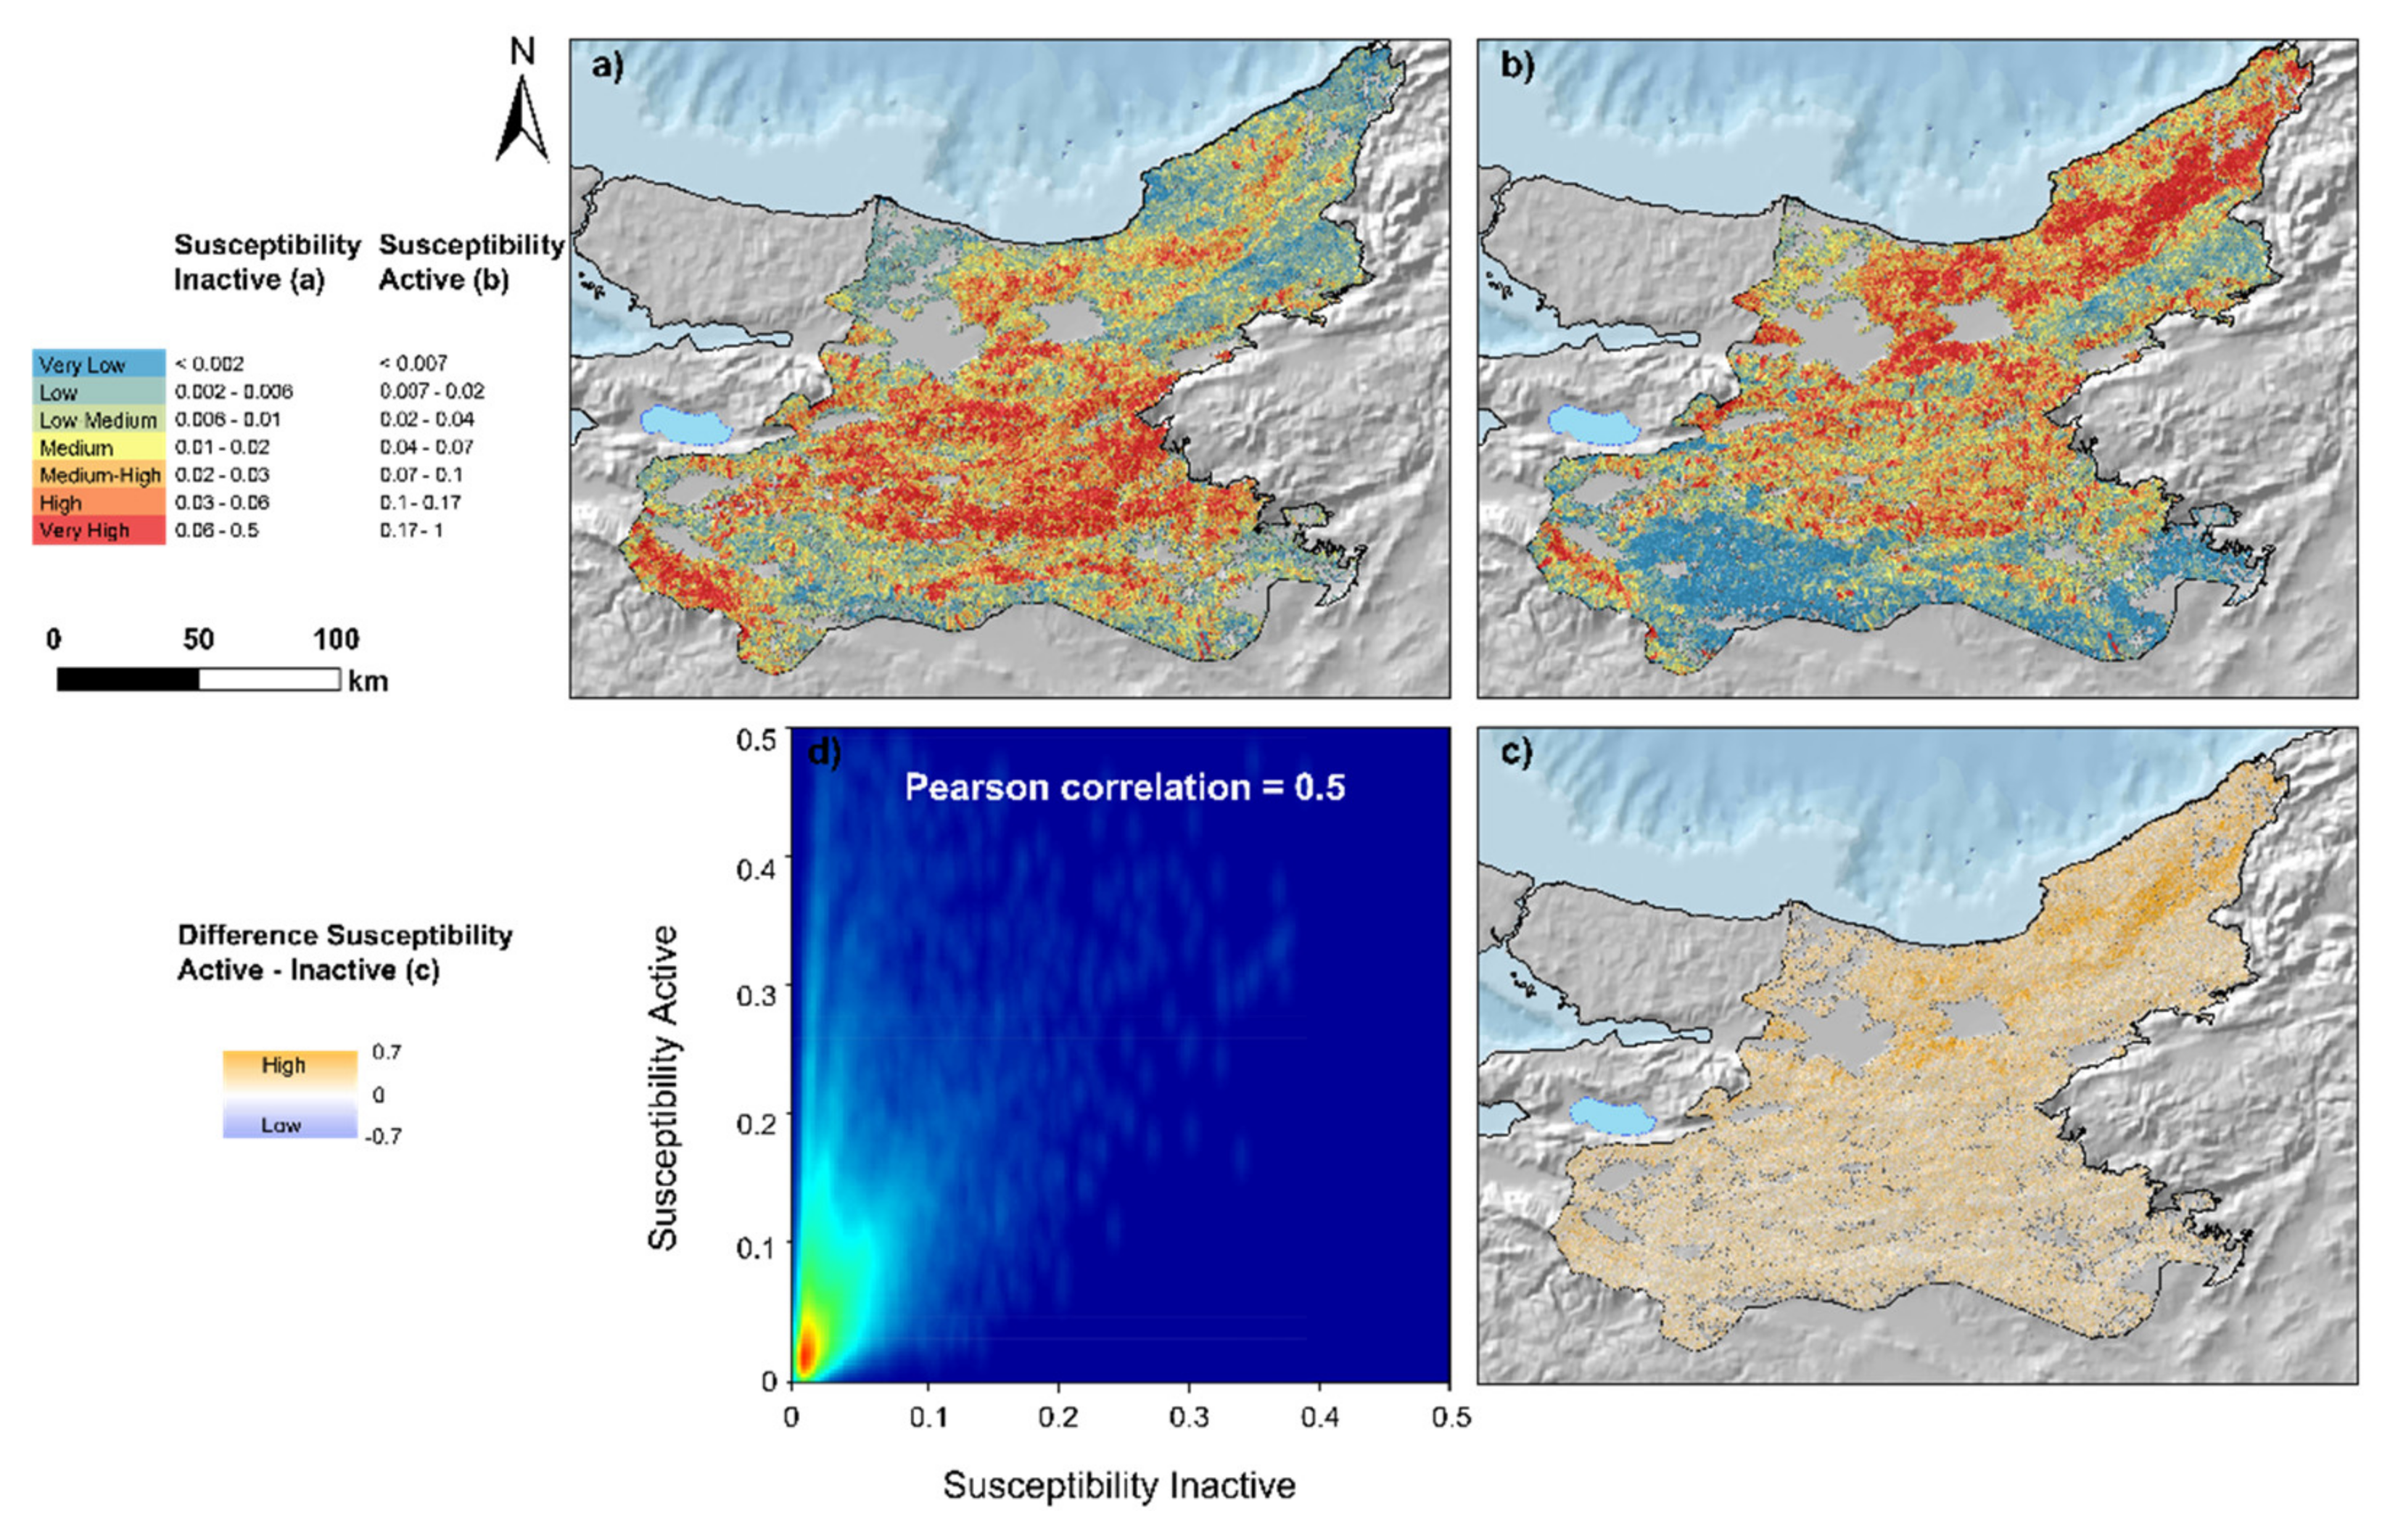
In Figure 6, we show the resulting susceptibility maps for the inactive and active landslides. The maps display markedly different spatial patterns that are consistent with the qualitative (Figure 1) and quantitative (Figure 3 and Figure 4) observations that the distribution of active landslides better correlates with the annual precipitation and that the distribution of inactive landslides better correlates with the peak ground acceleration.
What is more, the two maps are not “one the negative of the other”. The patterns that emerge are, in fact, distinct. Indeed, we do not observe a specular negative effect of precipitation in the distribution of inactive landslides (in fact, we do not observe a significant effect at all). However, we do see a negative effect of the peak ground acceleration in the distribution of active landslides, but the magnitude of this effect is smaller than that seen for inactive landslides.
The absence of correlation between the two maps is demonstrated quantitatively in Figure 6d, where the Pearson correlation shown is 0.5, indicating a random dependence. Similarities in the two maps mainly exist in areas with low density of landslides, independently of their state of activity, such as the northwestern and southernmost portions.

5. Discussion

5.1. Controls and Fate of Active Landslides

From our analysis, it emerged that, consistently with the definition of relict landslides (used to classify the inactive landslides), the conditions that caused their occurrence in the past are distinct from those that are responsible for the active movements in the present. Moreover, the locations of the inactive landslides point to areas with high seismicity, suggesting that they may be earthquake-induced phenomena, now stabilised and insensitive to hydrometeorological forcing. Conversely, the distribution of active landslides reflects the pattern of present-time annual precipitation, suggesting the rainfall-induced nature of these phenomena. If we interpret the active landslides as slow-moving mass movements (that is, processes that remain active for a comparatively long time, and thus more easily captured by inventories), the correlation between the rainfall pattern and the spatial distribution of landslides makes very much sense. There is a large literature showing that the mobilisation and acceleration of slow-moving landslides along slopes is mostly governed by rainfall events causing an increase in pore water pressure and thus a reduction in the available shear strength [67]. On the other hand, in the absence of significant shifts in hydro-meteorological patterns, the stabilisation of these landslides should mostly be related to their transition from steeper to gentler slopes and/or to plains or valleys without significant fluvial erosion at the toe). In other words, active landslides could be described as meta-stable hillslopes materials experiencing creep and consolidation processes while the ratio between driving and resisting forces fluctuates over time mostly under the control of hydro-meteorological factors.
Here, we should stress that slow-moving landslides could rapidly turn into catastrophic landslides (and thus rapidly stabilise) if at some point the driving forces dramatically exceed their resisting counterparts. Various factors including seismicity or precipitation itself could trigger catastrophic landslides. Yet, this may seem a more likely scenario for a region exposed to intense seismic external forces rather than precipitation because, overall, even relatively low-intensity ground shaking may be more destructive than intense precipitation at triggering landslides [68]. In this context, it is not surprising that the relict landslides are mostly distributed closer to the North Anatolian Fault zone, whereas the active landslides concentrate far from it.

5.2. Accuracy of the Active/Inactive Landslide Classification

The binary classification into active and inactive landslides in the inventory was performed well. This is demonstrated by the fact that it resulted in the production of two distinct and uncorrelated susceptibility maps. In other words, in addition to suggesting differences between the conditions responsible for landslides in the past and in the present in the study area (supporting a non-uniformitarian view in this highly dynamic context), this result also suggests that we are dealing with a well-done classification. Logically, active and relict landslides should not be difficult to discern, but the point here is that, if a bias existed in this classifier, it would have resulted in less distinct (and thus more spatially correlated) susceptibility maps. Seeing this the other way round, if a classifier is expected to define distinct regions of space and this does not occur, the severity of the classification bias could be quantified from the degree of correlation between the maps generated, separately, for the distinct values of the classifier.

6. Conclusions

The analyses presented in this work aimed at investigating differences in the spatial patterns of relict and active landslides in a landslide-rich geomorphological context. These differences, expected in the light of qualitative observations on the possible landslide triggers and predisposing factors, were expressed quantitatively using a purely data-driven approach, confirming the validity of such methodology, suggested in the literature [69], and the accuracy of the classification operated in the inventory. The result that the susceptibility patterns of relict and active landslides in the study area are spatially distinct and correlate with distinct explanatory variables suggests that, while current rainfall patterns may explain the distribution of active landslides, seismicity may have had an impact on the relict landslides.
Overall, we believe our work can represent a summary of good practices in the definition of landslide susceptibility mapping and hopefully serve as a reference standardised assessments in both common and specific applications. It also brings novelty as it presents a general slope unit-based susceptibility model through a Bayesian approach in a study area, namely the Turkish Northwesternmost Sector, so far not investigated with this technique.

Supplementary Materials

The following supporting information can be downloaded at: https://www.mdpi.com/article/10.3390/rs14061321/s1. Figure S1: Collinearity between the variables used in the model; Figure S2: Fixed effects expressed as marginal distributions for each lithological unit for landslide type; Table S1: List of lithologies used in the model.

Author Contributions

Conceptualisation and methodology, M.L., G.S., H.T., T.G. and L.L.; formal analysis, M.L., G.S. and L.L.; investigation, M.L.; data curation and original draft preparation, M.L.; review and editing, M.L., G.S., H.T., T.G. and L.L.; visualisation, M.L.; supervision, G.S. and L.L.; project administration, G.S. and M.L.; funding acquisition, G.S., M.L. and L.L. All authors have read and agreed to the published version of the manuscript.

Funding

M.L. appreciates the financial support given by the Charles University Grant Agency (GAUK) with project number 337121. Data analysis, manuscript preparation and publication were funded by the Grant Agency of the Czech Republic (GAČR Grant No. 20-28853Y) and the Fund for international mobility of researchers at Charles University (MSCA-IF IV; Project No. CZ.02.2.69/0.0/0.0/20_079/0017987). The research was also partially supported by the King Abdullah University of Science and Technology (KAUST) in Thuwal, Saudi Arabia (Grant URF/1/4338-01-01).

Data Availability Statement

Elaborated data are presented in the manuscript. Raw experimental data can be provided by the authors upon reasonable request.

Conflicts of Interest

The authors declare no conflict of interest. The funders had no role in the design of the study; in the collection, analyses, or interpretation of data; in the writing of the manuscript, or in the decision to publish the results.

References

  1. Hutton, J.X. Theory of the Earth; or an Investigation of the Laws observable in the Composition, Dissolution, and Restoration of Land upon the Globe. Trans. R. Soc. Edinb. 1788, 1, 209–304. [Google Scholar] [CrossRef] [Green Version]
  2. Lyell, C.; Clowes, W.; Deshayes, G.P.; Murray, J. Principles of Geology. In Being an Attempt to Explain the Former Changes of the Earth’s Surface, by Reference to Causes Now in Operation; John Murray: London, UK, 1830; Volume 1. [Google Scholar] [CrossRef]
  3. Reichenbach, P.; Rossi, M.; Malamud, B.D.; Mihir, M.; Guzzetti, F. A Review of Statistically-Based Landslide Susceptibility Models. Earth Sci. Rev. 2018, 180, 60–91. [Google Scholar] [CrossRef]
  4. Guzzetti, F.; Reichenbach, P.; Cardinali, M.; Galli, M.; Ardizzone, F. Probabilistic Landslide hazard Assessment at the Basin Scale. Geomorphology 2005, 72, 272–299. [Google Scholar] [CrossRef]
  5. Fan, X.; Yunus, A.P.; Scaringi, G.; Catani, F.; Subramanian, S.S.; Xu, Q.; Huang, R. Rapidly Evolving Controls of Landslides after a Strong Earthquake and Implications for Hazard Assessments. Geophys. Res. Lett. 2021, 48. [Google Scholar] [CrossRef]
  6. Tang, R.; Fan, X.; Scaringi, G.; Xu, Q.; Van Westen, C.J.; Ren, J.; Havenith, H.-B. Distinctive Controls on the Distribution of River-Damming and Non-Damming Landslides Induced by the 2008 Wenchuan Earthquake. Bull. Eng. Geol. Environ. 2018, 78, 4075–4093. [Google Scholar] [CrossRef]
  7. Orme, A.R. Shifting Paradigms in Geomorphology: The Fate of Research Ideas in an Educational Context. Geomorphology 2002, 47, 325–342. [Google Scholar] [CrossRef]
  8. Ercanoglu, M.; Gokceoglu, C.; Van Asch, T.W.J. Landslide Susceptibility Zoning of North of Yenice (NW Turkey) by Multivariate Statistical Techniques. Nat. Hazards 2004, 32, 1–23. [Google Scholar] [CrossRef]
  9. Goudie, A.S. (Ed.) International Association of Geomorphologists Encyclopedia of Geomorphology; Routledge: New York, NY, USA, 2004; ISBN 978-1-134-48275-7. [Google Scholar]
  10. Saponaro, A.; Pilz, M.; Wieland, M.; Bindi, D.; Moldobekov, B.; Parolai, S. Landslide Susceptibility Analysis in Data-Scarce Regions: The Case of Kyrgyzstan. Bull. Eng. Geol. Environ. 2014, 74, 1117–1136. [Google Scholar] [CrossRef] [Green Version]
  11. Zêzere, J.; Pereira, S.; Melo, R.; Oliveira, S.; Garcia, R. Mapping Landslide Susceptibility Using Data-Driven Methods. Sci. Total Environ. 2017, 589, 250–267. [Google Scholar] [CrossRef]
  12. Jones, J.N.; Boulton, S.J.; Bennett, G.L.; Stokes, M.; Whitworth, M.R.Z. Temporal Variations in Landslide Distributions Following Extreme Events: Implications for Landslide Susceptibility Modeling. J. Geophys. Res. Earth Surf. 2021, 126. [Google Scholar] [CrossRef]
  13. Scaringi, G.; Loche, M. A Thermo-Hydro-Mechanical Approach to Soil Slope Stability under Climate Change. Geomorphology 2022, 401, 108108. [Google Scholar] [CrossRef]
  14. Domènech, G.; Fan, X.; Scaringi, G.; van Asch, T.W.; Xu, Q.; Huang, R.; Hales, T.C. Modelling the Role of Material Depletion, Grain Coarsening and Revegetation in Debris Flow Occurrences after the 2008 Wenchuan Earthquake. Eng. Geol. 2019, 250, 34–44. [Google Scholar] [CrossRef]
  15. Lombardo, L.; Mai, P.M. Presenting Logistic Regression-Based Landslide Susceptibility Results. Eng. Geol. 2018, 244, 14–24. [Google Scholar] [CrossRef]
  16. Loche, M.; Scaringi, G.; Yunus, A.P.; Catani, F.; Tanyaş, H.; Frodella, W.; Fan, X.; Lombardo, L. Surface Temperature Controls the Pattern of Post-Earthquake Landslide Activity. Sci. Rep. 2022, 12, 1–11. [Google Scholar] [CrossRef]
  17. Duman, T.Y.; Çan, T.; Emre, Ö. 1: 1,500,000 Scaled Turkish Landslide Inventory Map; General Directorate of Mineral Research and Exploration Publication: Ankara, Turkey, 2011; Volume 27. [Google Scholar]
  18. Glade, T. Establishing the Frequency and Magnitude of Landslide-Triggering Rainstorm Events in New Zealand. Environ. Earth Sci. 1998, 35, 160–174. [Google Scholar] [CrossRef]
  19. Fan, X.; Scaringi, G.; Domènech, G.; Yang, F.; Guo, X.; Dai, L.; He, C.; Xu, Q.; Huang, R. Two Multi-Temporal Datasets That Track the Enhanced Landsliding after the 2008 Wenchuan Earthquake. Earth Syst. Sci. Data 2019, 11, 35–55. [Google Scholar] [CrossRef] [Green Version]
  20. Ali, M.Z.; Chu, H.-J.; Chen, Y.-C.; Ullah, S. Machine Learning in Earthquake- and Typhoon-Triggered Landslide Susceptibility Mapping and Critical Factor Identification. Environ. Earth Sci. 2021, 80, 1–21. [Google Scholar] [CrossRef]
  21. Steger, S.; Brenning, A.; Bell, R.; Glade, T. The Propagation of Inventory-Based Positional Errors into Statistical Landslide Susceptibility Models. Nat. Hazards Earth Syst. Sci. 2016, 16, 2729–2745. [Google Scholar] [CrossRef] [Green Version]
  22. Lima, P.; Steger, S.; Glade, T.; Tilch, N.; Schwarz, L.; Kociu, A. Landslide Susceptibility Mapping at National Scale: A First Attempt for Austria. In Advancing Culture of Living with Landslides; Mikos, M., Tiwari, B., Yin, Y., Sassa, K., Eds.; Springer International Publishing: Cham, Switzerland, 2017; pp. 943–951. [Google Scholar] [CrossRef]
  23. Steger, S.; Kofler, C. Statistical Modeling of Landslides. In Spatial Modeling in GIS and R for Earth and Environmental Sciences; Elsevier: Amsterdam, The Netherlands, 2019; pp. 519–546. ISBN 978-0-12-815226-3. [Google Scholar]
  24. Eeckhaut, M.V.D.; Hervás, J.; Jaedicke, C.; Malet, J.-P.; Montanarella, L.; Nadim, F. Statistical Modelling of Europe-Wide LandSlide Susceptibility Using Limited Landslide Inventory Data. Landslides 2011, 9, 357–369. [Google Scholar] [CrossRef]
  25. Kirschbaum, D.; Stanley, T.; Zhou, Y. Spatial and Temporal Analysis of a Global Landslide Catalog. Geomorphology 2015, 249, 4–15. [Google Scholar] [CrossRef]
  26. Petschko, H.; Bell, R.; Brenning, A.; Glade, T. Landslide Susceptibility Modeling with Generalized Additive Models–Facing the Heterogeneity of Large Regions. Landslides Eng. Slopes Prot. Soc. Improv. Underst. 2012, 1, 769–777. [Google Scholar]
  27. Das, I.; Stein, A.; Kerle, N.; Dadhwal, V.K. Landslide Susceptibility Mapping along Road Corridors in the Indian Himalayas Using Bayesian Logistic Regression Models. Geomorphology 2012, 179, 116–125. [Google Scholar] [CrossRef]
  28. Alvioli, M.; Marchesini, I.; Reichenbach, P.; Rossi, M.; Ardizzone, F.; Fiorucci, F.; Guzzetti, F. Automatic Delineation of Geomorphological Slope Units with r.slopeunits v1.0 and Their Optimization for Landslide Susceptibility Modeling. Geosci. Model Dev. 2016, 9, 3975–3991. [Google Scholar] [CrossRef] [Green Version]
  29. Alvioli, M.; Marchesini, I.; Guzzetti, F. Nation-Wide, General-Purpose Delineation of Geomorphological Slope Units in Italy. PeerJ Prepr. 2018, 6, e27066v1. [Google Scholar]
  30. Alvioli, M.; Guzzetti, F.; Marchesini, I. Parameter-Free Delineation of Slope Units and Terrain Subdivision of Italy. Geomorphology 2020, 358, 107124. [Google Scholar] [CrossRef]
  31. Tanyas, H.; Rossi, M.; Alvioli, M.; van Westen, C.J.; Marchesini, I. A Global Slope Unit-Based Method for the Near Real-Time Prediction of Earthquake-Induced Landslides. Geomorphology 2018, 327, 126–146. [Google Scholar] [CrossRef]
  32. Sengör, A.M.C.; Yilmaz, Y. Tethyan Evolution of Turkey: A Plate Tectonic Approach. Tectonophysics 1981, 75, 181–241. [Google Scholar] [CrossRef]
  33. Okay, A.I. Geology of Turkey: A Synopsis. Anschnitt 2008, 21, 19–42. [Google Scholar]
  34. Gorum, T.; Gonencgil, B.; Gokceoglu, C.; Nefeslioglu, H.A. Implementation of Reconstructed Geomorphologic Units in LandSlide Susceptibility Mapping: The Melen Gorge (NW Turkey). Nat. Hazards 2008, 46, 323–351. [Google Scholar] [CrossRef]
  35. Görüm, T. Tectonic, Topographic and Rock-Type Influences on Large Landslides at the Northern Margin of the Anatolian Plateau. Landslides 2018, 16, 333–346. [Google Scholar] [CrossRef]
  36. Akbaş, B.; Akdeniz, N.; Aksay, A.; Altun, İ.E.; Balcı, V.; Bilginer, E.; Bilgiç, T.; Duru, M.; Ercan, T.; Gedik, İ.; et al. 1:1.250.000 Scaled Geological Map of Turkey; General Directorate of Mineral Research and Exploration Publication: Ankara, Turkey, 2011. [Google Scholar]
  37. Geology and Tectonic Evolution of the Pontides. In Regional and Petroleum Geology of the Black Sea and Surrounding Region; American Association of Petroleum Geologists: Tulsa, OK, USA, 1997; pp. 183–226. ISBN 978-0-89181-348-4.
  38. Okay, A.; Şengör, A.C.; Görür, N. Kinematic History of the Opening of the Black Sea and Its Effect on the Surrounding Regions. Geology 1994, 22, 559–562. [Google Scholar] [CrossRef]
  39. Duman, T.Y.; Çan, T.; Emre, Ö.; Keçer, M.; Doğan, A.; Ateş, Ş.; Durmaz, S. Landslide Inventory of Northwestern Anatolia, Turkey. Eng. Geol. 2005, 77, 99–114. [Google Scholar] [CrossRef]
  40. Ulusay, R.; Aydan, Ö.; Kılıc, R. Geotechnical Assessment of the 2005 Kuzulu Landslide (Turkey). Eng. Geol. 2007, 89, 112–128. [Google Scholar] [CrossRef]
  41. Hijmans, R.J.; Cameron, S.E.; Parra, J.L.; Jones, P.G.; Jarvis, A. Very High Resolution Interpolated Climate Surfaces for Global Land Areas. Int. J. Climatol. 2005, 25, 1965–1978. [Google Scholar] [CrossRef]
  42. Carrara, A. Drainage and Divide Networks Derived from High-Fidelity Digital Terrain Models. In Quantitative Analysis of Mineral and Energy Resources; Chung, C.F., Fabbri, A.G., Sinding-Larsen, R., Eds.; Springer: Dordrecht, The Netherlands, 1988; pp. 581–597. ISBN 978-94-010-8288-4. [Google Scholar]
  43. Guzzetti, F.; Carrara, A.; Cardinali, M.; Reichenbach, P. Landslide Hazard Evaluation: A Review of Current Techniques and Their Application in a Multi-Scale Study, Central Italy. Geomorphology 1999, 31, 181–216. [Google Scholar] [CrossRef]
  44. Guzzetti, F.; Reichenbach, P.; Ardizzone, F.; Cardinali, M.; Galli, M. Estimating the Quality of Landslide Susceptibility Models. Geomorphology 2006, 81, 166–184. [Google Scholar] [CrossRef]
  45. Pokharel, B.; Alvioli, M.; Lim, S. Assessment of Earthquake-Induced Landslide Inventories and Susceptibility Maps Using Slope Unit-Based Logistic Regression and Geospatial Statistics. Sci. Rep. 2021, 11, 1–15. [Google Scholar] [CrossRef]
  46. Camilo, D.C.; Lombardo, L.; Mai, P.M.; Dou, J.; Huser, R. Handling High Predictor Dimensionality in Slope-Unit-Based Landslide Susceptibility Models through LASSO-Penalized Generalized Linear Model. Environ. Model. Softw. 2017, 97, 145–156. [Google Scholar] [CrossRef] [Green Version]
  47. Schlögel, R.; Marchesini, I.; Alvioli, M.; Reichenbach, P.; Rossi, M.; Malet, J.-P. Optimizing Landslide Susceptibility Zonation: Effects of DEM Spatial Resolution and Slope Unit Delineation on Logistic Regression Models. Geomorphology 2017, 301, 10–20. [Google Scholar] [CrossRef]
  48. UNESCO Working Party On World Landslide Inventory A Suggested Method for Describing the Activity of a Landslide. Bull. Int. Assoc. Eng. Geol. 1993, 47, 53–57. [CrossRef]
  49. Lombardo, L.; Cama, M.; Conoscenti, C.; Märker, M.; Rotigliano, E. Binary Logistic Regression Versus Stochastic Gradient Boosted Decision Trees in Assessing Landslide Susceptibility for Multiple-Occurring Landslide Events: Application to the 2009 Storm Event in Messina (Sicily, Southern Italy). Nat. Hazards 2015, 79, 1621–1648. [Google Scholar] [CrossRef]
  50. Lombardo, L.; Opitz, T.; Huser, R. Point Process-Based Modeling of Multiple Debris Flow Landslides Using INLA: An Application to the 2009 Messina Disaster. Stoch. Hydrol. Hydraul. 2018, 32, 2179–2198. [Google Scholar] [CrossRef] [Green Version]
  51. Bakka, H.; Rue, H.; Fuglstad, G.; Riebler, A.; Bolin, D.; Illian, J.; Krainski, E.; Simpson, D.; Lindgren, F. Spatial Modeling with R-INLA: A Review. WIREs Comput. Stat. 2018, 10, e1443. [Google Scholar] [CrossRef] [Green Version]
  52. Lombardo, L.; Tanyas, H.; Nicu, I.C. Spatial Modeling of Multi-Hazard Threat to Cultural Heritage Sites. Eng. Geol. 2020, 277, 105776. [Google Scholar] [CrossRef]
  53. Lindgren, F.; Rue, H. Bayesian Spatial Modelling with R-INLA. J. Stat. Softw. 2015, 63, 1–25. [Google Scholar] [CrossRef] [Green Version]
  54. Allen, M.P. The Problem of Multicollinearity. In Understanding Regression Analysis; Springer: Boston, MA, USA, 1997; pp. 176–180. ISBN 978-0-306-45648-0. [Google Scholar]
  55. Mela, C.F.; Kopalle, P.K. The Impact of Collinearity on Regression Analysis: The Asymmetric Effect of Negative and Positive Correlations. Appl. Econ. 2002, 34, 667–677. [Google Scholar] [CrossRef]
  56. Pourghasemi, H.R.; Rossi, M. Landslide Susceptibility Modeling in a Landslide Prone Area in Mazandarn Province, North of Iran: A Comparison between GLM, GAM, MARS, and M-AHP Methods. Arch. Meteorol. Geophys. Bioclimatol. Ser. B 2016, 130, 609–633. [Google Scholar] [CrossRef]
  57. Petschko, H.; Brenning, A.; Bell, R.; Goetz, J.; Glade, T. Assessing the Quality of Landslide Susceptibility Maps–Case Study Lower Austria. Nat. Hazards Earth Syst. Sci. 2014, 14, 95–118. [Google Scholar] [CrossRef] [Green Version]
  58. Brenning, A. Spatial Prediction Models for Landslide Hazards: Review, Comparison and Evaluation. Nat. Hazards Earth Syst. Sci. 2005, 5, 853–862. [Google Scholar] [CrossRef]
  59. Ploton, P.; Mortier, F.; Réjou-Méchain, M.; Barbier, N.; Picard, N.; Rossi, V.; Dormann, C.; Cornu, G.; Viennois, G.; Bayol, N.; et al. Spatial Validation Reveals Poor Predictive Performance of Large-Scale Ecological Mapping Models. Nat. Commun. 2020, 11, 1–11. [Google Scholar] [CrossRef]
  60. Valavi, R.; Elith, J.; Lahoz-Monfort, J.J.; Guillera-Arroita, G. Block CV: An r Package for Generating Spatially or Environmentally Separated Folds for k -Fold Cross-Validation of Species Distribution Models. Methods Ecol. Evol. 2018, 10, 225–232. [Google Scholar] [CrossRef] [Green Version]
  61. Wadoux, A.M.-C.; Heuvelink, G.B.; de Bruin, S.; Brus, D.J. Spatial Cross-Validation Is Not the Right Way to Evaluate Map Accuracy. Ecol. Model. 2021, 457, 109692. [Google Scholar] [CrossRef]
  62. Zevenbergen, L.W.; Thorne, C.R. Quantitative Analysis of Land Surface Topography. Earth Surf. Process. Landforms 1987, 12, 47–56. [Google Scholar] [CrossRef]
  63. Heerdegen, R.G.; Beran, M.A. Quantifying Source Areas through Land Surface Curvature and Shape. J. Hydrol. 1982, 57, 359–373. [Google Scholar] [CrossRef]
  64. Böhner, J.; Selige, T. Spatial Prediction of Soil Attributes Using Terrain Analysis and Climate Regionalisation. In SAGA—Analyses and Modelling Applications; Böhner, J., McCloy, K.R., Strobl, J., Eds.; Göttinger Geographische Abhandlungen: Göttingen, Germany, 2006; Volume 115, pp. 13–28. [Google Scholar]
  65. Moore, I.D.; Grayson, R.B.; Ladson, A.R. Digital Terrain Modelling: A Review of Hydrological, Geomorphological, and Biological Applications. Hydrol. Process. 1991, 5, 3–30. [Google Scholar] [CrossRef]
  66. Hosmer, D.W.; Lemeshow, S. Applied Logistic Regression, 2nd ed.; Wiley: New York, NY, USA, 2000. [Google Scholar]
  67. Lacroix, P.; Handwerger, A.L.; Bièvre, G. Life and Death of Slow-Moving Landslides. Nat. Rev. Earth Environ. 2020, 1, 404–419. [Google Scholar] [CrossRef]
  68. Tanyaş, H.; Kirschbaum, D.; Görüm, T.; van Westen, C.J.; Lombardo, L. New Insight into Post-seismic Landslide Evolution Processes in the Tropics. Front. Earth Sci. 2021, 9, 700546. [Google Scholar] [CrossRef]
  69. Lombardo, L.; Bakka, H.; Tanyas, H.; Van Westen, C.; Mai, P.M.; Huser, R. Geostatistical Modeling to Capture Seismic-Shaking Patterns from Earthquake-Induced Landslides. J. Geophys. Res. Earth Surf. 2019, 124, 1958–1980. [Google Scholar] [CrossRef]
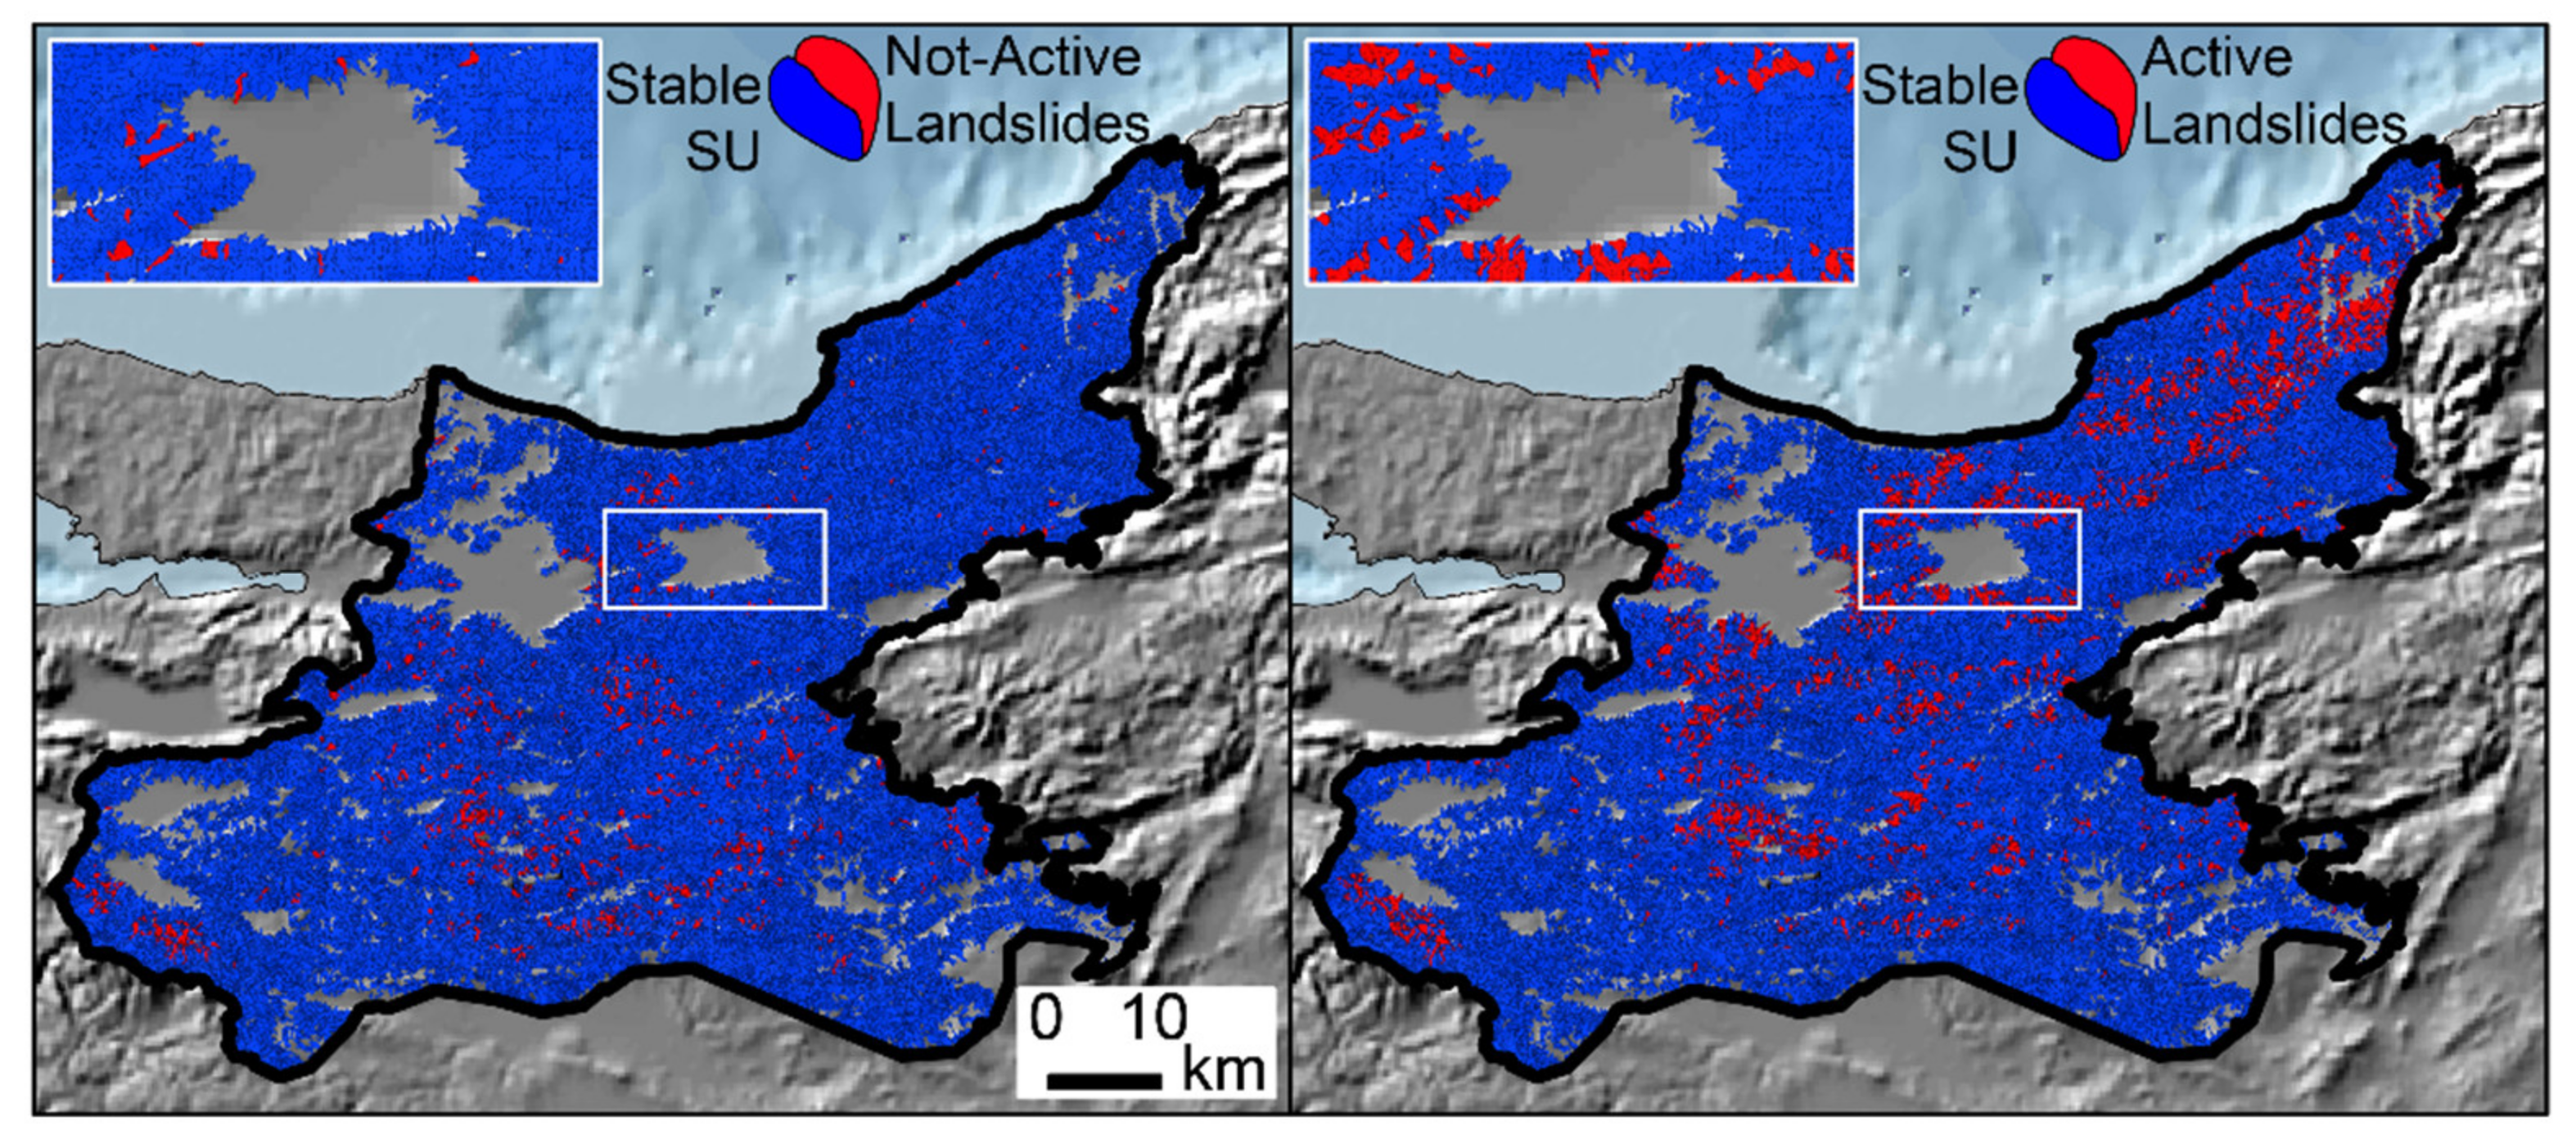
Figure 2. Slope Unit partition of the study area: SUs containing inactive (left) and active (right) landslides are shown. The sub-panels show a detail for a small region, in which it is possible to observe the flat areas excluded by the SU calculation (see Section 4.2 for explanation). The legend is valid for the whole area and zoomed panels.
Remotesensing 14 01321 g002
Figure 3. Fixed effects of geomorphological variables expressed as marginal distributions for inactive and active landslides.
Remotesensing 14 01321 g003
Figure 4. Nonlinear effects of slope (left column) and precipitation (right column) for inactive (top row) and active (bottom row) landslides. The effect is modelled as a random effect estimated over 20 classes with adjacent dependency. Thick coloured lines represent the posterior means whereas the coloured dashed lines indicate the posterior 95% credible interval. Dashed grey lines indicate the zero line along which coefficients play no role in the modelling outcome.
Remotesensing 14 01321 g004
Figure 5. (a) ROC curves and their AUCs for ten cross-validations for the inactive (left) and active (right) landslide models. (b) Confusion plot (left) constructed via the percentage of Observed TP and fitted TP against the percentage of Observed TN and fitted TN (for each landslide type), and error rates (right), both have been obtained from a tenfold CV.
Remotesensing 14 01321 g005
Figure 6. Susceptibility maps for inactive (a) and active (b) landslides. The maps are obtained by merging ten cross-validated subsets and thus entirely come from predicted estimates. The resulting probability values have been binned into seven susceptibility classes using a quantile criterion. The difference in susceptibility between (a) and (b) is shown in (c), while the graph in (d) displays their Pearson correlation.
Remotesensing 14 01321 g006
Publisher’s Note: MDPI stays neutral with regard to jurisdictional claims in published maps and institutional affiliations.