
Seasonal Contrast and Interactive Effects of Potential Drivers on Land Surface Temperature in the Sichuan Basin, China


Abstract
:1. Introduction
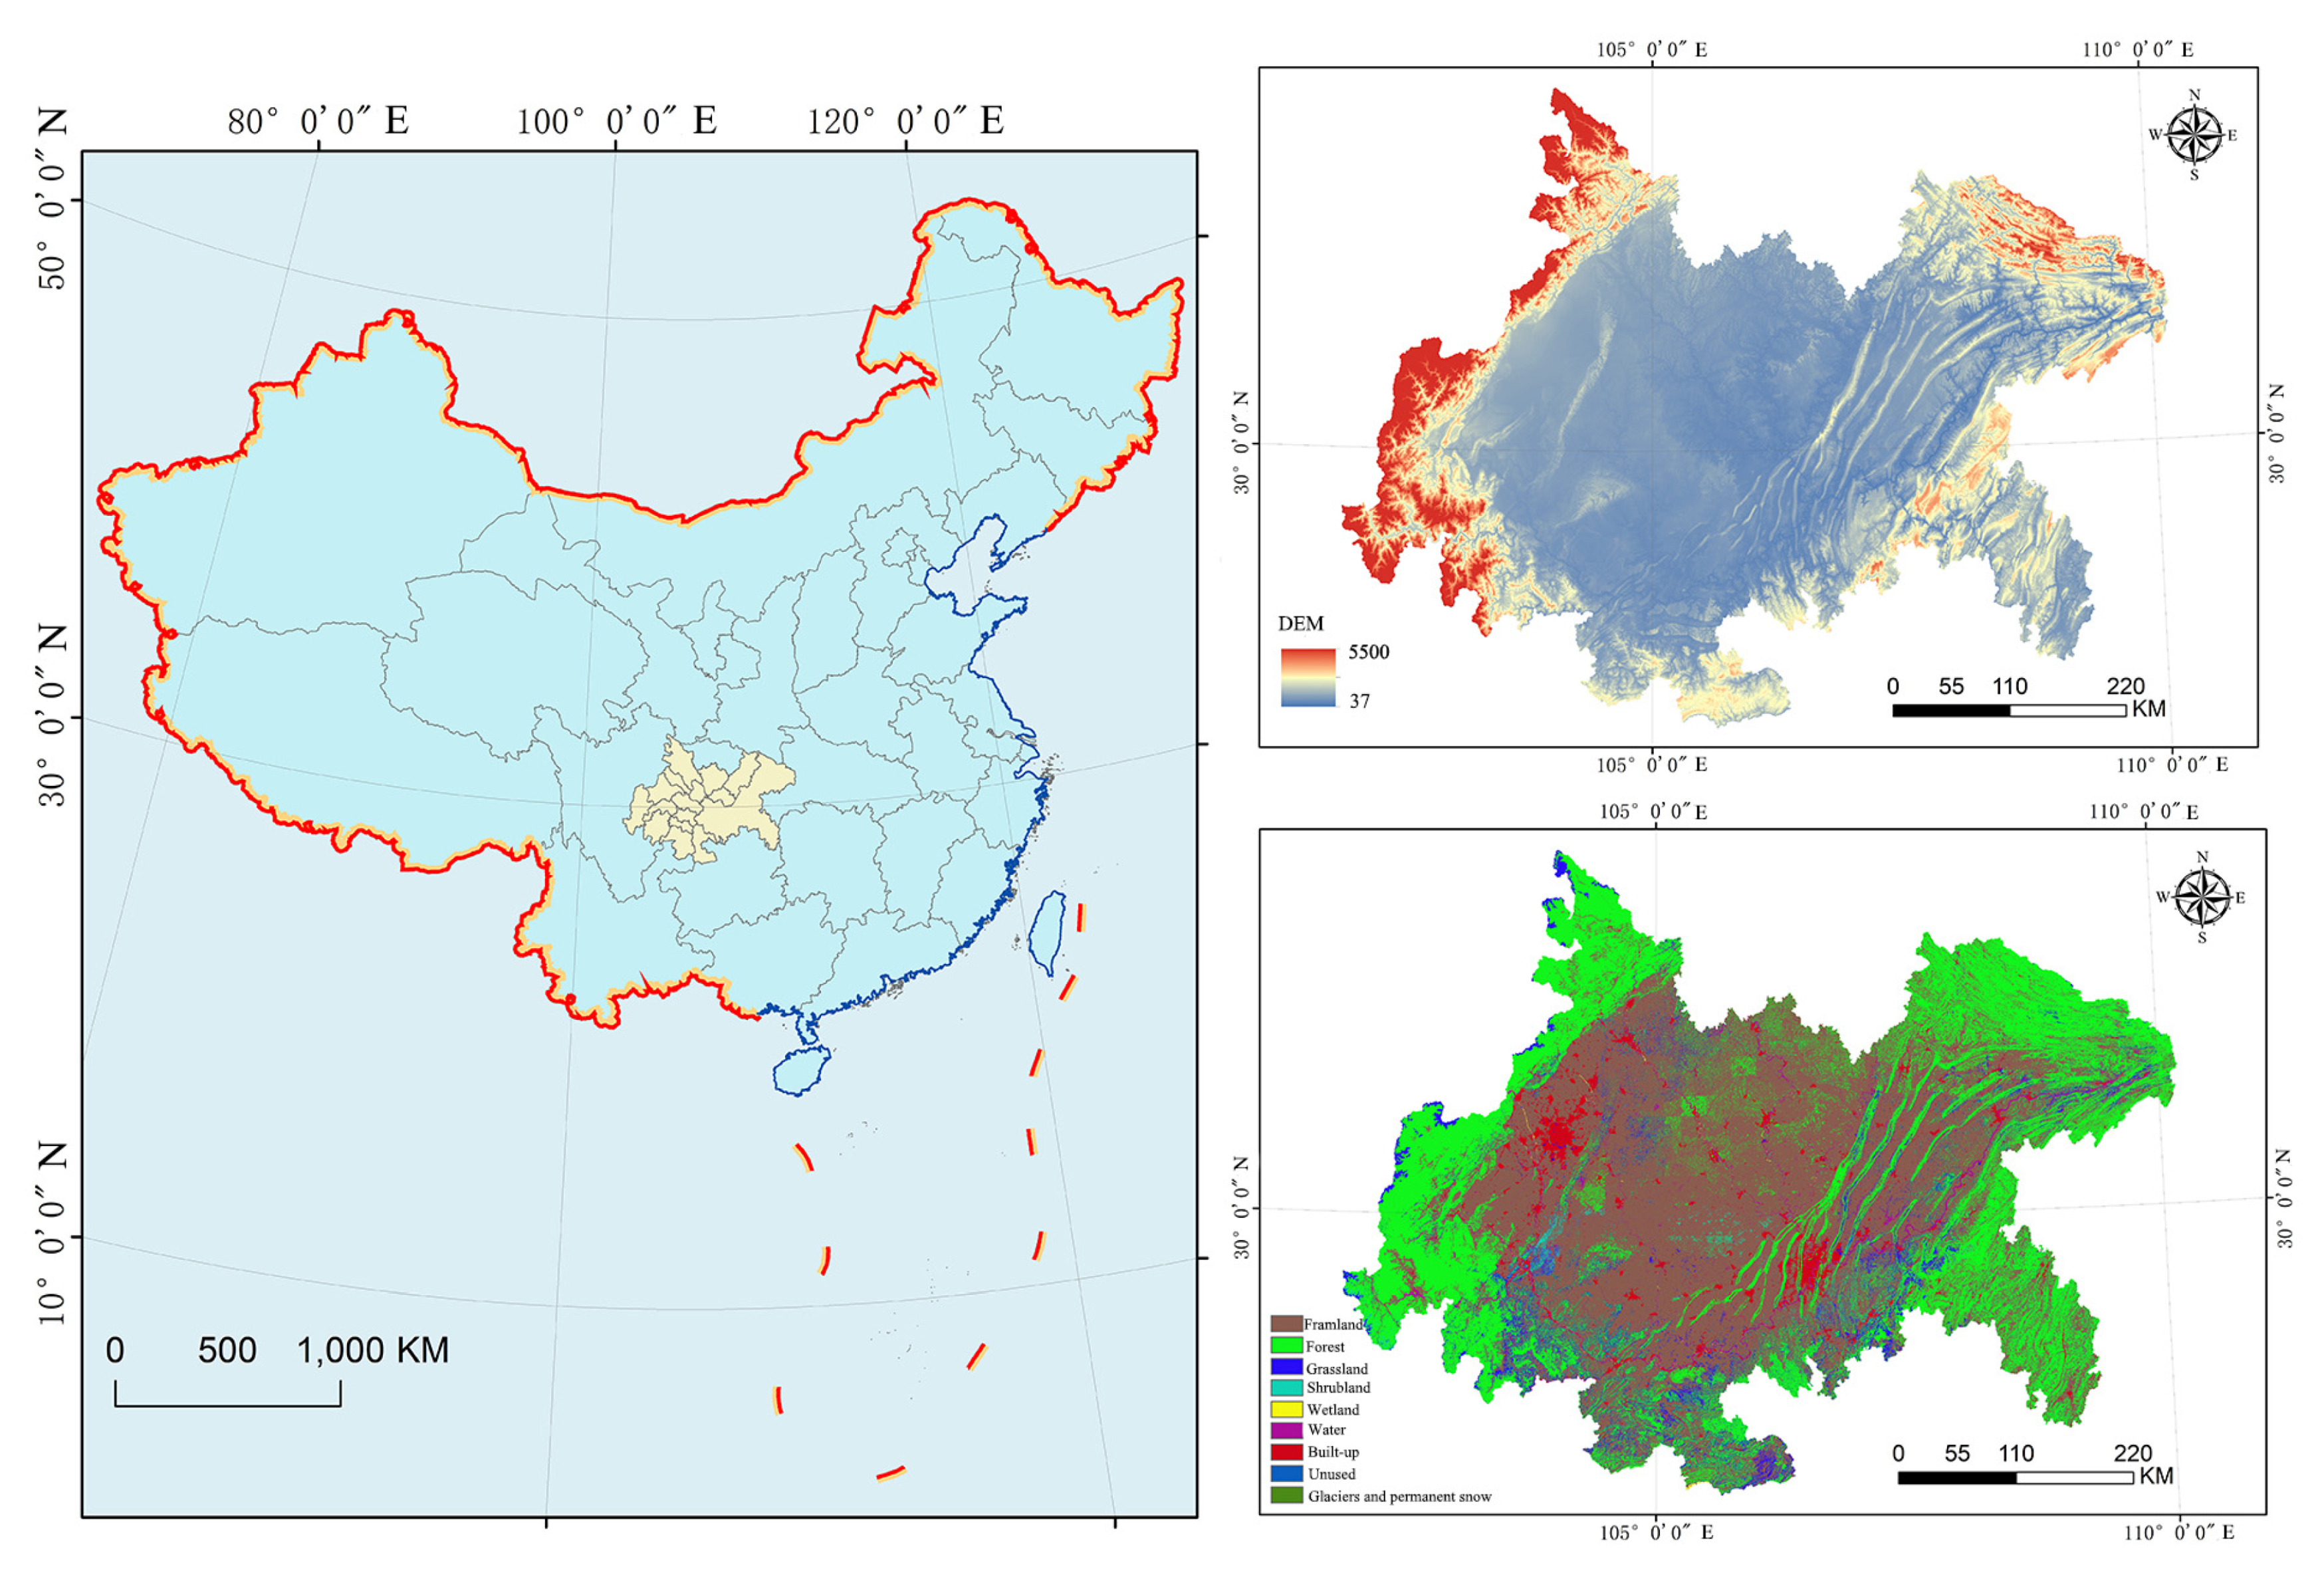
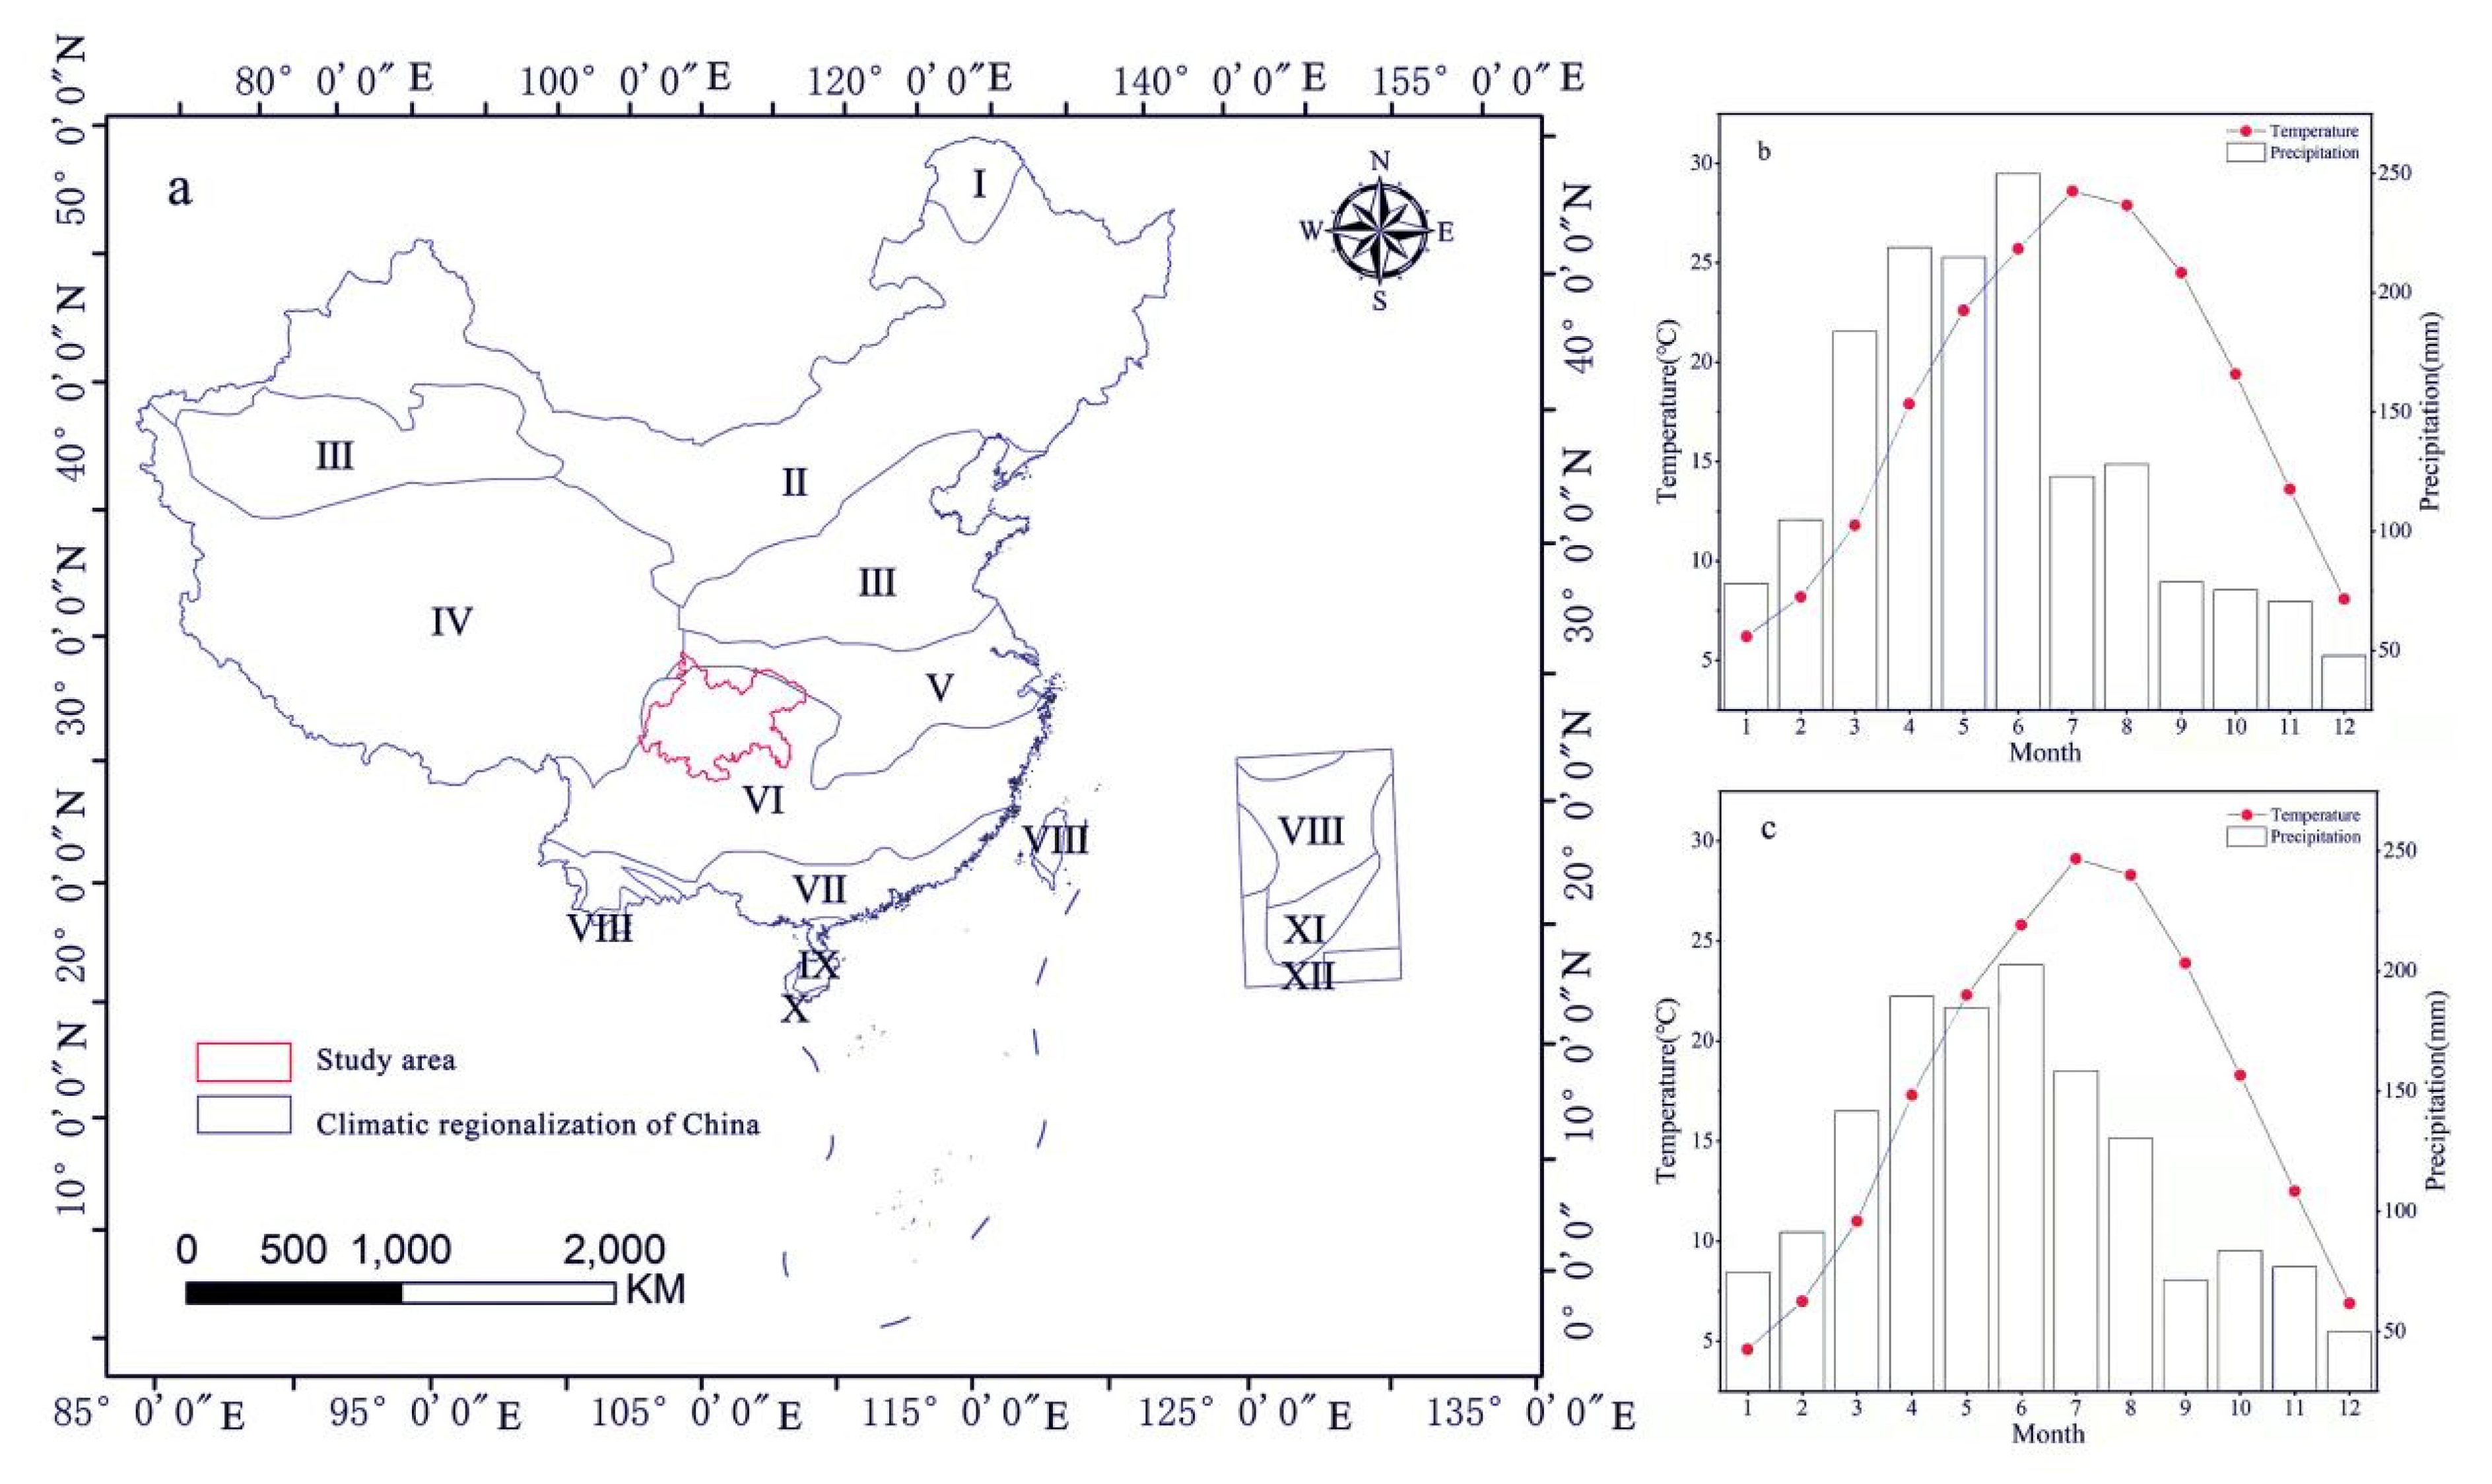
2. Study Area
3. Data and Methods
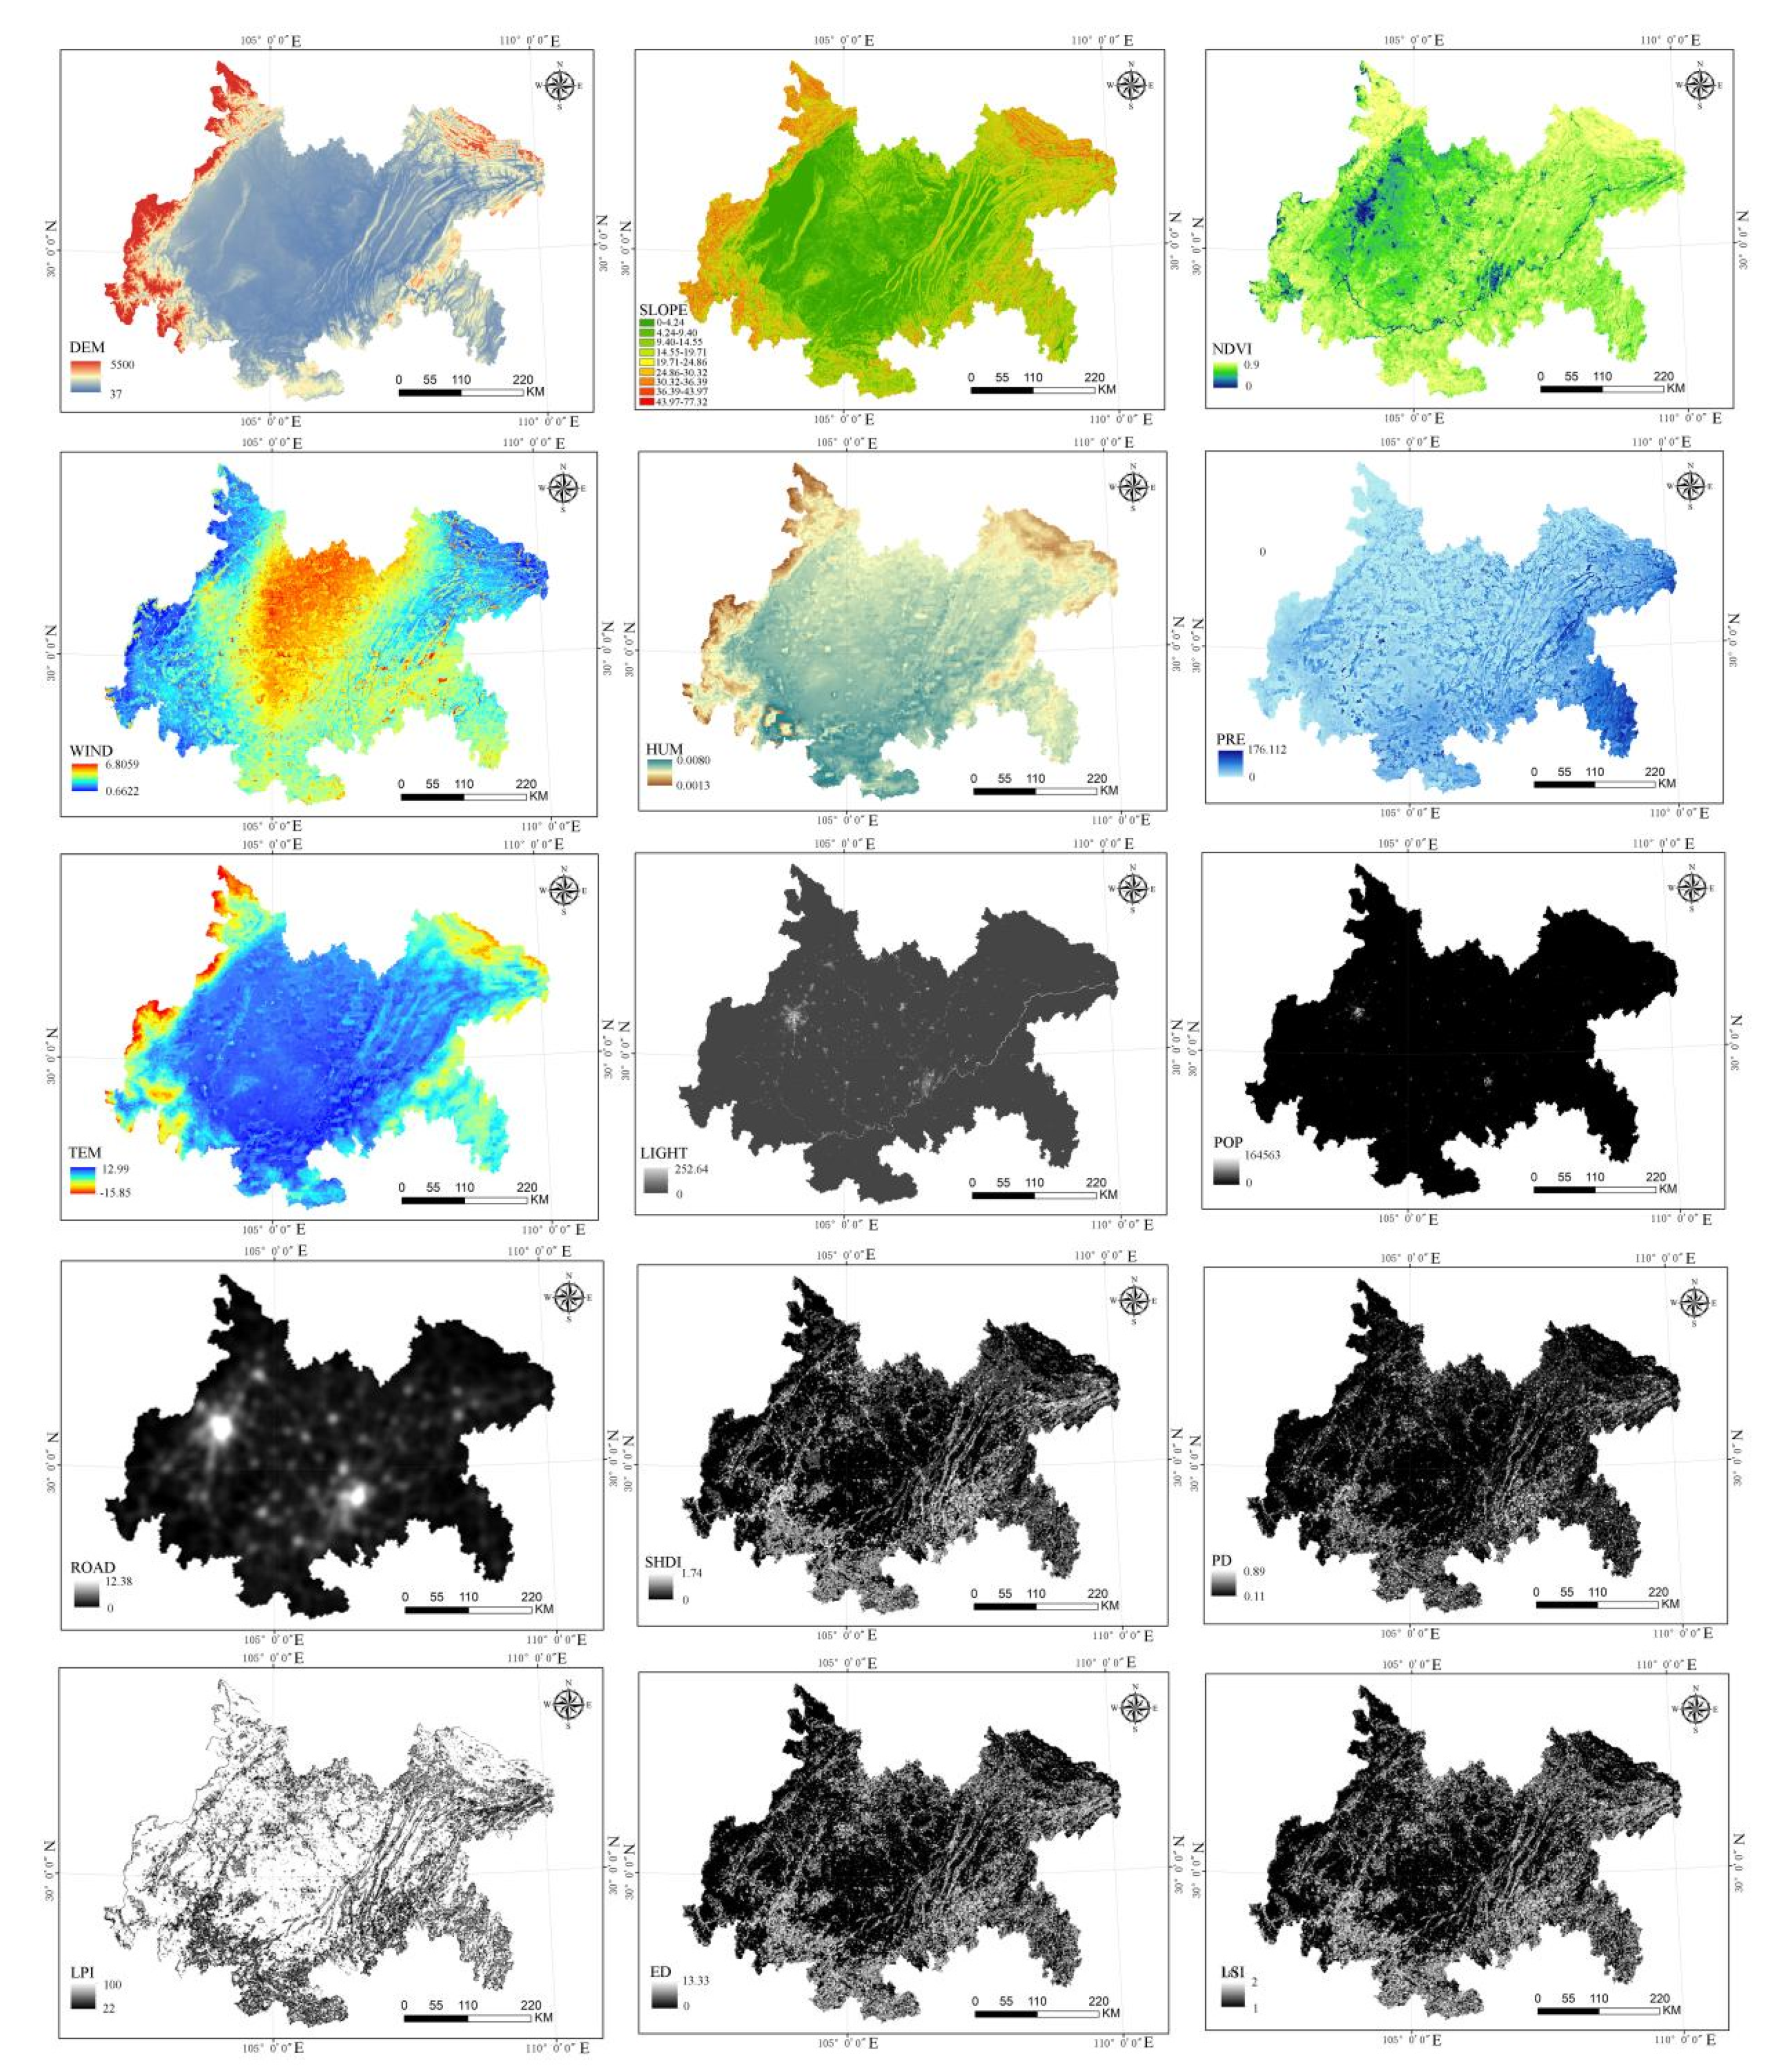
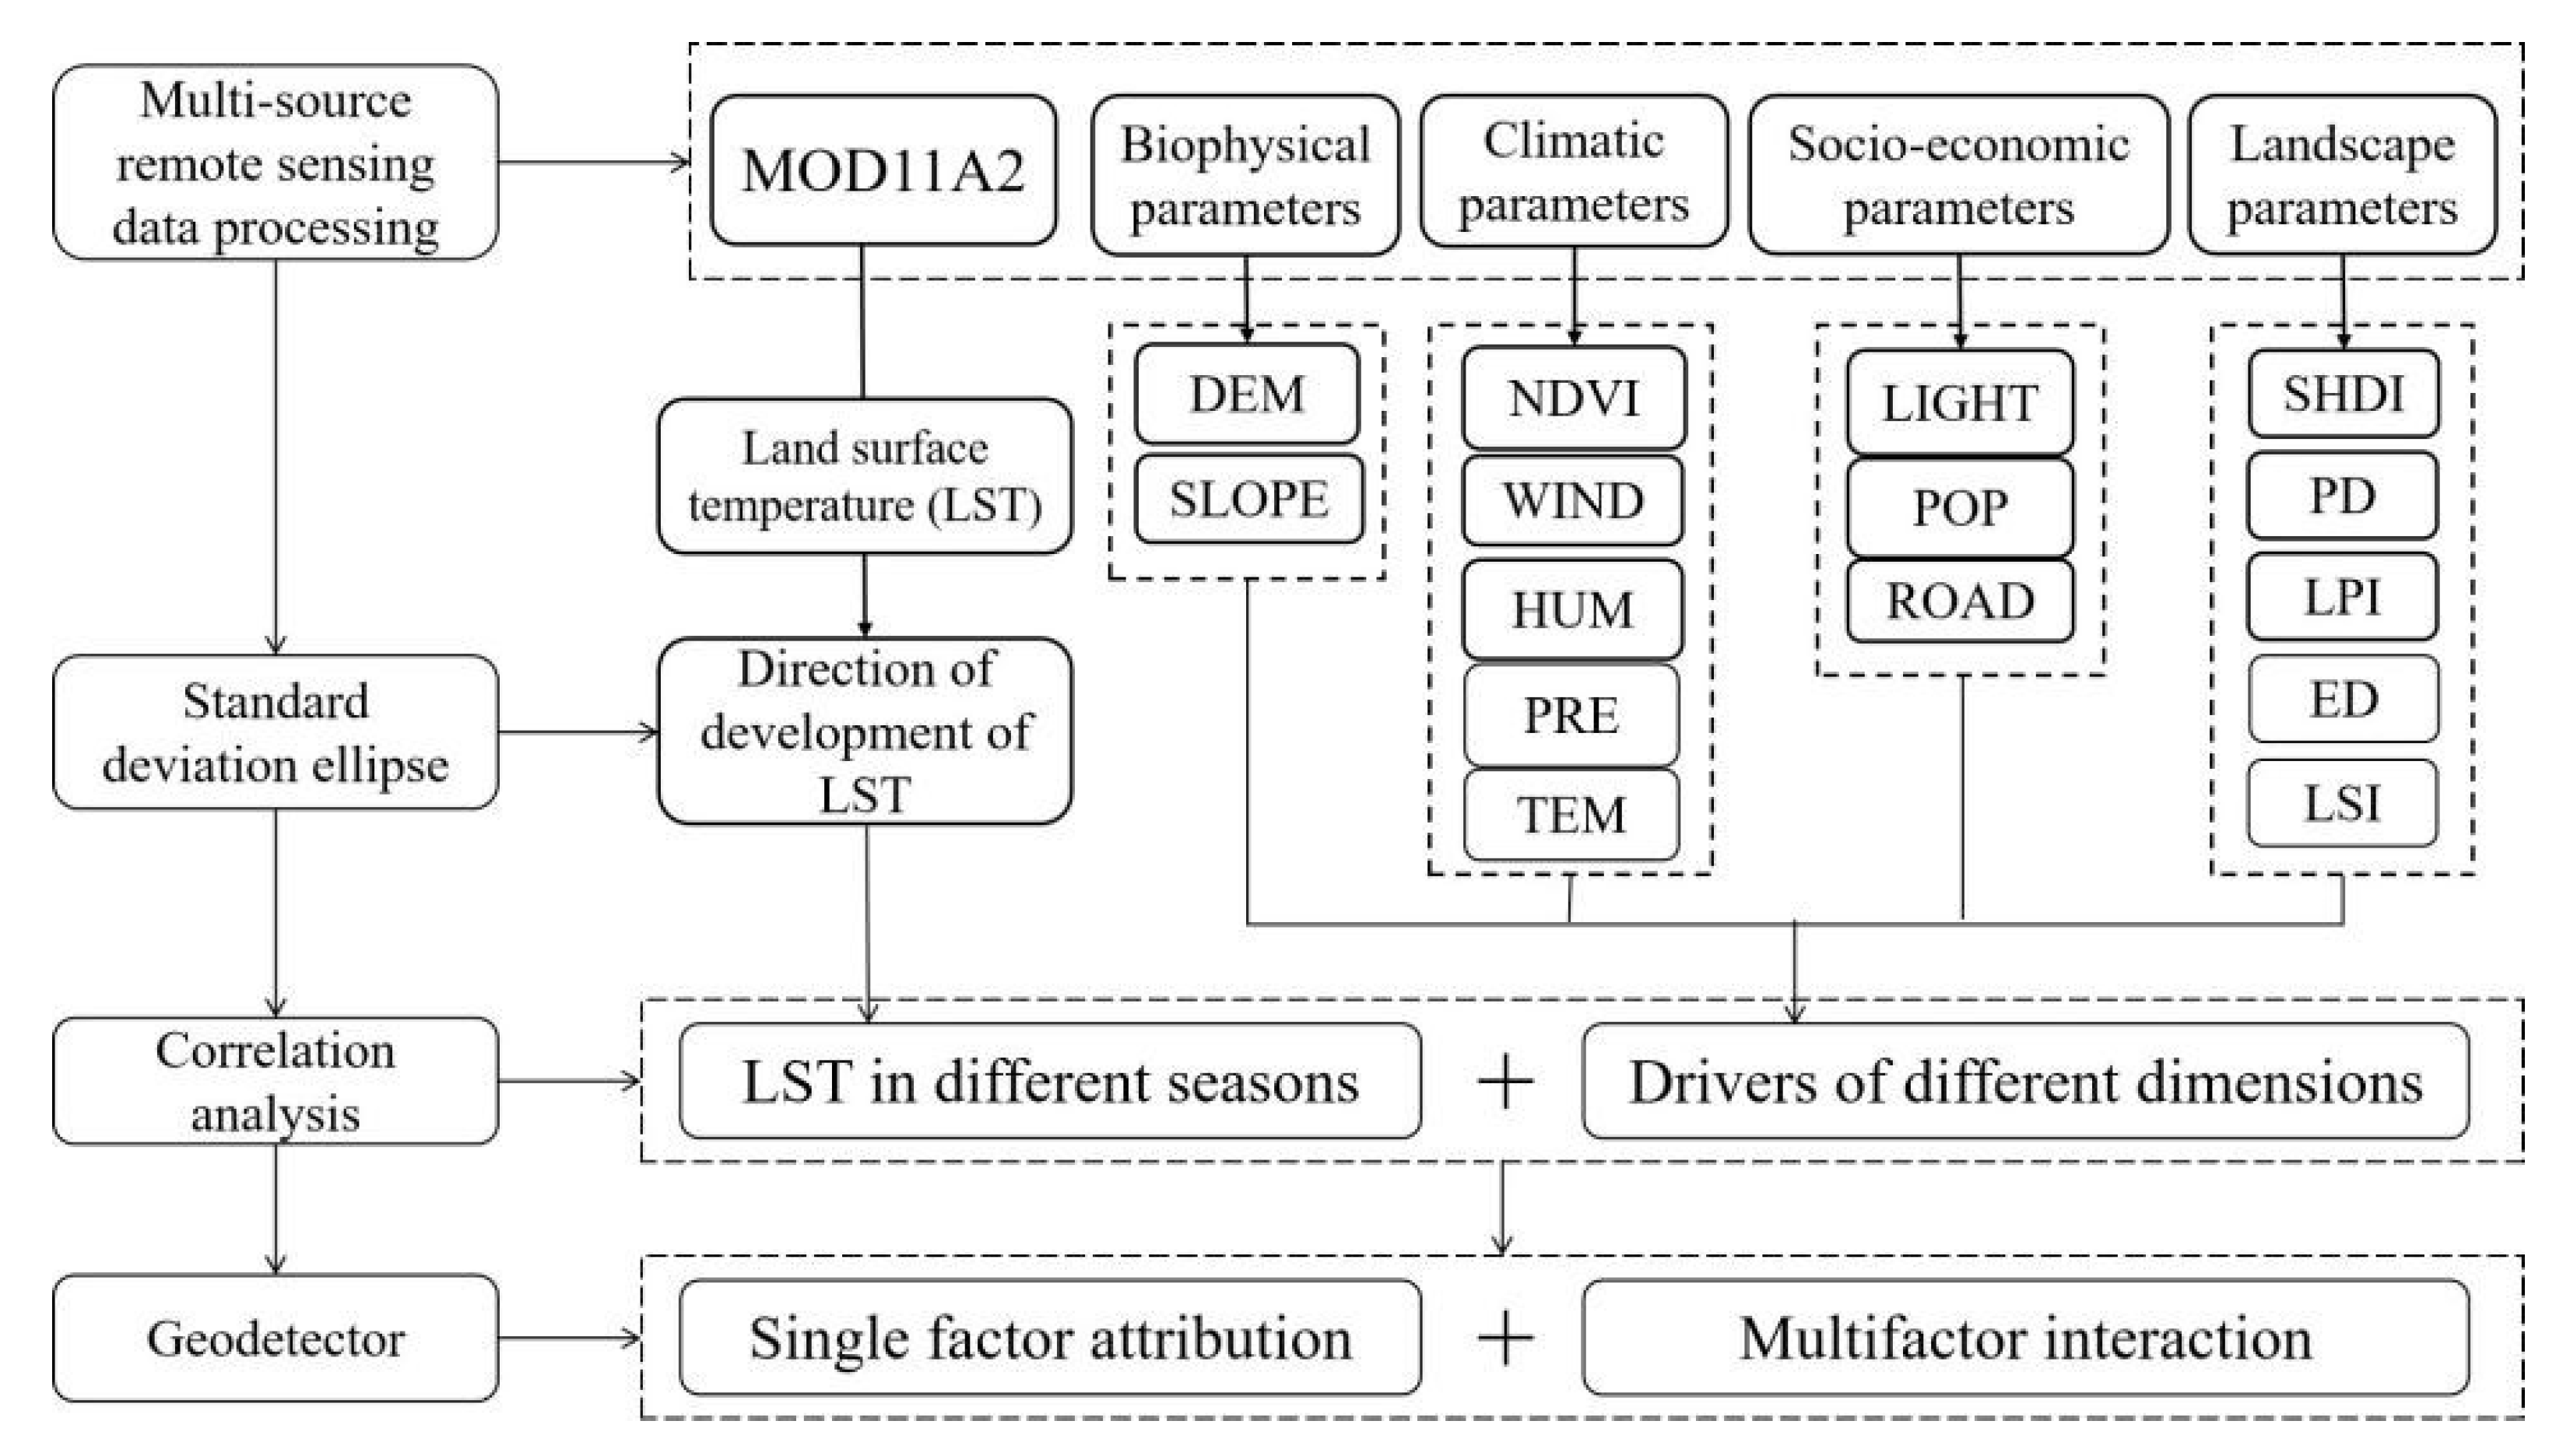
3.1. Data Source and Processing
3.2. Method
3.2.1. Landscape Pattern Index
3.2.2. Standard Deviation Ellipse
3.2.3. Correlation Analysis
3.2.4. Geo-Detector
4. Results
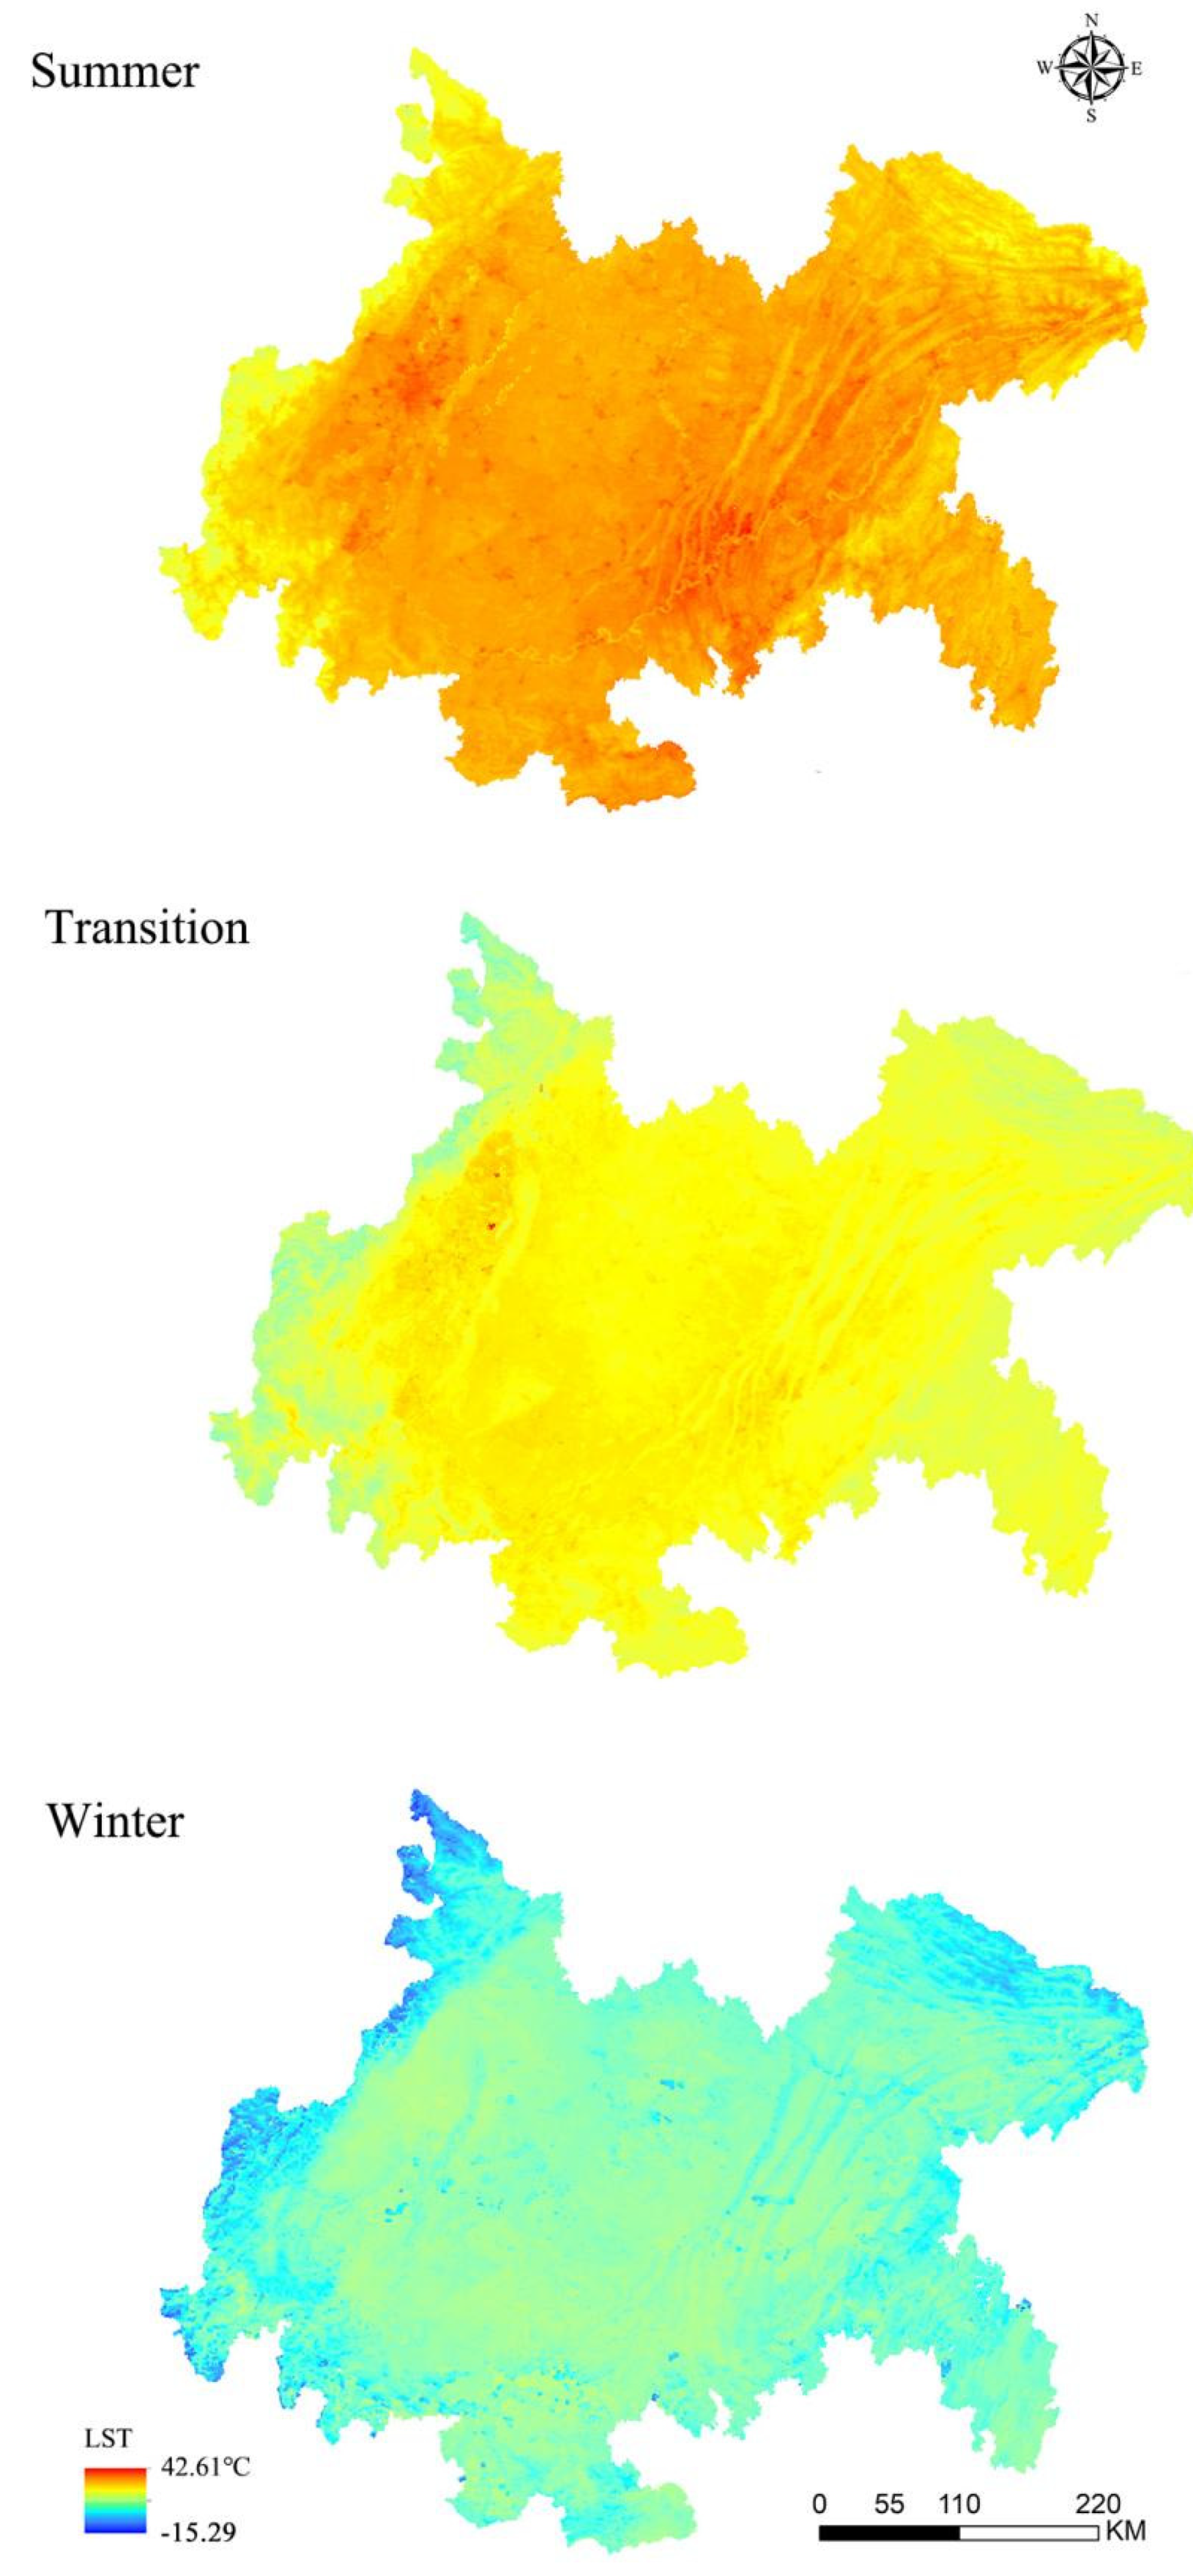
4.1. Spatial Pattern of LST in Different Seasons
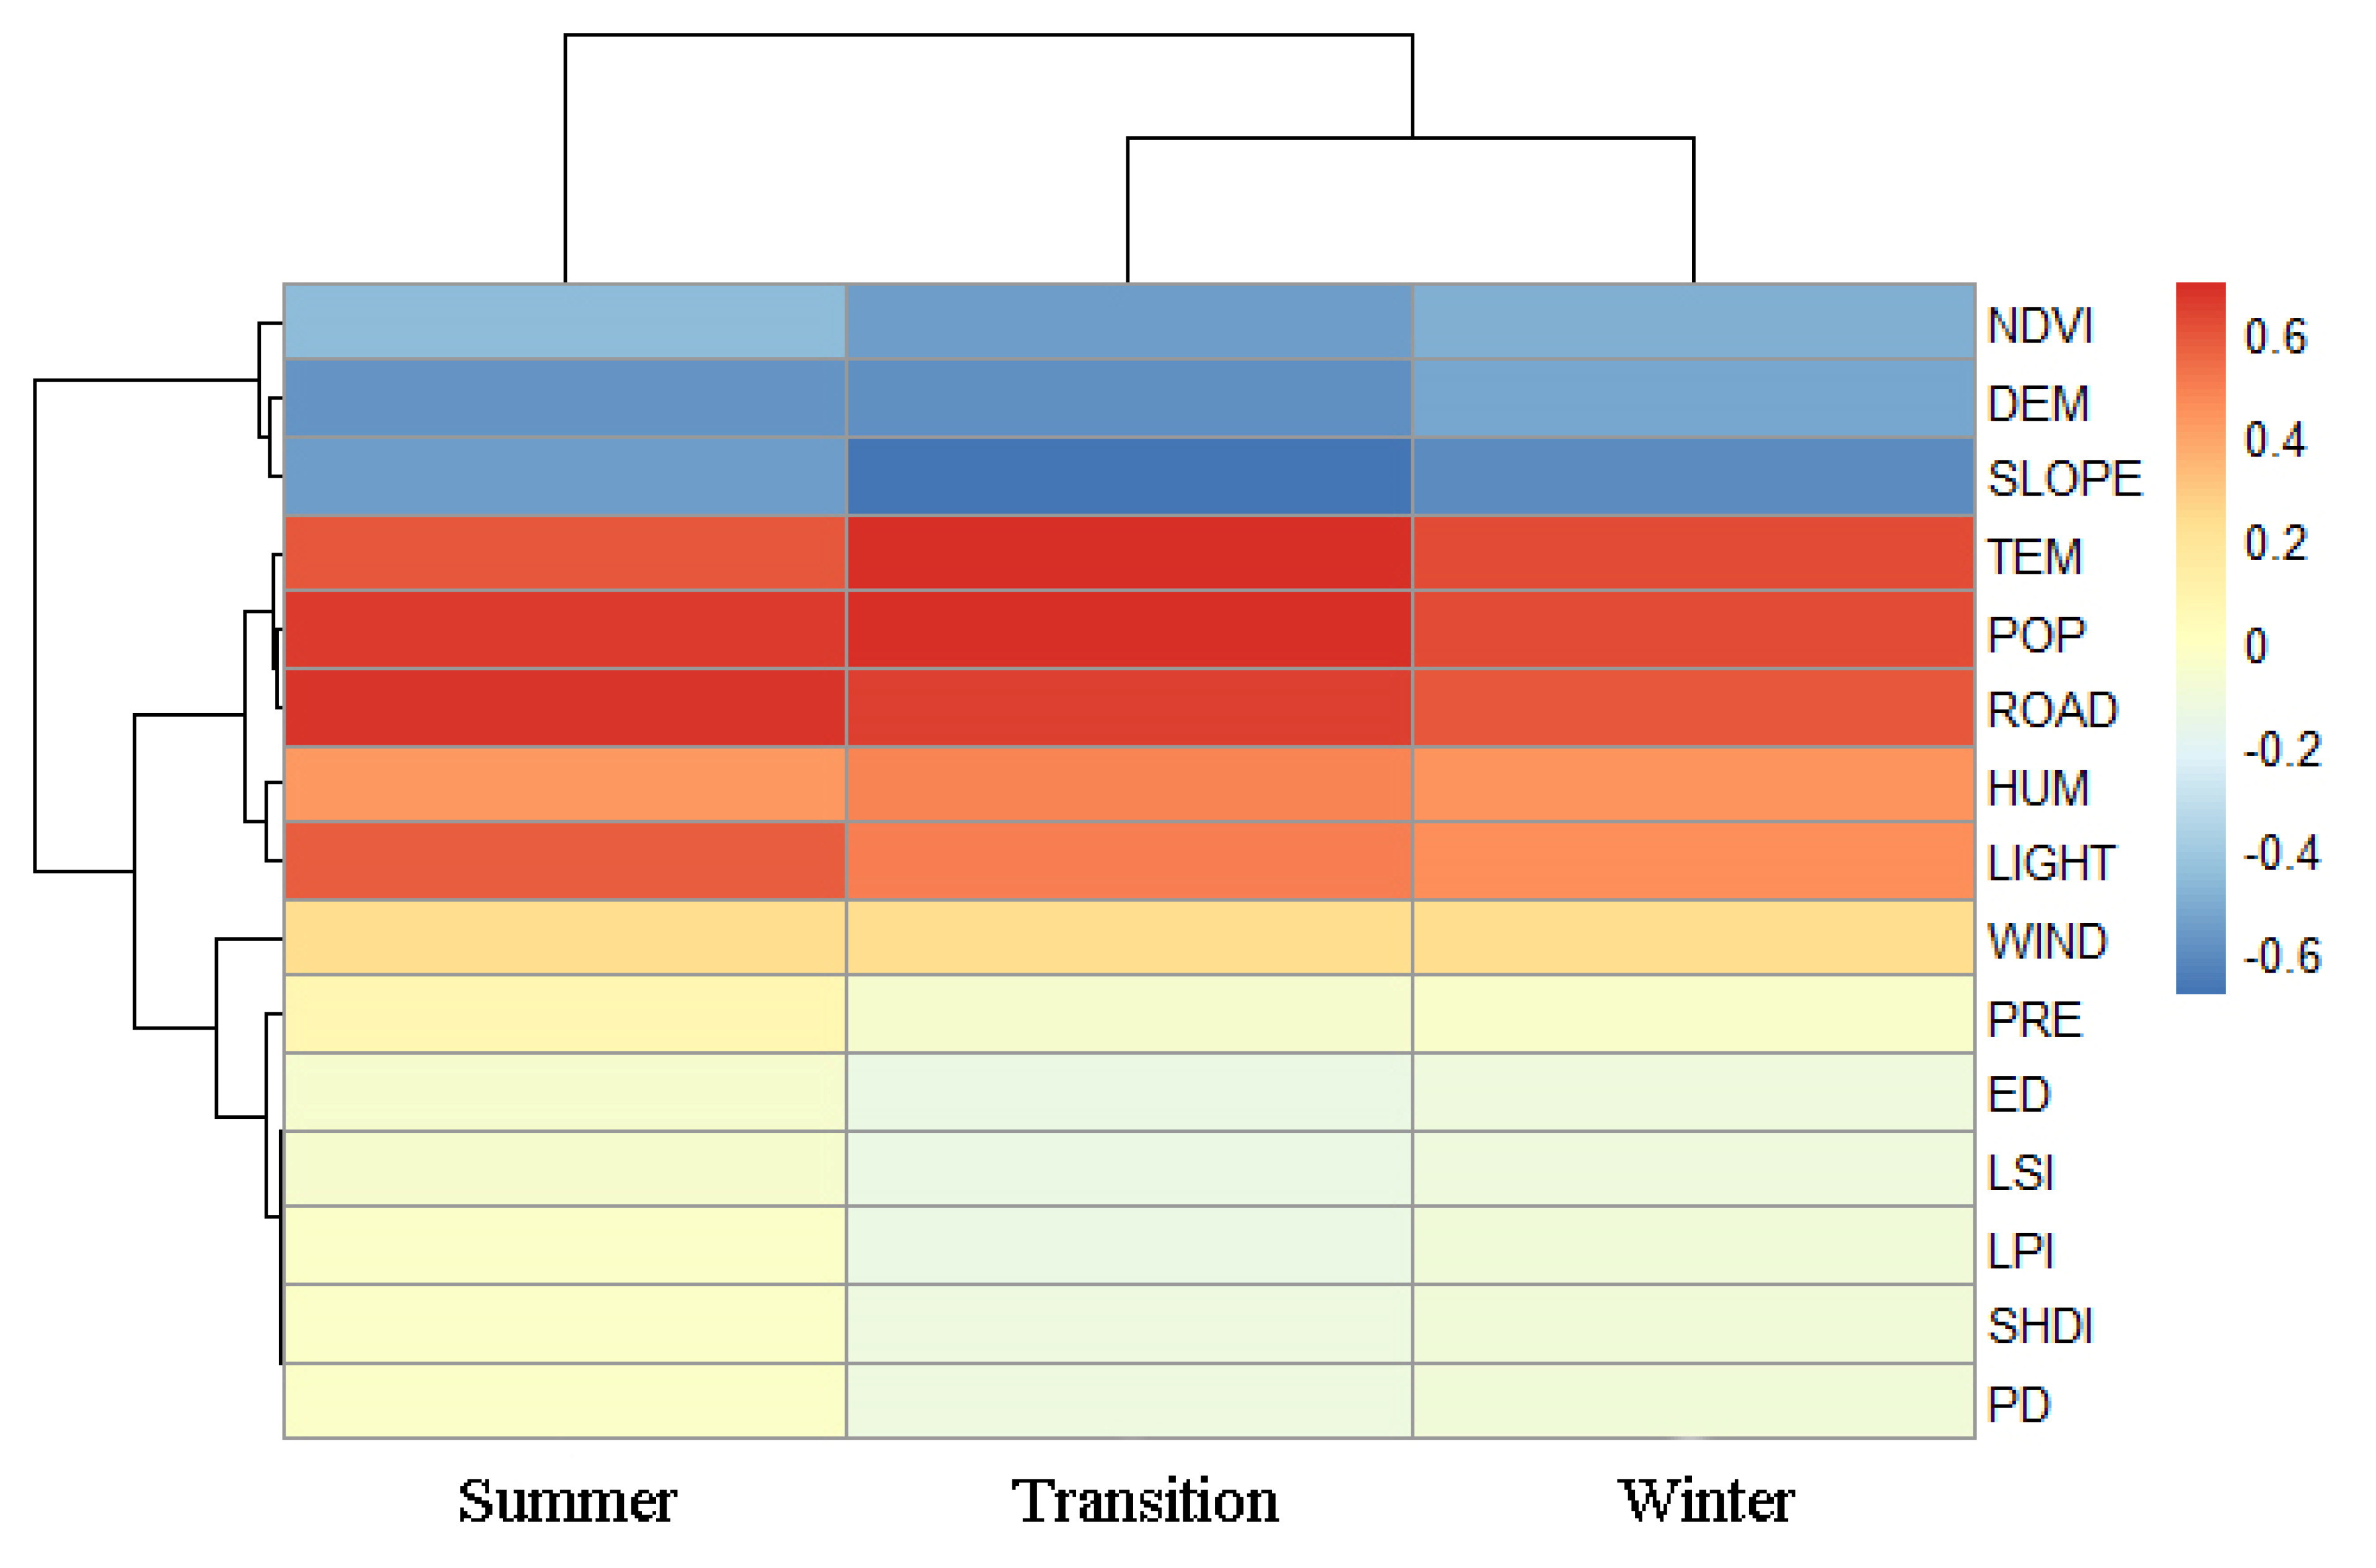
4.2. Correlation Analysis between LST and Influencing Factors in Different Seasons
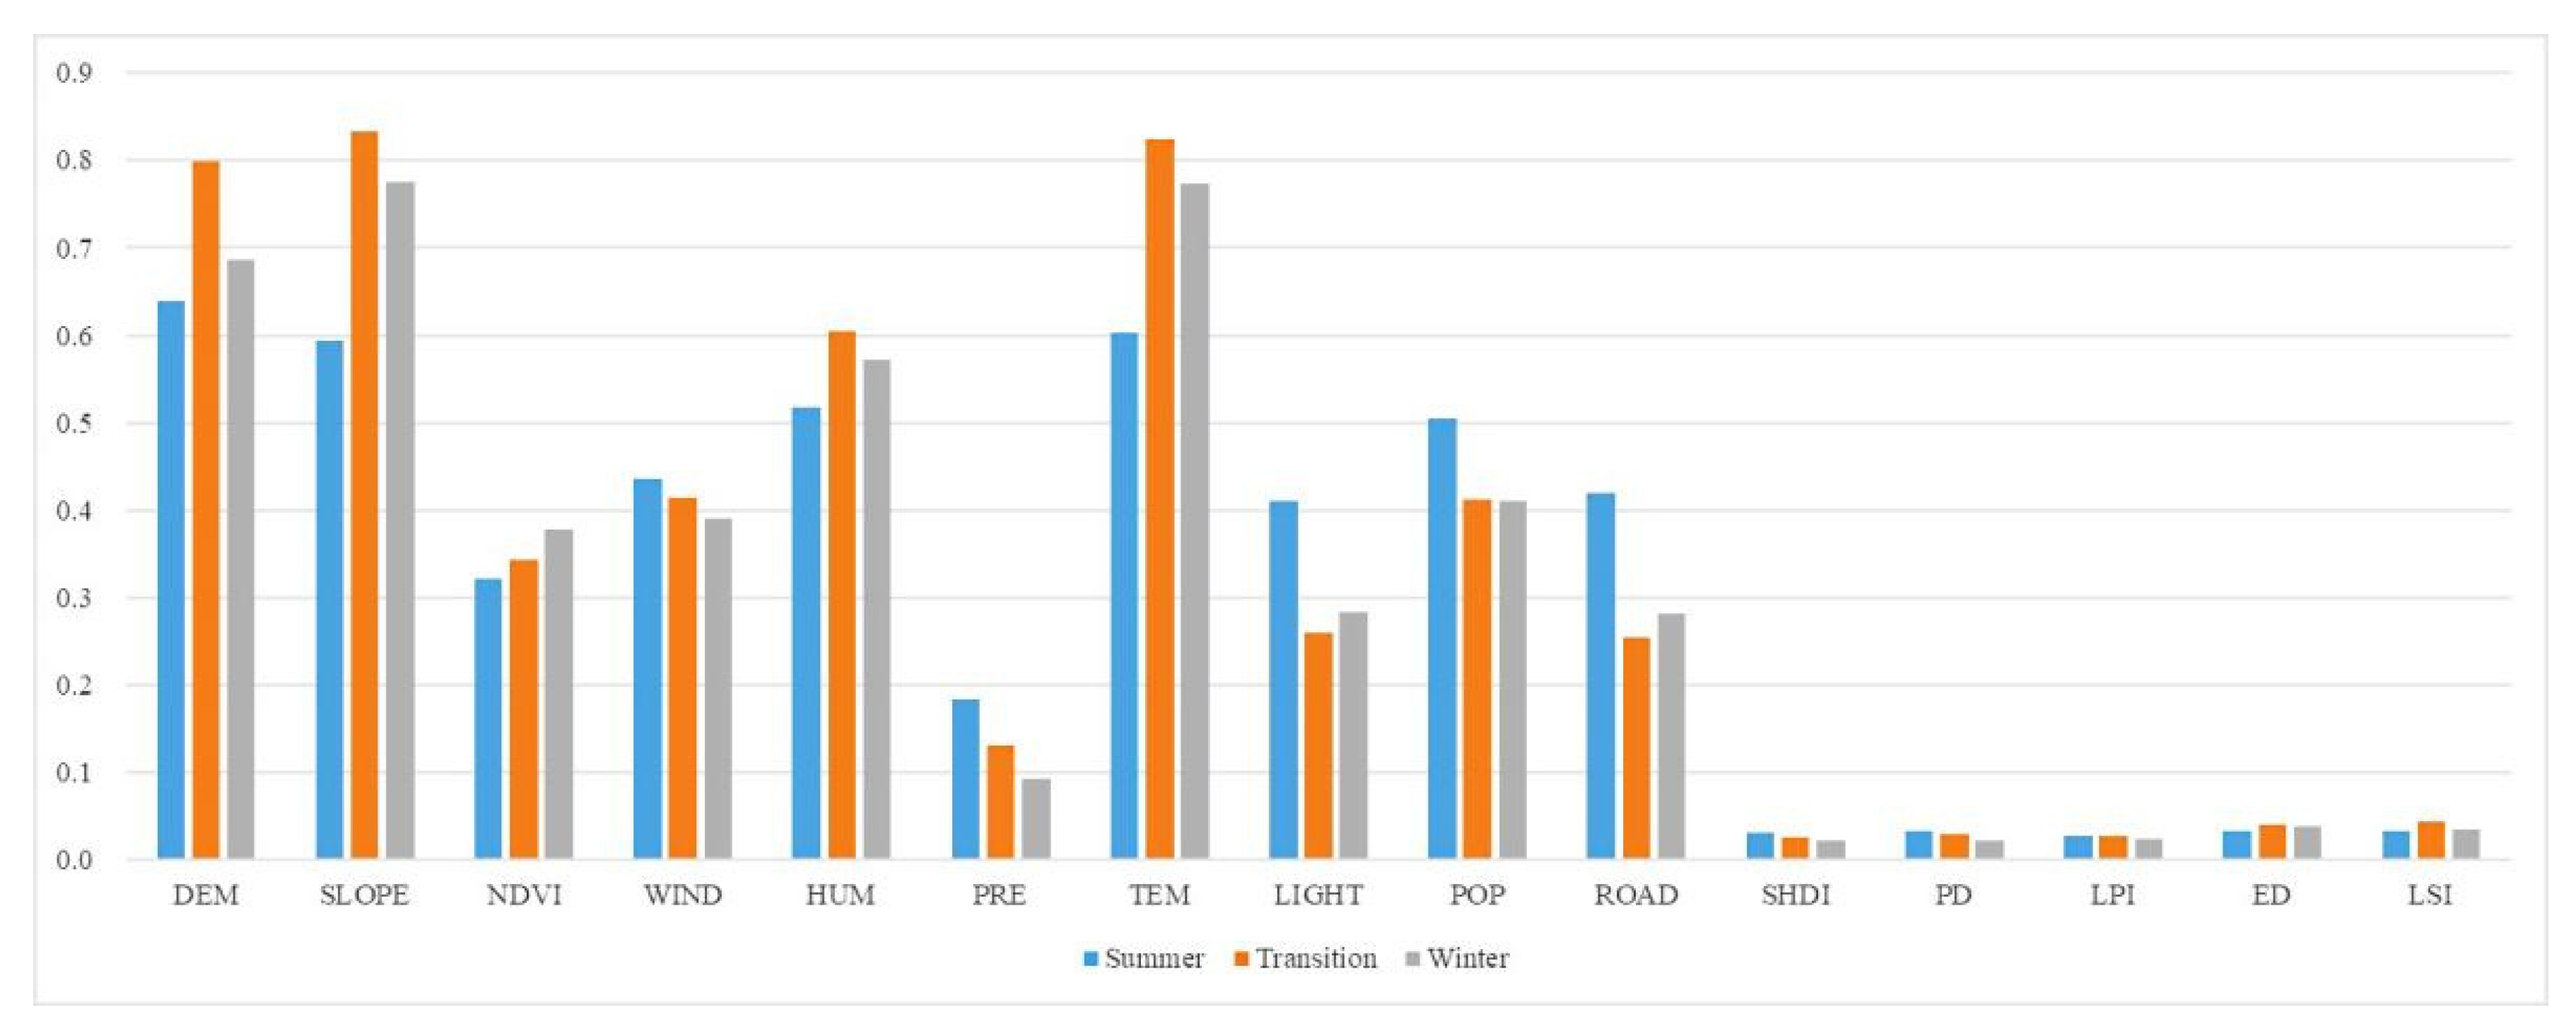
4.3. Single Factor Attribution of LST in Different Seasons
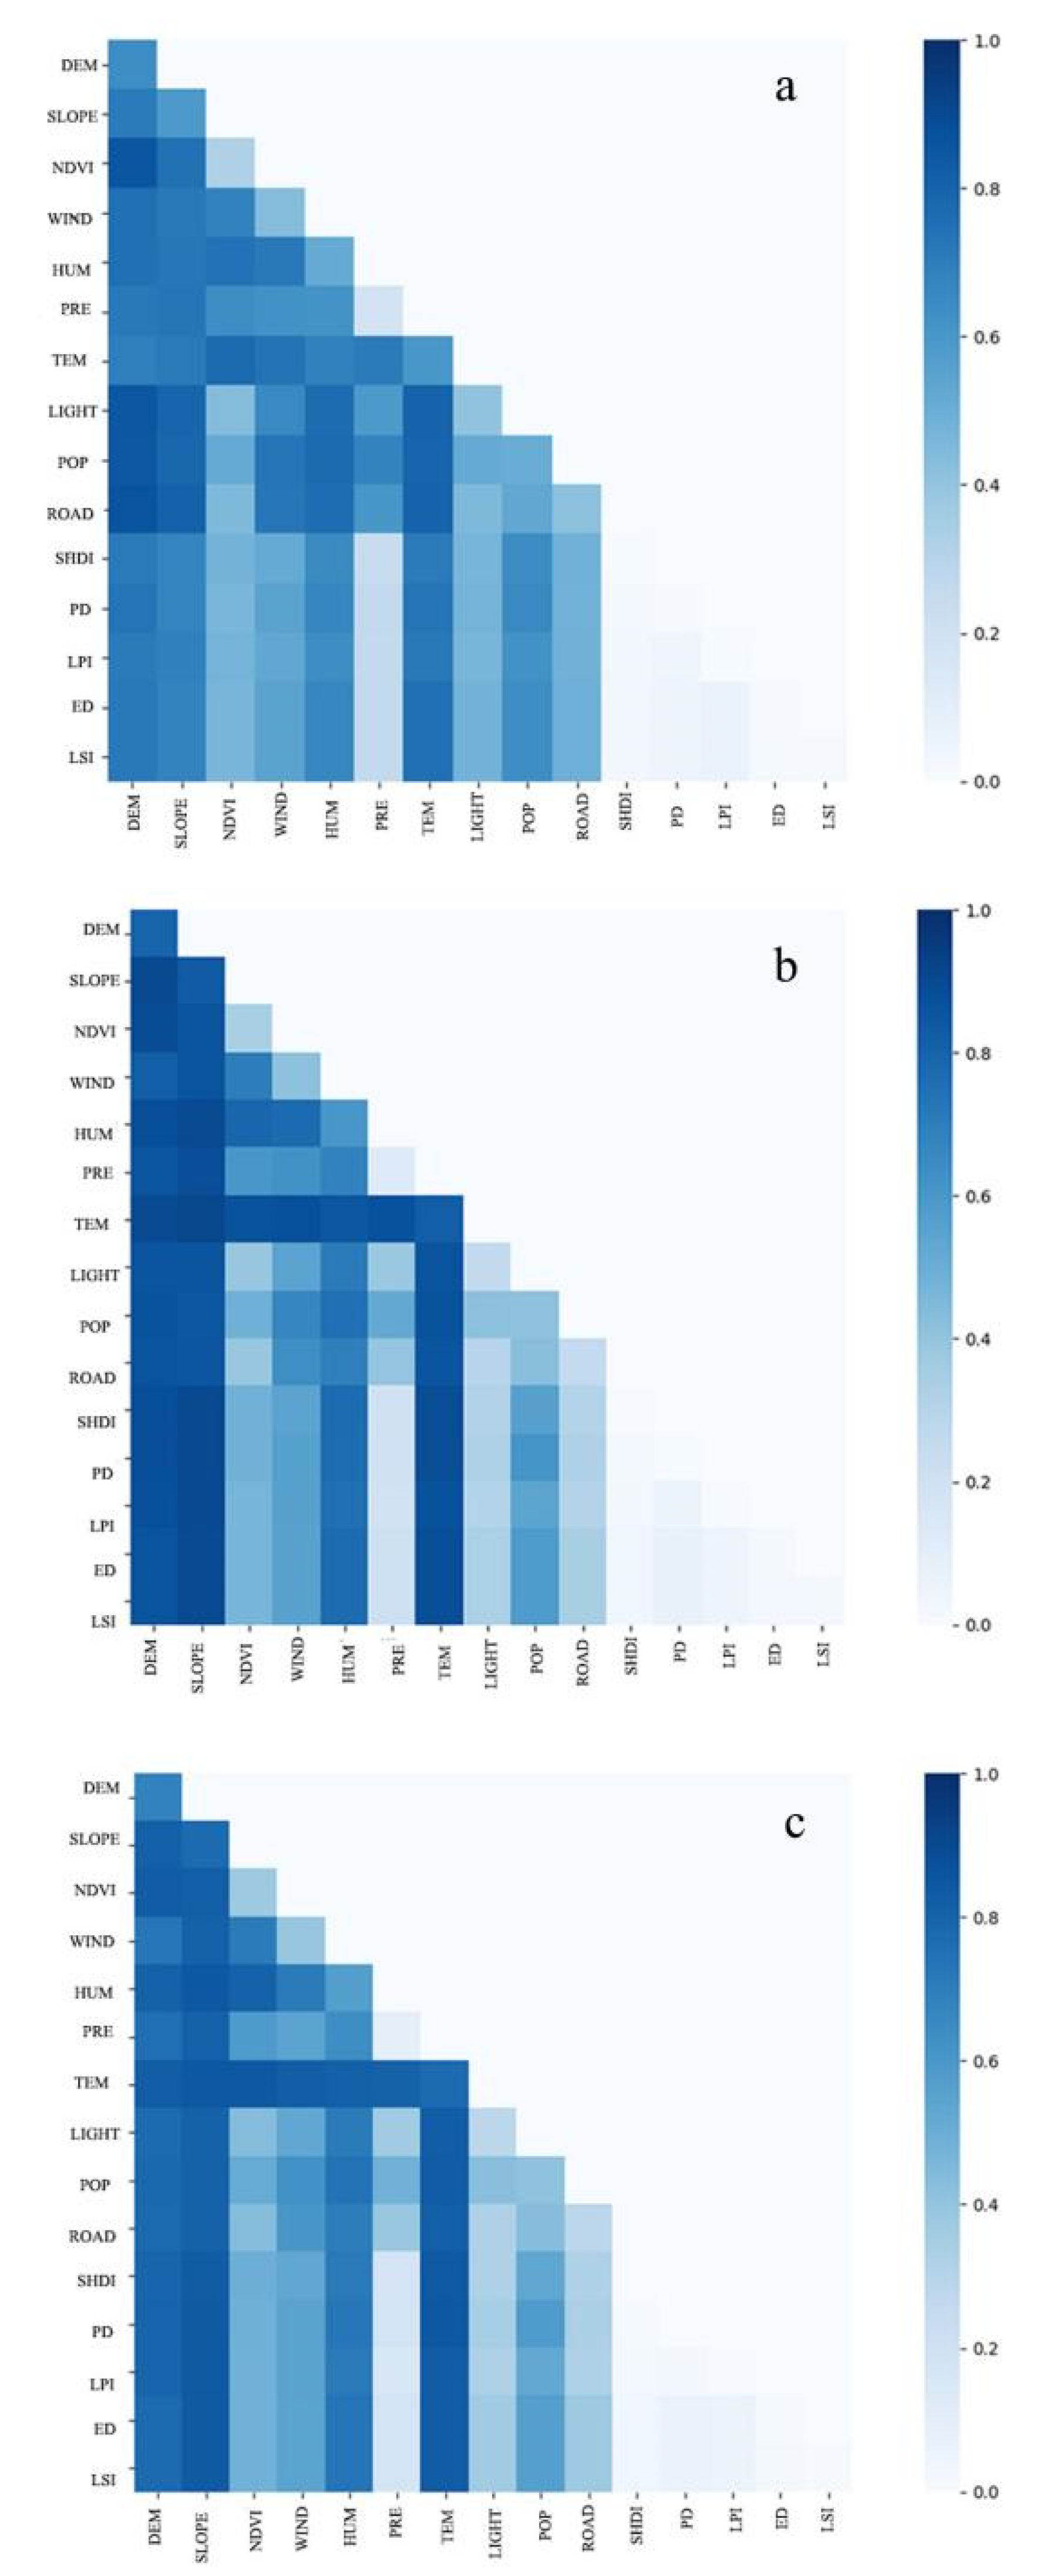
4.4. Interaction of Influencing Factors of LST in Different Seasons
5. Discussion
5.1. Spatial Pattern of LST
5.2. Influencing Factors of LST
5.3. Research Limitations
6. Conclusions
Author Contributions
Funding
Data Availability Statement
Conflicts of Interest
References
- Grimm, N.B.; Faeth, S.H.; Golubiewski, N.E.; Redman, C.L.; Wu, J.; Bai, X.; Briggs, J.M. Global Change and the Ecology of Cities. Science 2008, 319, 756–760. [Google Scholar] [CrossRef] [PubMed] [Green Version]
- Oke, T.R. City Size and the Urban Heat Island. Atmos. Environ. 1973, 7, 769–779. [Google Scholar] [CrossRef]
- Voogt, J.A.; Oke, T.R. Thermal Remote Sensing of Urban Climates. Remote Sens. Environ. 2003, 86, 370–384. [Google Scholar] [CrossRef]
- Liu, Y.; Li, Q.; Yang, L.; Mu, K.; Zhang, M.; Liu, J. Urban Heat Island Effects of Various Urban Morphologies under Regional Climate Conditions. Sci. Total Environ. 2020, 743, 140589. [Google Scholar] [CrossRef] [PubMed]
- He, B.-J.; Wang, J.; Liu, H.; Ulpiani, G. Localized Synergies between Heat Waves and Urban Heat Islands: Implications on Human Thermal Comfort and Urban Heat Management. Environ. Res. 2021, 193, 110584. [Google Scholar] [CrossRef]
- Tan, J.; Zheng, Y.; Tang, X.; Guo, C.; Li, L.; Song, G.; Zhen, X.; Yuan, D.; Kalkstein, A.J.; Li, F.; et al. The Urban Heat Island and Its Impact on Heat Waves and Human Health in Shanghai. Int. J. Biometeorol. 2010, 54, 75–84. [Google Scholar] [CrossRef]
- Zander, K.K.; Botzen, W.J.W.; Oppermann, E.; Kjellstrom, T.; Garnett, S.T. Heat Stress Causes Substantial Labour Productivity Loss in Australia. Nat. Clim. Chang. 2015, 5, 647–651. [Google Scholar] [CrossRef]
- Elliot, T.; Babí Almenar, J.; Rugani, B. Modelling the Relationships between Urban Land Cover Change and Local Climate Regulation to Estimate Urban Heat Island Effect. Urban For. Urban Green. 2020, 50, 126650. [Google Scholar] [CrossRef]
- Li, X.; Zhou, Y.; Yu, S.; Jia, G.; Li, H.; Li, W. Urban Heat Island Impacts on Building Energy Consumption: A Review of Approaches and Findings. Energy 2019, 174, 407–419. [Google Scholar] [CrossRef]
- Yuan, B.; Zhou, L.; Dang, X.; Sun, D.; Hu, F.; Mu, H. Separate and Combined Effects of 3D Building Features and Urban Green Space on Land Surface Temperature. J. Environ. Manag. 2021, 295, 113116. [Google Scholar] [CrossRef]
- Yang, J.; Wang, Y.; Xue, B.; Li, Y.; Xiao, X.; Xia, J.C.; He, B. Contribution of Urban Ventilation to the Thermal Environment and Urban Energy Demand: Different Climate Background Perspectives. Sci. Total Environ. 2021, 795, 148791. [Google Scholar] [CrossRef] [PubMed]
- Ma, L.; Yang, Z.; Zhou, L.; Lu, H.; Yin, G. Local Climate Zones Mapping Using Object-Based Image Analysis and Validation of Its Effectiveness through Urban Surface Temperature Analysis in China. Build. Environ. 2021, 206, 108348. [Google Scholar] [CrossRef]
- He, B.-J.; Zhao, Z.-Q.; Shen, L.-D.; Wang, H.-B.; Li, L.-G. An Approach to Examining Performances of Cool/Hot Sources in Mitigating/Enhancing Land Surface Temperature under Different Temperature Backgrounds Based on Landsat 8 Image. Sustain. Cities Soc. 2019, 44, 416–427. [Google Scholar] [CrossRef]
- Yang, J.; Zhan, Y.; Xiao, X.; Xia, J.C.; Sun, W.; Li, X. Investigating the Diversity of Land Surface Temperature Characteristics in Different Scale Cities Based on Local Climate Zones. Urban Clim. 2020, 34, 100700. [Google Scholar] [CrossRef]
- Chen, M.; Zhou, Y.; Hu, M.; Zhou, Y. Influence of Urban Scale and Urban Expansion on the Urban Heat Island Effect in Metropolitan Areas: Case Study of Beijing–Tianjin–Hebei Urban Agglomeration. Remote Sens. 2020, 12, 3491. [Google Scholar] [CrossRef]
- Imhoff, M.L.; Zhang, P.; Wolfe, R.E.; Bounoua, L. Remote Sensing of the Urban Heat Island Effect across Biomes in the Continental USA. Remote Sens. Environ. 2010, 114, 504–513. [Google Scholar] [CrossRef] [Green Version]
- Peng, J.; Jia, J.; Liu, Y.; Li, H.; Wu, J. Seasonal Contrast of the Dominant Factors for Spatial Distribution of Land Surface Temperature in Urban Areas. Remote Sens. Environ. 2018, 215, 255–267. [Google Scholar] [CrossRef]
- Zhao, Z.; Sharifi, A.; Dong, X.; Shen, L.; He, B.-J. Spatial Variability and Temporal Heterogeneity of Surface Urban Heat Island Patterns and the Suitability of Local Climate Zones for Land Surface Temperature Characterization. Remote Sens. 2021, 13, 4338. [Google Scholar] [CrossRef]
- Yang, J.; Yang, Y.; Sun, D.; Jin, C.; Xiao, X. Influence of Urban Morphological Characteristics on Thermal Environment. Sustain. Cities Soc. 2021, 72, 103045. [Google Scholar] [CrossRef]
- Gao, Y.; Zhao, J.; Han, L. Exploring the Spatial Heterogeneity of Urban Heat Island Effect and Its Relationship to Block Morphology with the Geographically Weighted Regression Model. Sustain. Cities Soc. 2022, 76, 103431. [Google Scholar] [CrossRef]
- Li, L.; Zha, Y.; Zhang, J. Spatially Non-Stationary Effect of Underlying Driving Factors on Surface Urban Heat Islands in Global Major Cities. Int. J. Appl. Earth Obs. Geoinf. 2020, 90, 102131. [Google Scholar] [CrossRef]
- Xiang, Y.; Huang, C.; Huang, X.; Zhou, Z.; Wang, X. Seasonal Variations of the Dominant Factors for Spatial Heterogeneity and Time Inconsistency of Land Surface Temperature in an Urban Agglomeration of Central China. Sustain. Cities Soc. 2021, 75, 103285. [Google Scholar] [CrossRef]
- Liu, H.; Huang, B.; Zhan, Q.; Gao, S.; Li, R.; Fan, Z. The Influence of Urban Form on Surface Urban Heat Island and Its Planning Implications: Evidence from 1288 Urban Clusters in China. Sustain. Cities Soc. 2021, 71, 102987. [Google Scholar] [CrossRef]
- Sun, D.; Hu, C.; Wang, Y.; Wang, Z.; Zhang, J. Examining Spatio-Temporal Characteristics of Urban Heat Islands and Factors Driving Them in Hangzhou, China. IEEE J. Sel. Top. Appl. Earth Obs. Remote Sens. 2021, 14, 8316–8325. [Google Scholar] [CrossRef]
- Guo, A.; Yang, J.; Xiao, X.; Xia, J.; Jin, C.; Li, X. Influences of Urban Spatial Form on Urban Heat Island Effects at the Community Level in China. Sustain. Cities Soc. 2020, 53, 101972. [Google Scholar] [CrossRef]
- Haashemi, S.; Weng, Q.; Darvishi, A.; Alavipanah, S. Seasonal Variations of the Surface Urban Heat Island in a Semi-Arid City. Remote Sens. 2016, 8, 352. [Google Scholar] [CrossRef] [Green Version]
- Manoli, G.; Fatichi, S.; Bou-Zeid, E.; Katul, G.G. Seasonal Hysteresis of Surface Urban Heat Islands. Proc. Natl. Acad. Sci. USA 2020, 117, 7082–7089. [Google Scholar] [CrossRef]
- Yang, J.; Jin, S.; Xiao, X.; Jin, C.; Xia, J.C.; Li, X.; Wang, S. Local Climate Zone Ventilation and Urban Land Surface Temperatures: Towards a Performance-Based and Wind-Sensitive Planning Proposal in Megacities. Sustain. Cities Soc. 2019, 47, 101487. [Google Scholar] [CrossRef]
- Ren, Y.; Deng, L.-Y.; Zuo, S.-D.; Song, X.-D.; Liao, Y.-L.; Xu, C.-D.; Chen, Q.; Hua, L.-Z.; Li, Z.-W. Quantifying the Influences of Various Ecological Factors on Land Surface Temperature of Urban Forests. Environ. Pollut. 2016, 216, 519–529. [Google Scholar] [CrossRef] [Green Version]
- Feng, R.; Wang, F.; Wang, K.; Wang, H.; Li, L. Urban Ecological Land and Natural-Anthropogenic Environment Interactively Drive Surface Urban Heat Island: An Urban Agglomeration-Level Study in China. Environ. Int. 2021, 157, 106857. [Google Scholar] [CrossRef]
- Sarangi, C.; Tripathi, S.N.; Qian, Y.; Kumar, S.; Ruby Leung, L. Aerosol and Urban Land Use Effect on Rainfall Around Cities in Indo-Gangetic Basin From Observations and Cloud Resolving Model Simulations. J. Geophys. Res. Atmos. 2018, 123, 3645–3667. [Google Scholar] [CrossRef]
- Guo, J.; Han, G.; Xie, Y.; Cai, Z.; Zhao, Y. Exploring the Relationships between Urban Spatial Form Factors and Land Surface Temperature in Mountainous Area: A Case Study in Chongqing City, China. Sustain. Cities Soc. 2020, 61, 102286. [Google Scholar] [CrossRef]
- Wu, S.; Yang, H.; Luo, P.; Luo, C.; Li, H.; Liu, M.; Ruan, Y.; Zhang, S.; Xiang, P.; Jia, H.; et al. The Effects of the Cooling Efficiency of Urban Wetlands in an Inland Megacity: A Case Study of Chengdu, Southwest China. Build. Environ. 2021, 204, 108128. [Google Scholar] [CrossRef]
- Luo, X.; Yang, J.; Sun, W.; He, B. Suitability of Human Settlements in Mountainous Areas from the Perspective of Ventilation: A Case Study of the Main Urban Area of Chongqing. J. Clean. Prod. 2021, 310, 127467. [Google Scholar] [CrossRef]
- Rigo, G.; Parlow, E.; Oesch, D. Validation of Satellite Observed Thermal Emission with In-Situ Measurements over an Urban Surface. Remote Sens. Environ. 2006, 104, 201–210. [Google Scholar] [CrossRef]
- Wan, Z. New Refinements and Validation of the MODIS Land-Surface Temperature/Emissivity Products. Remote Sens. Environ. 2008, 112, 59–74. [Google Scholar] [CrossRef]
- Chen, T.; Feng, Z.; Zhao, H.; Wu, K. Identification of Ecosystem Service Bundles and Driving Factors in Beijing and Its Surrounding Areas. Sci. Total Environ. 2020, 711, 134687. [Google Scholar] [CrossRef]
- Zhou, W.; Huang, G.; Cadenasso, M.L. Does Spatial Configuration Matter? Understanding the Effects of Land Cover Pattern on Land Surface Temperature in Urban Landscapes. Landsc. Urban Plan. 2011, 102, 54–63. [Google Scholar] [CrossRef]
- Hu, Y.; Hou, M.; Jia, G.; Zhao, C.; Zhen, X.; Xu, Y. Comparison of Surface and Canopy Urban Heat Islands within Megacities of Eastern China. ISPRS J. Photogramm. Remote Sens. 2019, 156, 160–168. [Google Scholar] [CrossRef]
- Liu, Y.; Peng, J.; Wang, Y. Efficiency of Landscape Metrics Characterizing Urban Land Surface Temperature. Landsc. Urban Plan. 2018, 180, 36–53. [Google Scholar] [CrossRef]
- Zhou, D.; Zhao, S.; Liu, S.; Zhang, L.; Zhu, C. Surface Urban Heat Island in China’s 32 Major Cities: Spatial Patterns and Drivers. Remote Sens. Environ. 2014, 152, 51–61. [Google Scholar] [CrossRef]
- Wang, L.; Chen, L. The Impact of New Transportation Modes on Population Distribution in Jing-Jin-Ji Region of China. Sci. Data 2018, 5, 170204. [Google Scholar] [CrossRef] [PubMed] [Green Version]
- Yang, Q.; Huang, X.; Tang, Q. Irrigation Cooling Effect on Land Surface Temperature across China Based on Satellite Observations. Sci. Total Environ. 2020, 705, 135984. [Google Scholar] [CrossRef]
- Weng, Q.; Lu, D.; Schubring, J. Estimation of Land Surface Temperature–Vegetation Abundance Relationship for Urban Heat Island Studies. Remote Sens. Environ. 2004, 89, 467–483. [Google Scholar] [CrossRef]
- Ren, J.; Yang, J.; Zhang, Y.; Xiao, X.; Xia, J.C.; Li, X.; Wang, S. Exploring Thermal Comfort of Urban Buildings Based on Local Climate Zones. J. Clean. Prod. 2022, 340, 130744. [Google Scholar] [CrossRef]
- Sun, R.; Lü, Y.; Yang, X.; Chen, L. Understanding the Variability of Urban Heat Islands from Local Background Climate and Urbanization. J. Clean. Prod. 2019, 208, 743–752. [Google Scholar] [CrossRef]
- Zhou, D.; Zhang, L.; Li, D.; Huang, D.; Zhu, C. Climate–Vegetation Control on the Diurnal and Seasonal Variations of Surface Urban Heat Islands in China. Environ. Res. Lett. 2016, 11, 074009. [Google Scholar] [CrossRef]
- Yao, R.; Wang, L.; Huang, X.; Zhang, W.; Li, J.; Niu, Z. Interannual Variations in Surface Urban Heat Island Intensity and Associated Drivers in China. J. Environ. Manag. 2018, 222, 86–94. [Google Scholar] [CrossRef]
- Gedzelman, S.D.; Austin, S.; Cermak, R.; Stefano, N.; Partridge, S.; Quesenberry, S.; Robinson, D.A. Mesoscale Aspects of the Urban Heat Island around New York City. Theor. Appl. Climatol. 2003, 75, 29–42. [Google Scholar] [CrossRef]
- Manoli, G.; Fatichi, S.; Schläpfer, M.; Yu, K.; Crowther, T.W.; Meili, N.; Burlando, P.; Katul, G.G.; Bou-Zeid, E. Magnitude of Urban Heat Islands Largely Explained by Climate and Population. Nature 2019, 573, 55–60. [Google Scholar] [CrossRef]
- Cao, C.; Lee, X.; Liu, S.; Schultz, N.; Xiao, W.; Zhang, M.; Zhao, L. Urban Heat Islands in China Enhanced by Haze Pollution. Nat. Commun. 2016, 7, 12509. [Google Scholar] [CrossRef] [PubMed]
- Connors, J.P.; Galletti, C.S.; Chow, W.T.L. Landscape Configuration and Urban Heat Island Effects: Assessing the Relationship between Landscape Characteristics and Land Surface Temperature in Phoenix, Arizona. Landsc. Ecol. 2013, 28, 271–283. [Google Scholar] [CrossRef]
- Buyantuyev, A.; Wu, J. Urban Heat Islands and Landscape Heterogeneity: Linking Spatiotemporal Variations in Surface Temperatures to Land-Cover and Socioeconomic Patterns. Landsc. Ecol. 2010, 25, 17–33. [Google Scholar] [CrossRef]
- Yao, L.; Xu, Y.; Zhang, B. Effect of Urban Function and Landscape Structure on the Urban Heat Island Phenomenon in Beijing, China. Landsc. Ecol. Eng. 2019, 15, 379–390. [Google Scholar] [CrossRef]
- Li, Y.; Sun, Y.; Li, J.; Gao, C. Socioeconomic Drivers of Urban Heat Island Effect: Empirical Evidence from Major Chinese Cities. Sustain. Cities Soc. 2020, 63, 102425. [Google Scholar] [CrossRef]
- Wang, W.; Yao, X.; Shu, J. Air Advection Induced Differences between Canopy and Surface Heat Islands. Sci. Total Environ. 2020, 725, 138120. [Google Scholar] [CrossRef]
- Zhou, D.; Bonafoni, S.; Zhang, L.; Wang, R. Remote Sensing of the Urban Heat Island Effect in a Highly Populated Urban Agglomeration Area in East China. Sci. Total Environ. 2018, 628–629, 415–429. [Google Scholar] [CrossRef]
- Chen, A.; Yao, L.; Sun, R.; Chen, L. How Many Metrics Are Required to Identify the Effects of the Landscape Pattern on Land Surface Temperature? Ecol. Indic. 2014, 45, 424–433. [Google Scholar] [CrossRef]
- Li, W.; Cao, Q.; Lang, K.; Wu, J. Linking Potential Heat Source and Sink to Urban Heat Island: Heterogeneous Effects of Landscape Pattern on Land Surface Temperature. Sci. Total Environ. 2017, 586, 457–465. [Google Scholar] [CrossRef]
- Zhou, D.; Xiao, J.; Bonafoni, S.; Berger, C.; Deilami, K.; Zhou, Y.; Frolking, S.; Yao, R.; Qiao, Z.; Sobrino, J. Satellite Remote Sensing of Surface Urban Heat Islands: Progress, Challenges, and Perspectives. Remote Sens. 2018, 11, 48. [Google Scholar] [CrossRef] [Green Version]
- He, B.-J.; Zhao, D.; Xiong, K.; Qi, J.; Ulpiani, G.; Pignatta, G.; Prasad, D.; Jones, P. A Framework for Addressing Urban Heat Challenges and Associated Adaptive Behavior by the Public and the Issue of Willingness to Pay for Heat Resilient Infrastructure in Chongqing, China. Sustain. Cities Soc. 2021, 75, 103361. [Google Scholar] [CrossRef]
- Zhao, D.; Arshad, M.; Wang, J.; Triantafilis, J. Soil Exchangeable Cations Estimation Using Vis-NIR Spectroscopy in Different Depths: Effects of Multiple Calibration Models and Spiking. Comput. Electron. Agric. 2021, 182, 105990. [Google Scholar] [CrossRef]
- Zhao, D.; Wang, J.; Zhao, X.; Triantafilis, J. Clay Content Mapping and Uncertainty Estimation Using Weighted Model Averaging. CATENA 2022, 209, 105791. [Google Scholar] [CrossRef]
- Shi, T.; Hu, Z.; Shi, Z.; Guo, L.; Chen, Y.; Li, Q.; Wu, G. Geo-Detection of Factors Controlling Spatial Patterns of Heavy Metals in Urban Topsoil Using Multi-Source Data. Sci. Total Environ. 2018, 643, 451–459. [Google Scholar] [CrossRef] [PubMed]
- Schatz, J.; Kucharik, C.J. Seasonality of the Urban Heat Island Effect in Madison, Wisconsin. J. Appl. Meteorol. Climatol. 2014, 53, 2371–2386. [Google Scholar] [CrossRef]
- Zhou, W.; Qian, Y.; Li, X.; Li, W.; Han, L. Relationships between Land Cover and the Surface Urban Heat Island: Seasonal Variability and Effects of Spatial and Thematic Resolution of Land Cover Data on Predicting Land Surface Temperatures. Landsc. Ecol. 2014, 29, 153–167. [Google Scholar] [CrossRef]
- McFeeters, S.K. The Use of the Normalized Difference Water Index (NDWI) in the Delineation of Open Water Features. Int. J. Remote Sens. 1996, 17, 1425–1432. [Google Scholar] [CrossRef]
- He, B.-J.; Ding, L.; Prasad, D. Wind-Sensitive Urban Planning and Design: Precinct Ventilation Performance and Its Potential for Local Warming Mitigation in an Open Midrise Gridiron Precinct. J. Build. Eng. 2020, 29, 101145. [Google Scholar] [CrossRef]


| Potential Drivers | Abbreviation | |
|---|---|---|
| Biophysical parameters | Digital Elevation Model | DEM |
| Slope | SLOPE | |
| NDVI | NDVI | |
| Climatic parameters | Wind speed | WIND |
| Humidity | HUM | |
| Precipitation | PRE | |
| Temperature | TEM | |
| Socio-economic parameters | Night light | LIGHT |
| Population density | POP | |
| Road network density | ROAD | |
| Landscape parameters | Shannon Diversity Index | SHDI |
| Patch Density | PD | |
| Largest Patch Index | LPI | |
| Edge Density | ED | |
| Landscape Shape Index | LSI |
| Landscape Pattern Index | Calculation Formula | Units | Ecological Meaning |
|---|---|---|---|
| SHDI | None | Reflect the richness of landscape types | |
| PD | n/km2 | It reflects the fragmentation of plaque | |
| LPI | Percent | It is helpful to determine the dominant types of landscape | |
| ED | m/ha | Reflecting the edge effect of landscape | |
| LSI | None | Reflect the shape complexity of the overall landscape |
| Seasons | Short Axis (X) (km) | Long Axis (Y) (km) | Rotation Angle (°) |
|---|---|---|---|
| Summer | 188,344.74 | 93,517.67 | 108.31 |
| Transition | 149,353.51 | 111,409.99 | 120.74 |
| Winter | 159,421.22 | 120,565.79 | 118.66 |
Publisher’s Note: MDPI stays neutral with regard to jurisdictional claims in published maps and institutional affiliations. |
© 2022 by the authors. Licensee MDPI, Basel, Switzerland. This article is an open access article distributed under the terms and conditions of the Creative Commons Attribution (CC BY) license (https://creativecommons.org/licenses/by/4.0/).
Share and Cite
Wang, Z.; Sun, D.; Hu, C.; Wang, Y.; Zhang, J. Seasonal Contrast and Interactive Effects of Potential Drivers on Land Surface Temperature in the Sichuan Basin, China. Remote Sens. 2022, 14, 1292. https://doi.org/10.3390/rs14051292
Wang Z, Sun D, Hu C, Wang Y, Zhang J. Seasonal Contrast and Interactive Effects of Potential Drivers on Land Surface Temperature in the Sichuan Basin, China. Remote Sensing. 2022; 14(5):1292. https://doi.org/10.3390/rs14051292
Chicago/Turabian StyleWang, Ziyi, Dongqi Sun, Chunguang Hu, Yu Wang, and Jingxiang Zhang. 2022. "Seasonal Contrast and Interactive Effects of Potential Drivers on Land Surface Temperature in the Sichuan Basin, China" Remote Sensing 14, no. 5: 1292. https://doi.org/10.3390/rs14051292
APA StyleWang, Z., Sun, D., Hu, C., Wang, Y., & Zhang, J. (2022). Seasonal Contrast and Interactive Effects of Potential Drivers on Land Surface Temperature in the Sichuan Basin, China. Remote Sensing, 14(5), 1292. https://doi.org/10.3390/rs14051292