1. Introduction
In recent years, marine aquaculture has flourished, fueled by the world’s rapidly growing demand for seafood [
1]. In most coastal areas, mariculture has developed into the backbone of the local rural industry [
2]. However, while bringing economic benefits, the rapidly developing mariculture industry is increasingly in conflict with the marine ecological environment. In an effort to pursue high productivity and high benefits, mariculture has developed in the direction of high density, intensification and scale-up, resulting in a high bioburden and high input aquaculture model which has caused a series of negative impacts on marine ecology [
3]. Raft aquaculture is the main method of marine aquaculture. It is important to know the location and distribution of marine raft aquaculture areas to reasonably lay the marine aquaculture sea, improve and protect the marine ecological environment, and promote the sustainable development of the mariculture economy. Satellite remote sensing earth observation technology has the advantages of large-area synchronous measurement, repeatability, low cost, and strong timeliness. It is an effective means to obtain large-scale marine raft aquaculture data [
4,
5,
6].
The floating raft inside the marine raft aquaculture area is made of plastic and other materials to build floats with hanging cages and slings and is fixed to the seabed with ropes [
7]. The main part of the structure is underwater, and only the float is exposed above the sea surface, which makes it difficult to monitor marine raft aquaculture areas using remote sensing technology.
In recent years, scholars have carried out a great deal of research on methods for monitoring marine raft aquaculture areas using remote sensing technology. Among them, research methods using optical remote sensing images are mainly divided into five categories. One is the visual interpretation methods, such as Chen et al. [
8]. The second is ratio band methods, such as the one Lu et al. [
9] used to extracted the marine raft aquaculture areas in Sanduao by constructing feature indices through spectral features. The third is the spatial feature analysis method, such as the one developed by Chu et al. [
10], which used texture information to extract the marine raft aquaculture area on GF1. The fourth is object-oriented methods, such as the one used by Wang Fang et al. [
11], which combined object-facing and association rule methods to extract mariculture areas. The fifth is deep learning methods. Liu et al. [
12] used the RCF network to extract the marine raft aquaculture areas from GF-2 images in Sanduao. Shi et al. [
13] improved the convolutional network based on FCN for automatic marking of marine raft aquaculture areas on GF1. Cui et al. [
14] improved the structure based on UNet to extract the marine raft aquaculture areas.
Although optical satellite imagery-based monitoring of marine raft aquaculture areas has been widely researched, optical imagery has difficulty stably acquiring effective images due to the complex meteorological and sea state in aquaculture areas [
15,
16]. An increasing number of scholars have extracted marine raft aquaculture areas from SAR images. Most studies use the method of artificial design feature fusion methods, and fewer are based on deep learning. Chou et al. [
17] took SAR images of Changhai County as an example, counted the effective number of looks, and extracted raft aquaculture areas using multiple methods of filtering and comprehensive analysis. Fan’s team has performed much research on the extraction of marine floating raft image areas from high-resolution SAR images. Fan et al. [
18] analyzed the imaging characteristics of floating rafts in SAR images and integrated multisource SAR features of marine raft aquaculture areas to achieve extraction. Geng et al. [
19] proposed a joint sparse representation classification method to extract marine raft aquaculture areas from high-resolution SAR images. Hu et al. [
20] improved a statistical region merging algorithm for superpixel segmentation and used a fuzzy tight density and separation clustering algorithms to identify marine raft aquaculture areas from SAR images. In a previous work we used NSCT to enhance the features of marine rafting areas and extracted the distribution of marine pastures with raft aquaculture using codec structured models [
21]. Wang et al. [
22] used SA-U-Net++ to extract the marine pastures with raft aquaculture. These two works extracted a large-scale marine raft aquaculture area end-to-end from SAR images using deep learning, but the independent distribution of marine raft aquaculture areas has not been studied.
The use of deep learning technology to extract marine raft aquaculture areas from SAR images faces many difficulties [
23,
24], but not limited to the following factors: (1) the system noise and coherent noise generated by the limitation of the SAR system cause the uneven grey distribution in the same target area of marine raft aquaculture area; (2) the offshore meteorological and sea conditions are complex, and the scattering characteristics of marine raft aquaculture areas in different phases and seas are affected by them and behave differently. This leads to a reduction in the saliency of the features from marine raft aquaculture areas; (3) the noise and geometric distortion caused by the characteristics of the SAR system make the identifiable features of the target very different from the optical image. Existing mainstream segmentation networks do not fully mine the characteristics of marine raft aquaculture areas in SAR images, resulting in poor results of direct migration to extract marine raft aquaculture areas in SAR images.
In this paper, an auxiliary shape-constrained extraction method for marine raft aquaculture areas based on multitemporal synthetic Sentinel-1 images is proposed, and the main contributions are as follows:
- 1.
To address the problem of reduced feature saliency in marine raft aquaculture areas due to the difference in scattering characteristics caused by dynamic changes in the ocean background and coherent noise in SAR images, we used multitemporal phase synthesis to enhance the signal in rafted areas and suppress noise.
- 2.
To address the problem that popular segmentation networks do not fully mine the characteristics of raft aquaculture areas from SAR images, we optimized the deep learning model combined with the radiation and geometric characteristics of raft aquaculture areas, and introduced the shape constraint module to improve the ability of the model to fit the characteristics of raft aquaculture areas.
2. Feature Analysis of Marine Raft Aquaculture Areas
This section specifies the scattering principle of marine raft aquaculture areas and their statistical size and rectangularity. Combined with the analysis results, this study selected the data pre-processing means as multitemporal phase synthesis and deeply optimized the semantic segmentation model to improve the accuracy of extracting the marine raft aquaculture areas.
2.1. Scattering Characteristics
In the floating raft structure inside the marine raft aquaculture area, only floats float on the sea surface (
Figure 1a). In the corresponding range of a single pixel of an image, both floats and seawater are present. Therefore, the greyscale representation of the raft aquaculture area in a SAR image consists mainly of the interaction between the sea surface and the floats. The backwards scattering of raft aquaculture consists mainly of scattering from the surface of the floats and seawater, scattering from the dihedral angle of the seawater floats, and scattering from the spirals of the seawater floats [
18,
25], as shown in
Figure 1b. Thus, the DN values of the marine raft aquaculture area on Sentinel-1 images characterize the mixed image properties, which are highly disturbed by the seawater background. Unlike land, the seawater is always in motion, and the part of the floating raft on the sea surface may be submerged at any time by the moving seawater. This causes individual raft aquaculture areas to break up or blur in images. Meanwhile, coherent noise is inevitable in SAR images. The presence of coherent noise causes the marine raft aquaculture area to exhibit an uneven distribution of internal grey values and blurred edges in the image, as shown in
Figure 1c.
The filtering methods commonly used in SAR image processing can effectively standardize the distribution of greyscale in the image, but they do not enhance detailed information such as edges [
26]. In addition, it is difficult to cope with the changes in the image characteristics of the floating raft itself caused by the dynamic changes in the temporal dimension of the seawater. In this study, we adopt a multitemporal synthesis method to improve image quality (as shown in
Section 3.3.1).
2.2. Geometrical Characteristics
The geometric features of the marine raft aquaculture areas in the SAR images are obvious, which are densely arranged in strips. In this section, the semi-perimeter(
C), the rectangularity(
R) of marine raft aquaculture areas in the training area and the aspect ratio (
AR) of its smallest circumscribed rectangle are calculated by following equations.
denotes the area of the marine raft aquaculture area,
denotes the area of its minimum outer rectangle.
and
represent the width and length of the minimum outer rectangle of the marine raft aquaculture area, respectively.
Figure 2 shows the statistical results, which provide the basis for subsequent work to optimize the segmentation model and improve the accuracy of the marine raft aquaculture area extraction.
As shown in
Figure 2a, the marine raft aquaculture area semi-perimeter distribution in the training data was mainly concentrated between 0 and 128, accounting for 91% of the total, with 66% of the total below 64 and 29% of the total below 32.
As shown in
Figure 2b,c, the statistical results of the rectangularity of most raft aquaculture areas are distributed above 0.6, accounting for 79% of the total, and the aspect ratio is mostly distributed below 0.4, accounting for 85% of the total. According to the statistical results, it can be concluded that the geometric shape of the raft aquaculture area in the image is relatively regular, approximately slender rectangle. Therefore, the shape features of the raft aquaculture area can be added to the model learning as an effective prior knowledge. In this study, the shape constraint method was used to add prior knowledge to the model to improve its performance to fit the raft aquaculture area. The specific process is described in
Section 3.3.3.
3. Materials and Methods
3.1. Data
3.1.1. Study Area
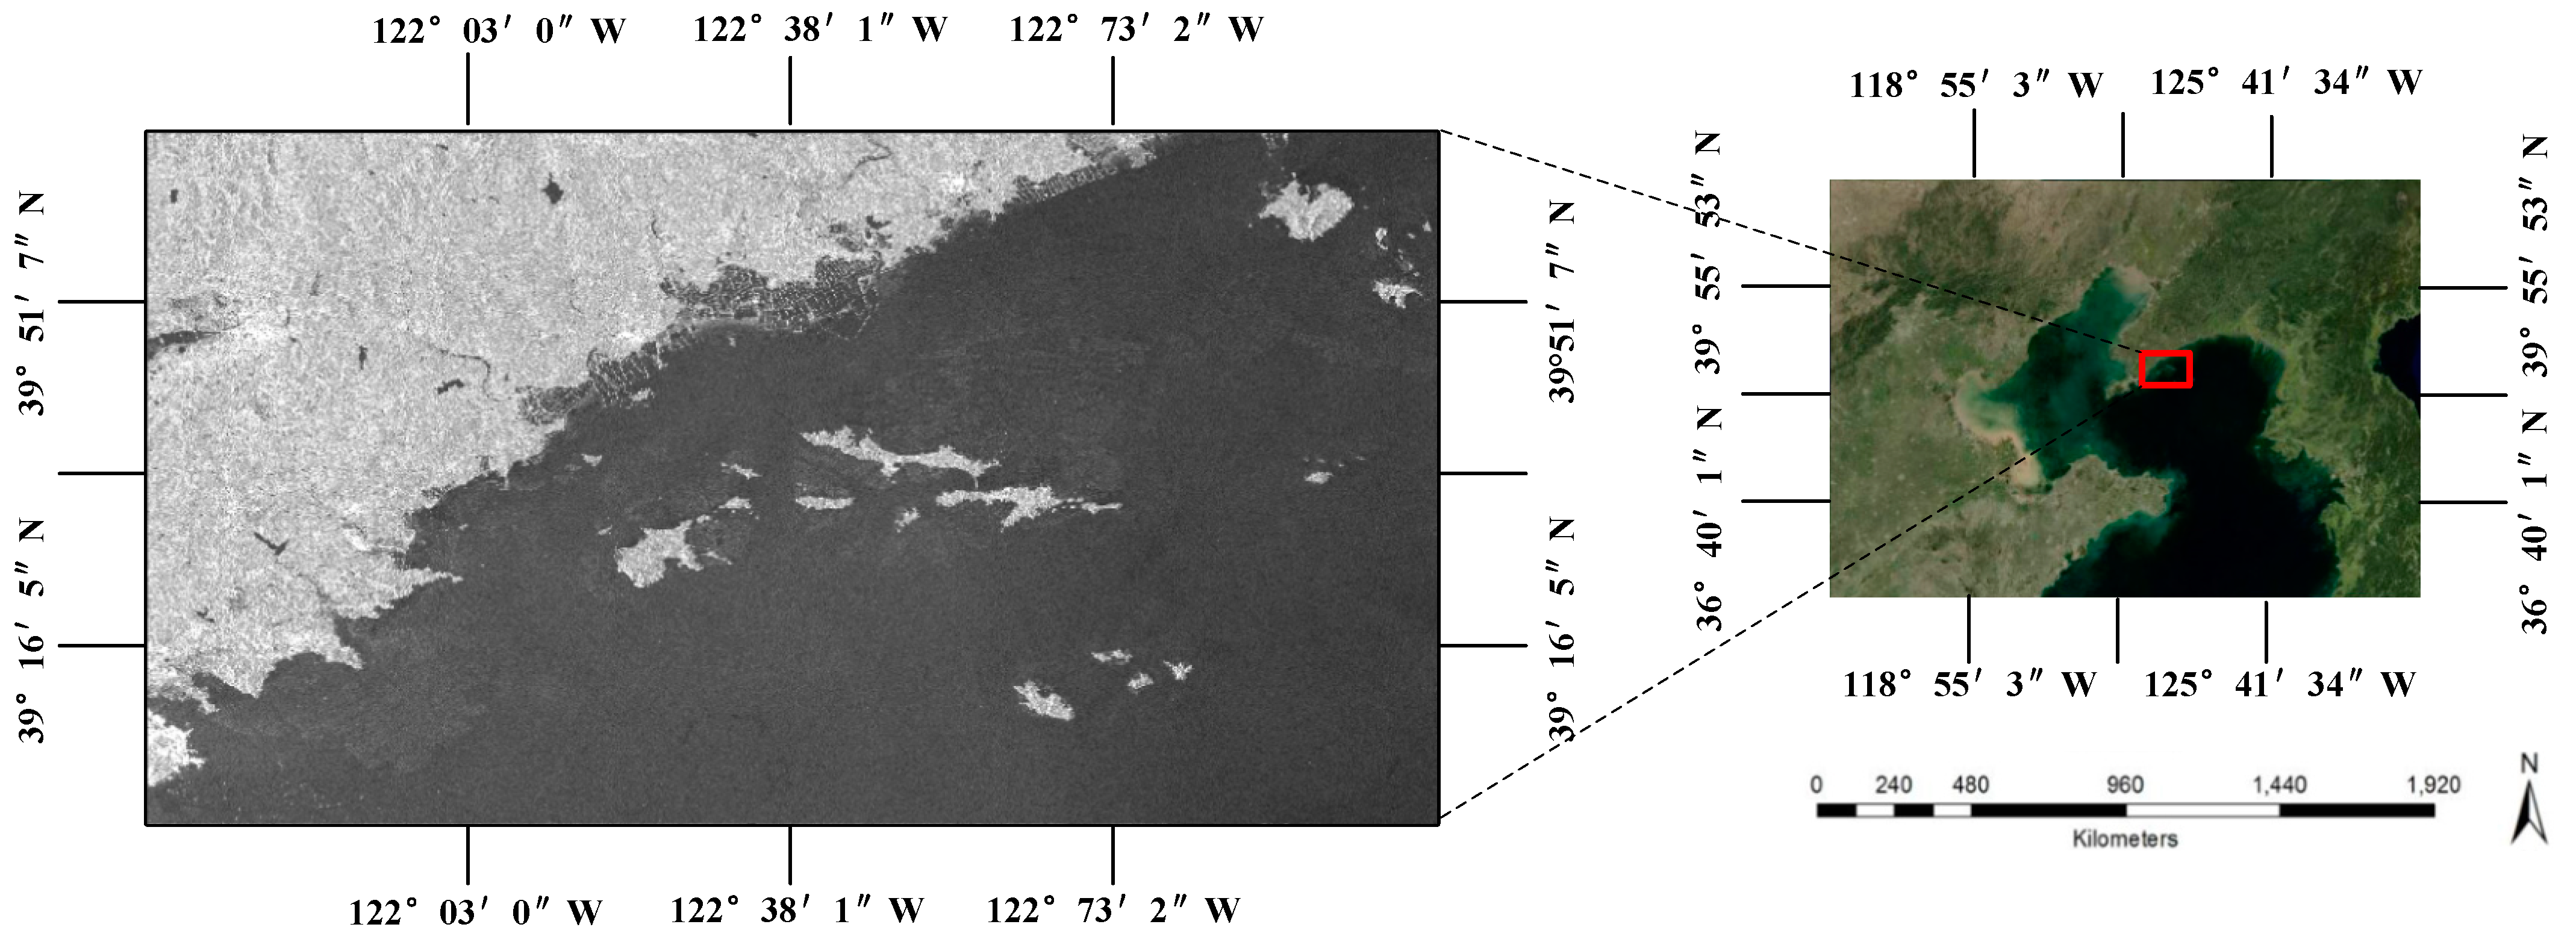
The eastern coast of Dalian has a large quantity of marine raft aquaculture areas, which is used as the study area in this paper. The eastern coast of Dalian is located on the southeastern side of Liaodong Peninsula in China and is part of the Yellow Sea area, with a vast sea area. The Biliu River, Yingna River, Zhuang River, Zanzi River, Dasha River, Densha River and Qingshui River converge here, and there are many types of aquaculture, with shellfish mariculture on rafts being the mainstay. The study area for this paper is illustrated in
Figure 3.
To present the results of the experimental part of this study more intuitive, seven areas within the study area were selected as experimental validation areas and numbered 0, 1, 2, 3, 4, 5, and 6, respectively. Moreover, region 0 is used in
Section 3.3.2 and
Section 4.1 to calculate the evaluation accuracy for comparing and selecting of popular models as well as data processing methods.
Section 3.3.3 and
Section 4.2 validate the experimental results in regions 1, 2, 3, 4, 5, and 6 for highlighting validity and applicability of the proposed model improvements.
3.1.2. Research Data
- 1.
Introduction to the data
In this study, the Sentinel-1 wide (IW, Interferometric Wide Swath) ground range product (GRD; ground range detected) of dual-polarized C-band (3.8–7.5 cm, 8000–4000 MHz) SAR images were used as the data source. It has application advantages in maritime monitoring tasks [
27]. The GRD data are obtained by multiviewing the SLC data from ESA and processing the focused data using the WGS84 ellipsoidal projection to ground distance. The processed data have a pixel spacing of 10 × 10 m and the pixel values on the image represent the amplitude of the received signal with no phase information. The statistical analysis shows that the area occupied by marine raft aquaculture in the image is larger than 3 × 3 pixel, so the Sentinel-1 GRD level-1 data resolution meets the needs of extracting floating rafts. Furthermore, the low-resolution remote sensing imagery can usually be used to obtain information over large areas, which is beneficial for mapping the distribution of marine aquaculture areas. The specific parameters of the obtained data are shown in
Table 1.
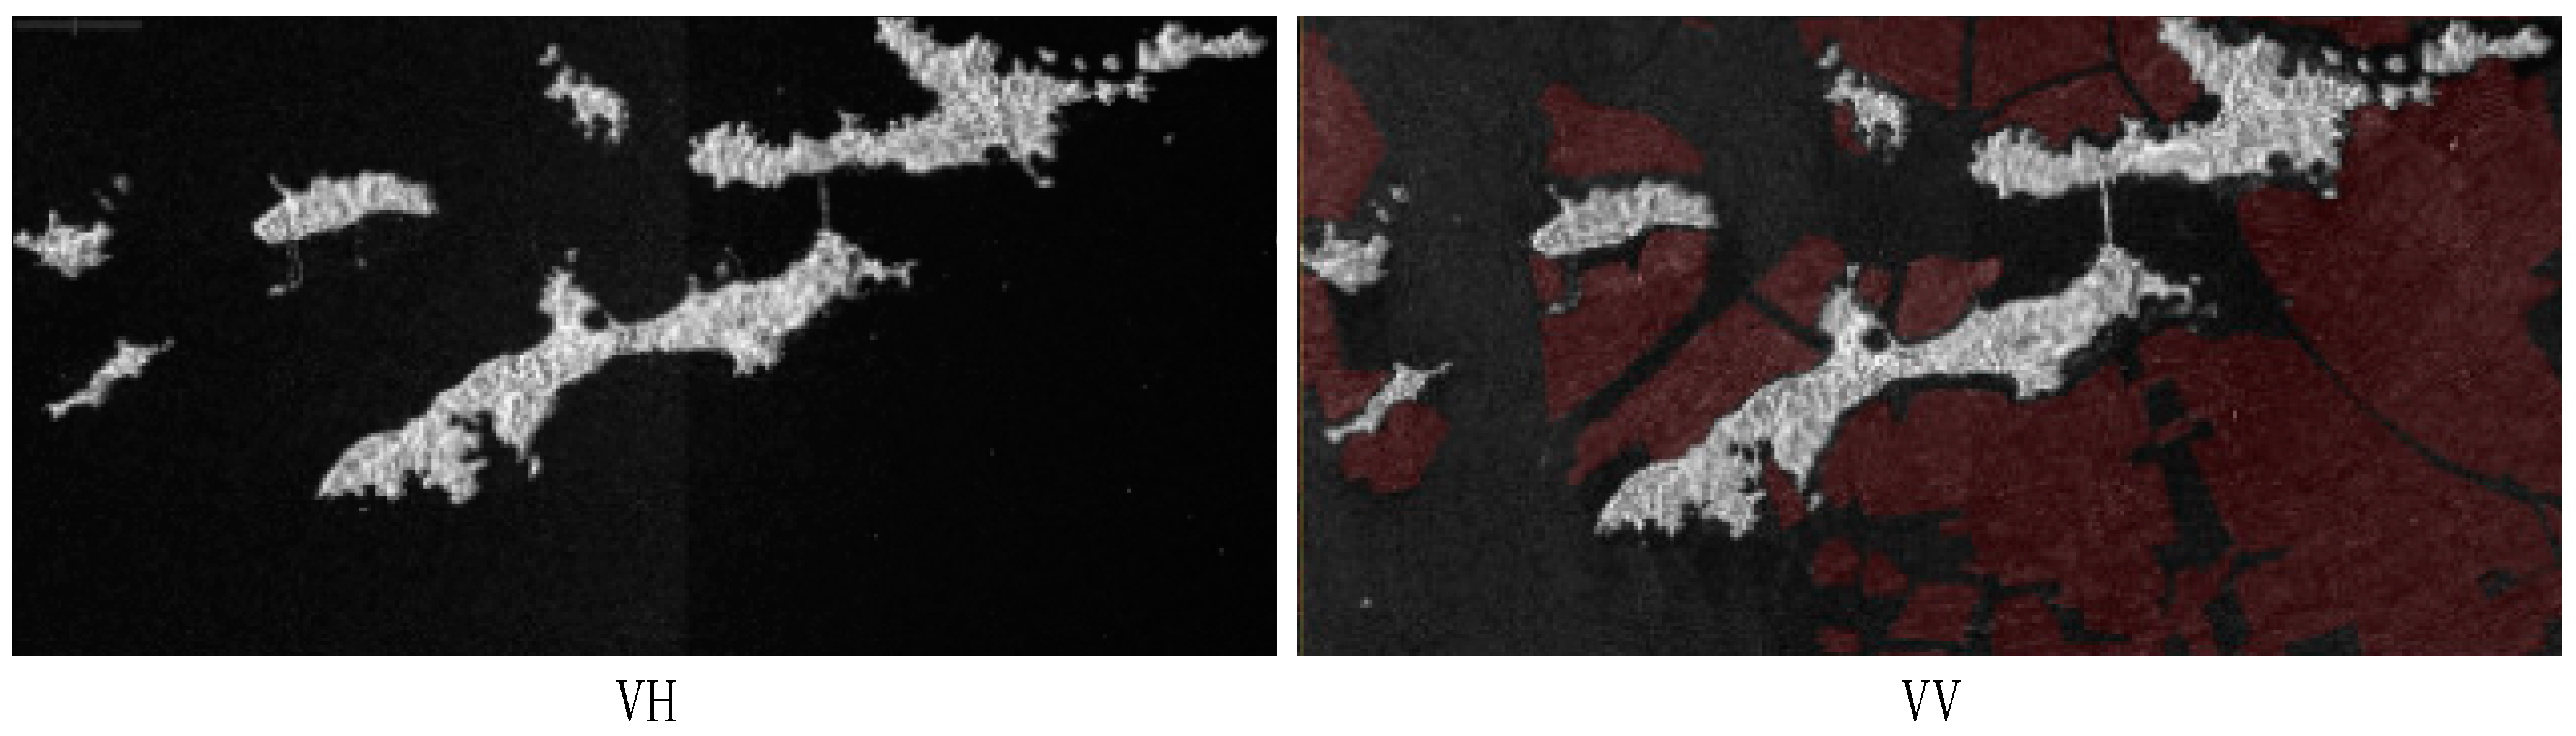
Sentinel-1 IW GRD data have two types of polarization as cross-polarized VH (vertical-horizontal) and dual-polarized VV (vertical-vertical). In the previous work we found that marine raft aquaculture areas are more observable in isotropic polarization images, as shown in
Figure 4 [
21]. Thus, the image of VV polarization was chosen as the data source.
- 2.
Sample library construction
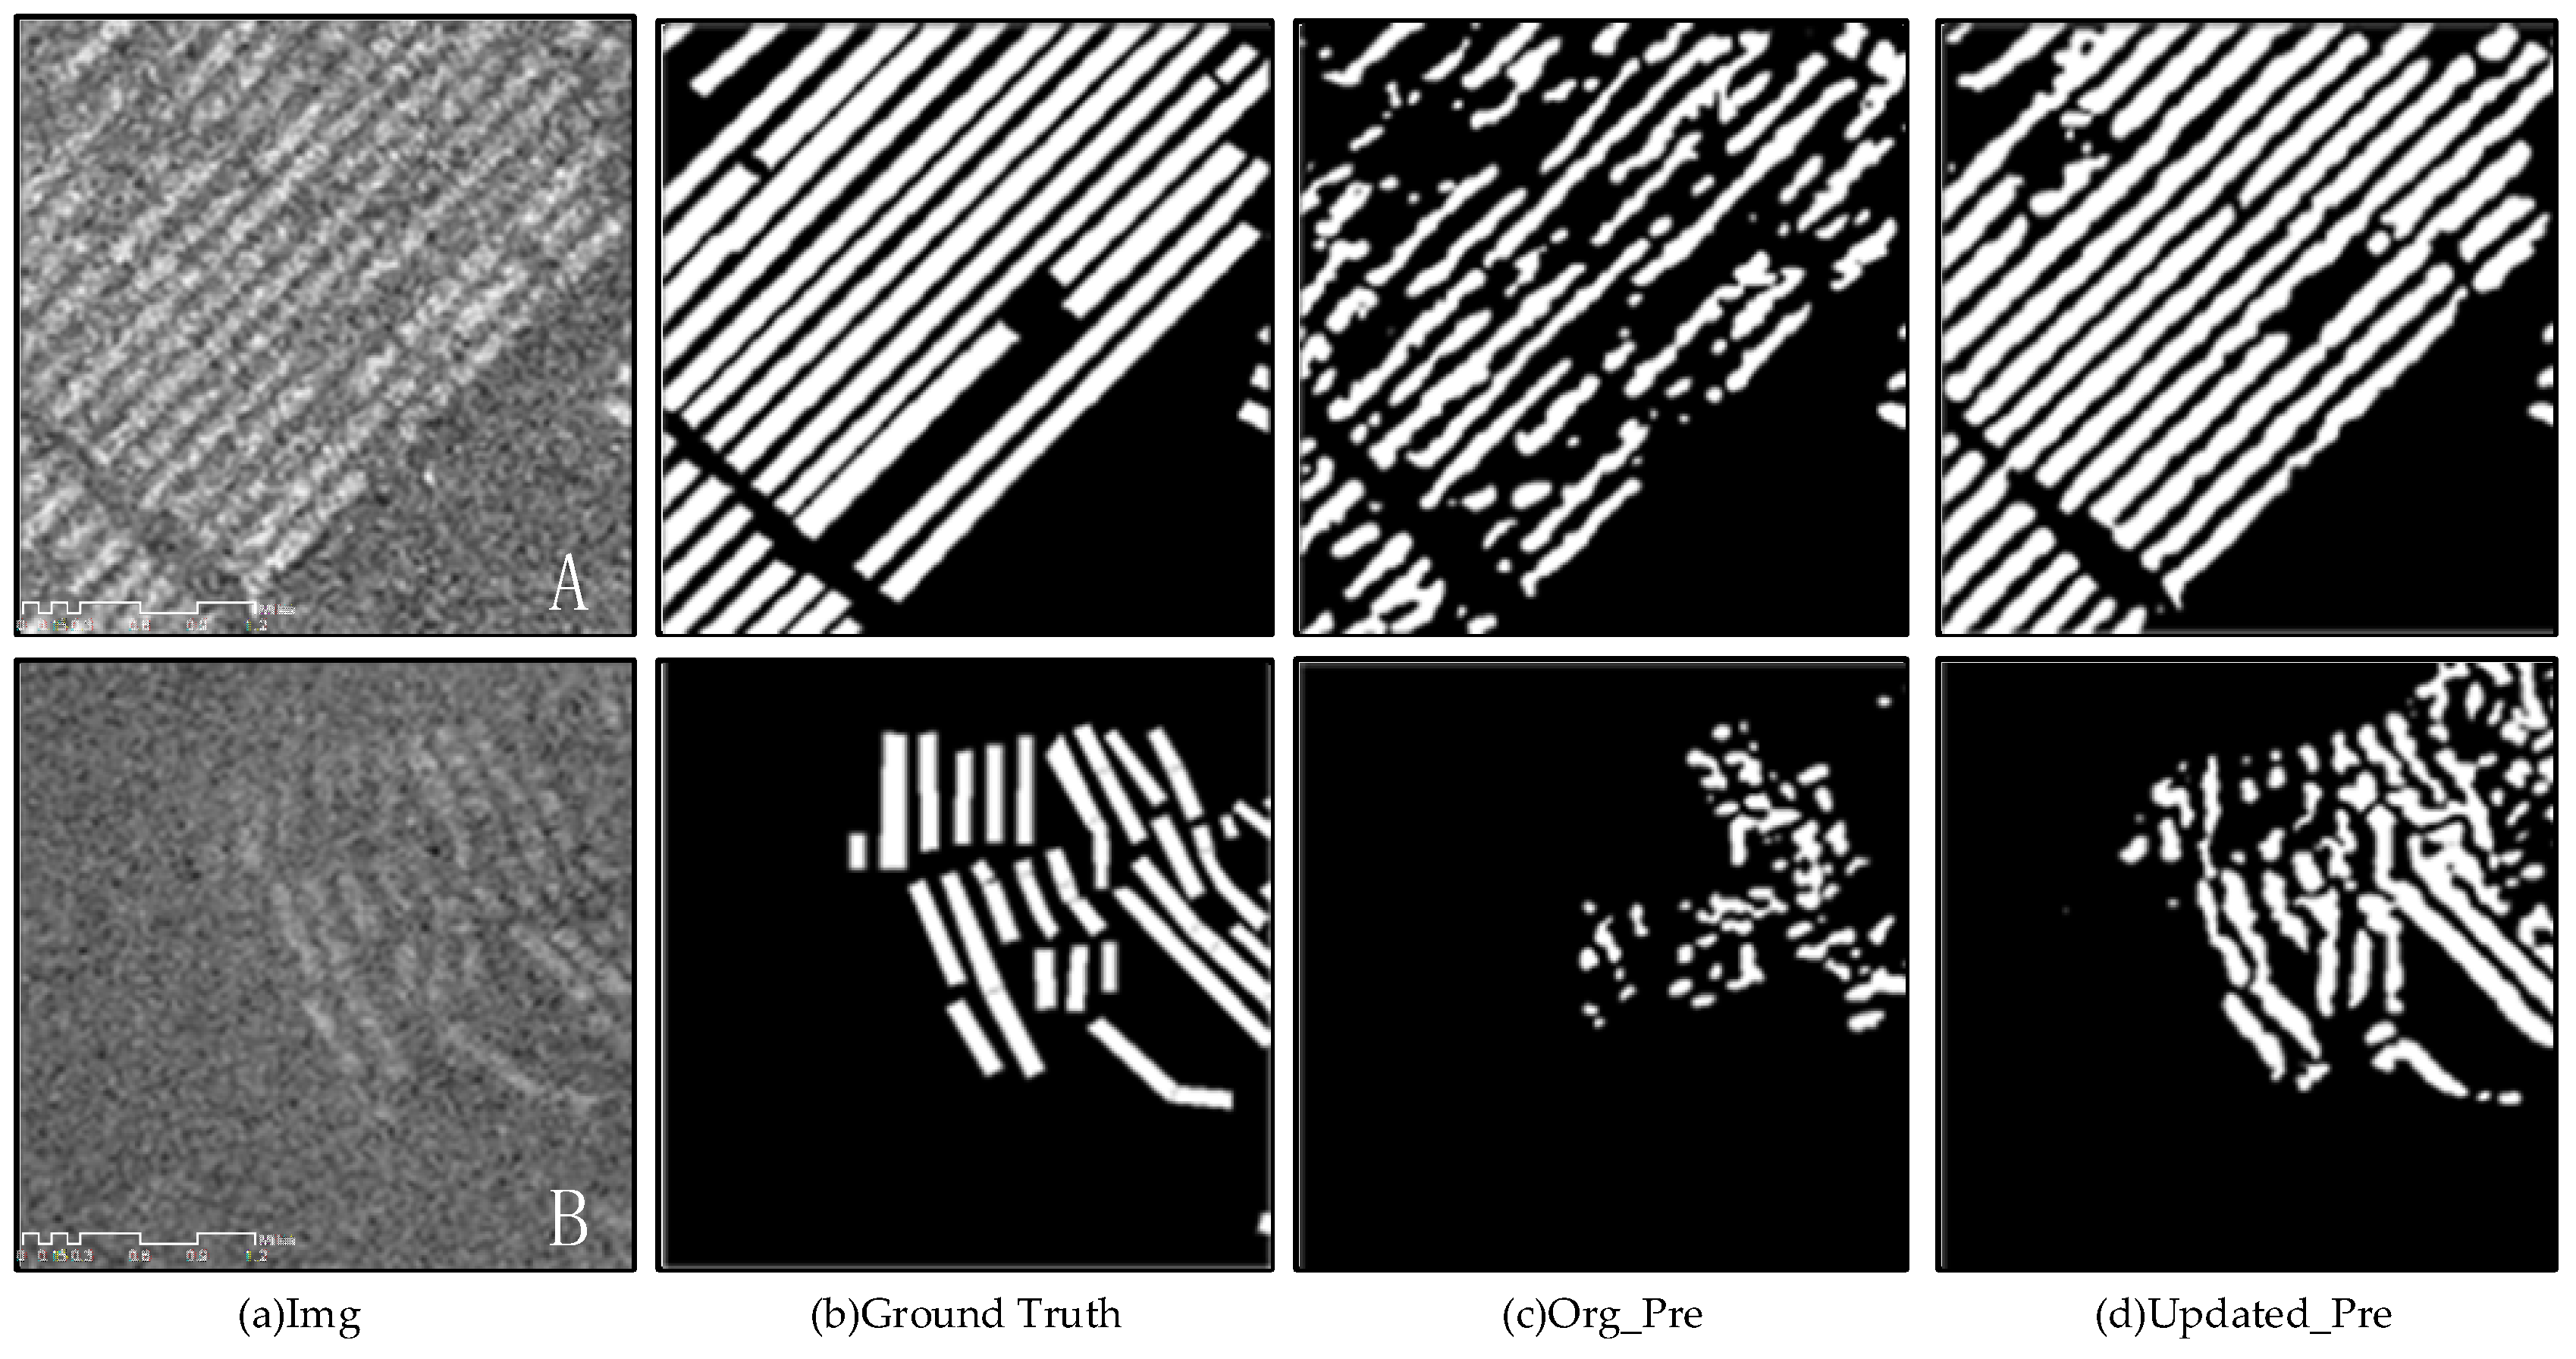
For the task of extracting marine raft aquaculture areas from Sentinel-1 imagery, there is no relevant authoritative dataset, so this study constructed a sample library based on a small amount of publicly available government data. Marine raft aquaculture areas are widely distributed. Affected by the dynamic changes in marine background, the scattering characteristics of raft aquaculture areas in different sea areas are different. Therefore, the sample database was constructed not only to include areas with typical characteristics, but also to expand a small number of samples for areas that are far away from the base sample database by borrowing the idea of nearest neighbor interpolation. The results show that the construction scheme of this sample library is effective. As shown in
Figure 5, the extraction results of region A and region B have been significantly improved after expanding the data of neighboring regions as samples.
- 3.
Dataset construction
The data used in this study were downloaded from ‘Sentinels Scientific Data Hub’ (
https://scihub.copernicus.eu/dhus/, (accessed on 5 December 2019)). They are GRD data from the Sentinel-1 satellite on 16, 28 September and 10 October 2019, covering the eastern coastal region of Dalian city, with a pixel size of (9839, 5486).
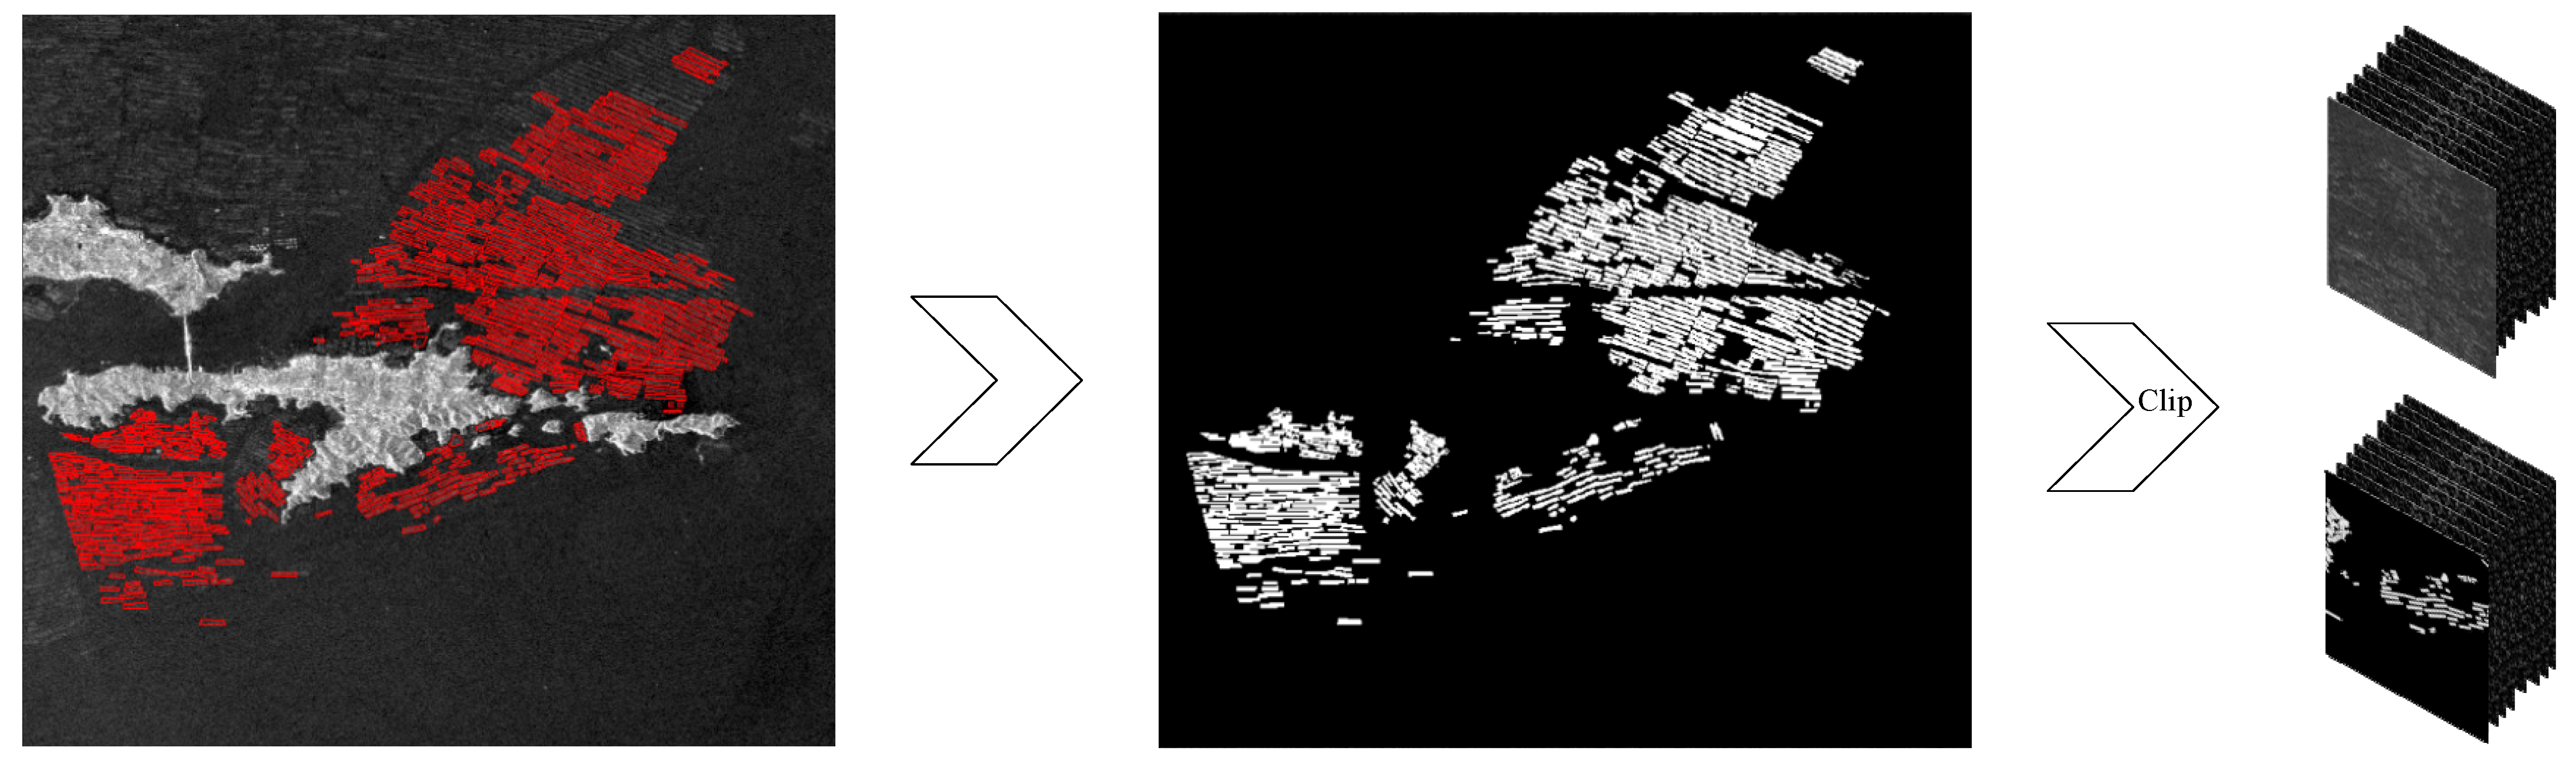
The dataset construction process is shown in
Figure 6.
- (1)
Multitemporal synthesis: The temporal average of Sentinel-1 GRD images covering the study area on 16 September, 28 September, and 10 October 2019, is taken.
- (2)
Label production: The obtained raft aquaculture area vector annotation data is converted into TIFF image data, 0 for background, 1 for the marine raft aquaculture area.
- (3)
Image clipping: The image pair (image and ground-truth data) is clipped into slices with a size of 512 × 512. To reduce the edge effect, the method of sliding window clipping is adopted.
- (4)
Data augmentation: Translation and rotation (45/90/270).
3.2. Evaluation Metrics
To verify the effectiveness of the method, this study selected the accuracy indicators of the overall accuracy (OA), mean intersection over union (MeanIOU), and
F1-Score (
F1) as evaluation indicators to quantitatively evaluate the extraction results of the marine raft aquaculture area. OA represents the full-pixel accuracy between the prediction result image and the ground truth. MeanIOU is the intersection ratio of the predicted image and ground truth image.
F1 is an accuracy index that considers precision and recall. The formulas to calculate the metrics are as follows:
3.3. Methods
The overall method process in this paper is shown in
Figure 7, including data processing, model comparison and selection, and deep learning model optimization.
3.3.1. Multitemporal SAR Image Synthesis
The data input to the deep learning model generally undergoes normalization and standardization, so that the distribution of the data is close to the origin but the image quality is not improved. The image quality determines the upper limit of the model fitting data features. The raw data downloaded for this study is Sentinel-1 IW GRD level data (level-1). Although the GRD data is subjected to overheating noise removal, there is still random noise interference due to the imaging mechanism. In addition, according to the analysis of scattering characteristics in the raft aquaculture area (
Section 2.1), the marine raft aquaculture area is greatly disturbed by the ocean background, especially in the high water level area, and the floating raft will be submerged due to the influence of sea conditions, resulting in unclear target objects. To suppress the noise of SAR images and enhance the raft aquaculture area, this study used a multitemporal synthesis method to preprocess the data of 16 September, 28 September, and 10 October 2019. Zhao et al. [
28] have verified the effectiveness of multitemporal denoising in improving the quality of SAR images.
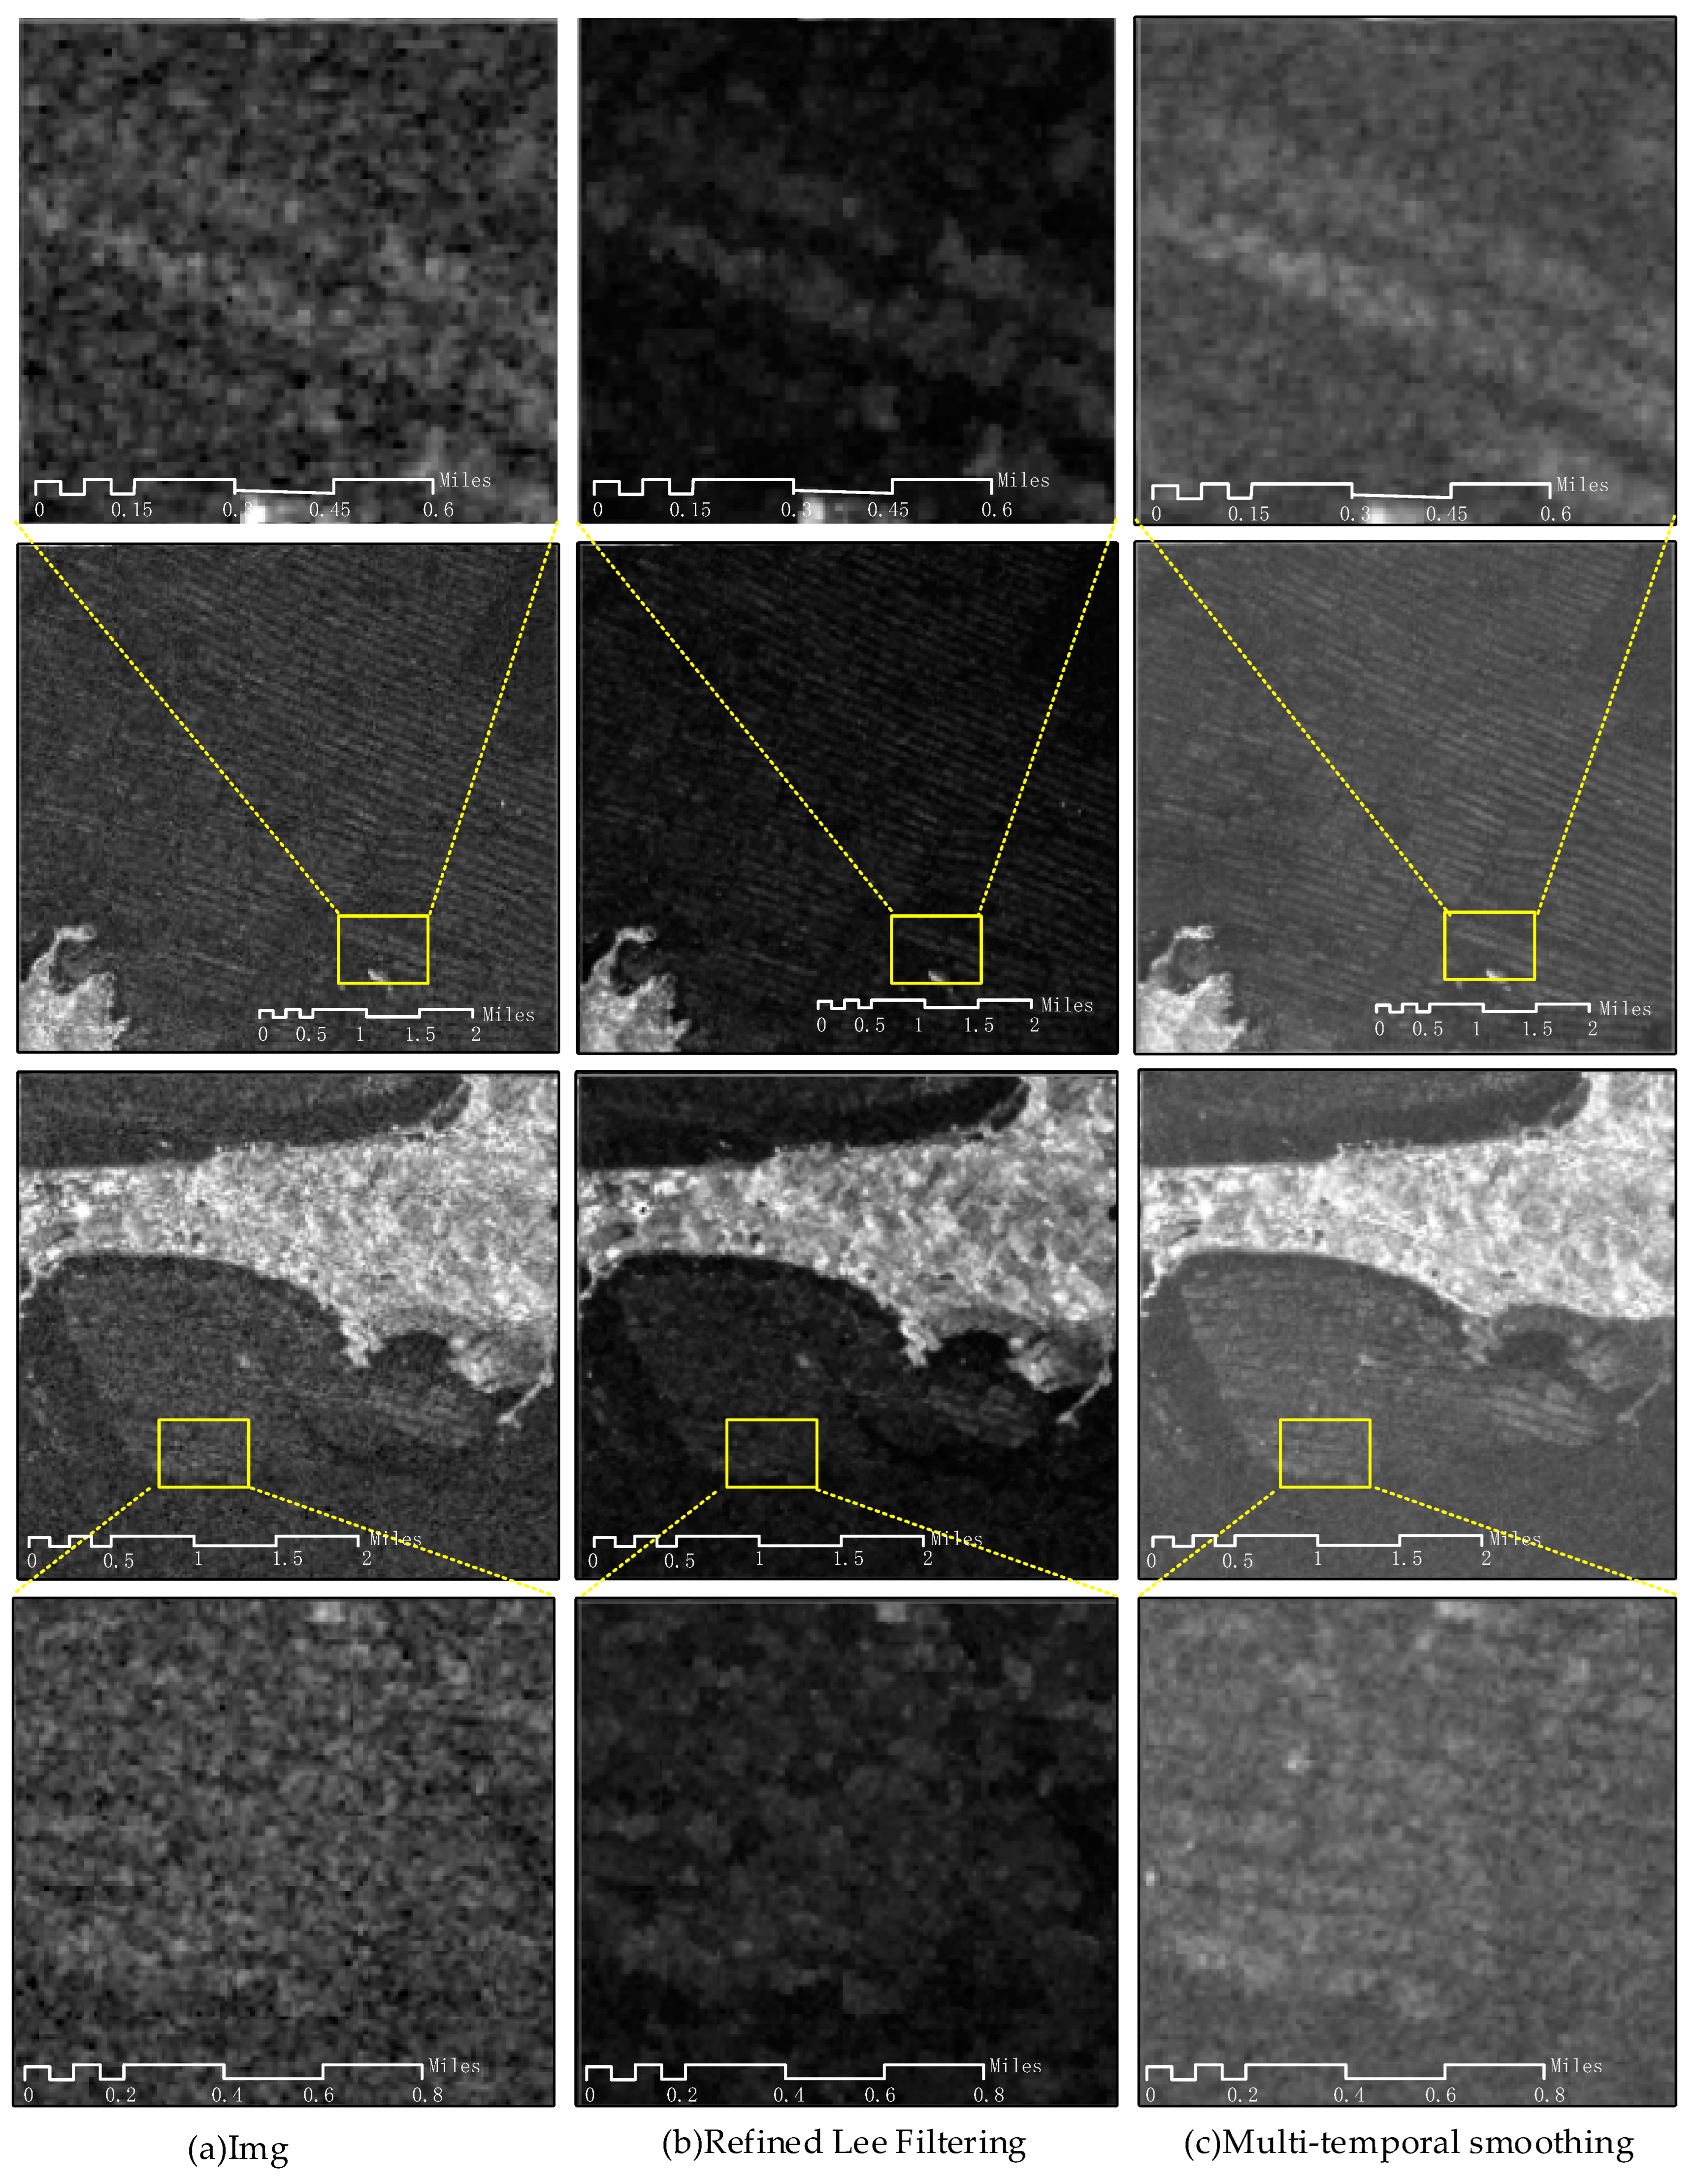
As a commonly used denoising method in SAR images, refined Lee effectively homogenizes the grey distribution in the target area but also causes the decline of image resolution and the loss of some original scattering information which makes the edge more blurred, as shown in
Figure 8b. The results of the multi-phase synthesis method used in the study are shown in
Figure 8c. Compared to the unprocessed image (
Figure 8a), the contrast between the marine raft aquaculture area and seawater is enhanced, the edges are clearer, and some false fracture areas are also improved.
3.3.2. Comparison and Selection of Models for Semantic Segmentation
The refined extraction task of the marine raft aquaculture area aims to identify all of the pixels belonging to marine raft aquaculture areas in the image and locate their positions to serve the subsequent statistics of aquaculture area and estimation of aquaculture production. This task belongs to the full-pixel semantic segmentation problem in the field of computer vision [
29,
30,
31,
32]. As popular semantic segmentation models, FCN [
33], Unet [
34], PSPnet [
35] and DeepLabV3+ [
36] each have their own advantages. FCN network is the pioneer of full convolutional networks; Unet is the classical codec structure model; PSPnet uses the pyramid pooling module; DeepLabV3+ introduces a new module for atrous convolution. In this section, we experimentally analyze which of these models is more suitable for the extraction task of marine raft aquaculture areas. Experiments are conducted using the same equipment and operating environment for four model fed with multitemporal synthesized data. Then, the training results of the four models are analyzed qualitatively and quantitatively in the same validation area which is numbered 0 (as shown in
Figure 9 and
Table 2).
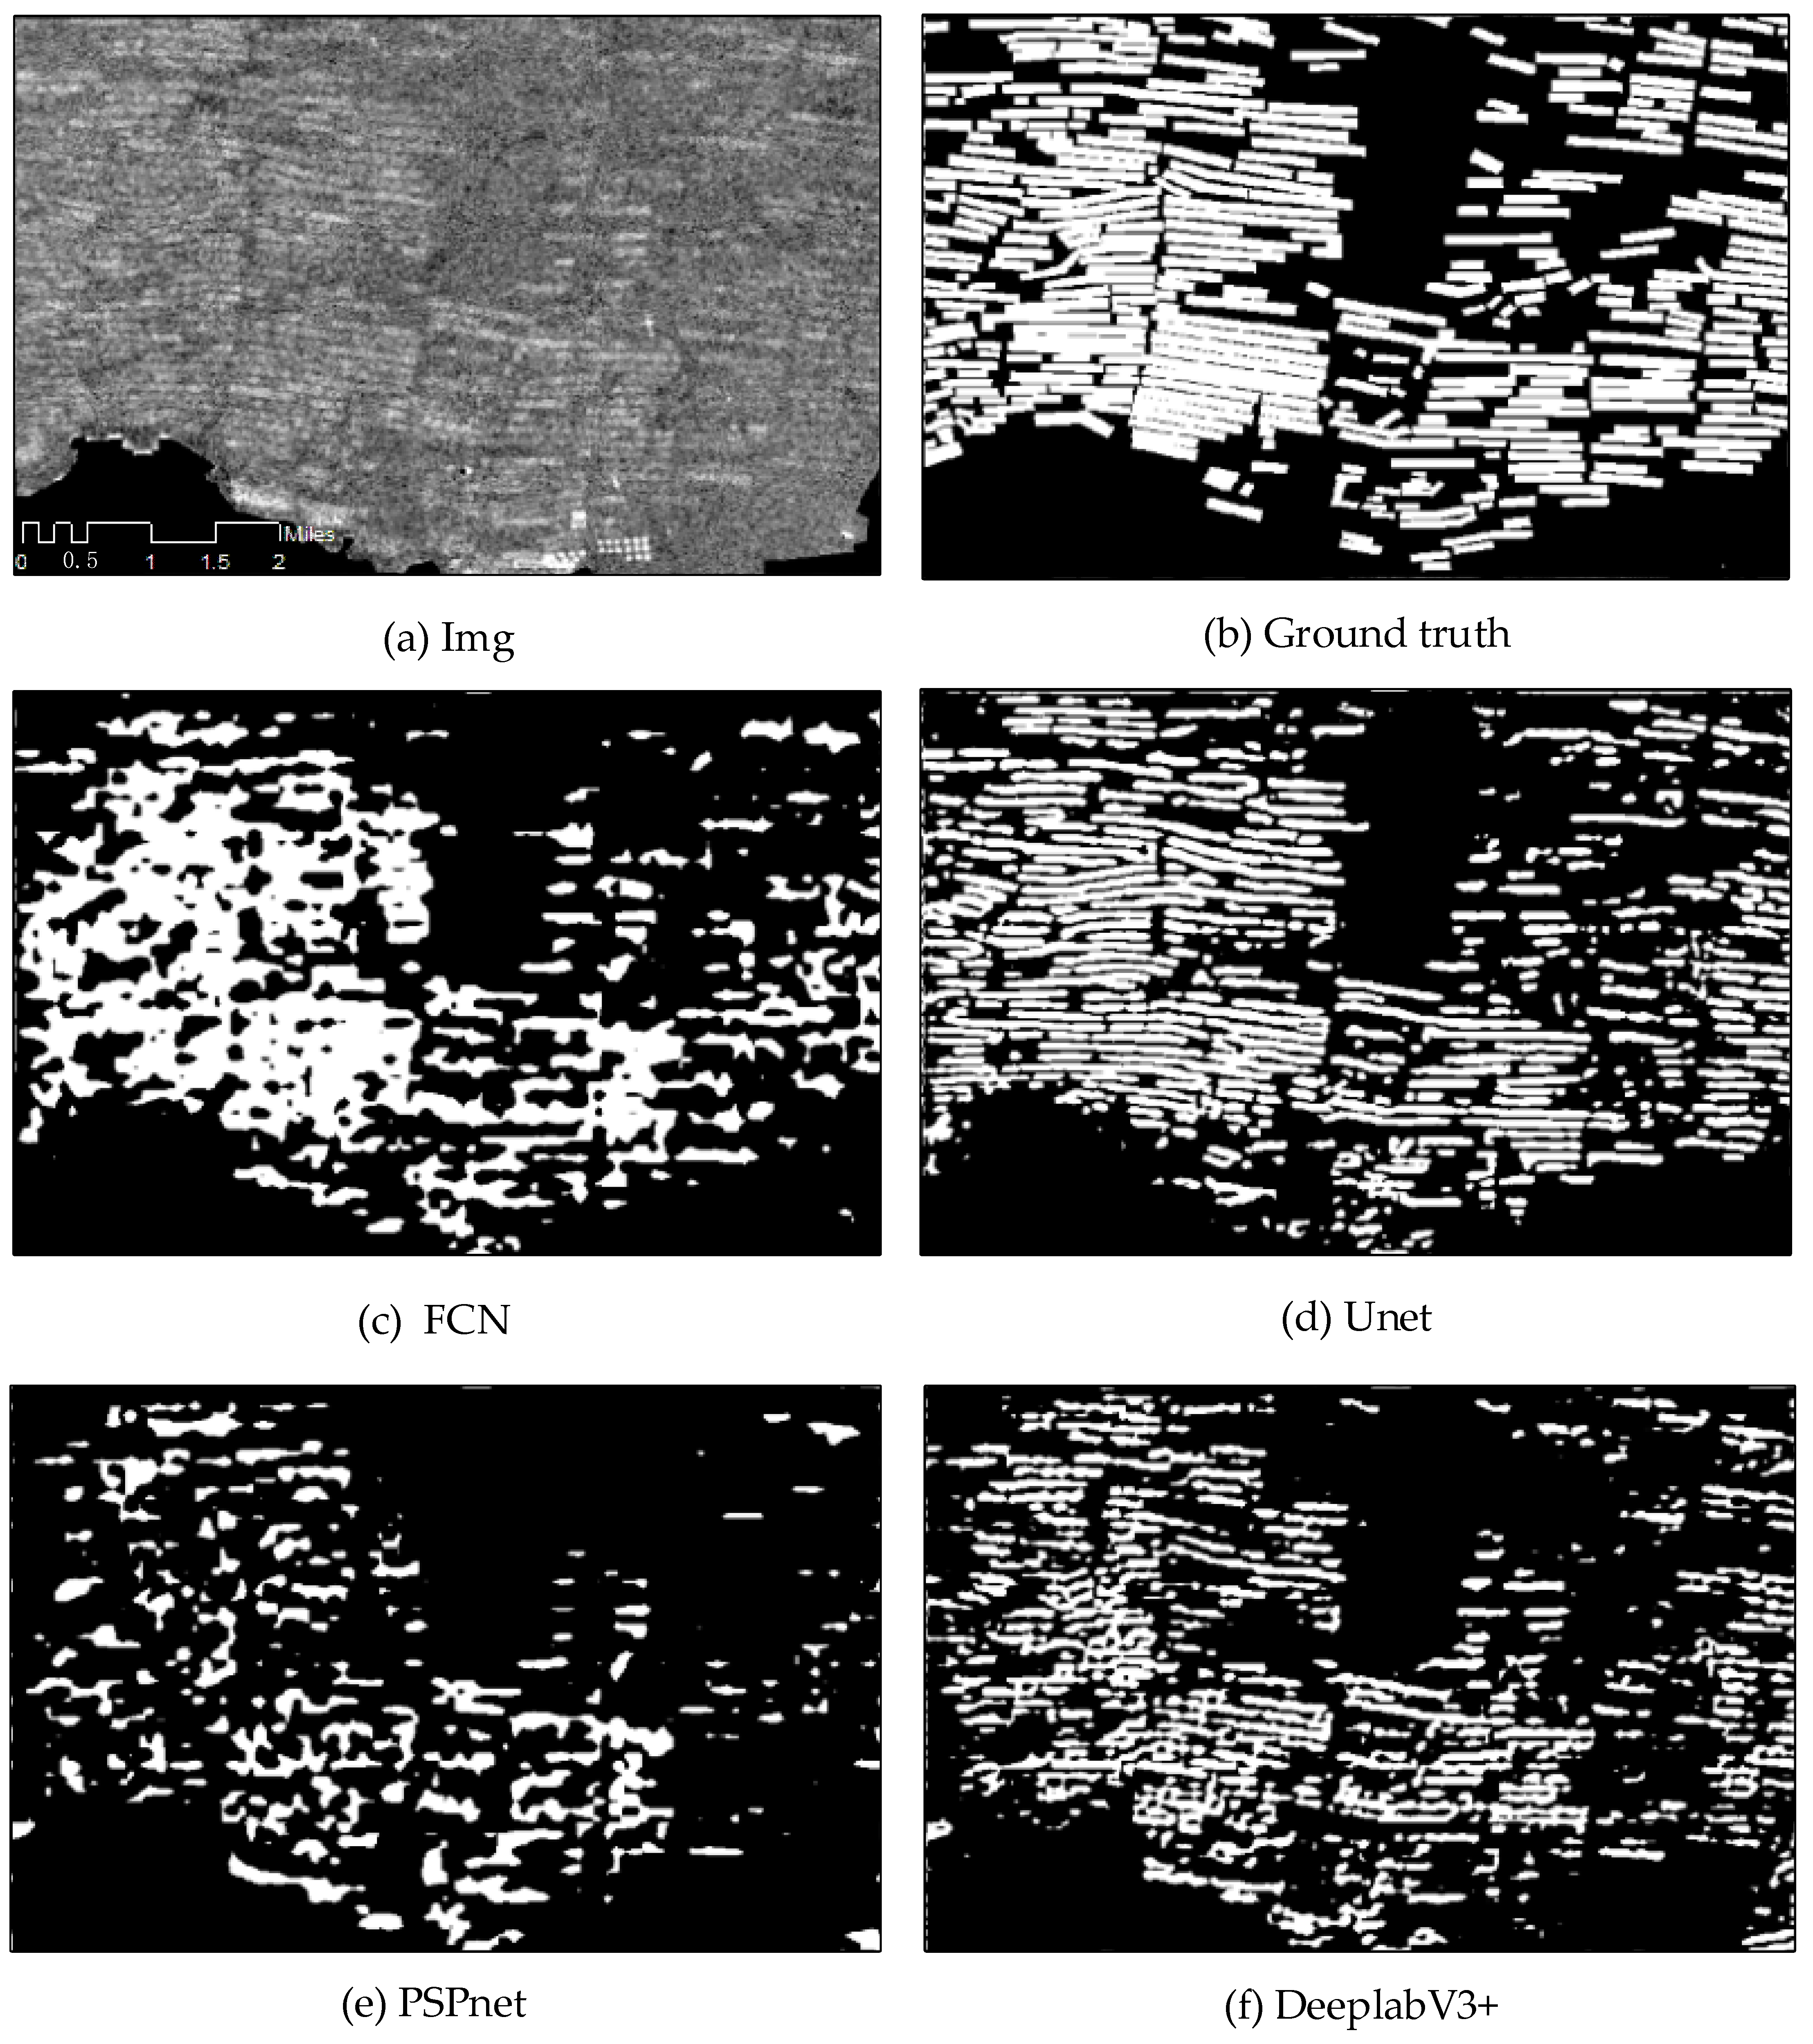
Figure 9 visualizes the extraction results of the models. As shown in
Figure 9c, the segmentation result of FCN has the most obvious sticking phenomenon. PSPnet introduces more contextual information than FCN, but excessive multi-scale pooling will lead to local information loss, and the final presented results have many missed detections, as shown in
Figure 9e. DeepLabV3+ uses atrous convolution to increase the perceptual field, which becomes sparsely sampled for the input, with loss of detail information. As shown in
Figure 9f, the results are better than those of FCN and PSPnet, but there are still problems of adhesion and missed detections. In comparison, the Unet visualization result as shown in
Figure 9d is the best among the four models and maintain a good integrity, but there are still missed detections in the weak signal area, which need to be further solved. Correspondingly, each accuracy evaluation index of Unet in
Table 2 is the best. Its
F1 is 8.37% higher than the next best result. The FCN has more adhesions but fewer omissions. So, the
F1 and MeanIOU of it are the second highest. PSPnet has too much false negative pixels. It can be seen its evaluation result is the worst. Although the visualization effect of DeepLabV3+ is the best except Unet, there are still many omissions. The recall of it is 44.92%, which is 19.65% lower than Unet. For that, the
F1 of DeeplbV3+ is 6.03% lower than FCN and 14.4% lower than Unet in
Table 2.
Therefore, in this study, the network structure of Unet is chosen as the basis for proposing a method that is more adapted to the task of extracting marine raft aquaculture areas from SAR images. In addition, in this part of the experiment we tried Resnet18 to replace the Unet encoder backbone network. The result does not provide a significant advantage. We conjectured that simply adding a single layer of convolution is not effective in improving the performance of the model.
3.3.3. Semantic Segmentation Model with Shape Constraints
The model proposed in this paper is based on the Unet framework and optimized according to the characteristics of the marine raft aquaculture area in SAR images. The specific model structure as shown in
Figure 10 is optimized in three main aspects: the number of model layers, the attention mechanism, and the shape constraint module.
Model Depth Optimization
Different target extraction tasks require different depth and width of the model, with deeper and wider networks required to fit complex situations [
37]. It is important to note that the model deepening is not unlimited. The depth of the model needs to be appropriate to the size of the target feature. Convolution, pooling and activation form a standard coding unit and the deepening of the network is achieved in this study by adding coding units. We compared the accuracy metrics of different depth networks on raft aquaculture areas extraction task using an indirect method, based on the classical Unet network structure.
Table 3 presents the prediction accuracy of the different depth networks under the same experimental conditions.
As shown in
Table 3, the accuracy of the model increases as the number of coding units increases up to Unet_6 before Unet_7. However, the accuracy of the Unet_7 network declines. Unet_7 includes six down-sampling modules and the image perimeter is reduced by a factor of
. The statistics in
Section 2.2 show that 66% of the raft aquaculture area has a half circumference of less than 64 pixels. After six down-samples, the features of these targets are inundated in one pixel cell. This feature inundating phenomenon causes a decrease in accuracy. Overall, Unet_6 is a better match to the feature size of marine raft aquaculture areas, and its predictions remain optimal for MeanIOU, OA, Precision, recall and
F1. Therefore, this study optimized the model depth to six layers.
Attention Module
The attention mechanism mainly suppresses background noise and redundant information by assigning weights to the feature map through data-driven, reinforcing the target features and allowing the network’s computational resources to be skewed towards the marine raft aquaculture areas.
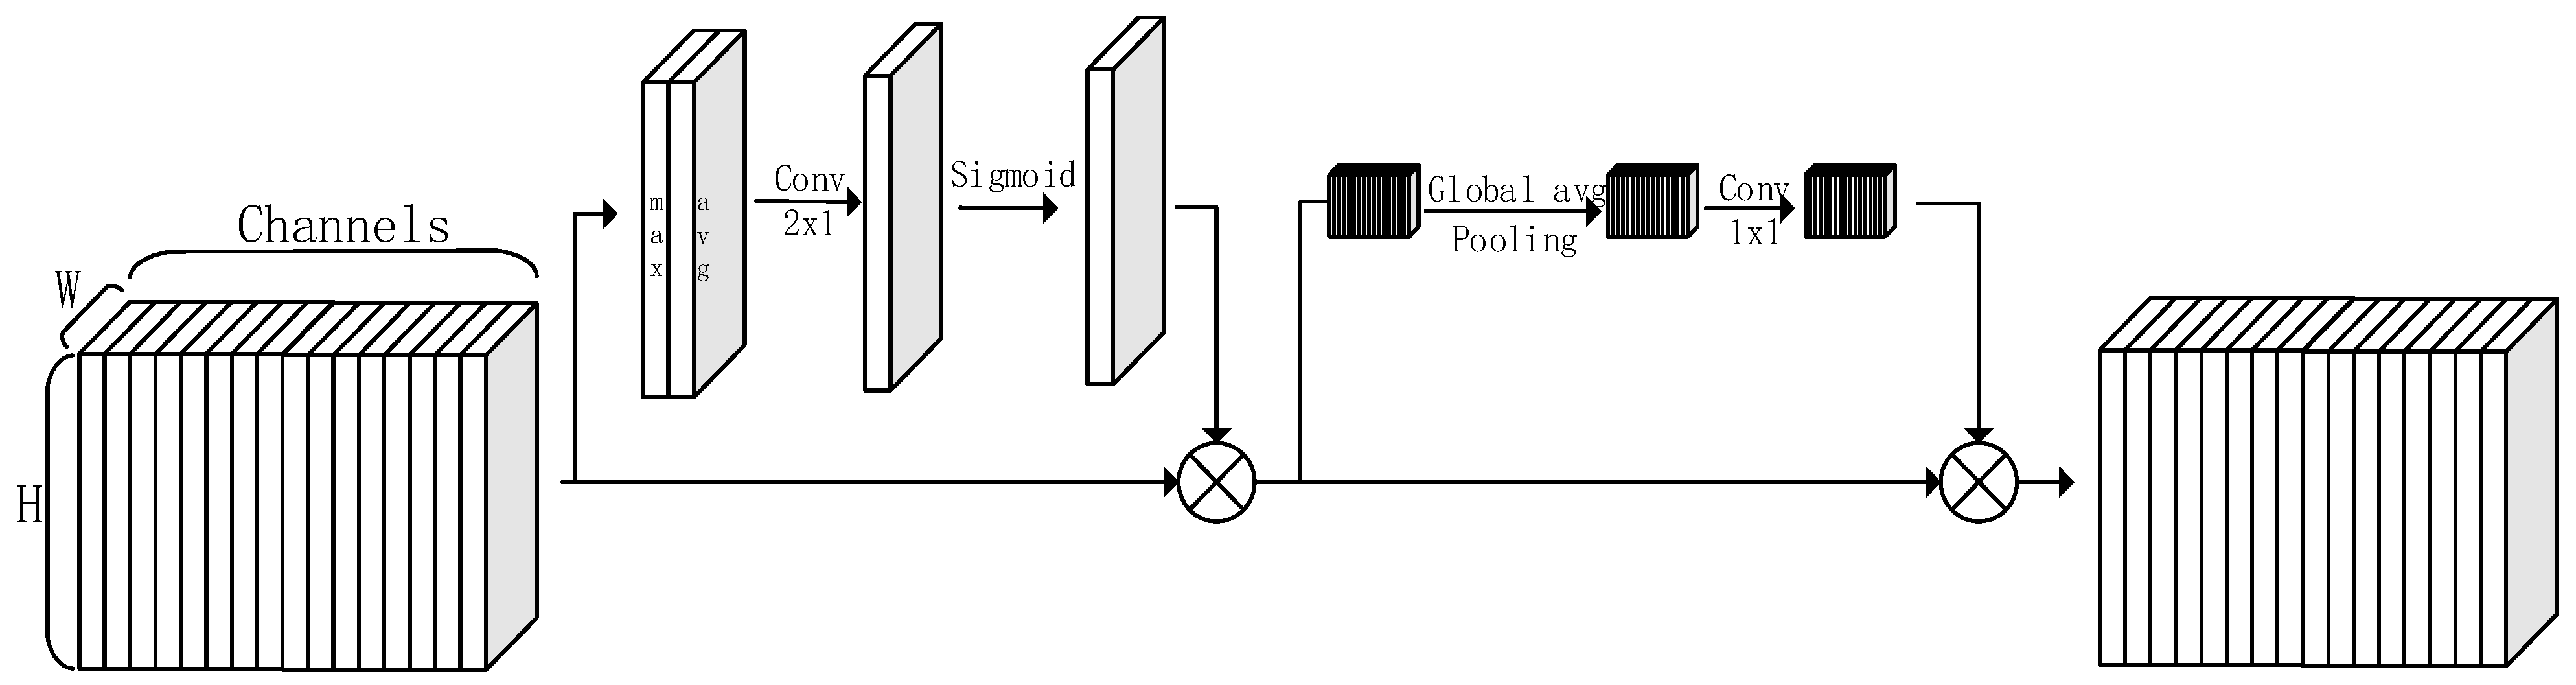
Commonly used attention mechanisms in convolutional networks include attention in the spatial domain and in the channel domain. The convolutional block attention module (CBAM) [
38] demonstrates that channel attention and spatial attention in tandem can work better in networks. In this study, the tandem spatial attention and efficient channel attention (ECA) [
39] module (which is more efficient) are introduced into the encoder-decoder network structure to improve the model’s ability to capture key features and weaken the interference of redundant information. In practical applications, the spatial attention module first finds the maximum and average values between channels to achieve dimensionality reduction of the channel domain, then learns high-dimensional features in the spatial domain through 2 × 1 convolution, finally obtaining the weight distribution through the activation layer to assign weights for the circulation features to the lower layers. The channel attention module, first, reduces the dimensionality of the input information spatial domain to the 1 × 1 category through global pooling operation, then encodes the channel information using a 1 × 1 convolution, and finally assigns weights to the features in the next layer of the input through the activation layer according to the dependency relationship between channels. The specific attention mechanism structure is shown in
Figure 11.
Shape Constraint Module
The statistical results in
Section 2.2 show that the marine raft aquaculture area generally presents the rectangle geometric features, which appears as a striped bright spot in images. The regular shape feature can effectively help the model to segment the marine raft aquaculture area on the image. Li et al. [
40] extracted shape-regular buildings through a network model with shape representation regularizer. Inspired by this, this study introduced the shape constraint module to add the shape prior of the raft aquaculture area to the model to constrain the model’s feature learning direction.
Figure 12 shows the design idea of shape constraints.
The shape constraint module consists of two parts: the shape-coding module and the shape loss function. The shape-coding module learns the shape feature representation and reconstructs the shape of the input data. The loss function part embeds the shape representation learned by the shape-coding module into the model loss function, which adds the shape prior knowledge into the model training process to guide the model convergence direction.
Shape-coding module: The basic convolution module is used to form the encoding and decoding structure, and the ground truth mask is input to learn shape features. The encoder encodes the feature representation of the shape features of the raft aquaculture area, and the decoder reconstructs the mask according to the input feature representation. The shape encoder is trained using the training sample data to obtain a pretrained model.
Shape loss function: The shape feature representation output from the shape-coding module is added to the model loss function to construct a loss that contains shape constraints. The model uses a loss function to evaluate the discrepancy between the network predictions and the true value in the practice of the task of semantic segmentation, updating the network weights by back propagating the error along the direction of the minimum gradient. The shape loss function causes the network to converge in the direction of the shape constraint.
As shown in Equation (10), the loss function used in this study contains two components: segmentation loss and shape loss. The shape loss
includes the potential shape representation loss
and the shape reconstruction loss
.
As shown in Equation (11), the segmentation loss
is calculated using the binary cross-entropy loss BCELoss commonly used in binary semantic segmentation and introducing a combination of Jaccard loss [
41].
uses the same combined function to calculate the error in the output of the true and predicted values after the encoder (
E(-)) in the shape coding module, as in Equation (12).
uses MSELoss to calculate the ground truth and predicted values after shape reconstruction in the decoder (
D(-)) of the shape coding module, as in Equation (13).
4. Results
This section presents the visualization results and quantitative evaluation results of the experiments to verify the validity of the methods in this paper and presents the results.
The experiments in this study were completed in a Windows 10 environment configured with Anaconda3 and PyTorch. To ensure the fairness of the method comparison, the experiments were conducted under a unified framework.
4.1. Comparative Experiments on Multitemporal Synthesis Methods
In
Section 3.3.1, we introduced the data pre-processing method for multitemporal synthesis. In this study, the multitemporal synthesis operation is accomplished by taking the mean value of the three temporal phases. In fact, this is one of the ways. The synthesis methods for finding the maximum and median values in the temporal phase dimension as well as image stacking are also commonly used for processing. To verify the superiority of the mean synthesis approach, this paper compares the prediction results of the models using the four methods with the same training data and consistent parameter settings.
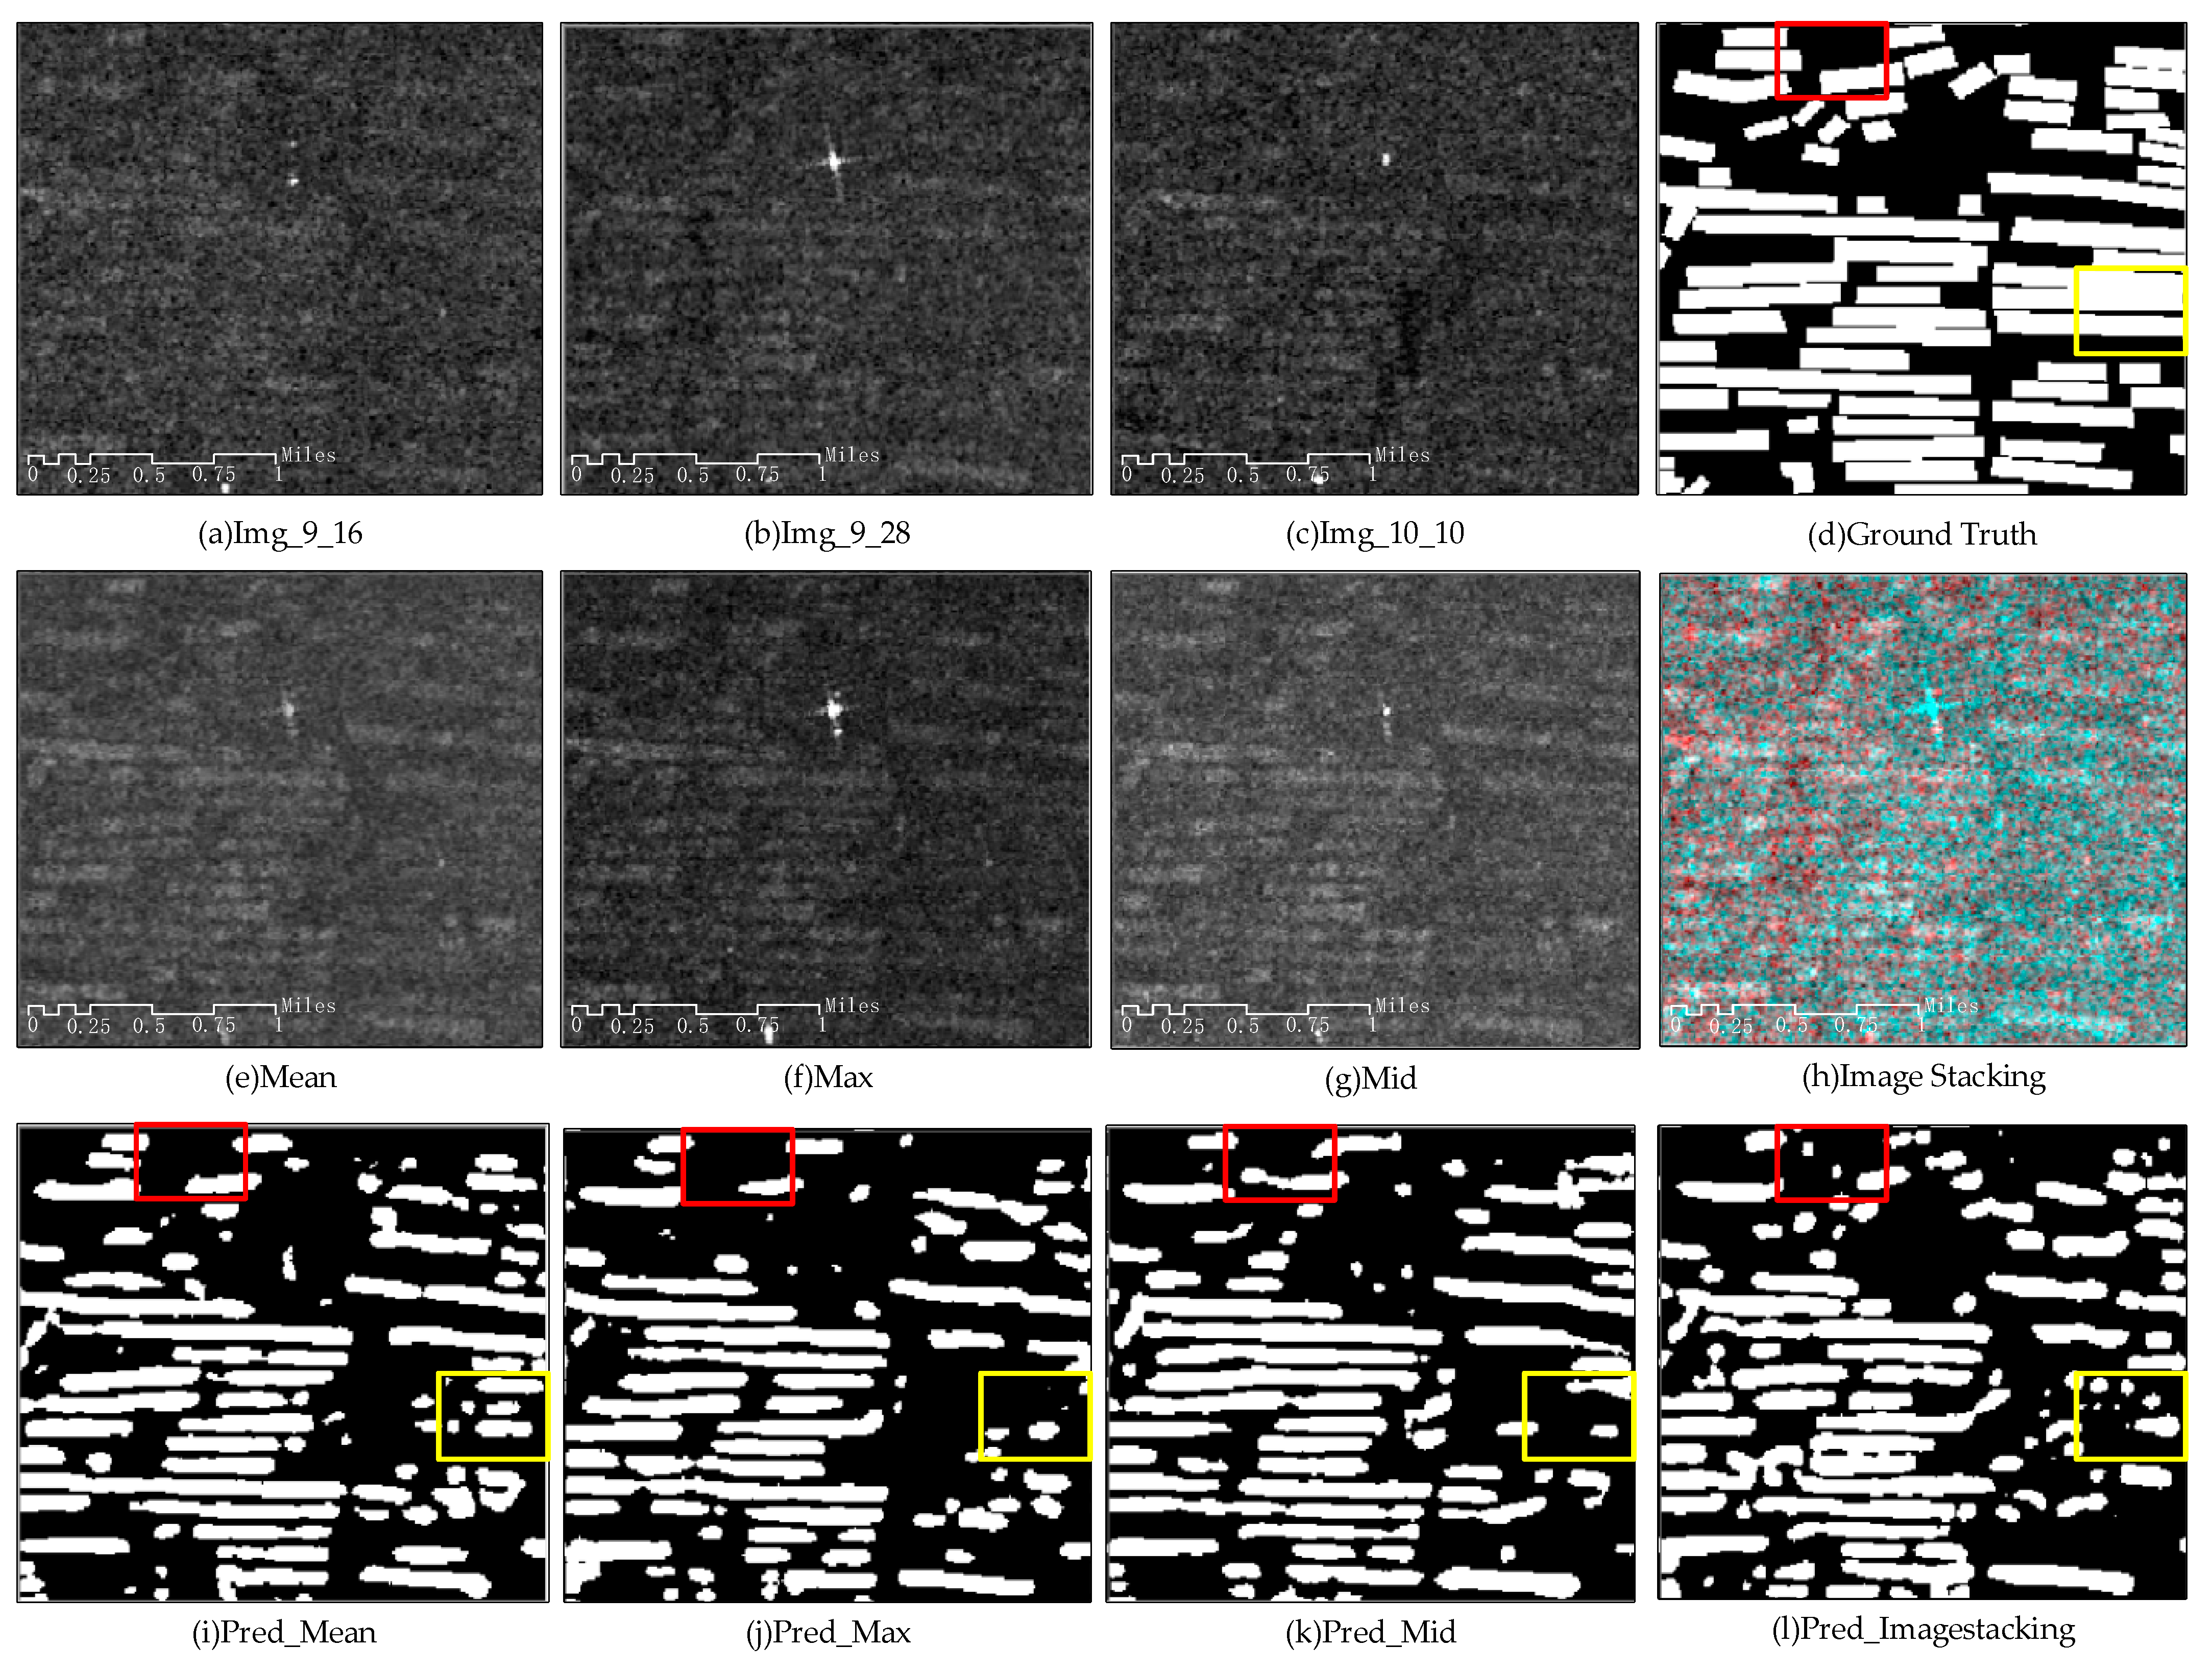
Figure 13 shows the processing results of the four smoothing methods. It can be seen intuitively that the image quality after multitemporal synthesis is improved compared to the original image, and the mean value synthesis method has the best effect. Although the combination of the maximum value and the median value enhances the signal in the raft aquaculture area to a certain extent, the discontinuity of the signal is also enhanced. Only the pixel value information of a single phase is retained. So, there are many omissions in the prediction results, as shown in the yellow box in
Figure 13j,k. The mean synthesis and image stacking approach retains the most information of the three time phases, but the image stacking approach has difficulty focusing on the marine raft aquaculture area. The noise which interferes with the target information on each time phase is retained too. As a result, there is considerable point noise in the extraction results (as shown in the red box in
Figure 13).
As shown in
Table 4, the mean value synthesis method has the highest MeanIOU, OA and
F1. The maximum and median synthesis approaches have more information loss, their Recall is lower and their MeanIOU, OA and
F1 are not dominant. The image stacking method keeps all of the temporal information intact but does not consider the denoising function. As shown in
Table 4, the result maintains the highest recall value while maintaining the lowest composite index
F1. Overall, multitemporal averaging is more robust.
4.2. Validity of the Model
In
Section 3.3.2 we compared the results of the popular semantic segmentation models for extracting marine raft aquaculture areas, of which Unet worked best. Therefore, in this section only the method proposed in this paper is compared with Unet for validation.
Figure 14 presents the prediction results of the models in typical regions.
Table 5 shows the quantitative assessment results of the validation experiment.
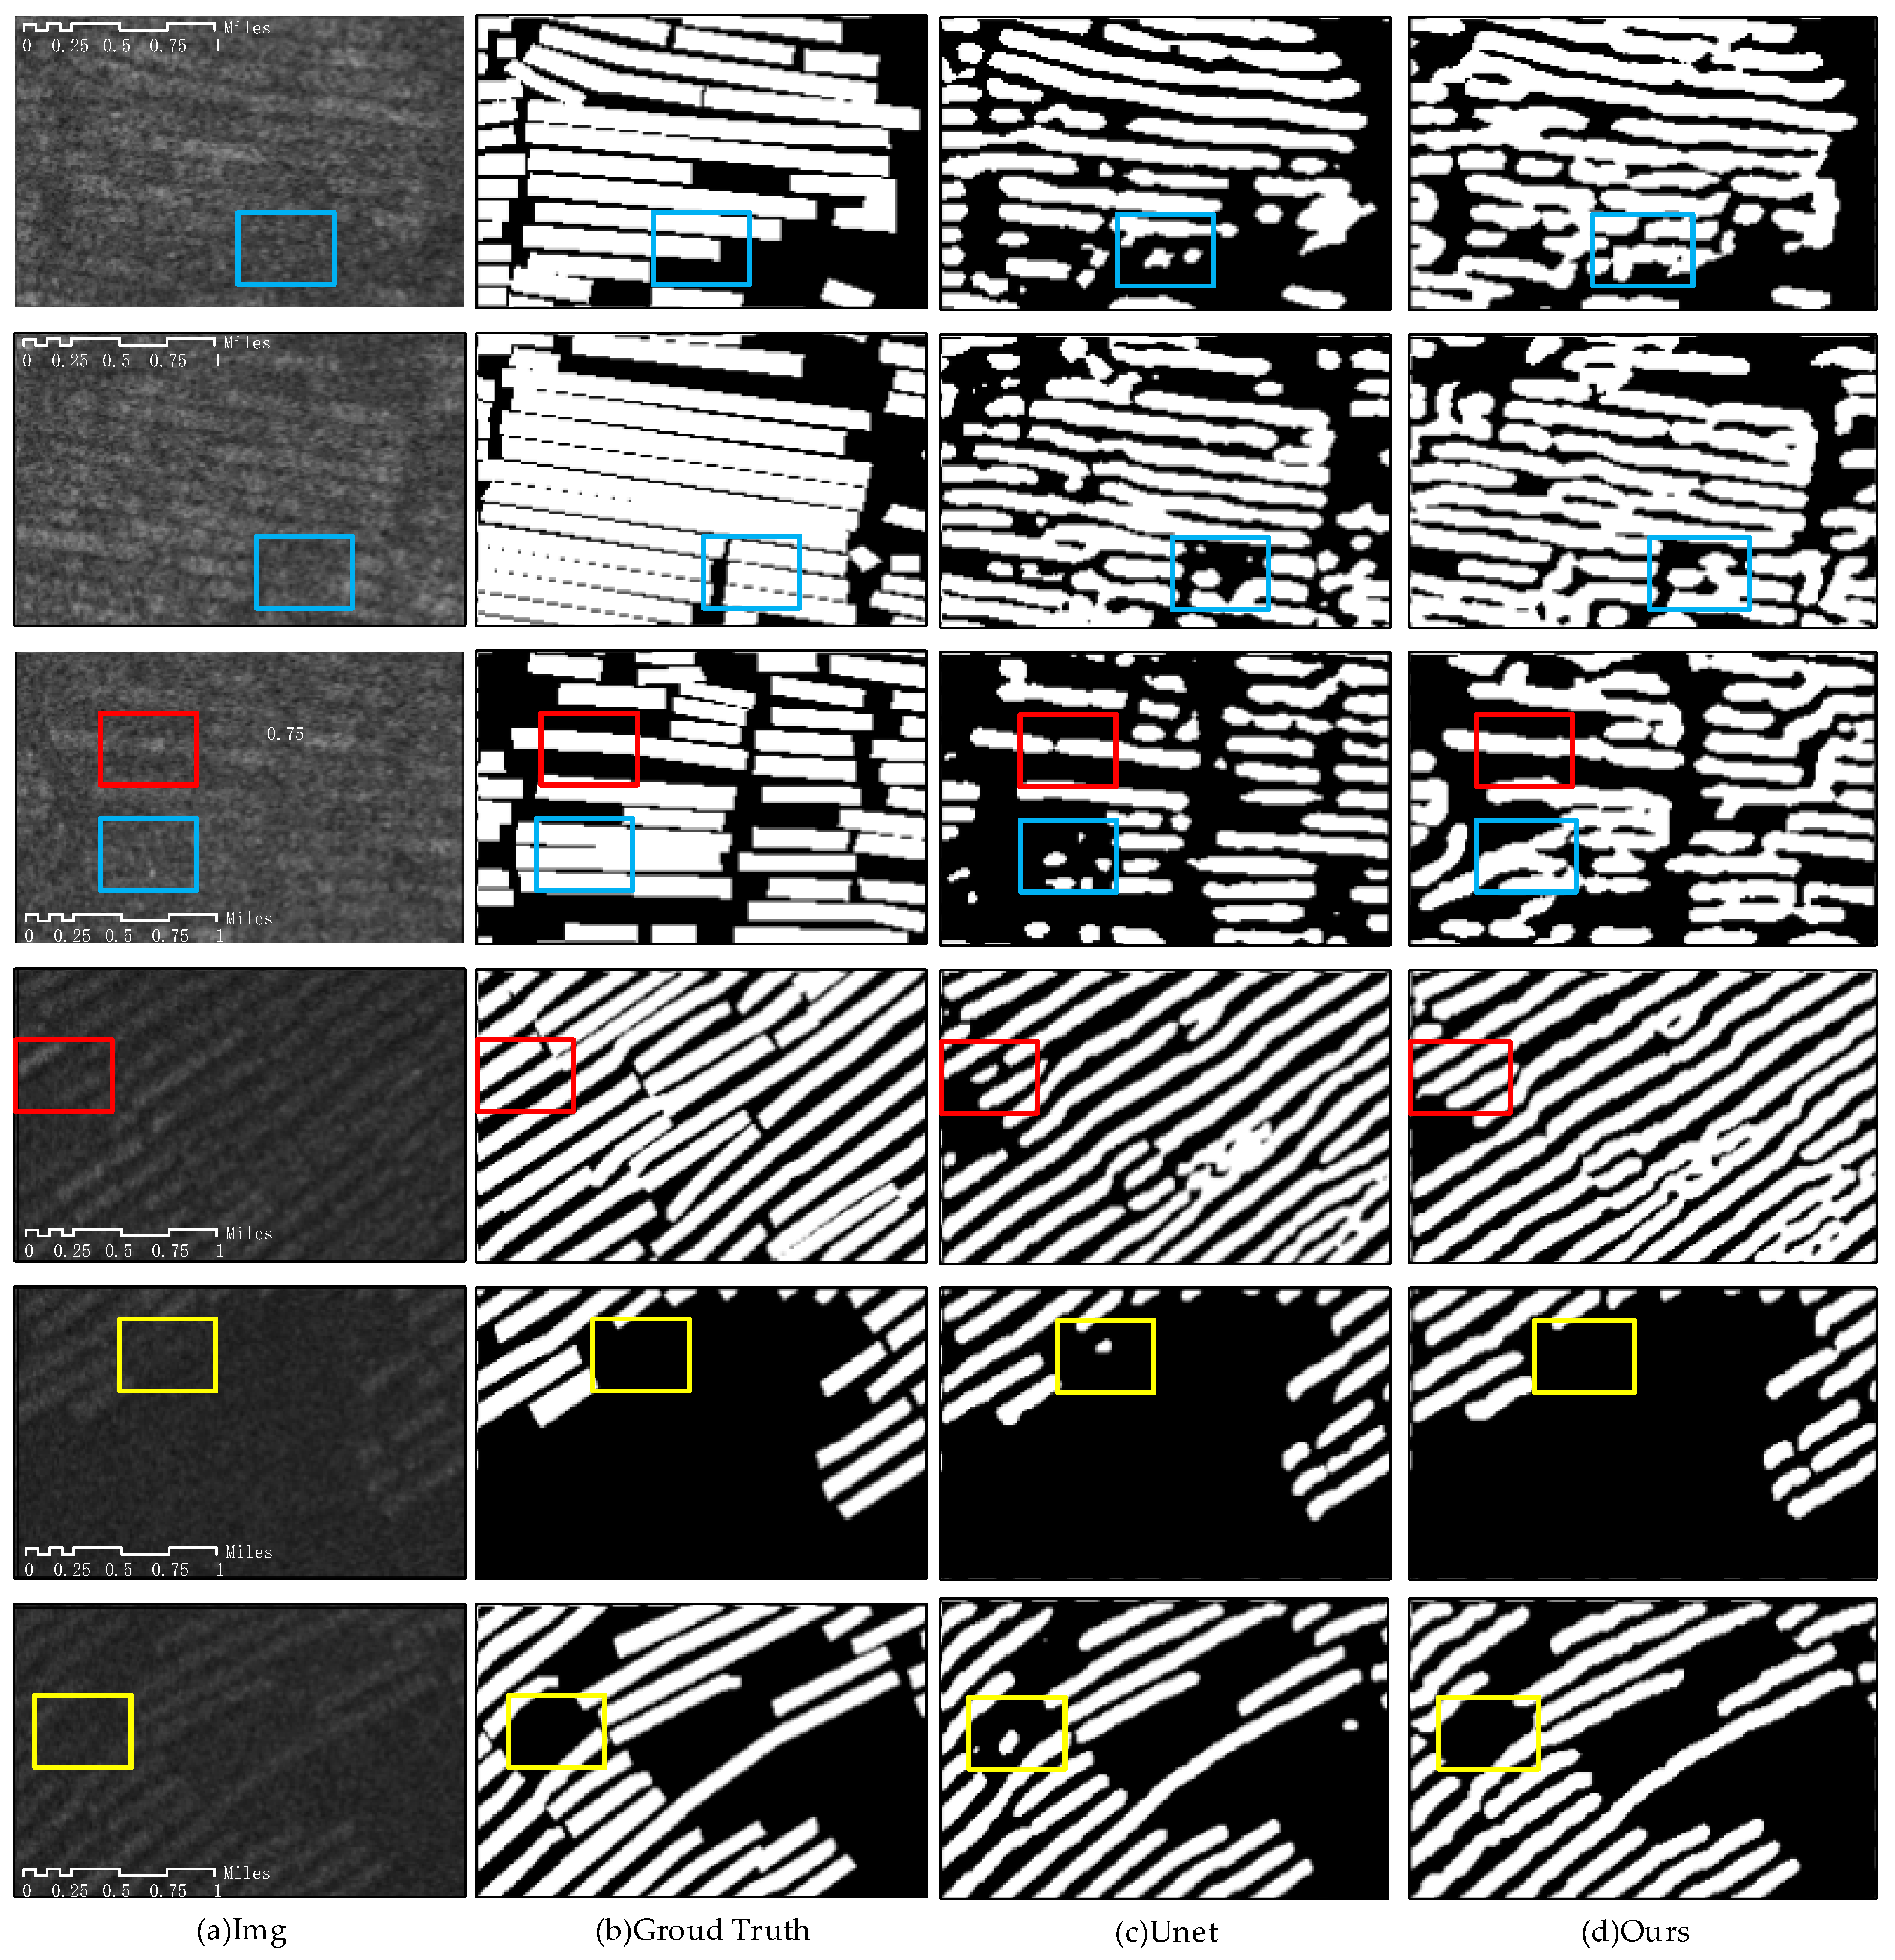
Although the extraction results of Unet are the best among popular semantic segmentation models, there are still many omissions. We speculate that this is due to the fact that the Unet model does not extract semantic information deeply enough and does not learn more critical information, resulting in its poor resistance to noise. As a result, there are many false negative pixels for regions with weak features in raft aquaculture areas, as shown in
Figure 14c. In addition, incomplete extraction results appear in regions of the image17 that are obviously attacked by noise, as shown in red boxes in
Figure 14c. The false positive pixels in yellow boxes in
Figure 14c further verify that Unet lacks the ability to extract key features. The model proposed in this paper uses a depth suitable for the size of the marine raft aquaculture area to learn more advanced semantic information while ensuring that the features of the target are not completely flooded. In addition, the shape constraint module guides the model to learn more critical features and improves the model’s immunity to noise. Therefore, the extraction results of the model presented in this paper have fewer omissions and higher completeness. As shown in
Figure 14d, there are less false negative pixels in blue and red boxes. Corresponding to the visualization results, in
Table 5, the model proposed in this paper obtained higher evaluation results compared to Unet, where the OA improved by 2.31%, the MeanIOU improved by 3.27%, and the
F1 improved by 3.99%.
4.3. Large Area Marking of Marine Raft Aquaculture Areas
The results of the marine raft aquaculture area distribution in the eastern coastal region of Dalian using the method in this study are shown in
Figure 15. The distribution of raft aquaculture areas is basically parallel to the coastline (generally in the southwest-northeast direction). Combined with the original image, the extraction results of the proposed method are basically consistent with the real distribution. The marine raft aquaculture area can be well identified.
5. Discussion
The popular semantic segmentation methods are more advantageous than the traditional methods, but they do not work well when directly migrated to SAR images for extracting the marine raft aquaculture area. The geometric features of the marine raft aquaculture area on the SAR image are obvious, but the grey value is greatly affected by noise and sea states, which reduces the significance of the features. Therefore, the proposed method in this paper uses mean synthesis in the data processing stage to improve the image quality and combines geometric features to optimize the model.
In terms of data pre-processing, this paper compares the results of model prediction under four different multitemporal data synthesis schemes: mean synthesis, maximum value synthesis, median synthesis, and image stacking. All above methods can, to a certain extent, eliminate the problem of inconspicuous features caused by the combined effect of their own structural characteristics and ocean movement in raft aquaculture areas. However, in comparison, the method of retaining the mean value information in the temporal phase dimension can balance SAR image denoising and feature enhancement of the marine raft aquaculture area. On the other hand, the maximum and median synthetic image pixel values are derived from the original pixel values in one view of the multitemporal images, resulting in loss of information from the marine raft aquaculture area. At the same time, although the processing method of multitemporal image stacking completely retains the content of three temporal phases, it mainly enhances the change information between different temporal images. As a result, the invariant features required for raft aquaculture area monitoring are not significant in this synthesis method, and the noise is also retained completely (albeit with stronger interference information). Therefore, the MeanIOU and F1 indices of the multitemporal phase mean synthesis method are the highest.
In terms of model, the popular semantic segmentation models, including FCN, PSPnet, DeepLabV3+ and Unet, are not ideal for extraction of the marine raft aquaculture area on Sentienl-1. The upsampling of FCN is too rough, resulting in the model being insensitive to image details. PSPnet lacks attention to the underlying information due to excessive multiscale pooling operations. DeepLabV3+ used atrous convolution to expand the receptive field, which also leads to loss of detailed information. There are both ‘omission’ and ‘adhesion’ are obvious in
Figure 9e,f. Unet used jump connection to fuse shallow semantics and deep semantics between encoder and decoder, which shows best performance in the task of marine raft aquaculture area extraction compared with other popular semantic segmentation models (
Section 3.3.1).
Nevertheless, Unet is not combined with the characteristics of the target, so it is greatly affected by its greyscale changes when extracting the marine raft aquaculture area and it is difficult to resist the interference of noise. The model proposed in this paper combines the geometric features of the raft aquaculture area to optimize the depth of the model and introduce a shape constraint module. The proposed method has better performance than Unet. The optimization of model depth makes the model extract more common features. The shape constraint module adds shape prior knowledge to the model through the loss function to guide the model to learn more critical features. Therefore, the features learned by this model are more closely matched to the essential features of the marine raft aquaculture area. As a result, it is more resistant to noise and less affected by the difference of target scattering features on the image. So, the method has better performance with 3.99% improvement in F1, 2.31% improvement in MeanIOU, and 4.07% improvement in OA compared to the original Unet.
Overall, the improvement of the method is effective and provides a reference for later researchers. In practical applications, the use of multitemporal information is very necessary for application scenarios where the background changes dynamically with time. In addition, it is essential to incorporate the characteristics of the target in the method design. We believe that it is helpful to incorporate shape priors into the method when extracting objects with regular shapes. Compared to Shi et al. [
13], Cui et al. [
14] who extracted marine raft aquaculture areas on high fractional optical images, the proposed method focuses on the study on SAR images which can be got all day and all weather. Compared with Zhang et al. [
21], Wang et al. [
22], the proposed method refines the extraction unit of the marine raft aquaculture area. Nonetheless, the method still has room for improvement. The type of aquaculture has not yet been distinguished, although large-scale marine raft aquaculture areas were marked in Dalian and the surrounding waters according to the proposed method. In the future, we expect to mark the marine aquaculture area of animal and plant separately.
6. Conclusions
The special structure of raft aquaculture and the complex marine background make the task of the marine raft aquaculture area extraction from Sentinel-1 images challenging. In this paper, we propose a method for segmenting marine raft aquaculture areas in multitemporal Sentinel-1 images with shape constraints and experimentally validate the effectiveness of the method:
- 1.
The data synthesized using the multitemporal average effectively overcomes the problems of the low signal-to-noise ratio of Sentinel-1 images and the reduction of feature significance in marine raft aquaculture areas caused by noise and ocean motion.
- 2.
The model proposed in this paper is designed by combining the geometric features of the marine raft aquaculture area. By determining a network structure suitable for the size of the object, introducing the attention mechanism, and adding shape prior knowledge to the network, the extraction accuracy of the marine raft aquaculture area is effectively improved.
In summary, the proposed method takes more application scenarios into consideration and incorporates the prior knowledge of the raft aquaculture area into the method system. Compared with Unet and other popular semantic segmentation methods, the proposed method has better extraction accuracy, which provides a good application basis for downstream practical application tasks and provides convenience for relevant departments to regularly monitor marine aquaculture on a large scale. It is conducive to the scientific layout of marine raft aquaculture areas and the protection of marine ecology.
Author Contributions
Conceptualization, Y.Z.; methodology, Y.Z., C.W.; validation, Y.Z., C.W. and F.W.; writing—original draft preparation, Y.Z.; writing—review and editing, Y.Z., C.W. and J.C.; funding acquisition, C.W., F.W. All authors have read and agreed to the published version of the manuscript.
Funding
This research was funded by “Big data on Earth in Support of Ocean Sustainable Development Goals Research [XDA19090123]” and Self-Topic Fund of Aerospace Information Research Institute, Chinese Academy of Sciences [E1Z211010F].
Acknowledgments
We would like to thank the Copernicus program of the European Space Agency for making Sentinel-1 SAR data freely available.
Conflicts of Interest
The authors declare no conflict of interest.
References
- FAO. World Fisheries and Aquaculture Overview 2020; FAO Fisheries Department: Rome, Italy, 2020. [Google Scholar]
- Ministry of Agriculture and Rural Affairs of the People’s Republic of China. 2019 China Fisheries Statistical Yearbook. World Agric. 2020, 2. Available online: http://www.stats.gov.cn/tjsj/ndsj/2019/indexeh.htm (accessed on 5 January 2020).
- Zhang, J.H.; Liu, J.H.; Zhang, Y.Y.; Li, G. Approaches for marine aquaculture to practice “negative marine emissions”. Proc. Chin. Acad. Sci. 2021, 36, 252–258. [Google Scholar] [CrossRef]
- Ministry of Agriculture and Rural Affairs of the People’s Republic of China. The “13th Five-Year Plan” for the Development of National Pelagic Fisheries. Rural. Pract. Technol. 2018, 5–8. Available online: https://www.uscc.gov/sites/default/files/Research/The%2013th%20Five-Year%20Plan_Final_2.14.17_Updated%20%28002%29.pdf (accessed on 5 January 2020).
- Huang, Q.Q.; Wang, L.H. Research on the application of remote sensing technology in aquaculture planning. China Fish. Econ. 2002, 27–28. [Google Scholar] [CrossRef]
- Wang, J.; Sui, L.C.; Yang, X.M.; Wang, Z.H.; Liu, Y.M.; Kang, J.M.; Lu, C.; Yang, F.S.; Liu, B. Extracting Coastal Raft Aquaculture Data from Landsat 8 OLI Imagery. Sensors 2019, 19, 1221. [Google Scholar] [CrossRef] [Green Version]
- Deng, G.; Wu, H.Y.; Guo, P.P.; Li, M.Z. Evolution and development trend of marine raft cultivation model in China. Chin. Fish. Econ. 2013, 31, 164–169. [Google Scholar]
- Chen, B.Q.; Yang, Y.M.; Xu, D.W. The application of satellite remote sensing technology in the investigation of the current situation of sea area use—Taking SPOT-5 image and Xiamen sea area as an example. In Proceedings of the Fujian Oceanographic Society 2008 Academic Annual Conference and the Construction of the Economic Zone on the West Coast of the Taiwan Strait Symposium on Marine Science and Technology Support and Marine Resources Development, Xiamen, China, 8 July 2008. [Google Scholar]
- Lu, Y.; Li, Q.; Du, X.; Wang, H.; Liu, J. A Method of Coastal Aquaculture Area Automatic Extraction with High Spatial Resolution Images. Remote Sens. Technol. Appl. 2015, 30, 486–494. [Google Scholar]
- Chu, J.; Shao, G.; Zhao, J.; Gao, N.; Wang, F.; Cui, B. Information extraction of floating raft aquaculture based on GF-1. Surv. Surv. Mapp. 2020, 45, 92–98. [Google Scholar]
- Wang, F.; Xia, L.H.; Chen, Z.B.; Cui, W.J.; Liu, Z.; Pan, C. Object-Oriented Remote Sensing Recognition of Coastal Marine Aquaculture Patterns Based on Association Rules. Chin. J. Agric. Eng. 2018, 34, 210–217. [Google Scholar]
- Liu, Y.M.; Yang, X.M.; Wang, Z.H.; Lu, C. Extraction of Sandu’ao raft culture area based on deep learning RCF model. Oceanogr. Soc. 2019, 41, 119–130. [Google Scholar]
- Shi, T.; Xu, Q.; Zou, Z.; Shi, Z. Automatic Raft Labeling for Remote Sensing Images via Dual-Scale Homogeneous Convolutional Neural Network. Remote Sens. 2018, 10, 1130. [Google Scholar] [CrossRef] [Green Version]
- Cui, B.; Fei, D.; Shao, G.; Lu, Y.; Chu, J. Extracting Raft Aquaculture Areas from Remote Sensing Images via an Improved U-Net with a PSE Structure. Remote Sens. 2019, 11, 2053. [Google Scholar] [CrossRef] [Green Version]
- Aguilar-Manjarrez, J.; Travaglia, C. Mapping coastal aquaculture and fisheries structures by satellite imaging radar: Case study of the Lingayen Gulf, the Philippines. ISME J. 2004. [Google Scholar] [CrossRef]
- Fan, J.C.; Zhang, F.; Zhao, D.; Wen, S.; Wei, B. Information extraction of marine raft aquaculture based on high-resolution satellite remote sensing SAR images. In Proceedings of the Second China Coastal Disaster Risk Analysis and Management Symposium, Haikou, China, 29 November 2014. [Google Scholar]
- Chu, J.L.; Zhao, D.Z.; Zhang, F.S.; Wei, B.Q.; Li, C.M.; Suo, A.N. Monitor method of rafts cultivation by remote sense—A case of Changhai. Mar. Environ. Sci. 2008, 27, 35–40. [Google Scholar]
- Fan, J.; Zhao, J.; An, W.; Hu, Y. Marine Floating Raft Aquaculture Detection of GF-3 PolSAR Images Based on Collective Multikernel Fuzzy Clustering. IEEE J. Sel. Top. Appl. Earth Obs. Remote Sens. 2019, 12, 2741–2754. [Google Scholar] [CrossRef]
- Geng, J.; Fan, J.C.; Chu, J.L.; Wang, H.Y. Target Recognition of Ocean Floating Rafts in SAR Image Based on Deep Cooperative Sparse Coding Network. J. Autom. 2016, 42, 593–604. [Google Scholar]
- Hu, Y.; Fan, J.; Wang, J. Target recognition of floating raft aquaculture in SAR image based on statistical region merging. In Proceedings of the 2017 Seventh International Conference on Information Science and Technology (ICIST), Da Nang, Vietnam, 16–19 April 2017; pp. 429–432. [Google Scholar]
- Zhang, Y.; Wang, C.; Ji, Y.; Chen, J.; Deng, Y.; Chen, J.; Jie, Y. Combining segmentation network and nonsubsampled contourlet transform for automatic marine raft aquaculture area extraction from sentinel-1 images. Remote Sens. 2020, 12, 4182. [Google Scholar] [CrossRef]
- Wang, D.; Han, M. SA-U-Net++: SAR marine floating raft aquaculture identification based on semantic segmentation and ISAR augmentation. J. Appl. Remote Sens. 2021, 15, 016505. [Google Scholar] [CrossRef]
- Sun, M.; Yang, X.; Xie, Y. Deep learning in aquaculture: A review. J. Comput. 2020, 31, 294–319. [Google Scholar]
- Zhu, X.; Montazeri, S.; Ali, M.; Hua, Y.; Wang, Y.; Mou, L.; Shi, Y.; Xu, F.; Bamler, R. Deep Learning Meets SAR: Concepts, Models, Pitfalls, and Perspectives. IEEE Geosci. Remote Sens. Mag. 2021, 9, 143–172. [Google Scholar] [CrossRef]
- Fan, J.; Wang, D.; Zhao, J.; Song, D.; Han, M.; Jiang, D. National Sea Area Use Dynamic Monitoring Based on GF-3 SAR Imagery. J. Radars 2017, 6, 456–472. [Google Scholar]
- Li, J. Research on Denoising and Classification of Polarimetric SAR Images Based on Deep Learning. Master’s Thesis, Liaoning University of Engineering and Technology, Jinzhou, China, 2021. [Google Scholar]
- Maritime Monitoring. Available online: https://sentinel.esa.int/web/sentinel/user-guides/sentinel-1-sar/applications/maritime-monitoring (accessed on 5 January 2020).
- Zhao, W.; Deledalle, C.A.; Denis, L.; Maître, H.; Nicolas, J.M.; Tupin, F. Ratio-based multi-temporal SAR images denoising. IEEE Trans. Geosci. Remote Sens. 2019, 57, 3552–3565. [Google Scholar] [CrossRef] [Green Version]
- Semantic Segmentation: Wiki, Applications and Resources. Available online: https://www.kdnuggets.com/2018/10/semantic-segmentation-wiki-applications-resources.html (accessed on 9 December 2020).
- Garcia-Garcia, A.; Orts-Escolano, S.; Oprea, S.; Villena-Martinez, V.; Garcia-Rodriguez, J. A Review on Deep Learning Techniques Applied to Semantic Segmentation. arXiv 2017, arXiv:1704.06857. [Google Scholar]
- Ulku, I.; Akagunduz, E. A Survey on Deep Learning-based Architectures for Semantic Segmentation on 2D images. arXiv 2019, arXiv:1912.10230. [Google Scholar] [CrossRef]
- Yuan, X.; Shi, J.; Gu, L. A review of deep learning methods for semantic segmentation of remote sensing imagery. Expert Syst. Appl. 2021, 169, 114417. [Google Scholar] [CrossRef]
- Long, J.; Shelhamer, E.; Darrell, T. Fully convolutional networks for semantic segmentation. In Proceedings of the IEEE Conference on Computer Vision and Pattern Recognition (CVPR), Boston, MA, USA, 7–12 June 2015; pp. 3431–3440. [Google Scholar]
- Ronneberger, O.; Fischer, P.; Brox, T. U-net: Convolutional networks for biomedical image segmentation. In Proceedings of the International Conference on Medical Image Computing and Computer-Assisted Intervention, Munich, Germany, 5–9 October 2015; Springer: Cham, Switzerland, 2015; pp. 234–241. [Google Scholar]
- Zhao, H.; Shi, J.; Qi, X.; Wang, X.; Jia, J. Pyramid scene parsing network. In Proceedings of the IEEE Conference on Computer Vision and Pattern Recognition (CVPR), Honolulu, HI, USA, 21–26 July 2017; pp. 2881–2890. [Google Scholar]
- Chen, L.C.; Zhu, Y.; Papandreou, G.; Schroff, F.; Adam, H. Encoder-Decoder with Atrous Separable Convolution for Semantic Image Segmentation; Springer: Cham, Switzerland, 2018. [Google Scholar]
- Bengio, Y.; Lecun, Y. Scaling learning algorithms towards AI. Large-Scale Kernel Mach. 2007, 34, 1–41. [Google Scholar]
- Woo, S.; Park, J.; Lee, J.Y.; Kweon, I.S. CBAM: Convolutional Block Attention Module; Springer: Cham, Switzerland, 2018. [Google Scholar]
- Wang, Q.; Wu, B.; Zhu, P.; Li, P.; Zuo, W.; Hu, Q. ECA-Net: Efficient Channel Attention for Deep Convolutional Neural Networks. In Proceedings of the 2020 IEEE/CVF Conference on Computer Vision and Pattern Recognition (CVPR), Seattle, WA, USA, 16–18 June 2020; pp. 11534–11542. [Google Scholar]
- Wang, C.; Li, L.F. Multi-Scale Residual Deep Network for Semantic Segmentation of Buildings with Regularizer of Shape Representation. Remote Sens. 2020, 12, 2932. [Google Scholar] [CrossRef]
- Jaccard, P. The Distribution of the Flora in the Alpine Zone. New Phytol. 2010, 11, 37–50. [Google Scholar] [CrossRef]
Figure 1.
View of the marine raft aquaculture area: (
a) natural image of the marine raft aquaculture area (
http://www.shuichan.cc/news_view-397141.html, (accessed on 21 February 2020); (
b) description of the scattering principle of floating raft in the marine raft aquaculture area. 1. Surface scattering from the seawater and the floats; 2. Double-bounce scattering from seawater and floating balls; 3. Helix scattering from seawater and floats; (
c) marine raft aquaculture areas in Sentinel-1 image.
Figure 2.
View of the results for geometric feature statistics: (a) semi-perimeter statistics for marine aquaculture areas; (b) rectangularity statistics for marine aquaculture areas; (c) aspect ratio statistics for marine aquaculture areas.
Figure 2.
View of the results for geometric feature statistics: (a) semi-perimeter statistics for marine aquaculture areas; (b) rectangularity statistics for marine aquaculture areas; (c) aspect ratio statistics for marine aquaculture areas.
Figure 3.
View of the study area.
Figure 3.
View of the study area.
Figure 4.
View of the Sentinel-1 dual polarization image.
Figure 4.
View of the Sentinel-1 dual polarization image.
Figure 5.
Extraction results for regions A and B before and after sample expansion. (a) Test image; (b) Ground truth; (c) The extraction result after training of the initial sample; (d) The extraction result after expansion of the sample.
Figure 5.
Extraction results for regions A and B before and after sample expansion. (a) Test image; (b) Ground truth; (c) The extraction result after training of the initial sample; (d) The extraction result after expansion of the sample.
Figure 6.
Overview of the dataset construction process.
Figure 6.
Overview of the dataset construction process.
Figure 7.
Overall process flow c.3.1. Multitemporal SAR Image Synthesis.
Figure 7.
Overall process flow c.3.1. Multitemporal SAR Image Synthesis.
Figure 8.
Overview of the results for data pre-processing. (a) shows the original image; (b) shows the result of refined Lee filtering obtained using SNAP (the ESA Sentinel Applications Platform); (c) shows the result of multitemporal synthesis.
Figure 8.
Overview of the results for data pre-processing. (a) shows the original image; (b) shows the result of refined Lee filtering obtained using SNAP (the ESA Sentinel Applications Platform); (c) shows the result of multitemporal synthesis.
Figure 9.
Visualization results of extraction for the marine raft aquaculture area by classical semantic segmentation models. (a) Test image (region numbered 0); (b) Ground truth; (c)The result obtained by FCN; (d) The result obtained by Unet; (e) The result obtained by PSPnet; (f) is the result obtained by DeepLabV3+.
Figure 10.
Schematic diagram of the model used in this study.
Figure 10.
Schematic diagram of the model used in this study.
Figure 11.
Schematic diagram of the attention module used in this study.
Figure 11.
Schematic diagram of the attention module used in this study.
Figure 12.
Schematic diagram of the overall flow of shape constraints.
Figure 12.
Schematic diagram of the overall flow of shape constraints.
Figure 13.
The results of multitemporal synthesis methods. (a–c) are the original images on 16, 28 September and 10 October 2019; (d) Ground truth; (e–h) are results obtained by using mean synthesis, maximum synthesis, median synthesis and image stacking in the time-phase dimension; (i–l) are corresponding prediction results for (e–h).
Figure 14.
Overview of the results of the experiment for verifying the model’s validity. (a) Test image (regions numbered 1,2,3,4,5,6); (b) Ground truth; (c) The prediction result obtained by Unet; (d) The prediction result obtained by our method.
Figure 14.
Overview of the results of the experiment for verifying the model’s validity. (a) Test image (regions numbered 1,2,3,4,5,6); (b) Ground truth; (c) The prediction result obtained by Unet; (d) The prediction result obtained by our method.
Figure 15.
Overview of the extraction results for the marine raft aquaculture area in the stuarea.
Figure 15.
Overview of the extraction results for the marine raft aquaculture area in the stuarea.
Table 1.
The specific parameters of the Sentinel-1 IW GRD level-1 data.
Table 1.
The specific parameters of the Sentinel-1 IW GRD level-1 data.
| Acq. Mode | IW |
| Product Type | GRD |
| Polarization | VV/VH |
| Resolution (Ring × Azi [m]) | 20 × 22 |
| Pixel Spacing (Ring × Azi [m]) | 10 × 10 |
| Num Looks (Ring × Azi) | 5 × 1 |
| Equivalent Number of Appearance (ENL) | 4.4 |
Table 2.
Results of accuracy evaluation of classical semantic segmentation models for extracting marine raft aquaculture areas.
Table 2.
Results of accuracy evaluation of classical semantic segmentation models for extracting marine raft aquaculture areas.
| Model | OA | MeanIOU | Recall | Precision | F1 |
|---|
| FCN | 0.7499 | 0.5755 | 0.5612 | 0.7530 | 0.6431 |
| Unet | 0.8051 | 0.6539 | 0.6457 | 0.8313 | 0.7268 |
| PSPnet | 0.6637 | 0.4234 | 0.2333 | 0.7669 | 0.3577 |
| DeepLabV3+ | 0.7418 | 0.5481 | 0.4492 | 0.8295 | 0.5828 |
Table 3.
Results of the accuracy evaluation for models with different depths.
Table 3.
Results of the accuracy evaluation for models with different depths.
| Model | OA | MeanIOU | Recall | Precision | F1 |
|---|
| Unet_3 | 0.8041 | 0.6699 | 0.7033 | 0.9086 | 0.7867 |
| Unet_4 | 0.814 | 0.6793 | 0.7118 | 0.9147 | 0.799 |
| Unet_5 | 0.82 | 0.6885 | 0.7196 | 0.9223 | 0.8053 |
| Unet_6 | 0.8272 | 0.6913 | 0.7271 | 0.9322 | 0.8141 |
| Unet_7 | 0.8139 | 0.68 | 0.7004 | 0.9306 | 0.7959 |
Table 4.
Quantitative assessment results of the comparison test for multitemporal synthetic in region 0.
Table 4.
Quantitative assessment results of the comparison test for multitemporal synthetic in region 0.
| Method | OA | MeanIOU | Recall | Precision | F1 |
|---|
| Mean | 0.8051 | 0.6539 | 0.6457 | 0.8313 | 0.7268 |
| Max | 0.7954 | 0.6355 | 0.5994 | 0.846 | 0.7017 |
| Mid | 0.7896 | 0.6290 | 0.6057 | 0.8235 | 0.698 |
| Image stacking | 0.7832 | 0.6202 | 0.6891 | 0.8124 | 0.6891 |
Table 5.
Quantitative assessment results of the validation experiment.
Table 5.
Quantitative assessment results of the validation experiment.
| Model | | OA | MeanIOU | Recall | Precision | F1 |
|---|
| Unet | 1 | 0.7647 | 0.6188 | 0.6773 | 0.8948 | 0.771 |
| 2 | 0.7218 | 0.548 | 0.6731 | 0.9176 | 0.7765 |
| 3 | 0.7184 | 0.5558 | 0.5406 | 0.9004 | 0.6756 |
| 4 | 0.8458 | 0.7274 | 0.8043 | 0.9415 | 0.8675 |
| 5 | 0.9571 | 0.8514 | 0.7923 | 0.9368 | 0.8585 |
| 6 | 0.9122 | 0.8295 | 0.83 | 0.9428 | 0.8828 |
| Mean | 0.82 | 0.6885 | 0.7196 | 0.9223 | 0.8053 |
| Ours | 1 | 0.7838 | 0.6414 | 0.8501 | 0.7652 | 0.8054 |
| 2 | 0.7435 | 0.5655 | 0.891 | 0.7325 | 0.804 |
| 3 | 0.7764 | 0.6344 | 0.8332 | 0.7349 | 0.781 |
| 4 | 0.8696 | 0.7597 | 0.915 | 0.8734 | 0.8937 |
| 5 | 0.9654 | 0.8815 | 0.9263 | 0.858 | 0.8908 |
| 6 | 0.9196 | 0.8444 | 0.9243 | 0.8696 | 0.8961 |
| Mean | 0.8431 | 0.7212 | 0.89 | 0.8056 | 0.8452 |
| Publisher’s Note: MDPI stays neutral with regard to jurisdictional claims in published maps and institutional affiliations. |
© 2022 by the authors. Licensee MDPI, Basel, Switzerland. This article is an open access article distributed under the terms and conditions of the Creative Commons Attribution (CC BY) license (https://creativecommons.org/licenses/by/4.0/).


