Article

Response of Vegetation Phenology to the Interaction of Temperature and Precipitation Changes in Qilian Mountains

1
State Key Laboratory of Resources and Environment Information System, Institute of Geographic Sciences and Natural Resources Research, Chinese Academy of Sciences, Beijing 100101, China
2
University of Chinese Academy of Sciences, Beijing 100049, China
3
College of Civil Engineering and Architecture, Jishou University, Zhangjiajie 427000, China
4
Institute of Atmospheric Physics, Chinese Academy of Sciences, Beijing 100029, China
5
College of Land Science and Technology, China Agricultural University, Beijing 100083, China
*
Author to whom correspondence should be addressed.
Remote Sens. 2022, 14(5), 1248; https://doi.org/10.3390/rs14051248
Submission received: 21 January 2022 / Revised: 2 March 2022 / Accepted: 2 March 2022 / Published: 3 March 2022
(This article belongs to the Special Issue Advanced Earth Observations of Forest and Wetland Environment)

Abstract

:
Located at the junction between the continental climate region and marine climate region, the Qilian Mountains have experienced significant climate change. Vegetation phenology in the Qilian Mountains is sensitive to climate change. However, the response of vegetation phenology to temperature and precipitation change is still unclear, and the same is true for their interactions. First, we extracted grassland phenological parameters such as SOS (the start of the growing season), EOS (the end of the growing season), and LOS (the length of the growing season) from revised MODIS-NDVI data in the Qilian Mountains during the period from 2000 to 2019. Second, we analyzed change trends of the phenological parameters, temperature, and precipitation. Furthermore, the effects of each meteorological element changes and their interaction on multiple phenological parameters were detected using the GeoDetector method. The result implied that (1) the SOS in most areas except the northwestern mountain region showed an advanced trend (10 d/10a); the EOS showed a delayed trend in the southeast (5 d/10a), and an advanced trend (5 d/10a) in the northwest; the LOS showed an extended trend (10 d/10a) in the southeast, and a shortened trend (5 d/10a) in the northwest. (2) Compared with a single meteorological element in a single period, the interaction of temperature and precipitation in different periods had a higher impact on grassland phenology, with the maximum q-value increasing by about 0.4 for each phenological parameter. (3) The change in the grassland phenology in the Qilian Mountains was inconsistently complete with climate change in the spatial distribution. Our research reveals the response of grassland phenology to the interaction of different meteorological elements in different periods. Compared with a single element, this can reflect the response of vegetation phenology to climate change more comprehensively.

1. Introduction

In recent decades, the global climate has undergone significant changes. The United Nations Intergovernmental Panel on Climate Change (IPCC) pointed out that a global warming trend has been obvious in the past 100 years, and the surface temperature has increased by 0.85 °C on average [1]. Zuo et al. analyzed the monthly average temperature and precipitation and found that the trend of temperature increase in China has been slightly higher than the global average by more than 0.25 °C/10a since 1970. The change trend of precipitation is not spatially homogeneous. The Qilian Mountains have experienced the same significant precipitation increases as Xinjiang, Northeast China, Southeastern Qinghai-Tibet Plateau, and Eastern China [2]. The Qilian Mountains region is located at the transition of multiple climate zones with a unique geographical condition, coupled with large topography, with complex and large temporal and spatial differences in climate conditions. Mainly due to the altitude variations in the region, there are significant spatial and temporal differences in the changes in the meteorological features. To study vegetation and carbon cycles in the region, the temporal and spatial patterns of the meteorological elements in the Qilian Mountains must be clarified first [3,4,5].
In mountainous areas such as Qilian, the climate is the dominant element affecting the growth and development of vegetation. Climate has profound impacts on the temporal and spatial patterns of ecosystems [6,7]. Among them, the alpine grassland is the most sensitive and thus fragile to climate change. Changes in grass phenology, distribution, and growth status are not only indicators of climate change but also have fundamental impacts on the carbon cycle, energy budgets, and even watershed hydrology of the entire region [8,9,10].
Phenology is a periodic phenomenon of plants and animals affected by environmental elements, such as meteorology, hydrology, and soil [11,12]. Among these, meteorological elements have the most significant influence. Through the study of phenology, we can understand the changes in the local climate and their impacts on animals and plants. As the primary producer of terrestrial ecosystems, vegetation is conditioned by external environment factors such as light, temperature, and precipitation. It is sensitive to climate change and can indicate local climate change [13,14,15,16]. Since the 1970s, researchers have completed many studies on the responses of vegetation to climate change. The International Geosphere Biosphere Programme (IGBP) points out that global climate change is caused by changes in atmospheric composition, and land use/land cover, and will eventually lead to biodiversity loss and land desertification [17]. However, some studies with long-term, large-scale satellite remote sensing monitoring found that the vegetation coverage in the mid-high latitudes of the northern hemisphere has shown a significant increase in recent decades; that is, the mid-high latitudes of the northern hemisphere have become “greener” [18]. Kawabata et al. [19] analyzed the change trend of the global normalized vegetation index (NDVI) and found that the main element affecting the increase in vegetation activity in the mid-high latitudes of the northern hemisphere is the increase in temperature. Piao et al. [20] analyzed the relationship between NDVI and climate in China’s temperate grassland. The study showed that China’s grassland NDVI continued to increase from 1982 to 1999, and the precipitation of 200 mm in the growing season was the turning point for the growth of temperate grassland vegetation. Additionally, there was a 3-month lag in precipitation. Qiao et al. [21] studied the temporal and spatial patterns of vegetation phenology in the Qilian Mountains and found that the vegetation in the Qilian Mountains have a trend of SOS advance, EOS delay, and LOS extension. At the same time, with the minimum, maximum, and average temperature, correlation analysis showed that the SOS and EOS were triggered more by the maximum temperature than the minimum temperature or average temperature, and the LOS was significantly positively correlated with the annual average temperature.
In the past, researchers have usually used linear regression analysis to study the effect of a single element on vegetation phenology change, or to compare the impact of multiple factors on phenology change [21,22]. Yang et al. [23] used the redundancy analysis method to detect the impact of the interaction of climate and human activities on the vegetation phenology of the Qinghai-Tibet Plateau, which broke through the previous studies that only focused on the correlation of a single element and comprehensively considered the interaction of multiple elements. However, the essence of this method is still based on linear regression analysis. Each piece of data was used as an independent sample without considering the spatial distribution relationship. By using simple mathematical, statistical algorithms, regression analysis can reveal the correlation between different elements quickly and accurately. However, the processes in terrestrial ecosystems are very complex, and geographic conditions are usually spatially heterogeneous and show a nonlinear distribution. While linear regression analysis can analyze the relationship between elements in an efficient and easy way, it will be difficult to analyze the impacts of multi-element interactions on the research subjects [24]. If two geographic elements are relatively weakly correlated at the overall regional scale, this does not mean they are necessarily uncorrelated. It is possible that there are positive correlations in some parts and negative correlations in other parts, which together results in a weaker overall correlation in the study area as a whole. Unlike Independent Identical Distribution (I. I. D.) in classical statistics, the spatial distribution pattern of spatial features provides us with “excess information” from a geographic perspective. If a spatial element X has an interpretation of a spatial element Y, then the spatial distribution of X and Y should also be consistent. Based on the above theoretical perception, Wang et al. proposed a theoretical spatially statistical analysis approach, which expounds the use of Spatial Stratified Heterogeneity (SSH) and Q statistical theory to carry out objective and quantitative stratification analysis of geographic features, and developed GeoDetector to detect the interpretation degree of different geographic elements and their interaction with subject geographic phenomena [25,26,27].
After 2000, MODIS data with higher spatial resolution, more spectral bands, and shorter revisit periods gradually replaced NOAA-AVHRR and became the main data source for the remote sensing and monitoring of phenological changes [28]. The production of various thematic products based on MODIS data is more convenient for relevant research [29]. However, in the high altitudes of the northern hemisphere, there is a cold climate and snow cover. Picard et al. [30] pointed out that due to the interference of snow cover, the use of high-resolution satellite remote sensing images to extract vegetation phenology may create large errors. Based on MODIS MOD-09 data, Liu et al. from the Resource and Environmental Science Data Center of the Chinese Academy of Sciences (RESDC, http://www.resdc.cn/, accessed on 1 November 2021) re-executed the fine detection of clouds, snow, and shadows. At the same time, using benchmark growth synthesis and optimized interpolation algorithms, the NDVI products produced by the revised methods can better reflect the true growth process of vegetation [31,32,33,34].
Based on the MODIS-NDVI time series products from 2000 to 2019, this study compared various time series fitting functions such as SG smoothing filter fitting, asymmetric Gaussian fitting and Double-Logistic fitting and selected the one most suitable for vegetation in the Qilian Mountains. Using the asymmetric Gaussian fitting method for the temporal NDVI curve, combined with the dynamic threshold method, we extracted three remote sensing phenological parameters to reflect the growth status of the grassland in the Qilian Mountains: the start of the season (SOS), the end of the season (EOS), and the length of the season (LOS). The linear regression of the long-term series data of each parameter with time was performed, and the temporal and spatial change pattern of the parameters in each growing season was analyzed. Then, to reveal the response rules of grassland remote sensing phenology to climate change in the Qilian Mountains, the geographic detectors developed by Wang [25,26,27] were used to quantify the degree of the temperature and precipitation and their interactions in each month to interpret the changes in remote sensed phenological parameters over the course of 20 years.

2. Materials and Methods

2.1. Study Area

The Qilian Mountains are located at 35–40° N, 93–104° E, are about 1000 km long from east to west, and are about 300 km wide from north to south (Figure 1). Located at the transition between northeastern Qinghai Province and southwestern Gansu Province, the Qilian Mountains are composed of mountains and wide valleys paralleling northwest to southeast, with Altun Mountain in the west and Wushaoling in the east. The mountainous areas above 4100 m are covered with snow all year round and have the distribution of modern glaciers. According to the data of the second China glacier catalogue, there are 2684 glaciers, with a total area of 1597.81 ± 70.30 km2 and reserves of about 84.48 km3. Rivers include Heihe River, Buha River, Shule River, and Yema River, and lakes include Qinghai Lake, and Hara Lake. The water source of these rivers is mainly ice melt water.
The terrain is high in the northwest and low in the southeast, with an average elevation of 3523 m. Its unique geographical location and mountain orientation form the northern edge of the Qinghai-Tibet Plateau with Altun Mountains, Kunlun Mountains, and other mountains, blocking the continental dry and cold monsoon, creating a humid monsoon area in southeast, arid areas in the northwest of China, and the typical diverse climate pattern in the alpine region of the Qinghai-Tibet Plateau. Most areas of the Qilian Mountains have a continental climate. This area is the transition zone between arid and semi-arid regions in China and from the world’s most typical temperate monsoon climate zone to a temperate continental climate zone. The eastern section of Qilian Mountains is greatly affected by the southeast monsoon climate, with a relatively humid climate and more precipitation than the western section. Due to the characteristics of the mountain range and the influence of the Qinghai-Tibet Plateau on the atmospheric circulation, the climate of the study area can be divided into two parts: southeast and northwest. The southeast is a temperate monsoon area, and the northwest is an alpine climate area. In summer, the southeast monsoon from the Pacific extends northward and westward in the Hexi Corridor, making the area warm and humid; in winter, the area is cold and dry due to the northwest dry and cold air currents. The precipitation varies greatly at different times and in different regions. Rainfall is mainly concentrated in summer in the southeast, and the snow is mainly concentrated in spring and autumn in the central and western regions, respectively. The precipitation of the whole region is less in winter. The wind speed in the northwest of the study area is stronger than that in the southeast. The northwest is affected by the dry and cold wind from Siberia, which makes the snowfall mainly concentrated in the north of the mountain. After summer, the southeast of the study area is dominated by the southeast wind from the Pacific Ocean, which is warm and humid. In winter, it is also dominated by the northwest wind from Siberia, which is cold and dry.
The vegetation in the Qilian Mountains is dense in the southeast and sparse in the northwest. The main vegetation in the study area includes grassland, such as alpine meadow, subalpine meadow, and desertified grassland; woodland, such as shrub, coniferous forest, broad-leaved forest, and mixed forest; and farmland. Among them, grassland vegetation accounts for about 60% of the total area of the study area, which is the main vegetation type in the area, and is mainly distributed in river valleys and mountain plains in the middle and east of the study area, including Stipa and Achnatherum splendens. Alpine meadows are distributed higher than 3000 m above sea level and include perennial dwarf wormwood, alpine wormwood, and wormwood. Due to the difference in topography, precipitation, and temperature between the east and west of the study area, the vegetation coverage has also formed a distinct zonal distribution. From east to west, there are temperate grasslands, temperate broad-leaved forests, temperate coniferous forests, alpine shrubs, alpine meadows, alpine grasslands, and alpine deserts.
The environment in the Qilian Mountains is harsh for humans; therefore, the population is sparse, and the impact of human activities is relatively trivial. Additionally, limited by the policy, there is no large-scale grazing phenomenon. The grassland is mainly natural wild grassland, and there is almost no pasture. The northwest of the study area is unused land, most of the central and eastern areas are grasslands, and there is a small amount of forest in the northeast. Only the eastern and northern river valleys and piedmont oasis areas have a small number of cities and agricultural land with strong human disturbance. Therefore, this study area can reflect the response of vegetation to climate change under natural conditions. Especially in recent years, the establishment of the Qilian Mountains National Park has protected the naturalness of the ecological system and protected the vegetation in the area from being destroyed by human activities.
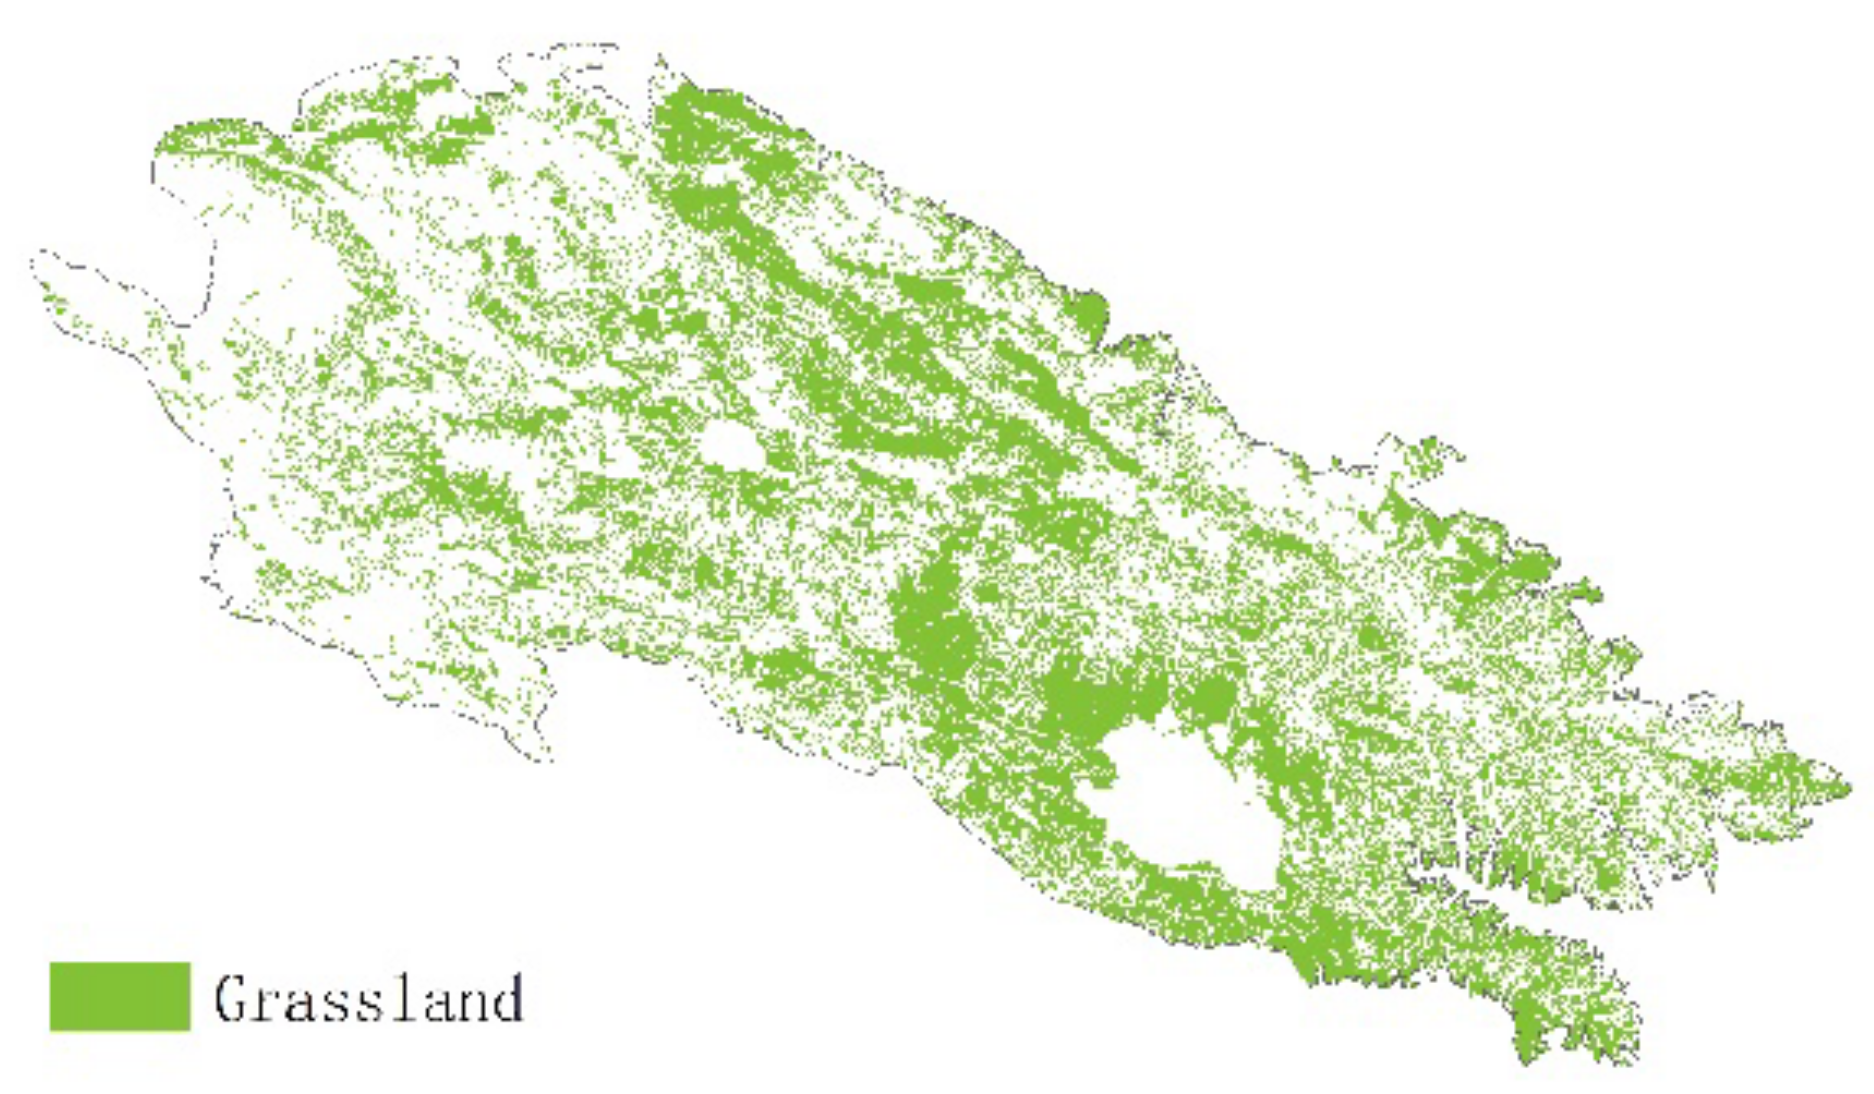
The land cover types in some parts of the study area have changed from 2000 to 2019. Some grassland became woodland, and some unused land became grassland due to natural ecological succession. This kind of land cover change will lead to significant changes in remote sensing phenological parameters. This kind of change is not caused merely by climate change and is not discussed in this study. Additionally, we selected grassland that has not changed between 2000 and 2019 as the research subject, as shown in Figure 2.

2.2. Data Source and Preprocessing

2.2.1. Meteorology Data

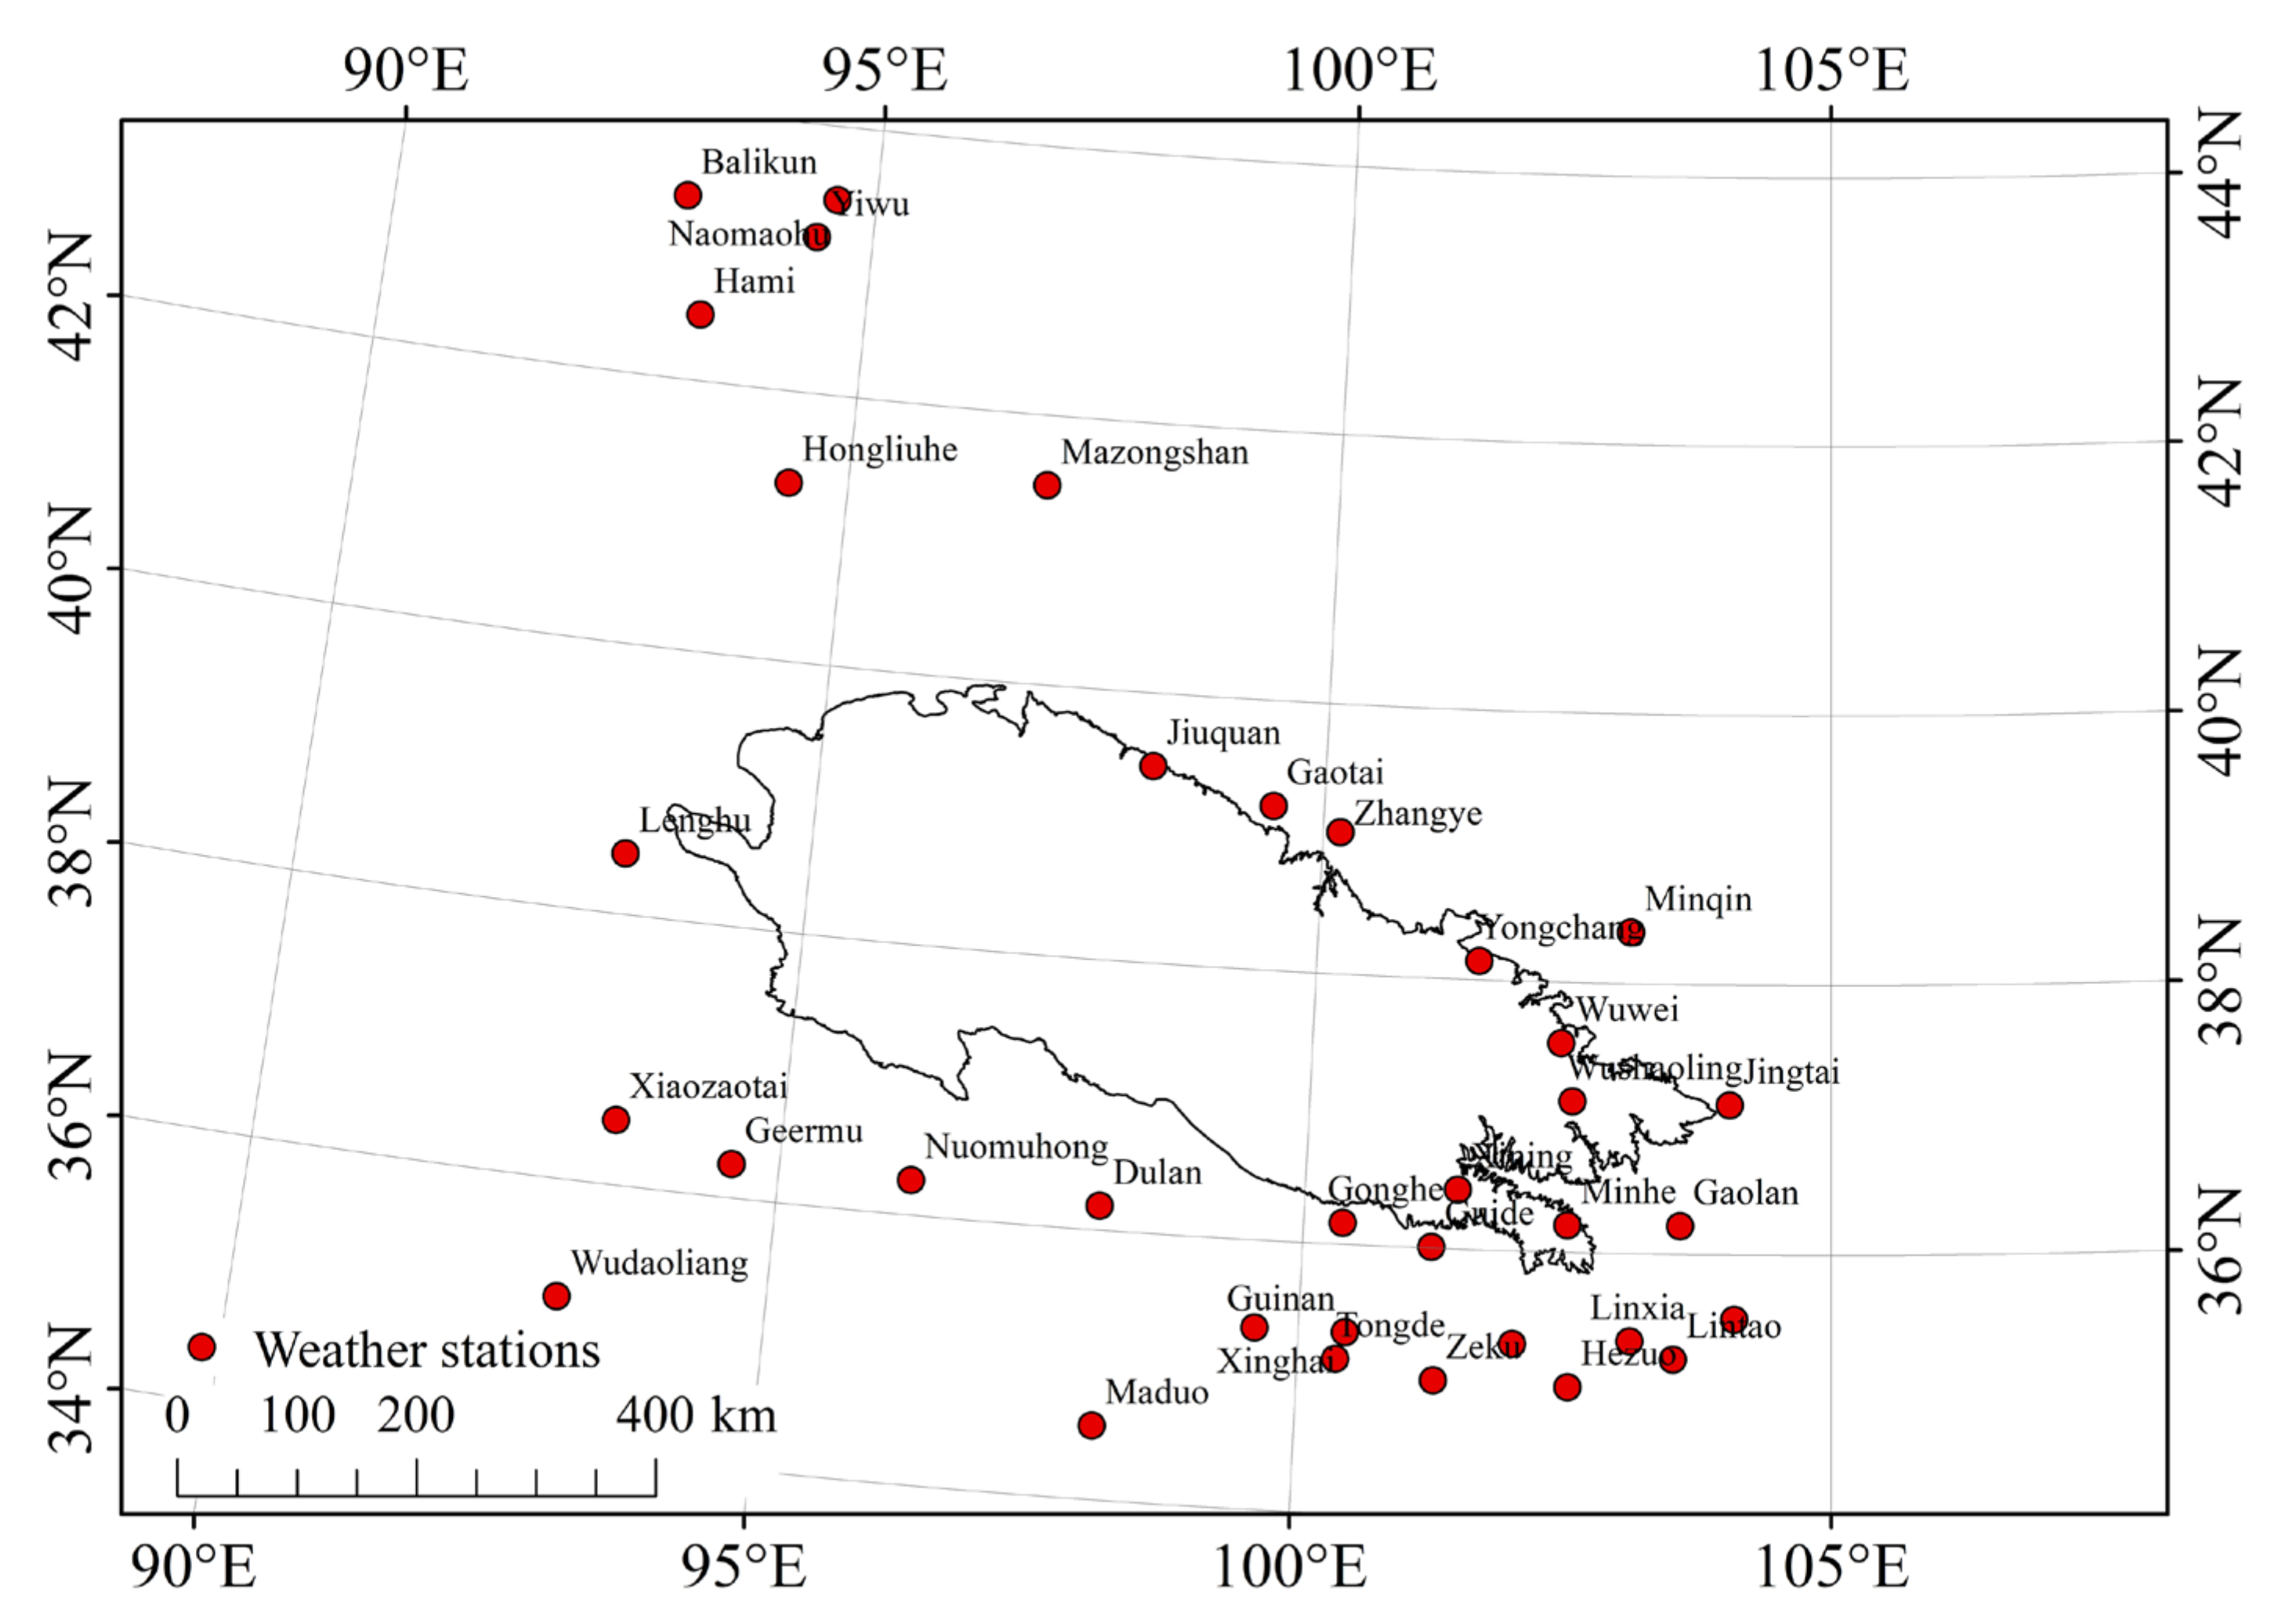
A dataset of daily meteorological observation in China (http://data.cma.cn/, accessed on 1 September 2021) was used to explore the correlation between phenology and meteorology. The dataset is derived from nationwide digitalized CLIMAT files from various provincial meteorological administrations through statistic compilations. This dataset covers data from basic, reference, and ordinary surface meteorological stations in China from 1951 to the present, and it includes the daily averages of weather elements, such as pressure, temperature, precipitation, and wind. The meteorological data from 1 January 2000, to 31 December 2019, including temperature and precipitation of 35 stations in and near the study area were used (Figure 3). A spatial interpolation [35,36] based on a Gauss distance weight operator was used to interpolate the meteorology data to raster data of 500 m resolution. The feature of this interpolation method is that it is based on the Gauss function and considers the influence of terrain on temperature, due to the air temperature decreasing with an increase in altitude.

2.2.2. NDVI Data

This research used the BVI-based revised MODIS-NDVI data, characterized by the better weakening of cloud and snow interference, produced by the Resource and Environmental Science and Data Center of the Chinese Academy of Sciences [31,32,33,34], with a spatial resolution of 0.005° and a time resolution of 8 days. The time span is 20 years from 2000 to 2019, with 46 images per year, totaling 920 images. The nearest method was applied for image preprocessing, and the original MODIS-NDVI data products of 0.005° were resampled to 500 m.

2.2.3. Landcover Data

China multi-period land use and land cover remote sensing monitoring datasets (CNLUCC) were produced by the visual interpretation of the Thematic Mapper (TM) images of Landsat [37,38]. The data of 2000, 2005, 2008, 2010, 2015, and 2018 were used in this study. The remaining grassland in the past 20 years was extracted.

2.3. Methods

2.3.1. Extraction of Phenology

At high altitudes, the NDVI curve of each growth season is asymmetric, where the NDVI change is more rapid in the early period of the growth season and slower in the later period. Thus, this study selected the asymmetric Gaussian function for piecewise fitting, taking the maximum value of NDVI as the midline and fitting the two halves before and after each vegetation period.
The asymmetric Gaussian function fitting was proposed by Jonsson in 2002 [39]. The point of this method is to use a combination of piecewise Gaussian functions to simulate each half of the seasonal growth changes in vegetation. Finally, we connected the Gaussian fitting curves through a smoothing algorithm to realize the reconstruction of the time series.
The formula is:
f t = f t ;   c 1 ,   c 2 ,   a 1 ,   ,   a 5 = c 1 + c 2 g t ;   a 1 ,   ,   a 5
In the formula, c 1 ,   c 2 determine the reference plane and amplitude; a 1 ,   ,   a 5 are nonlinear parameters, which determine the shape of the function g t ;   a 1 ,   ,   a 5 .
Among them:
g t ;   a 1 ,   ,   a 5 = exp t a 1 a 2 a 3 ,   t > a 1 exp a 1 t a 4 a 5 ,   t < a 1
In the formula, a 1 determines the position of the maximum or minimum with respect to the independent time variable t ; a 2 and a 3 determine the width and flatness (kurtosis) of the right function half, respectively; a 4 and a 5 determine the width and flatness (kurtosis) of the left function half, respectively.
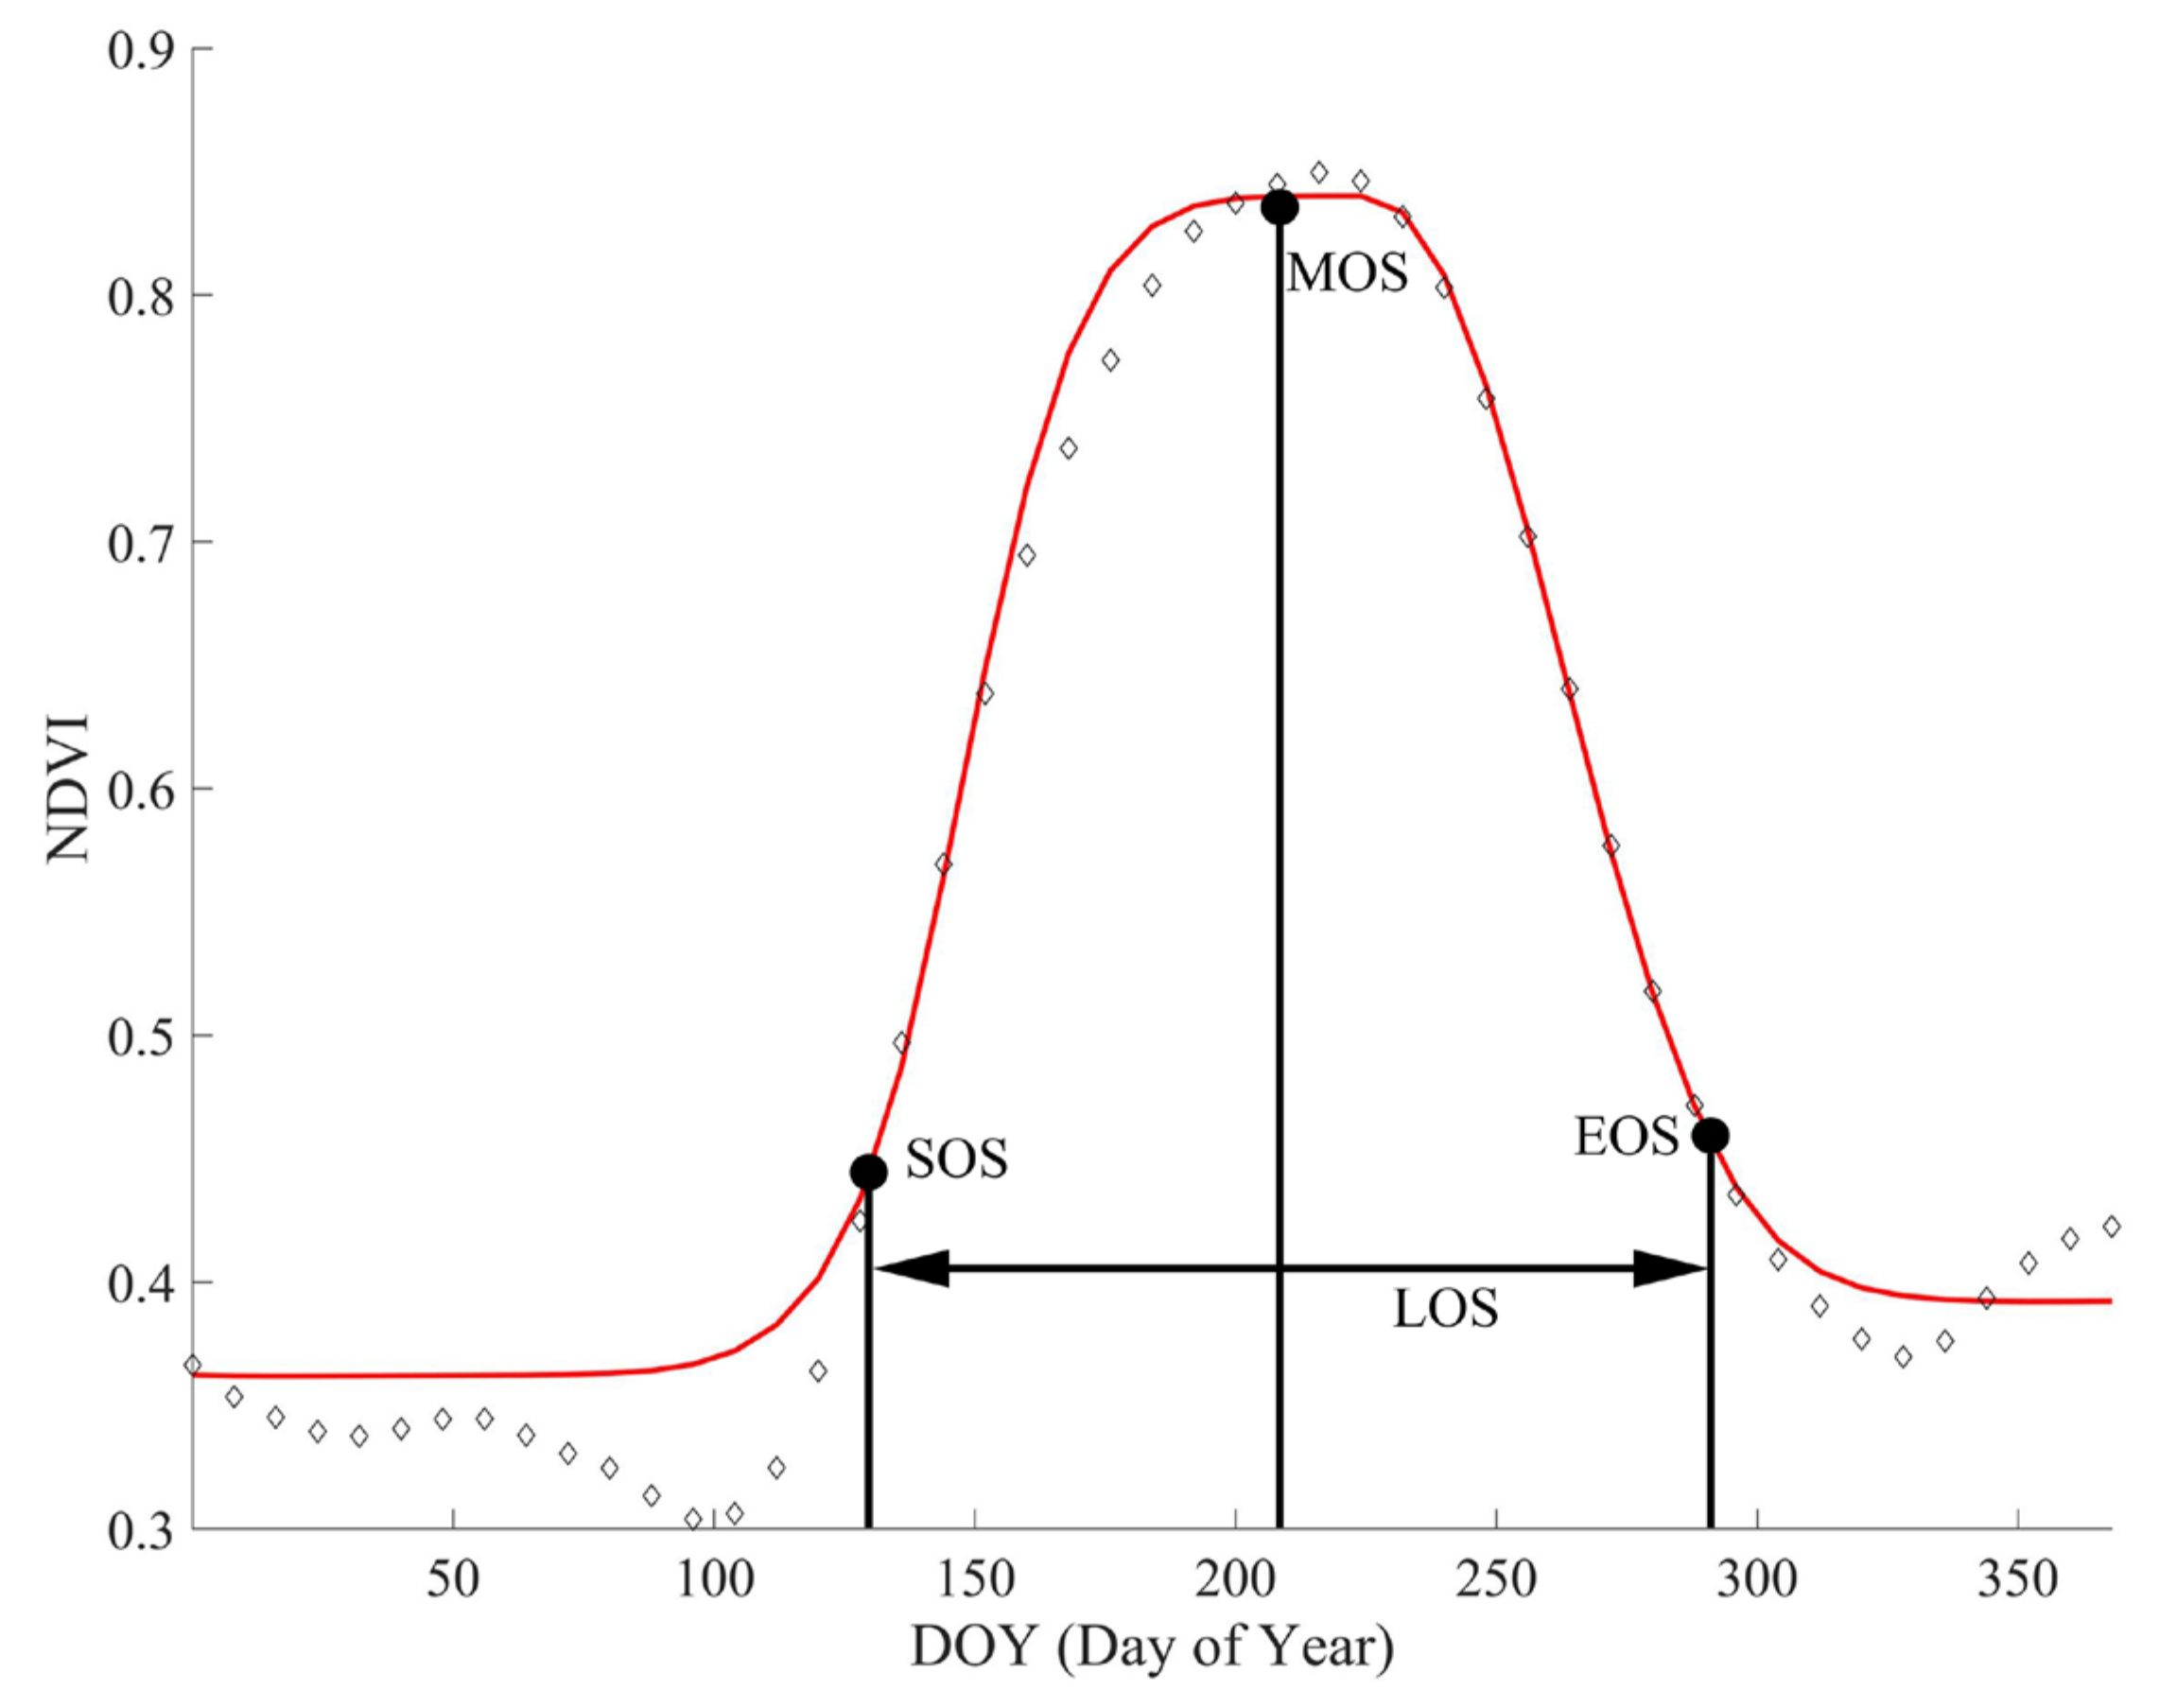
Based on the data after fitting and smoothing, TIMESAT software was used to extract the three vegetation growth season parameters: SOS, EOS, and LOS. The three vegetation growth season parameters were defined as follows:
(a)
The start of the season (SOS): time it took for the left edge to increase to 10% measured from the left minimum level.
(b)
The end of the season (EOS): time it took for the right edge to decrease to 10% measured from the right minimum level.
(c)
The length of the season (LOS): time from the start to the end of the season.
The dynamic threshold method was used to extract vegetation phenological parameters. According to the characteristics of shorter vegetation growing seasons and rapid growth starting and ending periods in high altitudes, the threshold setting followed the following principles: first, the criteria should be as close to winter NDVI background values as possible; second, they should not be too small and cause noise, overwhelming the NDVI signal. Based on the results of previous studies, the dynamic thresholds for the start and end of the growing season were set to 10% of the difference between the maximum and minimum values of the curve [40].
The NDVI time series data were fitted with a curve (Figure 4) to simulate the seasonal vegetation growth of NDVI, and three vegetation growth season parameters were extracted [39,40].

2.3.2. Trend Analysis

Linear regression analysis was used to extract the temporal linear trend of the yearly and monthly meteorology and phenology elements for 20 years. The formula is as follows.
k = i = 1 n x i x ¯ y i y ¯ i = 1 n x i x ¯ 2 = i = 1 n x i y i n x ¯ y ¯ i = 1 n x i 2 n x ¯ 2 b = y ¯ k x ¯
y ¯ = k x + b
D = k × 20
In these equations, k represents the slope, b represents the intercept, n represents the time span, i represents the i year(s) after 2000, x represents the year, and y represents the meteorology/phenology elements. x ¯ represents the average value of the year, y ¯ represents the average meteorology/phenology elements, and D represents the difference in meteorology/phenology elements change between 2000 and 2019.

2.3.3. GeoDetector

GeoDetector, developed by Wang et al. [25,26,27] based on Spatial Stratified Heterogeneity (SSH), is a tool to measure Spatial Heterogeneity (SH) and to explore the determinants of SH. The key point of GeoDetector is that: if X can explain Y, the distribution of X is consistent with that of Y. The value of q is used to measure how much X explains Y.
q = 1 h = 1 L i = 1 N h Y h i Y ¯ h 2 i = 1 N Y i Y ¯ 2 = 1 h = 1 L N h σ h 2 N σ 2 = 1 S S W S S T
where the total sum of squares:
S S T = i N Y i Y ¯ 2 = N σ 2
and the within sum of squares:
S S W = h = 1 L i N h Y h i Y ¯ h 2 = h = 1 L N h σ h 2
In these equations, h = 1 ,   2 , ,   L is the strata of X or Y; N h represents the unit number of strata h ; N represents the unit number of all strata; Y i and Y h i denote the value of unit i in the population and in stratum h , respectively; σ h 2 represents the within strata variance; and σ 2 represents the total variance.
If Y is stratified by a variable X, then q = 0 indicates that there is no coupling between Y and X; q = 1 indicates that Y is completely determined by X. The q-statistic measures the association between X and Y, both linearly and nonlinearly [25,26,27].
By superimposing variable X1 and variable X2, a new variable X1 X2 can be obtained (Figure 5). Then, q Y | X 1 X 2 can be calculated according to the above formula. The q Y | X 1 X 2 indicates the explanatory degree of the interaction of variables X1 and X2 on Y.

3. Results

3.1. Climate Change Trend

3.1.1. Temperature

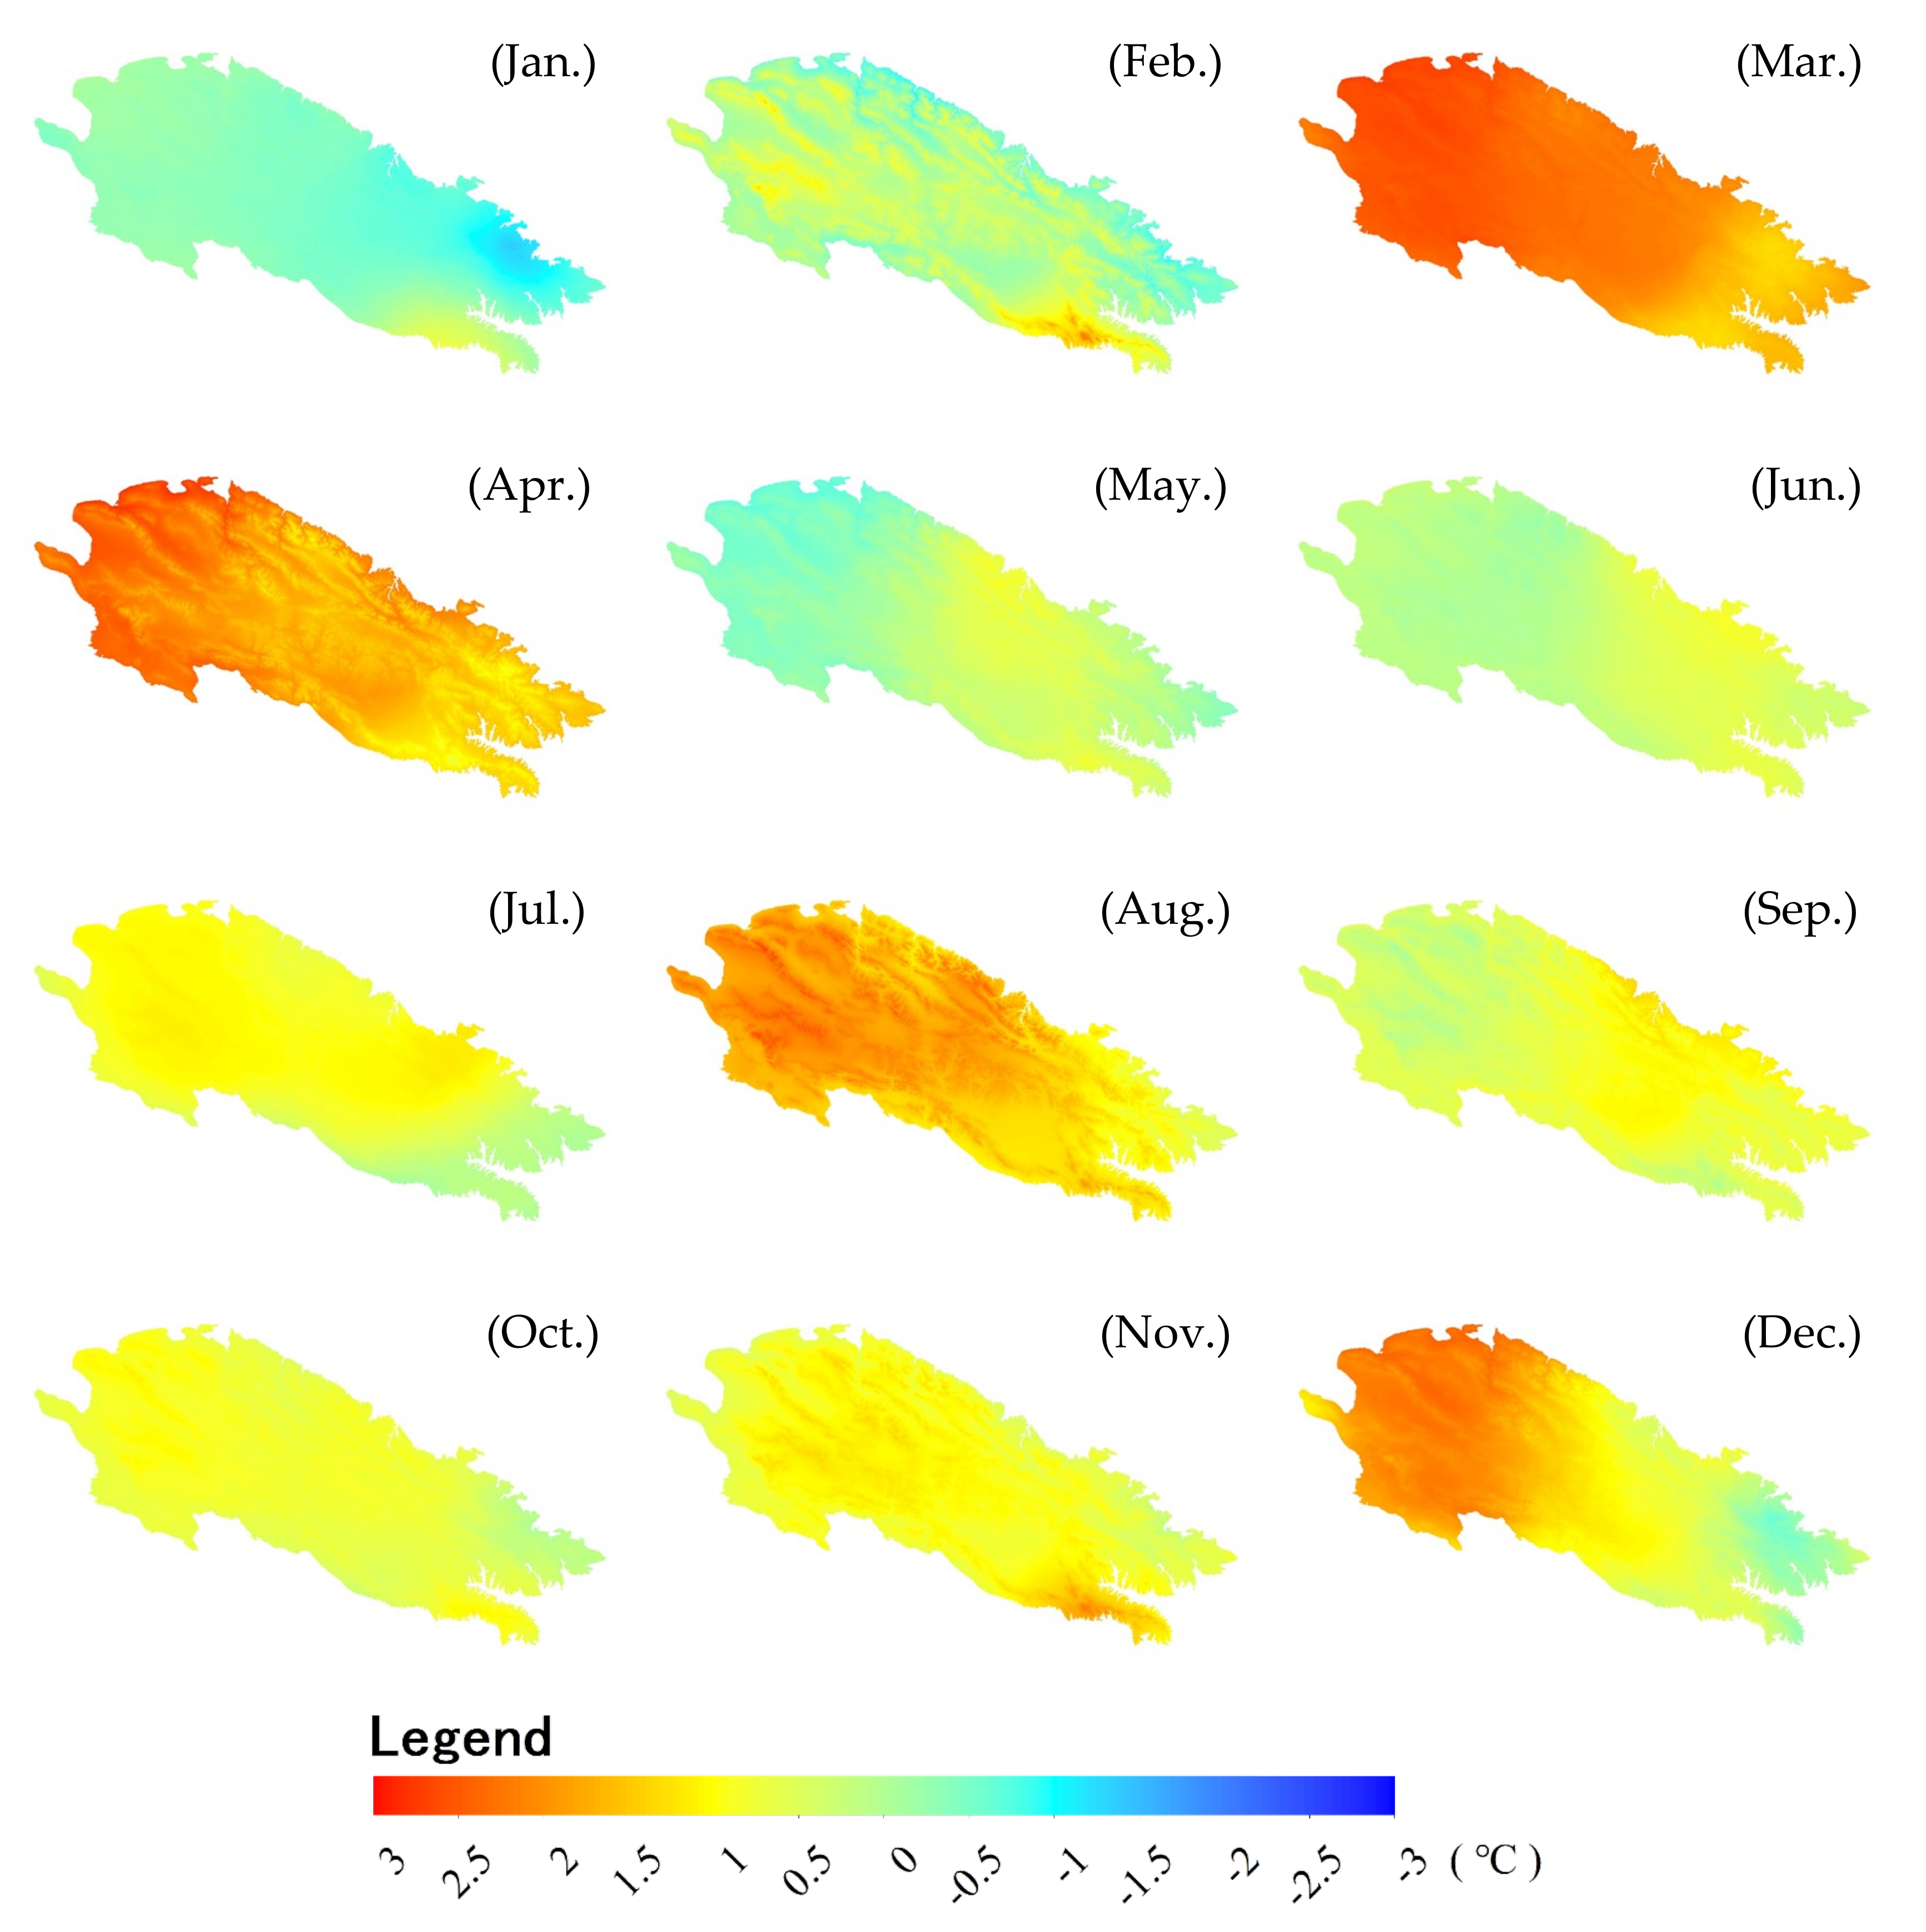
In Figure 6, the monthly average temperatures showed increasing trends from 2000 to 2019 in most areas in most months, except for January.
Specifically, the monthly average temperature showed an increase of more than 2 °C in most areas in March, April, and August, and in the central and western regions in December. More than 3 °C increments occurred in central and western areas in March, northwestern areas in April, central mountain areas in August, and northwestern areas in December. However, there was also a distinguished decrease in most areas in January, northeast and north in February, west and northeast in May, and northeast in December. However, the temperature decrease was less than 1 °C, except in January, where the temperature in the northeastern area decreased by more than 2 °C.

3.1.2. Precipitation

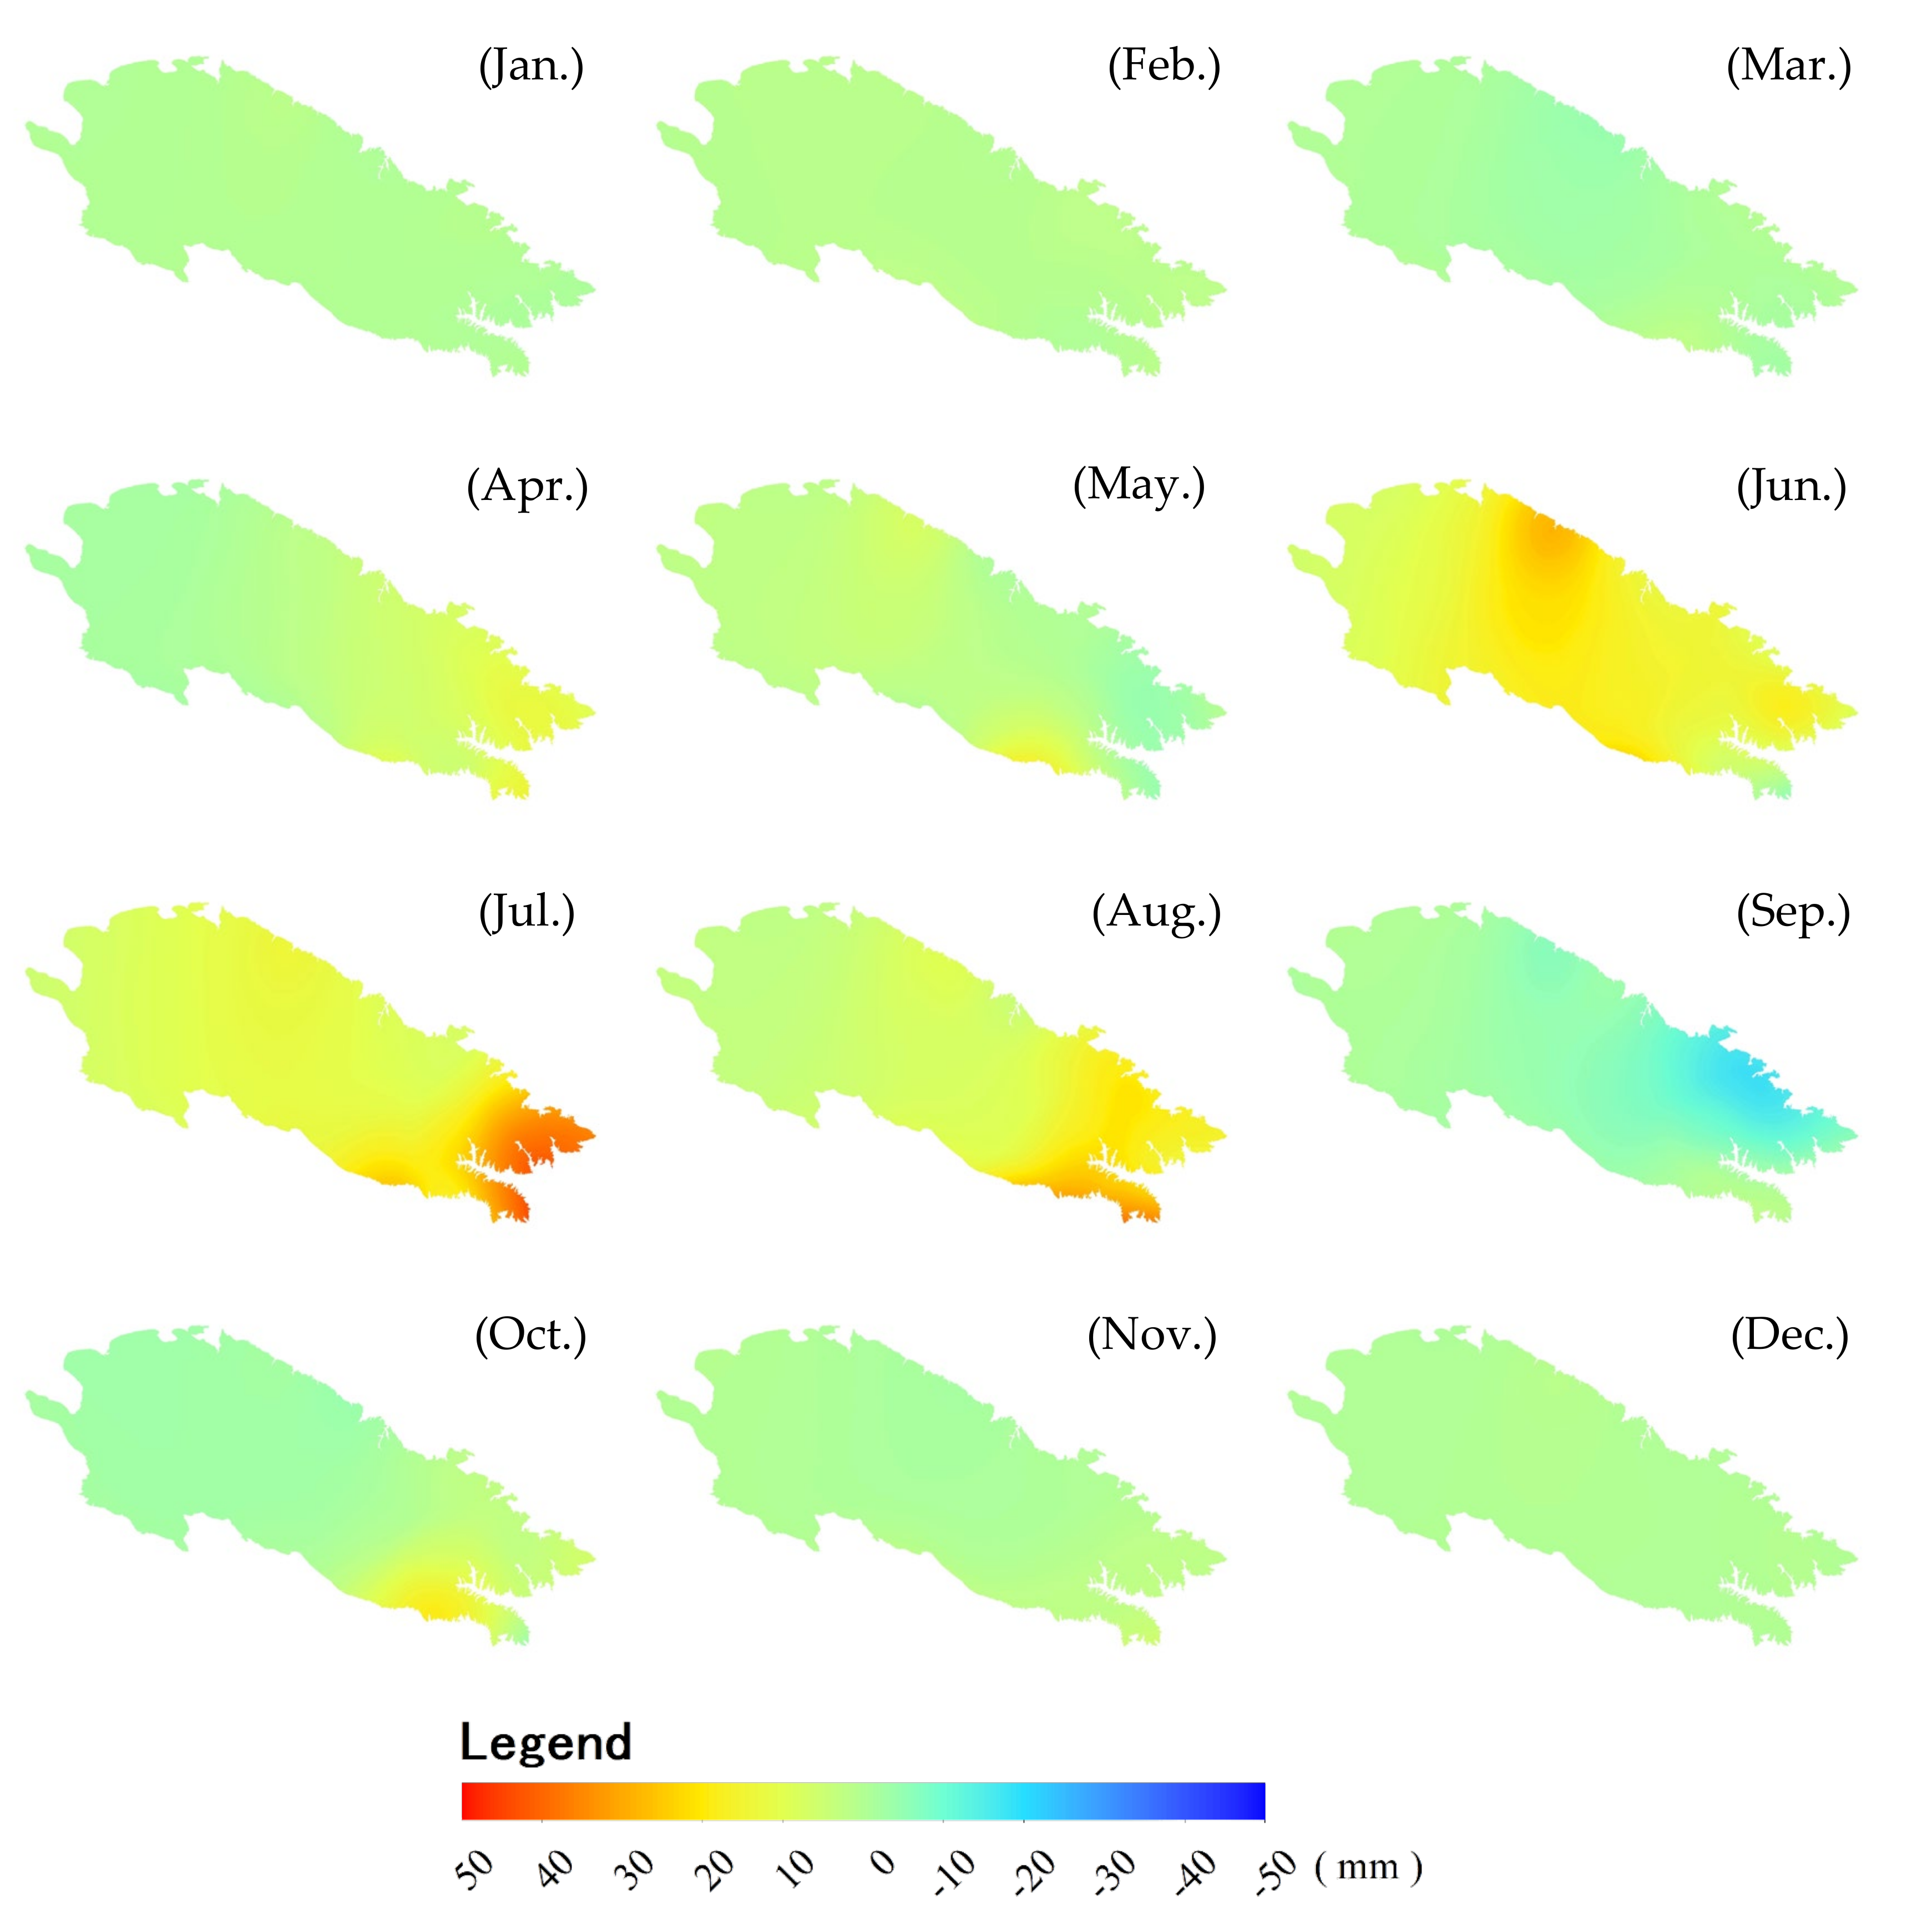
Figure 7 shows that the changes in monthly precipitation in the study area differed significantly. Except in the northeastern part of the study area in September, where there was a precipitation decrease of 10–20 mm, the rest of the region showed a precipitation increase in all months. More than a 20 mm precipitation increase occurred in the northeast in April, northwest and southwest in May, north in June, east in July and August, and southwest in October. The most significant precipitation increases of more than 40 mm occurred in the north in June and east in July and August.

3.2. Trends of the Phenological Parameters

3.2.1. SOS

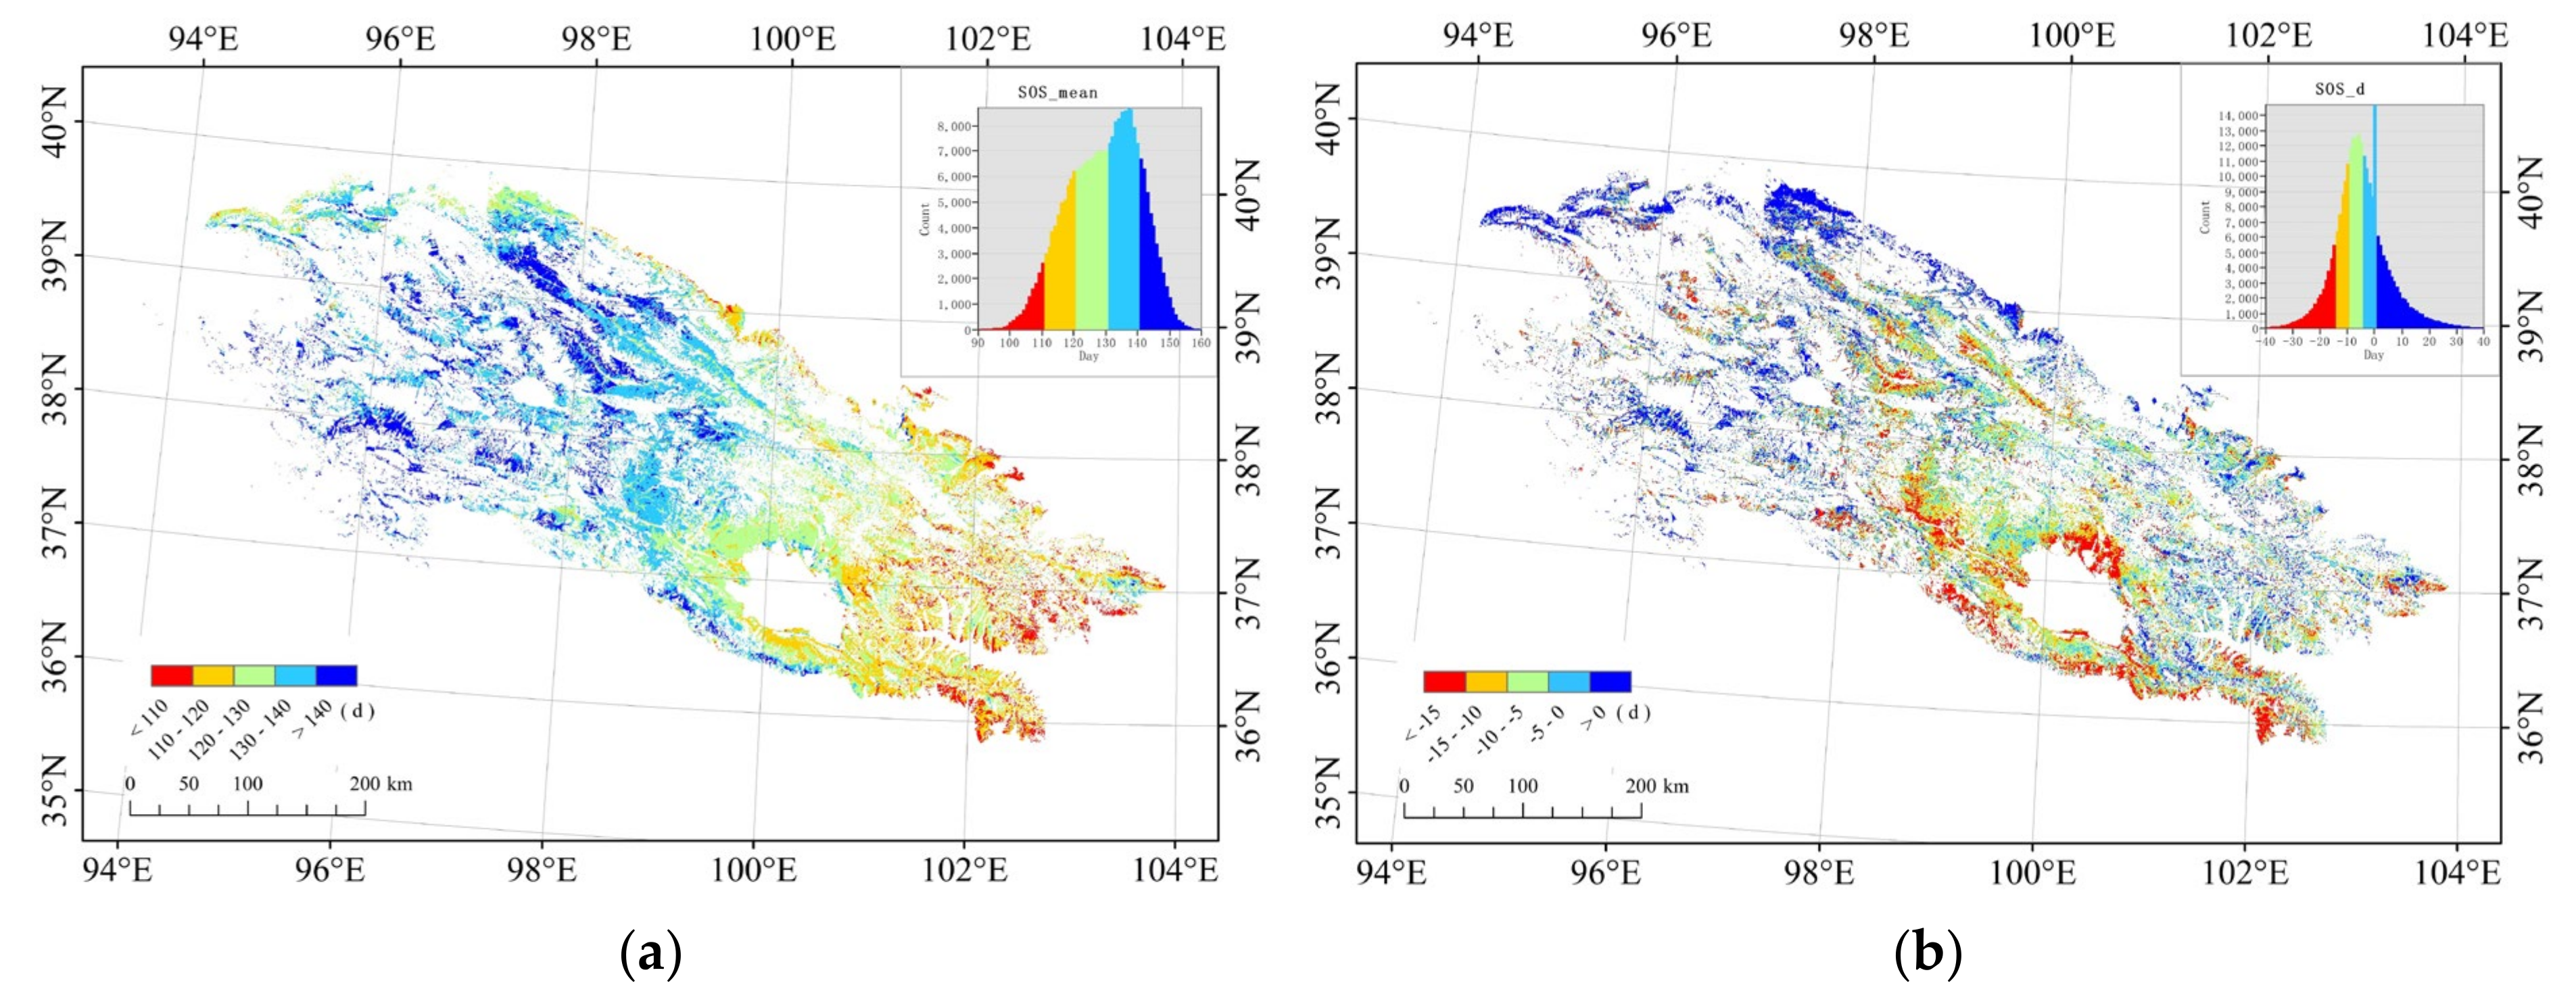
SOS in the study area varied from day 110 to 140 (Julian days), which spans early April to early May (Figure 8a); SOS occurred gradually from the southeast to northwest and from low-altitude areas to high-altitude areas. In the southeast and lowlands, SOS occurred around day 120 (Julian days), from mid-March to early April. In high-altitude mountain areas in the central and western regions of the study area, SOS was around day 150, late in May.
As shown in Figure 8b, the SOS in most areas, except for the northwest, occurred earlier during the 20 years, with an advance of 5–20 days. The southeast region and those around Qinghai Lake benefited the most in SOS, with an advance of more than 15 days. The central and eastern part was 5–15 days ahead of schedule 20 years ago. However, SOS in the northwest and a small part of the east showed a postponement trend.

3.2.2. EOS

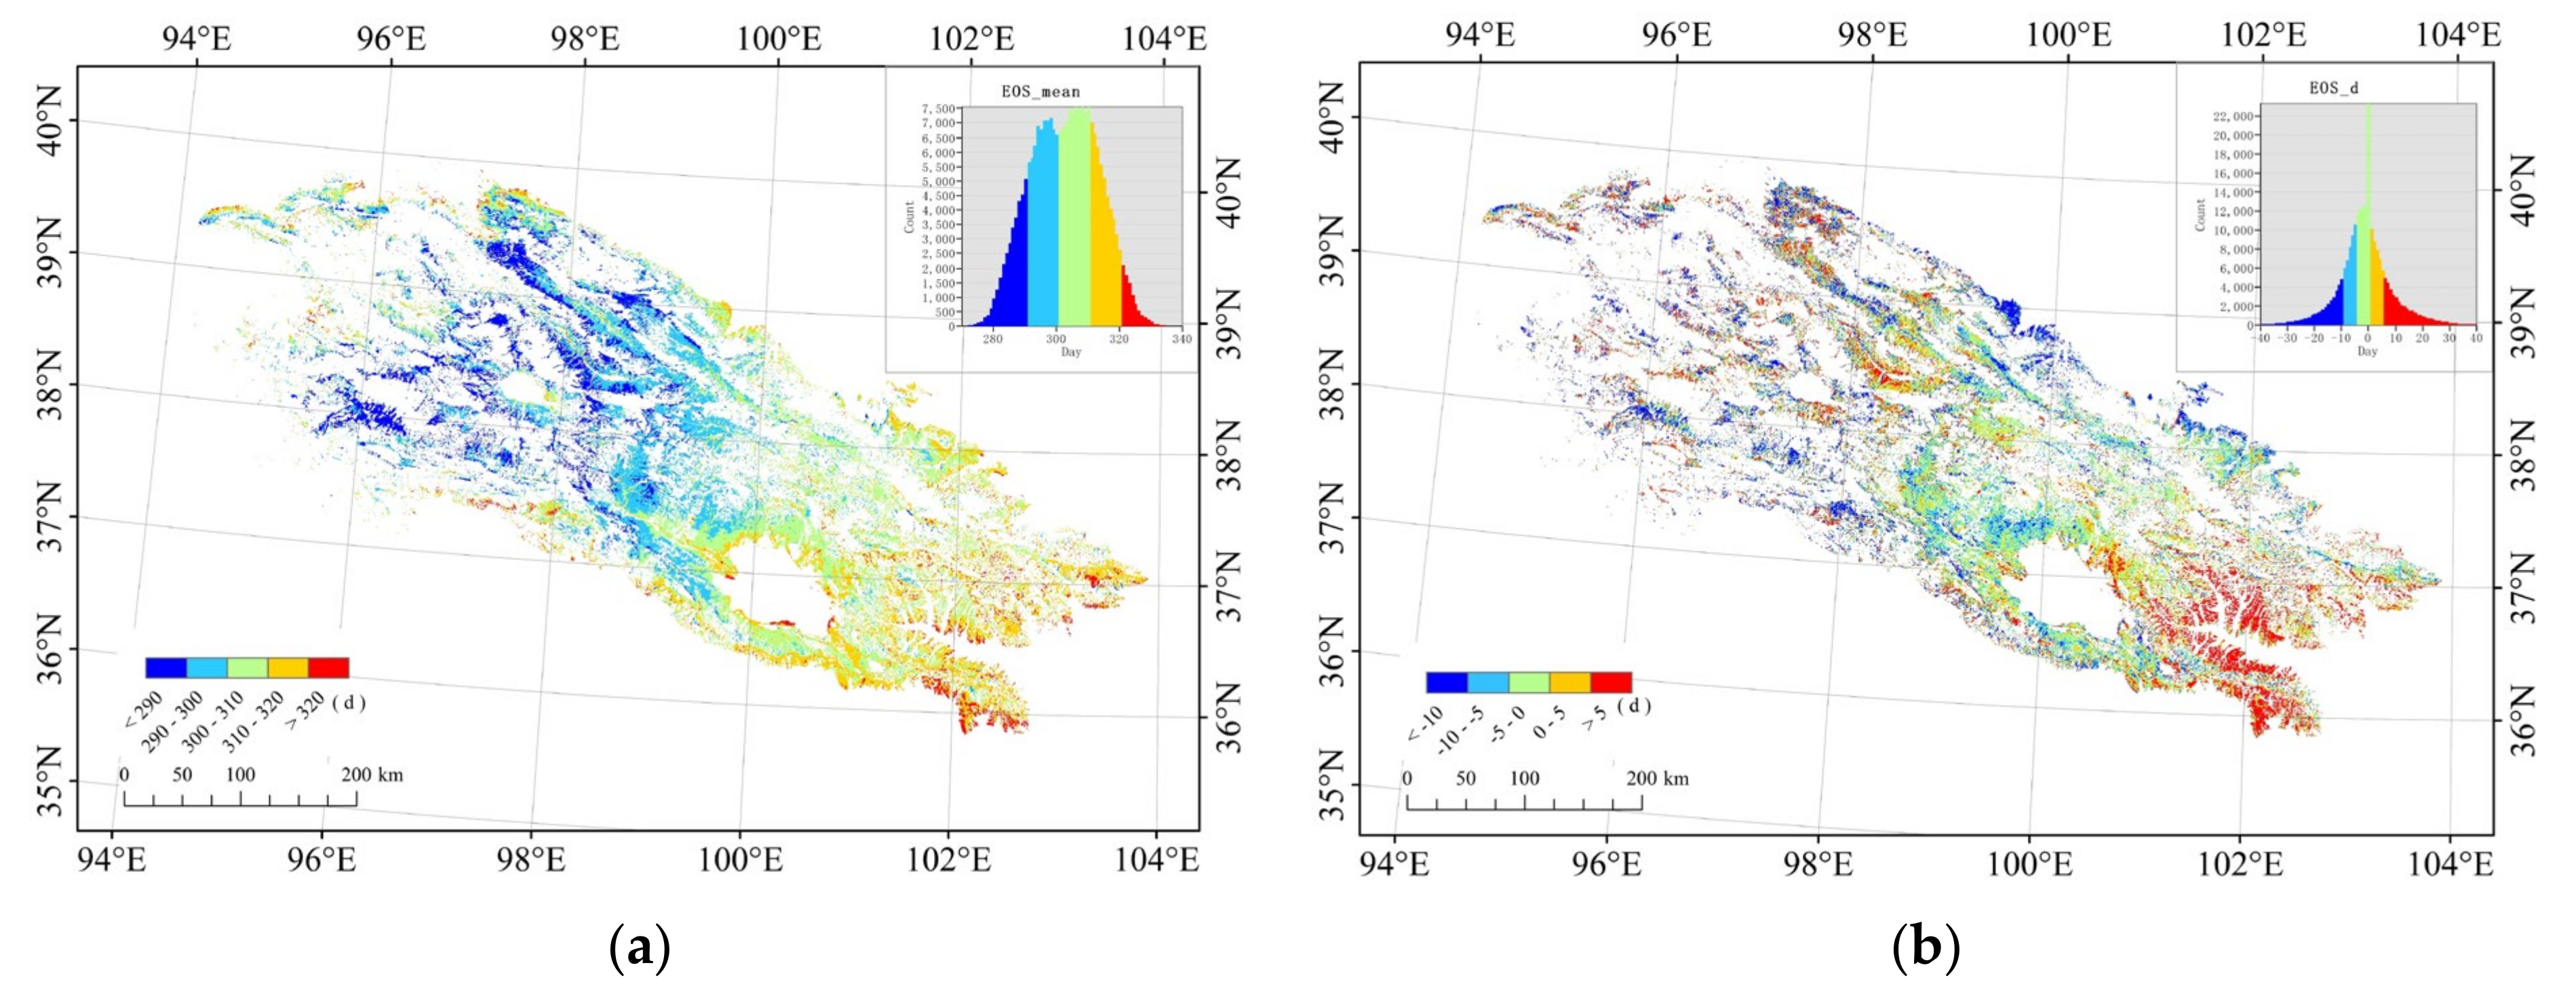
As shown in Figure 9a, EOS in the study area was around day 280 to 320 (Julian days), from middle October to middle November. EOS started in the high-altitude areas in the central and western part, around day 280 to 300 in early October to late October. In the east and the low-altitude areas, EOS was after day 300 in late October. Finally, EOS occurred latest in the southeastern part of the study area after day 320, around the middle of November.
As shown in Figure 9b, the EOS in the north and southwest of the study area showed advanced trends of more than 10 days, and postponement trends in the southeast and central parts of the study area of 5–20 days.

3.2.3. LOS

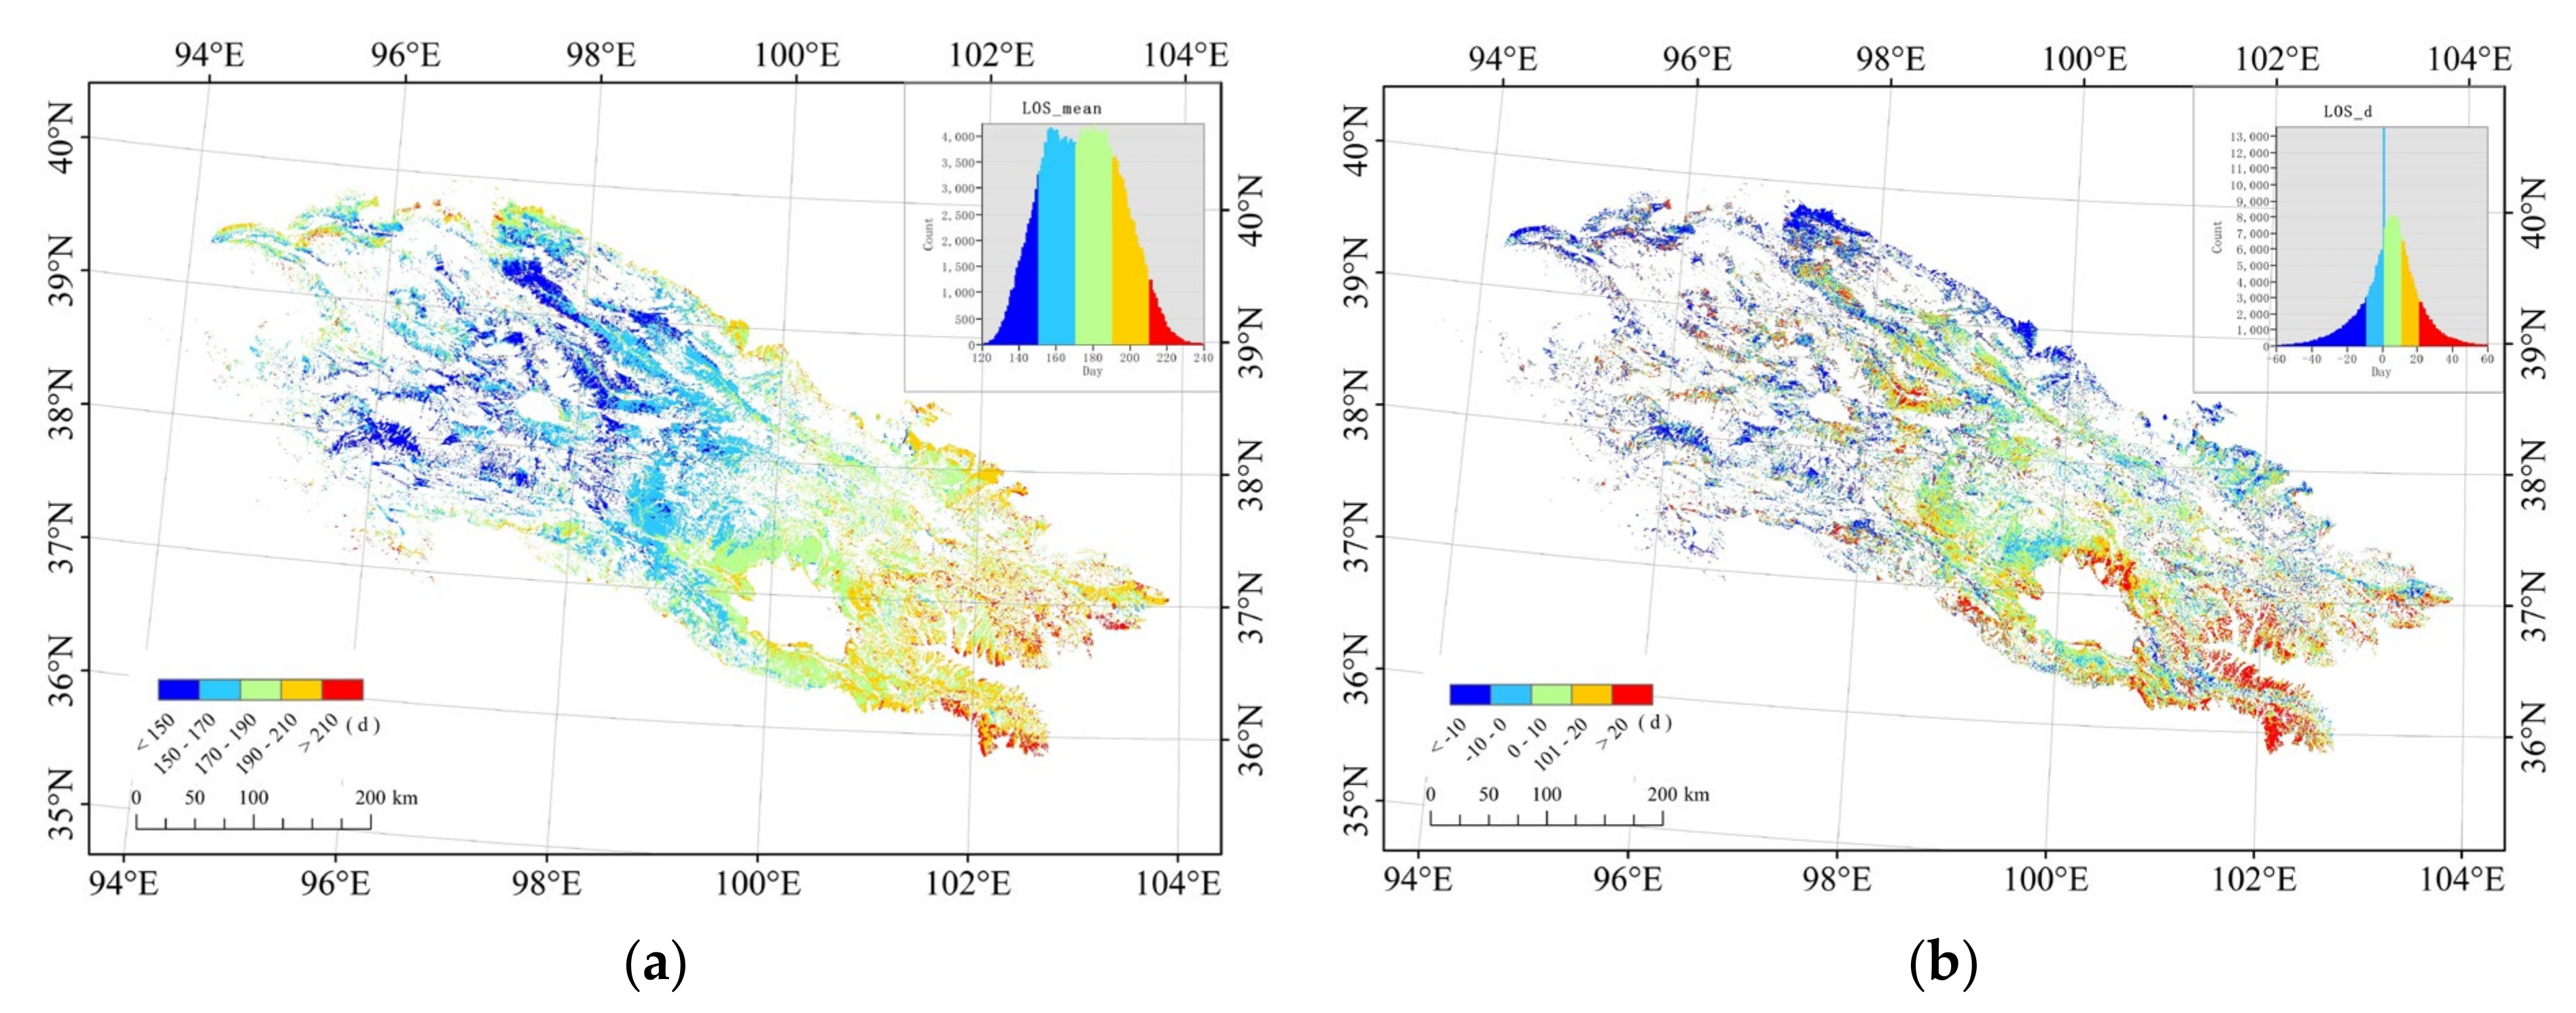
As shown in Figure 10a, LOS in the study area varied between 140 and 220 days. LOS was more than 200 days in the southeast and northwest and less than 150 days in high-altitude areas in the central and western parts of the study area, with the other areas between the two ends.
As shown in Figure 10b, LOS elongated the most in the southeastern and central parts of the study area and the northern shore of Qinghai Lake by about 20–40 days. In most of the northwestern areas, LOS was shortened by 10–30 days.

3.3. Interpretation of Changes in Phenological Parameters by Meteorological Elements

Table 1 shows the Q statistics when interpreting the spatial variations in the temporally changing trends of phenological parameters by the spatially corresponding monthly temperature and precipitation. A higher Q statistic value represents a stronger interpretation of the elements, i.e., monthly temperature and precipitation, for the spatial variations in SOS, EOS, and LOS temporal trends.
It can be seen from Table 1 that the changes in temperature in March, April, May, and December and the changes in precipitation in August can interpret changes in SOS to a relatively high degree (q > 0.200). The changes in temperature in April and July and the changes in precipitation in July, October, and November had a relatively high degree of interpretation effects for the changes in EOS (0.150 < q < 0.200). The temperature changes in March and April and the precipitation changes in April, July, August, and October (q > 0.200) were more efficient in interpreting trends of LOS than other elements.
The interpretation of phenological parameter changes by the interaction of monthly temperature precipitation changes are shown in Table A1, Table A2 and Table A3. It can be seen from Table A1, Table A2 and Table A3 that the interactions of the meteorological elements were more powerful than each of the two elements alone (q(X1 X2) > Max(q(X1), q(X2)), where Ta5 pre3, Ta12 pre1, Ta5 pre6, Ta12 pre3, Ta5 Ta7, Ta5 pre1, Ta6 pre12, Ta11 Ta12, Ta5 pre12, and Ta4 pre1 had high interpretation degrees (q ≥ 0.6 > Max(q(Ta5) = 0.245) for the change in SOS. Ta5 pre1 (q = 0.600) had high interpretation degrees for the change in EOS. Ta6 pre3 (q = 0.609) and Ta5 pre1 (q = 0.603) had high interpretation degrees for the change in LOS.

4. Discussion

4.1. The Response of Grassland Phenology to Climate Changes

Overall, the grassland phenology changes differed greatly both spatially and in terms of phenological features in the Qilian Mountains from 2000 to 2019. This is consistent with the conclusion of Ren et al. who found strong spatial heterogeneity in grassland phenology in the mid-latitude regions of the northern hemisphere [13]. In most areas, SOS showed advanced trends, but fewer areas showed advanced trends of EOS, and a certain number of areas showed delayed EOS trends. As a result, in most areas, LOS was extended. Additionally, there were also some areas where LOS was shortened. Qiao et al. [21] also found that EOS showed a delayed trend in the Qilian mountains region. However, in this study, with revised NDVI, we found that EOS was only delayed in some areas, and in other areas, there were advances in EOS. The NDVI data used in this research were revised by removing the effects of clouds and snow, and the extracted vegetation phenology in the northwest of the mountainous areas was not presented in Qiao’s study, in which GIMMS NDVI was used. In this study, EOS in this area advanced significantly. Due to the influence of terrain (high in the northwest and low in the southeast), the changes in temperature and precipitation in the study area show spatial heterogeneity from northwest to southeast. Chen et al. also found that EOS showed different trends under the influence of different temperature changes [41]. Thus, the phenology changes in the northwestern and southeastern regions are in opposite directions. It is clearly due to the existence of these spatial heterogeneities that it provides a data basis for the better use of GeoDetector to detect the coupling relationship between climate and phenology.
This study is the first to quantify the degree of interpretation of phenological changes by the changes in different meteorological elements in different periods and their interactions. In this study, the differences in the interpretation of each month’s temperature and precipitation change on phenological parameters were revealed. Among them, the change in spring (March, April, and May) temperature played a vital role in the change in SOS. At the same time, it is notable that the change in December’s temperature also showed a higher degree of interpretation for the change in SOS. The changes in EOS were less interpretable than SOS, but the changes in precipitation in summer and autumn (July to November) had a higher degree of interpretation for EOS than the meteorological elements in other months (Table 1). LOS is the combined results of SOS and EOS. Except for the change in October’s temperature and May’s precipitation, all the monthly temperature and precipitation changes throughout the growing season had a significant degree of interpretation for the change in LOS (p < 0.001).
Regarding the interpretation of phenological changes by the interaction of monthly temperature and precipitation changes, the interpretation degrees significantly improved. With a single element of SOS change, the highest degree of interpretation was for the temperature in May (q = 0.245), while the interaction of May’s temperature and March’s precipitation improved the q value by up to 0.646. For EOS, the highest degree of interpretation was for the precipitation in November (q = 0.190), while the interaction of May’s temperature and January’s precipitation had a q value of 0.600. For LOS, the highest degree of interpretation was for the temperature in April (q = 0.236), and the interaction of June’s temperature and March’s precipitation had a q value of 0.641. Through the GeoDetector, the interpretation degree of phenological changes caused by the changes in different meteorological elements can be quantitatively described. Overall, the interaction of different meteorological elements in different periods can significantly improve the interpretation of phenological changes.
Through interaction of the changes in temperature and precipitation in different months from 2000 to 2019, some interesting phenomena were found. Significantly, the interaction between the changes in temperature in May and precipitation in January had a high degree of explanation for both SOS and EOS. This finding is in line with Fu et al. [42]. Fu highlighted that the heat requirement, which is expressed in growing degree-days (GDDs), was a widely used method to assess and predict the effect of temperature on plant growth. Additionally, he found a positive correlation between the GDD requirement and previous winter season precipitation. In Qilian Mountains, the heat requirement (GDD requirement) was mainly from the temperature in May. Two hypotheses may explain this phenomenon. On the one hand, the precipitation in winter accumulated sufficient water for the early growth and development of vegetation, and the vegetation physiological function at that period of the growing season may affect the dynamic change in vegetation in the whole growing season. On the other hand, more precipitation in January results in thicker snow cover that needs more GDDs (in May) to melt before the soil can initialize vegetation growth, and more snow melting may cause the soil to be cooler, which needs more GDDs to initialize vegetation growth. Therefore, the interaction between changes in precipitation in January and temperature in May is of great significance to vegetation growth. Moreover, the interaction between the changes in temperature in May and precipitation in March also had a high degree of explanation for vegetation phenology. This is due to the hysteresis effect of precipitation on vegetation, while the effect of temperature is in real time. Previous studies have also revealed the promoting effect of early spring precipitation on vegetation phenology [43]. Additionally, it is well known that spring temperature has a positive effect on SOS. The use of GeoDetector not only confirmed the above research, but also quantified the interpretation degree of the interaction between temperature change in May and precipitation change in March to vegetation phenology, and even confirmed that the interpretation degree of this interaction is greater than the sum of two separate interpretation degrees ( q T a 5 p r e 3 = 0.646 ,   q T a 5 + q p r e 3 = 0.341 ). Of course, the mechanism of interaction in phenology is complex. In any case, the results detected by GeoDetector can provide direction for further study of the impact of climate change on phenology in the future.
Although winter was not the season for vegetation growth, the changes in meteorological elements in winter had unneglectable impacts on the changes in phenological parameters (Table A1, Table A2 and Table A3). The winter condition effects, however, are not notable in single-element detection. For example, the interaction of changes in spring temperature (from March to May) and winter (December to February of the following year) precipitation had a high degree of interpretation for the changes in SOS, but not winter precipitation alone. This finding is in line with Ji et al. [44], who, through observations at the Haibei Alpine Grassland Ecosystem Research Station located in the Qilian Mountains, found that asymmetric winter warming in temperature-sensitive ecosystems may delay spring phenological events and symmetric warming can advance spring phenology. The reason for this may be that the increase in temperature and precipitation in winter is conducive to the accumulating conditions for vegetation growth, which in turn has an impact on vegetation phenology. In China, there is an old saying: auspicious snow bodes well for a good year.
To explore the relationship between the phenological parameters, we also used GeoDetector to detect the influence of SOS and EOS on LOS. The results are shown in Table 2. The influences of SOS and EOS on LOS were direct and more interpretively powerful than the meteorological elements. The degree of interpretation to LOS by the interaction of SOS and EOS reached a very high level. The purpose of this analysis was to explore why the interaction of meteorological elements in some specific months had a higher degree of interpretation for SOS/EOS changes, while the changes in and interactions of meteorological elements throughout the year had higher degrees of interpretation for LOS.

4.2. Limits in the Application of GeoDetector

Spatial data have three characteristics: spatial autocorrelation, spatial heterogeneity, and the modified areal unit problem, which make the spatial analysis different from classical statistics with the assumption of Independent Identical Distribution (I. I. D.). If one spatial element (X) has an effect on another (Y), their spatial distribution patterns should also tend to be consistent. Based on this theory, Wang et al. [26] developed GeoDetector, which explains the X-Y relationship Here to Here; that is, the X in this place affects the Y in this place.
However, in this study, we found that the spatial distribution of the climate element changes was generally areal, but the spatial distribution of the phenological changes was of a more linear pattern. Superimposing the river network with the SOS change trend map (Figure 11), we found that the spatial distribution of SOS was coincident with linear geographic elements such as rivers, e.g., the Buha River and Heihe River, and the northern shore of Qinghai Lake, where the trend of SOS advance was greatly distinguishable. Considering the high altitude and more snow and ice coverage in the study area, we may deduce that this is owing to the climate warming in the upper reaches of the river, which has led to more ice and snow melting and an increase in precipitation in the area. Through river flows, there has been more downstream water, which in turn affects the growth of low-reach grasslands. This leads to a kind of Here to There spatial pattern; that is, the element X occurs upstream, but the influence is downstream via the river as a transmitting pipeline, leading to the occurrence of the downstream element Y.
This spatial displacement of the relationship between geographical elements breaks the premise of GeoDetector and dampens its detection capability. In this study, the location of the stratification elements, i.e., temperature and precipitation, was no longer spatially consistent with the location of the geographic phenomenon, i.e., phenological parameters. In this case, more attention should be paid to the problems of using GeoDetector. If GeoDetector does not detect that X presents an interpretation to Y, or the interpretation degree is low, it is not definite that X bears no interpretation to Y. There is the possibility of these pipeline effects. However, detecting the interpretation of Y by X in this situation warrants further research. Specifically, in this study, the X that affects Y downstream should be investigated upstream along the river, but the exact location of the X is yet to be targeted.

4.3. Comparison with the MODIS Land Cover Dynamics (MCD12Q2) Product

The MODIS Land Cover Dynamics (MCD12Q2) product is a widely used phenology product. Based on NBAR-EVI2, MCD12Q2 fits the vegetation growth curve through the Logistic fitting method with a window width of 5, and defines the threshold as 15% to extract the SOS and EOS [45]. This is relatively suitable for the extraction of global vegetation phenology. However, compared with the global vegetation, the vegetation in Qilian Mountains has unique characteristics: alpine, short growing season, rapid start and end of growth, and a large amount of snow.
The NDVI dataset used in this study is the MODIS-derived dataset, which is based on MODIS-MOD09 data. Additionally, specifically, the detection of cloud, snow, and shadow was carried out again for China. At the same time, the benchmark growth synthesis and optimized interpolation algorithm were used to analyze and optimize each step of the NDVI products in detail (e.g., cloud, snow, and shadow were determined based on the time series inflection point detection method, and the minimum NDVI was synthesized based on the BVI index), so that the products can not only eliminate the interference of noise, but also reflect the real growth process of vegetation perfectly [31,32,33,34]. Furthermore, as an alpine grassland, the growing season is short, and SOS/EOS is rapid. There may not be a large enough window width for Logistic fitting. Moreover, in this research, based on the results of previous studies, the dynamic thresholds for the start and end of the growing season were set to 10% of the difference between the maximum and minimum values of the curve. The MODIS phenology threshold is 15%. We think that the threshold should be as close as possible to the winter background value in regions with short growing seasons.
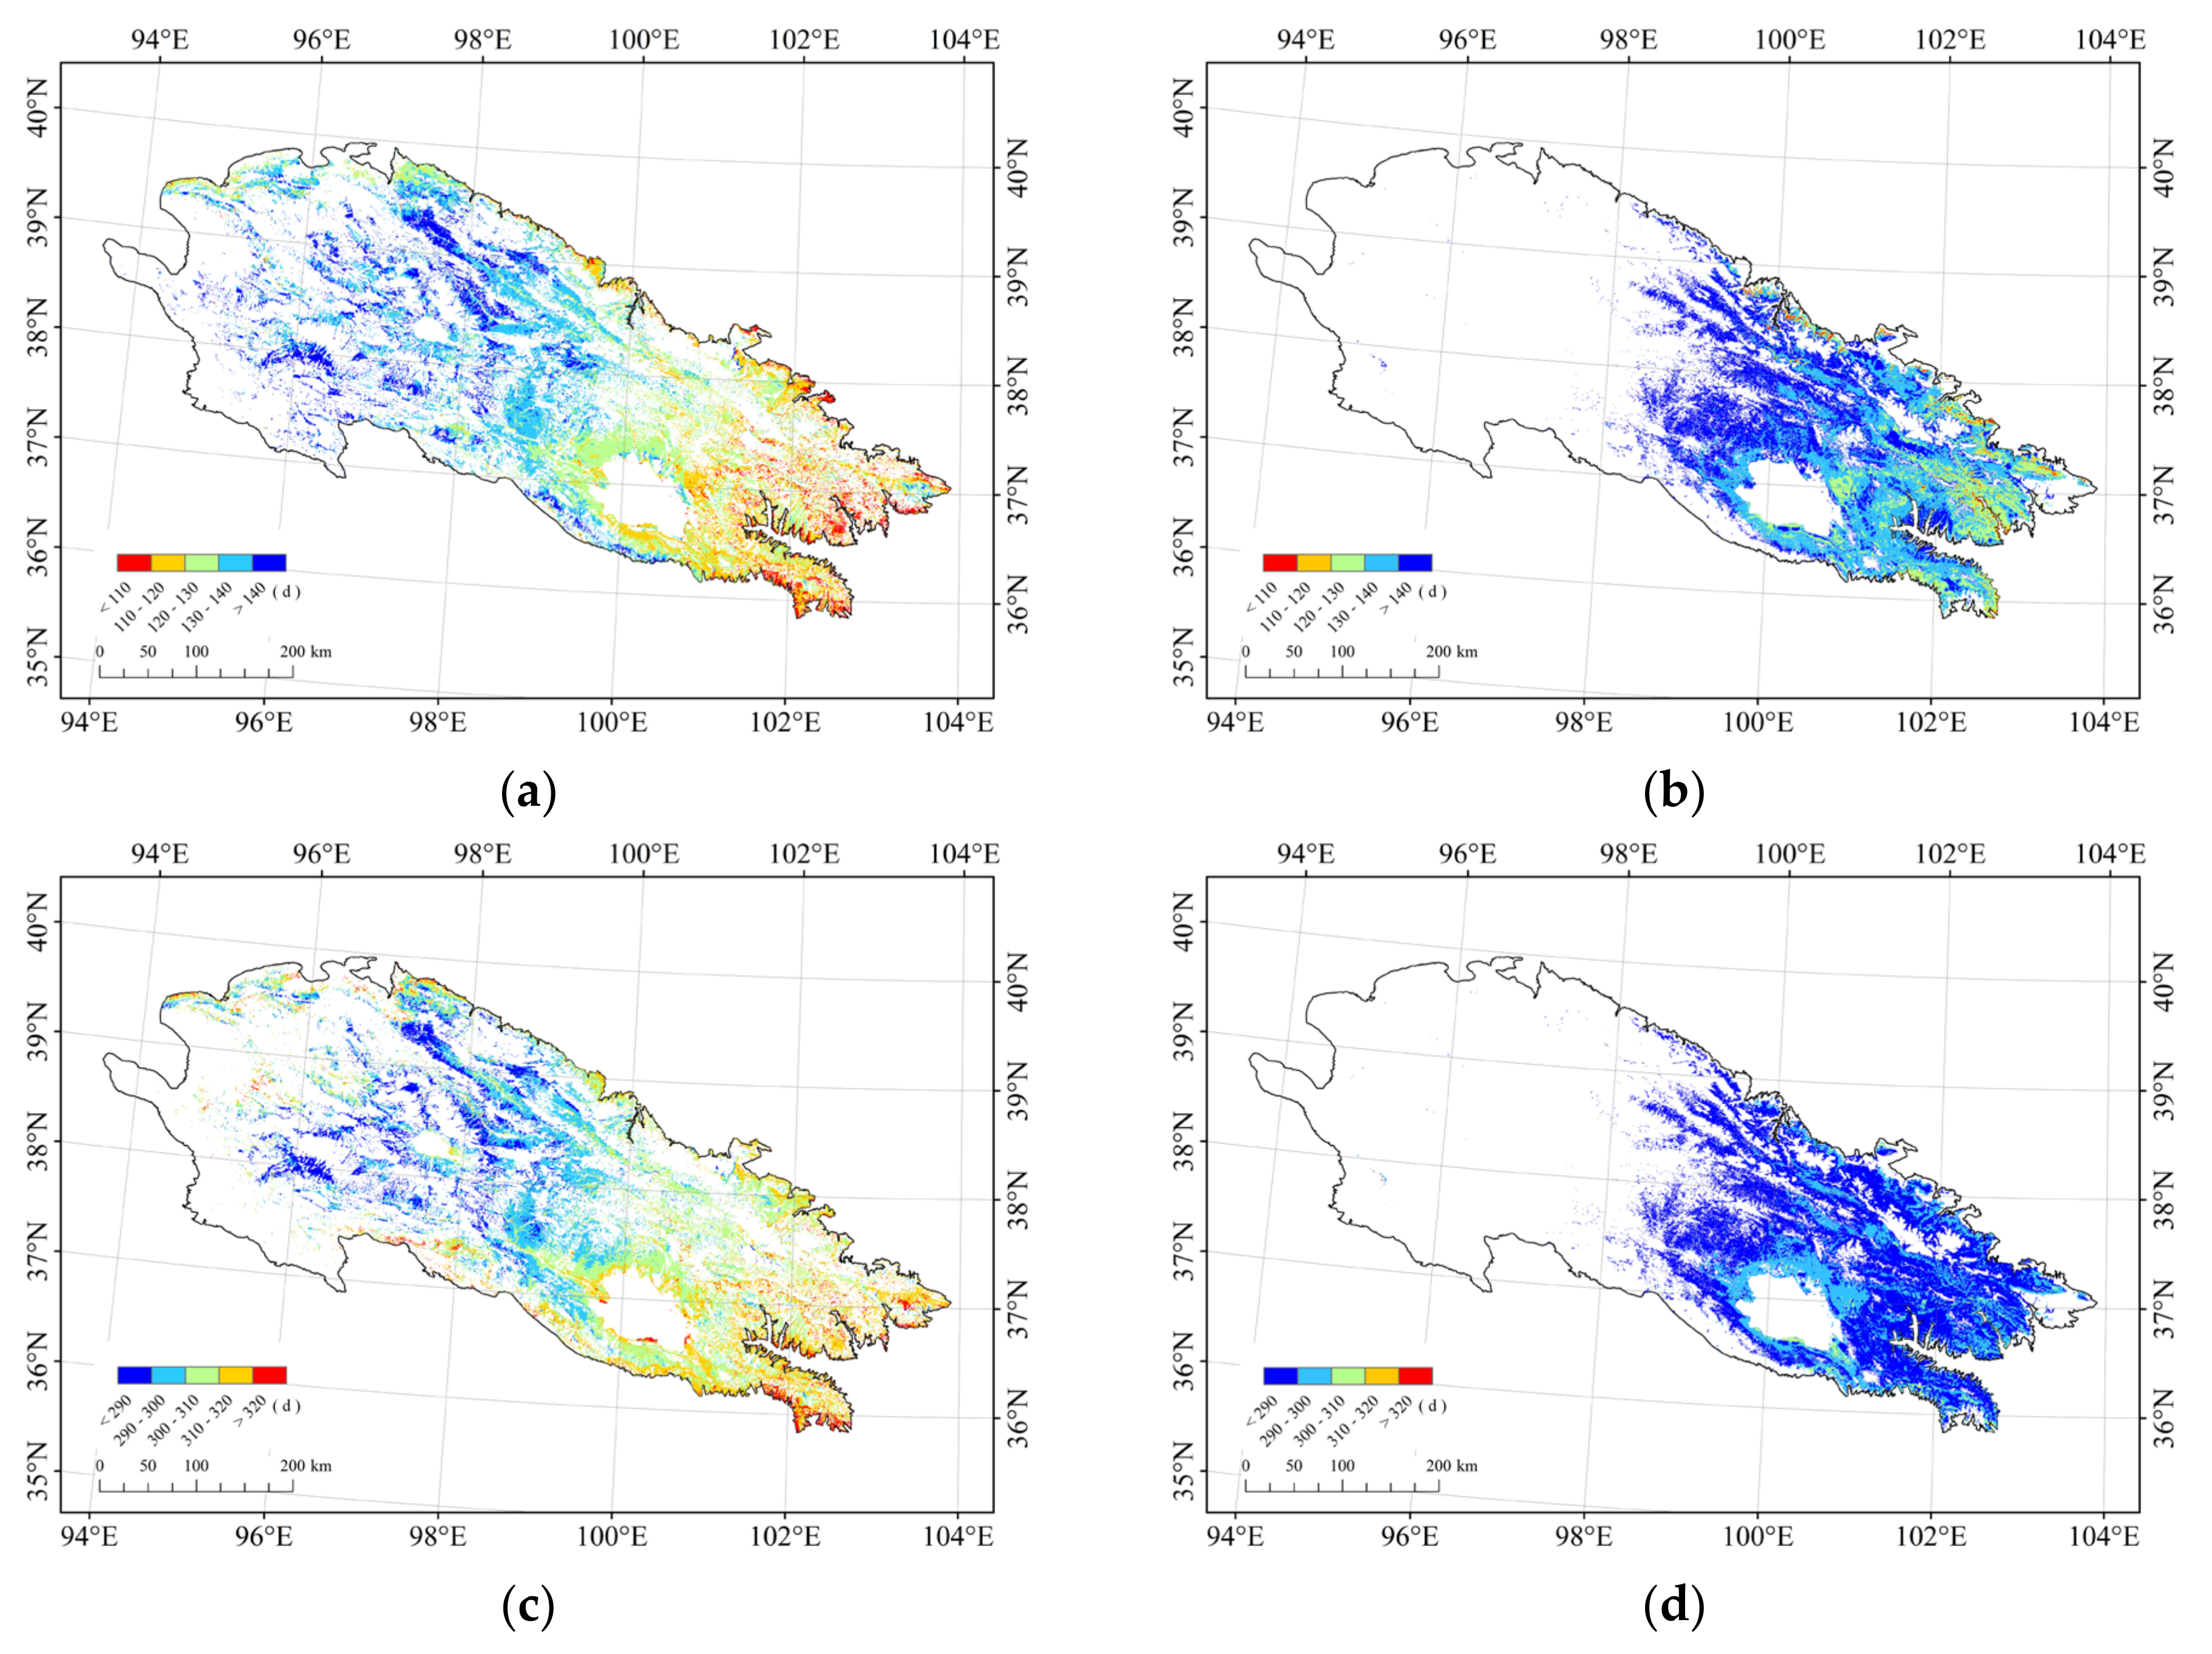
As shown in Figure 12, more phenological information was extracted by using these NDVI data than MCD12Q2. The Pearson Correlation Coefficient of the two SOS and EOS of grassland extracted from different data sources was analyzed. Both SOS and EOS had low correlations ( r S O S _ g r a s s l a n d _ m e a n = 0.23 ; r E O S _ g r a s s l a n d _ m e a n = 0.22 ). The Pearson Correlation Coefficient of the two SOS and EOS of forests extracted from different data sources was further analyzed. Both SOS and EOS had relatively high correlations ( r S O S _ f o r e s t _ m e a n = 0.47 ; r E O S _ f o r e s t _ m e a n = 0.49 ). Forests were distributed in the warm and humid low-altitude areas of the study area. They had a longer growing season and their conditions were similar to global conditions. Therefore, the forest phenology extracted from the MODIS-derived dataset in this study was highly correlated with MCD12Q2. As for grassland, more accurate phenology can be extracted using the data and methods in this study, compared to MCD12Q2.

4.4. Interpolation of Meteorological Data

Having reliable surface meteorological data was the basic requirement of this study. At present, CLIMAT is the meteorological dataset with the largest number of stations and the most complete records in China. As shown in Figure 3, there are many weather stations near the study area, which provided basic and reliable meteorological data for this study. However, it should be noted that the distribution of meteorological stations is not uniform—it is dense in southeast and sparse in the mid-west. Therefore, a suitable interpolation method for meteorological data is necessary. It is well known that as the altitude increases, the temperature decreases. The influence of terrain on the interpolation of air temperature data cannot be ignored. It is in the mid-west where there are few meteorological stations that the altitude difference is larger. A new meteorological data interpolation method developed by Liu and Zhang was used in this study [35]. This method takes into account the effect of terrain on the interpolation of meteorological data. In this way, although there are fewer weather stations in the mid-west, more accurate interpolation results can be obtained. Moreover, we set the cutoff radius to 500 km, which could ensure that at least four points could be included in the calculation, and, at the same time, the radius would not be too large and affect the accuracy.

5. Conclusions

In this study, the MODIS NDVI produced by a revised algorithm was used as the data source to extract the phenological parameters of the grassland in the Qilian Mountains from 2000 to 2019. The temporal trends and spatial variations of three phenological parameters of grassland (SOS, EOS, and LOS) and meteorological elements (temperature and precipitation) in the Qilian Mountains were analyzed. With the derived temporal trends of the meteorological elements and grass phenological parameters, GeoDetector was used to detect the degree of interpretation to changes in phenological parameters by the meteorological elements and their interactions. The conclusive results are as follows:
(1)
From 2000 to 2019, significant changes occurred in temperature, precipitation, and grassland phenology in the Qilian Mountains. The temperature increased by 0.43 °C/10a and the precipitation increased by 12.84 mm/10a. SOS in most areas, except the northwestern mountain region, showed advancement by 5–20 days, with EOS being delayed in the north and southeast by more than 10 days and advanced in the northwest and central part of the study area by 5–20 days. The LOS in the southeast was elongated by 20–40 days, and, in the northwest, shortened by 10–30 days.
(2)
The interaction of the monthly average meteorological elements presented a more powerful interpretation of grassland phenology changes in the Qilian Mountains than any of the elements alone. For SOS, the highest interpretation degree by a single monthly average meteorological element was from the temperature change in May (q = 0.245), and the highest interpretation degree by multi-element interaction was from the interaction of the temperature change in May and the precipitation change in March (q = 0.646). For EOS, the highest interpretation degree for a single monthly average meteorological element was from the precipitation change in November (q = 0.190), and the highest interpretation degree for multi-element interactions was from the interaction of the temperature change in May and the precipitation change in January (q = 0.600). For LOS, the highest interpretation degree for a single monthly average meteorological element was from the temperature change in April (q = 0.236), and the highest interpretation degree for multi-element interactions was from the interaction of the temperature change in June and the precipitation change in March (q = 0.609). The interaction of the changes in meteorological elements in winter and the changes in meteorological elements in other periods had unneglectable impacts on the phenology of grassland in the Qilian Mountains.
(3)
The response of grassland phenology to climate change in the Qilian Mountains was not strictly local, and there were pipeline effects. The climate change in the upper reaches of the river transferred its influence downstream via the runoff of the river, which thereafter affected the growth of the downstream vegetation and the phenologies.

Author Contributions

Conceptualization, C.L. and J.H.; methodology, C.L. and J.H.; software, W.Z. and Y.Z.; formal analysis, C.L.; investigation, C.L.; resources, J.H.; data curation, C.L. and Y.Z.; writing—original draft preparation, C.L.; writing—review and editing, J.H., W.Z., L.G. and D.Z.; visualization, C.L.; supervision, J.H. and D.Z.; project administration, J.H. and D.Z.; funding acquisition, D.Z. All authors have read and agreed to the published version of the manuscript.

Funding

This research was funded by Major Special Project: the China High-Resolution Earth Observation System (Project number 30-Y30F06-9003-20/22), National Natural Science Foundation of China (Grant number 41975118) and Strategic Priority Research Program of the Chinese Academy of Sciences (Grant number XDA19080303).

Institutional Review Board Statement

Not applicable.

Informed Consent Statement

Not applicable.

Data Availability Statement

Publicly available datasets were analyzed in this study. The data supporting the results of this study are available from the corresponding author upon reasonable request.

Acknowledgments

Thanks to Ronggao Liu, Xinliang Xu and Yang Liu in the Institute of Geographical Sciences and Natural Resources Research of the Chinese Academy of Sciences, for providing data support for this research. The anonymous reviewers of the editorial department of the Journal and the editor of the editorial department provided valuable suggestions for the improvement of this article.

Conflicts of Interest

The authors declare no conflict of interest.

Appendix A

Table A1. Interpretation of SOS changes by multi-element interaction.
Ta1Ta2Ta3Ta4Ta5Ta6Ta7Ta8Ta9Ta10Ta11Ta12pre1pre2pre3pre4pre5pre6pre7pre8pre9pre10pre11pre12
Ta10.111
Ta20.4950.095
Ta30.4770.5670.242
Ta40.4690.5400.5350.233
Ta50.5010.5710.5800.5100.245
Ta60.4510.5340.5920.5440.5820.131
Ta70.4580.4670.5240.5310.618 **0.5350.093
Ta80.5260.4440.5500.5440.5760.5280.4270.121
Ta90.4650.5280.5700.5240.5950.5520.5470.4930.159
Ta100.5020.5090.5740.5730.5850.5550.4330.4350.4840.078
Ta110.4510.3460.5590.5280.5270.5080.4650.4580.5130.4920.140
Ta120.5090.5900.5060.5490.5120.5290.5470.5380.5140.5770.605 **0.212
pre10.5200.5130.5900.602 **0.612 **0.5410.5380.5310.5740.4940.4900.629 **0.113
pre20.5110.4110.5620.5290.5340.5110.4820.4280.4410.4620.4830.5260.5450.113
pre30.4920.5070.5460.5600.646 **0.5820.5420.5620.5280.5280.4680.619 **0.5830.4940.096
pre40.4780.5940.4570.5520.5460.4970.5220.5480.5130.5090.5690.4340.5220.5020.4950.197
pre50.4250.4280.5640.5410.5360.3950.4550.4570.5400.4790.4580.4820.4530.3800.5310.4400.065
pre60.4290.4730.5220.5570.628 **0.5530.4880.5160.5160.4430.4780.5920.4620.5020.4880.4470.4850.134
pre70.4490.4280.4460.4880.5710.4730.3720.4380.5160.4130.4180.4870.4700.4560.4330.4080.4590.3760.117
pre80.4230.5630.4030.4820.5200.5090.5050.5060.4810.4770.5320.4560.5020.4670.4530.4060.4960.4370.4020.208
pre90.4130.5640.4810.5170.5720.5270.5040.4640.4320.4470.5280.5670.4690.4720.4990.4540.4960.3880.4890.3850.157
pre100.4510.4570.4520.4670.4850.4690.4310.4340.4520.4480.4500.4290.4610.4730.4530.4440.4220.4760.4310.4040.4440.170
pre110.5060.4590.5330.5440.5900.4650.4060.4750.5200.4640.4630.5710.4670.4740.4290.4620.4290.4080.3730.4500.4940.4050.078
pre120.5150.5050.5300.5390.604 **0.607 **0.5560.5050.5370.5150.5320.5810.5620.5440.5500.5070.5100.4710.4110.4410.4920.4580.4730.119
** Top 10 interpretations.
Table A2. Interpretation of EOS changes by multi-element interaction.
Ta1Ta2Ta3Ta4Ta5Ta6Ta7Ta8Ta9Ta10Ta11Ta12pre1pre2pre3pre4pre5pre6pre7pre8pre9pre10pre11pre12
Ta10.113
Ta20.4310.092
Ta30.4050.5250.161
Ta40.4130.4690.4520.173
Ta50.3890.5230.4560.4220.075
Ta60.4340.5340.4980.4730.5120.137
Ta70.4740.4570.4590.4560.5210.559 **0.177
Ta80.4530.3660.4760.4800.4670.5160.4760.110
Ta90.4700.4120.4960.4540.4770.5010.4950.4140.103
Ta100.4600.4540.5160.5400.5180.5320.4760.4170.4350.072
Ta110.3460.2740.4740.4390.4060.4480.4590.4000.4090.4450.078
Ta120.3860.5040.3450.4240.3640.4240.4650.4590.4170.5280.4670.128
pre10.4670.4750.5210.5450.600 **0.5380.572 **0.5070.551 **0.4970.4780.548 **0.123
pre20.4180.4340.4590.5150.4250.4770.4980.4580.4420.4520.4250.4620.4850.092
pre30.4110.4470.4380.4770.551 **0.578 **0.5350.4980.4790.5190.4020.4800.5400.4540.050
pre40.4070.4830.3860.4420.4490.4260.4920.4590.4320.4660.5020.3330.5140.4620.4280.136
pre50.4330.4490.4460.4500.4460.4400.5110.4560.4190.4580.4340.3500.4380.4340.4790.3960.084
pre60.4280.4060.4310.4970.5440.5410.5000.4980.4770.4650.3800.4510.4230.4370.4050.4260.4340.137
pre70.4410.4410.3930.4950.545 **0.5270.4560.4830.4570.4420.4780.4050.4360.4750.4290.3840.4160.4180.187
pre80.3750.4710.3310.4490.4540.4630.4390.4070.4420.4610.4730.3910.4020.4360.4120.3810.4480.3630.3860.161
pre90.3900.4800.4190.4490.5260.4520.5040.4970.4460.4790.4310.4370.4380.4460.4190.4400.4360.3600.4310.3560.129
pre100.3870.3700.3650.3950.4440.4340.4420.3670.3720.4420.3800.3920.4310.3990.4280.3820.3980.4460.3980.3780.4050.165
pre110.4470.4670.4620.4870.549 **0.5410.4120.5000.4840.4610.4570.4880.4540.4690.4040.4630.4240.3670.3650.4180.4420.3920.190
pre120.4960.4640.4660.4910.4770.5430.5350.548 **0.4500.5150.4760.4970.5220.4960.4630.4050.4010.4250.4190.4230.4240.4640.4760.053
** Top 10 interpretations.
Table A3. Interpretation of LOS changes by multi-element interaction.
Ta1Ta2Ta3Ta4Ta5Ta6Ta7Ta8Ta9Ta10Ta11Ta12pre1pre2pre3pre4pre5pre6pre7pre8pre9pre10pre11pre12
Ta10.128
Ta20.4740.104
Ta30.4490.5530.205
Ta40.4620.5200.4700.236
Ta50.4310.5460.4860.4540.154
Ta60.5040.574 **0.5460.5180.5210.174
Ta70.4670.4800.4930.4980.5680.5540.188
Ta80.4910.4100.4960.5200.5120.5460.4840.150
Ta90.5110.4820.5510.5080.5500.5520.5390.4550.157
Ta100.4820.4800.5350.591 **0.5520.5550.4700.4420.4770.073
Ta110.4240.3290.5250.5050.4610.4940.4850.4750.4950.4940.120
Ta120.4660.5540.4060.4830.4050.4780.5000.5220.4930.5690.5620.182
pre10.4960.4960.5610.5700.603 **0.5390.573 **0.5570.5530.4920.5250.597 **0.099
pre20.4880.4540.5280.5460.4510.5360.4970.4880.4860.5000.5010.5340.5130.128
pre30.4880.4800.5200.5480.589 **0.609 **0.5690.5480.5360.5510.4770.578 **0.585 **0.5100.079
pre40.4730.5530.4350.5100.4910.4770.5160.5140.5180.5140.5550.4130.5610.5200.5060.205
pre50.4530.4570.4980.4960.4740.4530.5220.4810.5050.4950.4700.4010.4540.4330.5320.4690.072
pre60.4610.4550.5000.5590.5720.589 **0.5000.5240.5320.4700.4560.5420.4710.5230.4720.4720.4990.162
pre70.4630.4660.4290.5250.5710.5480.4470.4830.5270.4570.4890.4730.4900.4980.4660.4080.4510.4320.201
pre80.4510.5410.3970.4700.4730.4940.4820.4650.5080.4970.5350.4490.4600.5150.4640.4360.4940.4320.4150.230
pre90.4530.5400.4680.5250.5340.5160.5200.5060.4770.4660.4940.5220.4610.4930.4980.4880.4980.4340.4940.3910.186
pre100.4500.4330.4250.4460.4600.4710.4810.4180.4410.4670.4750.4210.4790.4670.4860.4410.4380.5160.4540.4410.4700.201
pre110.4980.4970.4980.5420.5490.5570.4320.5290.5410.4820.4990.5580.5020.5020.4470.4970.4760.4170.4130.4750.5080.4450.186
pre120.5290.4930.4930.5120.5360.5660.5430.5240.5190.5230.5120.5360.5120.5200.4850.4610.4400.4560.4230.4570.4660.4880.4930.082
** Top 10 interpretations.

References

  1. IPCC. The Physical Science Basis. Contribution of Working Group I to the Fifth Assessment Report of the Intergovernmental Panel on Climate Change; Cambridge University Press: Cambridge, UK, 2013. [Google Scholar]
  2. Zuo, H.; Li, D.; Hu, Y.; Bao, Y.; Lü, S. Characteristics of climatic trends and correlation between pan-evaporation and environmental factors in the last 40 years over China. Chin. Sci. Bull. 2005, 50, 1235–1241. [Google Scholar] [CrossRef]
  3. Rong, Z.; Zhao, C.; Liu, J.; Gao, Y.; Zang, F.; Guo, Z.; Mao, Y.; Wang, L. Modeling the effect of climate change on the potential distribution of Qinghai Spruce (Picea crassifolia kom.) in Qilian Mountains. Forests 2019, 10, 62. [Google Scholar] [CrossRef] [Green Version]
  4. Deng, S.F.; Yang, T.B.; Zeng, B.; Zhu, X.F.; Xu, H.J. Vegetation cover variation in the Qilian Mountains and its response to climate change in 2000–2011. J. Mt. Sci. 2013, 10, 1050–1062. [Google Scholar] [CrossRef]
  5. Xianzhi, Y.; Qiang, Z.; Qiyun, X.; Wan-xiao, X.; Hui, G.; Zhi-juan, S. Characteristics of climate change in Qilian Mountains region in recent 50 years. Plateau Meteorol. 2009, 28, 85–90. [Google Scholar]
  6. Piao, S.; Ciais, P.; Huang, Y.; Shen, Z.; Peng, S.; Li, J.; Zhou, L.; Liu, H.; Ma, Y.; Ding, Y. The impacts of climate change on water resources and agriculture in China. Nature 2010, 467, 43–51. [Google Scholar] [CrossRef] [PubMed]
  7. Root, T.L.; Price, J.T.; Hall, K.R.; Schneider, S.H.; Rosenzweig, C.; Pounds, J.A. Fingerprints of global warming on wild animals and plants. Nature 2003, 421, 57–60. [Google Scholar] [CrossRef]
  8. Wang, G.X.; Bai, W.; Li, N.; Hu, H.C. Climate changes and its impact on tundra ecosystem in Qinghai-Tibet Plateau, China. Clim. Chang. 2011, 106, 463–482. [Google Scholar] [CrossRef]
  9. You, Y.F.; Wang, S.Y.; Pan, N.Q.; Ma, Y.X.; Liu, W.H. Growth stage-dependent responses of carbon fixation process of alpine grasslands to climate change over the Tibetan Plateau, China. Agric. For. Meteorol. 2020, 291, 11. [Google Scholar] [CrossRef]
  10. Gan, G.J.; Liu, Y.B.; Sun, G. Understanding interactions among climate, water, and vegetation with the Budyko framework. Earth-Sci. Rev. 2021, 212, 103451. [Google Scholar] [CrossRef]
  11. Lieth, H. Phenology and seasonality modeling. Ecol. Stud. 1974, 120, 461. [Google Scholar]
  12. Zhu, K.; Wan, M. Phenology; Science Press: Beijing, China, 1975. [Google Scholar]
  13. Ren, S.; Peichl, M. Enhanced spatiotemporal heterogeneity and the climatic and biotic controls of autumn phenology in northern grasslands. Sci. Total Environ. 2021, 788, 147806. [Google Scholar] [CrossRef] [PubMed]
  14. Ren, S.; Chen, X.; Lang, W.; Schwartz, M.D. Climatic Controls of the Spatial Patterns of Vegetation Phenology in Midlatitude Grasslands of the Northern Hemisphere. J. Geophys. Res. Biogeosci. 2018, 123, 2323–2336. [Google Scholar] [CrossRef]
  15. Piao, S.; Tan, J.; Chen, A.; Fu, Y.H.; Ciais, P.; Liu, Q.; Janssens, I.A.; Vicca, S.; Zeng, Z.; Jeong, S.-J. Leaf onset in the northern hemisphere triggered by daytime temperature. Nat. Commun. 2015, 6, 6911. [Google Scholar] [CrossRef] [Green Version]
  16. Fu, Y.H.; Zhao, H.; Piao, S.; Peaucelle, M.; Peng, S.; Zhou, G.; Ciais, P.; Huang, M.; Menzel, A.; Peñuelas, J. Declining global warming effects on the phenology of spring leaf unfolding. Nature 2015, 526, 104–107. [Google Scholar] [CrossRef] [PubMed] [Green Version]
  17. Steffen, W.; Noble, I.; Canadell, J.; Apps, M.; Schulze, E.D.; Jarvis, P.G.; Baldocchi, D.; Ciais, P.; Cramer, W.; Ehleringer, J.; et al. The terrestrial carbon cycle: Implications for the Kyoto Protocol. Science 1998, 280, 1393–1394. [Google Scholar]
  18. Chen, C.; Park, T.; Wang, X.H.; Piao, S.L.; Xu, B.D.; Chaturvedi, R.K.; Fuchs, R.; Brovkin, V.; Ciais, P.; Fensholt, R.; et al. China and India lead in greening of the world through land-use management. Nat. Sustain. 2019, 2, 122–129. [Google Scholar] [CrossRef] [PubMed]
  19. Kawabata, A.; Ichii, K.; Yamaguchi, Y. Global monitoring of interannual changes in vegetation activities using NDVI and its relationships to temperature and precipitation. Int. J. Remote Sens. 2001, 22, 1377–1382. [Google Scholar] [CrossRef]
  20. Piao, S.L.; Fang, J.Y.; Liu, H.Y.; Zhu, B. NDVI-indicated decline in desertification in China in the past two decades. Geophys. Res. Lett. 2005, 32, 4. [Google Scholar] [CrossRef]
  21. Qiao, C.; Shen, S.; Cheng, C.; Wu, J.; Jia, D.; Song, C. Vegetation Phenology in the Qilian Mountains and Its Response to Temperature from 1982 to 2014. Remote Sens. 2021, 13, 286. [Google Scholar] [CrossRef]
  22. Wu, C.Y.; Wang, J.; Ciais, P.; Penuelas, J.; Zhang, X.Y.; Sonnentag, O.; Tian, F.; Wang, X.Y.; Wang, H.J.; Liu, R.G.; et al. Widespread decline in winds delayed autumn foliar senescence over high latitudes. Proc. Natl. Acad. Sci. USA 2021, 118, 10. [Google Scholar] [CrossRef]
  23. Yang, Y.; Qi, N.; Zhao, J.; Meng, N.; Lu, Z.; Wang, X.; Kang, L.; Wang, B.; Li, R.; Ma, J.; et al. Detecting the Turning Points of Grassland Autumn Phenology on the Qinghai-Tibetan Plateau Spatial Heterogeneity and Controls. Remote Sens. 2021, 13, 4797. [Google Scholar] [CrossRef]
  24. Gao, X.; Huang, X.X.; Lo, K.; Dang, Q.W.; Wen, R.Y. Vegetation responses to climate change in the Qilian Mountain Nature Reserve, Northwest China. Glob. Ecol. Conserv. 2021, 28, 12. [Google Scholar] [CrossRef]
  25. Wang, J.F.; Xu, C.D. Geodetector: Princple and prospective. Acta Geogr. Sin. 2017, 72, 116–134. [Google Scholar] [CrossRef]
  26. Wang, J.F.; Zhang, T.L.; Fu, B.J. A measure of spatial stratified heterogeneity. Ecol. Indic. 2016, 67, 250–256. [Google Scholar] [CrossRef]
  27. Wang, J.F.; Li, X.H.; Christakos, G.; Liao, Y.L.; Zhang, T.; Gu, X.; Zheng, X.Y. Geographical Detectors-Based Health Risk Assessment and its Application in the Neural Tube Defects Study of the Heshun Region, China. Int. J. Geogr. Inf. Sci. 2010, 24, 107–127. [Google Scholar] [CrossRef]
  28. Zhang, X.Y.; Friedl, M.A.; Schaaf, C.B.; Strahler, A.H.; Hodges, J.C.F.; Gao, F.; Reed, B.C.; Huete, A. Monitoring vegetation phenology using MODIS. Remote Sens. Environ. 2003, 84, 471–475. [Google Scholar] [CrossRef]
  29. Shuai, Y.M.; Schaaf, C.B.; Strahler, A.H.; Li, X.W.; Gao, F.; Liu, J.; Wolfe, R.E.; Wang, J.; Zhang, X.Y.; Zhu, Q.J. Monitoring vegetation phenology using improved MODIS products. In Proceedings of the Conference on Electronic Imaging and Multimedia Technology V, Beijing, China, 12–15 November 2007. [Google Scholar]
  30. Picard, G.; Quegan, S.; Delbart, N.; Lomas, M.R.; Le Toan, T.; Woodward, F.I. Bud-burst modelling in Siberia and its impact on quantifying the carbon budget. Glob. Chang. Biol. 2005, 11, 2164–2176. [Google Scholar] [CrossRef] [Green Version]
  31. Shang, R.; Liu, R.G.; Xu, M.Z.; Liu, Y.; Zuo, L.; Ge, Q.S. The relationship between threshold-based and inflexion-based approaches for extraction of land surface phenology. Remote Sens. Environ. 2017, 199, 167–170. [Google Scholar] [CrossRef]
  32. Liu, R.; Shang, R.; Liu, Y.; Lu, X. Global evaluation of gap-filling approaches for seasonal NDVI with considering vegetation growth trajectory, protection of key point, noise resistance and curve stability. Remote Sens. Environ. 2017, 189, 164–179. [Google Scholar] [CrossRef] [Green Version]
  33. Liu, R. Compositing the Minimum NDVI for MODIS Data. IEEE Trans. Geosci. Remote Sens. 2017, 55, 1396–1406. [Google Scholar] [CrossRef]
  34. Liu, R.; Liu, Y. Generation of new cloud masks from MODIS land surface reflectance products. Remote Sens. Environ. 2013, 133, 21–37. [Google Scholar] [CrossRef]
  35. Liu, Y.; Chen, P.Q.; Zhang, W.; Hu, F. A Spatial Interpolation Method for Surface Air Temperature and Its Error Analysis. Chin. J. Atmos. Sci. 2006, 30, 146–152. [Google Scholar]
  36. Thornton, P.E.; Running, S.W.; White, M.A. Generating surfaces of daily meteorological variables over large regions of complex terrain. J. Hydrol. 1997, 190, 214–251. [Google Scholar] [CrossRef] [Green Version]
  37. Jiyuan, L.; Mingliang, L.; Xiangzheng, D.; Dafang, Z.; Zengxiang, Z.; Di, L. The land use and land cover change database and its relative studies in China. J. Geogr. Sci. 2002, 12, 275–282. [Google Scholar] [CrossRef]
  38. Zhuang, D.; Liu, J.; Liu, M. Research activities on land-use/cover change in the past ten years in China using space technology. Chin. Geogr. Sci. 1999, 9, 330–334. [Google Scholar] [CrossRef]
  39. Jonsson, P.; Eklundh, L. Seasonality extraction by function fitting to time-series of satellite sensor data. IEEE Trans. Geosci. Remote Sens. 2002, 40, 1824–1832. [Google Scholar] [CrossRef]
  40. Jonsson, P.; Eklundh, L. TIMESAT—A program for analyzing time-series of satellite sensor data. Comput. Geosci. 2004, 30, 833–845. [Google Scholar] [CrossRef] [Green Version]
  41. Chen, L.; Hänninen, H.; Rossi, S.; Smith, N.G.; Pau, S.; Liu, Z.; Feng, G.; Gao, J.; Liu, J. Leaf senescence exhibits stronger climatic responses during warm than during cold autumns. Nat. Clim. Chang. 2020, 10, 777–780. [Google Scholar] [CrossRef]
  42. Fu, Y.H.; Piao, S.; Zhao, H.; Jeong, S.J.; Wang, X.; Vitasse, Y.; Ciais, P.; Janssens, I.A. Unexpected role of winter precipitation in determining heat requirement for spring vegetation green-up at northern middle and high latitudes. Glob. Chang. Biol. 2014, 20, 3743–3755. [Google Scholar] [CrossRef]
  43. Piao, S. Interannual variations of monthly and seasonal normalized difference vegetation index (NDVI) in China from 1982 to 1999. J. Geophys. Res. 2003, 108, 4401. [Google Scholar] [CrossRef]
  44. Ji, S.N.; Classen, A.T.; Zhang, Z.H.; He, J.S. Asymmetric winter warming advanced plant phenology to a greater extent than symmetric warming in an alpine meadow. Funct. Ecol. 2017, 31, 2147–2156. [Google Scholar] [CrossRef] [Green Version]
  45. Friedl, M.; Gray, J.; Sulla-Menashe, D. MCD12Q2 MODIS/Terra+Aqua Land Cover Dynamics Yearly L3 Global 500m SIN Grid V006; United States Geological Survey: Reston, VA, USA, 2019. [CrossRef]
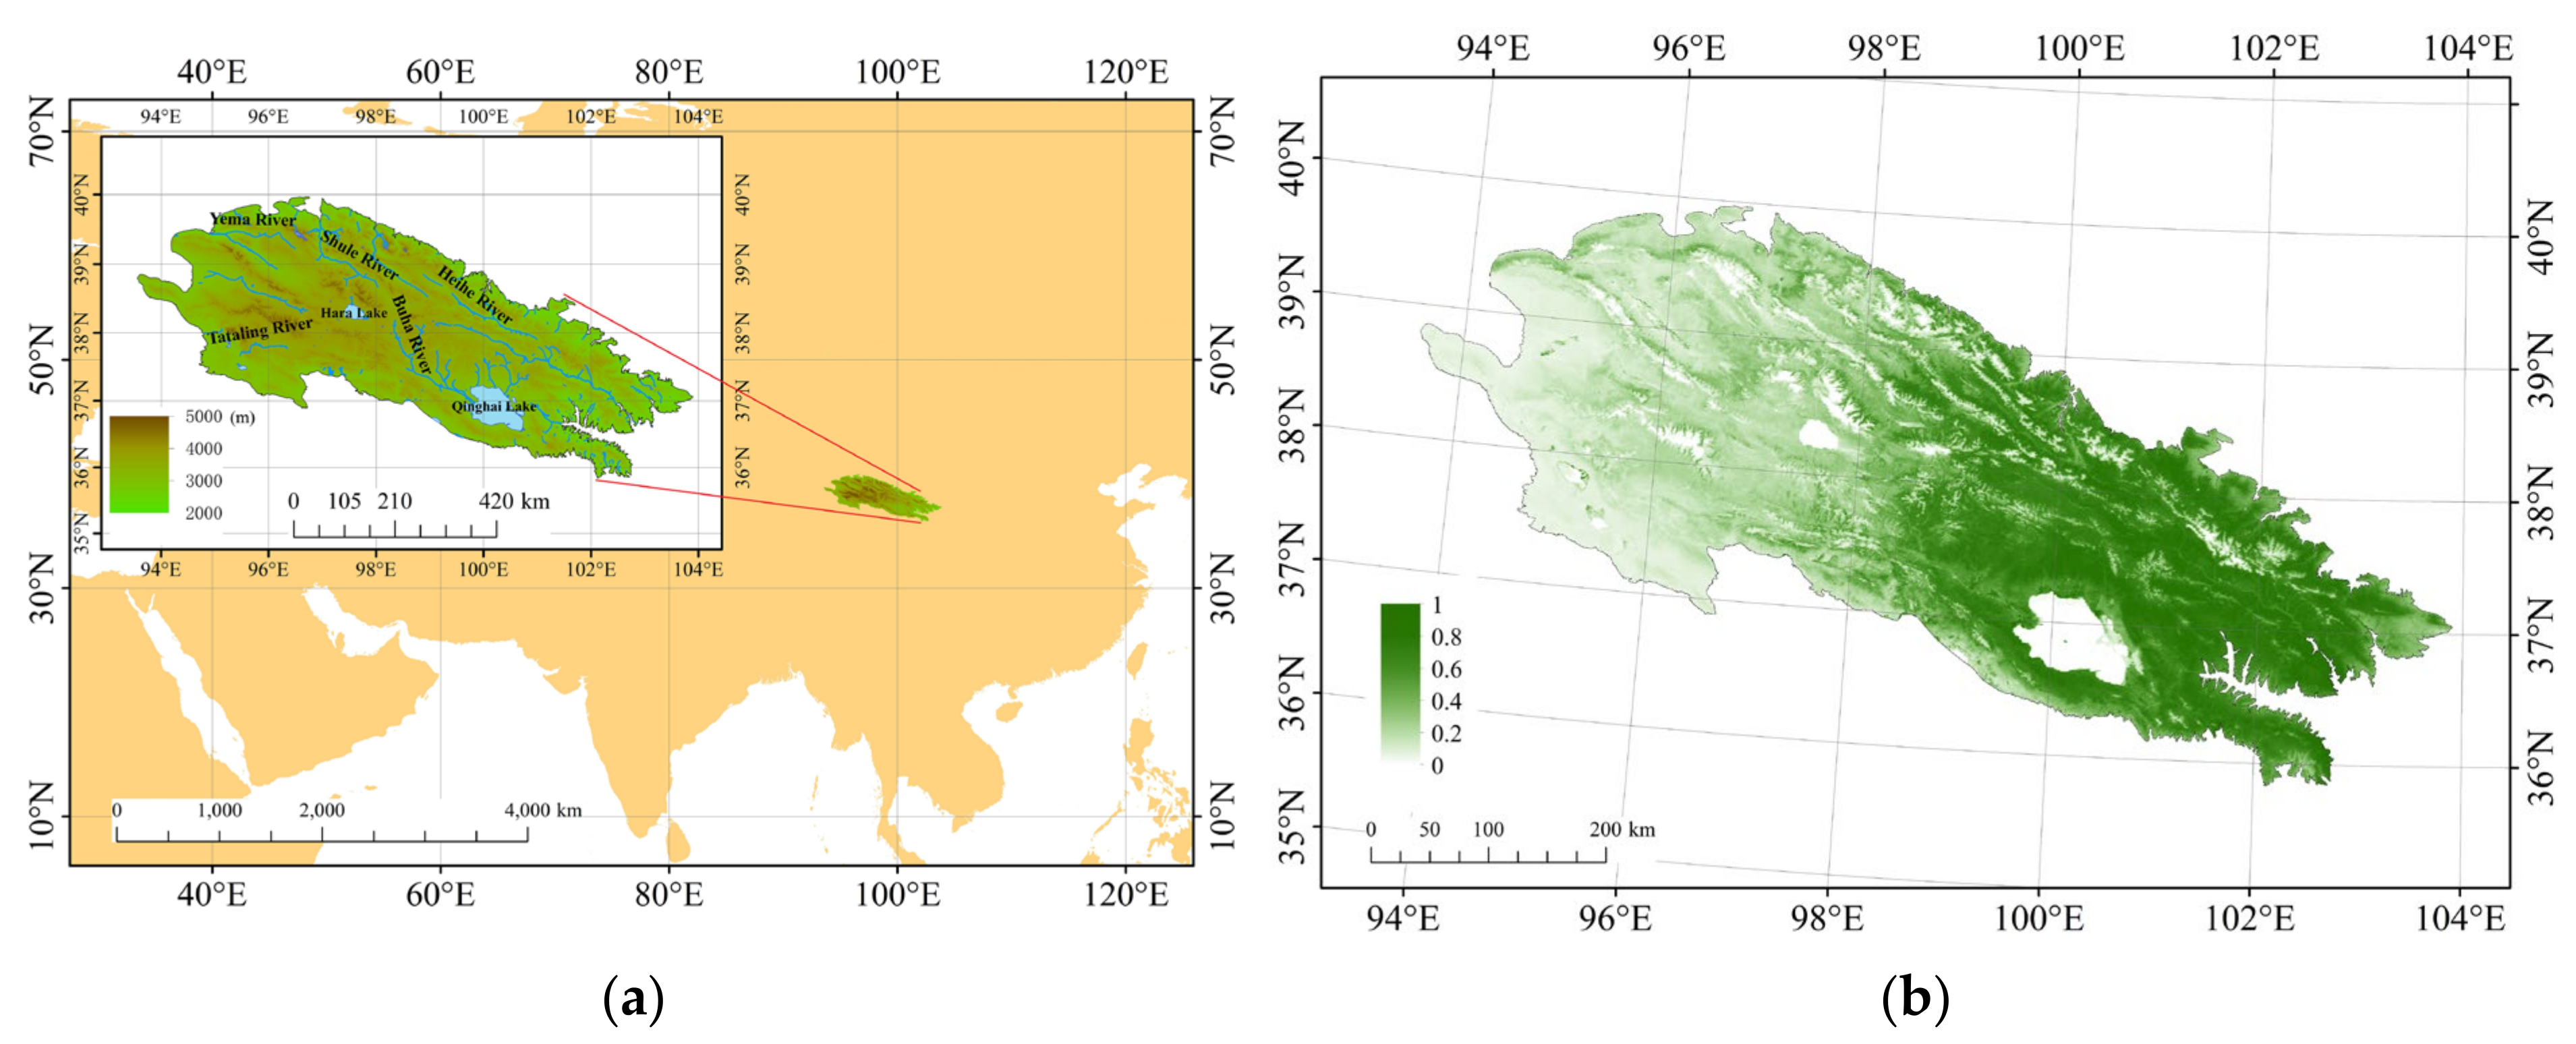
Figure 1. Geographical background of Qilian Mountains. (a) DEM, river network and location of study area; (b) mean of annual NDVI Maximum Value from 2000 to 2019.
Remotesensing 14 01248 g001
Figure 2. The distribution of remaining grassland in the study area from 2000 to 2018.
Remotesensing 14 01248 g002
Figure 3. Distribution of weather stations.
Remotesensing 14 01248 g003
Figure 4. The asymmetric Gaussian function was used to fit the NDVI curve. Additionally, the dynamic threshold method was used to extract vegetation phenological parameters.
Remotesensing 14 01248 g004
Figure 5. Diagrammatic sketch that GeoDetector used to detect the interaction between explanatory variables X1 and X2.
Remotesensing 14 01248 g005
Figure 6. Difference in monthly average temperature for 20 years by linear regression from 2000 to 2019 per month.
Remotesensing 14 01248 g006
Figure 7. Difference in monthly average precipitation for 20 years by linear regression from 2000 to 2019 per month.
Remotesensing 14 01248 g007
Figure 8. Spatial distribution of (a) average SOS for 20 years from 2000 to 2019 and (b) difference in SOS for 20 years by linear regression from 2000 to 2019.
Remotesensing 14 01248 g008
Figure 9. Spatial distribution of (a) average EOS for 20 years from 2000 to 2019 and (b) difference in EOS for 20 years by linear regression from 2000 to 2019.
Remotesensing 14 01248 g009
Figure 10. Spatial distribution of (a) average LOS for 20 years from 2000 to 2019 and (b) difference in LOS for 20 years by linear regression from 2000 to 2019.
Remotesensing 14 01248 g010
Figure 11. River network and D-Value of SOS in the study area.
Remotesensing 14 01248 g011
Figure 12. Comparison of phenology extracted from the MODIS-derived NDVI in this study and from the MCD12Q2. (a) SOS extracted from the MODIS-derived NDVI in this study; (b) SOS extracted from the MCD12Q2; (c) EOS extracted from the MODIS-derived NDVI in this study; (d) EOS extracted from the MCD12Q2.
Remotesensing 14 01248 g012
Table 1. Q statistics and the significance of phenological parameters when interpreting their trends by monthly average temperature and precipitation with GeoDetector.
SOSEOSLOS
q Statisticp Valueq Statisticp Valueq Statisticp Value
Ta1 10.111<0.0010.113<0.0010.128<0.001
Ta20.095<0.0010.092<0.0010.104<0.001
Ta30.242 *<0.0010.161<0.0010.205 *<0.001
Ta40.233 *<0.0010.173<0.0010.236 *<0.001
Ta50.245 *<0.0010.0750.0070.154<0.001
Ta60.131<0.0010.137<0.0010.174<0.001
Ta70.093<0.0010.177<0.0010.188<0.001
Ta80.121<0.0010.110<0.0010.150<0.001
Ta90.159<0.0010.103<0.0010.157<0.001
Ta100.0780.0060.0720.0190.0730.014
Ta110.1400.0940.078<0.0010.120<0.001
Ta120.212 *<0.0010.128<0.0010.182<0.001
pre1 20.113<0.0010.123<0.0010.099<0.001
pre20.113<0.0010.092<0.0010.128<0.001
pre30.096<0.0010.0500.2450.0790.005
pre40.197<0.0010.136<0.0010.205 *<0.001
pre50.0650.0450.084<0.0010.0720.006
pre60.134<0.0010.137<0.0010.162<0.001
pre70.117<0.0010.187<0.0010.201 *<0.001
pre80.208 *<0.0010.161<0.0010.230 *<0.001
pre90.157<0.0010.129<0.0010.186<0.001
pre100.170<0.0010.165<0.0010.201 *<0.001
pre110.0780.0940.190<0.0010.186<0.001
pre120.119<0.0010.0530.2140.0820.005
1 Ta1, 2, …, 12 averages the change in temperature from 2000 to 2019 in January, February, …, December (the same below). 2 pre1, 2, …, 12 averages the change in precipitation from 2000 to 2019 in January, February, …, December (the same below). * Where q > 0.2.
Table 2. Interpretation of LOS change trend by SOS and EOS.
LOS
q Statisticp Value
SOS0.589<0.001
EOS0.708<0.001
SOS EOS 10.999-
1 Interaction between SOS and EOS.
Publisher’s Note: MDPI stays neutral with regard to jurisdictional claims in published maps and institutional affiliations.