Article

How Can We Understand the Past from Now On? Three-Dimensional Modelling and Landscape Reconstruction of the Shuanghuaishu Site in the Central Plains of China

1
Key Laboratory of Digital Earth Science, Aerospace Information Research Institute, Chinese Academy of Sciences, Beijing 100094, China
2
College of Resources and Environment, University of Chinese Academy of Sciences, Beijing 100049, China
3
Digital Environmental Archaeology Research Center, Institute of Geography, Henan Academy of Sciences, Zhengzhou 450052, China
4
Zhengzhou Municipal Research Institute of Cultural Relics, Zhengzhou 450052, China
*
Author to whom correspondence should be addressed.
These authors contributed equally to this work.
Remote Sens. 2022, 14(5), 1233; https://doi.org/10.3390/rs14051233
Submission received: 14 January 2022 / Revised: 24 February 2022 / Accepted: 28 February 2022 / Published: 2 March 2022

Abstract

:
The Shuanghuaishu (SHS) site in China is one of the 100 most important archaeological discoveries over the past 100 years; its historical heritage can be traced directly back 5300 years. Understanding the early landscape of the site would provide important information about the origin of Chinese civilization. The SHS site is buried and surface traces are difficult to see; therefore, we attempted to reconstruct the early landscape of the site based on a current surface landscape model and environmental archaeological analysis. We created a modern three-dimensional (3D) landscape model of the study area from high spatial resolution unmanned aerial vehicle (UAV) aerial photographs and analysed the distance change between the Yellow River and SHS site in the past 60 years from CORONA and Landsat images. By combining environmental archaeological survey results, archaeological excavation data, relevant papers, and field measurements, we reconstructed the paleotopography of the SHS site during the Yangshao period (7000–5000 aBP). On this basis, 3D natural and human landscapes during the Yangshao period were rebuilt. The results show that (1) Satellite images acquired at different resolutions can provide multiscale spatial information about the site, and high-precision models of current conditions can be quickly generated from UAV aerial photography. (2) From 1960 to 2020, the shortest distance between the SHS site and the Yellow River was approximately 512 m. The location of bedrock on Mang Mountain can be used to infer the early extent of the northern terrace at the site. (3) Environmental archaeology provided information about the palaeoenvironment of the site area. By incorporating spatial information technology and 3D visualization, we can better restore the early landscape of the SHS site. Our work integrates environmental archaeology, field archaeology, and spatial technology, enabling data and modelling support for the visual interpretation of the SHS site.

1. Introduction

The Shuanghuaishu (SHS) site is the highest-standard cluster with the nature of a capital city discovered so far in the Yellow River basin for the late stage of Yangshao culture, the early stage of the formation of Chinese civilization. This site, which is attracting widespread attention, is regarded as “the embryo of early Chinese civilization” and is called the “Heluo kingdom” by archaeologists [1]. The important archaeological findings at this site prove the representativeness and influence of the Heluo area in the golden stage of the origin of Chinese civilization around 5300 years ago, offering important materials for the study of the civilization process in the Central Plains. Furthermore, the complete landscape of the site during the Yangshao period is an even more important addition to understanding the historical development of ancient China. Thus, the study of three-dimensional (3D) landscape reconstructions of archaeological sites is of particular importance for expanding the interpretive horizons of the living spaces of ancient societies and their interactions with living spaces.
There are several applications for restored site architecture paired with archaeological data and imagery [2,3,4]. The rise and fall of early settlements have important correlations with climate change and geographic locations [5,6,7]. Qin Zhen discussed the interaction between human activities and climate in China from 3500 BCE to 220 CE [8]. Li et al., on the other hand, argue that there was spatial heterogeneity in ancient human production activities in the Yellow-Huai river area, east China during the Longshan period (4600~3900 BP) [9]. If we want to recover the overall landscapes of settlement sites, a combination of site excavation information and geographical environmental analysis is necessary [10,11,12,13,14]. Today, remote sensing (RS),geographic information systems (GIS), and virtual reality (VR) can be applied to study and solve archaeological problems [15,16,17,18], more effectively revealing the spatial relationship and interaction between the past interactions of people and societies and the natural environment. In analysing the relationship between the site and its surroundings, it will not only reveal the influence of the natural environment on the activities of the ancestors, but also serve as a guide for archaeological investigations in unknown areas [19,20,21,22]. Liritzis et al. used satellite images to detect paths to the burial chambers and applied them to the study of astronomical orientation [23]. Georges Abou Diwan made a multifaceted assessment of the archaeological potential of the area around the Bekaa region (Lebanon) [19]. In terms of site restoration, RS technology can be applied to acquire information from different scenes at multiple scales through diversified platforms and mounted sensors. The application of this technology is useful not only to efficiently acquire the natural texture of the environment surrounding a site area but also to photograph archaeological excavation [24], which is an essential tool for the construction of a modern 3D landscape of the site [25,26,27,28]. GIS can integrate geographic resources and spatial elements and analyse spatial distribution patterns and association characteristics [29,30,31]. Three-dimensional modelling of site areas mainly uses medium- or high-resolution satellite imagery and digital elevation model (DEM) data to obtain the site’s supporting environmental attributes [32,33,34,35]. For 3D modelling of sites, unmanned aerial vehicle (UAV) platforms are usually used to acquire images or point cloud data of ruins and obtain high-precision texture, structure, and other information, from which more realistic 3D models can be built [36,37,38,39]. While the addition of RS and GIS enables the fine-scale portrayal and analysis of 3D models of existing sites, the recovery of relics still needs multidisciplinary support. In particular, logical extraction and complementation are performed for archaeological data through professional analyses [40,41,42,43,44]. In the restoration of aboveground ancient architectural sites, we generally take the existing remains as samples, obtain the properties and structural characteristics of the sites, and restore the damaged parts by employing logical design concepts and the available archaeological data [45,46,47,48,49,50]. Buried sites that lack aboveground marks, where details such as texture and structure are not visible, are more dependent on archaeological results and expert knowledge to identify analogies and provide speculations that aid restoration [51,52,53]. Environmental archaeology is an interdisciplinary approach that combines archaeology and paleogeography, which have growing theoretical and technical maturity, to analyse paleoenvironmental and human-environmental interactions [54,55,56,57,58,59]; the results obtained through this approach can provide important theoretical and data support for landscape recovery at sites.
Most previous site restoration studies focused on the site proper, applying physical remains and architectural logic to create ontological models. Fewer studies have focused on subsurface buried sites and ancient relic environments. Moreover, current site restoration has achieved many important results with support from multiple disciplines [60,61], but integration with environmental archaeology is not sufficient. Therefore, this study constructs a modern high-precision 3D landscape of the SHS site based on satellite images and UAV aerial photography data, simulates the topography of the SHS site during the Yangshao period by using field mapping and survey data, and obtains information about the early natural and cultural landscape of the site based on field archaeological and environmental archaeological data. Based on these achievements, we attempt to construct a 3D landscape of the SHS site during this period. This research contributes to providing a methodological reference for the site’s early landscape reconstruction and offers basic data and modelling support for site conservation, display, and utilization.

2. Materials and Methods
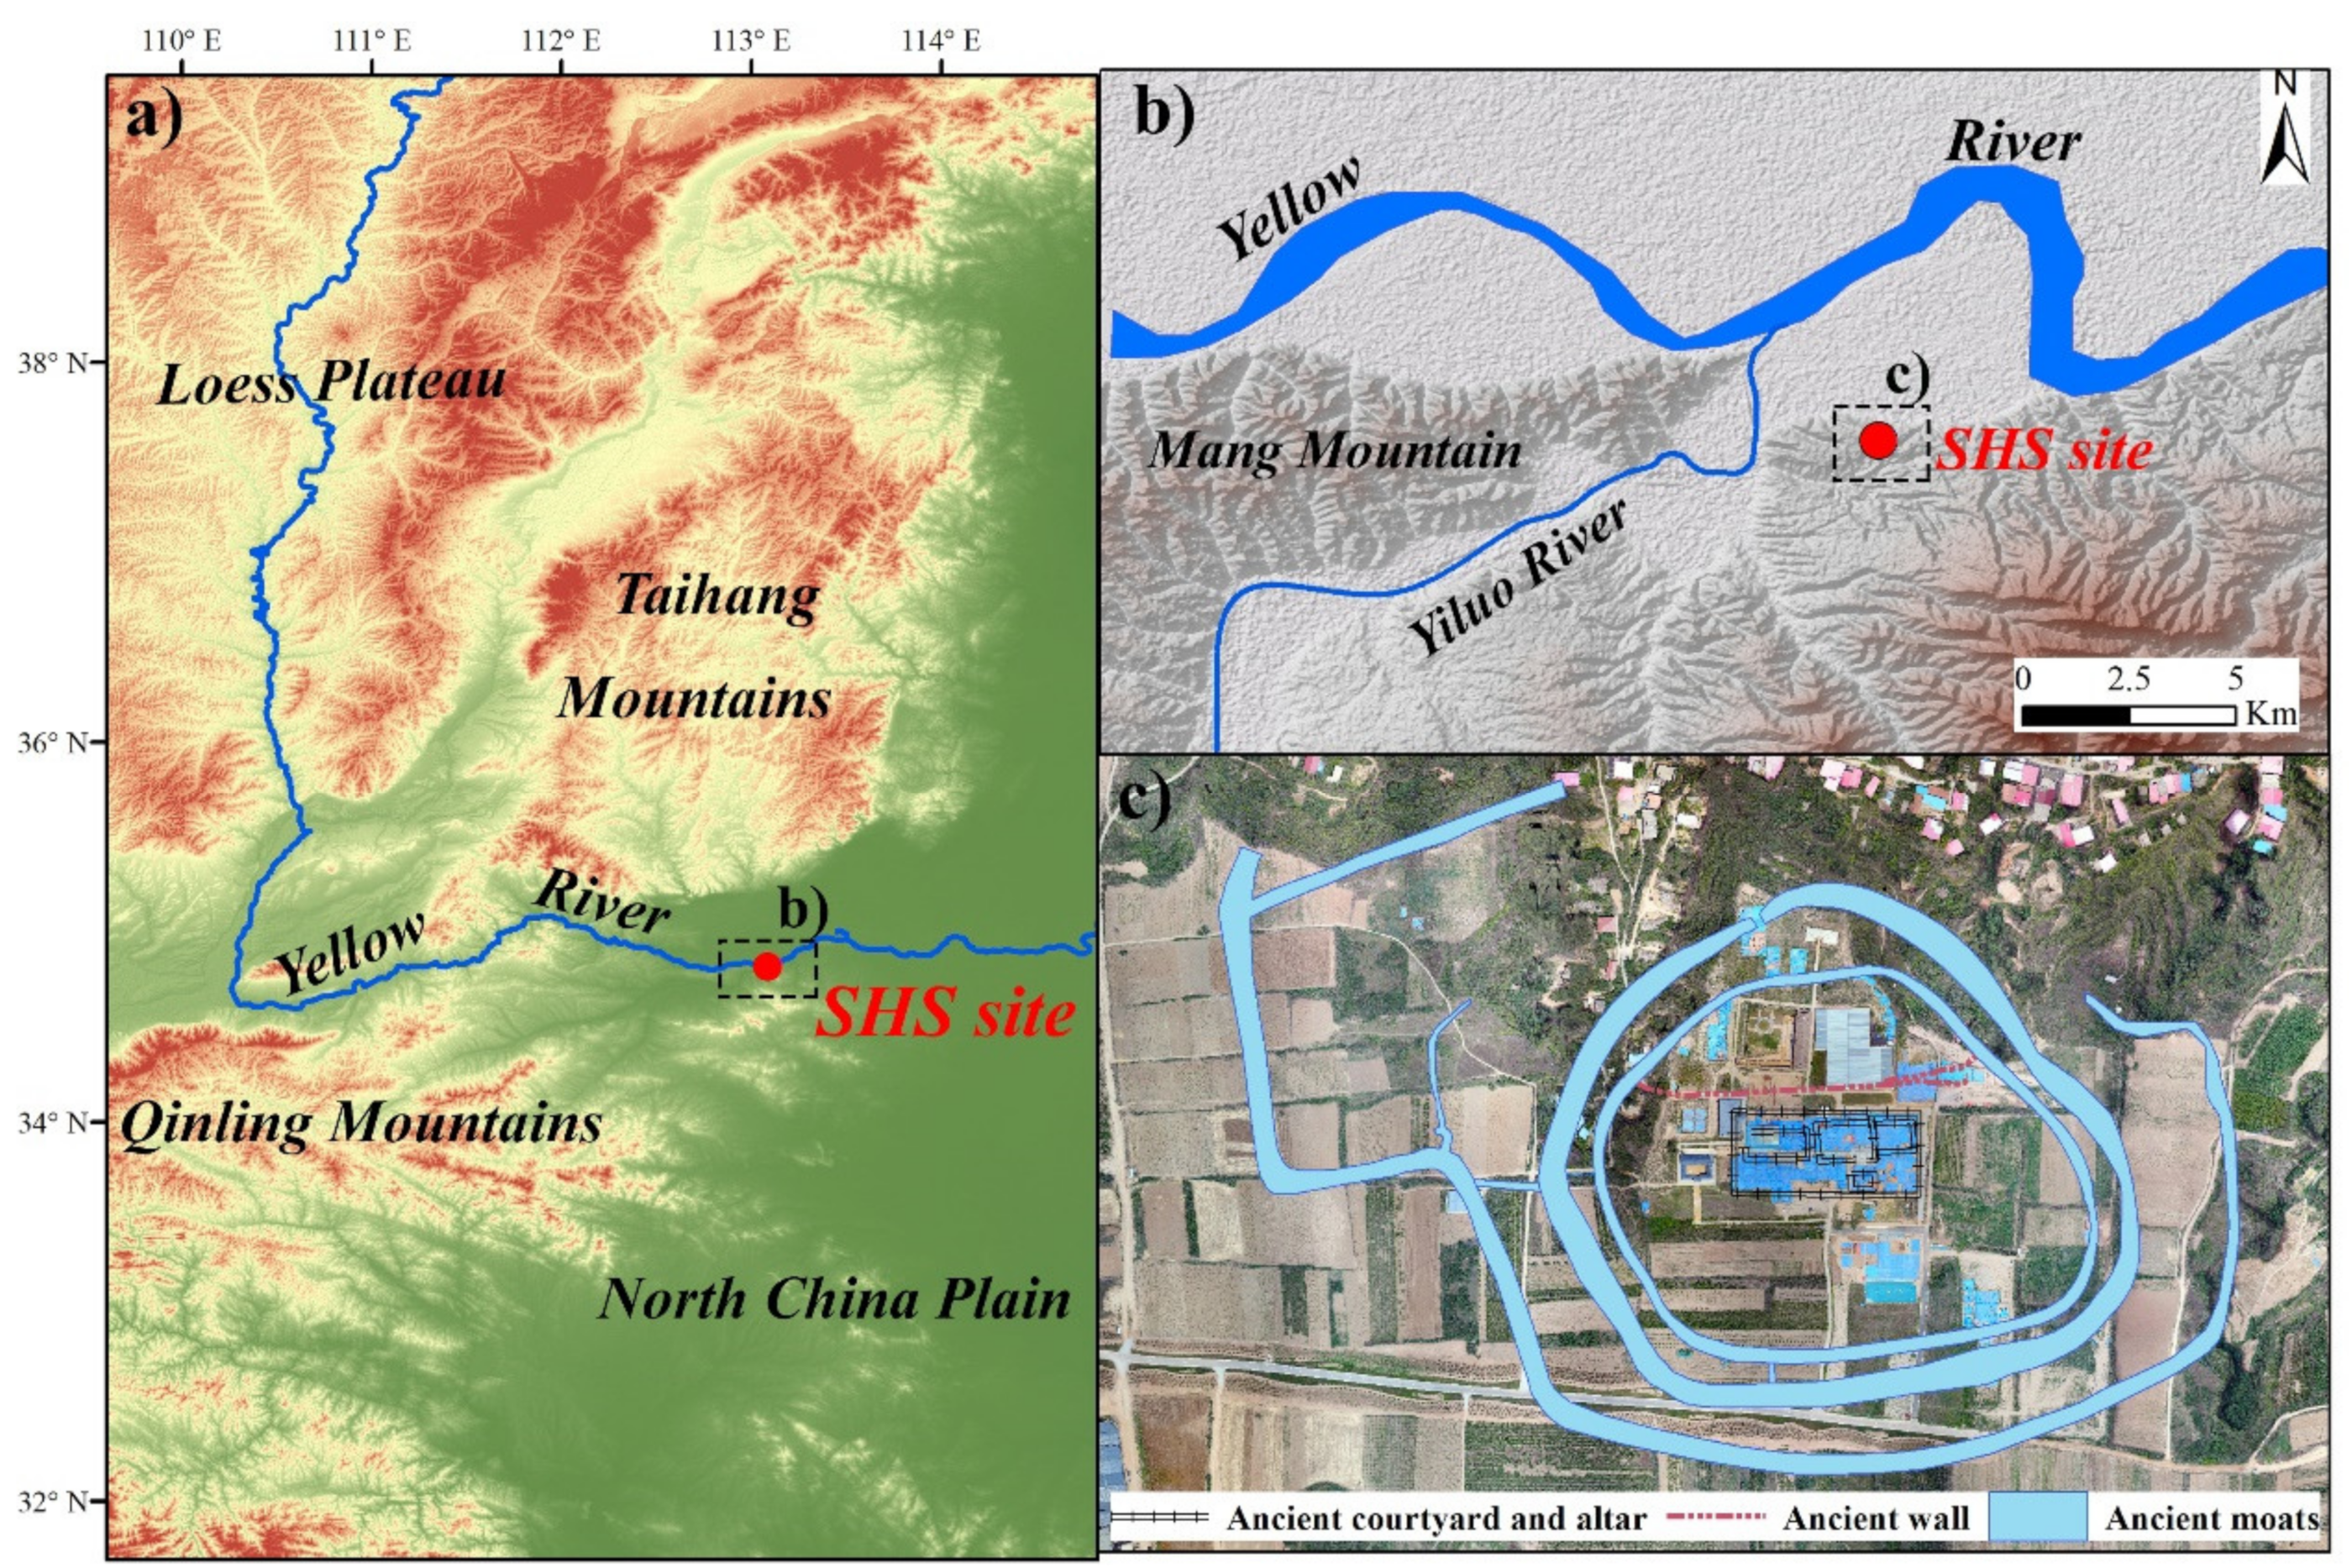
2.1. Study Region

The SHS site is located in Gongyi city, Henan Province, China, the central coordinates of which are 34°48′56″ N and 113°5′12″ E. It is located in the transition zone from the second to the third terrace in China, at the boundary between the Loess Plateau, the Qinling Mountains, the Taihang Mountains and the North China Plain, as well as close to the Yellow River (Figure 1). The site is approximately 2 km from the southern bank of the Yellow River to the north and 4 km from the Yiluo River to the east, covering an area of approximately 1.17 million square metres, and the whole site is situated on a high platform in the northern of the area. The results of excavation [62] indicate three major circular moats at the site from the middle and late Yangshao culture: the earliest wall with a barbican entrance structure, a large central residence site with a closed row layout, a large rammed earth foundation site, and large continuous block rammed earth remains. There are also more than 1700 large public cemeteries with strict planning, three rammed earth altar sites, and large tombs around the central altar. In the core area of the site, bounded by a barbican entrance-type structural enclosure, the remains of nine clay pots used to simulate nine stars and the earliest bone silkworm carving artwork in China were found in a sheltered area of the northern wall. The southern part of the enclosure appears to be a large rammed earth area; three large courtyards with suspected rutting traces in the middle were found in this part of the site. There is a rectangular altar to the south of the courtyard, and signs of artificial ramming are evident at the rammed earth foundation site to the west of the courtyard.
Referring to the results of previous investigations of the topographic features of Gongyi city [63], the landforms in the area of the SHS site were classified into four types based on the extraction of DEM information, landform composition, and gully density: medium and low hills in tectonic erosion, structural erosion hills, loess hills, and alluvial-proluvial inclined plains (Figure 2). As a whole, the loess hills consist of two main parts, namely, the western Mang Mountains and the southern bank of the hilly area along the Yiluo River; bedrock outcrops were found at several locations in the loess hills during field investigations. The bedrock hills near the site primarily consist of the Fuxi Mountains in the southeast, which are the northeast-oriented remnants of the Song Mountain system. The northwestern part of the region is a plain formed by the alluvial deposits of the Yiluo and Yellow Rivers, with the deposits occurring discontinuously and symmetrically along the banks of the rivers. The information on the current geomorphology of the SHS site area provided guidance and assistance for our field investigations, as well as important material for the recovery of the early geomorphology of the site.

2.2. Data Acquisition and Processing

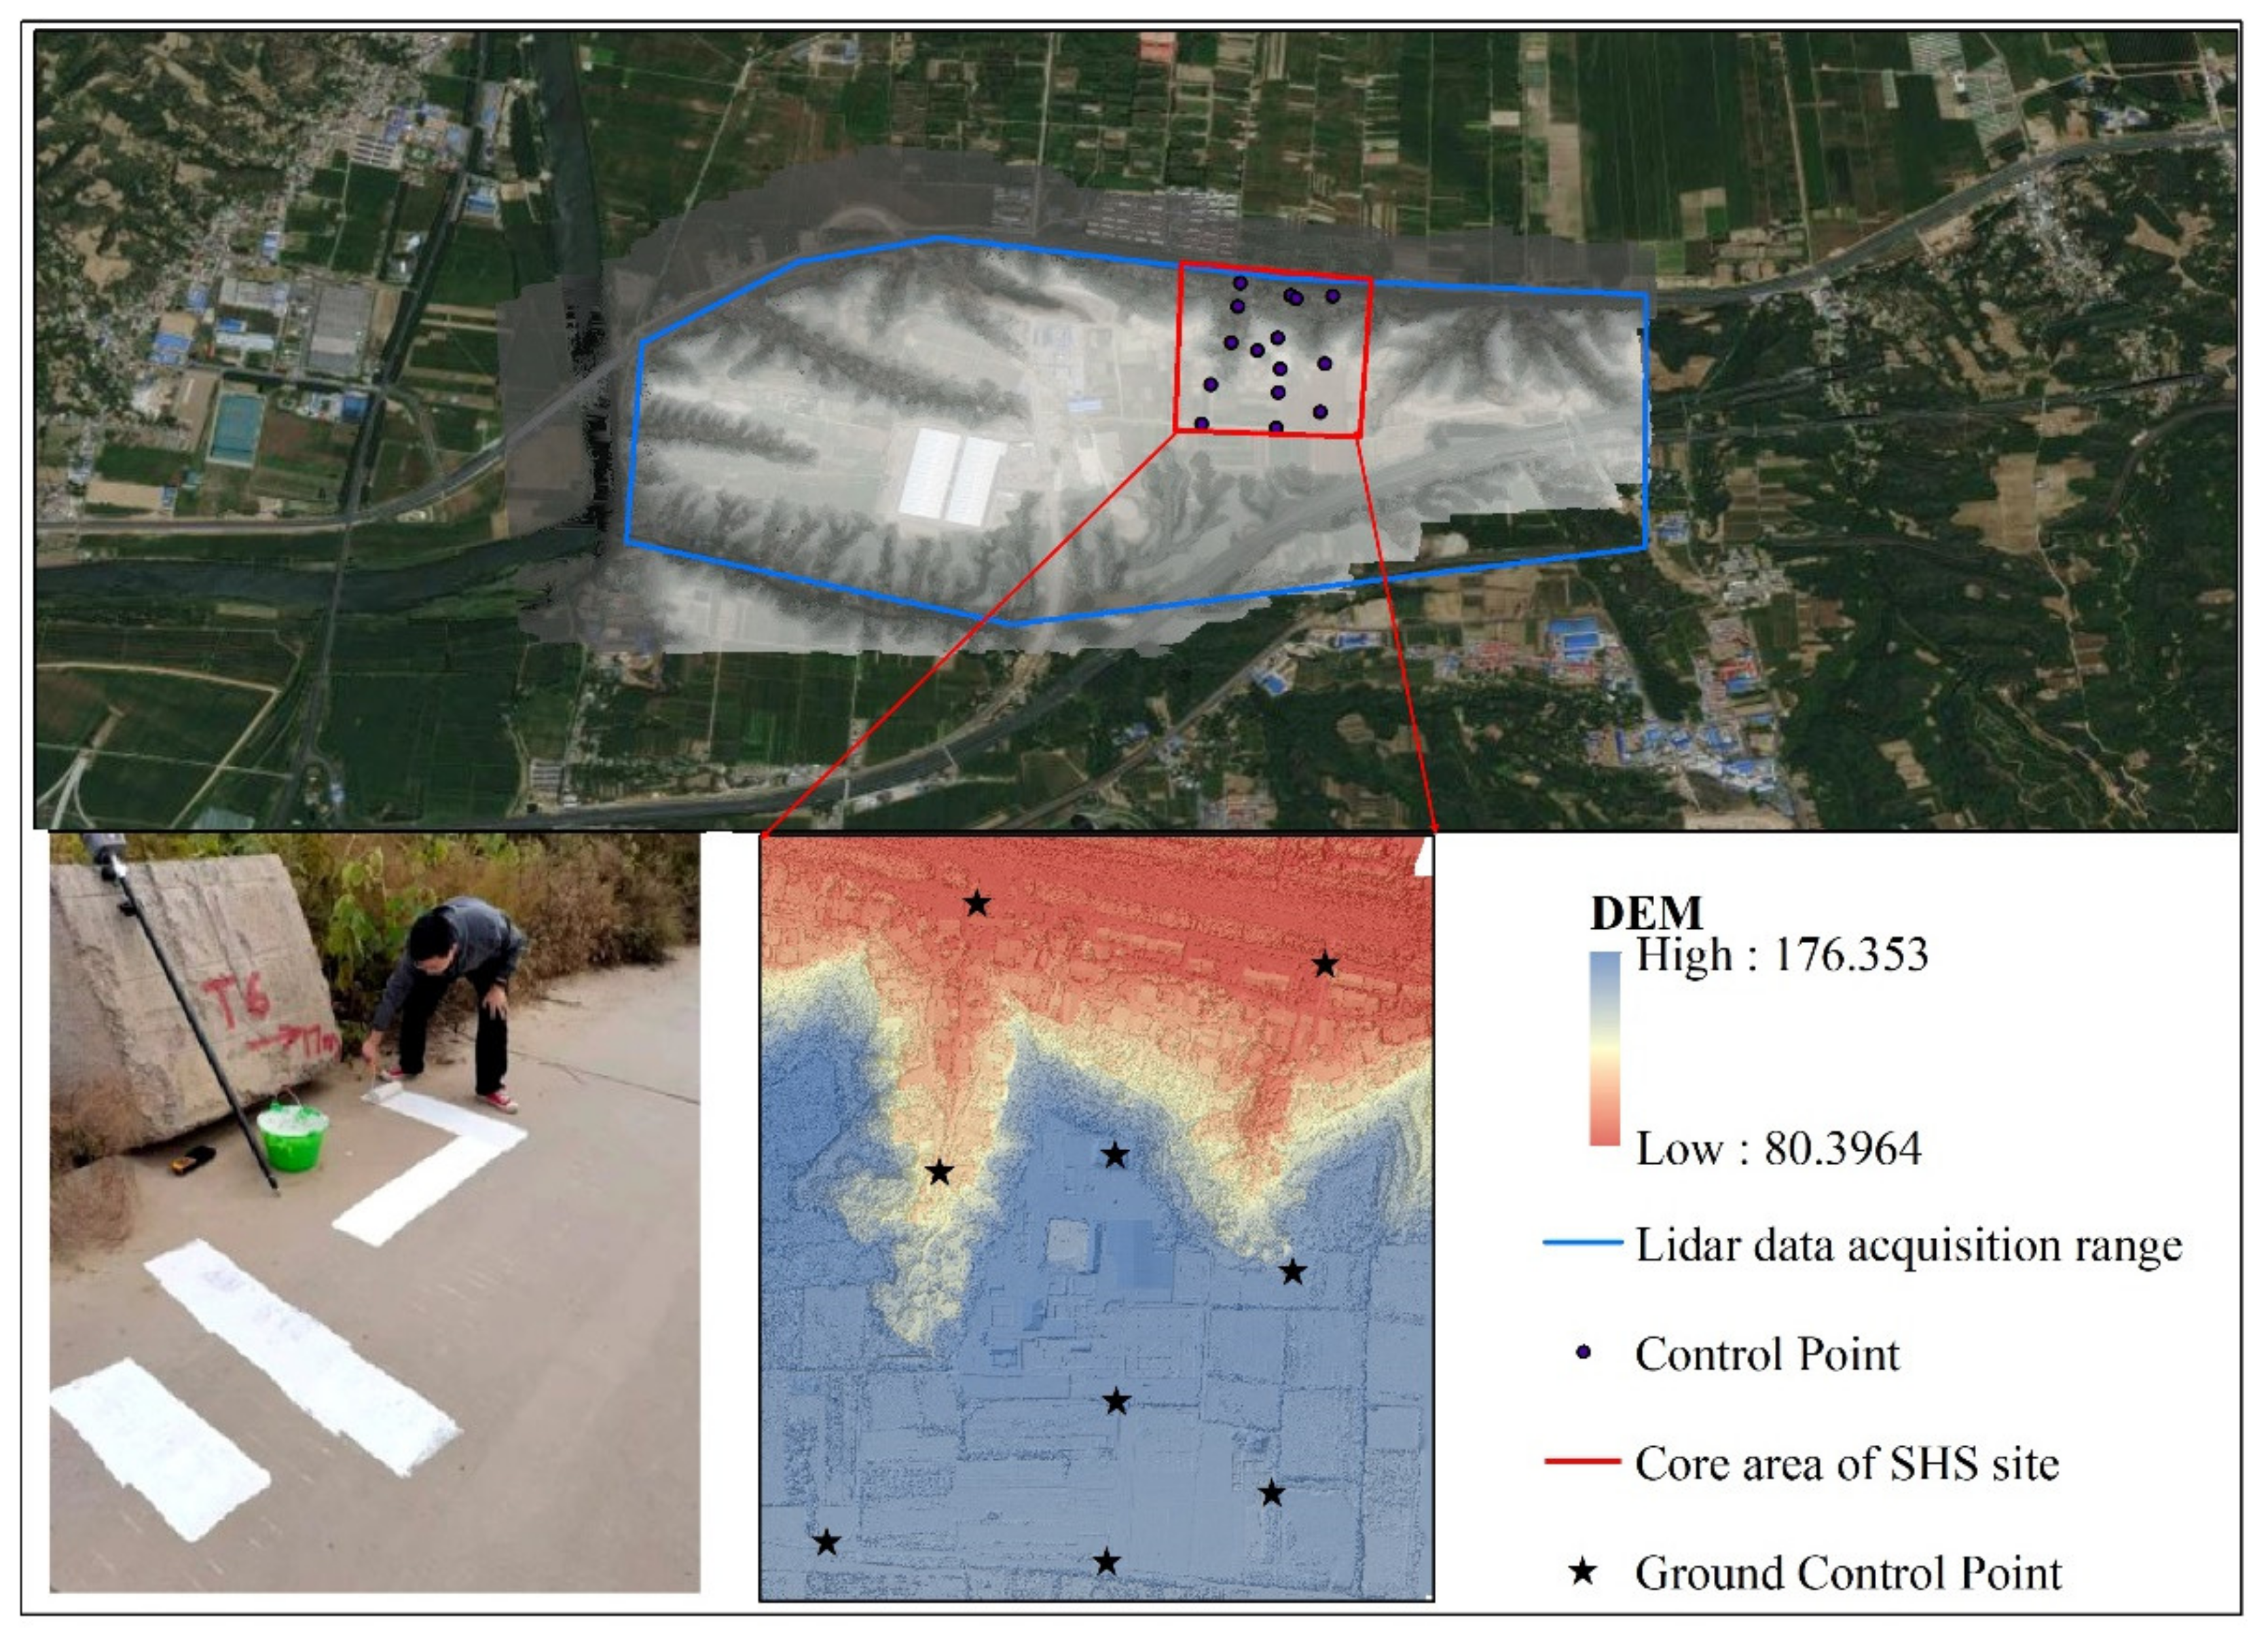
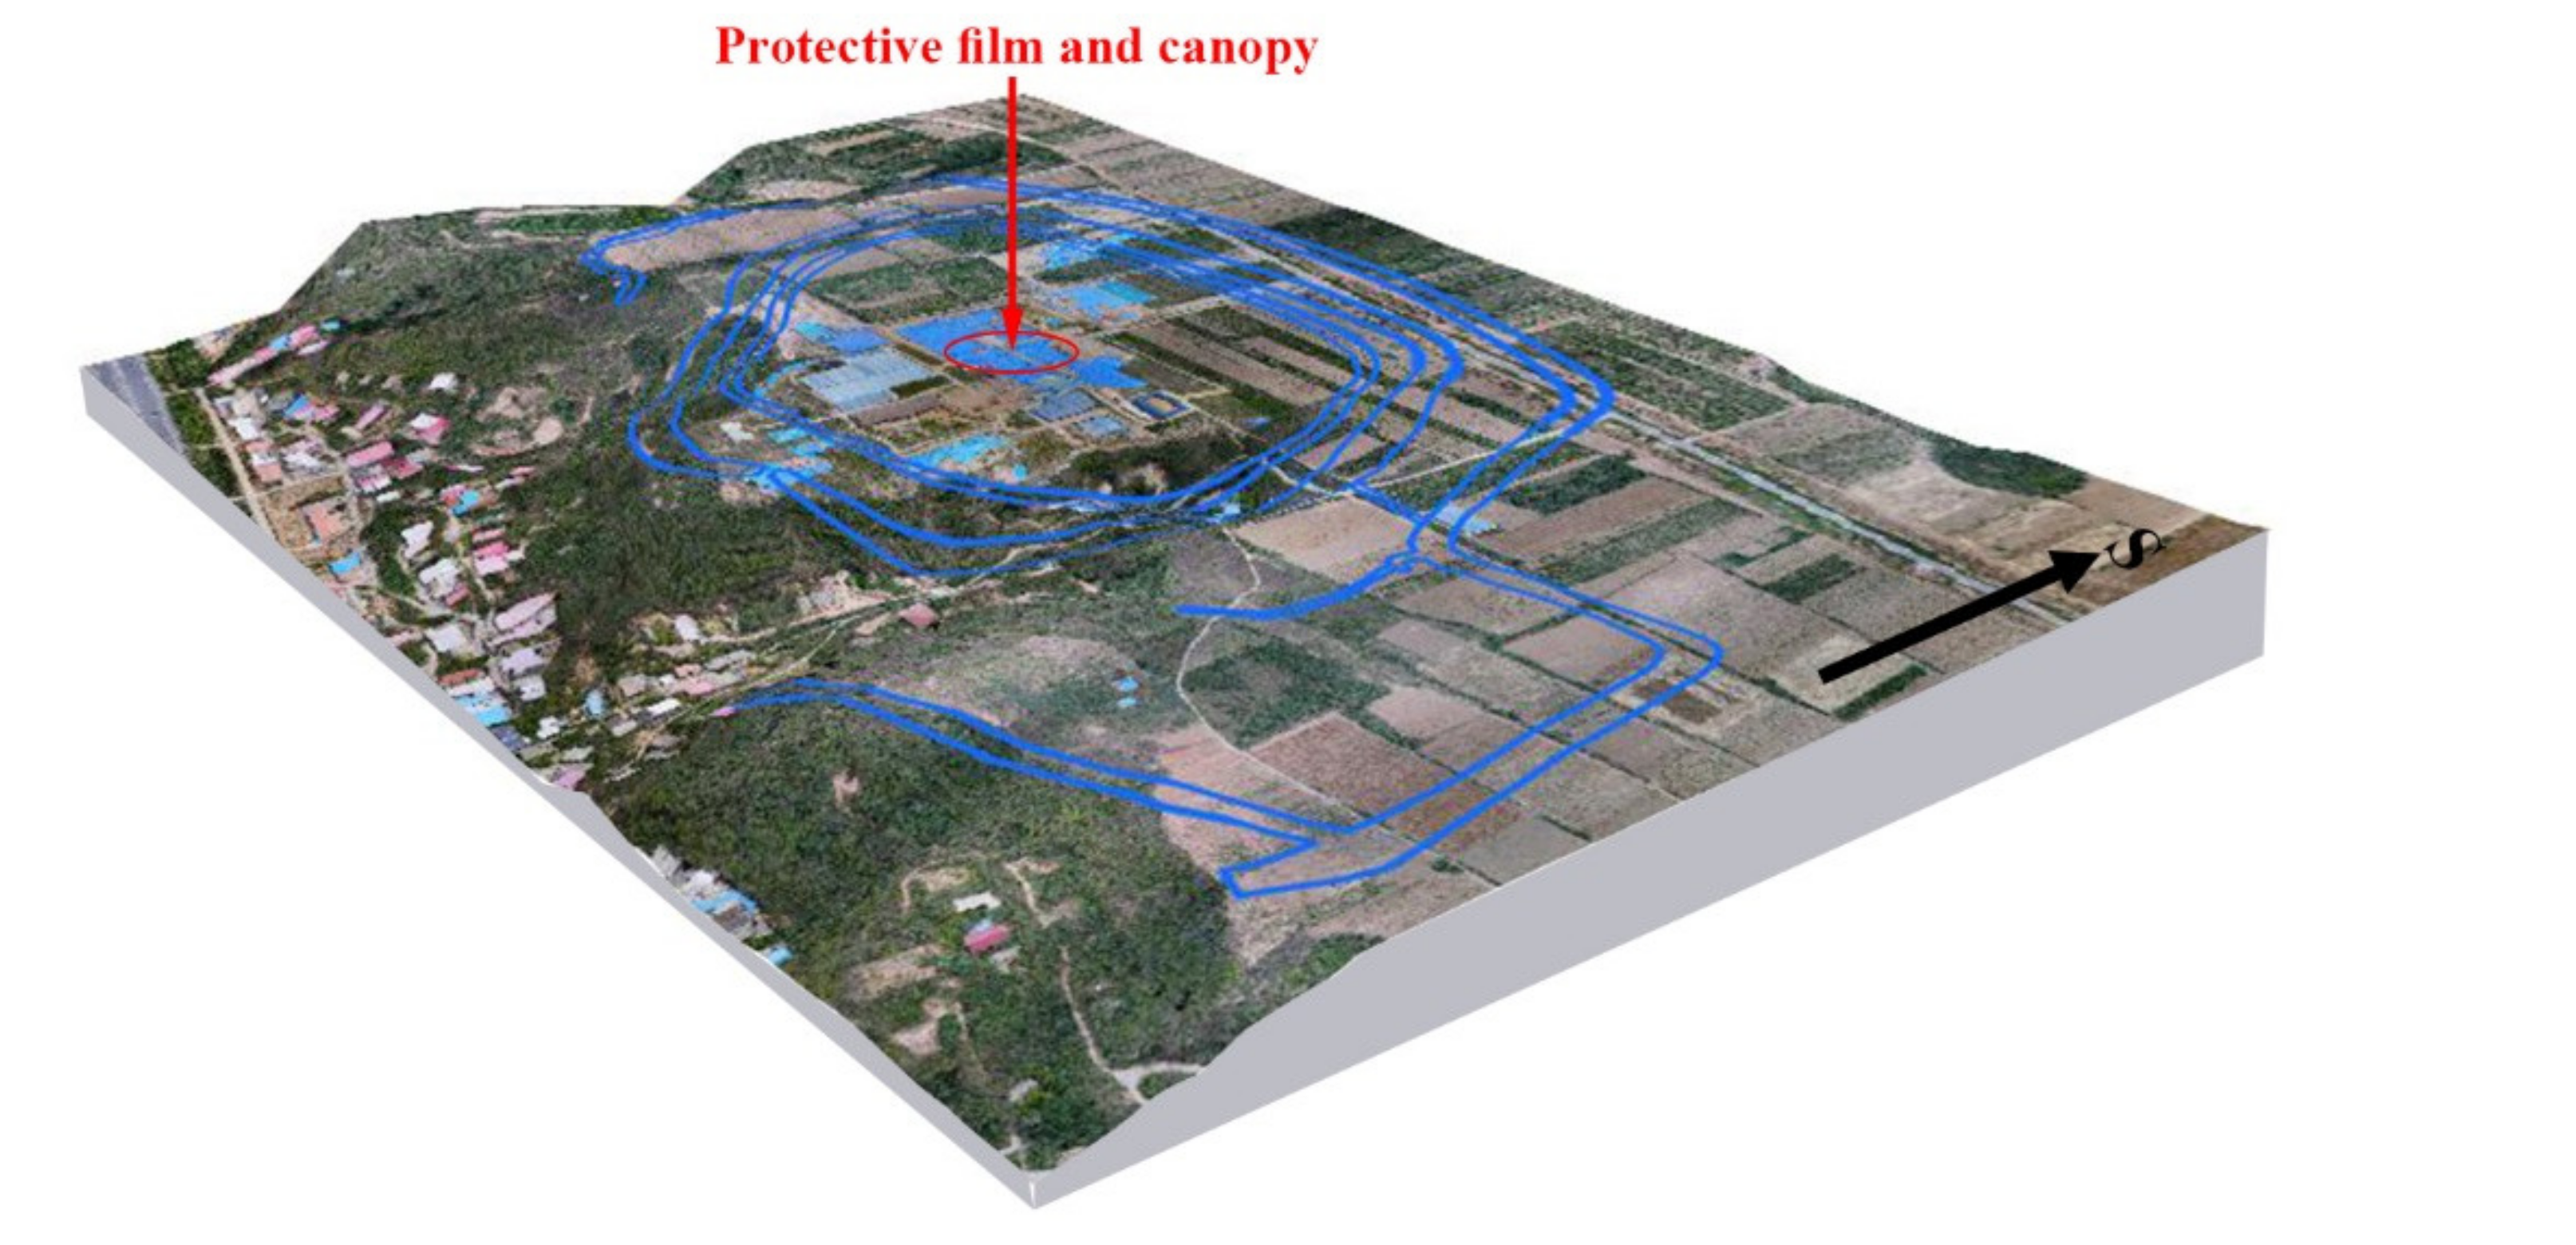
2.2.1. Acquisition and Processing of Surface 3D Information for the SHS Site

To obtain information on the environment surrounding the site, we collected CORONA images from the Declass 1 dataset of the United States Geological Survey (https://earthexplorer.usgs.gov/, accessed on 10 January 2022) for the years 1960–1970. The resolutions of the images were 1.8 m and 7.5 m according to their widths. In addition, the Google Earth Engine (GEE) platform was used to collect Landsat multispectral images and multiscale DEM data products for the SHS region. The collected images include Landsat 5 and 8 images from 1980 to 2020 with a spatial resolution of 30 m, Advanced Spaceborne Thermal Emission and Reflection Radiometer (ASTER) Global Digital Elevation Model V002 data with a spatial resolution of 30 m, and Advanced Land Observing Satellite Phased Array type L-band Synthetic Aperture Radar (ALOS PALSAR) data with a spatial resolution of 12.5 m.
At the SHS site, high-resolution aerial photography was conducted using a DJI Genie RTK UAV (Manufactured by Shenzhen Dajiang Innovation Technology Co., Ltd, Shenzhen, China)and a Feima multirotor UAV D20 (Manufactured by FEIMA ROBOTICS, Shenzhen, China, equipped with DV-Lidar20). The spatial resolution of the DJI Genie real-time kinetic (RTK) UAV data was 4 cm, the spatial resolution of the airborne LiDAR UAV data was 4 cm, and the point cloud accuracy was within 5 cm (Table 1). Figure 3 shows the Flight route of the Feima UAV. The 2000 National Geodetic Coordinate System (CGCS2000) was used to obtain orthophotos and high-precision DEMs of the site. LiDAR data were used to produce high precision ground DEMs of the SHS site area, and photogrammetry point cloud data were used to generate orthophotos and DEMs of the core excavation area.
In this study, LiDAR360 software was used to import lidar data covering the SHS site, and the different ground classes in the aerial images were interpreted manually. Nonground points were removed using Lidar360’s internal deep learning integration module. The process was (1) manually labelled ground and nonground point samples, (2) imported training samples and used the random forest algorithm. The “parameters” section: the maximum building scale was set to 20 m, the iteration distance was 1.4 m, the maximum terrain slope was 88 degrees, and the triangle construction was stopped when the side length was less than 1 m. (3) The module was run to filter out the nonground points. From this we obtained highly accurate ground DEM data with an error of better than 5 cm. The image-based 3D modelling method uses ICP algorithms to achieve image alignment and TSDF surface fusion to fuse the images captured by the UAV HD camera into a global 3D model. The workflow of using PhotoScan (Manufactured by Agisoft LLC, St. Petersburg, Russia).to generate the ground model is as follows. (1) Laying control points. The aerial survey adopts “L” type mark as the image control point. The length of the figure is 80–120 cm. The width is 15–20 cm. When collecting coordinates in the “L” type image control point marked right-angle cross positive, the coordinates are collected at the centre of the right-angle intersection of the “L” markers, and the image control points are laid on the smooth road surface with no obstructions around and overhead. Twenty to twenty-five image control points are laid in each area, including three to five check points. (2) Image extraction: the camera is used to acquire aerial images of the double locust tree area and import them into PhotoScan. (3) Image preprocessing: the acquired images of the study area are processed through denoising and other processes to improve image accuracy, and then transformed into point cloud information. (4) Point cloud alignment: the attitude relationship between the two frames is determined based on the point cloud data of the two frames, and the imaging points of the control points in different images are corresponded. (5) Surface fusion: with a more accurate matching result, combined with the internal and external parameters calibrated by the camera, modern 3D scene information can be recovered. The accuracy report for the core excavation area of the SHS site shows that the flying altitude of DJI Genie RTK UAV is 132 m, the coverage area is 0.577 km2, the ground resolution is 3.22 cm and the reprojection error is 1.64 pixel. By comparing with the position of the control point, the estimated error is 3.43 cm. The DEM resolution after reconstruction is 6.44 cm. A 3D orthomosaic model of the SHS site was generated by aligning the point clouds with the image control points, with the accuracy of 8 cm. The generated DEM and digital surface model (DSM) were clipped to obtain a model of the SHS site. Figure 4 shows the location and coverage of the camera, and Figure 5 illustrates the process of our data collection and processing.

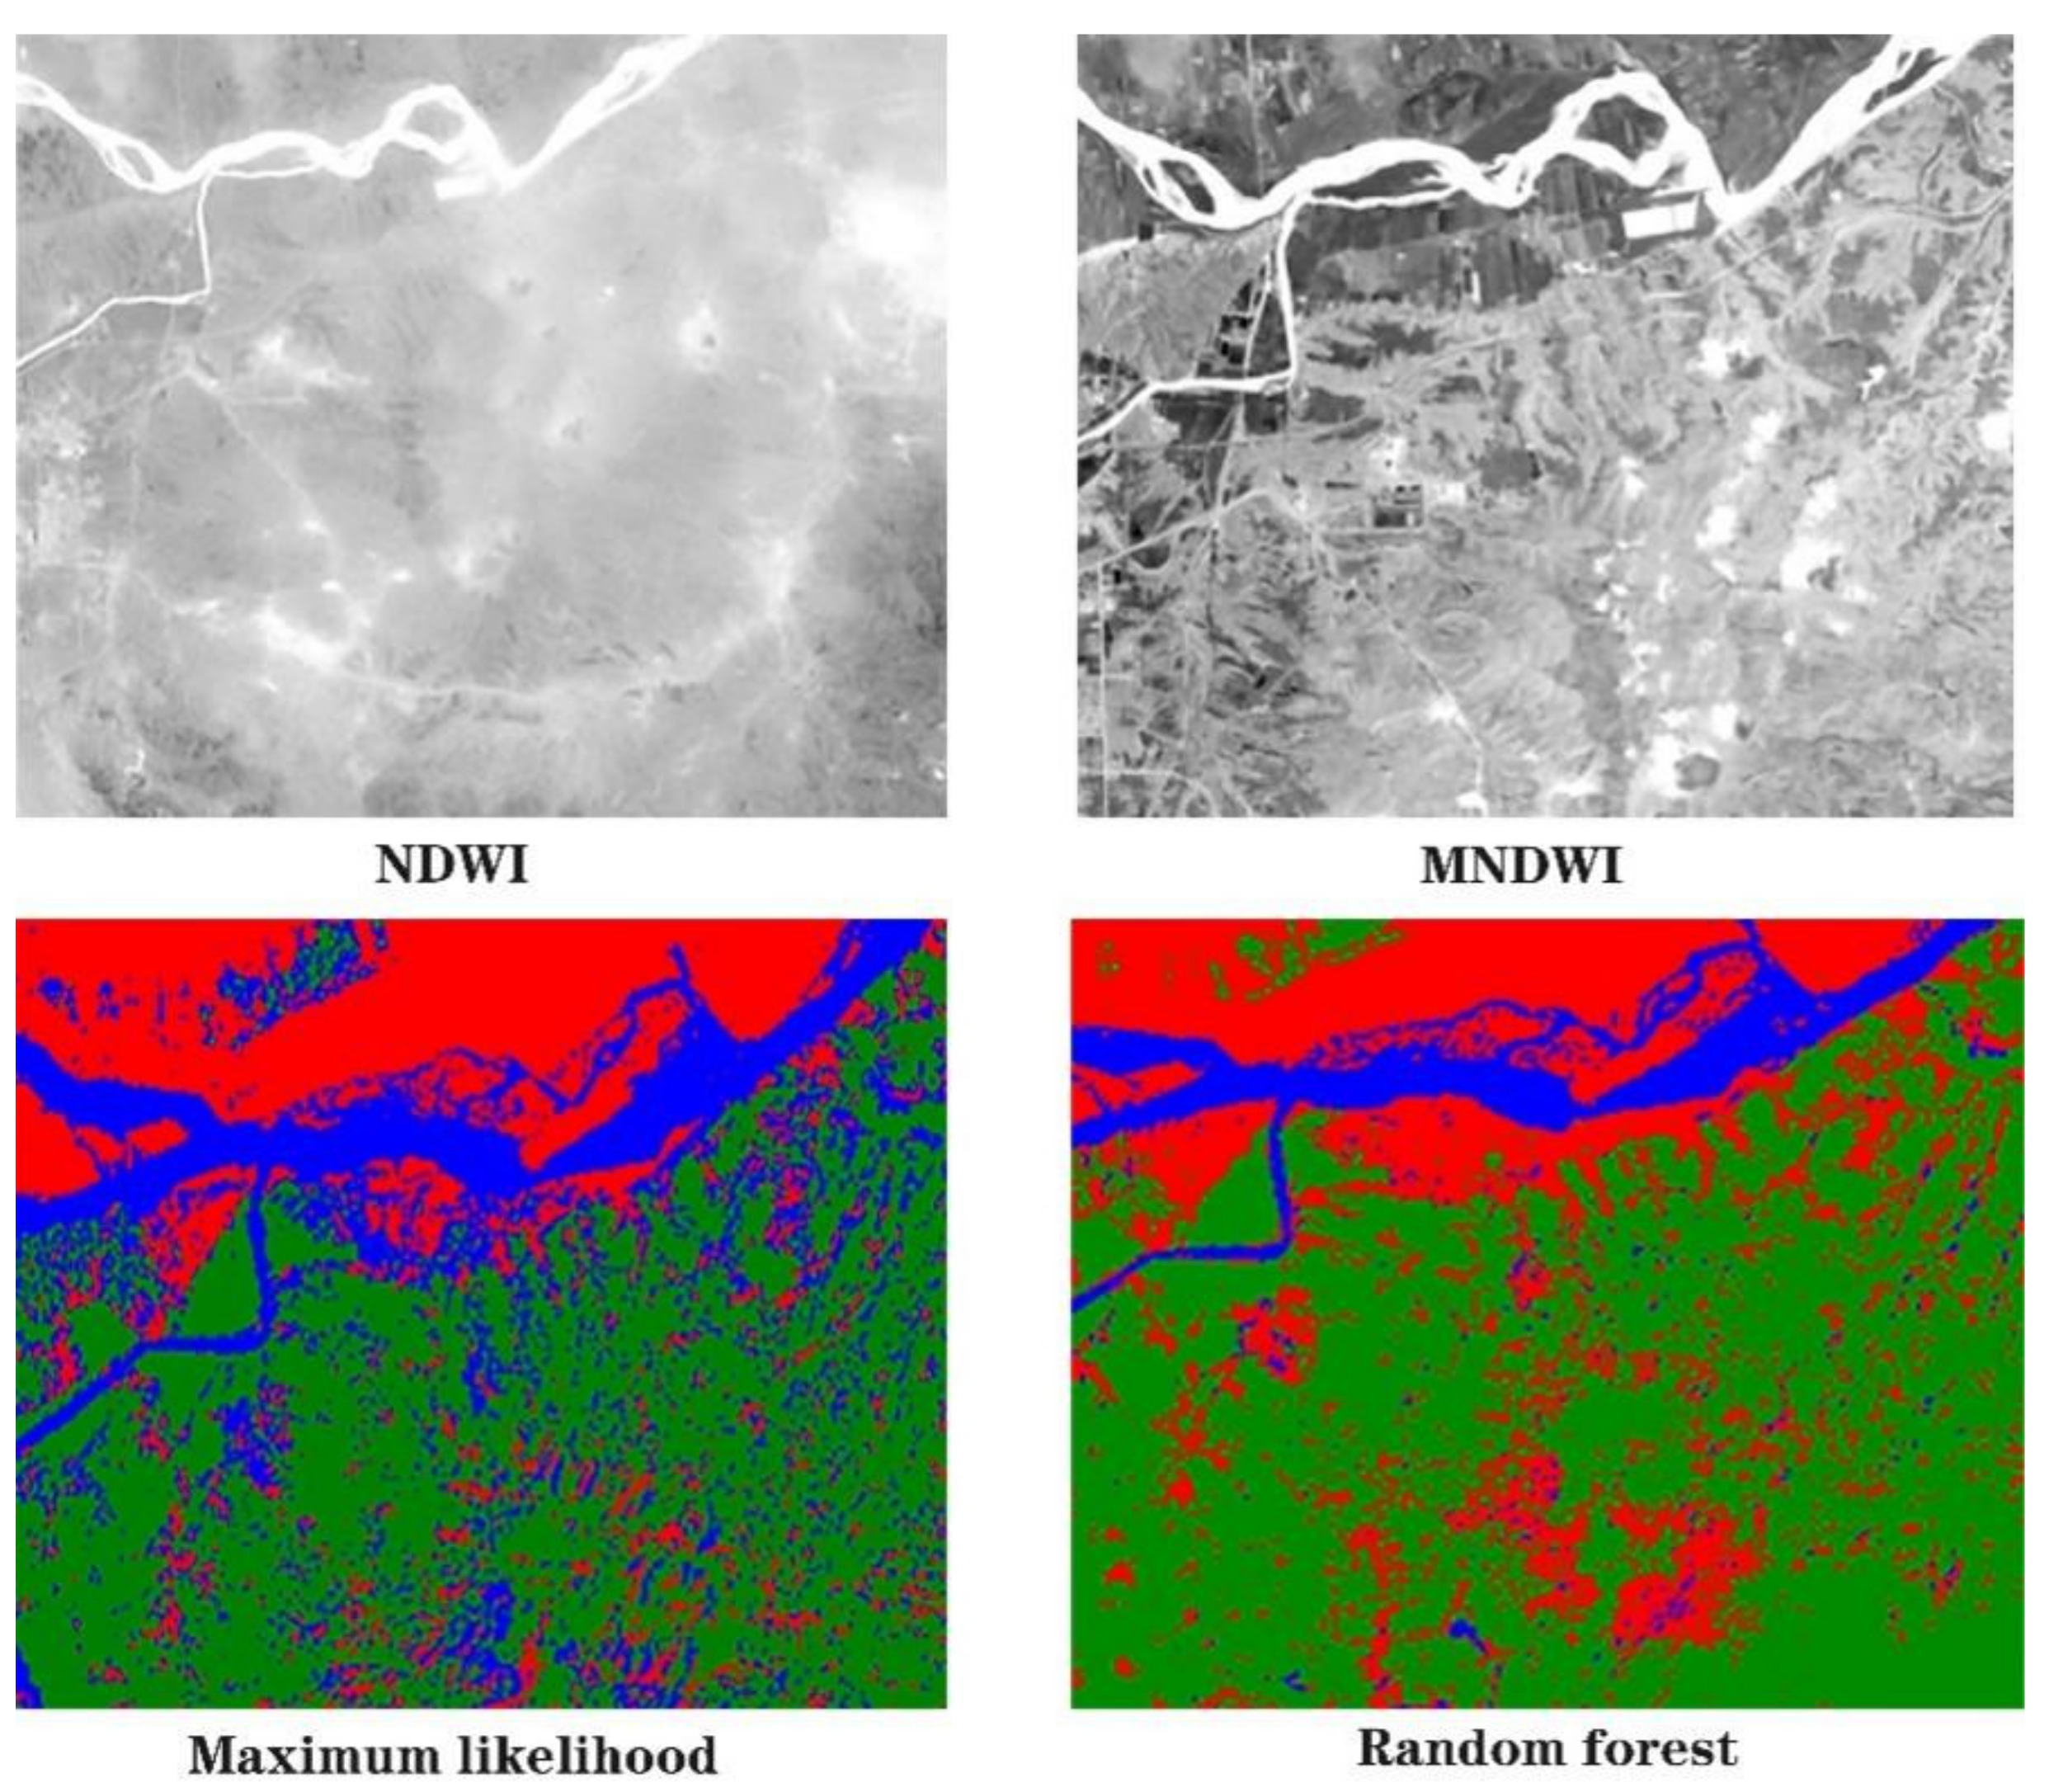
2.2.2. Edge Information Extraction for the Yellow River at the North of the Site

The northern part of the site is affected by changes in the Yellow River channel. To analyse the effects of erosion from the Yellow River on the platform, satellite images from 1960 to 2020 were used to extract information about the southern edge of the Yellow River Channel, which is closest to the site, and analyse the distance relationship between the southern edge of the Yellow River and the site over the past 60 years. In view of the exposure of bedrock and geomorphic changes around the site, we can speculate that the platform at the site changed during the Yangshao period.
As the CORONA images from 1960 to 1970 do not contain spectral information, it is impossible to extract early river edges from conventional water indexes. In the images, the Yellow River is widely distributed, has strong morphological features and is obviously different from its surroundings; therefore, the image edge extraction algorithm was used to extract the edges and then vectorize them to determine the variation in the shortest distance between the Yellow River and SHS site in the 1960s and 1970s. The commonly used edge extraction operators are the Sobel, Roberts, Prewitt, Canny, Laplacian of Gaussian (LOG), and Canny of Gaussian (COG) operators [64]. Among these operators, the Sobel, Roberts, Prewitt, and Canny operators are not well balanced between noise and edge extraction accuracy. The LOG operator has better scale characteristics than the other operators and has both filtering and edge detection for a detected image, which can ensure a better balance between detection and localization errors. The COG operator introduces a Gaussian filtering function, which has a significant noise suppression effect, is sensitive to pseudoedges, and provides more refined detection results [65,66].
The calculation process of LOG is as follows:
g ( x , y ) = 1 2 π σ 2 exp x 2 + y 2 2 σ 2 H ( x , y ) = 2 g ( x , y ) × f ( x , y ) 2 = 2 x 2 + 2 y 2
where the original image is f(x,y), σ is the standard deviation, g(x,y) is the Gaussian function and 2 is the Laplacian operator. Before the Laplacian operation, the image is usually smoothed with a Gaussian smoothing filter to reduce the sensitivity of the Laplacian operation to noise and to prevent multiple smoothings and false extraction of edges.
The calculation process for the COG operator is as follows:
R ( x , y ) = g ( x , y ) f ( x , y ) G ( x , y ) = R x ( x , y ) 2 + R y ( x , y ) 2 θ = arctan R y ( x y ) R x ( x , y )
As shown in Equation (2), f(x,y) is the original image, R(x,y) is the Gaussian-smoothed image, and G(x,y) and θ are the gradient amplitude and direction of the smoothed image, respectively. Gaussian filtering of the greyscale image before determining the computed gradient and direction of the Canny operator can improve the sensitivity of the operator to the edges of the Yellow River and suppress noise at the same time.
For Yellow River water extraction from 1980 to 2010, a series of Landsat images was used. Based on the spectral information and morphological and other features in the images, we used the normalized difference water index (NDWI), the modified normalized difference water index (MNDWI), the maximum likelihood method and random forest to extract the edge information of the Yellow River water bodies. MNDWI and NDWI are ratio indexes that rely on the characteristics of river water in multispectral bands (such as the highest and lowest reflectance bands); the differences among land cover types are emphasised by the ratio, with the brightness of water bodies enhanced to their maximum value, while background features are suppressed in processed images [67,68]. The maximum likelihood method is important in supervised classification. In this method, labelled training water samples are extracted, a feature vector is obtained, and the discriminant function is used to divide each pixel point. Supervised classification of Landsat images used the maximum likelihood method in ENVI 5.3, which is as follows. (1) We define of the training samples. Selecting pure water body image elements is key to the extraction of water bodies. (2) We evaluate the separability between samples. A separability value greater than 1.8 between all features indicates good separability between categories and allows for supervised classification. We select water bodies, bare ground and grassland with a separability of 1.9. (3) The supervised classification tool is selected in the toolbox and the method is determined to be the maximum likelihood method. We select all categories and set the maximum stdev to 10. (4) We postprocess the classified results and fix unclassified and misclassified categories. (5) We evaluate the classification results using the confusion matrix. The confusion matrix showed the overall accuracy, kappa coefficient, misclassification error, omission error etc. of the classification. Random forest is a categorical classification method. This method uses multiple decision trees for training and to make predictions. Its advantages are fast training speed, high precision and limited overfitting [69].
The NDWI is calculated as follows:
N D W I = ρ Green ρ NIR ρ Green + ρ NIR
In Equation (3), ρ Green represents the reflectance of the feature target in the green band, and ρ NIR represents the reflectance of the feature target in the near-infrared band.
The MNDWI is calculated as follows.
M N D W I = ρ Green ρ MIR ρ Green + ρ MIR
The NDWI takes into account only the distinction between vegetation and water bodies and ignores the similarities between soil, buildings, and water in the green and near-infrared bands. MNDWI enhances the gap between water bodies and buildings by replacing the near-infrared band with the mid-infrared band (Equation (4)).

2.2.3. Collation of Early Environmental Indicator Data from the Site Area

The species and quantity of sporopollen are good indicators of the climatic background of a site. Numerous scholars and research institutions have used environmental archaeological techniques to analyse sporulation and other environmental indicators around sites. For example, the Dahecun site, located 53.6 km to the east of the SHS site, is one of the important archaeological discoveries in China in the last century; this site has a long historical span (approximately 6800–3500 aBP) and thick accumulation in the cultural layer. The results of sporopollen analysis can serve as an important reference for natural environmental changes in the area of the SHS site. The sporopollen profiles of 11 sites around the SHS site were collated and used as references for the recovery of landscape changes in the historical natural environment in the SHS site area (Figure 6).
The comprehensive analysis of the environmental indicators in the profiles collected from around the SHS site (Table 2) show that the area entered the Yangshao period from 8000–6000 aBP. This period, which had the optimal conditions, was characterised by a warm and humid climate, and the climate conditions deteriorated in the later stage of the Yangshao period. From 8000–6000 aBP, tree pollen dominated the profiles but semihygrophytes and aquatic plants begin to appear, and there was a large area of water. The landscape was dominated by deciduous broad-leaved forest. From 6000 aBP to 5000 aBP, the climate gradually changed from warm and wet conditions to dry and cool conditions, which characterised the late Yangshao period. Among the sporopollen analysed, the tree species consisted mainly of pine, the proportion of grass was lower, and aquatic plants were present. Therefore, at approximately 5000 aBP, the vegetation at the SHS site consisted mainly of pine trees and aquatic plants. Cedar and Pinus tabulaeformis, representative plants in Central China (e.g., at the Laojunshan scenic spot in Luoyang city, Henan Province), were selected as the typical vegetation of the SHS site. The natural landscape was modelled in Lumion 10.0.

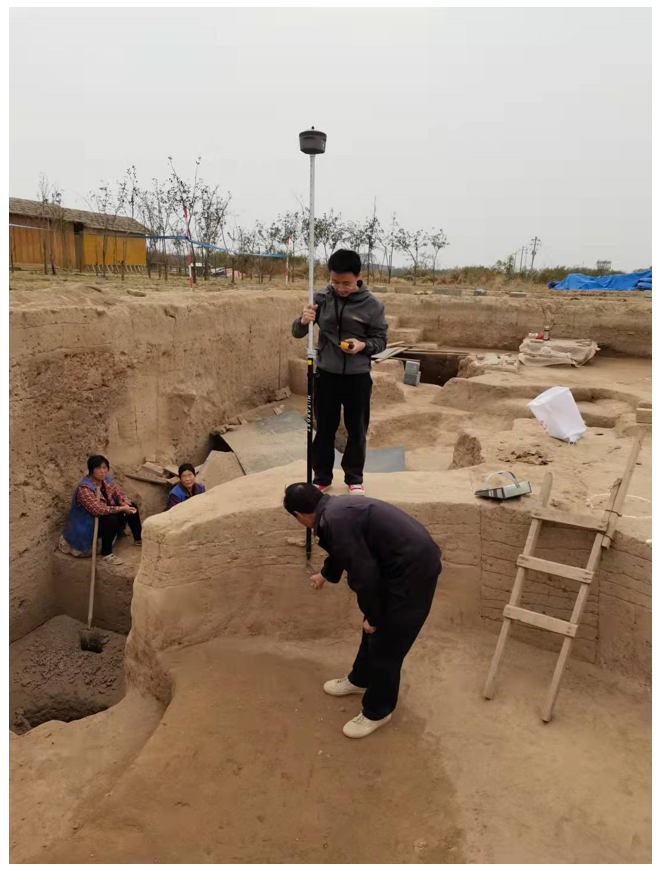
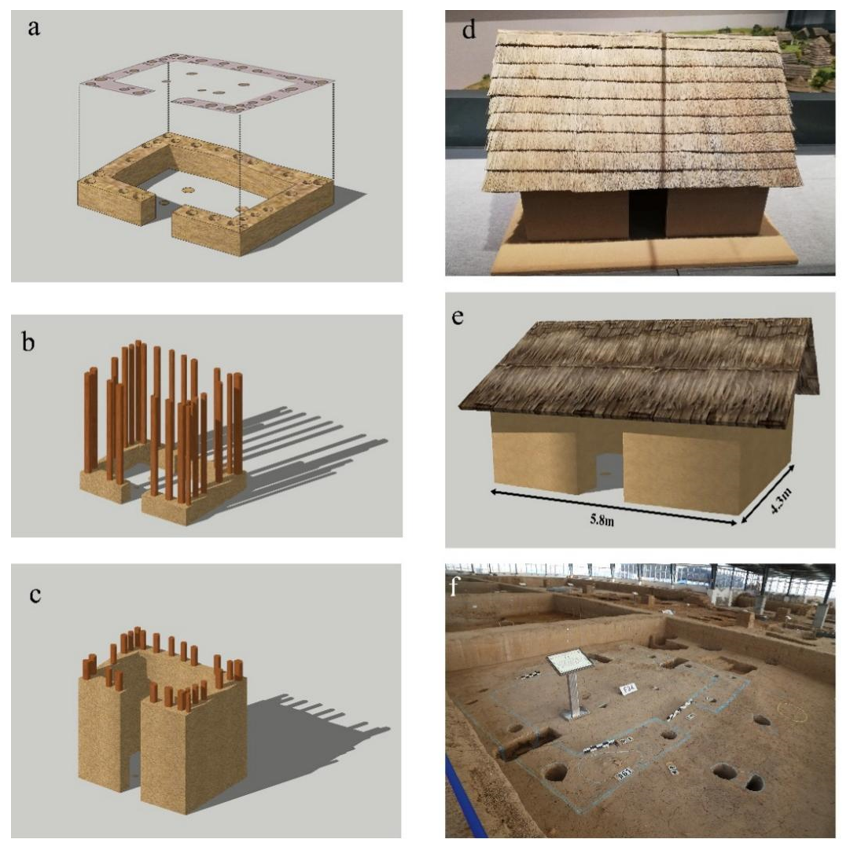
2.2.4. Field Mapping and the Construction of a House Site Model at the SHS Site

To obtain paleotopographic information, GPS and total station mapping were used to obtain elevation information of early strata based on natural profiles and some ancient strata exposed through excavation. Because the elevation point information in the study area is spatially discrete, an interpolation algorithm was applied to recover the paleotopography. The number of sample points collected in this study was small, and the samples were mainly clustered in the excavation area. Adopting a machine learning algorithm would make it difficult to take into account all the topographical features of the site area and achieve global optimality [88]. For this reason, the classical interpolation algorithm, inverse distance weighted (IDW) interpolation, was used to establish the early topographic information of the region.
Z ( x 0 ) = n i = 1 w i Z ( x i )
w i = d i p n i = 1 d i p , n i = 1 w i = 1
where Z*( x 0 ) is the predicted elevation value at unknown point x 0 ; n is the number of surrounding known points; Z ( x i ) is the true elevation value at sample point x i ; w i is the weight of sample point x i ; di is the distance between the estimated point and the known point, and p is the power of the distance. Figure 7 illustrates the process by which we collected early site strata spatial information.
Feature measurement and virtual model reconstruction of important remains from field archaeological excavations is critical. First, the key points and inflection data of the house shape in the central residential site and rammed earth foundation area were collected by using GPS and field stations (Figure 8). ArcMap 10.7 was used to create a vector map of the house site to determine its location and measure its length and width. Then, based on relevant references (e.g., [50]) and restoration models of similar houses (Figure 8), the style and material of the house were determined with appropriately detailed textured materials. Finally, the virtual reconstruction of the site house site was realized in SketchUp Pro 2020 software (Figure 8).

3. Results

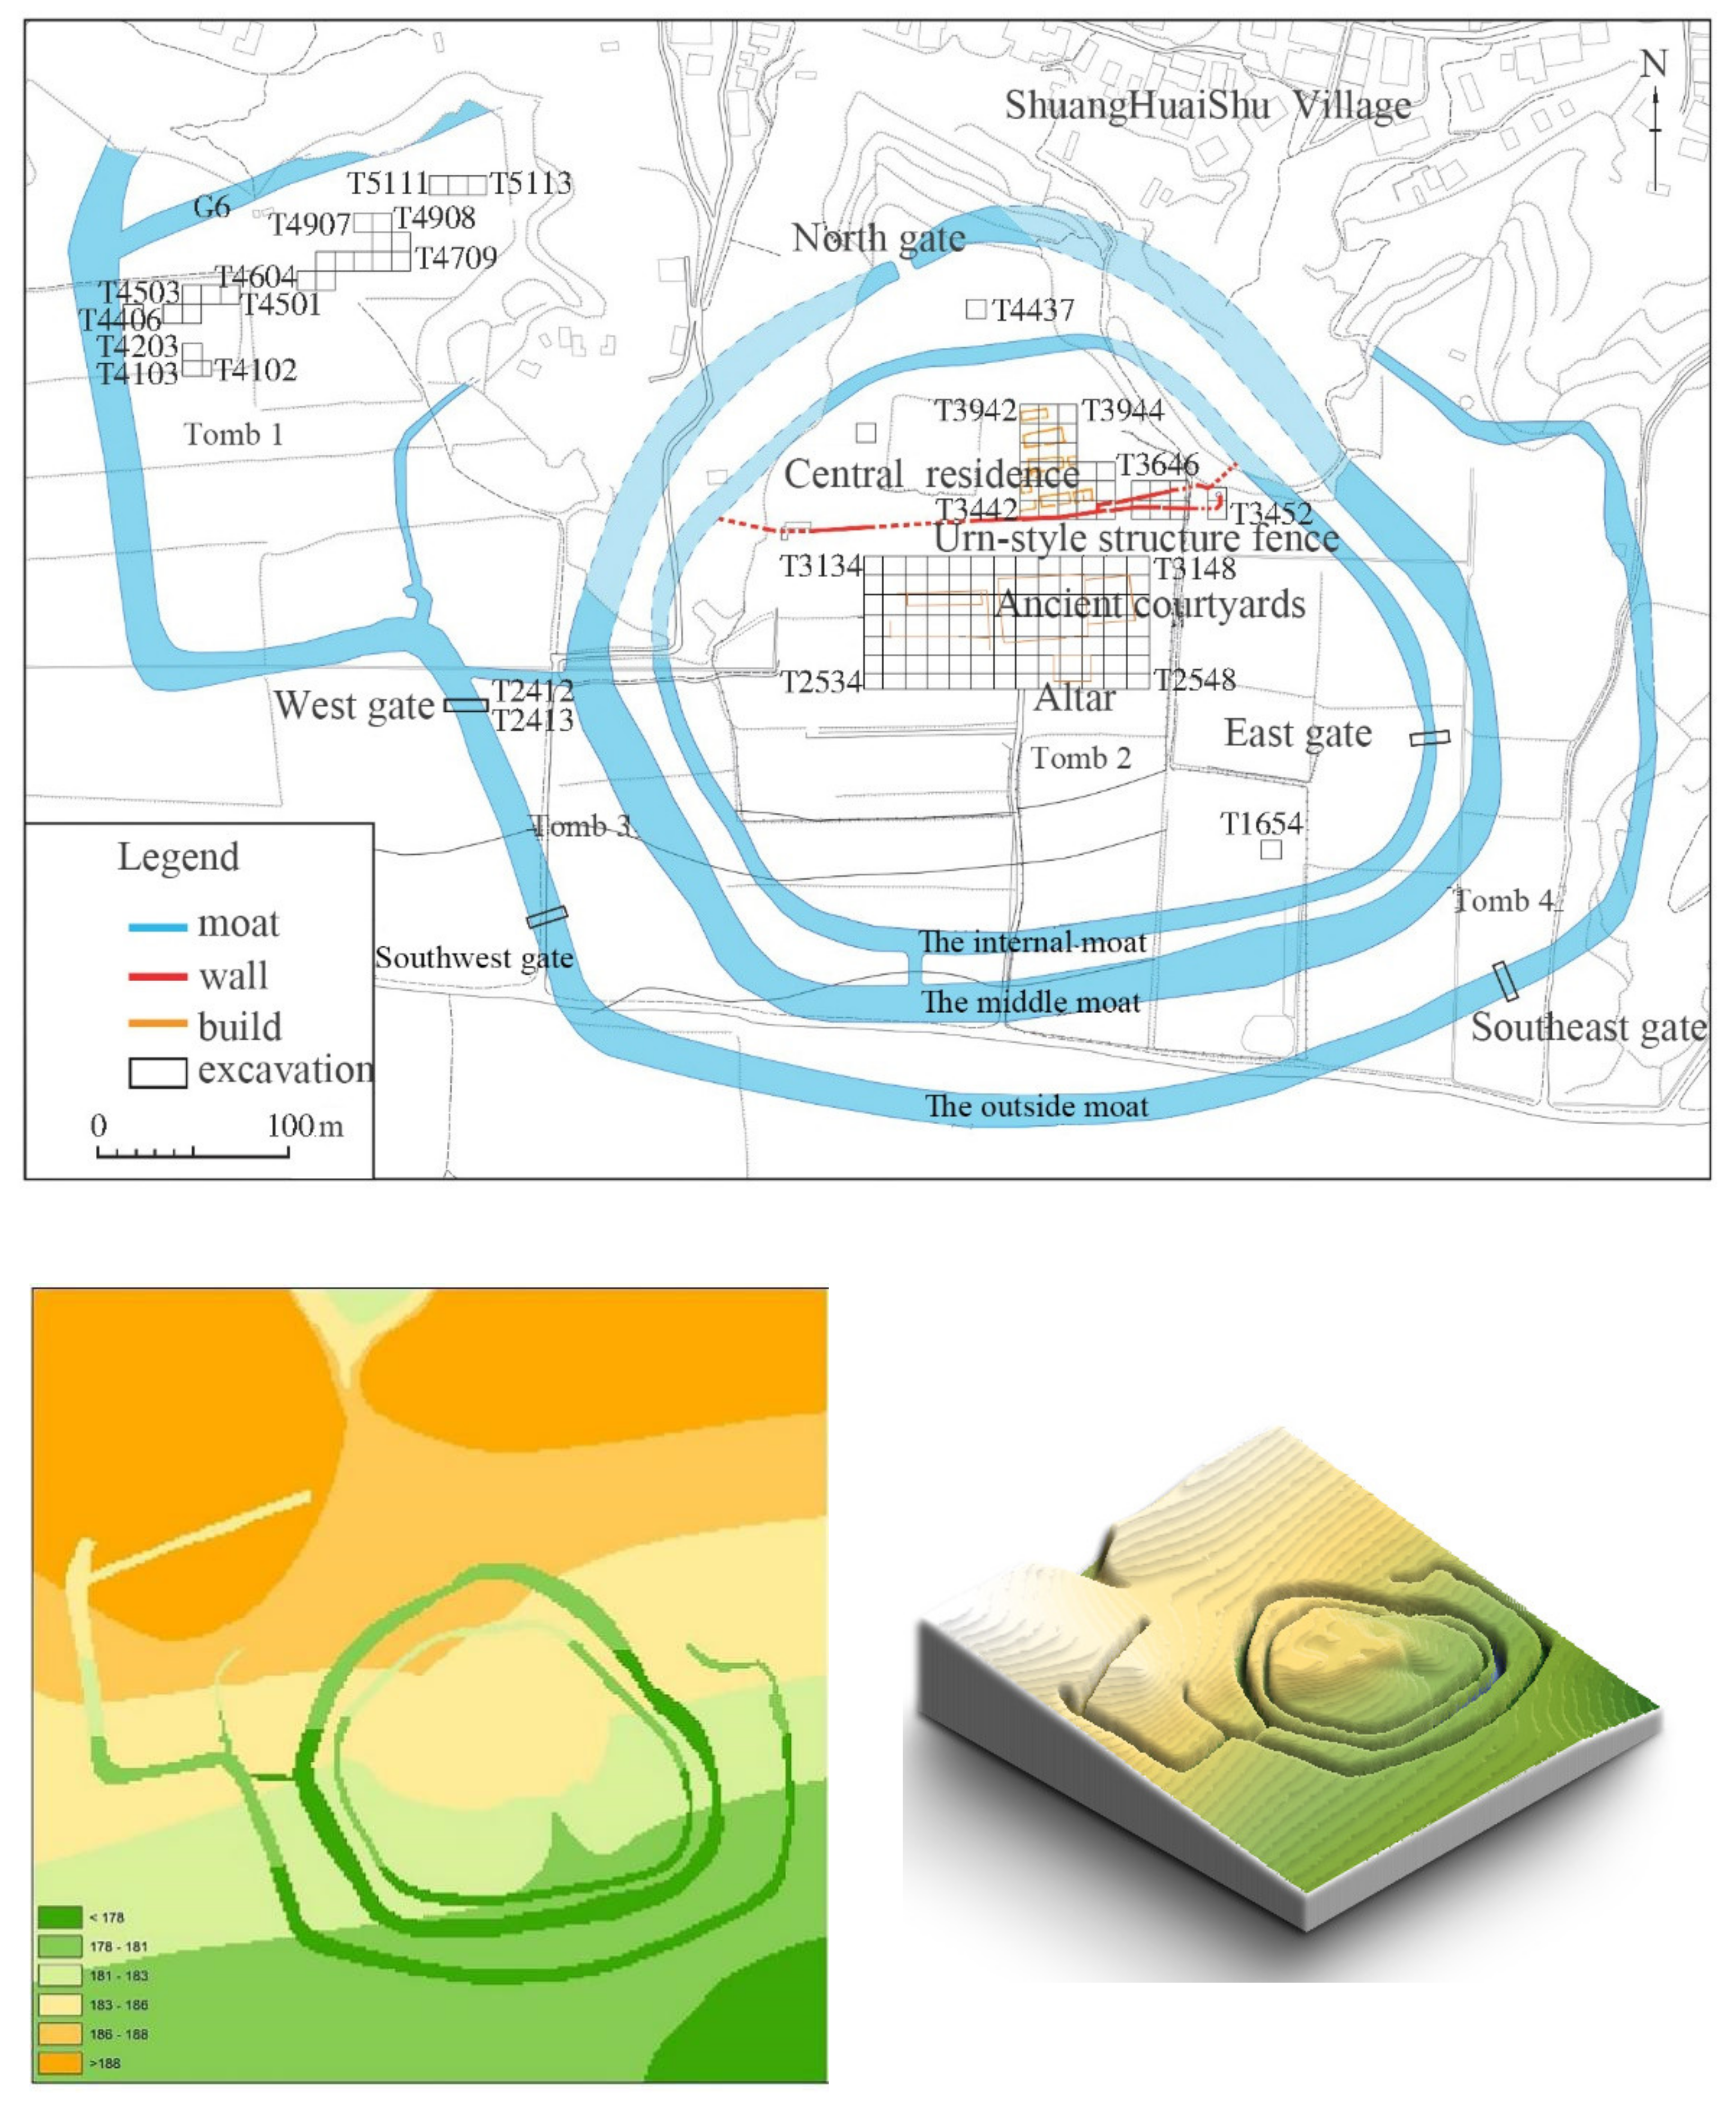
3.1. Modern 3D Landscape of the SHS Site Area

The SHS site is southeast of the confluence of the Yiluo River and the Yellow River and is located on the Loess Plateau. The northern part of the site is a river valley formed by the Yellow River and the Yiluo River. Based on the results of the environmental archaeological field survey and related materials (Figure 9), the line from the Meng Zhai ridge (Mang Mountain) to the SHS site was selected as the profile line, the angle of which was 135°. The site profile demonstrates that the SHS site is located in an area of the Loess Plateau with relatively high terrain. Along the profile line to the east, the terrain gradually rises, and the landform changes from loess hills to mountain bedrock. Along the profile line to the west, from the floodplain to Mang Mountain, the terrain gradually rises. A small number of loess hills are distributed in the northern part of Mang Mountain, and many parts of the loess hills have exposed bedrock.
The loess terrace where the site is located is 82 m above the Yellow River beach to the north. The core excavation area is approximately 780 m wide from north to south and more than 1200 m long from east to west; the overall terrain of the platform is high in the north and low in the south, with the highest altitude in the north being 192 m and the lowest altitude in the south being 176 m. The excavation area is covered by blue plastic protective film, and a white inflatable canopy covers the site (Figure 10); the remaining area is bare land and cultivated land. Due to the constant erosion by the Yellow River and the Yiluo River, there are many wide and deep loess gullies, some of which are deeper than 30 m. The bottom of the valley is flat, and most of the residential areas are linearly distributed in the direction of the river. Based on the investigation and model analysis of the current landscape, it is believed that the northern landform of the current site is the result of continuous erosion by the Yellow River and the Yiluo River over a long period. In the Yangshao period, the platform area likely extended northwards.

3.2. Distances between the Yellow River and the SHS Site from 1960 to 2020

To extract the Yellow River channel edge data using CORONA images, we compared the edge extraction effects of the Sobel, Roberts, Prewitt, LOG, Canny and COG operators applied in our experiments (Figure 11). The Sobel operator had the worst extraction effect, while the Roberts and Prewitt operators led to rougher edges and the loss of detailed information. The LOG, Canny and COG operators yielded extractions with better details, with the COG operator extracting more complete edge information (Figure 12).
For the Landsat images, we experimentally compared extractions of the Yellow River channel through NDWI, MNDWI, the maximum likelihood method and random forest. The extraction results of NDWI and MNDWI were not good: there was a relatively high level of noise in the extractions and the threshold was difficult to classify accurately. Classification of selected water and nonwater samples showed that extractions made with the maximum likelihood method and random forest were significantly better than those made with NDWI and MNDWI. There was no significant difference between the maximum likelihood method and random forest classification due to the small sample size (Figure 13).
Data obtained from the extraction of the edge of the Yellow River from images of different periods were vectorized and aligned in ArcMap 10.6 to obtain the shortest distance between the SHS site from 1960 to 2020 and the Yellow River (Figure 14). The path of the Yellow River is complex in this section of the SHS site [89]. The distance between the Yellow River and the SHS site fluctuated according to the river path over the last 60 years, with the overall trend being characterised by a greater distance from the site. The Yellow River was farthest from the SHS site in approximately 2004, with a distance of approximately 2675 m. The Yellow River was closest to the SHS site in approximately 1970, with a distance of approximately 512 m. Although it is impossible to infer the distance between the Yellow River and the SHS site during the Yangshao period, it is reasonable to postulate that the Yellow River was once very close to the site. Access to water sources and terrain were quite important factors influencing the locations and survival of early settlements [90].

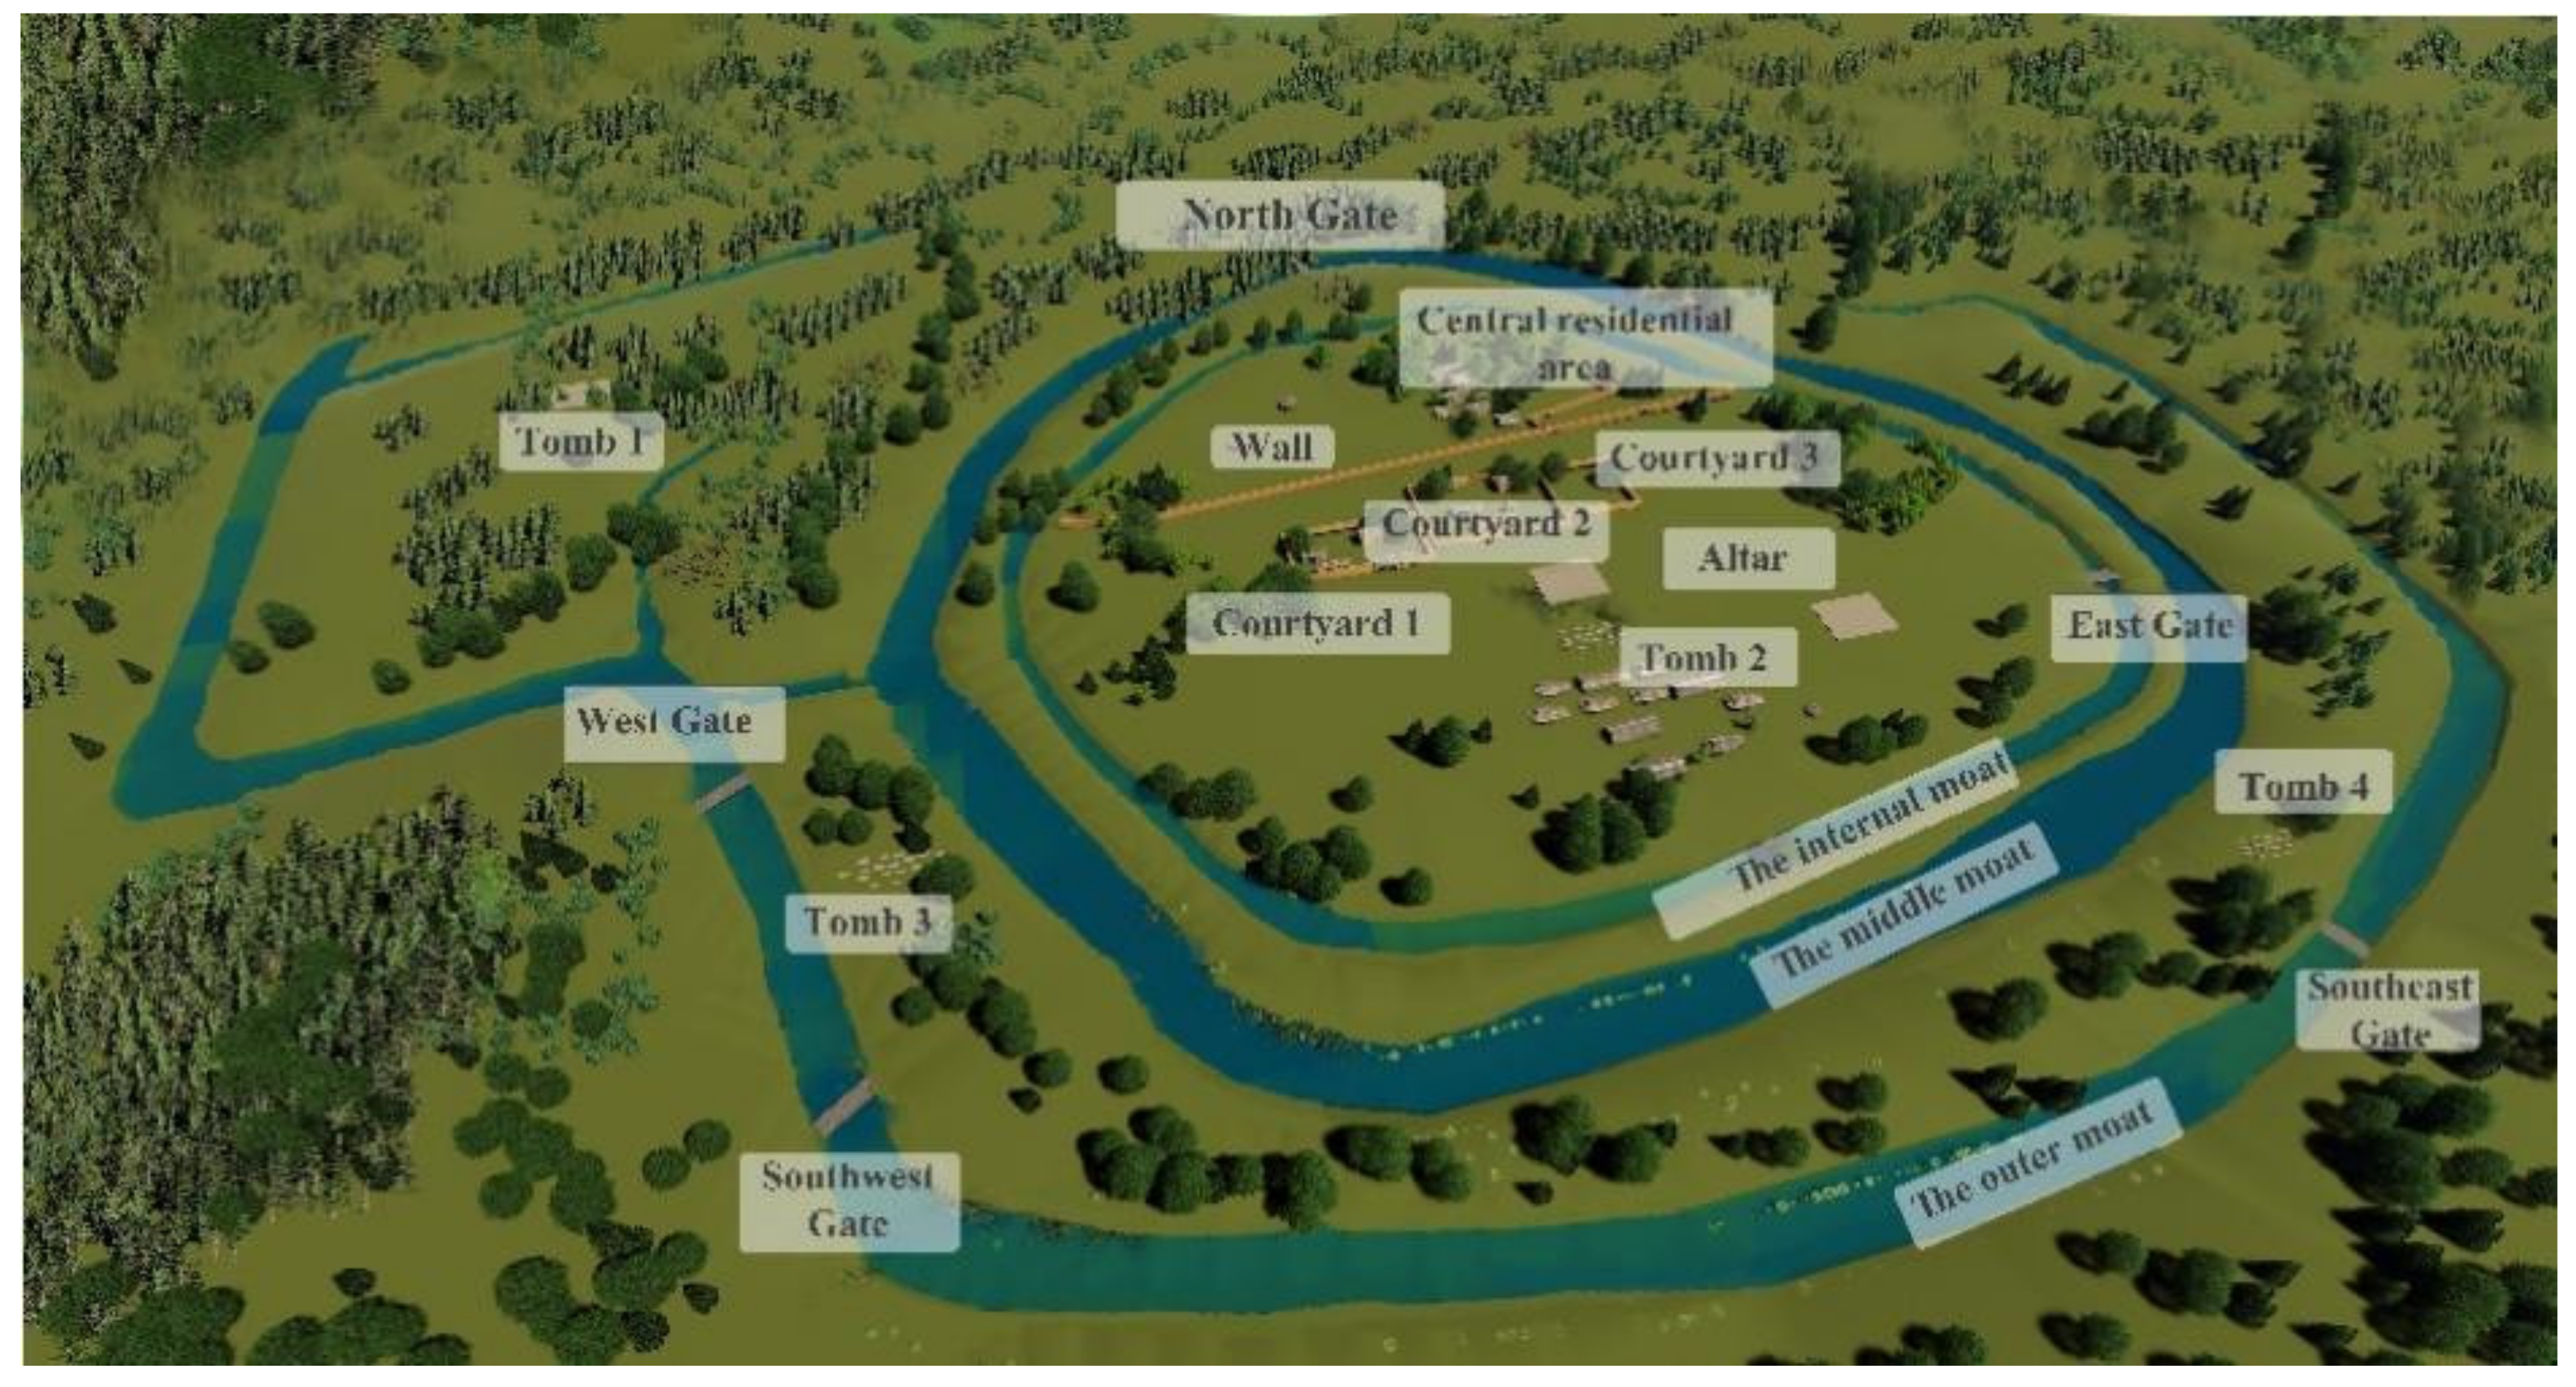
3.3. A 3D Model of the Late Yangshao Period at the SHS Site

As early as the Pei Li Gang period (8500–7000 aBP), inhabitants began to build semicavity shanty house sites, and square houses emerged in the Yangshao period [91]. These house structures have the advantages of being tall, stable, and less likely to collapse. By 5000 aBP, house construction in the settlement area followed a more complicated process, the main steps of which were as follows (Figure 15): First, the ground was rammed and smoothed, the foundation was dug, and grooves were built. Then, numerous wooden pillars were inserted in the grooves at several locations, and the wooden pillars were connected with straw and reeds. Finally, mud was mixed with grass to serve as the wall material, which was then rammed and smoothed [92]. The refinement of house sites, the differentiation of important sites, the selective spatial layout, and the large scale of artificial transformation further indicate the important value of the SHS site in the study of the Central Plains culture and Chinese civilization.
The spatial pattern of the SHS site shows triple moats around the dwelling site and burial and other relic areas. The field mapping data demonstrate that the depth of the northern moats was generally less than that of the southern moats, with the depth of the trenches ranging from 4 m to 9.5 m and the width of the openings ranging from 1 m to 5 m. According to excavation data from the Zhengzhou Municipal Research Institute of Cultural Relics and our survey, the inhabitants of the SHS site excavated the moats depending on the terrain features, with rammed earth pilings, residential construction areas, courtyards, and ritual areas located in areas with higher elevations. The northern side of the site was bounded by a wall similar to a barbican entrance, forming the central residential area. The topography of the reconstructed site reveals that early ritual relics representing the nine stars of the Big Dipper are located on the highest terrain of the core area. The topographical features characterising the burial areas are distributed around the site and in the northwestern highland (Figure 16 and Figure 17).
In the late Yangshao period, the vegetation around the SHS site was represented by the pine family, with flourishing grasses and trees. People settled in the area and began a series of modifications to the natural environment. The artificial transformation of the landscape manifested in mainly the following two ways: a negative terrain was created on the original natural surface due to the excavation of moats, and a positive terrain was artificially created at the site due to the accumulation of rammed earth and artificial dumping (Figure 18). From the perspective of the reconstructed topography, the overall topographic features of the core area of the SHS site (high in the north and low in the south) have not changed under the combined effect of the natural environment and artificial transformation, and the topographic pattern of the SHS site affected the transformation of the settlement pattern to a certain extent. Figure 19 shows a cold winter scene in the house site area of the SHS site.

4. Discussion

In the course of field investigations, exposed bedrock was found in the northeastern part of Mang Mountain, west of the confluence of the Yellow River and the Yiluo River (Figure 20). The bedrock is approximately 2 km from the site and follows a straight line parallel to the SHS site; the bedrock prevented and slowed southward erosion by the Yellow River. According to this result, it was inferred that the maximum extent of the northern terrace extension at the SHS site remained within the area between the SHS site and the bedrock during the Holocene. According to the results of river channel extraction from early CORONA images, the shortest distance of the Yellow River from the site in the 1970s was approximately 512 m. Therefore, the comprehensive analysis suggests that the location of the northern terrace of the SHS site in the late Yangshao period extended no more than 500 m northwards relative its position in the modern period. Remote sensing observation data, especially historical information, can provide a basis for environmental archaeology, and environmental archaeological data can in turn be conceptualized and tested empirically.
In this study, we employed a combination of multidisciplinary information from remote sensing, field archaeology and environmental archaeology. A 3D model of the current state of the SHS site was established by using UAV aerial photography with a high spatial resolution. The distance between the SHS site and the Yellow River in the last 60 years was analysed by CORONA and Landsat satellite images. Guided by the results of environmental archaeological investigation, the terrain of the SHS site in the Yangshao period was reconstructed. The natural and cultural landscapes of the site in the Yangshao period (i.e., the paleotopography of the site) were reconstructed. The results of this study show that (1) the 3D model of the current SHS site accurately represent the relationship between the site and the Yellow River and the Yiluo River, displaying the geomorphological landscape of the selected loess terrace at the site. (2) The dynamic changes in the distance between the Yellow River and the SHS site from 1960 to 2020 reflect the influence of the Yellow River on the site and can be used as one of the criteria for understanding the effects of the erosion process of the Yellow River on the terrace of the SHS site. (3) The landscape of the SHS site was artificially modified in the Yangshao period through extensive works. The site has three large moats, a wall of urn structures, a large central dwelling site, a rammed earth foundation site and several burial areas. The spatial pattern of the features of the SHS site is related to the terrain. However, since the SHS site is an important cultural site of the Yangshao period and was discovered in recent years, data from its excavation are still being updated. The integrated use of ground-penetrating radar scanning of unexcavated areas can be considered in the succeeding work, which can help to obtain accurately subsurface elements and detect anomalous target areas. For the extraction of Yellow River water bodies from Landsat images, we will use better indicators to extract water bodies in the follow-up to improve results, such as the AWEI proposed by Feyisa et al. [93]. The site model was constructed from only existing data, on which analysis and speculation were based, and it should be revised and improved as excavation data are updated.

Author Contributions

Conceptualization: R.Y., P.L., P.C. and G.C.; data curation: G.C., R.Y., P.L., P.C.; formal analysis: G.C., R.Y.; investigation: G.C., R.Y., P.L., P.C.; methodology: G.C., R.Y., P.L., P.C.; resources: W.G., X.W., Y.H., J.Z., R.Y. and P.L.; writing—original draft preparation: G.C., R.Y.; writing—review and editing: G.C., R.Y., P.L. and P.C. All authors have read and agreed to the published version of the manuscript.

Funding

The study is funded by the National Key R&D Program of China(2020YFC1521900), The Earth big data science project of the Chinese Academy of Sciences Pilot Project “Dynamic observation and evaluation of influencing factors of cultural heritage protection” (XDA19030502),the National Natural Science Foundation of China (Grant Nos. 41971016, 41671014), the National Social Science Foundation of China (Grant Nos. 19ZDA227), the Study of Environment archaeology in Zhengzhou, the Digital Environment Archaeology Specially-appointed Researcher of Henan, China (Grant No. 210501002), and the Research on the Roots of Chinese Civilization of Zhengzhou University (XKZDJC202006).

Institutional Review Board Statement

Not applicable.

Informed Consent Statement

Not applicable.

Data Availability Statement

The data that support the findings of this study are available from the author upon reasonable request.

Acknowledgments

We are very grateful to Zhengzhou Academy of Archaeology for providing on-site assistance and professional knowledge guidance for this study. Peng Lu’s team of Digital Environmental Archaeology Research Office of Institute of Geography, Henan Academy of Sciences and Duowen Mo of the School of City and Environment, Peking University provided great help for data collection, environmental archaeology analysis and guidance of this study. We are also very grateful to Luo Lei from Aerospace Information Research Institute, Chinese Academy of Sciences, and Ping Chen from the Guilin University of Technology for their help in the field survey and in obtaining data.

Conflicts of Interest

The authors declare no conflict of interest.

References

  1. Press conference on Major Archaeological Discoveries of Shuanghuaishu Ancient Capital Site in Gongyi, Zhengzhou, Henan Was Held in Zhengzhou. Available online: http://www.gongyishi.gov.cn/portal/gyzx/jryw/webinfo/2020/05/1590512634158364.htm (accessed on 22 December 2021).
  2. Benito-Calvo, A.; Arnold, L.J.; Mora, R.; Martínez-Moreno, J.; Demuro, M. Reconstructing Mousterian landscapes in the southeastern Pyrenees (Roca dels Bous site, Pre-Pyrenees ranges, Spain). Quat. Res. 2020, 97, 167–186. [Google Scholar] [CrossRef]
  3. Del Pozo, S.; Rodríguez-Gonzálvez, P.; Hernández-López, D.; Onrubia-Pintado, J.; Guerrero-Sevilla, D.; González-Aguilera, D. Novel Pole Photogrammetric System for Low-Cost Documentation of Archaeological Sites: The Case Study of “Cueva Pintada”. Remote Sens. 2020, 12, 2644. [Google Scholar] [CrossRef]
  4. Moyano, J.; León, J.; Nieto-Julián, J.E.; Bruno, S. Semantic interpretation of architectural and archaeological geometries: Point cloud segmentation for HBIM parameterisation. Automat. Constr. 2021, 130, 103856. [Google Scholar] [CrossRef]
  5. St. Amand, F.; Childs, S.T.; Reitz, E.J.; Heller, S.; Newsom, B.; Rick, T.C.; Sandweiss, D.H.; Wheeler, R. Leveraging legacy archaeological collections as proxies for climate and environmental research. Proc. Natl. Acad. Sci. USA 2020, 117, 8287–8294. [Google Scholar] [CrossRef] [Green Version]
  6. Beyer, R.M.; Krapp, M.; Eriksson, A.; Manica, A. Climatic windows for human migration out of Africa in the past 300,000 years. Nat. Commun. 2021, 12, 4889. [Google Scholar] [CrossRef]
  7. Xu, J.; Jia, Y.; Ma, C.; Zhu, C.; Wu, L.; Li, Y.; Wang, X. Geographic distribution of archaeological sites and their response to climate and environmental change between 10.0–2.8 ka BP in the Poyang Lake Basin, China. J. Geogr. Sci. 2016, 26, 603–618. [Google Scholar] [CrossRef] [Green Version]
  8. Zhen, Q. Exploring the early anthropocene: Implications from the long-term human-climate interactions in early China. Mediterr. Archaeol. Archaeom. 2021, 21, 133–148. [Google Scholar]
  9. Li, K.; Gong, P.; Hu, H.; Jia, W.; Liu, X.; Gao, W. Spatial variability of human subsistence strategies during the longshan period (~4.6~3.9 ka bp) and its possible physical environmental contexts in the yellow-huai river area, east China. Sci. Cult. 2021, 7, 105–117. [Google Scholar]
  10. Genuite, K.; Delannoy, J.; Bahain, J.; Gresse, M.; Jaillet, S.; Philippe, A.; Pons-Branchu, E.; Revil, A.; Voinchet, P. Dating the landscape evolution around the Chauvet-Pont d’Arc cave. Sci. Rep. 2021, 11, 8944. [Google Scholar] [CrossRef]
  11. Du, L.; Ma, M.; Lu, Y.; Dong, J.; Dong, G. How Did Human Activity and Climate Change Influence Animal Exploitation During 7500–2000 BP in the Yellow River Valley, China? Front. Ecol. Evol. 2020, 8, 161. [Google Scholar] [CrossRef]
  12. Dong, G. Understanding past human-environment interaction from an interdisciplinary perspective. Sci. Bull. 2018, 63, 1023–1024. [Google Scholar] [CrossRef] [Green Version]
  13. Guanghui, D.; Shanjia, Z.; Yishi, Y.; Jianhui, C.; Fahu, C. Agricultural intensification and its impact on environment during Neolithic Age in northern China. Chin. Sci. Bull. 2016, 61, 2913–2925. [Google Scholar]
  14. Sugiyama, N.; Sugiyama, S.; Catignani, T.; Chase, A.S.Z.; Fernandez-Diaz, J.C. Humans as geomorphic agents: Lidar detection of the past, present and future of the Teotihuacan Valley, Mexico. PLoS ONE 2021, 16, e257550. [Google Scholar] [CrossRef] [PubMed]
  15. Chen, F.; Guo, H.; Ma, P.; Lin, H.; Wang, C.; Ishwaran, N.; Hang, P. Radar interferometry offers new insights into threats to the Angkor site. Sci. Adv. 2017, 3, e1601284. [Google Scholar] [CrossRef] [PubMed] [Green Version]
  16. Luo, L.; Wang, X.; Guo, H.; Lasaponara, R.; Zong, X.; Masini, N.; Wang, G.; Shi, P.; Khatteli, H.; Chen, F.; et al. Airborne and spaceborne remote sensing for archaeological and cultural heritage applications: A review of the century (1907–2017). Remote Sens. Environ. 2019, 232, 111280. [Google Scholar] [CrossRef]
  17. Juan Torrejón, M.W.I.T. Big data in landscape archaeological prospection. In Proceedings of the 8th International Congress on Archaeology, Computer Graphics, Cultural Heritage and Innovation (ARQUEOLOGICA), Valencia, Spain, 5–7 September 2016; University Politecnica Valencia: Valencia, Spain, 2016. [Google Scholar]
  18. Demetrescu, E. Archaeological stratigraphy as a formal language for virtual reconstruction. Theory and practice. J. Archaeol. Sci. 2015, 57, 42–55. [Google Scholar] [CrossRef]
  19. Diwan, G.A. GIS-based comparative archaeological predictive models: A first application to iron age sites in the Bekaa (Lebanon). Mediterr. Archaeol. Archaeom. 2020, 20, 143–158. [Google Scholar]
  20. Selvi, H.Z.; İrfan, A.B.; Karauğuz, B.; Karauğuz, G. Spatial analysis of the eflatunpinar and fasillar hittite monuments using GIS. Mediterr. Archaeol. Archaeom. 2020, 20, 243–256. [Google Scholar]
  21. Carnevale, F.; Ranieri, M. Lunistices at sesto fiorentino: An investigation on geometry and alignments of the tholos tombs of the etruscan princes. Mediterr. Archaeol. Archaeom. 2016, 16, 219–224. [Google Scholar]
  22. Fernández, J.F.; Alonso, D.Á.; González, P.A. Gis and geoarchaeological analysis in superficial open-air sites: The case of raña de cañamero neanderthal settlement (Guadiana Basin, Spain). Mediterr. Archaeol. Archaeom. 2016, 16, 47–59. [Google Scholar]
  23. Liritzis, I.; Al-Otaibi, F.M.; Castro, B.D.A. Nabatean tombs orientation by remote sensing: Provisional results. Mediterr. Archaeol. Archaeom. 2015, 15, 289–299. [Google Scholar]
  24. Waagen, J. New technology and archaeological practice. Improving the primary archaeological recording process in excavation by means of UAS photogrammetry. J. Archaeol. Sci. 2019, 101, 11–20. [Google Scholar] [CrossRef]
  25. Menna, F.; Agrafiotis, P.; Georgopoulos, A. State of the art and applications in archaeological underwater 3D recording and mapping. J. Cult. Herit. 2018, 33, 231–248. [Google Scholar] [CrossRef]
  26. Von Schwerin, J.; Richards-Rissetto, H.; Remondino, F.; Spera, M.G.; Auer, M.; Billen, N.; Loos, L.; Stelson, L.; Reindel, M. Airborne LiDAR acquisition, post-processing and accuracy-checking for a 3D WebGIS of Copan, Honduras. J. Archaeol. Sci. Rep. 2016, 5, 85–104. [Google Scholar] [CrossRef] [Green Version]
  27. Papworth, H.; Ford, A.; Welham, K.; Thackray, D. Assessing 3D metric data of digital surface models for extracting archaeological data from archive stereo-aerial photographs. J. Archaeol. Sci. 2016, 72, 85–104. [Google Scholar] [CrossRef] [Green Version]
  28. Smith, N.; Levy, T. Archfield: A digital application for realtime acquisition and dissemination-from the field to the virtual museum. Mediterr. Archaeol. Archaeom. 2014, 14, 65–74. [Google Scholar]
  29. Núñez Andrés, M.A.; Buill Pozuelo, F. Evolution of the architectural and heritage representation. Landsc. Urban Plan. 2009, 91, 105–112. [Google Scholar] [CrossRef]
  30. Richards-Rissetto, H. An iterative 3D GIS analysis of the role of visibility in ancient Maya landscapes: A case study from Copan, Honduras. Digit. Scholarsh. Humanit. 2017, 32, i195–i212. [Google Scholar] [CrossRef] [Green Version]
  31. Sullivan, E.A. Seeking a Better View: Using 3D to Investigate Visibility in Historic Landscapes. J. Archaeol. Method Theory 2017, 24, 1227–1255. [Google Scholar] [CrossRef]
  32. Ortiz-Villarejo, A.J.; Gutiérrez Soler, L. A Low-Cost, Easy-Way Workflow for Multi-Scale Archaeological Features Detection Combining LiDAR and Aerial Orthophotography. Remote Sens. 2021, 13, 4270. [Google Scholar] [CrossRef]
  33. Asăndulesei, A.; Tencariu, F.A.; Nicu, I.C. Pars pro toto—Remote Sensing Data for the Reconstruction of a Rounded Chalcolithic Site from NE Romania: The Case of Ripiceni–Holm Settlement (Cucuteni Culture). Remote Sens. 2020, 12, 887. [Google Scholar] [CrossRef] [Green Version]
  34. Klehm, C.; Barnes, A.; Follett, F.; Simon, K.; Kiahtipes, C.; Mothulatshipi, S. Toward archaeological predictive modeling in the Bosutswe region of Botswana: Utilizing multispectral satellite imagery to conceptualize ancient landscapes. J. Anthropol. Archaeol. 2019, 54, 68–83. [Google Scholar] [CrossRef]
  35. Monteleone, K.; Thompson, A.E.; Prufer, K.M. Virtual cultural landscapes: Geospatial visualizations of past environments. Archaeol. Prospect. 2021, 28, 379–401. [Google Scholar] [CrossRef]
  36. Zijian, Z.; Xiaojun, C.; Yujie, C.; Feng, W.; Yue, Y. Application of 3D Reconstruction of Relic Sites Combined with Laser and Vision Point Cloud. Chin. J. Lasers 2020, 47, 273–282. [Google Scholar]
  37. Toprak, A.S.; Polat, N.; Uysal, M. 3D modeling of lion tombstones with UAV photogrammetry: A case study in ancient Phrygia (Turkey). Archaeol. Anthrop. Sci. 2019, 11, 1973–1976. [Google Scholar] [CrossRef]
  38. Holata, L.; Plzák, J.; Světlík, R.; Fonte, J. Integration of Low-Resolution ALS and Ground-Based SfM Photogrammetry Data. A Cost-Effective Approach Providing an ‘Enhanced 3D Model’ of the Hound Tor Archaeological Landscapes (Dartmoor, South-West England). Remote Sens. 2018, 10, 1357. [Google Scholar] [CrossRef] [Green Version]
  39. Hatzopoulos, J.; Stefanakis, D.; Georgopoulos, A.; Tapinaki, S. Use of various surveying technologies to 3D digital mapping and modelling of cultural heritage structures for maintenance and restoration purposes: The Tholos in Delphi, Greece. Mediterr. Archaeol. Archaeom. 2017, 17, 311–336. [Google Scholar]
  40. Denker, A. Rebuilding Palmyra virtually: Recreation of its former glory in digital space. Virtual Archaeol. Rev. 2017, 8, 20–30. [Google Scholar] [CrossRef] [Green Version]
  41. Danielová, M.; Kumke, H.; Peters, S. 3D Reconstruction and Uncertainty Modelling Using Fuzzy Logic of Archaeological Structures: Applied to the Temple of Diana in Nemi, Italy. Cartogr. Int. J. Geogr. Inf. Geovis. 2016, 51, 137–146. [Google Scholar] [CrossRef]
  42. Di Maio, R.; La Manna, M.; Piegari, E. 3D Reconstruction of Buried Structures from Magnetic, Electromagnetic and ERT Data: Example from the Archaeological Site of Phaistos (Crete, Greece). Archaeol. Prospect. 2016, 23, 3–13. [Google Scholar] [CrossRef]
  43. Hu, Q.; Wang, S.; Fu, C.; Ai, M.; Yu, D.; Wang, W. Fine Surveying and 3D Modeling Approach for Wooden Ancient Architecture via Multiple Laser Scanner Integration. Remote Sens. 2016, 8, 270. [Google Scholar] [CrossRef] [Green Version]
  44. Weber, J.W.J.; Powis, T.P.T.G. Assessing Terrestrial Laser Scanning in Complex Environments. Adv. Archaeol. Pract. 2014, 2, 123–137. [Google Scholar] [CrossRef] [Green Version]
  45. Fazio, L.; Lo Brutto, M. 3D survey for the archaeological study and virtual reconstruction of the “Sanctuary of Isis” in the ancient Lilybaeum (Italy). Virtual Archaeol. Rev. 2020, 11, 1–14. [Google Scholar] [CrossRef] [Green Version]
  46. Ferdani, D.; Fanini, B.; Piccioli, M.C.; Carboni, F.; Vigliarolo, P. 3D reconstruction and validation of historical background for immersive VR applications and games: The case study of the Forum of Augustus in Rome. J. Cult. Herit. 2020, 43, 129–143. [Google Scholar] [CrossRef]
  47. Moyano, J.; Nieto-Julián, J.E.; Bienvenido-Huertas, D.; Marín-García, D. Validation of Close-Range Photogrammetry for Architectural and Archaeological Heritage: Analysis of Point Density and 3D Mesh Geometry. Remote Sens. 2020, 12, 3571. [Google Scholar] [CrossRef]
  48. Hiebel, G.; Aspöck, E.; Kopetzky, K. Ontological Modeling for Excavation Documentation and Virtual Reconstruction of an Ancient Egyptian Site. J. Comput. Cult. Herit. 2021, 14, 1–14. [Google Scholar] [CrossRef]
  49. Stampouloglou, M.; Toska, O.; Tapinaki, S.; Kontogianni, G.; Skamantzari, M.; Georgopoulos, A. Archaeological anastylosis of two Macedonian tombs in a 3D virtual environment. Virtual Archaeol. Rev. 2020, 11, 26–40. [Google Scholar] [CrossRef] [Green Version]
  50. Georgopoulos, A. 3D virtual reconstruction of archaeological monuments. Mediterr. Archaeol. Archaeom. 2014, 14, 155–164. [Google Scholar]
  51. Liu, J.; Zou, Q.; Hu, Q.; Zhang, C. A Settlement Landscape Reconstruction Approach Using GIS Analysis with Integrated Terrain Data of Land and Water: A Case Study of the Panlongcheng Site in the Shang Dynasty (Wuhan, China). Remote Sens. 2021, 13, 5087. [Google Scholar] [CrossRef]
  52. Schneider, A.; Hirsch, F.; Wechler, K.; Raab, A.; Raab, T. Reconstruction of a Palaeosurface and Archaeological Site Location in an Anthropogenic Drift Sand Area. Archaeol. Prospect. 2017, 24, 297–310. [Google Scholar] [CrossRef]
  53. Mercuri, A.M.; Florenzano, A.; Massamba N’Siala, I.; Olmi, L.; Roubis, D.; Sogliani, F. Pollen from archaeological layers and cultural landscape reconstruction: Case studies from the Bradano valley (Basilicata, southern Italy). Plant Biosyst. Int. J. Deal. Asp. Plant Biol. 2010, 144, 888–901. [Google Scholar] [CrossRef]
  54. Xia, Z.K.; Zhang, J.N. The rise, development and outlook of Huanjingkaogu (environmental archaeology in China). J. Palaeogeogr. 2019, 21, 175–188. [Google Scholar]
  55. Peng, L.; Ruixia, Y. Overview on the Researches of the Prehistoric Settlement in the Digital Environment Archaeology. Areal Res. Dev. 2013, 32, 165–169. [Google Scholar]
  56. Ren, X.; Mo, D.; Storozum, M.; Lemoine, X.; Yu, Y.; Gu, W.; Lei, X.; Zhang, J.; Lü, J.; Kidder, T.R. Early urban impact on vegetation dynamics: Palaeoecological reconstruction from pollen records at the Dongzhao site, Henan Province, China. Quat. Int. 2019, 521, 66–74. [Google Scholar] [CrossRef]
  57. Yasuda, Y.; Fujiki, T.; Nasu, H.; Kato, M.; Morita, Y.; Mori, Y.; Kanehara, M.; Toyama, S.; Yano, A.; Okuno, M.; et al. Environmental archaeology at the Chengtoushan site, Hunan Province, China, and implications for environmental change and the rise and fall of the Yangtze River civilization. Quat. Int. 2004, 123–125, 149–158. [Google Scholar] [CrossRef]
  58. Zhang, G.; Zhu, C.; Wang, J.; Zhu, G.; Ma, C.; Zheng, C.; Zhao, L.; Li, Z.; Li, L.; Jin, A. Environmental archaeology on Longshan Culture (4500–4000 aBP) at Yuhuicun Site in Bengbu, Anhui Province. J. Geogr. Sci. 2010, 20, 455–468. [Google Scholar] [CrossRef]
  59. Zong, Y.; Chen, Z.; Yu, Z. Multidisciplinary studies in environmental archaeology with particular reference to China: An introduction to the Special Issue. Holocene 2012, 22, 609–611. [Google Scholar] [CrossRef] [Green Version]
  60. Sapir, Y.; Sarah, P.; Sapir, Y.; Faust, A. Topsoil formation processes as indicated from geoarchaeological investigations at tel’eton, israel, and its environment. Mediterr. Archaeol. Archaeom. 2021, 20, 85–107. [Google Scholar]
  61. Koh, A.J.; Liritzis, I. The Mycenaean Citadel and Environs of Desfina-Kastrouli: A Transdisciplinary Approach to Southern Phokis. Mediterr. Archaeol. Archaeom. 2020, 20, 43–73. [Google Scholar]
  62. Wangfa, G.; Xu, W.; Yayi, H.; Yingjun, X. The ShuangHuaiShu neolithic sites in Gongyi, Henan. Archaeology 2021, 7, 27–48. [Google Scholar]
  63. Qingchao, W. Study on Geological Hazards and Countermeasures in Gongyi City. Master’s Thesis, Chang’an University, Xi’an, China, 2018. [Google Scholar]
  64. Muntarina, K.; Shorif, S.B.; Uddin, M.S. Notes on edge detection approaches. Evolv. Syst. 2021, 13, 169–182. [Google Scholar] [CrossRef]
  65. Chen, J.; Wang, Z.H.; Dou, L.H. Scale Adaptive Canny Edge Detection Method. Opto-Electron. Eng. 2008, 35, 79–84. [Google Scholar]
  66. Kanchanatripop, P.; Zhang, D. Adaptive Image Edge Extraction Based on Discrete Algorithm and Classical Canny Operator. Symmetry 2020, 12, 1749. [Google Scholar] [CrossRef]
  67. Zhang, S.; Yang, P.; Xia, J.; Qi, K.; Wang, W.; Cai, W.; Chen, N. Research and Analysis of Ecological Environment Quality in the Middle Reaches of the Yangtze River Basin between 2000 and 2019. Remote Sens. 2021, 13, 4475. [Google Scholar] [CrossRef]
  68. Cavallo, C.; Papa, M.N.; Gargiulo, M.; Palau-Salvador, G.; Vezza, P.; Ruello, G. Continuous Monitoring of the Flooding Dynamics in the Albufera Wetland (Spain) by Landsat-8 and Sentinel-2 Datasets. Remote Sens. 2021, 13, 3525. [Google Scholar] [CrossRef]
  69. Lasko, K.; Maloney, M.C.; Becker, S.J.; Griffin, A.W.H.; Lyon, S.L.; Griffin, S.P. Automated Training Data Generation from Spectral Indexes for Mapping Surface Water Extent with Sentinel-2 Satellite Imagery at 10 m and 20 m Resolutions. Remote Sens. 2021, 13, 4531. [Google Scholar] [CrossRef]
  70. Junshu, L. A preliminary peobe into the holocene palaeoclimate variations in the zheng zhou area. J. Xi’an Coll. Geol. 1994, 16, 48–54. [Google Scholar]
  71. Ren, X.; Xu, J.; Wang, H.; Storozum, M.; Lu, P.; Mo, D.; Li, T.; Xiong, J.; Kidder, T.R. Holocene fluctuations in vegetation and human population demonstrate social resilience in the prehistory of the Central Plains of China. Environ. Res. Lett. 2021, 16, 55030. [Google Scholar] [CrossRef]
  72. Fuhua, Y.; Yongying, Y.; Xuishun, M. Geological ace and enviroment of the Dahocun site, Zhengzhou, from sopro-poilen data. Seismol. Geol. 1986, 8, 69–74. [Google Scholar]
  73. Yongfei, L.; Huadong, S.; Ge, Y.; Chunhai, L.; Shouyun, H. A study of lacustrine and palustrine sediments and enviromental changes in Zhengzhou regions during the past 20,000 years. J. Stratigr. 2019, 43, 364–375. [Google Scholar]
  74. Li, K.F.; Ma, C.M.; Gao, W.H.; Li, S.Y.; Li, Z.X.; Pan, Y.F. Progress and trend of Holocene environmental archaeology in Henan Province. Prog. Geogr. 2015, 34, 883–897. [Google Scholar]
  75. Wang, X.L.; He, Y.; Jia, T.F.; Li, R.Q. Living enviroment of ancient man since 7000 aB.P. at Xishan Relic Site of Zhengzhou in Henan Province. J. Palaeogeogr. 2004, 6, 234–240. [Google Scholar]
  76. Mangzhou, L. Characteristics of climatic environment in the Central Plains in the middle of Quaternary Holocene. Henan Earth Sci. Bull. 2009, 1, 80–84. [Google Scholar]
  77. Sun, X.; Xia, Z. Paleoenvironment Changes Since Mid-Holocene Revealed by a Palynological Sequence from Sihenan Profile in Luoyang, Henan Province. Acta Sci. Nat. Univ. Pekin. 2005, 41, 289–294. [Google Scholar]
  78. Xiaolan, W.; Yu, H. Climate change from 7000 a BP in Xishan Mountain of Zhengzhou by analysis of magnetic suscepibility. J. Beijing Norm. Univ. 2004, 40, 133–136. [Google Scholar]
  79. Wang, L.; Hu, S.; Yu, G.; Wang, X.; Wang, Q.; Zhang, Z.; Ma, M.; Cui, B.; Liu, X. Multiproxy studies of lake sediments during mid-Holocene in Zhengzhou region of the Henan Province, central China, and the implications for reconstructing the paleoenvironments. Quat. Int. 2019, 521, 104–110. [Google Scholar] [CrossRef]
  80. Peng, L.; Yan, T.; Panpan, C.; Lijie, Y.; Lisheng, S. The relationship between settlements distribution and regional tectonics around the Songshan Mountain during 9000–3000 a BP. Acta Geogr. Sin. 2014, 69, 738–746. [Google Scholar]
  81. Zhang, Z.; Zhou, K.; Yang, R.; Zhang, S.; Cai, Q.; Lu, P.; Hao, L.; Wang, C. Environm ental archaeology in the Shuangji river basin. Quat. Sci. 2007, 27, 453–460. [Google Scholar]
  82. Zhijun, Z.; Yanming, F. Identification and Analysis of the Objects Floatation-selected from the Soil Samples Collected to the Wangchenggang Site in Dengfeng. Huaxia Archaeol. 2007, 2, 78–89. [Google Scholar]
  83. Zhengquan, Y.; Yan, W.; Wang, C.; Zhao, C. Phytolith analysis of Xinzhai site in Xinmi City, Henan Province. Archaeology 2007, 3, 90–96. [Google Scholar]
  84. Yuqin, S.; Guang, Z.; Yuling, H.; Yuxin, W. Environmental information of Erlitou site in Yanshi City, Henan Province. Archaeology 2002, 12, 75–79. [Google Scholar]
  85. Wang, H.; Jia, Y.; Zhang, Y.; Wang, N.; Luo, P.; Qiu, H.; Ayidina, S.; Xiao, Q.; Chen, D. Research progress of paleoflood events in the Yellow River Basin since the Last Deglaciation. Prog. Geogr. 2021, 40, 1220–1234. [Google Scholar] [CrossRef]
  86. Hui, W.; Peng, L.; Junjie, X.; DuoWen, M. On the Role of Natural Environment in the Formation and Evolution of Business Modes-Taking the Neolithic Age in Qishui Area of Henan Province as an Example. Cult. Relics South. China 2019, 5, 170–179. [Google Scholar]
  87. Yu, Q. Development of complex societies in the yiluo region: A gis based population and agricultural area analysis. Acta Archaeol. Sin. 2010, 4, 423–454. [Google Scholar]
  88. Zhu, D.; Cheng, X.; Zhang, F.; Yao, X.; Gao, Y.; Liu, Y. Spatial interpolation using conditional generative adversarial neural networks. Int. J. Geogr. Inf. Sci. IJGIS 2020, 34, 735–758. [Google Scholar] [CrossRef]
  89. Zheng, S.; Wu, B.; Wang, K.; Tan, G.; Han, S.; Thorne, C.R. Evolution of the Yellow River delta, China: Impacts of channel avulsion and progradation. Int. J. Sediment Res. 2017, 32, 34–44. [Google Scholar] [CrossRef]
  90. Yan, L.; Yang, R.; Lu, P.; Teng, F.; Wang, X.; Zhang, L.; Chen, P.; Li, X.; Guo, L.; Zhao, D. The spatiotemporal evolution of ancient cities from the late Yangshao to Xia and Shang Dynasties in the Central Plains, China. Herit. Sci. 2021, 9, 124. [Google Scholar] [CrossRef]
  91. Lu, P.; Tian, Y.; Storozum, M.; Chen, P.; Wang, H.; Wang, X.; Xu, J.; Jing, L.; Yan, L.; Zhang, L.; et al. Shifting Patterns of House Structures during the Neolithic-Bronze Age in the Yellow River Basin: An Environmental Perspective. Land 2021, 10, 574. [Google Scholar] [CrossRef]
  92. Xing, S.Q.B. On the factors of cultural civilization in Dahe Village. In Song Mountain Civilization Research Newsletter; Boqin Li, A., Huancheng Yang, B., Eds.; Zhengzhou Research Association of the Origin of Chinese Civilization and Songshan Civilization: Zhengzhou, China, 2013; Volume 2, pp. 21–41. [Google Scholar]
  93. Feyisa, G.L.; Meilby, H.; Fensholt, R.; Proud, S.R. Automated Water Extraction Index: A new technique for surface water mapping using Landsat imagery. Remote Sens. Environ. 2014, 140, 23–35. [Google Scholar] [CrossRef]
Figure 1. The geographical location of the SHS site: (a) the site is located in the northern central part of Henan Province, China; (b) the surroundings of the SHS site at a large spatial scale; (c) the layout of the SHS site.
Remotesensing 14 01233 g001
Figure 2. Regional Landform of the SHS site.
Remotesensing 14 01233 g002
Figure 3. Flight route over the SHS site.
Remotesensing 14 01233 g003
Figure 4. Camera location and image overlap.
Remotesensing 14 01233 g004
Figure 5. Data processing for the SHS site.
Remotesensing 14 01233 g005
Figure 6. Locations of the collected profile data.
Remotesensing 14 01233 g006
Figure 7. Collection of spatial information from earlier site strata.
Remotesensing 14 01233 g007
Figure 8. Survey and mapping of the house shape.
Remotesensing 14 01233 g008
Figure 9. Example of the F34 house recovery process: (a) reconstruction of the house foundation based on mapped data; (b) insertion of wooden pillars into the foundation grooves; (c) plastering with grass and wood plaster to reinforce the walls; (d) restoration of the house at the Erlitou site; (e) restoration of the F34 house site; (f) photo of the F34 house shape.
Remotesensing 14 01233 g009
Figure 10. Surrounding environment and profile of the SHS site.
Remotesensing 14 01233 g010
Figure 11. Modern 3D model of the core area of the SHS site.
Remotesensing 14 01233 g011
Figure 12. Edge extraction of the southern bank of the Yellow River from CORONA images.
Remotesensing 14 01233 g012
Figure 13. Edge extraction of the southern bank of the Yellow River from Landsat images.
Remotesensing 14 01233 g013
Figure 14. Change in the distance between the SHS site and the southern bank of the Yellow River from 1960 to 2020.
Remotesensing 14 01233 g014
Figure 15. Model of the construction process of the house site at the SHS site (the survey and base map are described in reference [62]): (a) a mapping of the base of the house inside the site (bf) The process of building a house site by the early pioneers, including the ramming of the foundation, the insertion of wooden posts, and the plastering of the walls; (g) the position and fall of part of the 3D model of the house site.
Remotesensing 14 01233 g015
Figure 16. Topographic restoration of the SHS site (the survey and basemap are described in reference [62]).
Remotesensing 14 01233 g016
Figure 17. Early settlement landscape of the SHS site.
Remotesensing 14 01233 g017
Figure 18. Profile reconstruction landscape of the SHS site.
Remotesensing 14 01233 g018
Figure 19. Snowscape at the SHS site.
Remotesensing 14 01233 g019
Figure 20. The locations of Mang Mountain and the SHS site.
Remotesensing 14 01233 g020
Table 1. Data source information.
Data ResourceResolution/AccuracyTime
CORONA images7.8/12.5 m1960s–1970s
(18 April 1962, 26 July 1970)
Landsat5 images30 m1980s–2010s
(9 April 1984, 11 May 1990, 11 June 2004, 15 June 2011)
Landsat8 images30 m(9 July 2020)
ASTER DEM30 m2020
ALOS DEM12.5 m2020
DJI Genie RTK UAV4 cm(21 November 2020)
Feima multirotor UAV D20(equipped with DV-Lidar20)5 cm(28 September 2021)
GPS2 cm(9 November 2020)
Total Station1 cm(12 November 2020)
Pollen dataSamples taken, awaiting lab results(9 October 2020)
Optically Stimulated LuminescenceSamples taken, awaiting lab results(9 October 2020)
Table 2. Natural environmental changes at the SHS site area over 10,000 years.
Time PeriodSporopollen ResultsClimate and LandscapeReferences
10,000 aBPTrees account for more than half of the vegetation; coniferous pine and deciduous broad-leaved species that thrive in the temperature and humidity conditions of this time are dominant. Pollen records indicate that the herbaceous plants were dominated by the family Moraceae, followed by Artemisiaceae, Quinoa and Asteraceae.The climate is dry and cool; the vegetation landscape consists of mixed forests and grasses.[70,71,72,73]
8000–6000 aBPBroad-leaved trees and pine trees appear and subtropical pollen and water fern spores, such as those from maple and water cycad, are present.The climate is warm and humid; the vegetation landscape consists of deciduous broad-leaved forest.[70,71,73,74,75,76,77,78]
6000–5000 aBPTree species, along with semihygrophytic and aquatic plants, dominate the pollen record. The pollen record is dominated by pine pollen, and the proportion of vegetation is low.The climate is warm and humid; the vegetation landscape is dominated by pine trees, with some aquatic vegetation.[74,75,78,79,80,81]
4000–3000 aBPThe early and middle parts of this period are more suitable, and sporulation is dominated by grasses and trees. There is an overall decline in the vegetation population in the later parts of this period.The climate is dry and warm; the vegetation landscape is dominated by grasses and trees, and the lake dries up at approximately 3000 aBP.[82,83,84,85,86,87]
Publisher’s Note: MDPI stays neutral with regard to jurisdictional claims in published maps and institutional affiliations.

