Article

New Archaeological Discoveries Based on Spatial Information Technology and Cultural Analysis: Taking the Study of the Spatial Relationship between Ancient Chinese Capitals and the Natural Environment as an Example

1
School of Architecture, Chang’an University, No. 161, Chang’an Road, Xi’an 710061, China
2
Xi’an Research Base of China-Portugal Joint Laboratory of Cultural Heritage Conservation Science Supported by the Belt and Road Initiative, No. 161, Chang’an Road, Xi’an 710061, China
3
School of Architecture, Xi’an University of Architecture & Technology, No. 13, Yanta Road, Xi’an 710055, China
4
School of Remote Sensing and Information Engineering, Wuhan University, No. 129, Luoyu Road, Wuhan 430079, China
5
Xi’an Tianqiong Survey Information Co., Ltd., No. 8, Gaoxin Road, Xi’an 710075, China
*
Author to whom correspondence should be addressed.
Remote Sens. 2022, 14(14), 3298; https://doi.org/10.3390/rs14143298
Submission received: 31 May 2022 / Revised: 2 July 2022 / Accepted: 6 July 2022 / Published: 8 July 2022

Abstract

:
How to combine science and technology with the humanities in the research on ancient cities to reveal ancient peoples’ urban planning thoughts is worthy of in-depth study. The capitals of the Western Han dynasty as well as the Sui and Tang dynasties were some of the greatest cities in the world at the time. This paper takes them as its subjects and puts forward a method to study the spatial relationship between ancient cities and the natural environment by combining spatial information technology and cultural analysis. Firstly, satellite images, elevation maps, urban ichnographies, and literature materials were collected and sorted to deeply understand the cultural thoughts involved in ancient urban planning; based on this, key element points were marked and rechecked on the spot, and the above drawings were accurately superimposed by GIS technology to form a geographic information base that integrated multisource information. Then, Python was used to construct a “decision model of spatial relationship between urban elements and natural elements”, and rules as well as parameters were set through man–machine collaboration. The decision model was used to test the geographic information base, and the information of strong correlations between urban objects and natural objects was outputted. The drawings were exported after screening, and a visual expression was realized with Illustrator software. The research results indicated that this analysis method was feasible, effective, and easy to promote. The new archaeological discoveries included eight important line segments with a 9:6 proportional relationship (which represents the balance of Yin and Yang) and two important line segments with a 9:5 proportional relationship (which represents the supreme imperial power) in the capitals of the Western Han dynasty as well as the Sui and Tang dynasties, and 16 contraposition lines in a positive direction or oblique 45° direction (which reflects the close relationship between urban elements and natural elements). We consider that the two capitals were intentionally closely related to natural environments such as mountain peaks and valley entrances in the planning stage, and that proportions and scales with profound humanistic meaning were selected. The capital of the Sui and Tang dynasties was specially aligned with the capital of the Western Han dynasty in space. These characteristics embody ancient Chinese Confucian cultural thoughts such as the “integration of yang and yin”, “harmony between nature and humans”, the “supremacy of emperors”, and the “use of numbers and shapes to convey meaning”.

Graphical Abstract

1. Introduction

As important research objects in archaeology, urban planning, cultural heritage protection, etc., ancient cities, especially national capitals, can reflect the highest achievements of a civilization in politics, economics, philosophy, culture, and engineering to a great extent. Ancient cities have many remarkable characteristics, such as large scales, many elements, diverse forms of site preservation, a strong association with the surrounding environment, etc. Thus, research on them has complex and interdisciplinary characteristics.
One of the core aims of research on ancient cities is to understand the historical situation or explore an ancient people’s thoughts by analyzing the characteristics (size, location, relative relationship, importance, etc.) of archaeological sites in cities. This research mainly involves two specific issues.
The first issue is how to identify archaeological sites and accurately determine as well as classify their characteristics. In recent years, archaeologists and satellite-image analysts have conducted intensive scientific research in this interdisciplinary area and have achieved many results, in addition to Google Earth, they have used various satellite images for archaeological research [1], and have also used spatial information technology to identify, predict, and map archaeological sites in large-scale areas. The basic idea in identification and prediction methods is to use remote-sensing data [2] to develop a specific algorithm or analysis method to build a prediction model, thereby realizing the identification or prediction of existing and potential sites [3,4,5,6,7,8,9]. The specific methods are divided into manual implementation type and machine implementation type [10]. The analysis methods used include advanced classification algorithms (support vector machine and random forest), an analytic hierarchy process (AHP) [11], an improved Otsu segmentation algorithm with a linear Hough transform (LHT) [12], and various other techniques (spatial analysis, statistical techniques, and fuzzy logic functions [3]). Commonly used data sources include satellite image data (including historical satellite image data represented by CORONA satellite data [13,14]), elevation data, LiDAR data [15], UAV photogrammetric data [16], etc. A few scholars also use ancient documents and ancient maps [17], and usually create composite databases from several data sources that play an important role in research. The above methods have achieved good results in various archaeological exploration cases [18]. In surveying and mapping, they are mainly used to obtain the size, position, relative relationship, and other information of sites. Usually, satellite data [6,19] are used to measure large-scale objects, and surveying as well as mapping instruments are directly used for field surveying and mapping when facing small-scale objects. The data obtained from surveys are often used to produce a more accurate plan of the archaeological site through tools such as GIS [20].
The second issue is how to effectively analyze and study the characteristics of ancient cities as well as present the design ideas of an ancient people. In recent years, scholars have proposed two basic ideas: One is to discover theories or laws from material objects, observe the morphology of ancient cities, find key lines and points based on experts’ experiences, try to analyze relevant drawings by artificially adjusting geometric drawing rules, and explain the discovered phenomena with ancient theories. There are many such study cases, such as the analyses of the proportions of ancient cities [21,22], the analysis of ancient city morphologies by using a baseline [23], the capture and refinement of the “prototype” of European cities with the help of typology theory [24], etc. The other is to verify a material object with theory. Based on experts’ understandings of ancient documents, a specific concept or drawing rule is preset, and then the research objects are verified via drawing. For example, examination of ancient cities based on preset models and concepts [25,26], and the analysis of ancient cities by using circular and square drawing methods [27]. In addition, other scholars study human/environment interactions in the past through an archaeological GIS perspective [28,29,30]; these are also related to the study of ancient cities and settlements.
Although many achievements have been made in the current research, there are still some issues worthy of further discussion, including the following:
  • Spatial information technology can only be used to discover phenomena but not to explain them. Humanistic knowledge can explain phenomena, but the research methods of relevant scholars are accidental and incomplete. How can science and technology be deeply combined with the humanities in urban research to make the process more controllable and the conclusions more convincing?
  • In addition to identifying and predicting isolated sites, how can the connection between sites and a whole city, and the connection between a whole city and the surrounding natural environment, be scientifically and effectively revealed?
  • Archaeologists have first-hand archaeological excavation data, urban planners have a deep understanding of design ideas, and remote-sensing geographers have strict norms for cartography, but there is a certain gap between the various disciplines. How can the breakthroughs made in different fields be integrated and comprehensive analyses be effectively carried out?
Based on this, this paper selects the capitals of the Han dynasty as well as the Sui and Tang dynasties in China (some of the greatest capitals in the world) as its subjects for research. The purpose of this paper is to reveal the large-scale spatial relationship between ancient Chinese capitals and the natural environment, as well as the cultural connotations behind it, to provide new ideas for scientifically and efficiently exploring the relationship between cities and nature and to provide a reference for solving problems in archaeology and urban planning by using spatial information technology.

2. Background

2.1. Overview of the Han/Tang Cities

The capitals of the Western Han dynasty (202 B.C.–A.D. 8) as well as the Sui and Tang dynasties (A.D. 581–907) were located near Xi’an, Shaanxi Province, China (108.83°–109.00°E, 34.19°–34.37°N). At present, there are only archaeological sites of a spatial overlapping relationship with Xi’an. Fortunately, these sites were intentionally protected during urban construction in the 20th century, and archaeologists have effectively determined the site information of these two capitals through long-term work [31,32,33,34,35,36].
The capital of the Western Han dynasty was named Chang’an, which covered an area of about 35 square kilometers and could accommodate 300,000 people at its peak; it was one of the largest cities in the world at the time [37,38]. It was the starting point of the ancient Silk Road and witnessed the history of cultural exchange between the East and the West. From the second century B.C. to the sixth century A.D., ten dynasties and regimes successively designated it as the capital. It was not until the second year (A.D. 582) after the Sui dynasty was established that a new capital, named Daxing, was built to the southeast of the capital of the Western Han dynasty. After the establishment of the Tang dynasty (A.D. 618–907), it was renamed Chang’an. The capital of the Sui and Tang dynasties covered an area of about 87 square kilometers and could accommodate about 1 million people at its peak; it was one of the largest cities in the world at the time [37,38]. The capitals of the Han dynasty as well as the Sui and Tang dynasties are key cultural relic protection units in China. The site of the Weiyang Palace in the capital of the Western Han dynasty and the sites of the Daming Palace, Big Wild Goose Pagoda, and Small Wild Goose Pagoda in the capital of the Sui and Tang Dynasties are listed in the World Heritage List property “Silk Roads: the Routes Network of Chang’an-Tianshan Corridor”. The two cities have outstanding universal value, especially historical and cultural value.
The capitals of the Western Han dynasty as well as the Sui and Tang dynasties were located on the Guanzhong Plain, which is wide from east to west and narrow from north to south. North of the two cities was the Weihe River, flowing eastward, and further north were continuous hills. South of the two cities was the east–west mountain range called the Qinling Mountains. Some small rivers flowed from the valleys of the Qinling Mountains as well as other hills and surrounded the two cities.
The overall shape of the capital of the Western Han dynasty was close to that of a square, and its boundary was limited by the city walls. The shapes of the south wall and the north wall had obvious twists and turns. There were 12 gates in the city walls, and there were several palace areas with huge areas in the city. There were two market areas in the north of the city, and there were large-scale ritual buildings for sacrifices in the suburbs about 1 km south of the city. The capital of the Sui and Tang dynasties also took an appropriate square shape and consisted of three areas from outside to inside: the outer sub-city (residential area and places of worship), the royal city (area where the nobility lived), and the imperial city (area where the emperor and his family lived). Each area was separated by the city walls and had its own city gate. There were market areas in the east and west of the outer sub-city and a royal forbidden garden area in the north suburb of the city.
Although archaeologists have drawn ichnographies (Figure 1) for the above two capitals, these ichnographies often lack representations of the elements of the surrounding natural environment, which makes it impossible to directly and accurately observe whether there is a close connection between the environmental elements inside the cities and those outside the cities, which means that many important truths may be concealed.

2.2. Research Objects and Current Problems

The research objects are the two capitals of the Western Han dynasty as well as the Sui and Tang dynasties in China. The research goal is to establish a feasible, efficient, and easy-to-promote method and operation process that is convenient for scholars to establish a geographic information base that integrates multiple elements based on archaeological site drawings. Through it, the spatial relationship between a city and the natural environment can be explored and analyzed, and more new archaeological discoveries can be made, thus revealing the thoughts behind ancient urban planning.
This research focuses on two main aspects, i.e., accurately drawing a map of the capital cities of the Han dynasty as well as the Sui and Tang dynasties that integrates the natural elements and urban elements; the other is to make comprehensive use of archaeological and cultural knowledge to effectively analyze various relationships between cities and the natural environment in maps, identify unique phenomena, and explain the thoughts behind ancient urban planning.
The difficulties of this research lie in the following aspects:
  • A single satellite image map or topographic map cannot reflect the multiple elements needed for research; the city ichnographies drawn by archaeologists lack the surrounding environmental elements, and are not drawn in strict accordance with cartographic specifications, so they cannot be directly superimposed on satellite images (since many of the archaeological discoveries around Chang’an City were carried out in the mid-20th century or even earlier, when people did not use CAD or GIS to produce maps of the ancient city, but instead made manual drawings using tools such as ruler gauges, resulting in a number of drawings made during that period that were actually not accurate; one of the tasks of this study is to correct and align these less accurate drawings so that subsequent studies on spatial relationships can be carried out); specialized maps reflecting the characteristics of natural elements (such as a water system map and a mountain peak map) may be different due to different projection methods. How can an accurate superposition of multiple drawings be realized?
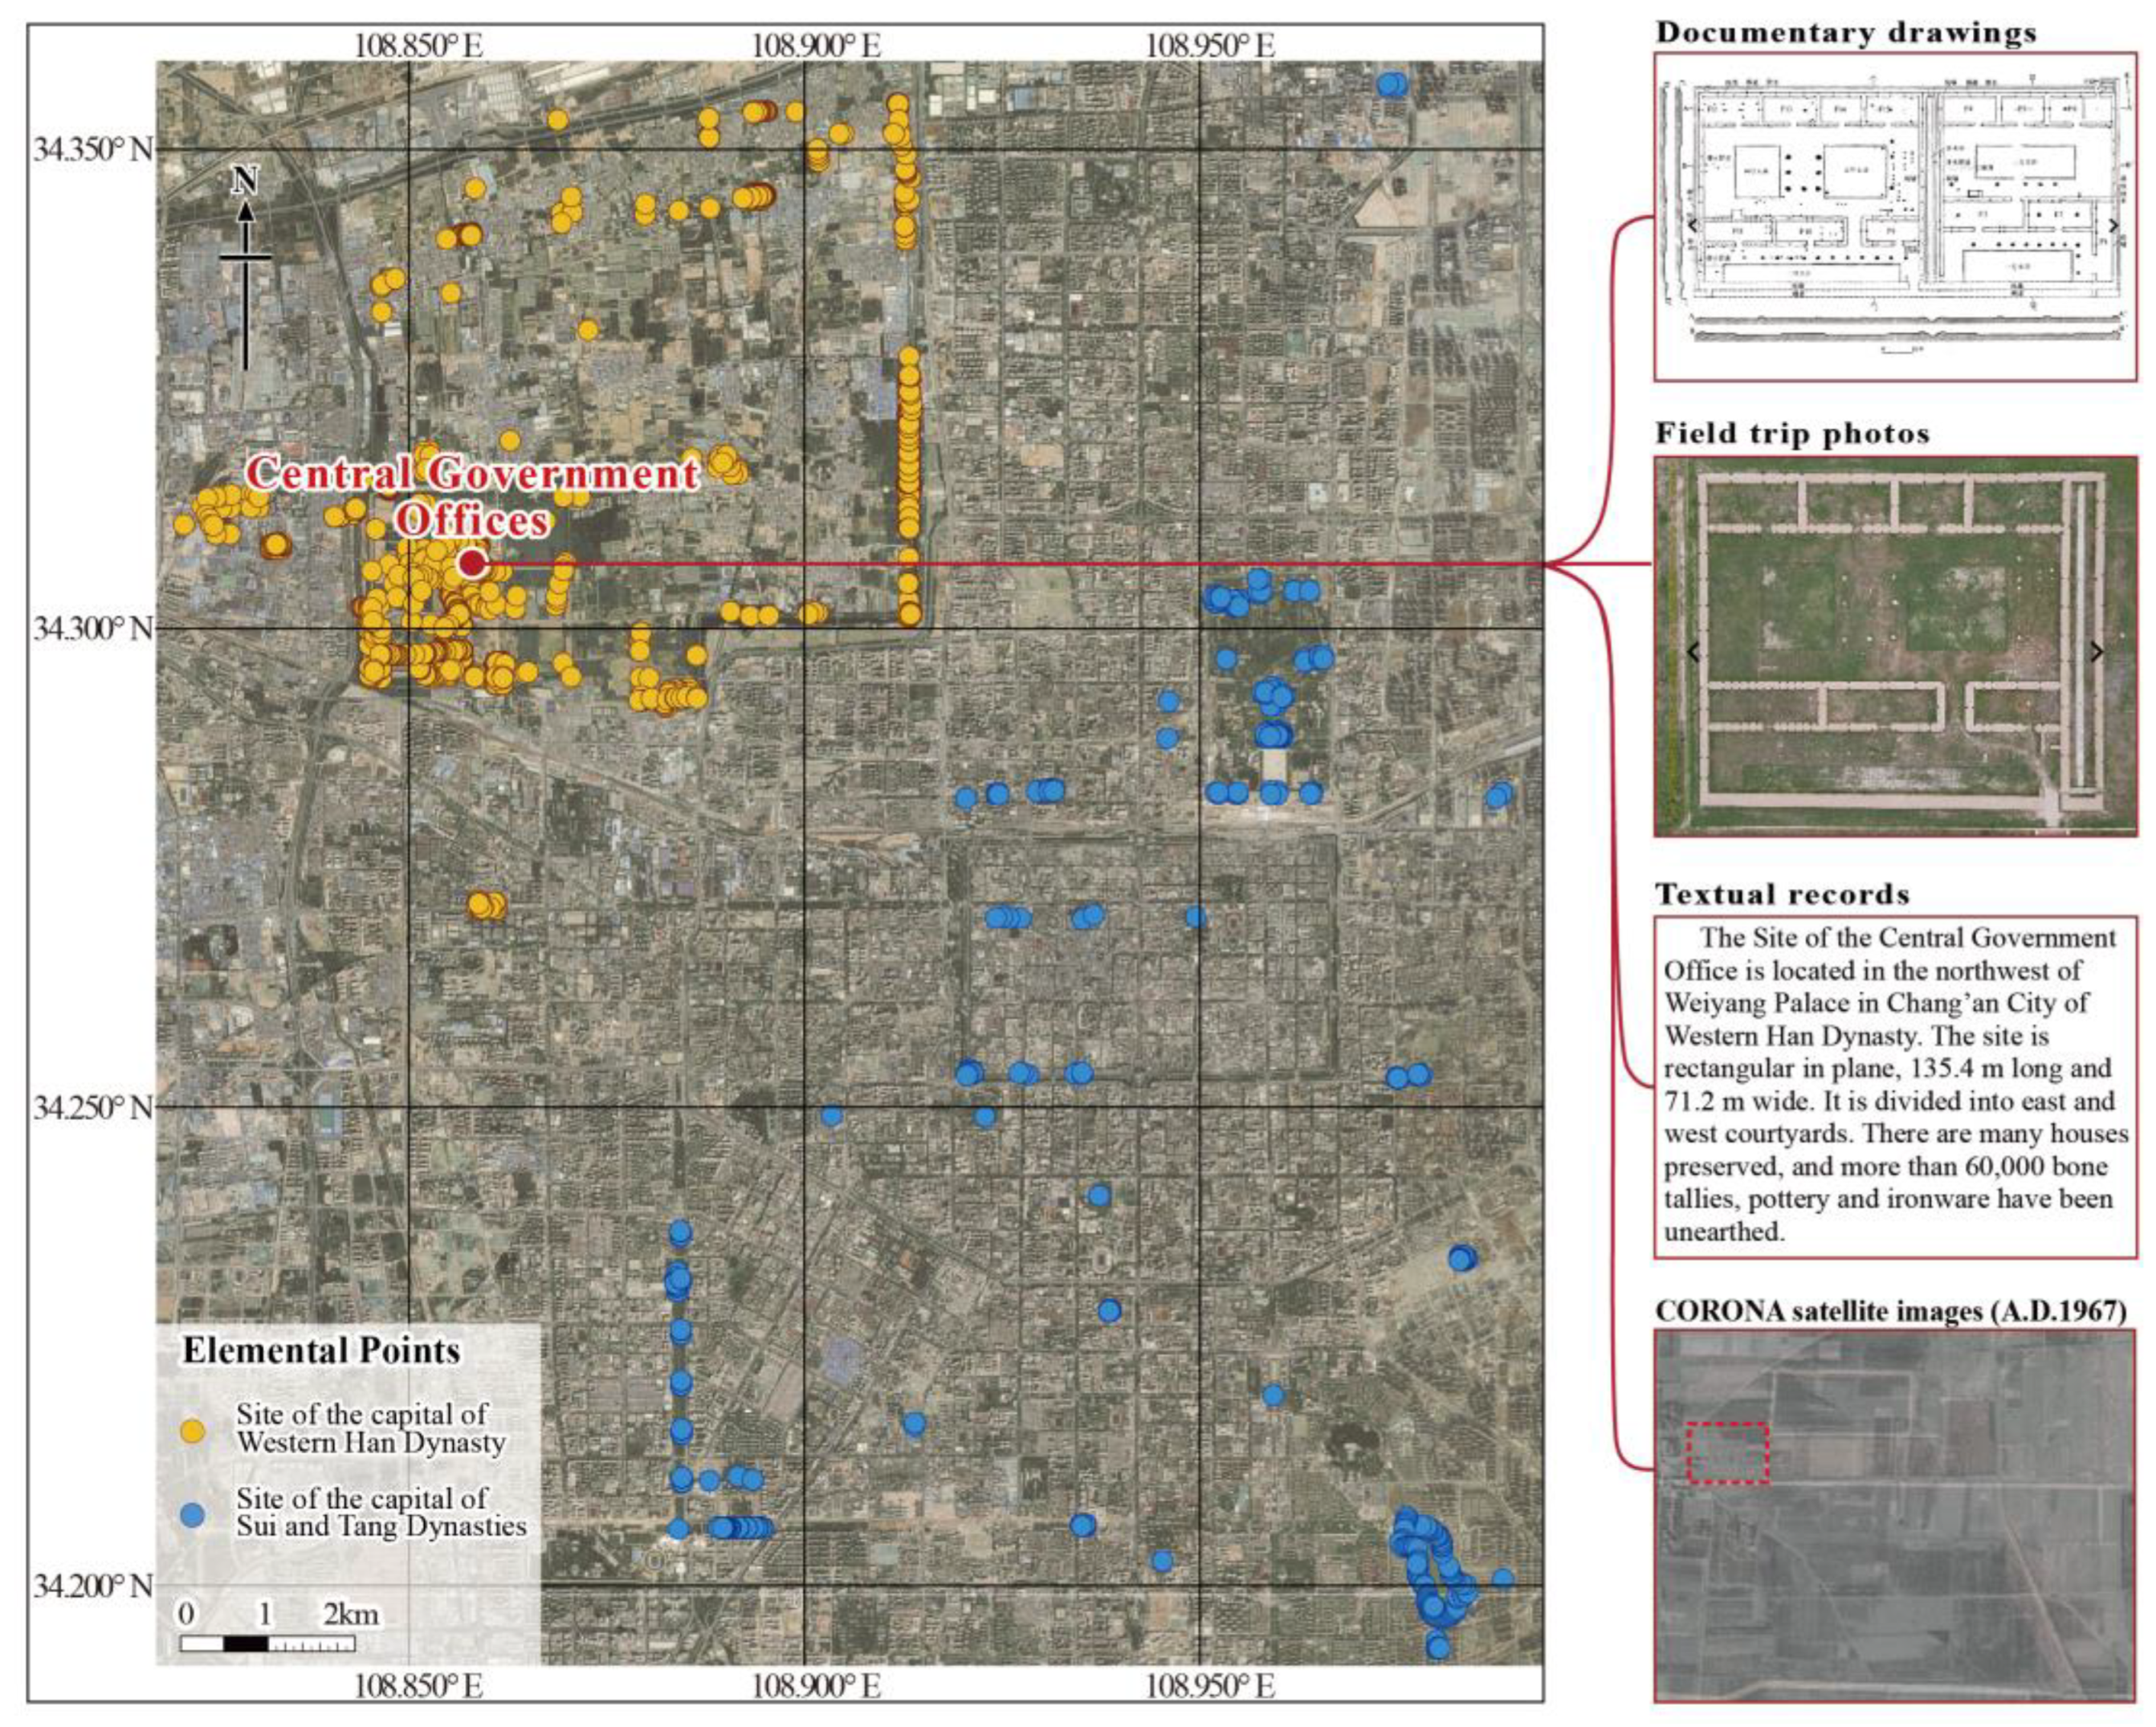
  • Chang’an from the Han dynasty and Chang’an from the Sui and Tang dynasties are currently covered by or overlap with modern cities, and several hundred surviving sites are scattered around different locations and are still visible on the surface. How can the geographical locations of the whole ancient cities be determined according to the limited scattered points? In addition, the satellite images of the sites are easily blocked or interfered with by elements such as trees on the surface, and it is difficult to accurately identify the location and shape of the sites. How can the number or accuracy of identified sites be improved?
  • How can Chinese capitals of the Western Han dynasty as well as the Sui and Tang dynasties be understood from the perspective of the ancients with the help of historical data? How can the cultural and ideological connotations behind urban planning be revealed from the relationship between the scale, proportion, and alignment of these cities?

3. Research Strategies

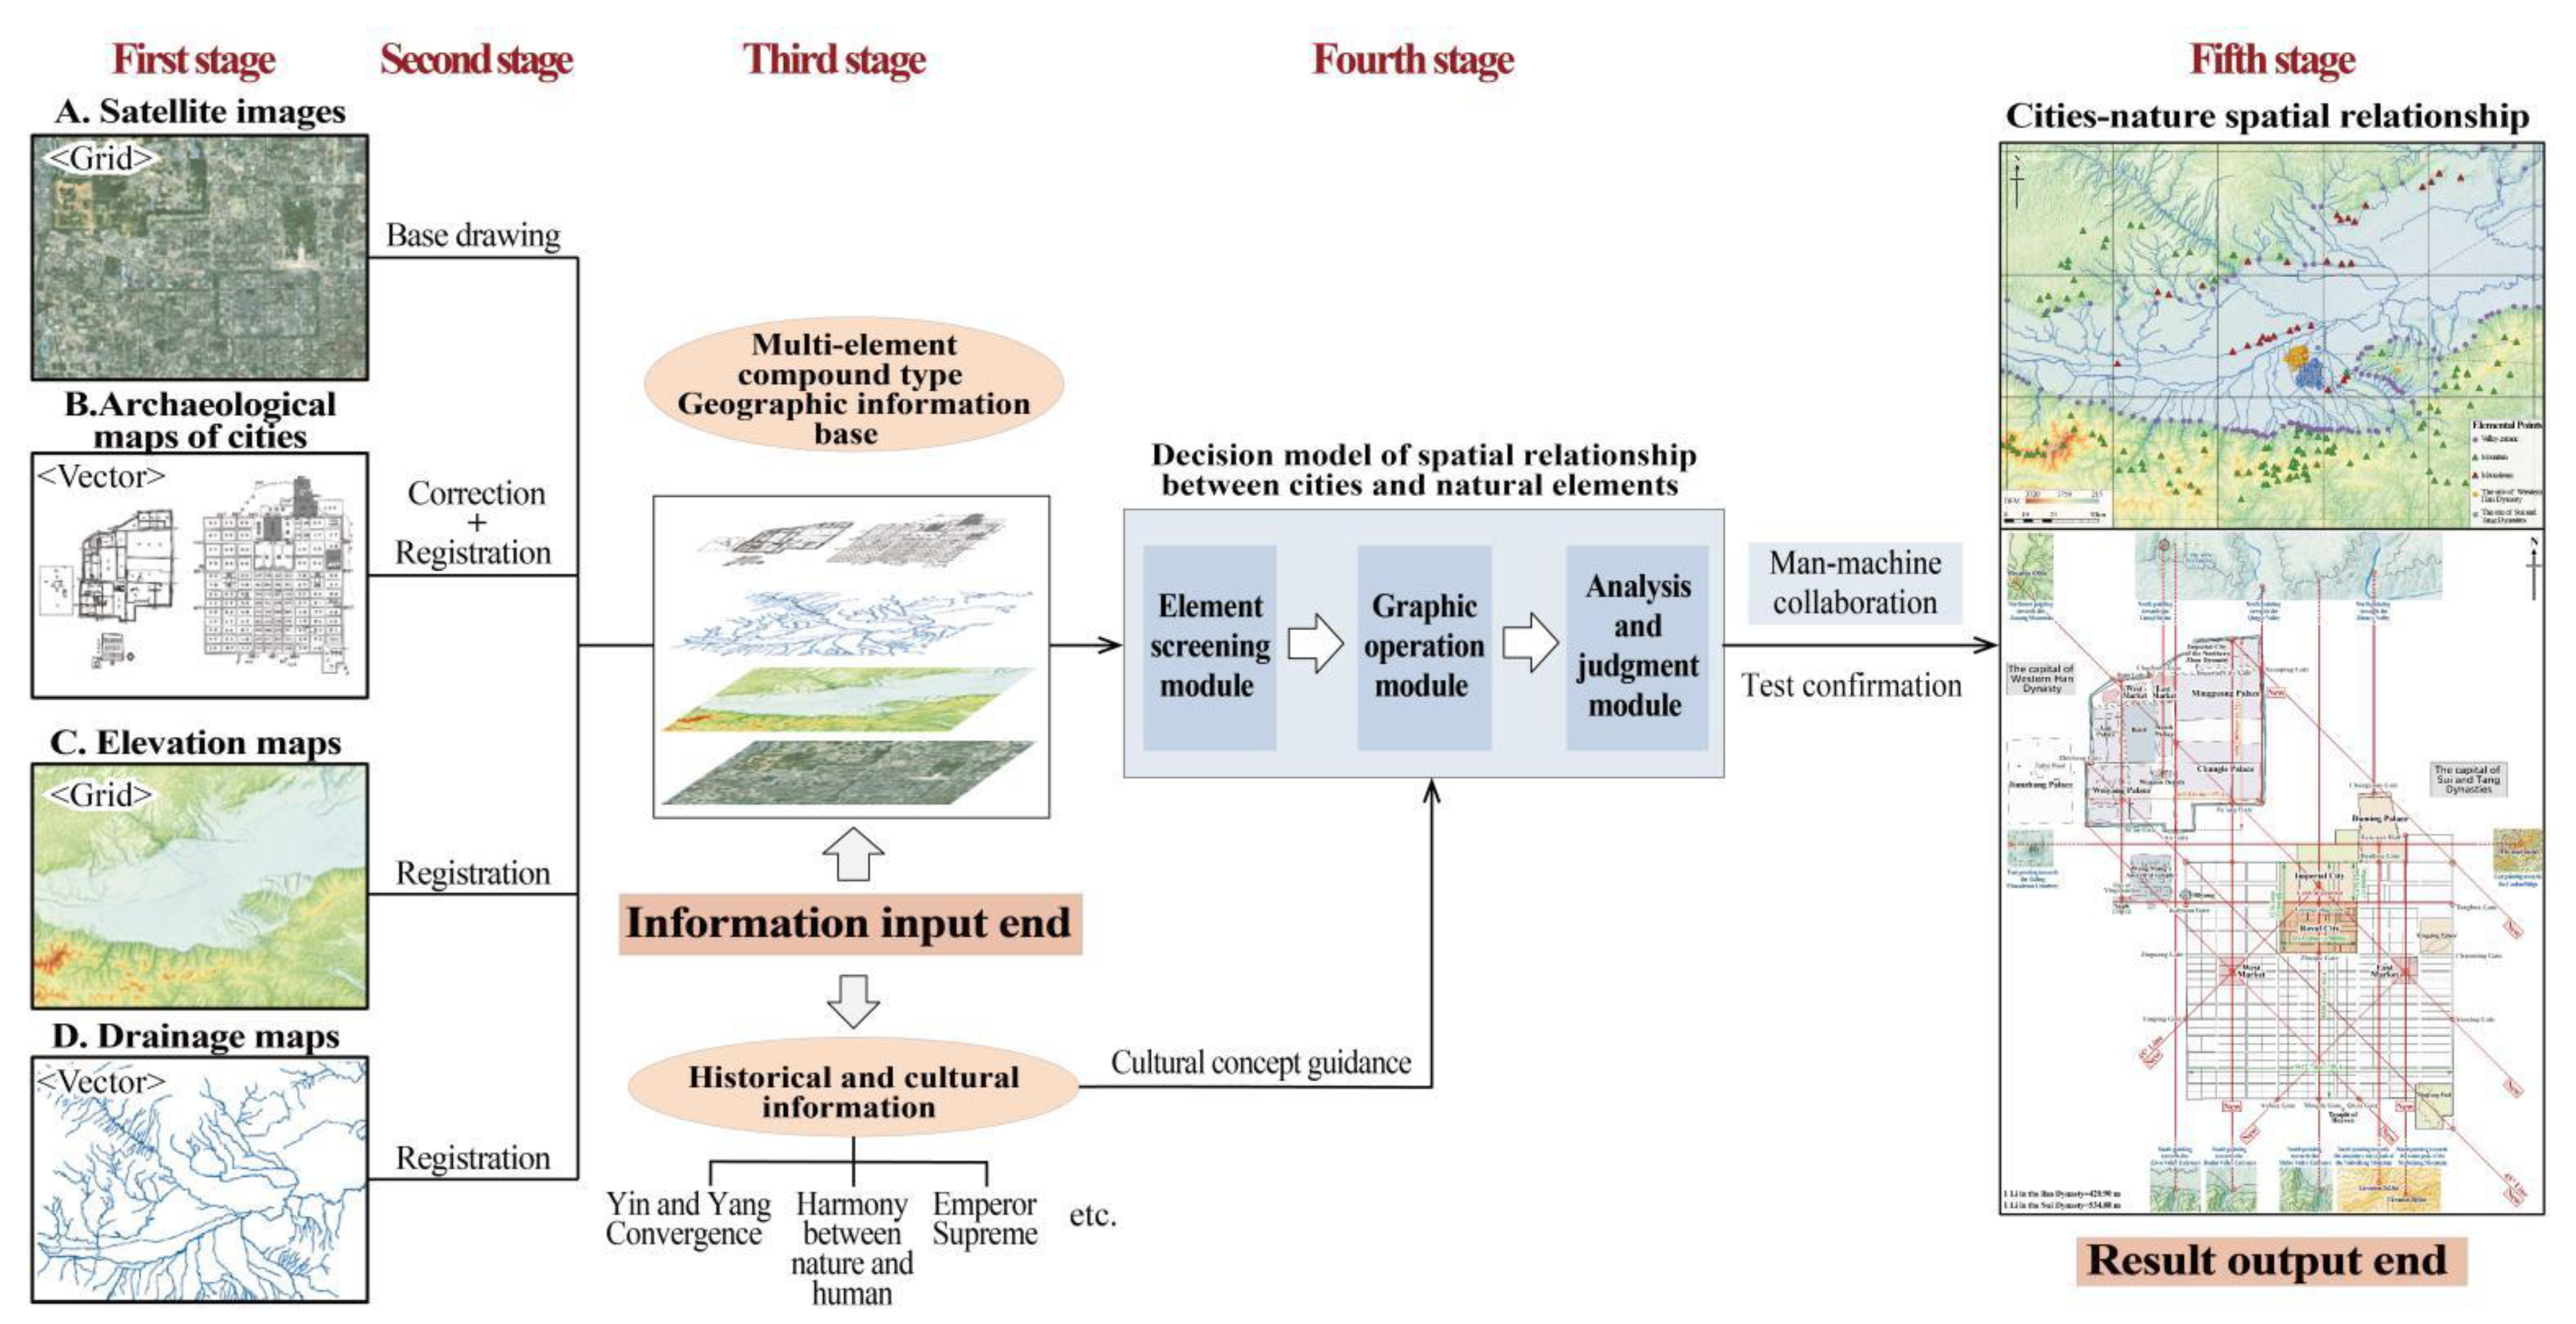
3.1. The Technical Flow Chart and Technical Defects

The technical method adopted in this research is shown in Figure 2.
In the first stage, satellite images (current and historical satellite images), elevation maps (mountain peaks and valley entrances), water system maps, city ichnographies, archaeological site excavation reports, and other related materials are collected and sorted (paper drawings need to be digitized), and then the ancient cultural thoughts are understood by reading and studying the literature on ancient urban planning and “harmony between nature and humans” (pursuing the harmonious interaction between man and everything in heaven and on Earth) [39,40].
In the second stage, relevant data are used to determine the number and name of important position points that still exist. The geographical coordinates of the abovementioned important position points are determined and obtained using today’s satellite images, and the missing points are subject to supplementary identification by combining historical satellite images and old maps. The important position points are surveyed and remeasured on the spot, and the information of all of the position points is marked on the current satellite images and city ichnographies.
In the third stage, by using GIS technology, the city ichnographies drawn by archaeologists are corrected through archaeological sites, and they are registered with current satellite images to obtain a preliminary superimposed base map (city ichnographies and current satellite images), and then the registered elevation map and water system map are superimposed onto the base map to form a geographic information base containing multisource elements of urban environments and natural environments.
In the fourth stage, a “decision model of spatial relationship between urban elements and natural elements” is constructed and parameters are set. The model includes element screening, graphic operation, analysis, and judgment modules (the structure of the model depends on different research needs, and there are some reference cases [41,42]). Urban element points are screened and prioritized (such as the turning points of city walls, city gates, and midpoints or corners of main buildings), “mapping rules” are preset (including the selection of culturally meaningful numbers, drawing axes and oblique lines with specific angles, etc.) based on cultural concepts, and thresholds are set to determine the strong correlation between elements.
In the fifth stage, decision model operation and visual expression are performed. Taking the “compound geographic information base” as the subject, a decision-making model is used to carry out tests through human–machine collaboration, the information on key points that is meaningful and has a strong association (better than the preset threshold) is outputted. The key element points and alignment lines are marked on the city ichnography by vector drawing software, thus realizing the visual expression of the analysis results.
The technical defects of the research are the following:
The preset drawing rules originate from historical texts and cultural ideas, and the understanding and selection of these ideas will vary from person to person. Therefore, it is necessary to admit that there are certain uncertain factors in the process of the analysis, but it also contains the possibility of discovering unexpected surprises. In addition, the classification mode of urban element points and the threshold for strong associations are adjustable parameters, and improper presetting will affect the results and lead to an increase in the amount of trial and error.

3.2. Specific Implementation Processes

3.2.1. Collection and Collation of Relevant Data

The satellite images which are open sources (Table 1) allow other researchers to easily replicate our methodology. In this research, on account of Google Earth being unavailable in China, the data source for the latest satellite images which we have chosen was Esri world imagery with a high resolution (0.3 m); the data source for the historical satellite images which we have chosen was CORONA satellite images (the serial number of the satellite was KH-4B, and the obtained years were A.D.1967–1972).
The distribution information of natural elements (peaks, valley entrances, rivers, etc.) is obtained from elevation maps and water system maps. The elevation map came from ALOS PALSAR (DEM data with an accuracy of 12.5 m). The water system map refers to the ancient water system map data (raster data) for the river near the capital. The water system far away from the capital refers to the “Water System and Watershed Zoning Map of Shaanxi Province” (published by the Shaanxi Bureau of Surveying and Mapping and Geoinformation in 2010, raster data). The related water systems were redrawn as vector data in satellite images. The same area containing the research subject was selected for the above map ranges, that is, the area of 107.50°–110.00°E and 33.65°–35.15°N. The latest satellite base map and elevation map adopted the Mercator projection, which has certain advantages for drawing and expressing large-scale maps in mid-latitude plain areas; the ichnography of Chang’an in the Han dynasty comes from the paper drawing published in the article A Comprehensive Review of Chang’an City in Han Dynasty–Commemorating the Sixty Years of Archaeology of the Site of Chang’an City in Han Dynasty, and the ichnography of Chang’an in the Sui and Tang dynasties comes from the paper drawing published in the book named Compilation of Archaeological Data of the Site of Chang’an City in Sui and Tang Dynasties. The projection methods adopted by the two sets of ichnographies are not explained. The paper version of the city ichnographies drawn by archaeologists was scanned to form a digital map, which was then depicted as a vector map in Adobe Illustrator software (made by Adobe Systems Inc., San Jose, CA, USA).
The archaeological data involved in the research include books and papers [31,32,33,34,35,36,37,38,39,40,41,42,43,44,45,46], by means of which it is possible to deeply understand the cultural thoughts of the ancient Chinese.

3.2.2. Marking of Archaeological Sites

From the above documents, the names of key archaeological sites were sorted and marked at the corresponding positions of the city ichnography (Figure 3). The current satellite images were checked, the geographical location was marked with the QGIS-OSGeo4W software (an official project of the Open Source Geospatial Foundation), and the historical images of the CORONA satellite and old maps were used for the supplementary identification of sites that were damaged or had disappeared [13,43]. The abovementioned sites were subjected to field surveys and identification, and full conversations with local residents were carried out to obtain important information. The RTK (real-time kinematic) method was used to check the coordinates of element points, and the sorted investigation photos, literature drawings, and interview content texts were loaded into the remarks of the corresponding points in QGIS software (Figure 3) so that important sites contained all-round available information.

3.2.3. Correction, Registration, and Superposition of Multisource Information Maps Based on GIS

In QGIS software, the city map, elevation map, and water system map were registered and superimposed with current satellite images.
Firstly, marked sites with the same name were used to correct and register the city ichnography, so that they could be accurately superimposed with satellite images. The more scattered and numerous the sites were, the more remarkable the registration effect was. In the research, 228 archaeological site objects (163 objects from the Han dynasty and 65 objects in the Sui and Tang dynasties) were marked, involving 2504 site coordinate points (1940 in the Han dynasty and 564 in the Sui and Tang dynasties).
Since the existing city ichnographies are not completely accurate, some sites could not be registered all of the time. Therefore, we were first required to perform a “trial to registration” between the city ichnographies with satellite images to determine the problems existing in the city ichnographies, then we corrected the city ichnographies according to the coordinate positions of the sites, modified the lines that did not conform to the facts in the ichnographies, and then registered the two ichnographies again until they completely matched. In the registration, “histogram stretching” is adopted, and the “linear” transformation type was adopted. After operation, geometric correction, projection transformation, and a unified scale could be realized, thus giving us a preliminary base map.
Then, the elevation map was further superimposed onto the base map. Since it adopted the same projection coordinate system as the current satellite image, it could be quickly superimposed using only three sites with the same name in theory. In order to ensure accuracy, six sites with the same name were used for registration this time. Thereafter, a similar operation to that used for the elevation map was repeated for the water system map. Since the water system map and the satellite map had the same projection coordinate system, the registration could be realized quickly. After the above operation, a compound geographic information base of urban elements and natural environment elements was formed.

3.2.4. Construction and Parameter Setting of “Decision Model of Spatial Relationship between Urban Elements and Natural Elements”

A “Decision Model of Spatial Relationship between Urban Elements and Natural Elements” (Figure 4) was constructed, which consisted of three parts: an “Element Screening Module”, a “Graphic Operation Module”, and an “Analysis and Judgment Module”. Each module involved the setting of several adjustable parameters that could be debugged and optimized by man–machine coordination. The input end of the model is the previously generated “compound geographic information base”, and the results of the output end of the model were the judgment value of a strong spatial association among the elements and the corresponding graphic diagram.
In the decision model of this research, the specific contents of each module were as follows.
The “element screening module” was mainly used to screen and grade urban element points and natural element points. Urban element points were selected from the turning points of the city walls, the midpoints of the city gates, and the corners and midpoints of the main building areas in the Han dynasty as well as the Sui and Tang dynasties (the midpoints of the sideline in particular can also be included for important buildings), among which the main building areas involved the imperial city area (or the palace building group area), the royal city area, the market area, the sacrificial area, and the urban landscape area [44]; when the priority was divided, element points such as the city walls, city gates, the imperial city area, and the royal city area, which have an important impact on the urban structure and form, were designated as the first level, as are the mausoleums on the outskirts of town, while other element points were designated as the second level as auxiliary references. Natural element points were selected from peaks in the area of the compound geographic information base (the points above 1500 m above sea level and with the maximum local elevation), the valley entrance (the midpoint of the line segment at the opening), and the river bifurcation points or intersection points within the composite map area. When the priority is divided, the element points with high stability in the mountain peaks and valley entrances were classified as the first level, while other element points that are easy to change were classified as the second level. There were 407 first-level element points set in this research, including 169 urban element points and 238 natural element points; there were 359 s-level element points set, including 69 urban element points and 290 natural element points. These element points were marked with different shapes and colors. Since the element points come from different objects (buildings or natural objects), it is necessary to assign object attribute values to each element point (which can be marked differently through the method of natural sequence + object name) to describe the mapping relationship between element points and real objects.
The “Graphic Operation Module” used the element points screened out in the previous stage to carry out specific graphic operations. The drawing rules and parameters need to be preset based on cultural concepts and can be changed according to different research objectives. The graphic operation rules (Figure 5) set in this research were as follows:
(1)
Operation of “drawing an axis”. The direction parameters of the axis are set in a north–south direction and an east–west direction, which is in line with the ancient Chinese cultural cognition of “four directions” and “center”. The axis must pass through at least two first-level element points before it is regarded as valid.
(2)
Operation of “drawing an oblique line at a specific angle”. The direction parameters of the oblique lines are set to have angles of 30°, 45°, and 60° with meridians, respectively, which also correspond to 1/12, 1/8, and 1/6 of the circumference of 360°. There is also a harmonious and regular proportional relationship between the side lengths of the right triangles formed by them, so the oblique lines of these angles have a special significance in Chinese culture. An oblique line shall be considered valid only if it passes through at least two first-level element points.
(3)
Operation of “selecting culturally meaningful numbers to determine the scale and proportion”. In ancient Chinese Confucianism, yang and yin are the basic units of the whole universe, while the numbers nine and six represent yang and yin [47,48], respectively. In addition, the number nine is the largest number among unit digit integers, while the number five is the number in the middle of unit digit integers. Combined, the numbers nine and five have the meaning of “being in the center and having the highest status” and serve as the symbol of imperial power in ancient China [47,49]. As for the object of the scale analysis, we selected the length of a line segment formed by connecting any two key element points. The purpose of the analysis is to check whether the length has multiple relationships or additive summation relationships with ancient lengths, such as 9 Li, 6 Li, 5 Li, 900 Bu, 600 Bu, and 500 Bu. The abovementioned “Li” and “Bu” are Chinese length units; Bu means to take one step with both feet; Li is a larger unit of length, with 1 Li = 300 Bu in the Han dynasty and 1 Li = 360 Bu in the Sui and Tang dynasties. The object of the ratio analysis is the length ratio between related line segments (two effective alignment line segments with one element point with the same name can be called related line segments), and the purpose of the analysis is to check whether the length ratio of these two line segments is 9:6 or 9:5.
Man–machine coordinated dynamic debugging is worth explaining. The rules of the location selection and classification of element points need to be determined by researchers after carefully observing the actual situation (especially natural element points), so there will be many man–machine interaction behaviors. In a scale calculation, it is now generally believed that one Bu in the Han dynasty represented roughly 1.3–1.4 m, while one Bu in the Sui and Tang dynasties represented roughly 1.45–1.55 m. Researchers need to dynamically debug the precise length of one Bu, so as to examine whether the lengths of related objects in the capitals of the Western Han dynasty as well as the Sui and Tang dynasties conform to the number of Li or Bu of integers. Although this process can rely on a related algorithm with minimal variance, the selection of the lengths of objects for investigation is based on cultural concepts and the understanding of the importance of things, which still need to be realized by man–machine coordination.
Figure 5. Schematic diagram of the graphic operation method.
Remotesensing 14 03298 g005
The “Analysis and Judgment Module” was used to compare the trial value obtained by graphic operation with the target value, calculate the corresponding degree of association, and judge whether there is a strong association situation that degree of association is better than threshold value. Since the length will change with the expansion of the object scale, the length association degree (expressed by ADl) can be set as the ratio obtained by dividing the smaller value between the trial length value (expressed by La) and the target length value (expressed by Lb) by the larger value, which is expressed as a percentage; ADl can be calculated by the following formula:
ADl = MIN (La, Lb)/MAX (La, Lb)
Since the angle does not change with the expansion of the object scale, the angle association degree (ADa) can be set as the ratio of the complementary angle of the angle difference between the trial angle value (expressed by α) and the target angle value (expressed by β) to a right angle (i.e., 90°), which is expressed as a percentage. ADa can be calculated by the following formula:
ADA = [90° ABS(α − β)]/90°
When the degree of association between the trial value and the target value is better than (greater than or equal to) the preset threshold value, they are considered to be strongly associated. In the present study, the influence of the threshold value change was preliminarily investigated by man–machine interaction, and then the strong association threshold values of the length and angle were set to 98% according to the situation, which is equivalent to the allowable error of 20 m per 1 km in length and about 1.8° in terms of angles. During the test, the element points were selected from the test objects in descending order of priority (first level and then second level). According to the preset drawing rules in the “Graphic Operation Module”, corresponding alignment analysis lines were drawn towards the outside. The intersection between the alignment lines and the important natural element points within the scale range selected above was checked, and the key dimensions and angles were measured so as to judge whether the trial value was strongly associated with the target value (exceeding the threshold value). If the judgment result was “Yes”, the information of the relevant element points was outputted; if it was “No”, other element points were selected and the above test was repeated for verification. Since the shape of the analysis object was mostly rectangular, the four endpoints in the object were strongly associated, so the results of such a strong association needed to be eliminated. If no ideal results were obtained in each test, this indicated that there was no spatial correlation between urban elements and natural elements under the basic presupposition.

3.2.5. Operation and Visual Expression of the “Decision Model”

In this study, the combination of any two element points can form a calculation unit. The total number of calculation units can be expressed by Nu; this value is the number of combinations of 766 element points, and each calculation unit needs to perform the operation with the same rules. The number of unit operations (expressed by Nc) was 14, including one object attribute judgment operation (if the object attribute values of two element points were the same, this indicates that they belonged to the same object and were judged as invalid solutions), five angle operations, and eight size–scale operations. The total number of calculations (expressed by N) can be calculated by the following formula:
N = N c N u = 14 C 766 2 = 14 766 ! 2 ! ( 766 2 ) ! = 4,101,930
Therefore, the total number of element point operations this time was 4,101,930. In order to improve the computational efficiency, the QGIS platform was redeveloped by using the Python programming language (Python Software Foundation, State of Delaware, America), and the decision model code was implanted into the platform, which could realize the automatic operation of the analysis and decision process (Figure 6). The total operation time was about 5–10 s, which is very convenient.
After calculation, the information set of effective element points and point plots with attribute information could be outputted by cooperating with further manual screening. The key element points and alignment lines that were meaningful and conform to preset rules could be found accordingly. The ichnographies of Chinese capitals of the Western Han dynasty as well as the Sui and Tang dynasties in QGIS were exported to a picture format (.jpeg). The key element points screened out and the alignment lines were marked on the city ichnography with Adobe Illustrator software, and the layout, color matching, and labeling were adjusted to have a visual aesthetic feeling, so as to realize the visual expression of the analysis results. Some references concerning digital humanities were referred to in this study [50,51].

4. Results

4.1. Accurate Ichnography and Size Analysis Results of Chinese Capitals of the Western Han Dynasty as Well as the Sui and Tang Dynasties

In this study, an accurate ichnography of Chinese capitals of the Western Han dynasty as well as the Sui and Tang dynasties in addition to the natural environment (Figure 7), which integrates multiple elements, realized the calibration of the previously published city ichnographies and incorporated environmental elements such as the water system, mountain peaks, valley entrances, sites around the city, and elevation information into the ichnography.
Relying on this accurate ichnography, a spatial size data table (Table 2) of Chinese capitals of the Western Han dynasty as well as the Sui and Tang dynasties was also created. By comparing the calibrated current size with the size in previous research results, it was found that the overall size difference of the capital of the Western Han dynasty is small, with the maximum difference being 0.30%, while the overall size difference of the capital of the Sui and Tang Dynasties is notable, with the maximum difference being 1.30%, which may be due to the incremental error caused by topographic relief in previous measurements. In addition, through debugging, it was found that the ideal value of the capital size is in good agreement with the calibrated measured value when the unit size is as follows: 1.403 m for 1 Bu, 420.9 m for 300 Bu in 1 Li in the Han dynasty, 1.486 m for 1 Bu, and 534.88 m for 360 Bu in 1 Li in the Sui Dynasty. In this case, the total sizes of the capitals of the Western Han dynasty as well as the Sui and Tang dynasties are very close to integer multiples of 1 Li (or 0.5 Li), while the sizes of important areas, such as the imperial city and royal city in the Sui and Tang dynasties, are integer multiples of 100 Bu, and the maximum error between the calibrated value and ideal value is only 0.55%. This is equivalent to restoring the ancient scale length and putting forward the ideal size in the planning and design of these two capitals.

4.2. Analysis Results of the Spatial Alignment Relationship between Chinese Capitals of the Western Han Dynasty as Well as the Sui and Tang Dynasties and the Natural Environment

We also created a data table and a corresponding analysis chart of the spatial alignment relationship between the capitals of the Western Han dynasty and Sui and Tang dynasties and the natural environment. In fact, a total of 79 alignment lines were discovered by computer. However, good results require man–machine collaboration; after manual identification and review, sixteen effective and meaningful alignment lines were finally confirmed, including four due north–south axes and two due east–west axes that had been discovered by previous scholars (Table 3) whose existence have been verified again in this study; four due north-south axes and six 45° oblique lines have also been newly discovered (Table 4). These ten newly discovered alignment lines are the key alignment lines connecting the capitals of the Western Han dynasty and the Sui and Tang dynasties and the natural environment (Figure 8), which are important new archaeological discoveries. The coincidence degree of the existing discoveries was relatively low, and most of the coincidence degrees of the new discoveries exceeded 99%.

4.3. Proportion Analysis Results of Chinese Capitals of the Western Han Dynasty as Well as the Sui and Tang Dynasties

In this study, a proportion analysis data table (Table 5) and corresponding drawing (Figure 9) of the Chinese capitals of the Western Han dynasty as well as the Sui and Tang dynasties were created, from which it was found that there are specific proportional relationships between the two capitals that involve 10 pairs of line segment combinations. There were six line segments with a 9:6 proportional relationship in the Western Han dynasty capital and two line segments with a 9:6 proportional relationship as well as two line segments with a 9:5 proportional relationship in the Sui and Tang dynasties’ capital. Most of the coincidence degrees exceeded 99%. The end points of the line segments involved are basically important urban element points, and a few are important natural element points.

5. Results Discussion

5.1. Accuracy of Results

The overall accuracy of the compound geographic information base obtained this time is about 8–10 m, which can support a 1:20,000 large-scale map presentation, and the accuracy in cities can be close to 3.5 m, which is significantly improved compared with previous research results. This is mainly due to the use of 0.3 m-pixel high-resolution satellite images, which ensure the reliability of the research conclusions. The main sources of errors are the resolution of the satellite images themselves, the errors caused by the superposition and matching of multilayer images, and the errors caused by the manual identification and positioning of element points, which will be further reduced with the improvement of scientific and technological standards.
In addition, there were construction errors caused by ancient people due to technical limitations, which have occurred and cannot be eliminated. Therefore, such errors are eliminated by presetting the threshold value during the analysis. In this study, the threshold value is set to 98%. When it increases, the credibility of the results increases, but the results that meet the requirements decrease sharply; when it decreases, the credibility of the results decreases, but the results that meet the requirements increase obviously. At present, the set threshold value takes into account two factors—the credibility and number of results—and can ensure that the images are visually convincing.

5.2. Cultural Connotations behind Capital Scale and Proportion Figures

As can be seen from the scale and proportion results, although the two Chinese capitals of the Western Han dynasty as well as the Sui and Tang dynasties were separated by nearly a thousand years, they shared inherent common planning and design concepts. They tended to use a specific proportion of line segments for planning. These lines were closely linked with key urban elements, such as palace areas, city wall boundaries, city gates, and markets. There were attempts to express the harmonious relationship between yin and yang through the digital ratio of 9:6, with profound humanistic connotations, and to highlight the supreme status of emperors by strengthening the core position of palace areas where emperors were located and by using the digital ratio of 9:5. The ancients conveyed “number” through the great work of a city, which was seen as a key to revealing the mystery of the universe.

5.3. Alignment Relationships between Capitals and the Natural Environment and Their Cultural Connotations

As can be seen from the results of the alignment analysis, the central axis of the capitals in the Western Han dynasty as well as the Sui and Tang dynasties had a clear alignment relationship with distant valley entrances and mountain peaks, forming a whole of “city–nature” integration, which was inseparable from the ancient Chinese thought of “harmony between nature and humans” (pursuing the harmonious interaction between man and everything in heaven and on Earth [39,55]) and is also reflected in the superb understanding accumulated by the ancient people’s long-term in-depth observation of natural geography. Why did the ancient Chinese choose to align these natural elements with urban elements? We believe there are the following reasons: Firstly, the peaks and valley entrances were the most easily recognizable topographical markers and were very culturally significant representations [56], while palaces and marketplaces were the most important spatial areas in ancient capitals, and the city walls delineated the city boundaries. Aligning important capital elements with eye-catching topographical markers remotely could have the effect of reinforcing each other and highlighting urban design ideas. Secondly, in order to highlight the most important central axis of the city, the ancient Chinese would deliberately have this central axis point to valley entrances so that the symmetrical hills on either side of the valley entrances would form a visual foil. The Han dynasty capital city’s central axis was aligned with the Ziwu Valley, a unique valley running very close to due north–south. Its name means Midnight and Noon. It was an interesting example of the Chinese expression of fusion of time and space. A turtle-shaped boulder was located at the mouth of the valley opposite the central axis of the Sui and Tang capitals, and the turtle was a divine creature worshipped at the time, which represented keeping the capital safe for a long time. Thus, the two valley entrances are rich in cultural significance. Thirdly, the ancients would also have chosen high and graceful peaks (Niubeiliang mountain, Jiuzong mountain, Caolian ridge) as markers so that other subdominant axes pointed to them so that people in the city could easily see the eye-catching peaks and thus further understand the unique position in which people stood in the city [57].
In addition, the capital of the Sui and Tang dynasties was deliberately aligned with the important elements of the capital of the Western Han dynasty through 45° oblique lines, which was a unique way for the ancient people to pay tribute to historical time with the city as the carrier, to show that the Sui and Tang dynasties were derived from the same origin with the Han dynasty. Oblique lines of 45° also symbolize eight directions and remarkably reflect the ancient concept of spatial orientation.

6. Conclusions

In conclusion, the following conclusions were obtained:
(1)
This research has formed a complete and feasible technical process of “humanistic knowledge + map → geographic information base → decision model → man-machine collaboration test → analysis result → visual representation”, which can be widely used in different urban objects. The humanities can tell technology how to make decisions (including how to set appropriate rules and parameters), while technology can answer the question as to how the humanities can provide support (including how to realize a series of operations, such as measurement, analysis, judgment, and visual presentation). When analyzing the spatial relationship between large-scale archaeological objects (represented by ancient cities), it is necessary to fully grasp the spatial information technology and cultural concepts and to construct a “decision model” with clear operation steps. By analyzing the elements and their relationships, previous accidental discoveries can be turned into observable, easy-to-understand, and controllable deterministic results and this can also be convenient for revealing deeper cultural connotations.
(2)
The “decision model of spatial relationship between urban elements and natural elements” constructed by this study includes three modules: element screening, graphic operation, and comparison analysis. The setting of rules and parameters needs to be based on ancient Chinese urban planning concepts and debugged through man–machine coordination. The operation depends on GIS, AI, Python, and other software tools. The input is a variety of maps and historical as well as cultural information; the output is the data table and visual drawing of the spatial relationship between the capitals and the natural environment, which provide strong support for discovering and explaining ancient peoples’ urban planning thoughts.
(3)
In this study, 16 alignment lines related to the surrounding natural environment were found in Chinese capitals of the Western Han dynasty as well as the Sui and Tang dynasties, important urban elements (taking the central or angular points) were associated with surrounding peaks or valley entrances crossings tens of kilometers by means of predetermined alignment lines (it could be argued that the ancient Chinese purposefully positioned important urban elements in their urban plans to face already existing peaks or valley entrances crossings). These alignment lines are divided into three categories: due north–south axis, due east–west axis and 45° oblique line, all of which have a better than 98% agreement with the ideal values, most of which are better than 99%, this proves that these two capitals in different periods were closely related to the surrounding natural environment. The capital of the Sui and Tang dynasties also intended to establish an association with the capital of the Western Han dynasty in its planning (this was also signaled via the use of alignment lines). The key parameters involved in the cities were related to the concepts of the “integration of yang and yin” (9:6 proportion), the “harmony between nature and humans” (used alignment lines to strengthen the relationship between urban elements and natural elements), the “supremacy of emperors” (9:5 proportion), and the “meaning conveyed by numbers and shapes”, which reflect the idea that ancient Chinese people had a high level of urban planning and unique cultural thoughts thousands of years ago, and also verify the correctness of some previous scholars’ research results.
(4)
The method of a composite map that integrates multisource information is further optimized, which can effectively superimpose an ancient city map, elevation map, and drainage map with today’s satellite images accurately, and the accuracy of the results is improved compared with previous studies; it can serve archaeology, urban planning, ecology, and other multidisciplinary fields. Comprehensive archaeological research involves many fields, and the drawings drawn by scholars of different specialties will be quite different, which will affect the accuracy of the research results. Therefore, future archaeologists should strengthen their knowledge of remote sensing technology and cartography. When drawing large-scale archaeological site drawings, they should also fully consider the surrounding important natural environment (such as mountains, valley entrances, rivers, etc.), and make necessary marks on the drawings.

Author Contributions

S.C. conceived the research, wrote the paper, collected and processed the data, established the decision models, set the relevant parameters, and drew relevant drawings; X.X. assisted S.C. in drawing the relevant drawings; K.S. realized map data extraction; M.Y. and Y.D. assisted S.C. in establishing the decision model; Q.H. provided some valuable suggestions; J.G. assisted S.C. in using Python to automate the decisions. All authors have read and agreed to the published version of the manuscript.

Funding

This research was supported by the National Key R&D Program of China (grant no. 2021YFB2600401) and the Fundamental Research Funds for the Central Universities (Chang’an University) (grant no. 300102410656).

Acknowledgments

Many thanks to Xiangyu Chen, Lin Zhang, Chen Peng, Xinchi Wang, Wenjuan Pu, Li Yuan, Shuang Liang, and Shiyong Zhao for their help.

Conflicts of Interest

The authors declare no conflict of interest.

References

  1. Agapiou, A.; Alexakis, D.D.; Sarris, A.; Hadjimitsis, D.G. On the use of satellite remote sensing in archaeology. In Best Practices of Geoinformatic Technologies for the Mapping of Archaeolandscapes; Sarris, A., Ed.; Archaeopress: Oxford, UK, 2015; pp. 115–125. [Google Scholar]
  2. Krupochkin, E.P.; Sukhanov, S.I.; Vorobiev, D.A. Remote Sensing as a Tool for Archaeological Exploration and Mapping of Archaeological Sites (on the Example of Altai Model Sites). Geod. Cartogr. 2019, 80, 40–54. [Google Scholar] [CrossRef]
  3. Nsanziyera, A.F.; Lechgar, H.; Fal, S.; Maanan, M.; Saddiqi, O.; Oujaa, A.; Rhinane, H. Remote-sensing data-based Archaeological Predictive Model (APM) for archaeological site mapping in desert area, South Morocco. Comptes Rendus Geosci. 2018, 350, 319–330. [Google Scholar] [CrossRef]
  4. Gioia, D.; Bavusi, M.; Di Leo, P.; Giammatteo, T.; Schiattarella, M. A geoarchaeological study of the Metaponto coastal belt, Southern Italy, based on geomorphological mapping and GIS-supported classification of landforms. Geogr. Fis. Din. Quat. 2016, 39, 137–148. [Google Scholar]
  5. Luo, L.; Wang, X.; Liu, C.; Guo, H.; Du, X. Integrated RS, GIS and GPS approaches to archaeological prospecting in the Hexi Corridor, NW China: A case study of the royal road to ancient Dunhuang. J. Archaeol. Sci. 2014, 50, 178–190. [Google Scholar] [CrossRef]
  6. Bachagha, N.; Luo, L.; Wang, X.; Masini, N.; Moussa, T.; Khatteli, H.; Lasaponara, R. Mapping the Roman Water Supply System of the Wadi el Melah Valley in Gafsa, Tunisia, Using Remote Sensing. Sustainability 2020, 12, 567. [Google Scholar] [CrossRef] [Green Version]
  7. De, L.V.; Paulissen, E.; Waelkens, M. Methods for the extraction of archaeological features from very high-resolution Ikonos-2 remote sensing imagery, Hisar (southwest Turkey). J. Archaeol. Sci. 2007, 34, 830–841. [Google Scholar]
  8. Menze, B.H.; Mühl, S.; Sherratt, A.G. Virtual survey on north Mesopotamian tell sites by means of satellite remote sensing. In Broadening Horizons: Multidisciplinary Approaches to Landscape Study; Ooghe, B., Verhoeven, G., Eds.; Cambridge Scholars Publishing: Newcastle, UK, 2007; pp. 5–29. [Google Scholar]
  9. Kvamme, K. An examination of automated archaeological feature recognition in remotely sensed imagery. In Computational Approaches to Archaeological Spaces; Bevan, A., Lake, M., Eds.; Left Coast Press: Walnut Creek, CA, USA, 2013; pp. 53–68. [Google Scholar]
  10. Bachagha, N.; Wang, X.; Luo, L.; Li, L.; Khatteli, H.; Lasaponara, R. Remote sensing and GIS techniques for reconstructing the military fort system on the Roman boundary (Tunisian section) and identifying archaeological sites. Remote Sens. Environ. 2020, 236, 111418. [Google Scholar] [CrossRef]
  11. Nsanziyera, A.F.; Rhinane, H.; Oujaa, A.; Mubea, K. GIS and Remote-Sensing Application in Archaeological Site Mapping in the Awsard Area (Morocco). Geosciences 2018, 8, 207. [Google Scholar] [CrossRef] [Green Version]
  12. Luo, L.; Bachagha, N.; Yao, Y.; Liu, C.; Shi, P.; Zhu, L.; Shao, J.; Wang, X. Identifying Linear Traces of the Han Dynasty Great Wall in Dunhuang Using Gaofen-1 Satellite Remote Sensing Imagery and the Hough Transform. Remote Sens. 2019, 11, 2711. [Google Scholar] [CrossRef] [Green Version]
  13. Casana, J. Global-Scale Archaeological Prospection using CORONA Satellite Imagery: Automated, Crowd-Sourced, and Expert-led Approaches. J. Field Archaeol. 2020, 45 (Suppl. 1), S89–S100. [Google Scholar] [CrossRef] [Green Version]
  14. Deroin, J.P.; Kheir, R.B.; Abdallah, C. Geoarchaeological remote sensing survey for cultural heritage management. Case study from Byblos (Jbail, Lebanon). J. Cult. Herit. 2017, 23, 37–43. [Google Scholar] [CrossRef] [Green Version]
  15. Lausanne, A.L.; Fedje, D.W.; Mackie, Q.; Walker, I.J. Using aerial LIDAR imaging and GIS on Quadra Island, Canada. J. Isl. Coast. Archaeol. 2021, 2–4, 482–508. [Google Scholar] [CrossRef]
  16. Kadhim, I.; Abed, F.M. The Potential of LiDAR and UAV-Photogrammetric Data Analysis to Interpret Archaeological Sites: A Case Study of Chun Castle in South-West England. ISPRS Int. J. Geo-Inf. 2021, 10, 41. [Google Scholar] [CrossRef]
  17. Elfadaly, A.; Abouarab, M.A.R.; El Shabrawy, R.R.M.; Mostafa, W.; Wilson, P.; Morhange, C.; Silverstein, J.; Lasaponara, R. Discovering Potential Settlement Areas around Archaeological Tells Using the Integration between Historic Topographic Maps, Optical, and Radar Data in the Northern Nile Delta, Egypt. Remote Sens. 2019, 11, 3039. [Google Scholar] [CrossRef] [Green Version]
  18. Giardino, M.J. A history of NASA remote sensing contributions to archaeology. J. Archaeol. Sci. 2011, 38, 2003–2009. [Google Scholar] [CrossRef] [Green Version]
  19. Stott, D.; Kristiansen, S.M.; Lichtenberger, A.; Raja, R. Mapping an ancient city with a century of remotely sensed data. Proc. Natl. Acad. Sci. USA 2018, 115, E5450–E5458. [Google Scholar] [CrossRef] [Green Version]
  20. Glebova, A.B.; Bykov, N.I.; Sergeev, I.S. Geoinformation analysis of location of the archaeological sites on Ukok plateau (Altai). Proc. Russ. Geogr. Soc. 2016, 4, 65–77. [Google Scholar]
  21. Palladio, A. The Four Books of Architecture; Dover Publications Inc.: Mineola, NY, USA, 1968. [Google Scholar]
  22. Fu, X. Research on Urban Planning, Architectural Layout and Architectural Design Methods in Ancient China; China Architecture & Building Press: Beijing, China, 2015; Volume 1. [Google Scholar]
  23. Corbusier, L. Vers Une Architecture; Cres et Cie: Paris, France, 1923. [Google Scholar]
  24. Rossi, A. The Architecture of the City; The MIT Press: Cambridge, MA, USA, 1984. [Google Scholar]
  25. Funo, S. History of Asian Architecture and Cities; Showado: Kyoto, Japan, 2003. [Google Scholar]
  26. Seo, T. Chang’an in Sui and Tang Dynasties and Comparison of Capital History in East Asia; Gao, B.; Guo, X.N.; Huang, H.J., Translators; Northwest University Press: Xi’an, China, 2019. [Google Scholar]
  27. Wang, N. A Study on the Composition Proportion of Ancient Chinese Capitals, Architectural Complexes and Individual Buildings; China City Publishing House, China Architecture & Building Press: Beijing, China, 2018. [Google Scholar]
  28. Byington, M.E. Recovery of lost archaeological features on the Yalu River through GIS and historical imagery. Archaeol. Res. Asia 2022, 30, 100363. [Google Scholar] [CrossRef]
  29. Lech, P.; Zakrzewski, P. Depopulation and devastation: Using GIS for tracing changes in the archaeological landscape of Kharaib al-Dasht, a Late Islamic fishing village (Kuwait). Archaeol. Prospect. 2021, 28, 17–24. [Google Scholar] [CrossRef]
  30. Mejia, C.D.F.; Carretero, P.P.A. Archaeological Landscapes Analysis of Basin Viewshed at the Puruha Site of Collay. Arqueol. Iberoam. 2017, 36, 43–47. [Google Scholar]
  31. Dong, H.W.; Liu, Q.H.; Zhou, J.X.; Zhang, Y.H.; Mei, X.Q. New information obtained from surveying and mapping study of Han Chang’an City site. Archaeology and Cultural Relics. 2000, 5, 39–49. [Google Scholar]
  32. Institute of archaeology of Chinese academy of social sciences. Archaeological Excavation Report of Weiyang Palace, Chang’an City, Han Dynasty, 1980–1989; Encyclopedia of China Publishing House: Beijing, China, 1996. [Google Scholar]
  33. Institute of archaeology of Chinese academy of social sciences; Nara National Research Institute for Cultural Properties. Guigong, Chang’an City, Han Dynasty: Report of Archaeological Excavation 1996–2001; Cultural Relics Publishing House: Beijing, China, 2007. [Google Scholar]
  34. Institute of archaeology of Chinese academy of social sciences. The Armory of Han Chang’an City: A Collection of Reports on Chinese Field Archaeology; Cultural Relics Publishing House: Beijing, China, 2005. [Google Scholar]
  35. Institute of archaeology of Chinese academy of social sciences. The Ceremonial Architecture Site of Western Han Dynasty; Cultural Relics Publishing House: Beijing, China, 2003; p. 126. [Google Scholar]
  36. Institute of archaeology of Chinese academy of social sciences; Xi’an Chang’an Site Protection Center of Sui and Tang Dynasties; Xi’an World Heritage Monitoring and Management Center. Archaeological Data of Chang’an City Site in Sui and Tang Dynasties; Cultural Relics Publishing House: Beijing, China, 2017. [Google Scholar]
  37. George, M. World Cities: −3000 to 2000; FAROS 2000: Washington, DC, USA, 2003; p. 218. [Google Scholar]
  38. Ian, M. Social Devlopment; Stanford University Press: Redwood City, CA, USA, 2010; pp. 121–124. [Google Scholar]
  39. Ji, C. The I Ching or Book of Changes; Richard, W.; Cary, F.B., Translators; Princeton University Press: Princeton, NJ, USA, 1997. [Google Scholar]
  40. Ban, G. Book of Han; Zhonghua Book Company: Beijing, China, 1962. [Google Scholar]
  41. Paul, W. Models of Decision-Making: Simplifying Choices; Cambridge University Press: Cambridge, UK, 2015. [Google Scholar]
  42. Kwakkel, J.H. The Exploratory Modeling Workbench: An open source toolkit for exploratory modeling, scenario discovery, and (multi-objective) robust decision making. Environ. Model. Softw. 2017, 96, 239–250. [Google Scholar] [CrossRef]
  43. Watanabe, N.; Nakamura, S.; Liu, B.; Wang, N. Utilization of Structure from Motion for processing CORONA satellite images: Application to mapping and interpretation of archaeological features in Liangzhu Culture, China. Archaeol. Res. Asia 2017, 11, 38–50. [Google Scholar] [CrossRef]
  44. Anonymous. Kao Gong Ji: The World’s Oldest Encyclopaedia of Technologies; Guan, Z.J.; Konrad, H., Translators; Brill: Leiden, The Netherlands, 2019. [Google Scholar]
  45. Wei, Z. Book of Sui; Zhonghua Book Company: Beijing, China, 1997. [Google Scholar]
  46. Song, Q.; OuYang, X. The New Book of Tang; Zhonghua Book Company: Beijing, China, 1975. [Google Scholar]
  47. Robin, R.W. Yinyang: The Way of Heaven and Earth in Chinese Thought and Culture; Cambridge University Press: Cambridge, UK, 2012. [Google Scholar]
  48. Wu, H.Y. Numerical Culture in China; Yuelu Press: Changsha, China, 2013. [Google Scholar]
  49. Chen, Y.L. Exploration on the Cultural Connotation of English and Chinese Numerical Digits. Adv. Soc. Sci. Educ. Humanit. Res. 2018, 103, 552–555. [Google Scholar]
  50. David, M.B.; Anders, F. Digital Humanities: Knowledge and Critique in a Digital Age; Polity Press: Malden, MA, USA, 2017. [Google Scholar]
  51. Oliver, L.D. Digital Humanities: History and Development; Wiley-ISTE: New York, NY, USA, 2018. [Google Scholar]
  52. Qin, J.; Zhang, Z.; Yang, Z. The baselines of super-long buildings of the Western Han Dynasty from north to south centered on Chang’an city have been discovered in Shaanxi province. Cult. Relics 1995, 3, 4–15. [Google Scholar]
  53. Wang, S. Preliminary Study on Urban Design Method Combining with Large-scale Natural Environment: Taking the Relationship Between Urban Design of Xi’an and Zhongnan Mountain as an Example. J. Xi’an Univ. Sci. Technol. 2009, 5, 574–578. [Google Scholar]
  54. Yu, Z.; Wang, Z. “Mimicking the Ancient” and “Tracing the Ancient” On the Context Consciousness in the Space Design of The Two Capitals in Sui and Tang Dynasties. Study Image Hist. 2015, 1, 76–88. [Google Scholar]
  55. Kostić, N. The unity of heaven and man: Ancient Chinese concept of three properties of the universe—In the change of Zhou. Zb. Matice Srp. Drus. Nauk. 2015, 152, 393–408. [Google Scholar] [CrossRef]
  56. Kim, Y. Worship of Mountains and Rivers and State Power in Ancient China. Hist. Stud. Anc. Mediev. China 2014, 34, 1–42. [Google Scholar]
  57. Francesca, B.; Vera, D.L.; Georges, M. Graphics and Text in the Production of Technical Knowledge in China; Brill: Leiden, The Netherlands, 2007; pp. 135–168. [Google Scholar]
Figure 1. Ichnographies of the capitals of the Western Han dynasty as well as the Sui and Tang dynasties drawn by archaeologists.
Remotesensing 14 03298 g001
Figure 2. Technological roadmap for the research.
Remotesensing 14 03298 g002
Figure 3. Distribution map of archaeological sites (including site information such as spatial coordinates, investigation photos, literature drawings, and textual records) in the capitals of the Western Han dynasty as well as the Sui and Tang dynasties.
Remotesensing 14 03298 g003
Figure 4. Framework diagram of the “Decision Model of Spatial Relationship between Urban Elements and Natural Elements”.
Remotesensing 14 03298 g004
Figure 6. The redevelopment of the QGIS platform was carried out using Python to realize automatic decision making.
Remotesensing 14 03298 g006
Figure 7. Ichnography of capitals of the Western Han dynasty as well as the Sui and Tang dynasties in addition to the natural environment.
Remotesensing 14 03298 g007
Figure 8. Analysis of the alignment relationship between the capitals of the Western Han dynasty as well as the Sui and Tang dynasties.
Remotesensing 14 03298 g008
Figure 9. Proportion analysis chart of the capitals of the Western Han dynasty as well as the Sui and Tang dynasties.
Remotesensing 14 03298 g009
Table 1. List of commonly used satellite image resources.
Satellite Image NameProviderThe Highest Image
Resolution
Image TypeView SupportOpen Source (for Academic Purpose) or Not
Esri World Imagery
(modern image used in this study)
Esri Inc., Redlands, CA, USA0.3 mMultispectral image2DYes
Google Earth ImageryGoogle Inc., Mountain View, Santa Clara County, CA, USA0.25 mMultispectral image2D & 3DYes/Not
(unavailable in China)
Tianditu ImageryNational Administration of Surveying, Mapping and Geographic Information of the PRC., Beijing, China0.5 mMultispectral image2DYes
Baidu Satellite ImageryBeijing Baidu Netcom Technology Co., Ltd., Beijing, China0.8 mMultispectral image2DYes
Autonavi Satellite ImageryAutonavi Software Inc., Beijing, China0.8 mMultispectral image2DYes
CORONA (KH-4B)
(historical image used in this study)
KeyHole satellite, The National Reconnaissance Office, Chantilly, VA, USA1.8 mPanchromatic band image2DYes
Table 2. Size and ideal value analysis table of Chinese capitals of the Western Han dynasty as well as the Sui and Tang dynasties.
Object NameCapital Size
(Attached Measuring Position)
Size in
Previous
Research Results (m)
Measured Sizes after Map
Calibration (m)
Ratio of Calibrated Value to Previous Value (%)The Calibrated Size Is
Converted to the Value in “Li” or “Bu”
Ideal Value
(Li/Bu)
Ratio of Calibrated Value to Ideal
Value (%)
Chang’an in the Han dynastyTotal east–west length (calculated according to the east–west straight line distance from the southeast corner of the city walls to the southwest corner of the city walls)6296.006314.61100.3015.01
(420.9 m for 1 Li in the Han dynasty)
15 Li100.07
Total north–south length (calculated according to the north–south straight line distance from the northeast corner of the city walls to Anmen)6901.006902.40100.0216.41
(420.9 m for 1 Li in the Han dynasty)
16.5 Li99.45
Chang’an in the Sui and Tang dynastiesTotal east–west length (calculated according to the east–west distance of the outer sub-city north wall)9721.009622.7498.9917.99
(534.88 m for 1 Li in the Sui dynasty)
18 Li99.99
Total north–south length (calculated from the midpoint of the outer sub-city’s north wall to the midpoint of the outer sub-city’s south wall)8651.708539.1398.7015.96
(534.88 m for 1 Li in the Sui dynasty)
16 Li99.75
North–south length of the imperial city1492.101479.9299.18994.57
(1.488 m for 1 Bu in the Sui dynasty)
1000 Bu99.46
East–west length of the imperial city (equal to the east–west length of the royal city)2820.302818.40100.131897.90
(1.488 m for 1 Bu in the Sui dynasty)
1900 Bu99.89
Total north–south length of the royal city and imperial city3335.703276.6498.232202.04
(1.488 m for 1 Bu in the Sui dynasty)
2200 Bu100.09
Table 3. List of the analysis results of the spatial relationship between Chinese capitals of the Western Han dynasty as well as the Sui and Tang dynasties and the natural environment (existing discoveries).
Features of Alignment LinesKey Element Points Passing throughThe Latitude and Longitude of Each PointDegree of
Association
between Two Ends and Target Value
The Lowest Value of the Degree of
Association between Each Point and
Target Value
Discoveries
(Attached Discoverer and Time)
Due north-south axisTianqi Temple Site, a certain section of Qingyu River (which was artificially transformed to be close to the due north-south direction), Changling Mausoleum (the mausoleum of Liu Bang, Emperor Gaozu of the Han dynasty), the midpoint of the arsenal in the capital city of the Western Han dynasty, Anmen, and the entrance of Ziwu Vale (now named Ziwu Valley) in Qinling Mountains(108.8751°E, 34.7091°N), (108.8774°E, 34.6415°N), (108.8767°E, 34.4347°N), (108.8739°E, 34.3109°N),
(108.8796°E, 34.2928°N), (108.8802°E, 34.0406°N)
99.6%98.8%Discovered (Qin Jianming, A.D. 1995) [52]
Due north-south axisThe south gate of imperial city in the capital city of the Sui and Tang Dynasties (named Guangyang Gate in the Sui Dynasty and Chengtian Gate in the Tang Dynasty), Zhuque Gate and Mingde Gate, and the tortoise-like stone on the west side of the entrance in Shibie Valley (now named Shibian Valley) in Qinling Mountains(108.9351°E, 34.2695°N), (108.9350°E, 34.2532°N), (108.9351°E, 34.2061°N), (108.9416°E, 34.0206°N)98.6%98.1%Discovered (documented by Lv Dafang in Chang’an Map of the Song Dynasty, A.D.1080)
Due north-south axisHeng Gate, the capital city of the Western Han dynasty, the midpoint of the front hall of Weiyang Palace, and the Site of Yingshanlou (southern suburb building)(108.8578°E, 34.3412°), (108.8586°E, 34.3044°N), (108.8600°E, 34.2710°N)98.3%97.8%Discovered (Huang Zhanyue, A.D. 2003)
[35]
Due north-south axisHanyuan Hall, Danfeng Gate and Wild Goose Pagoda in capital city of the Sui and Tang Dynasties, and main peak of the Niubeiliang mountain (Actually, we think the secondary main peak of the Niubeiliang mountain is more appropriate, the latitude and longitude of this point is 108.9597°E,33.8777°N)(108.9594°E, 34.2888°N), (108.9593°E, 34.2828°N), (108.9386°E, 34.2287°N), (108.9698°E, 33.8740°N)98.7%95.3%Discovered (Wang Shusheng, A.D.2009)
[53]
Due east-west axisTailing Mausoleum (the mausoleum of Yang Jian, Emperor Wen of the Sui Dynasty) and Caolian ridge(108.0227°E, 34.2888°N), (109.8260°E, 34.2909°N)99.9%99.9%Discovered (Yu Zhifei, A.D.2015)
[54]
Due east-west axisThe southwest corner of Wangmang Nine Temple (a large sacrificial building in the southern suburbs), the southern end of Biyong in the capital city of the Western Han dynasty, and the south gate of imperial city in the capital city of the Sui and Tang Dynasties (named Guangyang Gate in the Sui Dynasty and Chengtian Gate in the Tang Dynasty)(108.8620°E, 34.2702°N), (108.8839°E, 34.2701°N), (108.9351°E, 34.2695°N)99.3%99.1%Discovered (Yu Zhifei, A.D.2015)
[54]
Table 4. List of the analysis results of the spatial relationship between Chinese capitals of the Western Han dynasty as well as the Sui and Tang dynasties and the natural environment (new discoveries).
Features of Alignment LinesKey Element Points Passing throughThe Latitude and Longitude of Each PointDegree of Association between Two Ends and Target ValueThe Lowest Value of the Degree of Association between Each Point and Target ValueDiscoveries
Due north-south axisThe valley entrances of Qingyu River, the midpoint of imperial city (imperial city from the Sixteen Kingdoms to the early Sui Dynasty) in the northeast corner of the capital city of the Western Han Dynasty, Fuang Gate, the midpoint of Xishi (west market) in the capital city of the Sui and Tang Dynasties, and the entrance of Baolin Valley (now named Baolong Valley) in Qinling Mountains(108.9124°E, 34.6912°N), (108.9000°E, 34.3499°N), (108.9014°E, 34.3015°N), (108.9017°E, 34.2476°N),
(108.9079°E, 34.0330°N)
99.6%98.1%A new discovery
Due north-south axisThe entrance midpoint of Qingyu River, the northeast corner and southeast corner of the capital city of the Western Han Dynasty(108.9124°E, 34.6912°N),
(108.9119°E, 34.3549°N),
(108.9133°E, 34.3016°N)
99.9%98.6%A new discovery
Due north-south axisThe northeast corner of Daming Palace, midpoint of Dongshi (east market) in capital city of the Sui and Tang Dynasties, and the main peak of the Niubeiliang mountain(108.9703°E, 34.2913°N),
(108.9694°E, 34.2476°N),
(108.9696°E,33.8743°N)
99.9%98.9%A new discovery
Due north-south axisThe entrance midpoint of Zhuoyu River, Xuanwu gate of Daming Palace in capital city of the Sui and Tang Dynasties(108.9527°E,34.6928°N),
(108.9576°E,34.3033°N)
99.3%99.3%A new discovery
45° oblique line (northwest to southeast)The highest peak of Jiuzong mountain, the northwest corner of Changle Palace, the midpoint of imperial city, the midpoint of Dongshi (east market) and Yanxing Gate in capital city of the Sui and Tang Dynasties(108.5181°E, 34.6239°N), (108.8795°E, 34.3217°N), (108.9358°E, 34.2762°N), (108.9694°E, 34.2477°N),
(108.9883°E, 34.2318°N)
99.9%99.4%A new discovery
45° oblique line (northwest to southeast)The midpoint of the north wall of imperial city in the northeast corner of the capital city of the Western Han dynasty (imperial city from the Sixteen Kingdoms to the early Sui Dynasty) and the northeast corner of Guocheng in the capital city of the Sui and Tang Dynasties(108.8997°E, 34.3544°N), (108.9882°E, 34.2829°N)99.1%99.1%A new discovery
45° oblique line (northwest to southeast)Zhicheng Gate in capital city of the Western Han dynasty, northwest corner of Guocheng in the capital city of the Sui and Tang Dynasties, southwest corner of imperial city, southeast inflection point of Qujiang Pool(108.8473°E, 34.3147°N), (108.8837°E, 34.2828°N), (108.9205°E, 34.2532°N), (108.9805°E, 34.2050°N)99.7%98.2%A new discovery
45° oblique line (northwest to southeast)The southwest corner of the city wall in the capital city of the Western Han dynasty, the midpoint of Xishi (west market) in the capital city of the Sui and Tang Dynasties, and the Qixia Gate(108.8451°E, 34.2949°N), (108.9017°E, 34.2476°N), (108.9510°E, 34.2061°N)99.7%99.6%A new discovery
45° oblique line (northeast to southwest)Midpoint of imperial city, midpoint of Xishi (west market), and Yanping Gate in the capital city of the Sui and Tang Dynasties(108.9358°E, 34.2762°N), (108.9017°E, 34.2476°N), (108.8839°E, 34.2318°N)99.1%97.9%A new discovery
45° oblique line (northeast to southwest)Midpoint of Dongshi (east market) and Anhua Gate of capital city in the capital city of the Sui and Tang Dynasties(108.9694°E, 34.2476°N), (108.9194°E, 34.2060°N)99.9%99.9%A new discovery
Table 5. Proportional analysis data table of Chinese capitals of the Western Han dynasty as well as the Sui and Tang dynasties.
Starting and Ending Points of Related Line SegmentsTrue Length of Related Line SegmentsTarget
Proportion
Degree of Coincidence with Target Proportion
Line segment A1: The north-south distance from the Tianqi Temple Site to the midpoint of the arsenal in the capital city of the Western Han dynasty
Line segment B1: The north-south distance from the midpoint of the arsenal in the capital city of the Western Han dynasty to the entrance of Ziwu Vale (now named Ziwu Valley) in Qinling Mountains
Discovered (Qin Jianming, 1995)
A1 = 44,164.92 m
B1 = 29,986.27 m
9:698.2%
Line segment A2: The north-south distance from Tianqi Temple Site to the south boundary of Zhangchengmen Street in the capital city of the Western Han dynasty
Line segment B2: The north-south distance from the south boundary of Zhangchengmen Street to Xuandu Altar Site
A2 = 45,263.50 m
B2 = 30,484.31 m
9:699.0%
Line segment A3: The north-south distance from the northern boundary of Xuanpingmen Street to the northern boundary of Bachengmen Street, the capital city of the Western Han dynasty
Line segment B3: The north-south vertical distance from the northern boundary of Bachengmen Street to Xi’an Gate, the capital city of the Western Han dynasty
A3 = 3379.83 m
B3 = 2247.21 m
9:699.7%
Line segment A4: The north-south distance from the northern boundary of Weiyang Palace to the southern boundary of Xigongmen Street of Weiyang Palace, the capital city of the Western Han dynasty
Line segment B4: The north-south vertical distance from the south boundary of Xigongmen Street in Weiyang Palace to Xi’an Gate
A4 = 838.44 m
B4 = 1259.28 m
9:699.9%
Line segment A5: The north-south vertical distance from the south boundary of Zhichengmen Street to Xi’an Gate, the capital city of the Western Han dynasty
Line segment B5: The north-south vertical distance from Xi’an Gate to the southeast corner of Sheji Altar
A5 = 2163.21 m
B5 = 3222.34 m
9:699.3%
Line segment A6: The north-south vertical distance from Changling Mausoleum (the mausoleum of Liu Bang, Emperor Gaozu of the Han dynasty) to the southeast corner of Sheji Altar in the capital city of the Western Han dynasty
Line segment B6: The north-south vertical distance from the southeast corner of Sheji Altar to Xuandu Altar in Qinling Mountains
A6 = 18,226.23 m
B6 = 27,069.54 m
9:699.0%
Line segment A7: The north-south distance from the entrance midpoint of Qingyu River and Zhuoyu River to the axis of Tailing Mausoleum-Caolian Ridge
Line segment B7: The north-south distance from the axis of Tailing Mausoleum-Caolian Ridge to the turtle-shaped boulder at the entrance of Shibie Valley (now named Shibian Valley) in Qinling Mountains
A7 = 44,537.99 m
B7 = 29,884.76 m
9:699.4%
Line segment A8: The north-south distance from the south boundary of Zhuquemen Street (the north boundary of the market) to Mingdemen in capital city of the Sui and Tang Dynasties (average)
Line segment B8: The north-south distance from the midpoint of the north wall of imperial city to the south boundary of Zhuquemen Street (the north boundary of the market), the capital city of the Sui and Tang Dynasties
A8 = 5096.68 m
B8 = 3415.02 m
9:699.5%
Line segment A9: From the east-west boundary wall of city wall to the midpoint of imperial city, the capital city of the Sui and Tang Dynasties (average value)
Line segment B9: The east-west distance from the midpoint of imperial city to the east boundary of Xishi(west market), the capital city of the Sui and Tang Dynasties (average value)
A9 = 4818.18 m
B9 = 2639.43 m
9:598.6%
Line segment A10: The east-west distance from the east-west boundary wall to the midpoint of imperial city, the capital city of the Sui and Tang Dynasties (average value)
Line segment B10: The north-south distance from Zhuquemen to the midpoint of Jingshan and Chongye, the capital city of the Sui and Tang Dynasties
A10 = 4818.18 m
B10 = 2665.30 m
9:599.6%
Publisher’s Note: MDPI stays neutral with regard to jurisdictional claims in published maps and institutional affiliations.

