
Disaster Prediction Knowledge Graph Based on Multi-Source Spatio-Temporal Information

 ,
, 
Abstract
:
1. Introduction
2. Materials and Methods
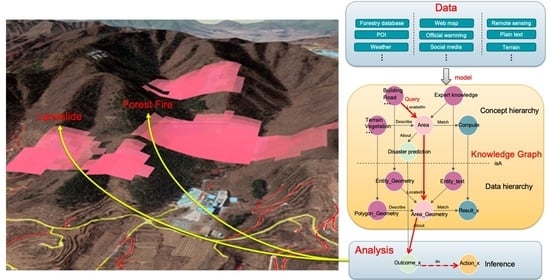
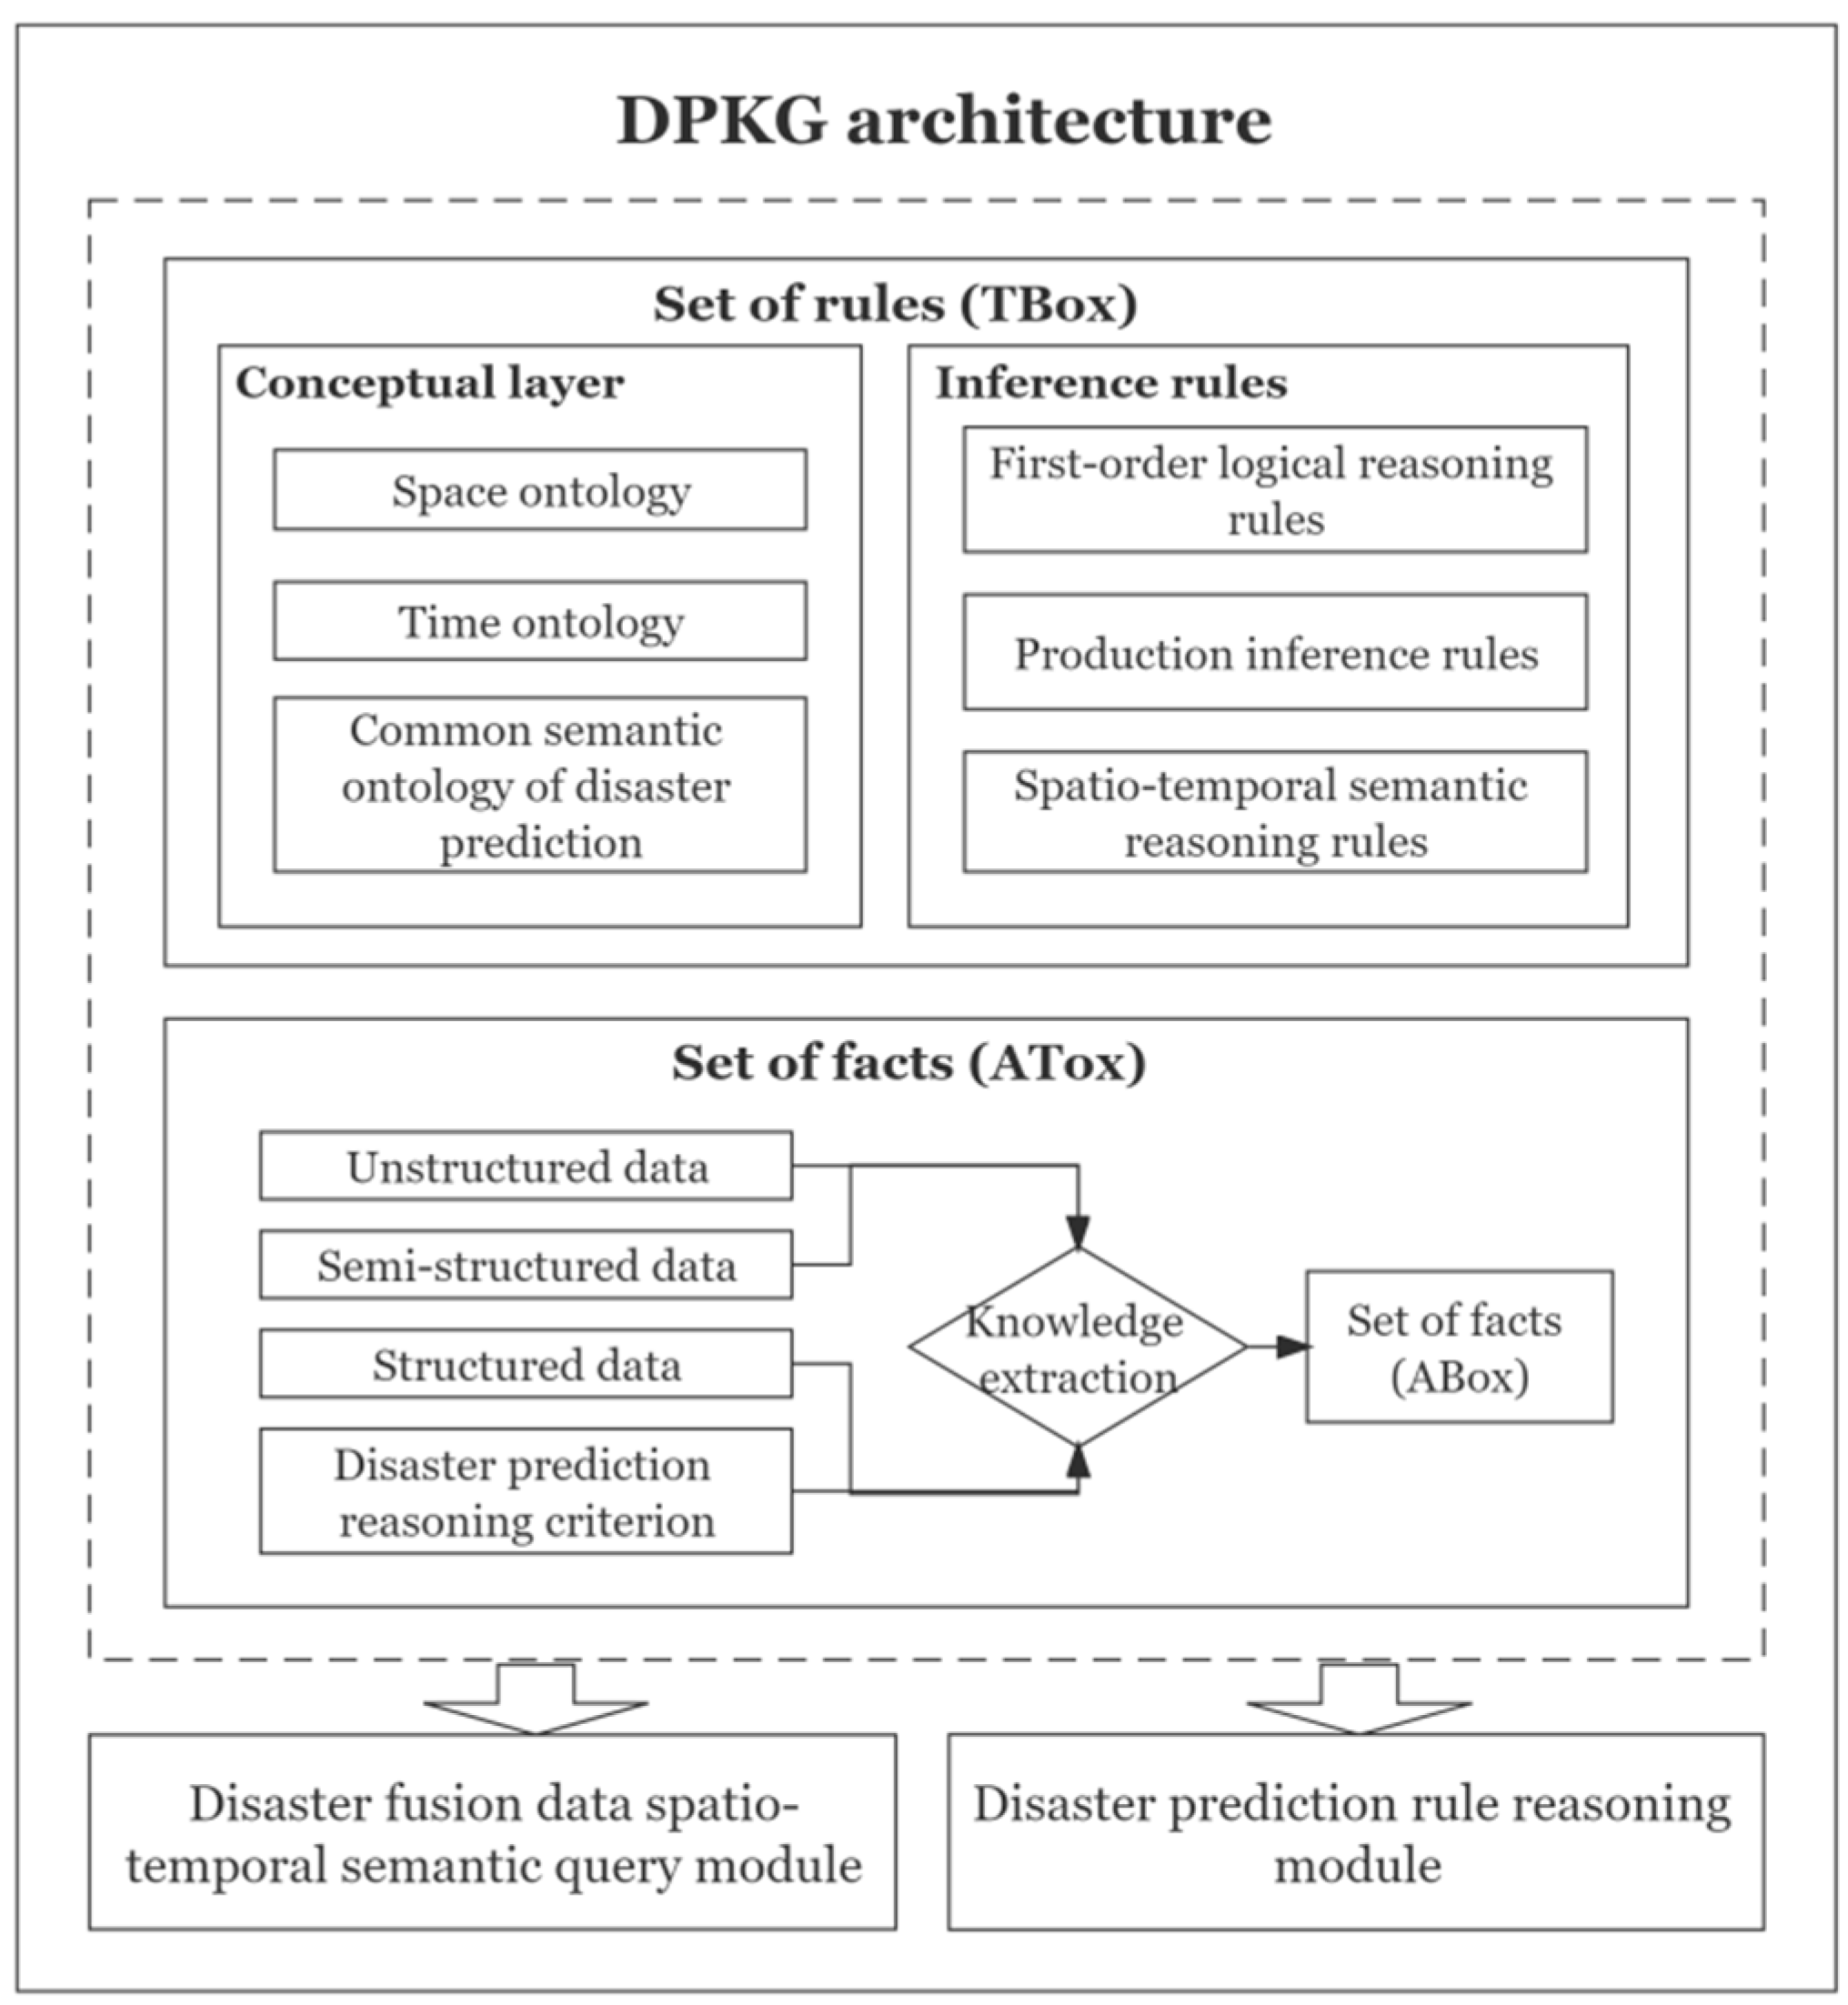
2.1. DPKG Architecture
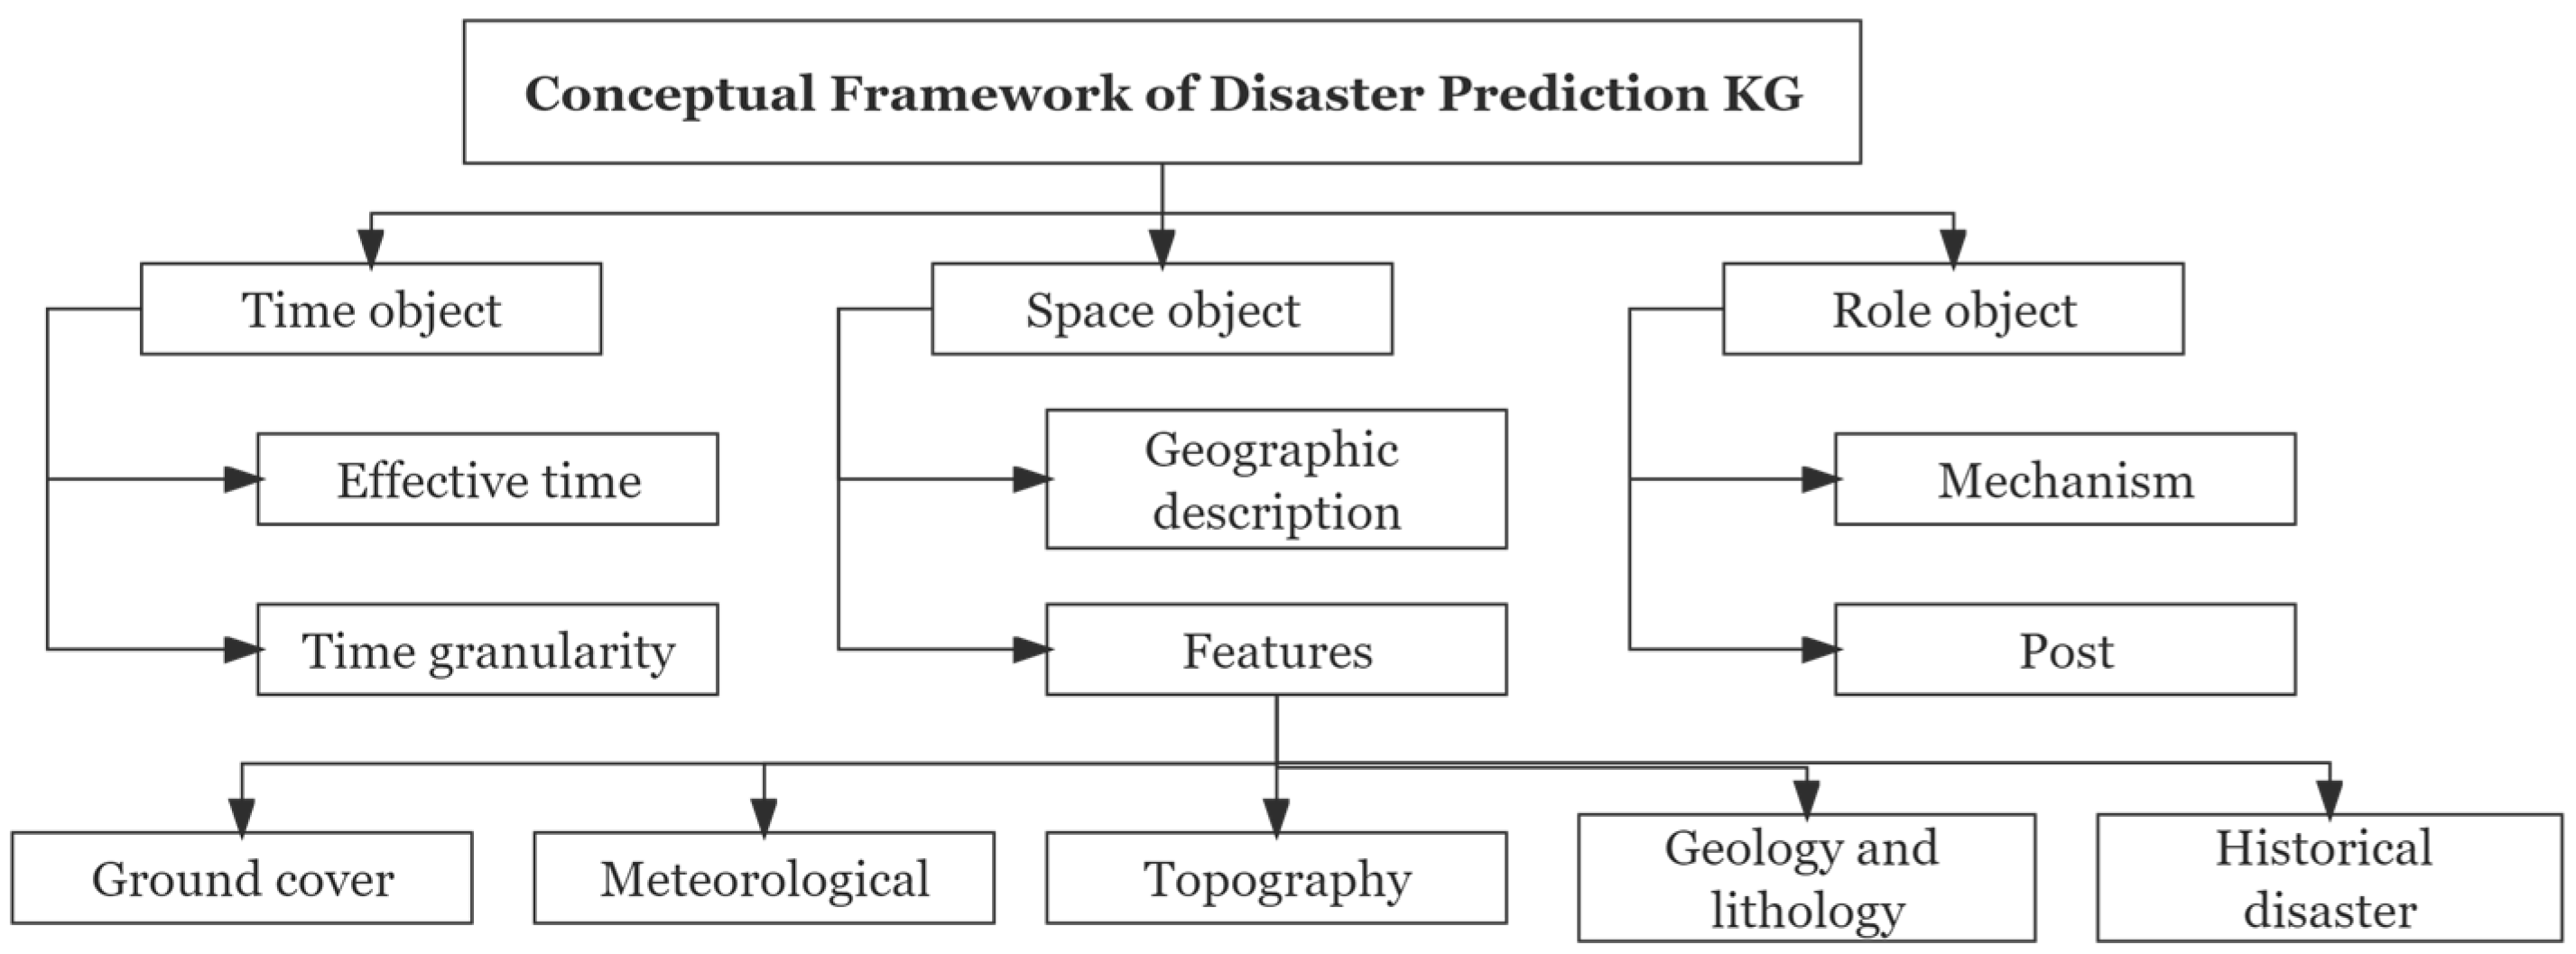
2.1.1. Hierarchical Semantic Model of Disaster Prediction Scenarios
2.1.2. Mapping between Disaster Prediction Scenarios and DPKG Architecture
2.2. Construction of Disaster Prediction Knowledge Graph
2.2.1. Knowledge Representation Language
2.2.2. Design of Conceptual Layer
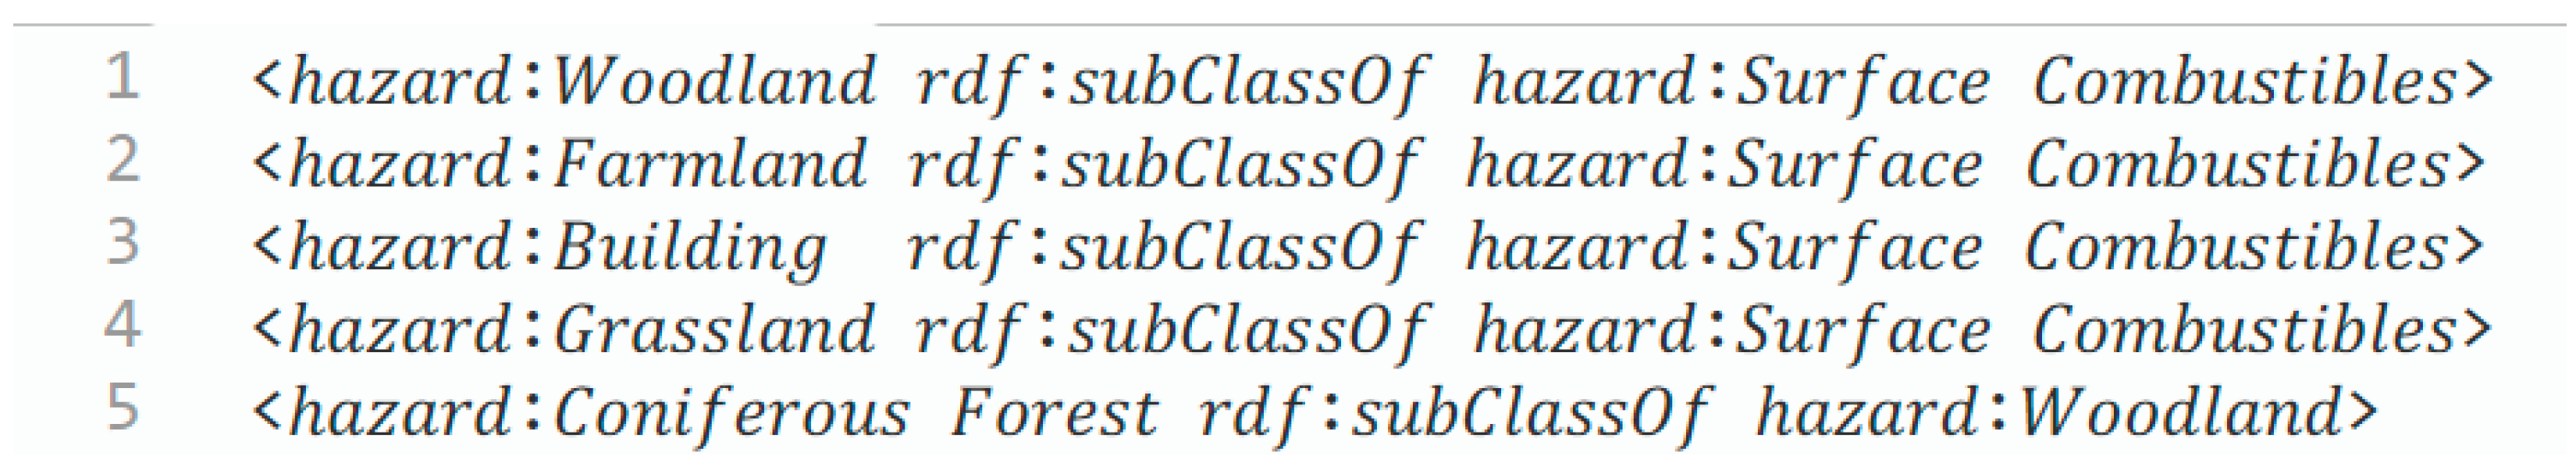
- Common Semantic Ontology of Disaster Prediction
- 2.
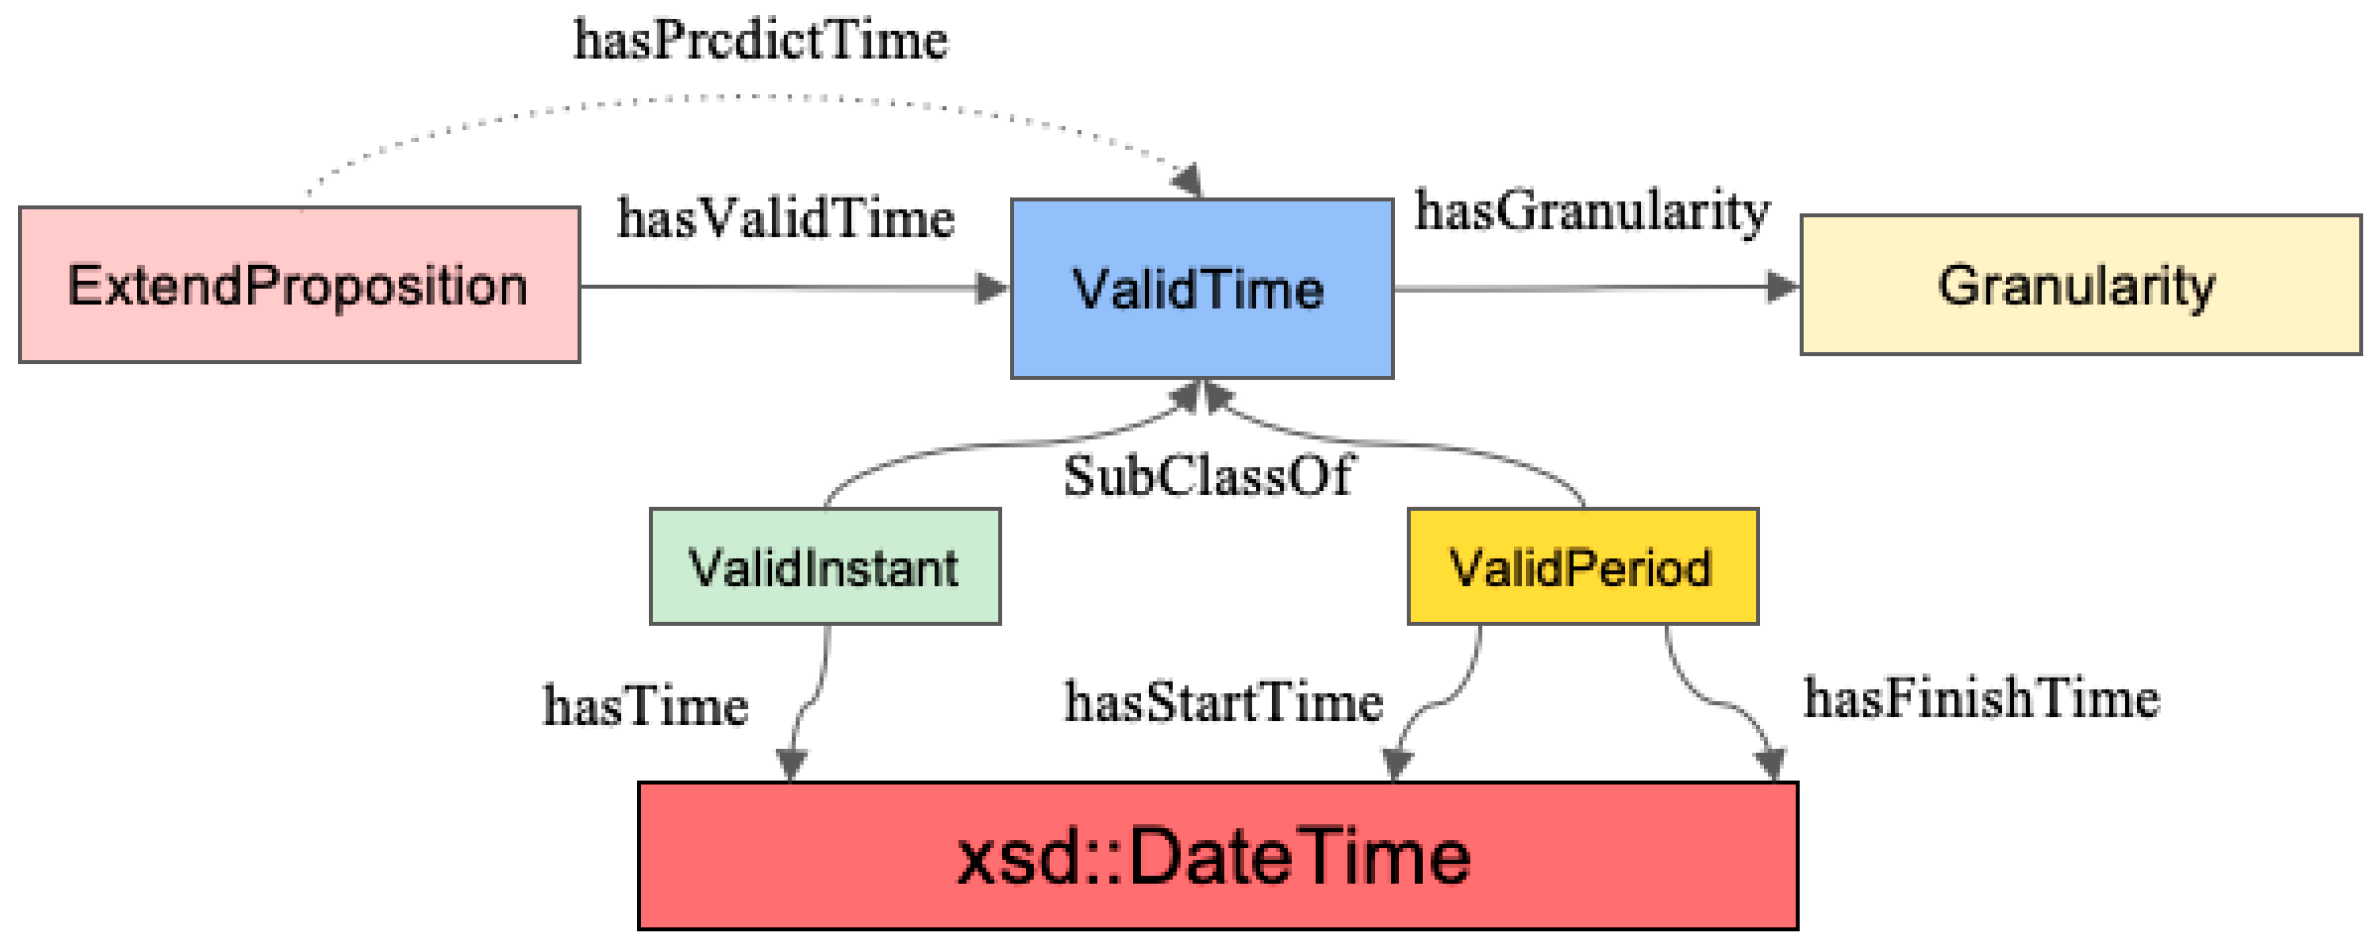
- Time Ontology
- 3.
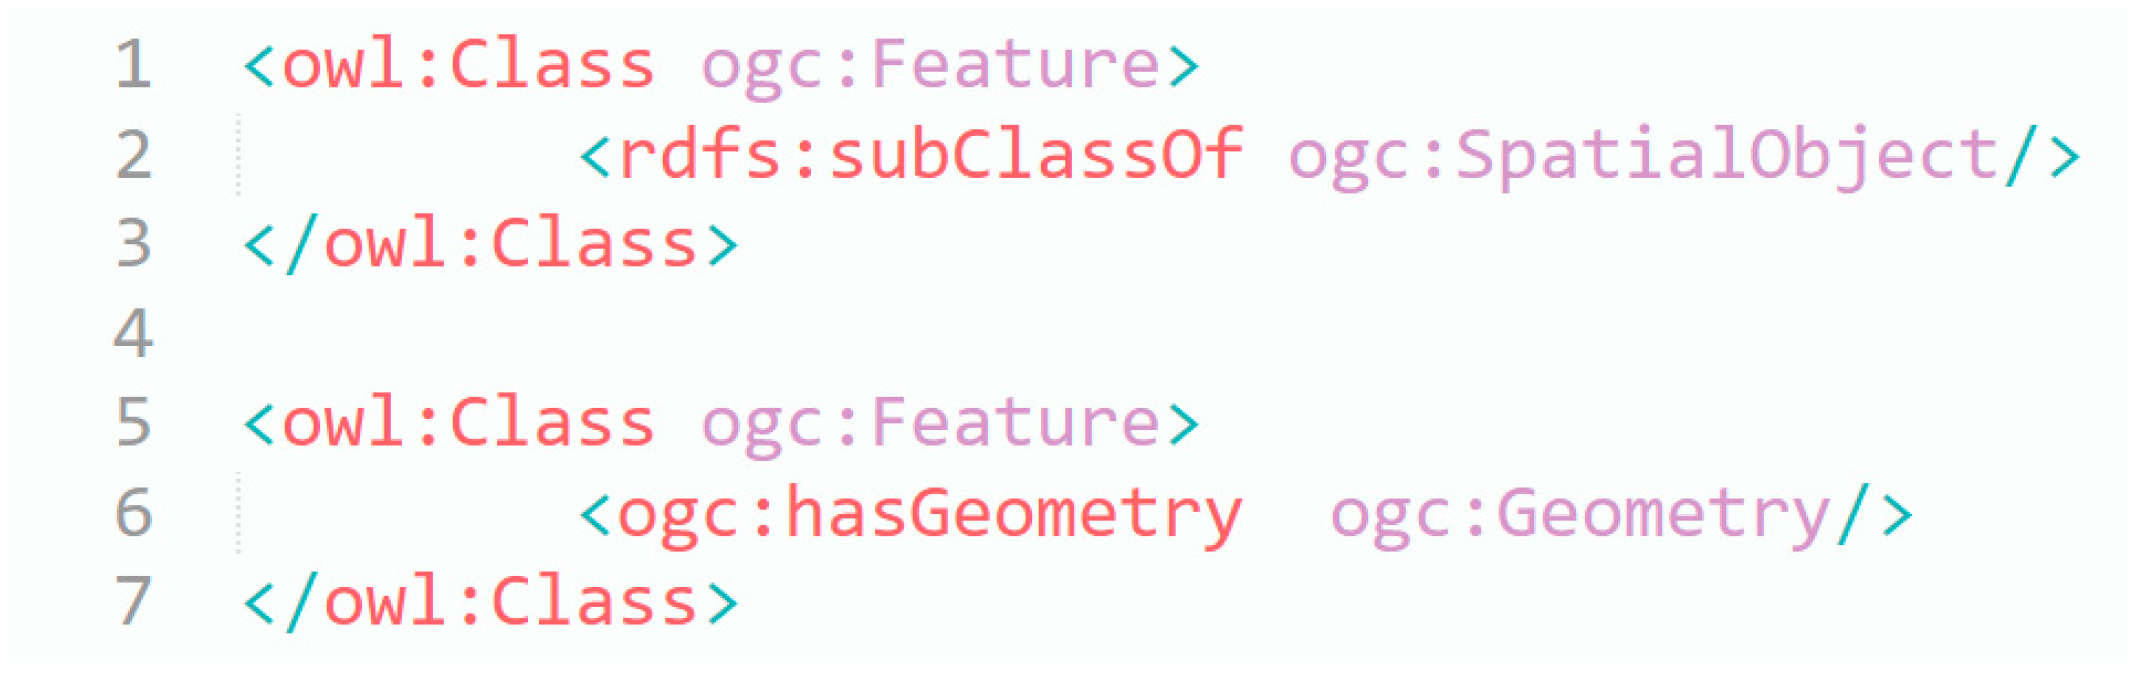
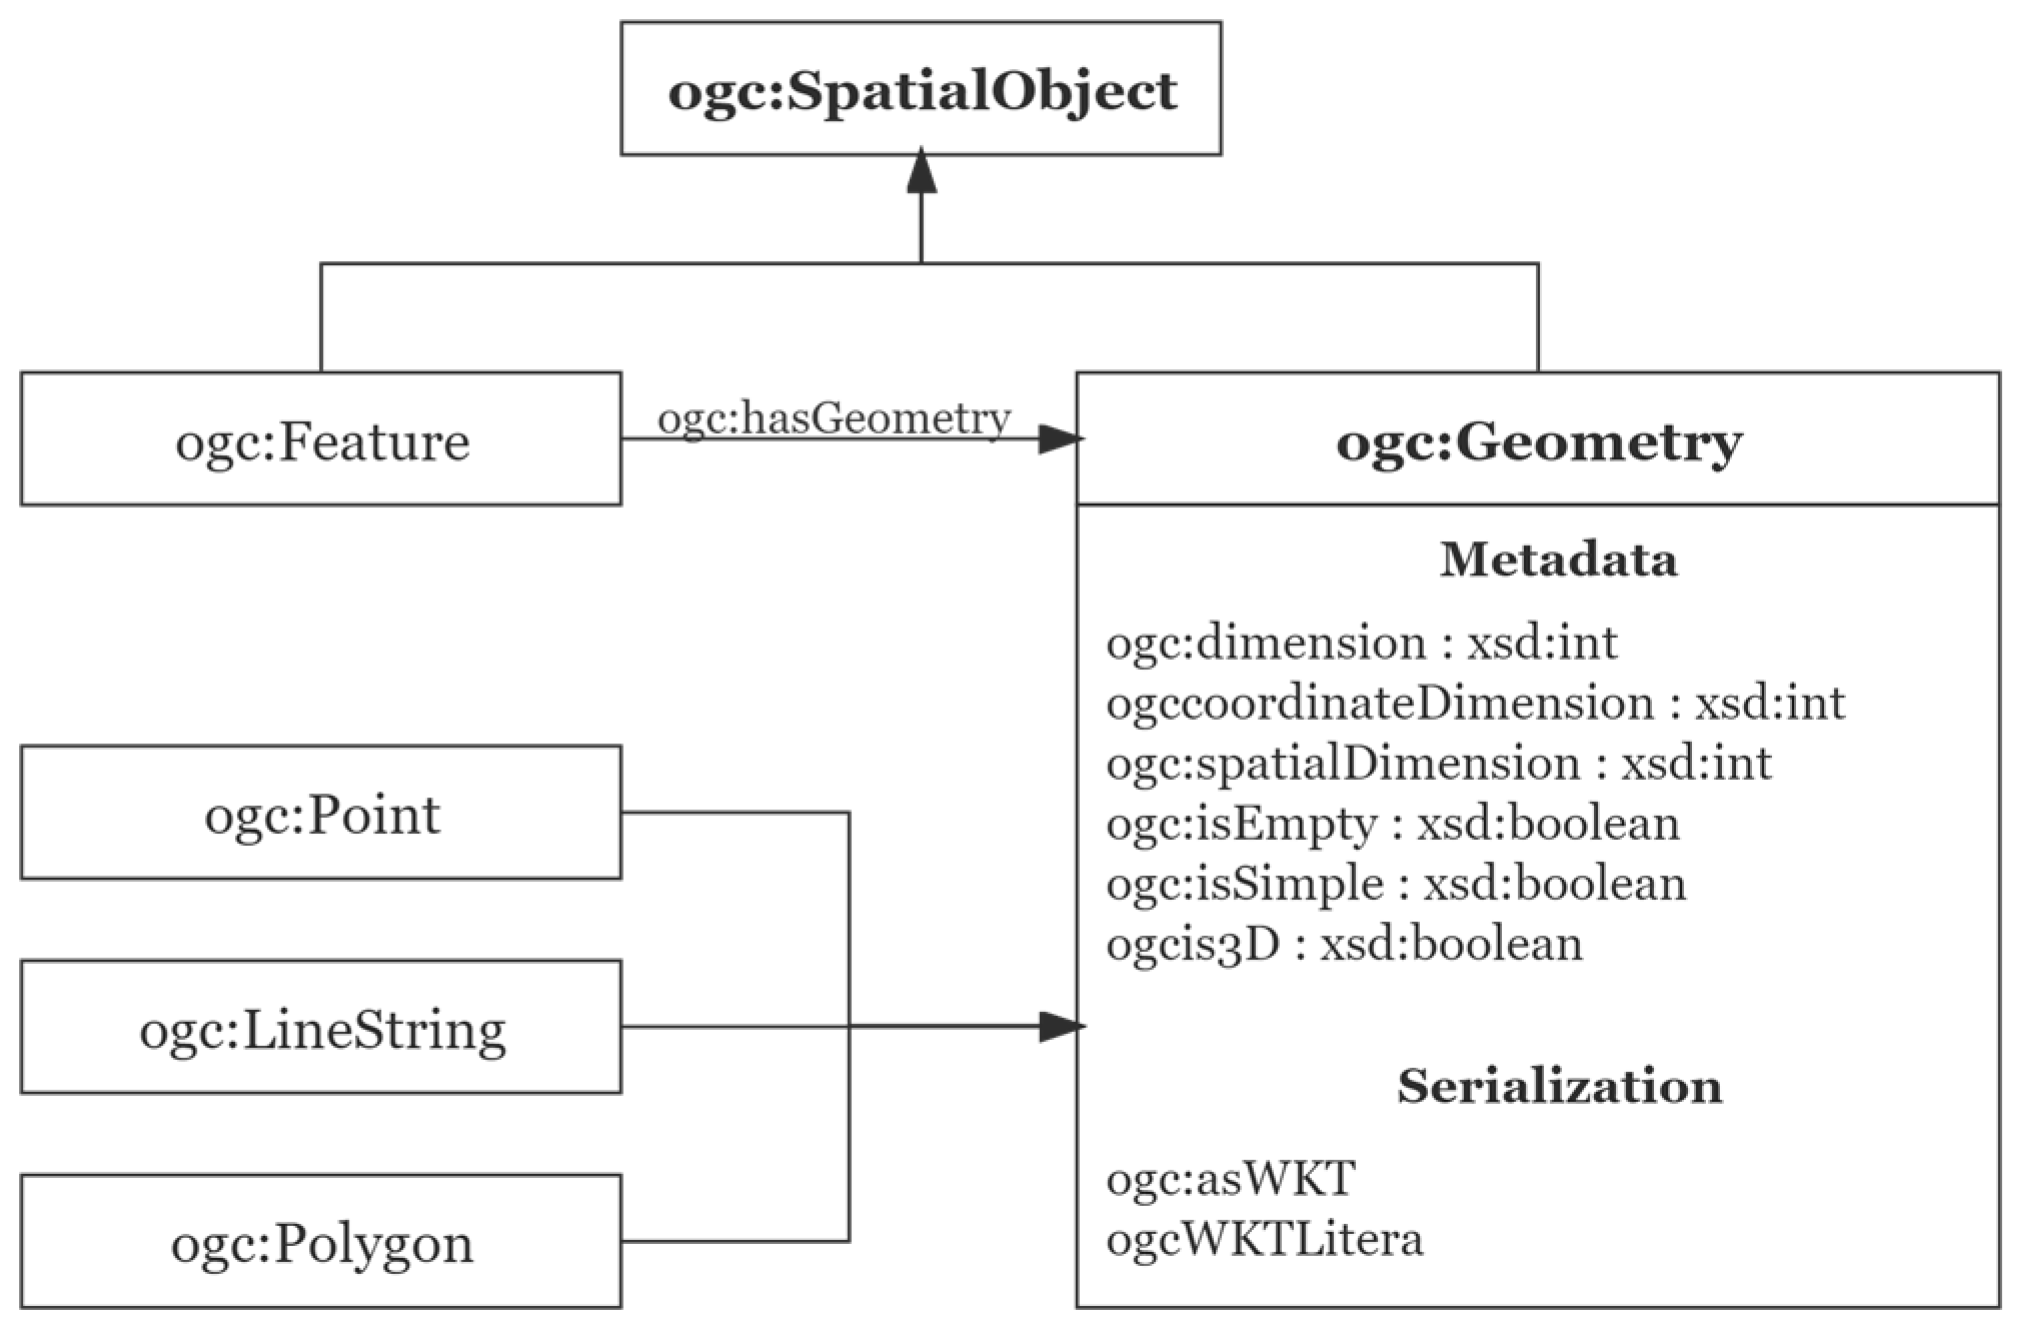
- Space Ontology
- OWL Ontology Vocabulary
- Geometry extension expression
- Topology extension query
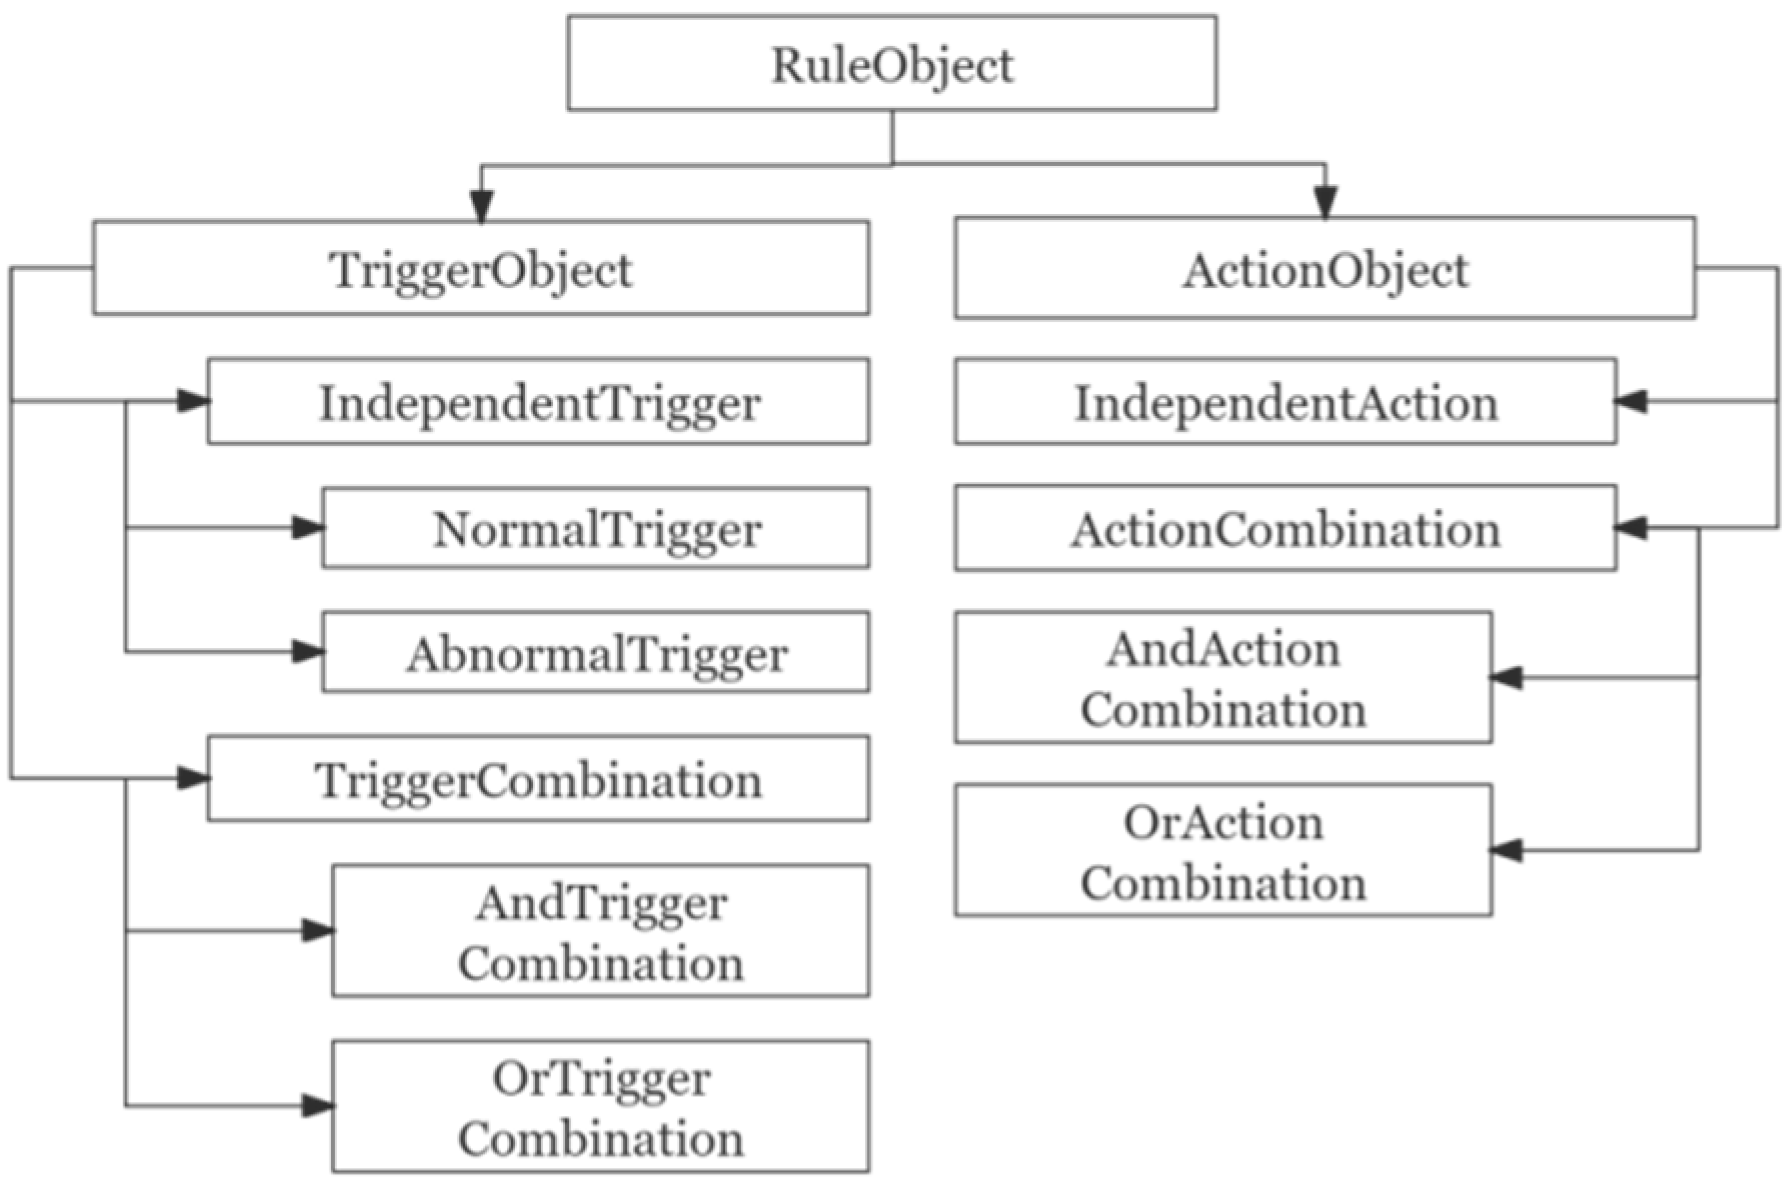
2.2.3. Construction of Disaster Prediction Inference Rules
- Construction of First-Order Logical Inference rules
- 2.
- Construction of Production Inference rule
- 3.
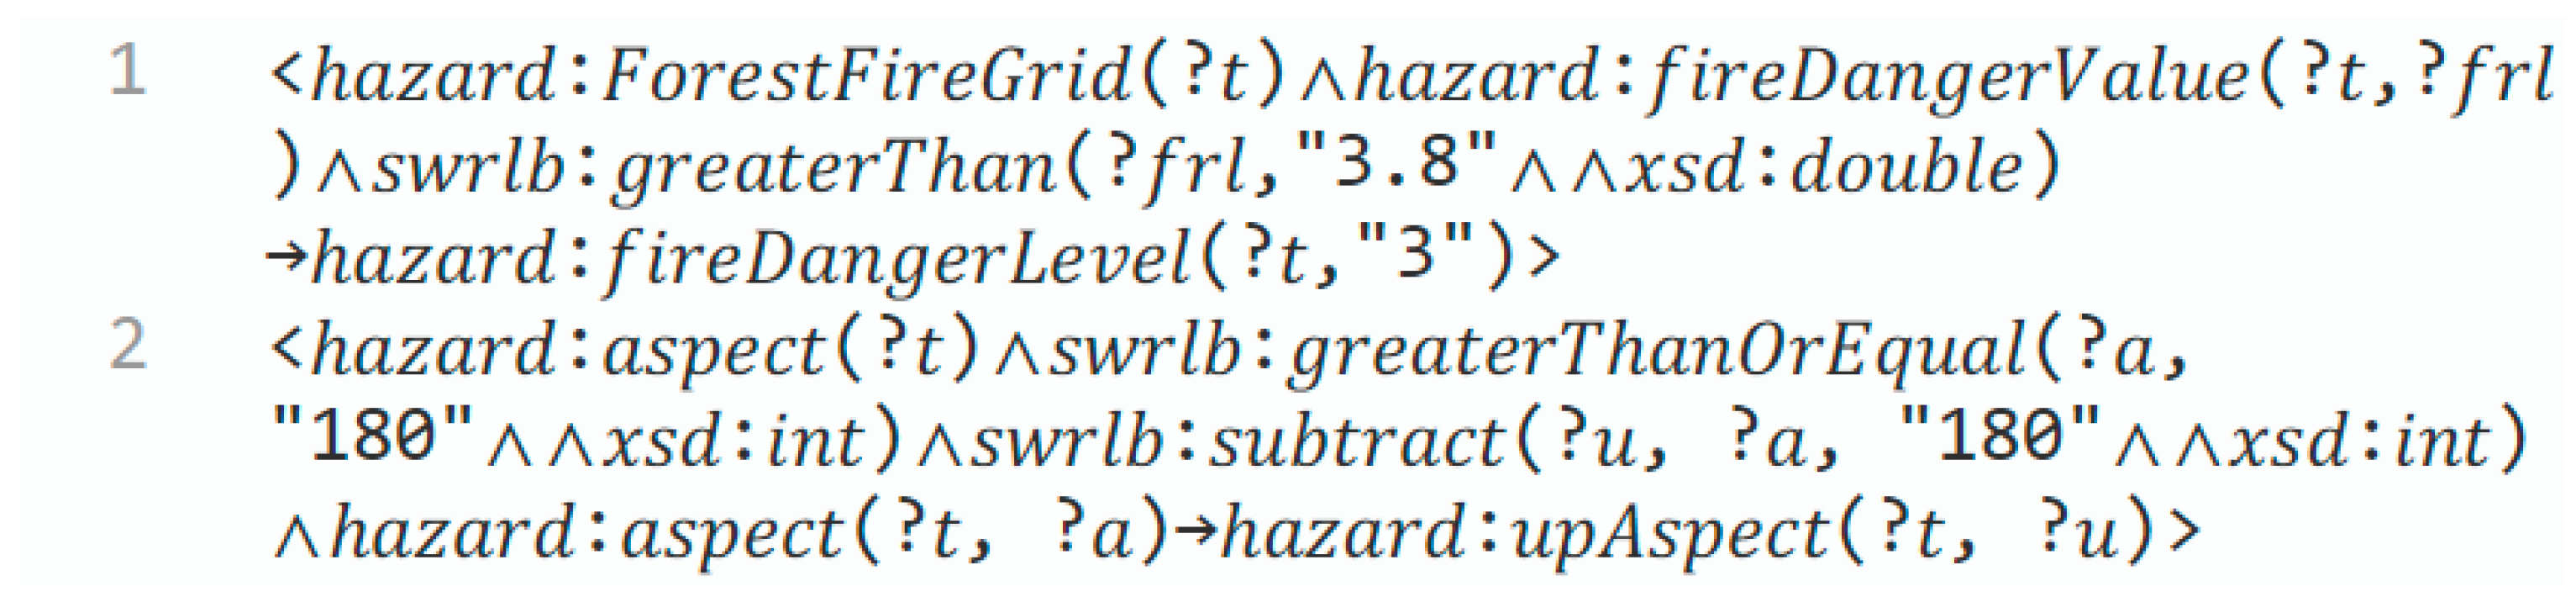
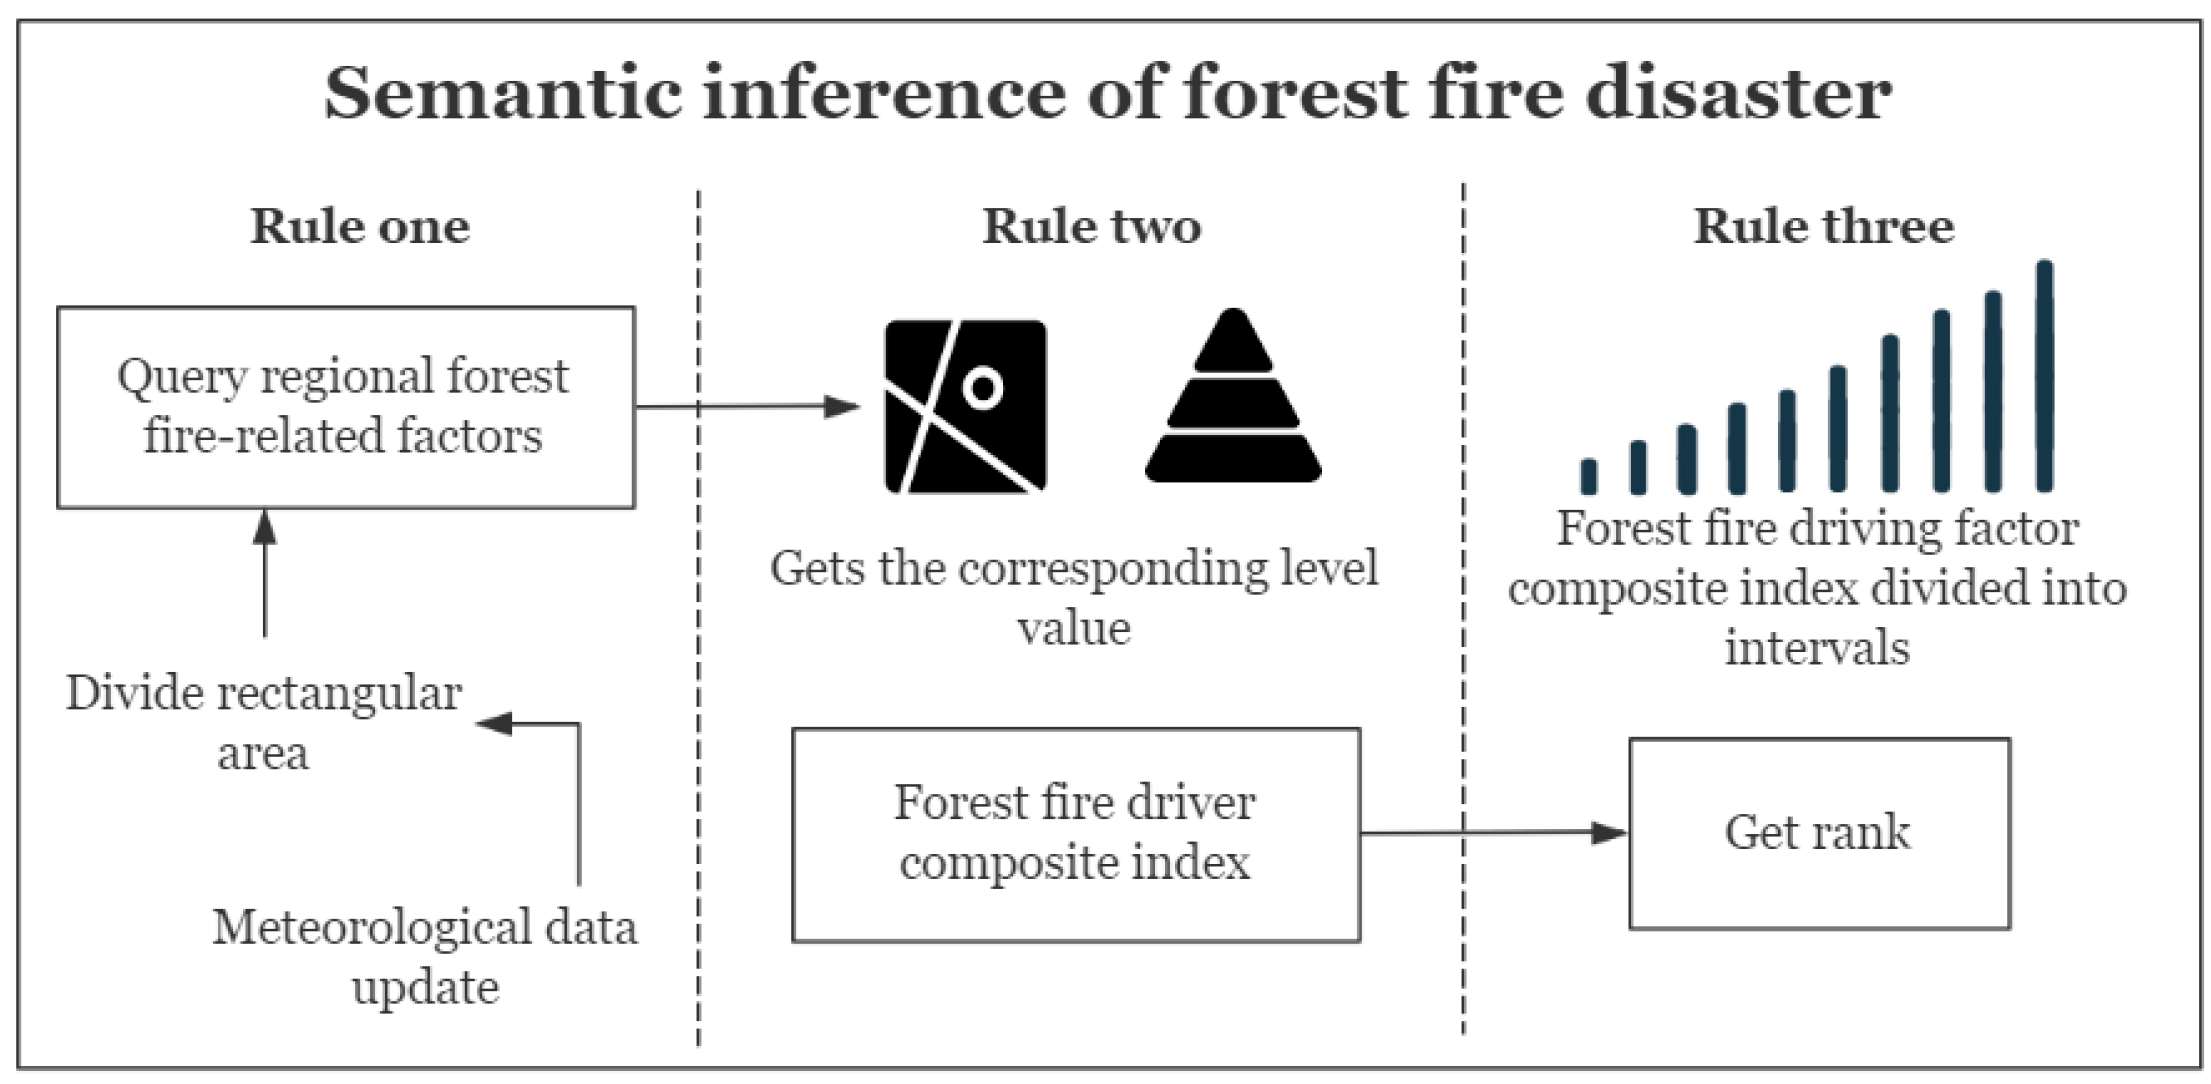
- Construction of Spatio-Temporal Semantic Inference Rule
2.2.4. Design of Instance Layer
- Knowledge Extraction from Unstructured Data
- 2.
- Knowledge Extraction from Semi-Structured Data
- 3.
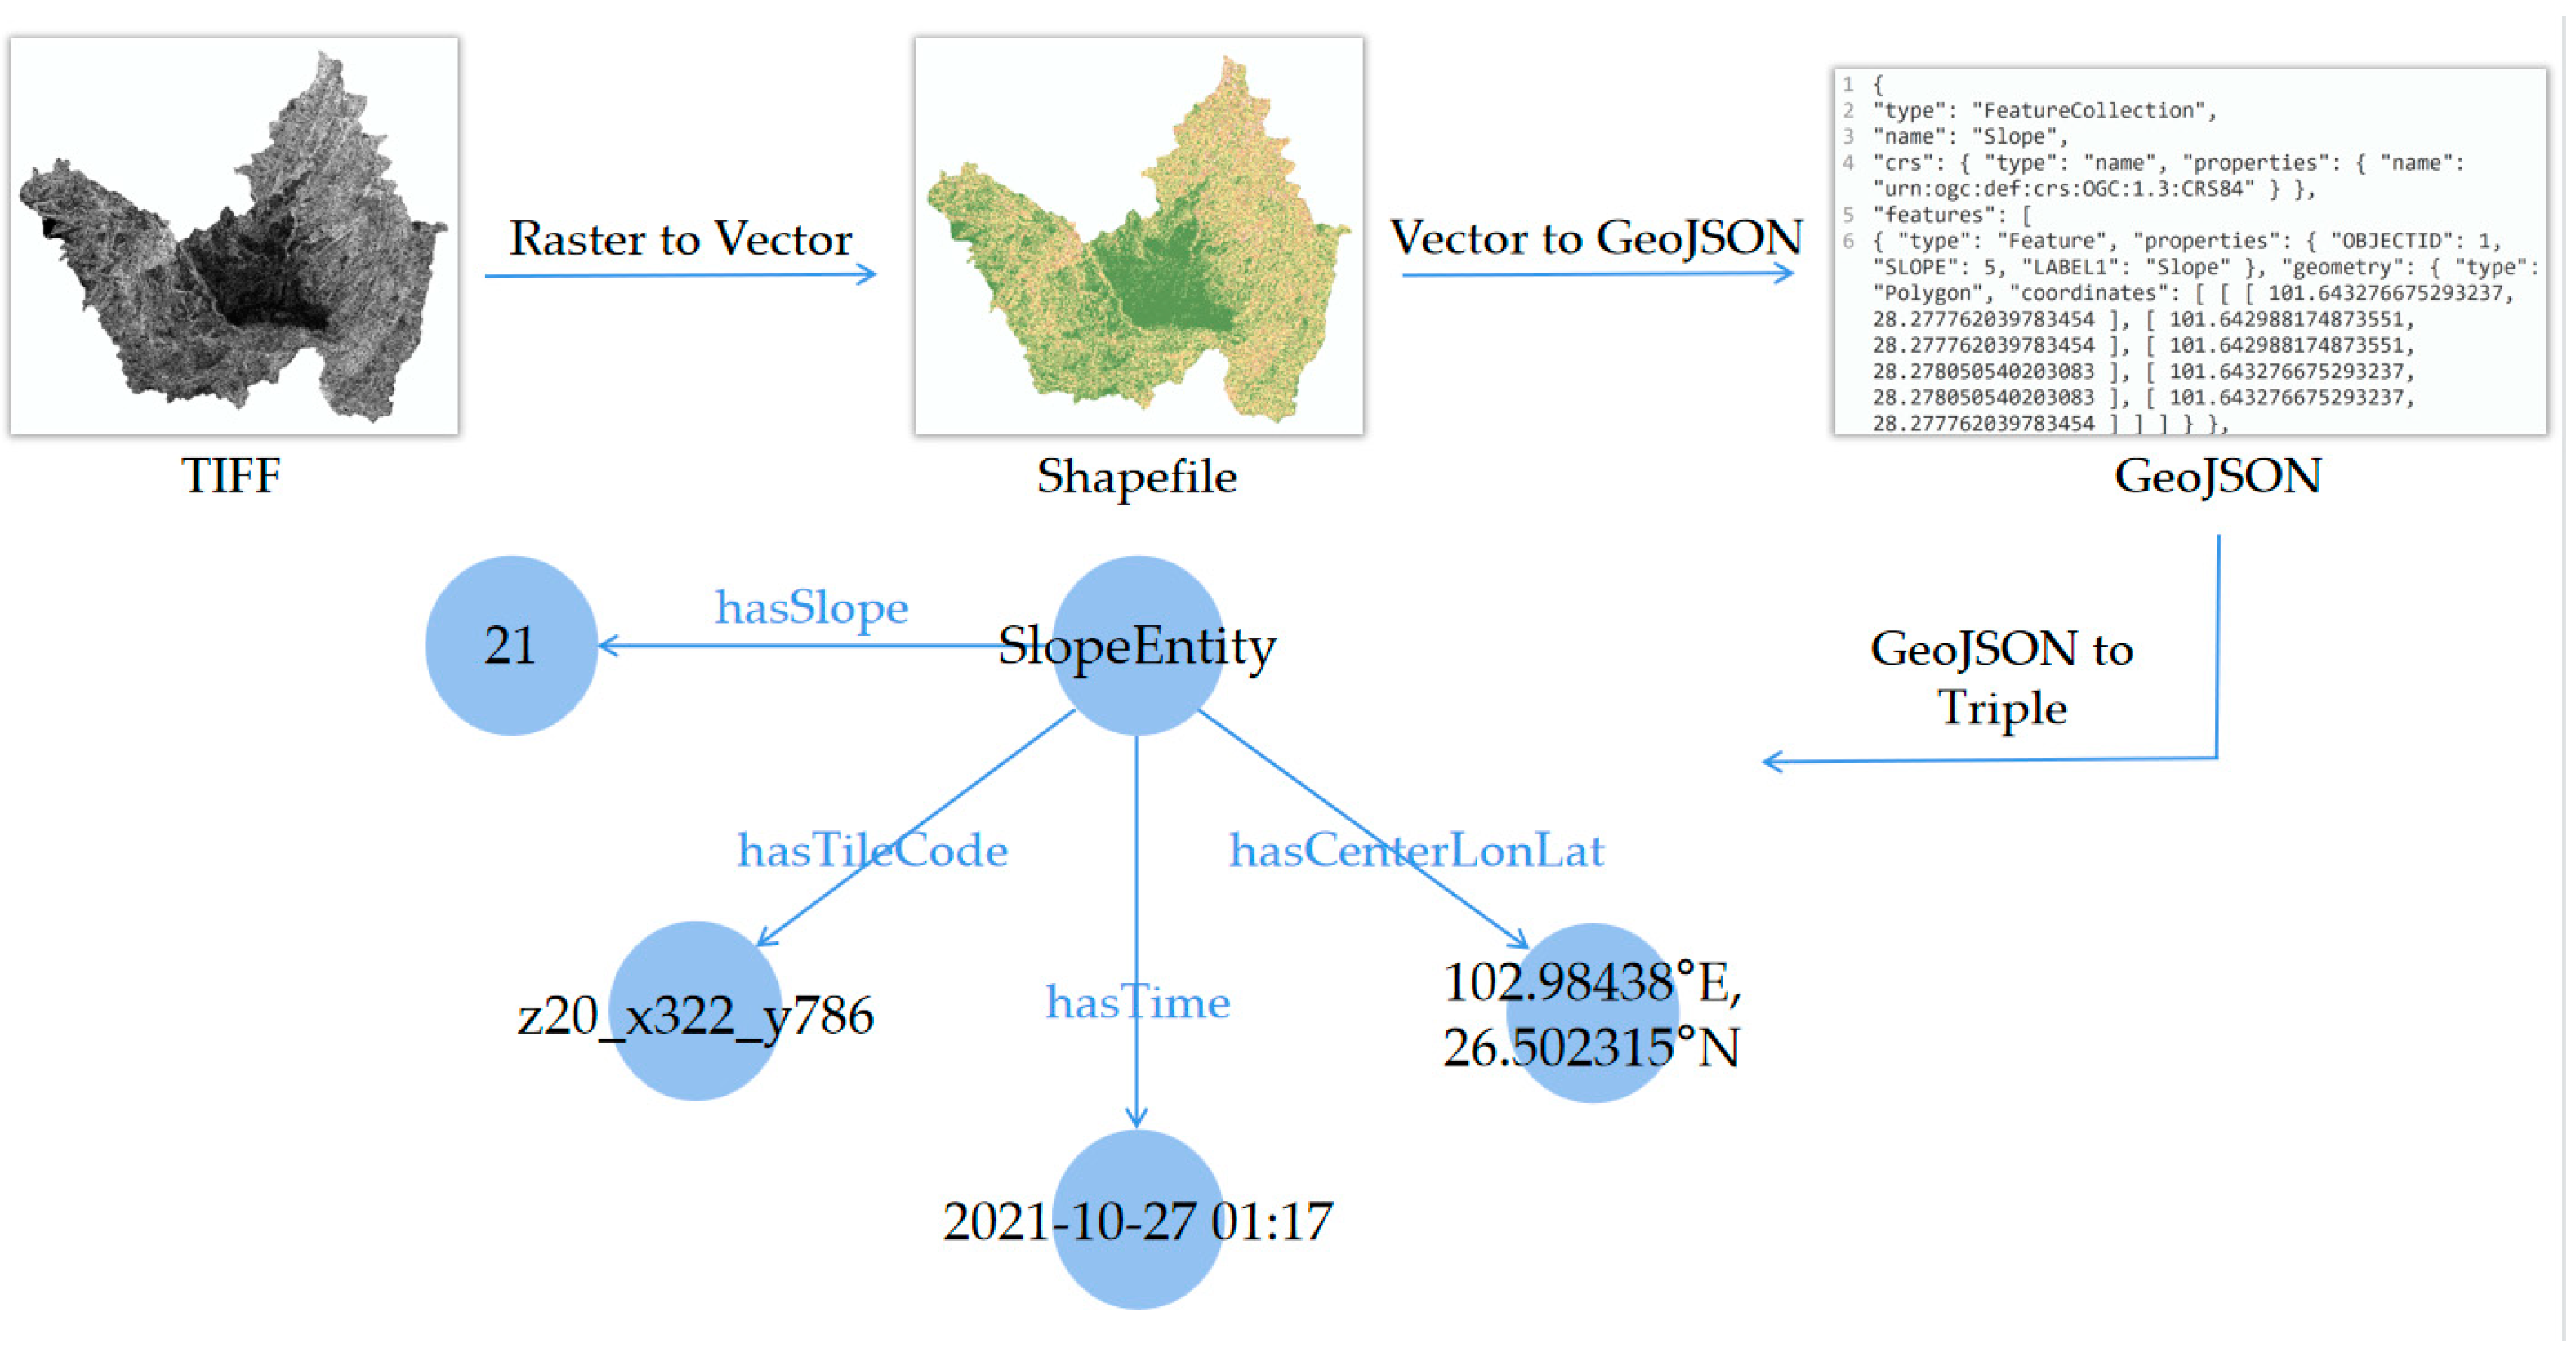
- Knowledge Extraction from Structured Data
- 4.
- Knowledge Extraction from Disaster Prediction Reasoning Criterion
2.3. Query and Reasoning of Disaster Prediction DPKG
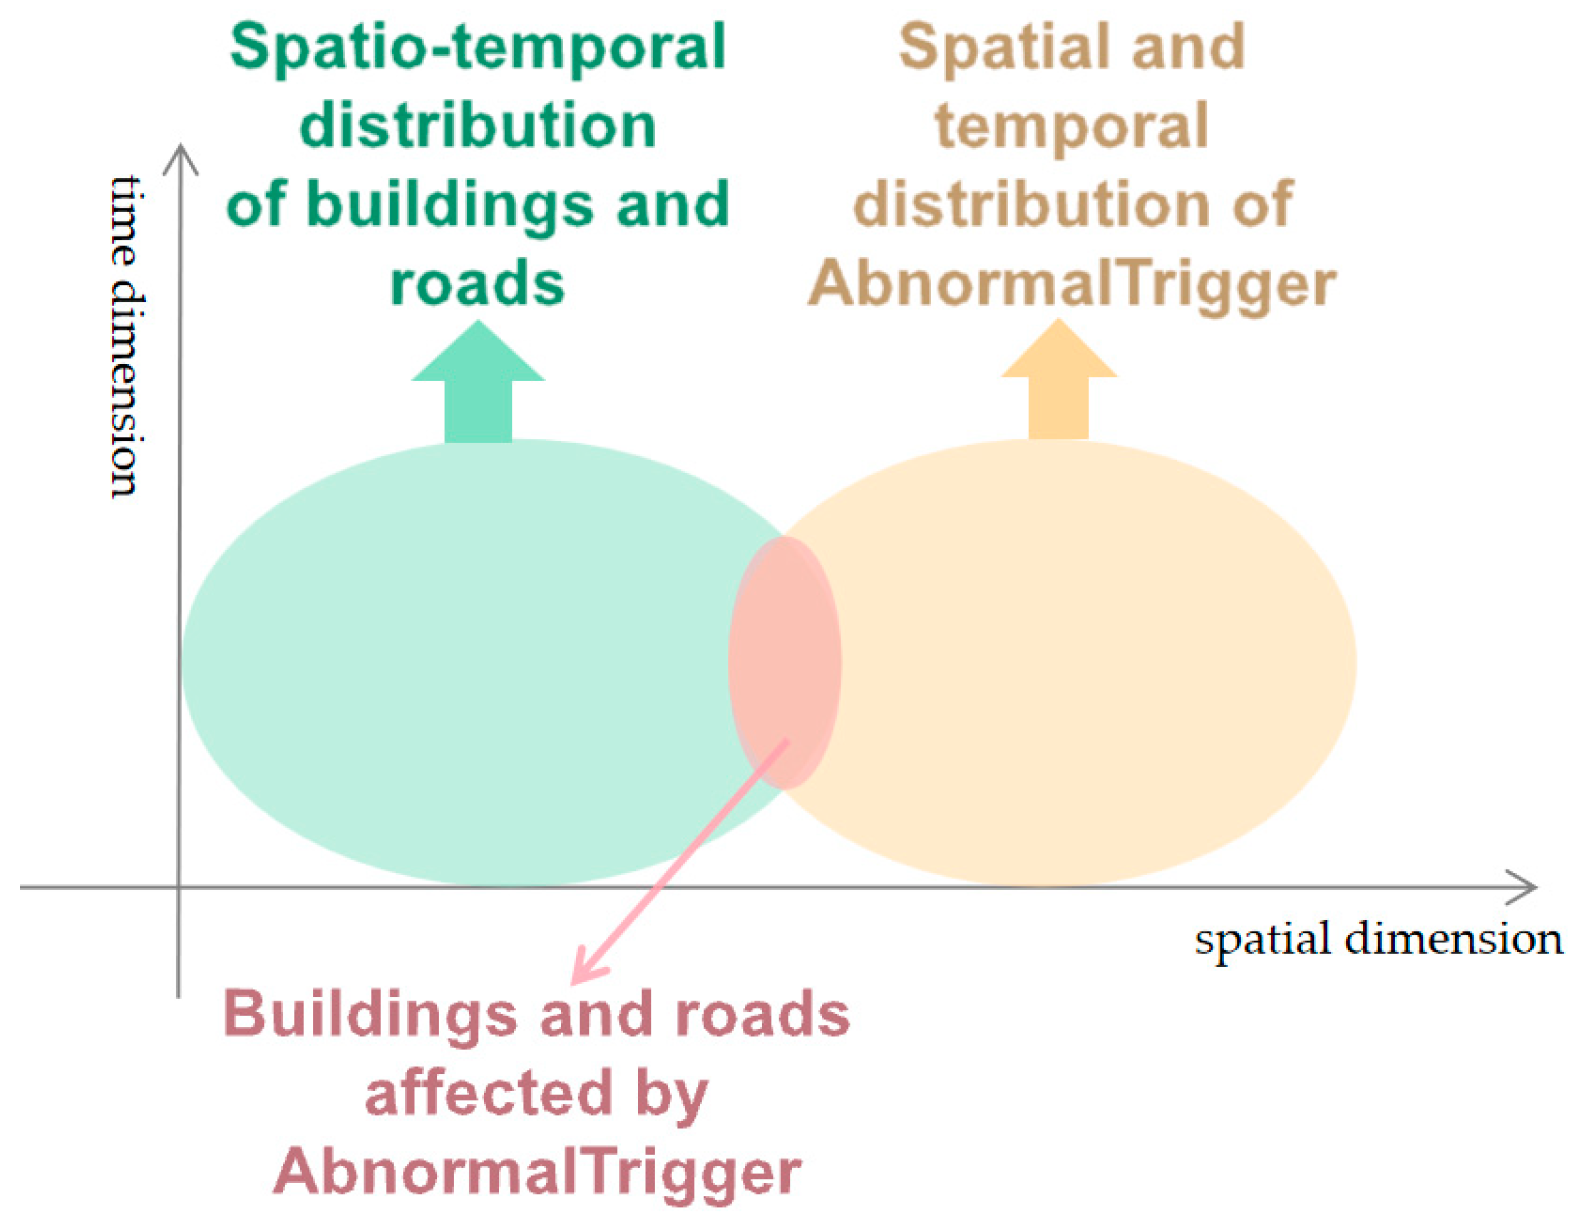
2.3.1. Spatio-Temporal Semantic Query for Disaster Fusion Data
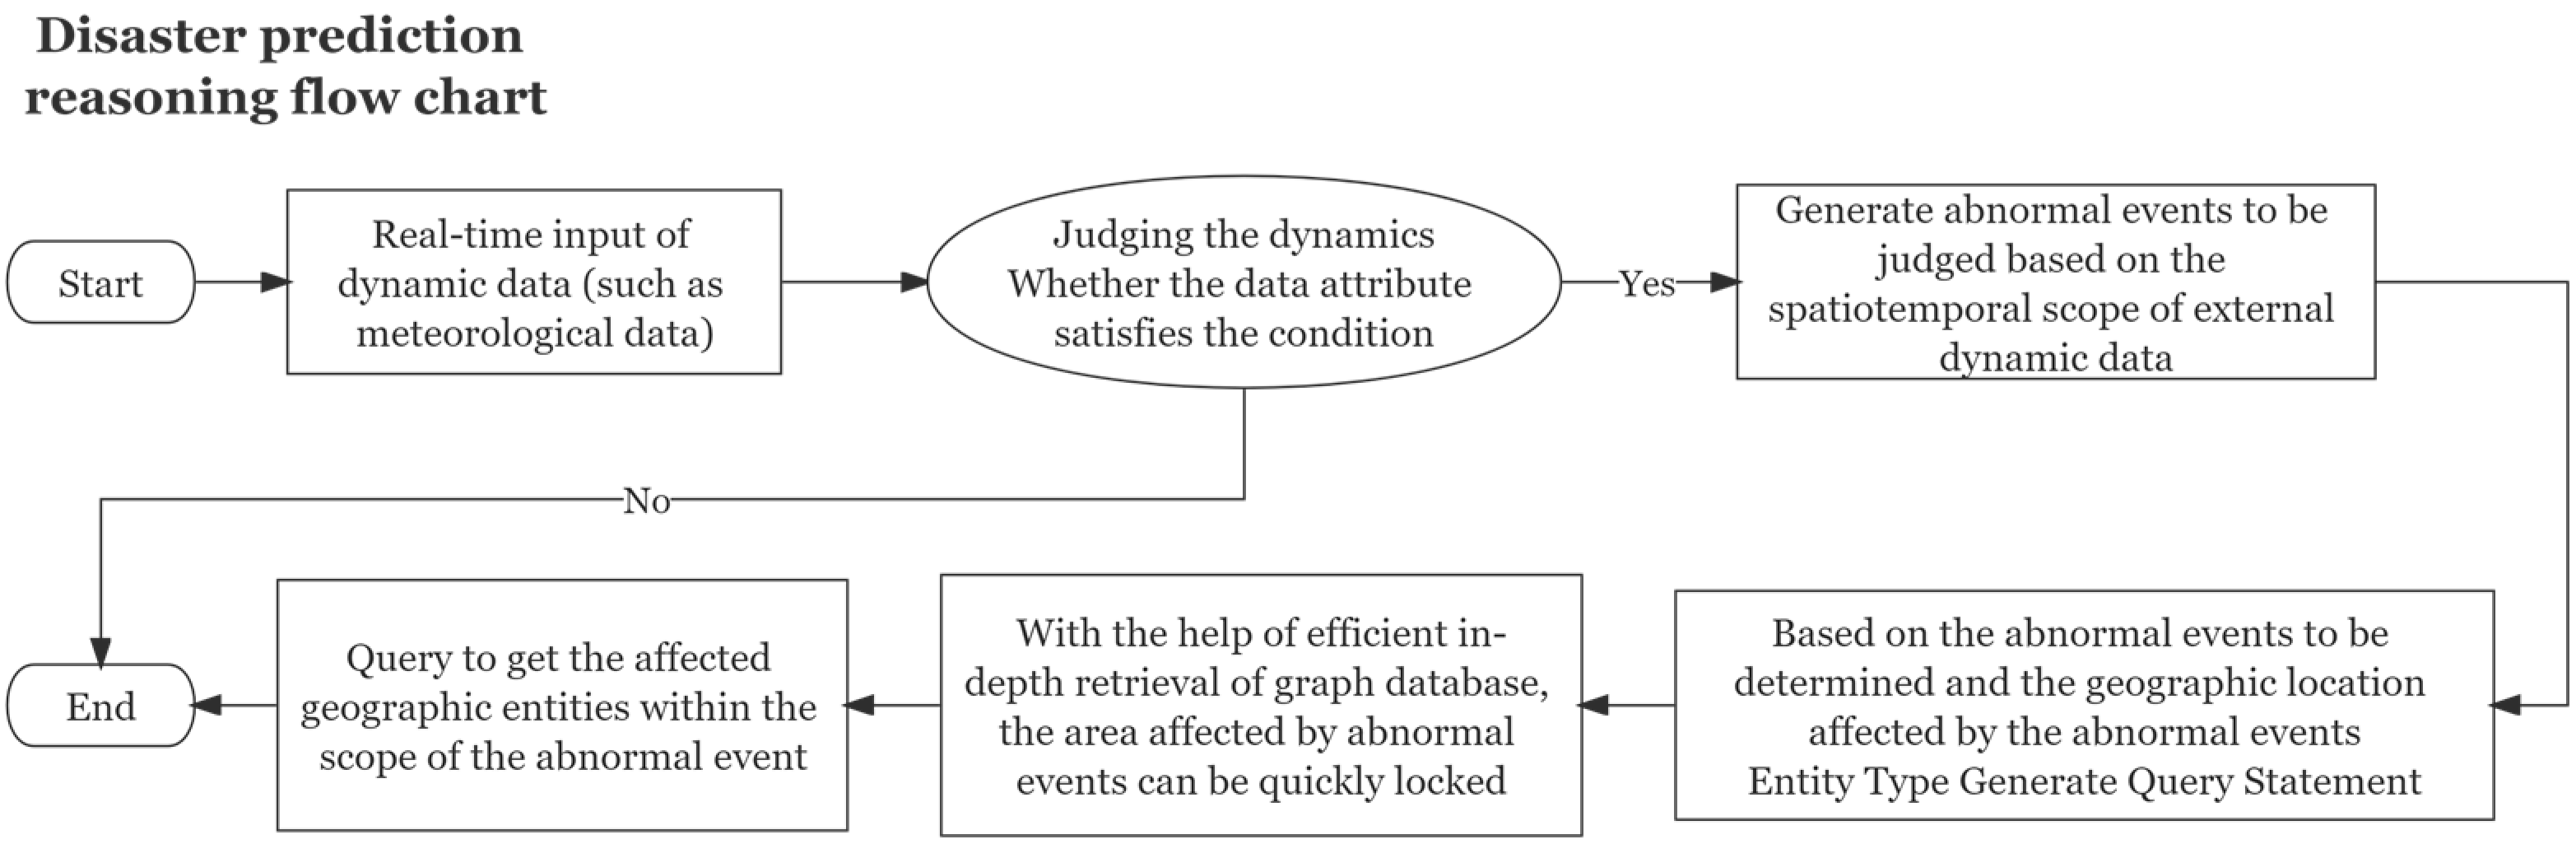
2.3.2. Disaster Prediction Rule Reasoning
- First-order logical reasoning
- 2.
- Production reasoning
- 3.
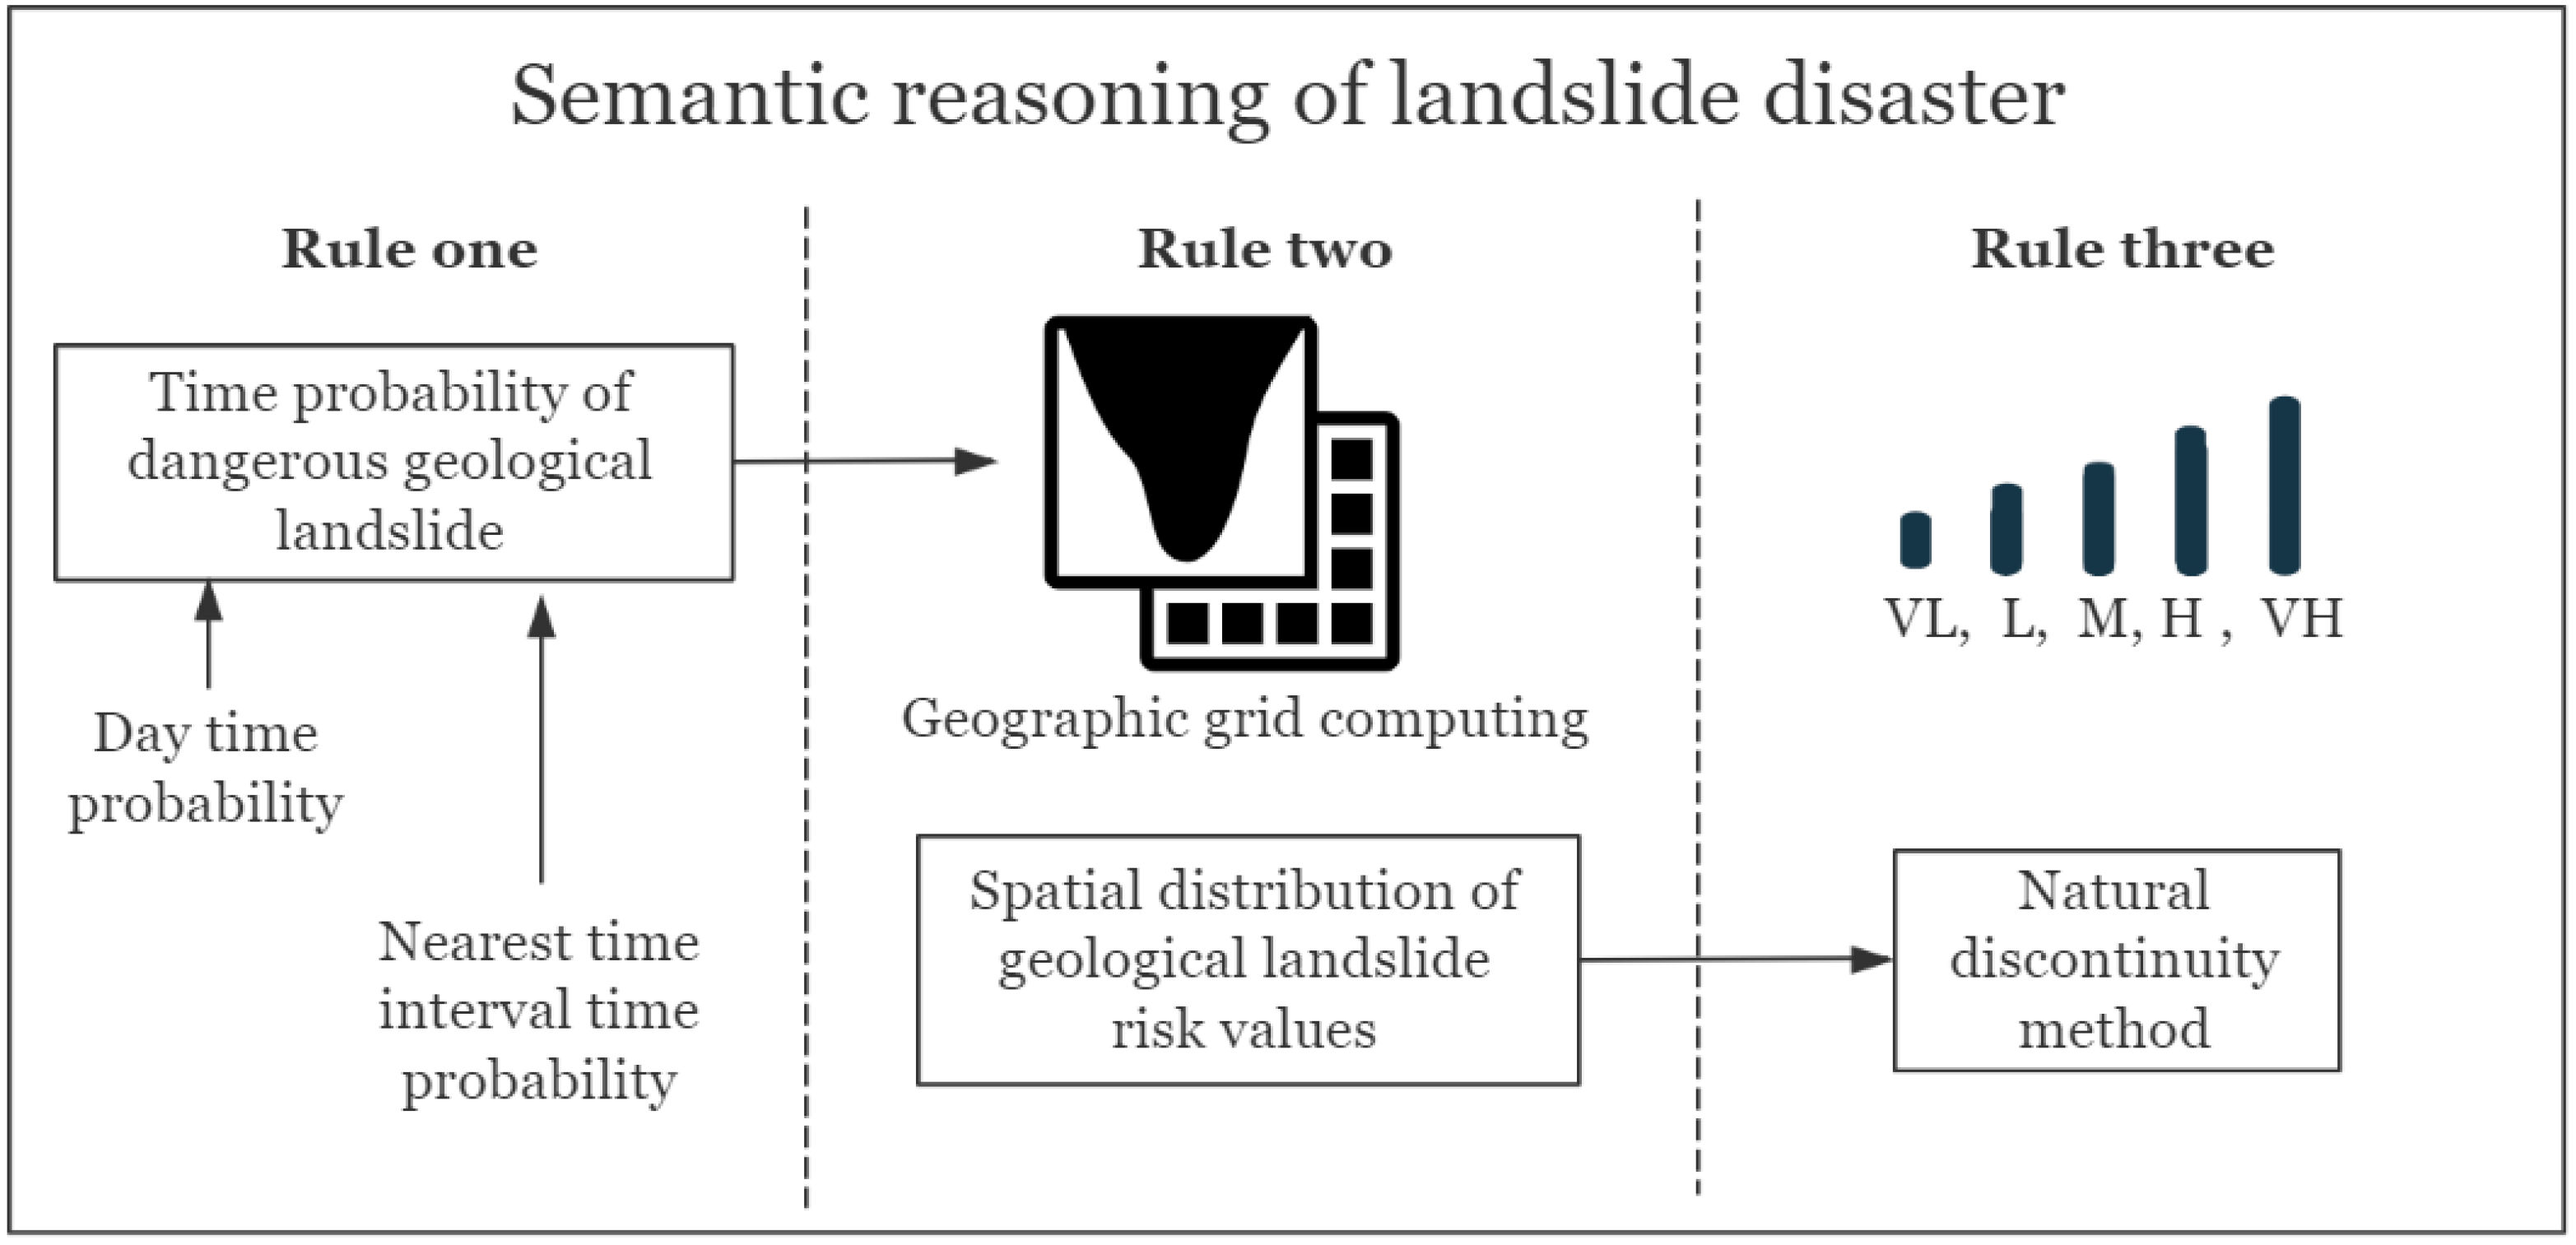
- Spatio-temporal semantic reasoning
3. Results
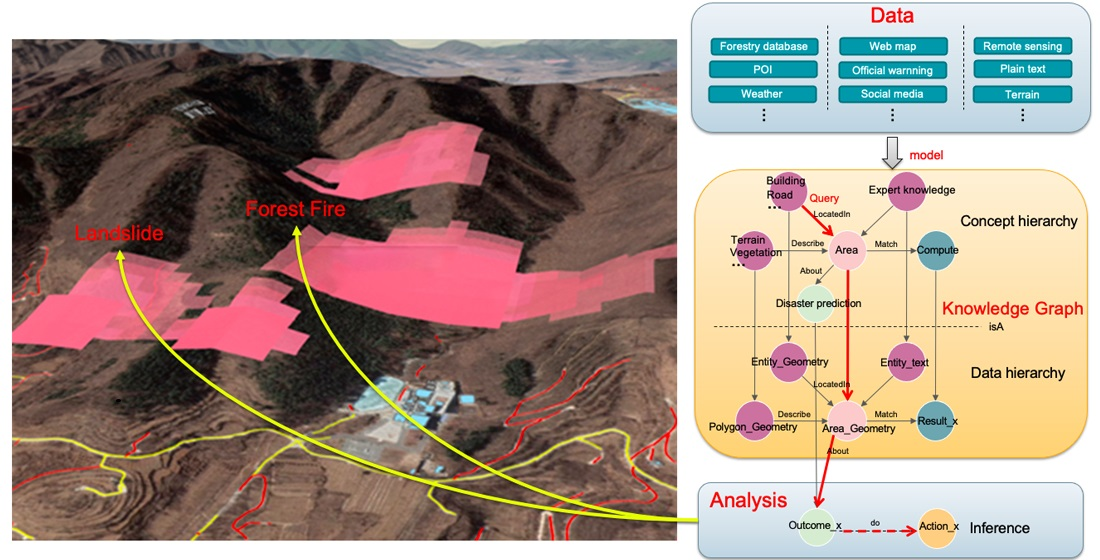
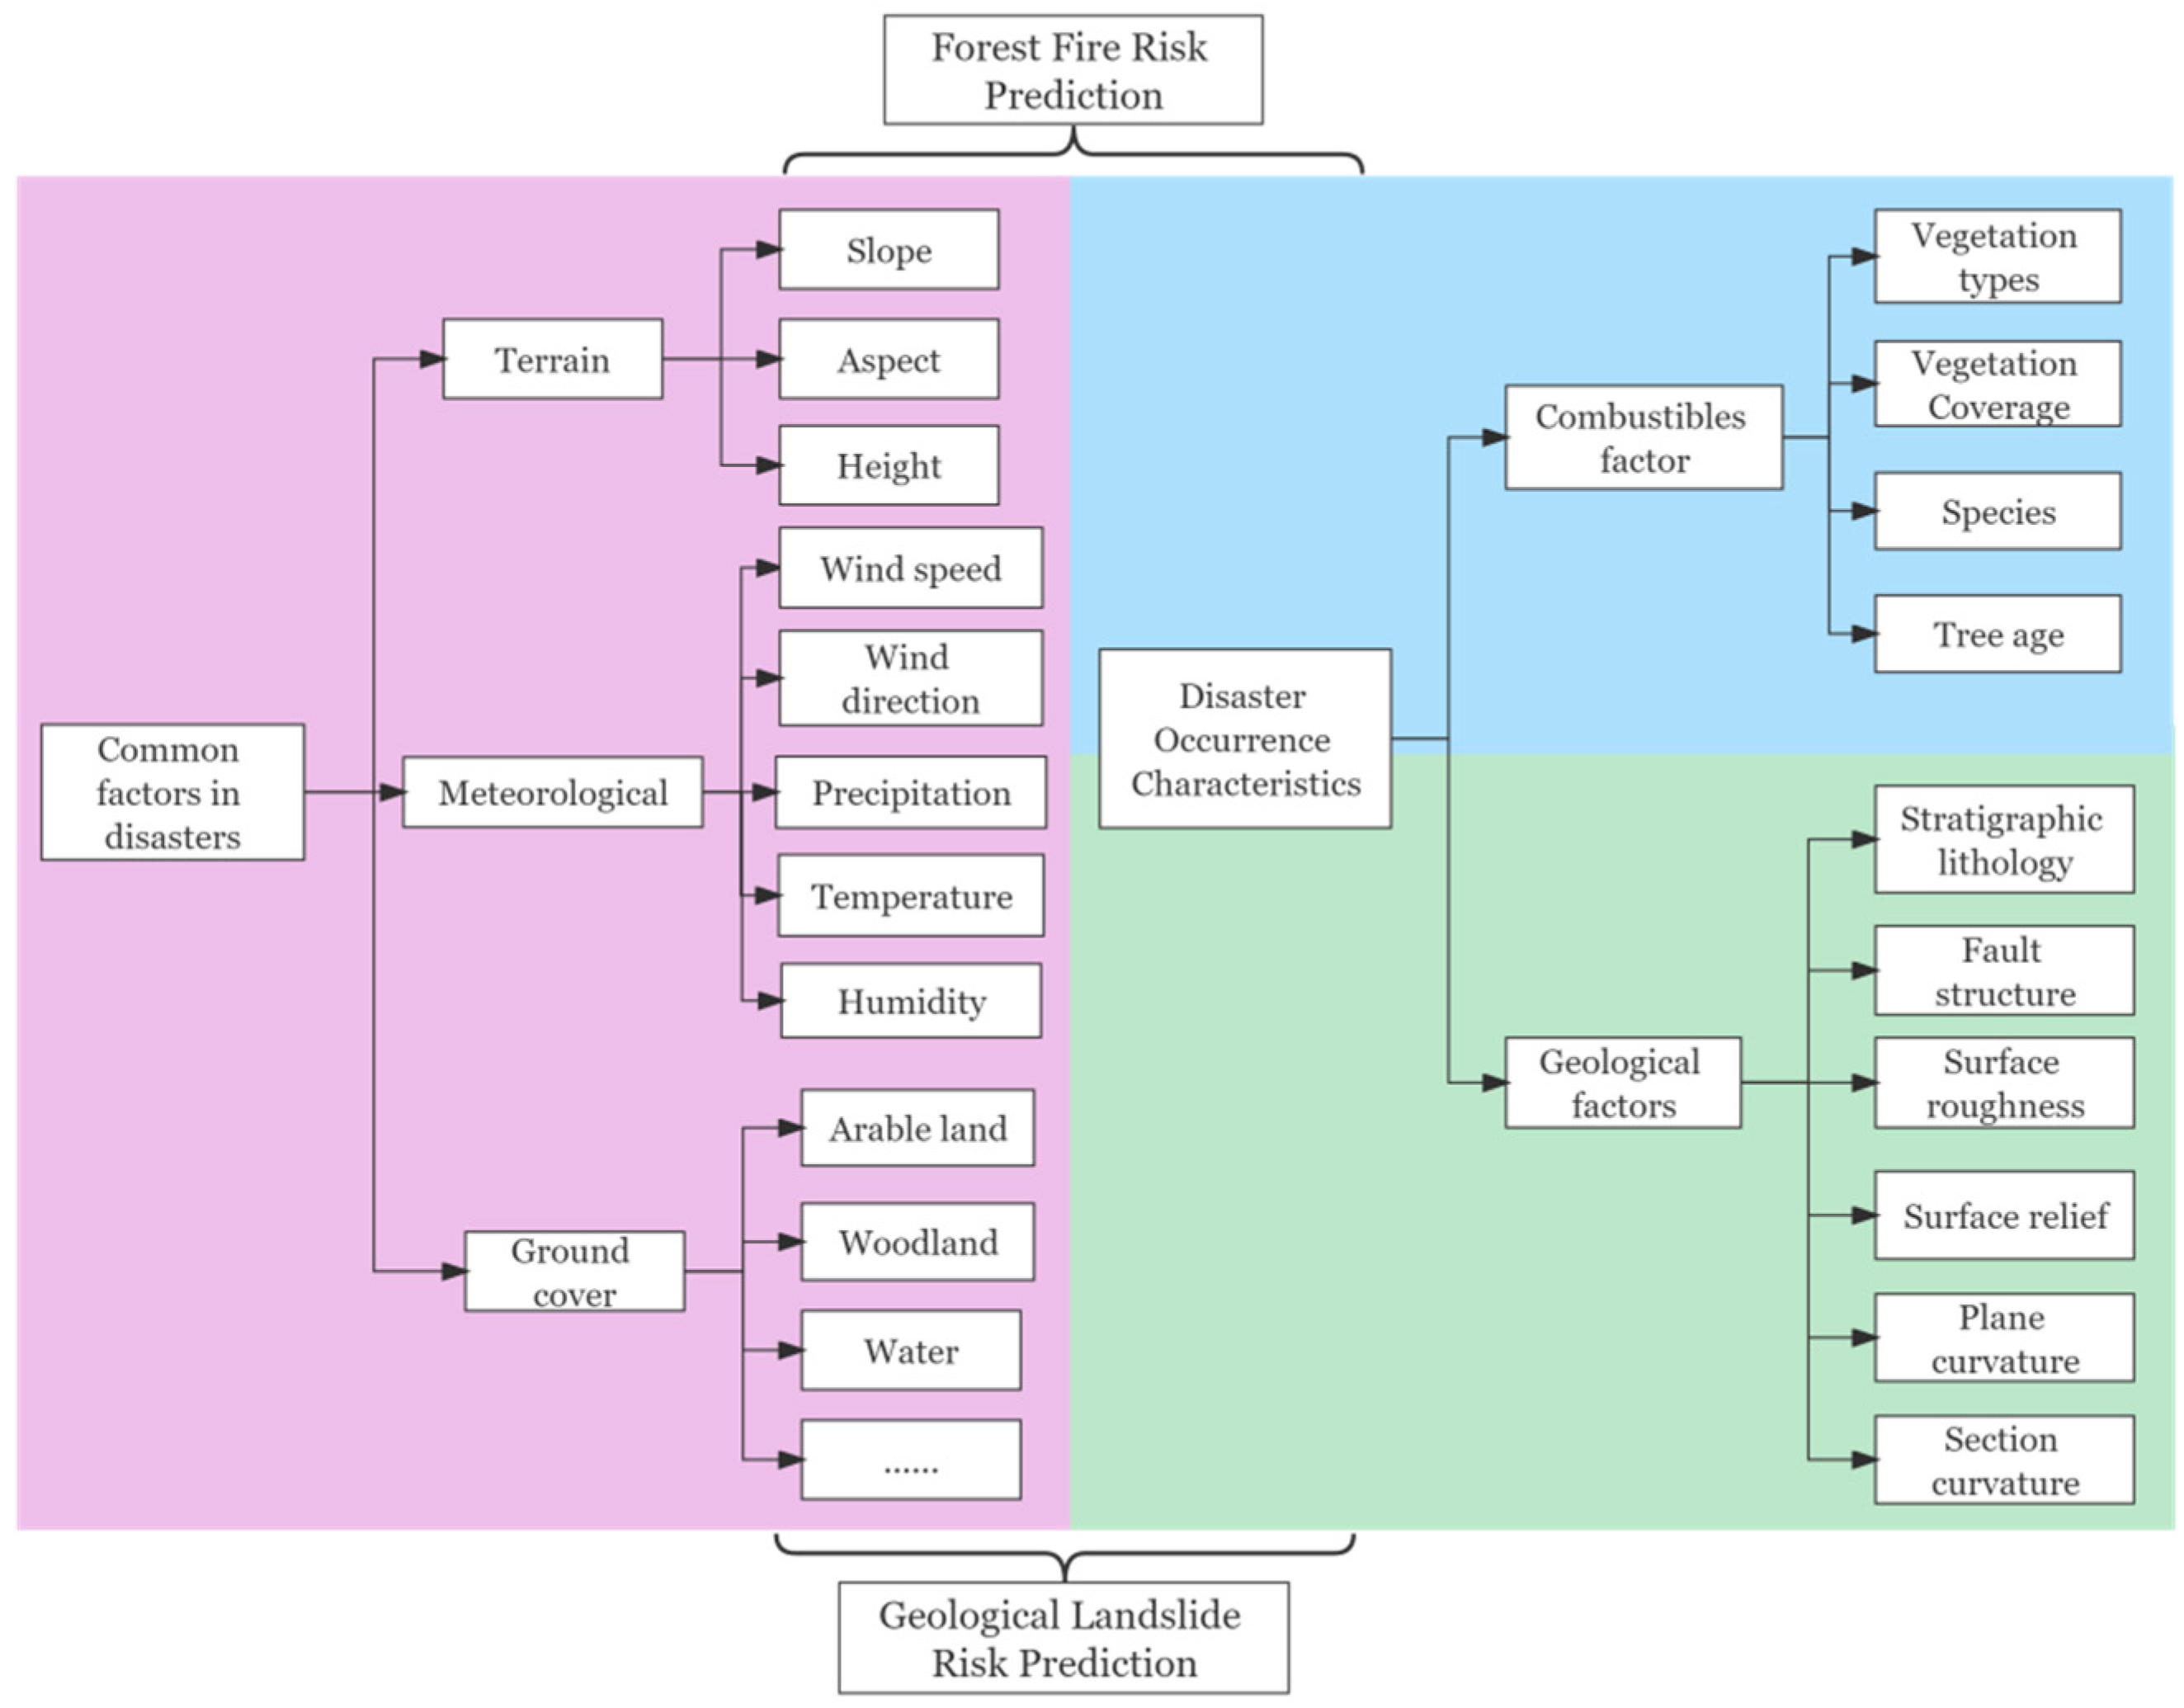
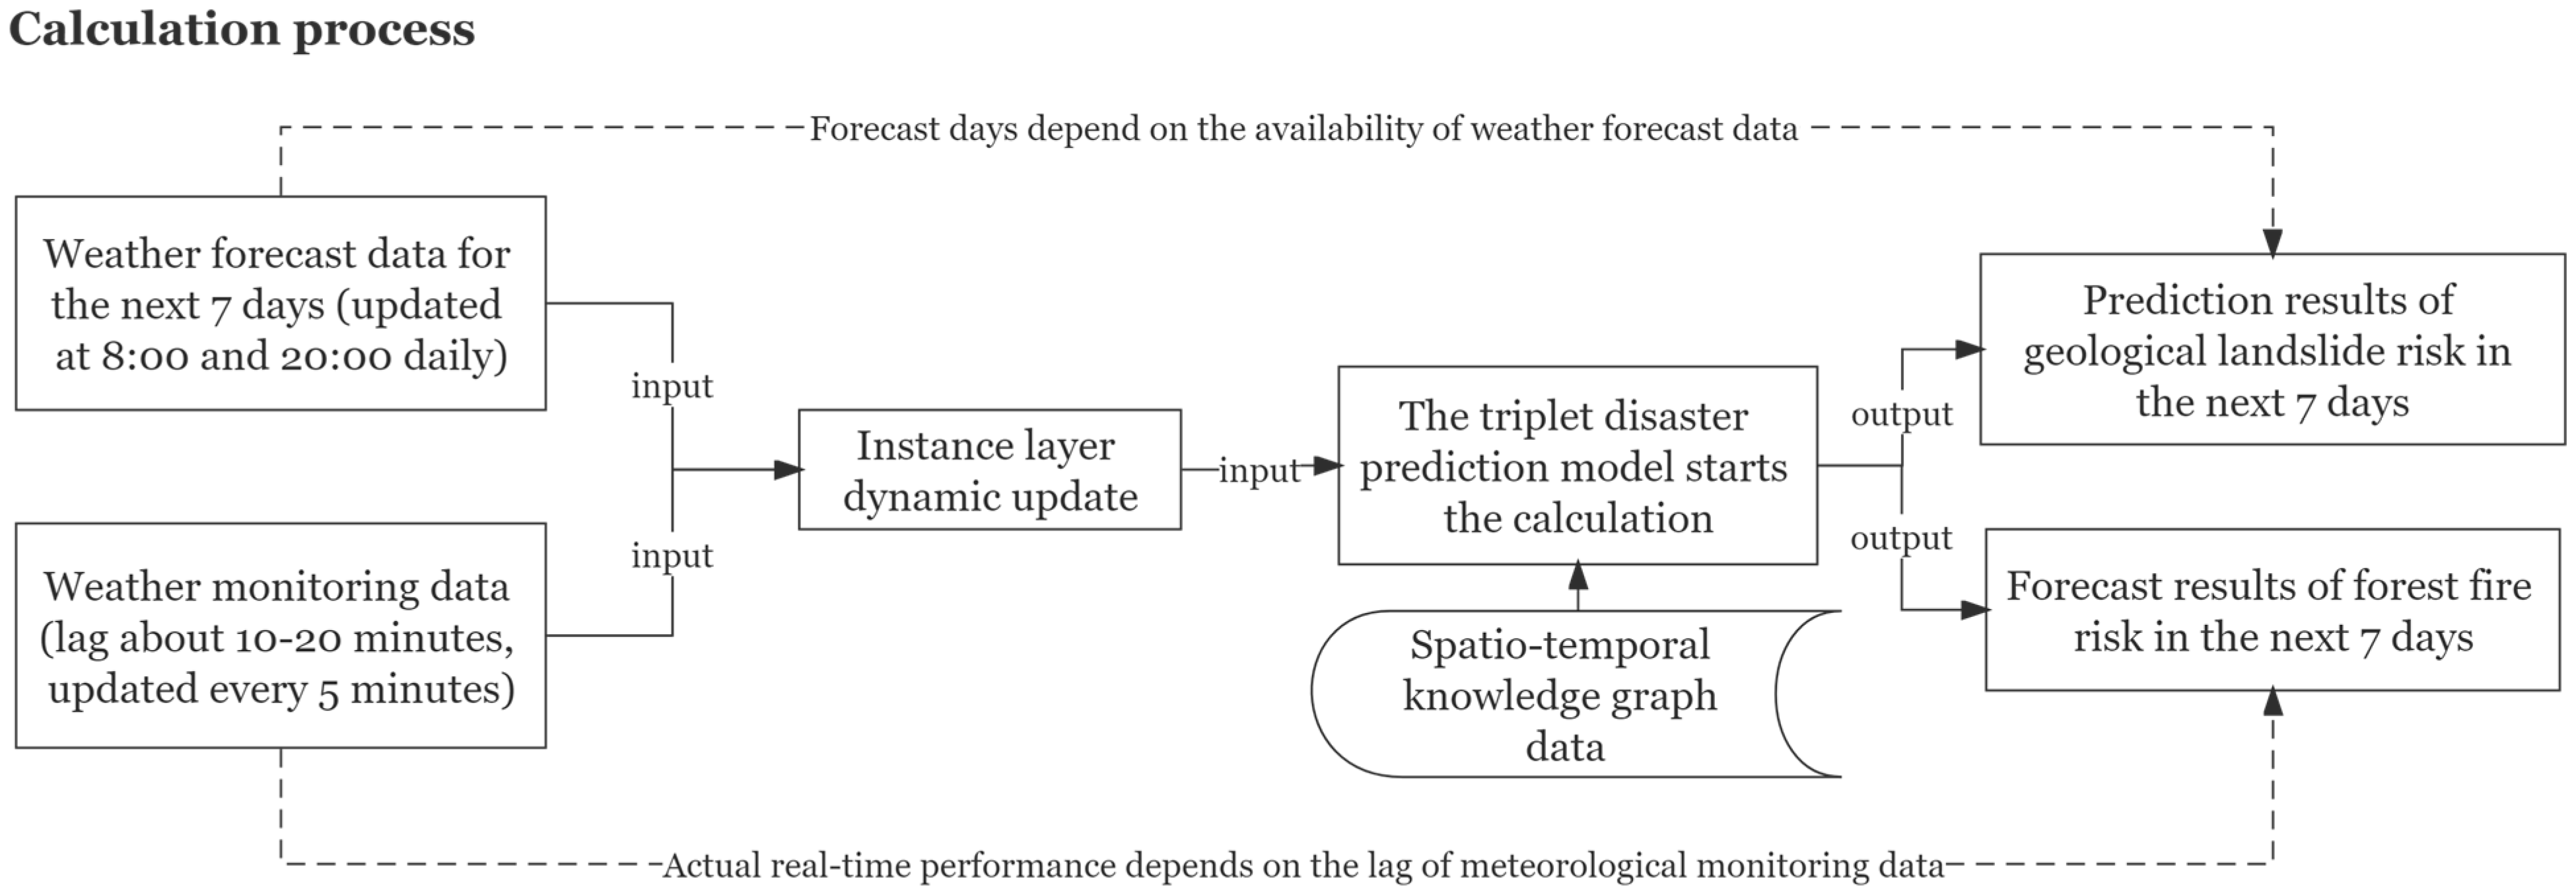
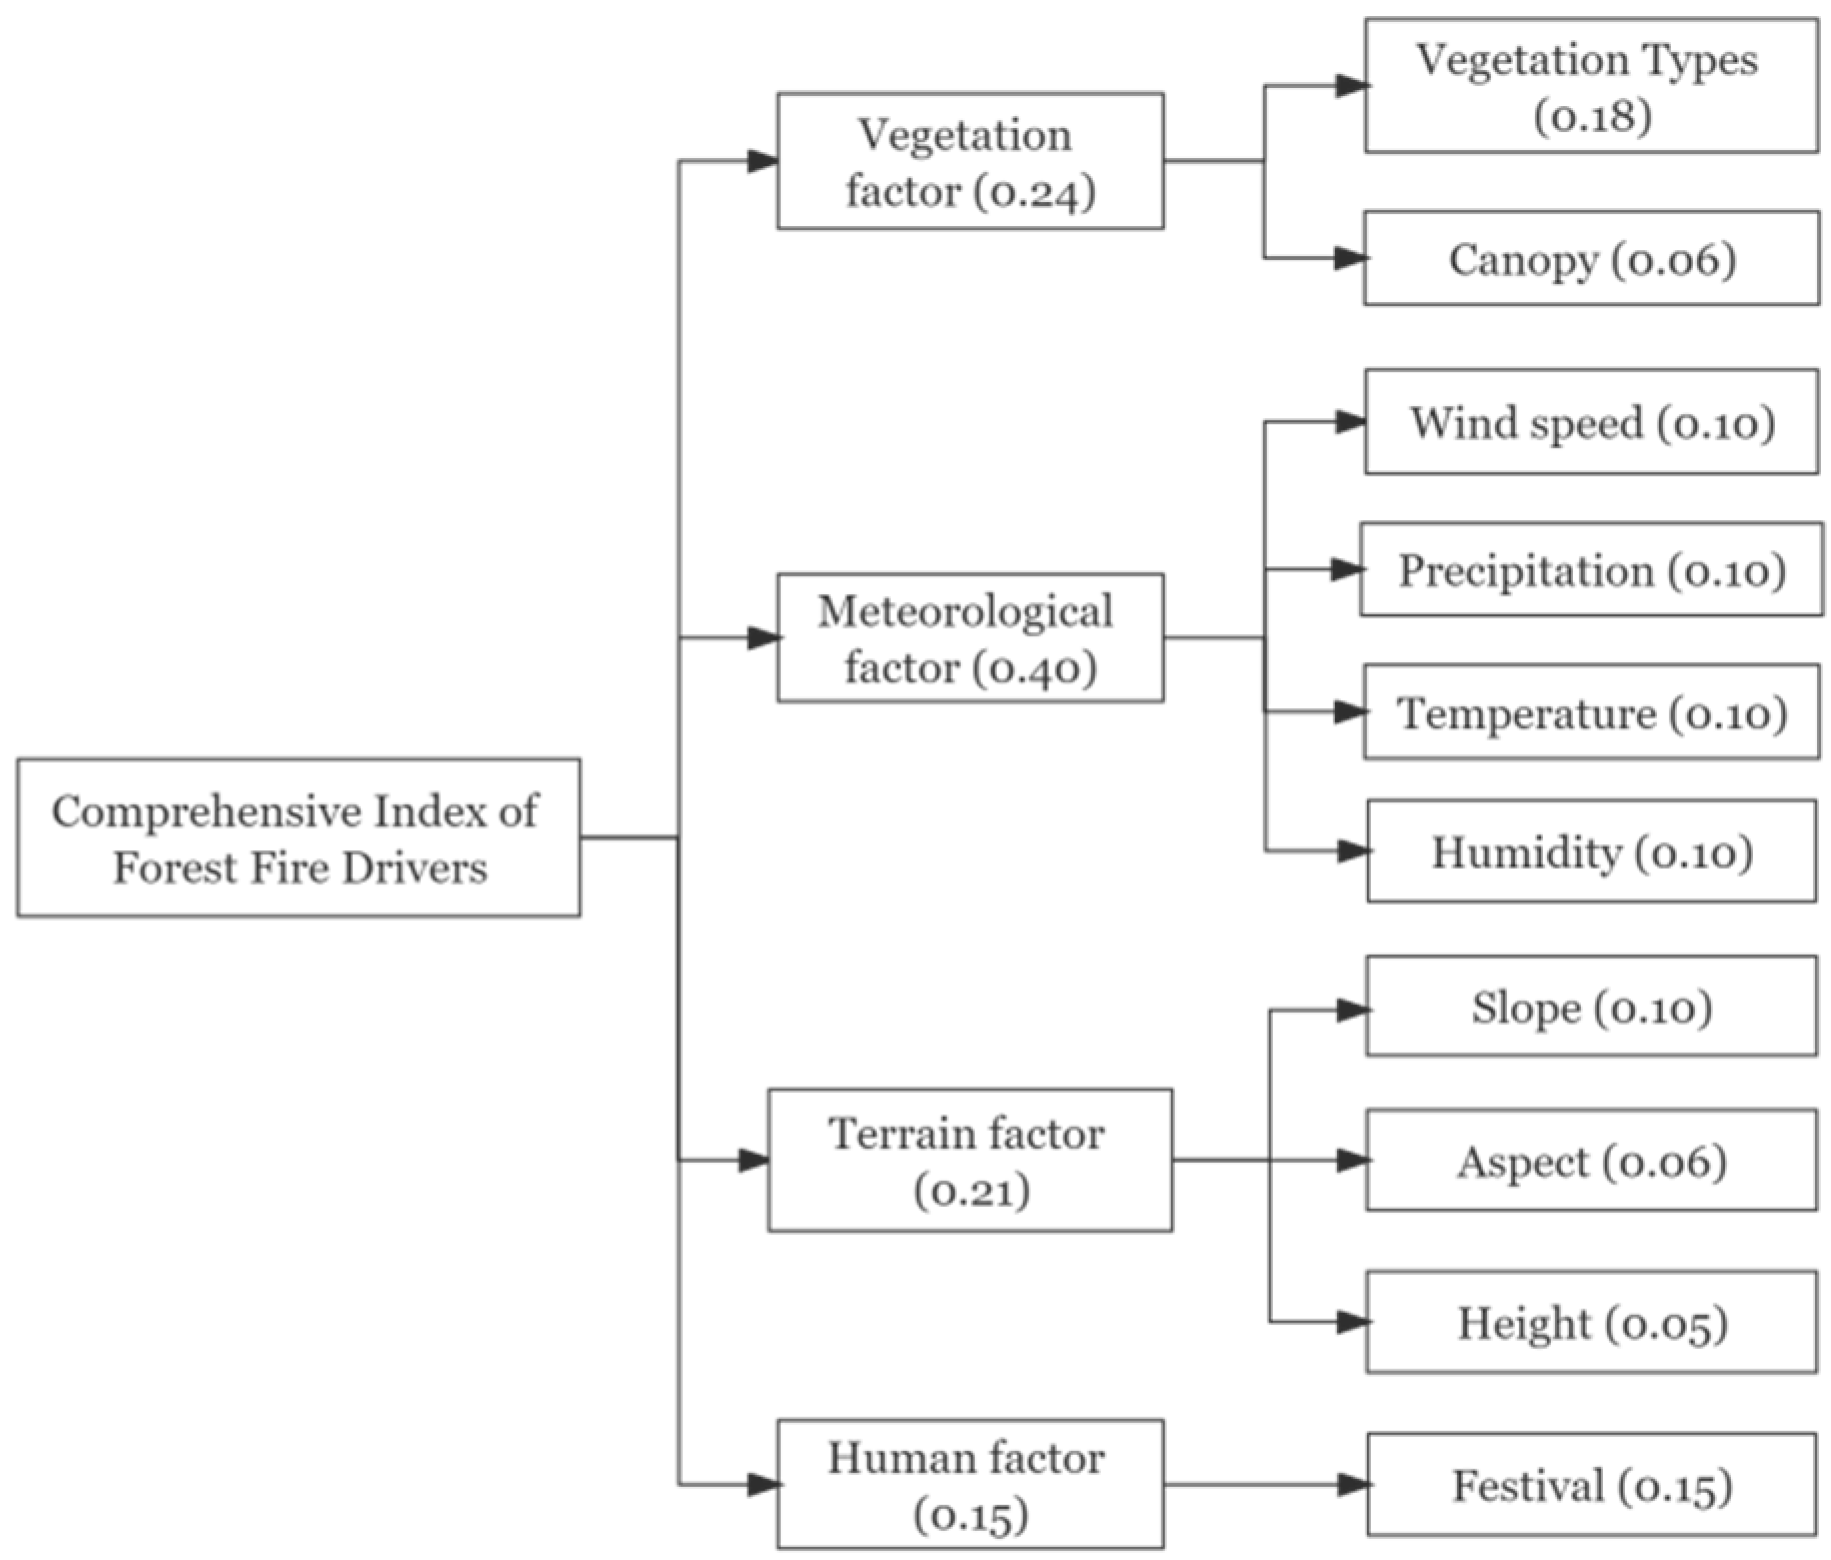
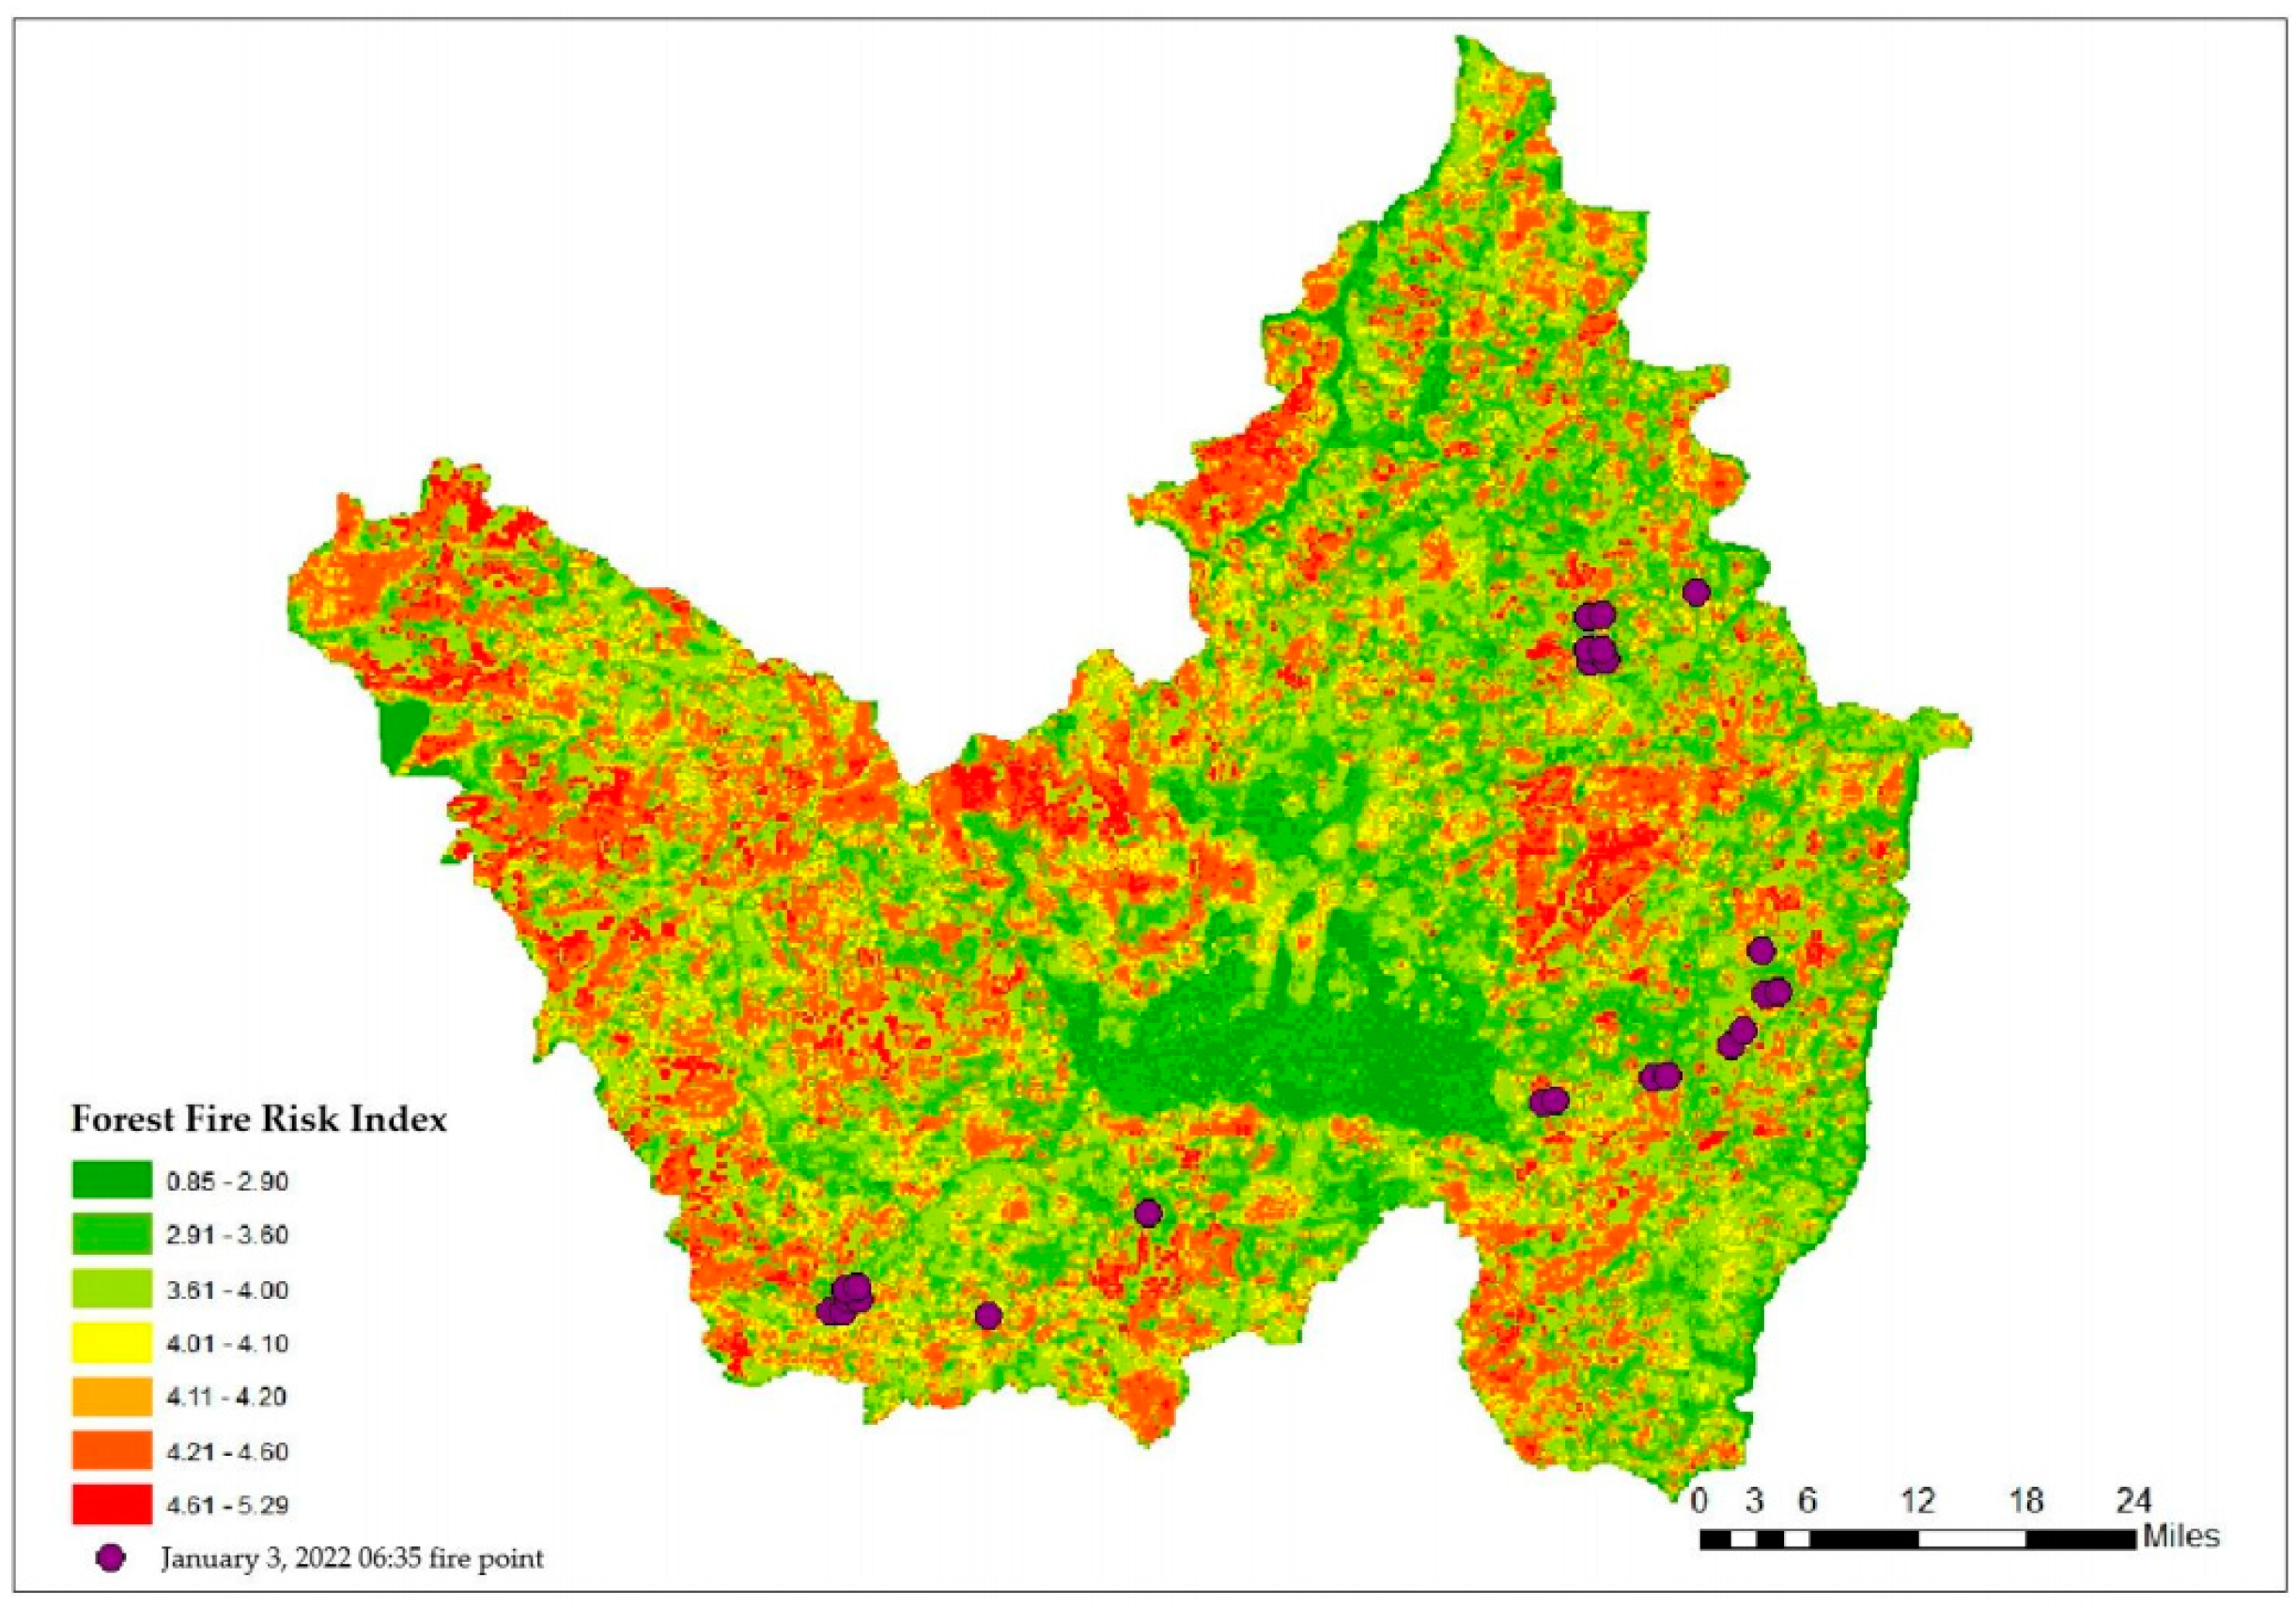
3.1. Case Study: Forest Fire Risk Prediction
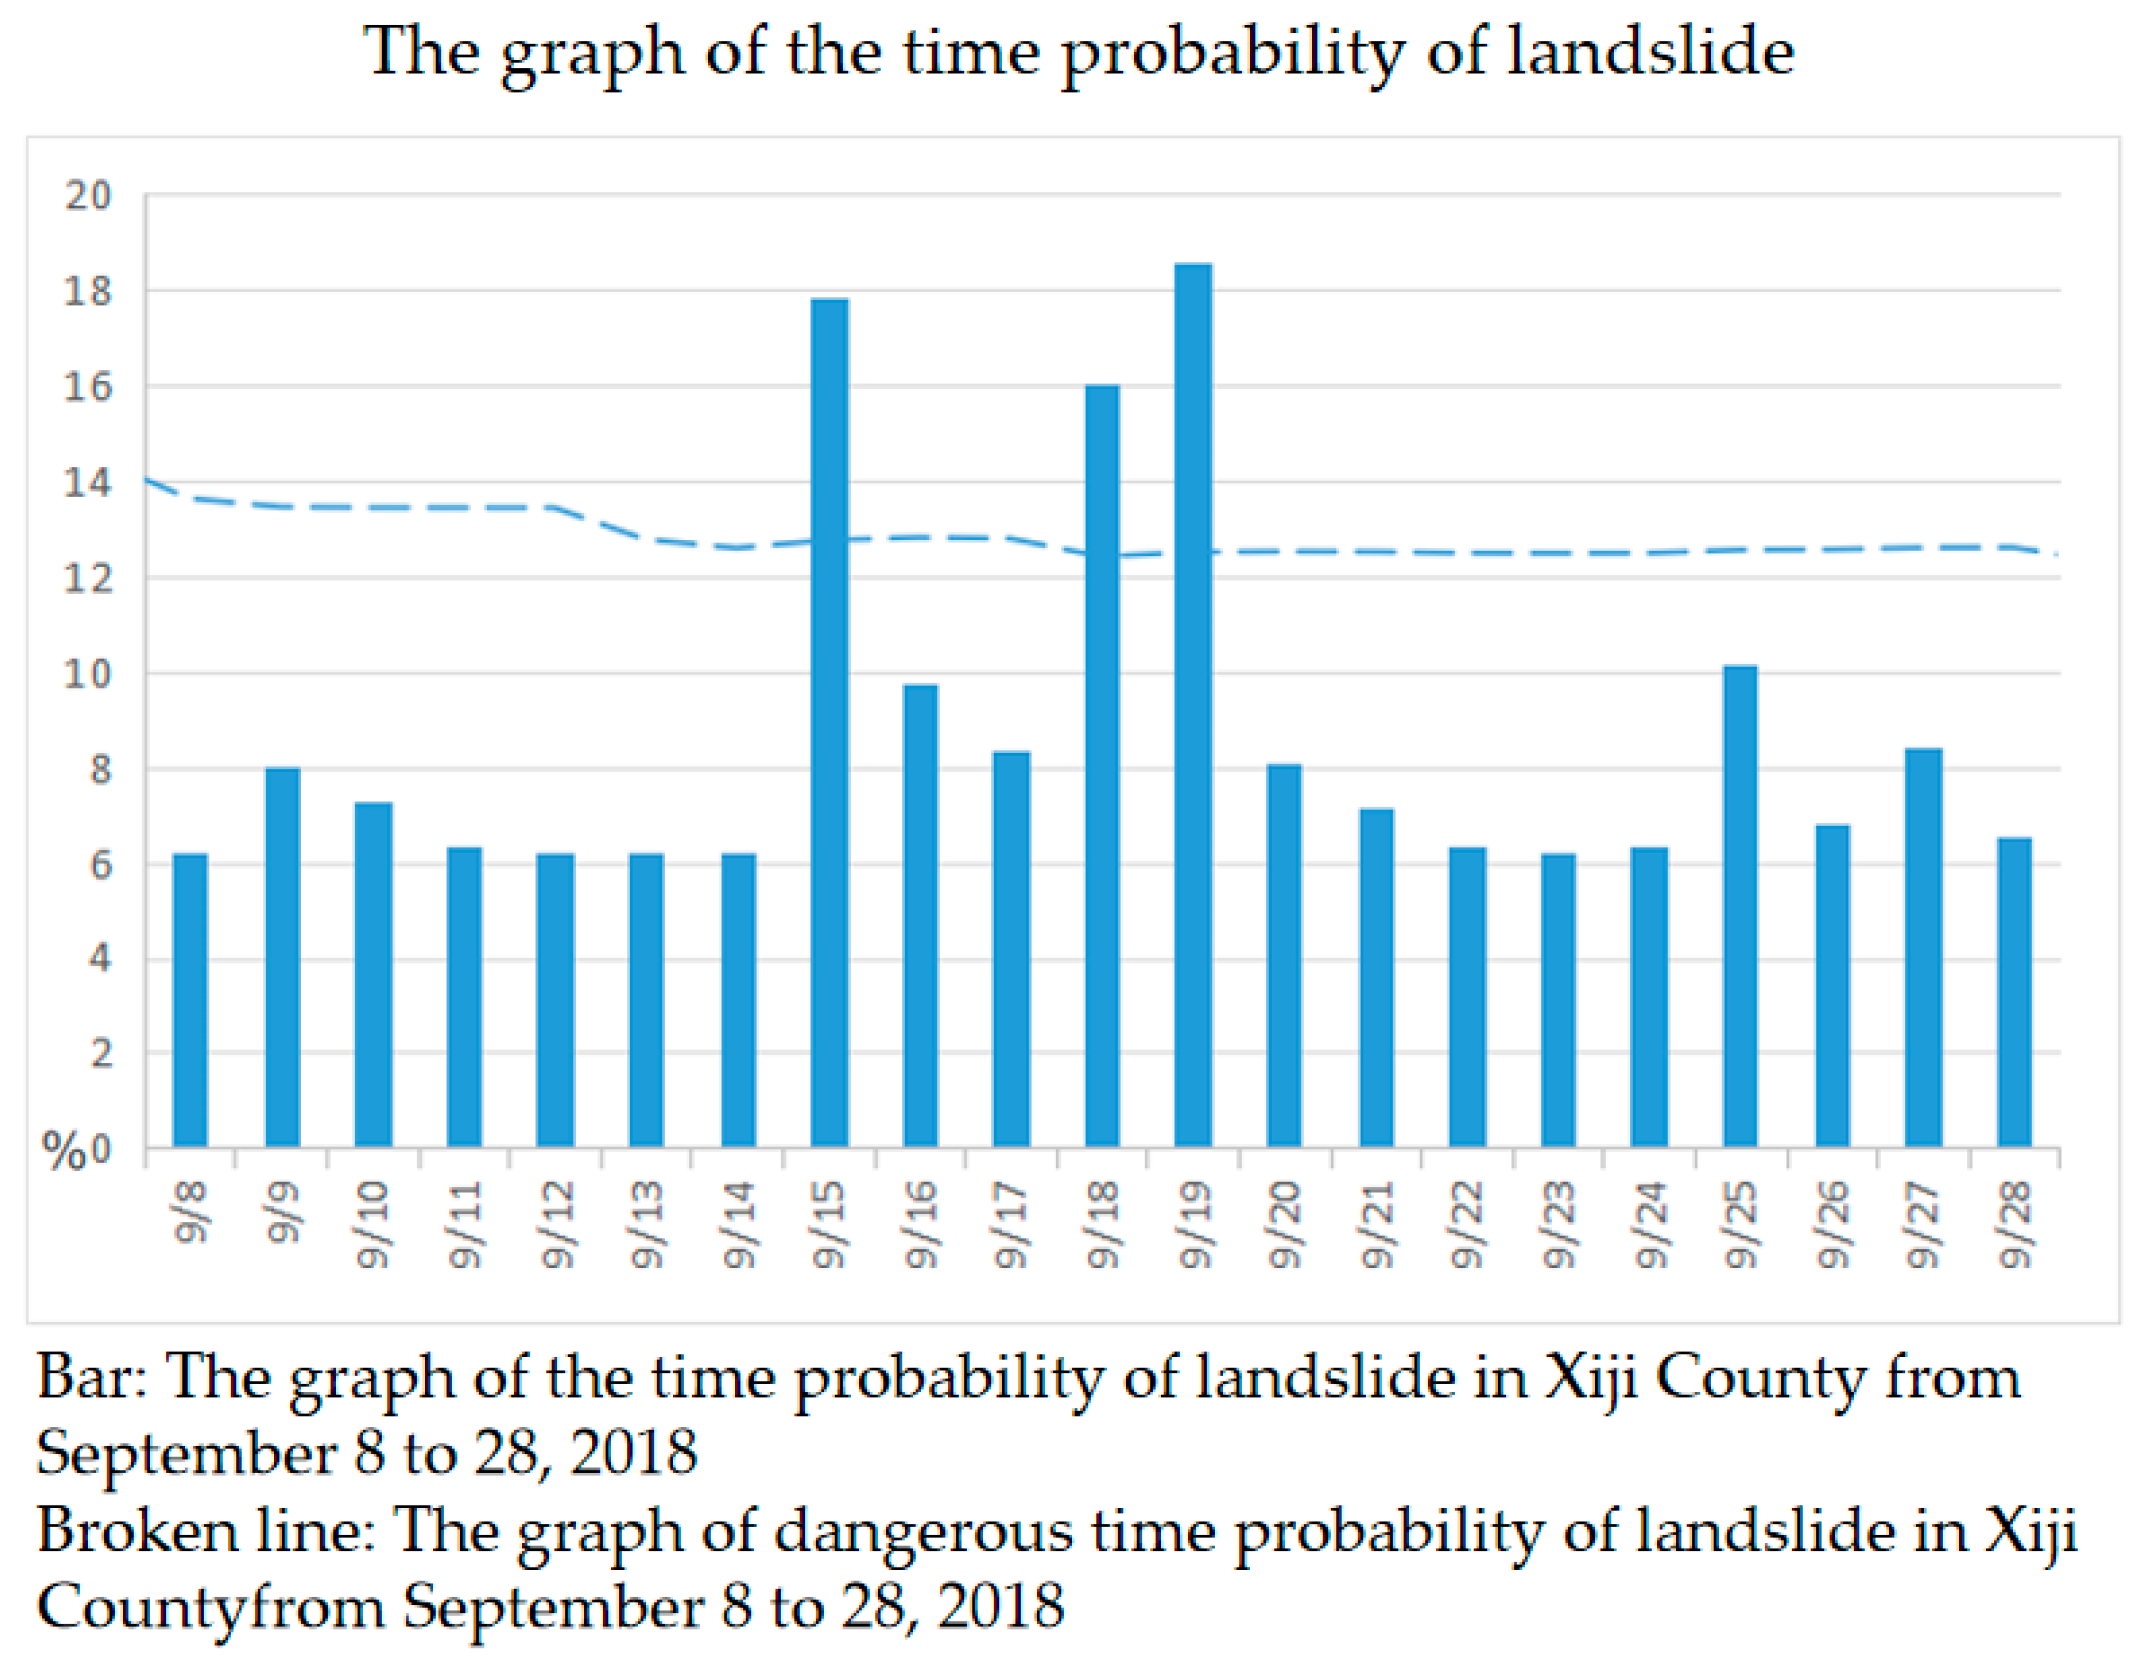
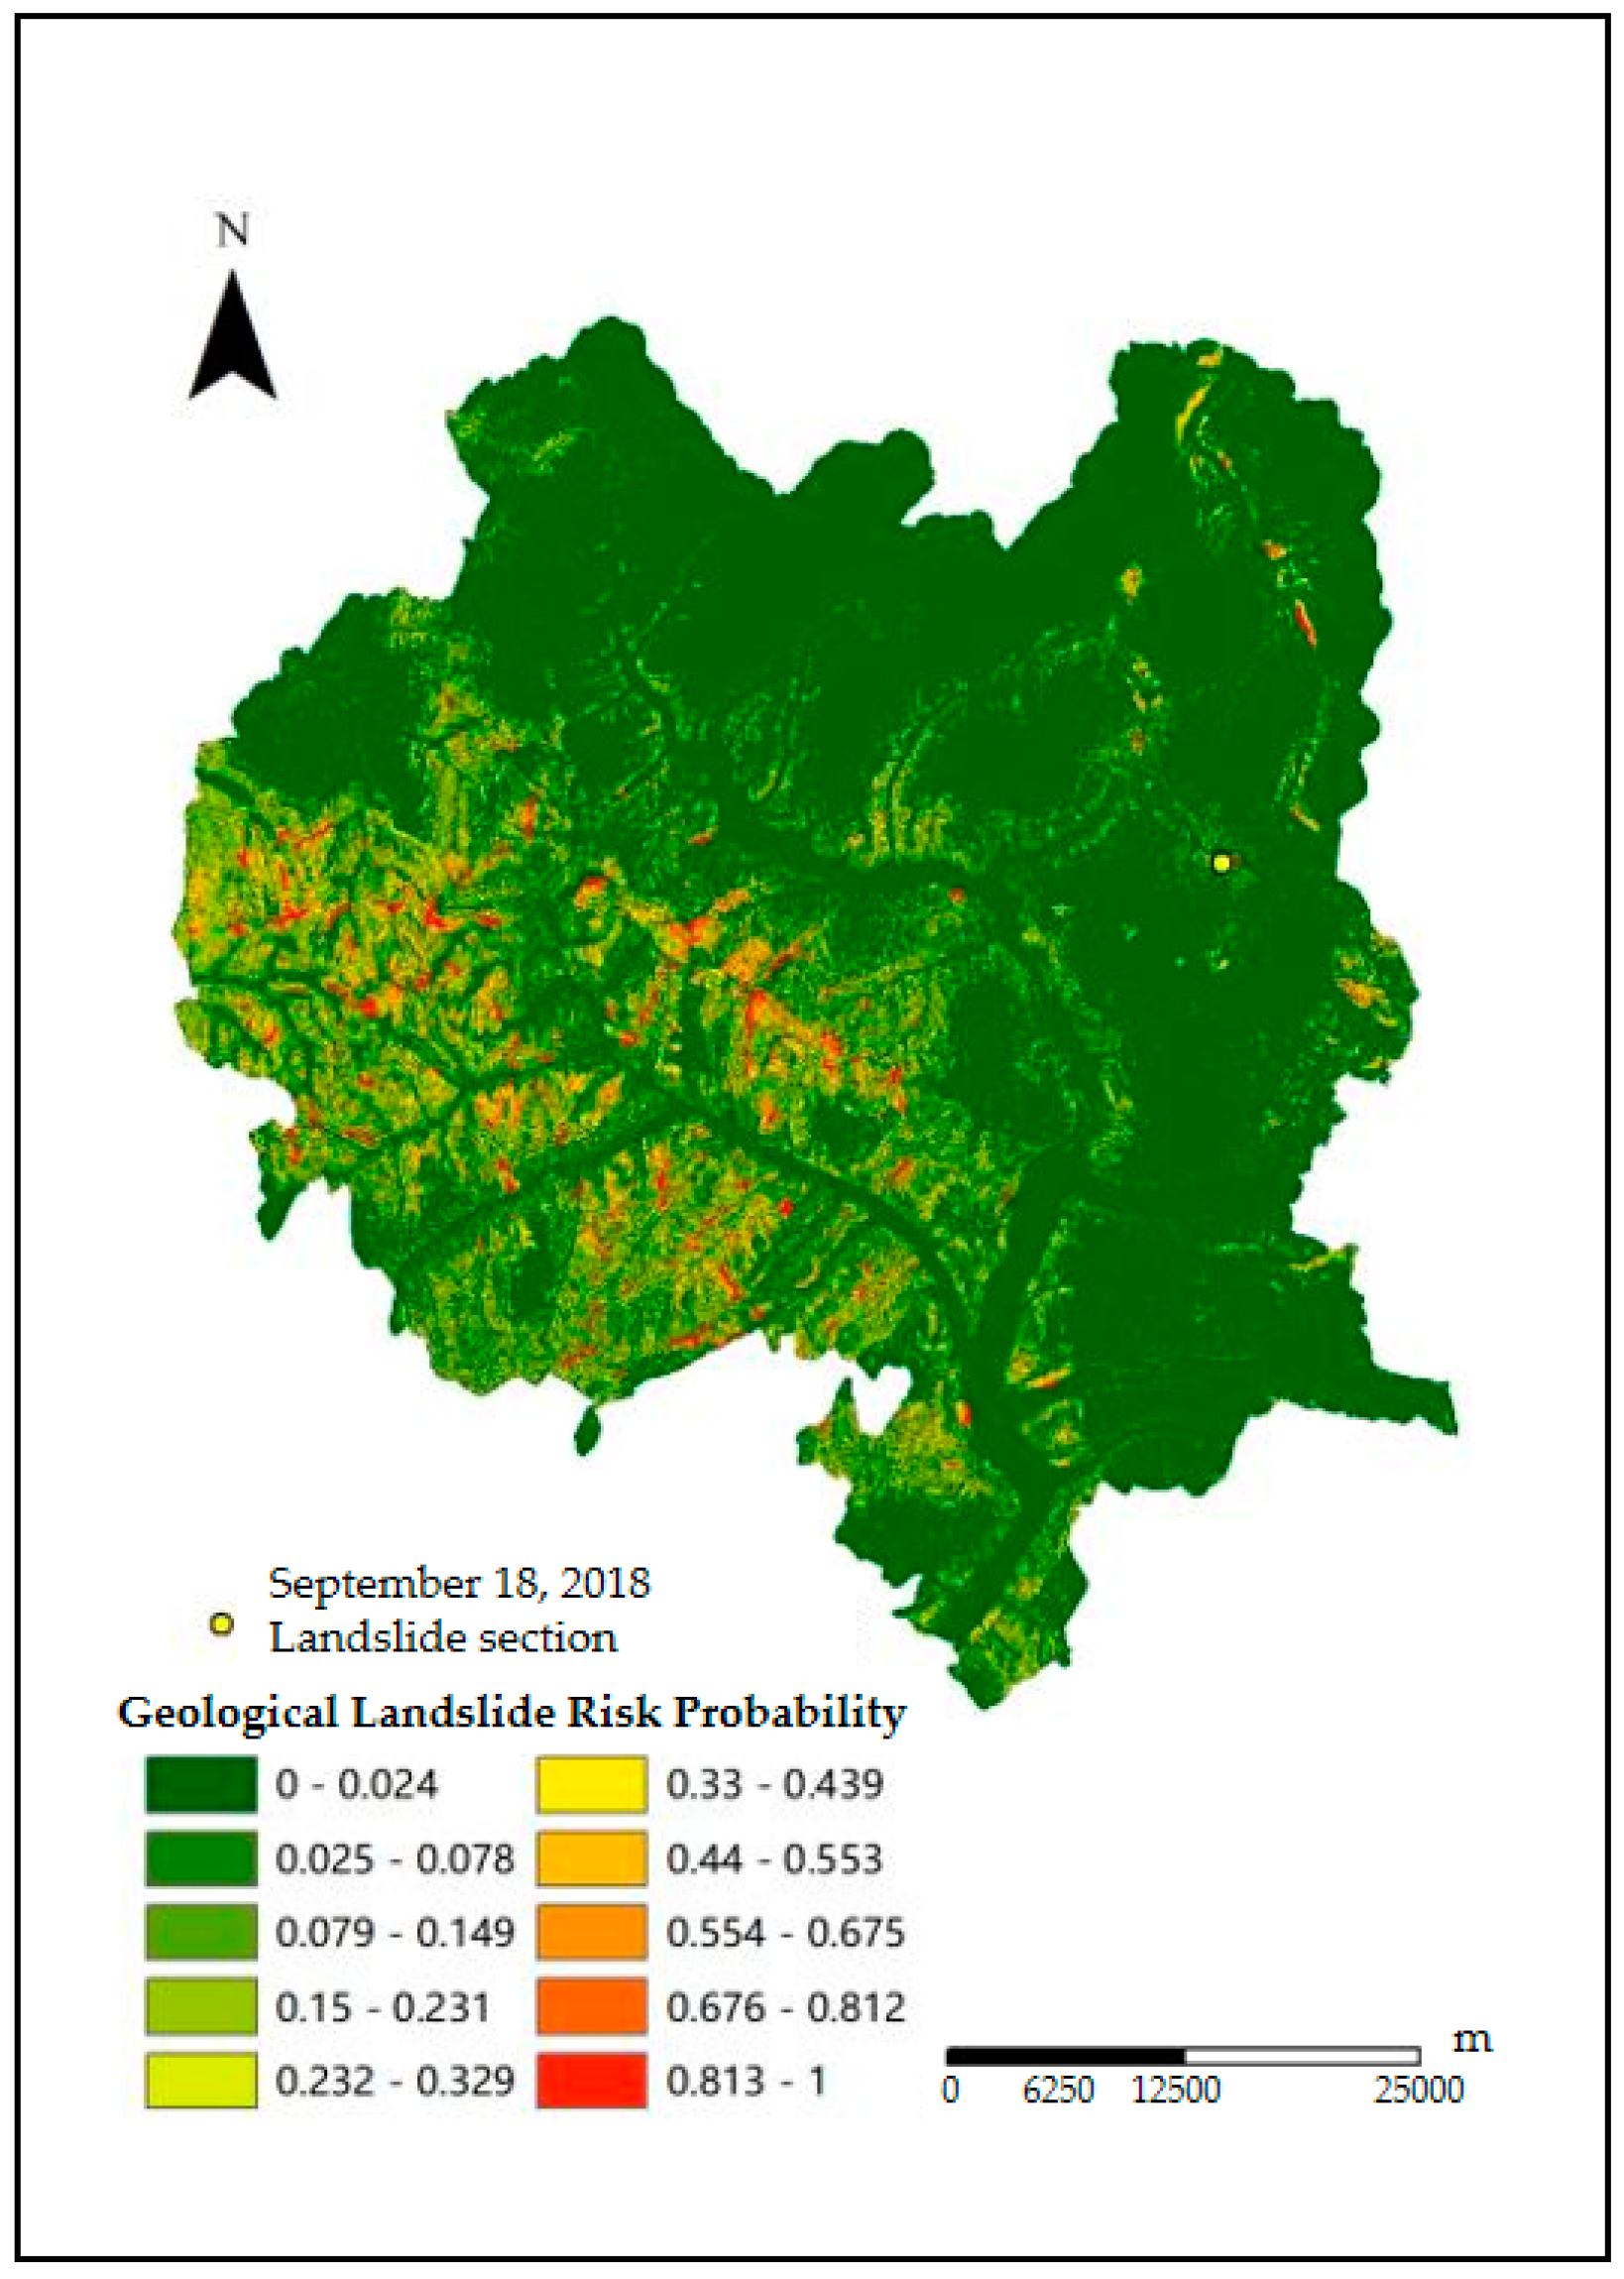
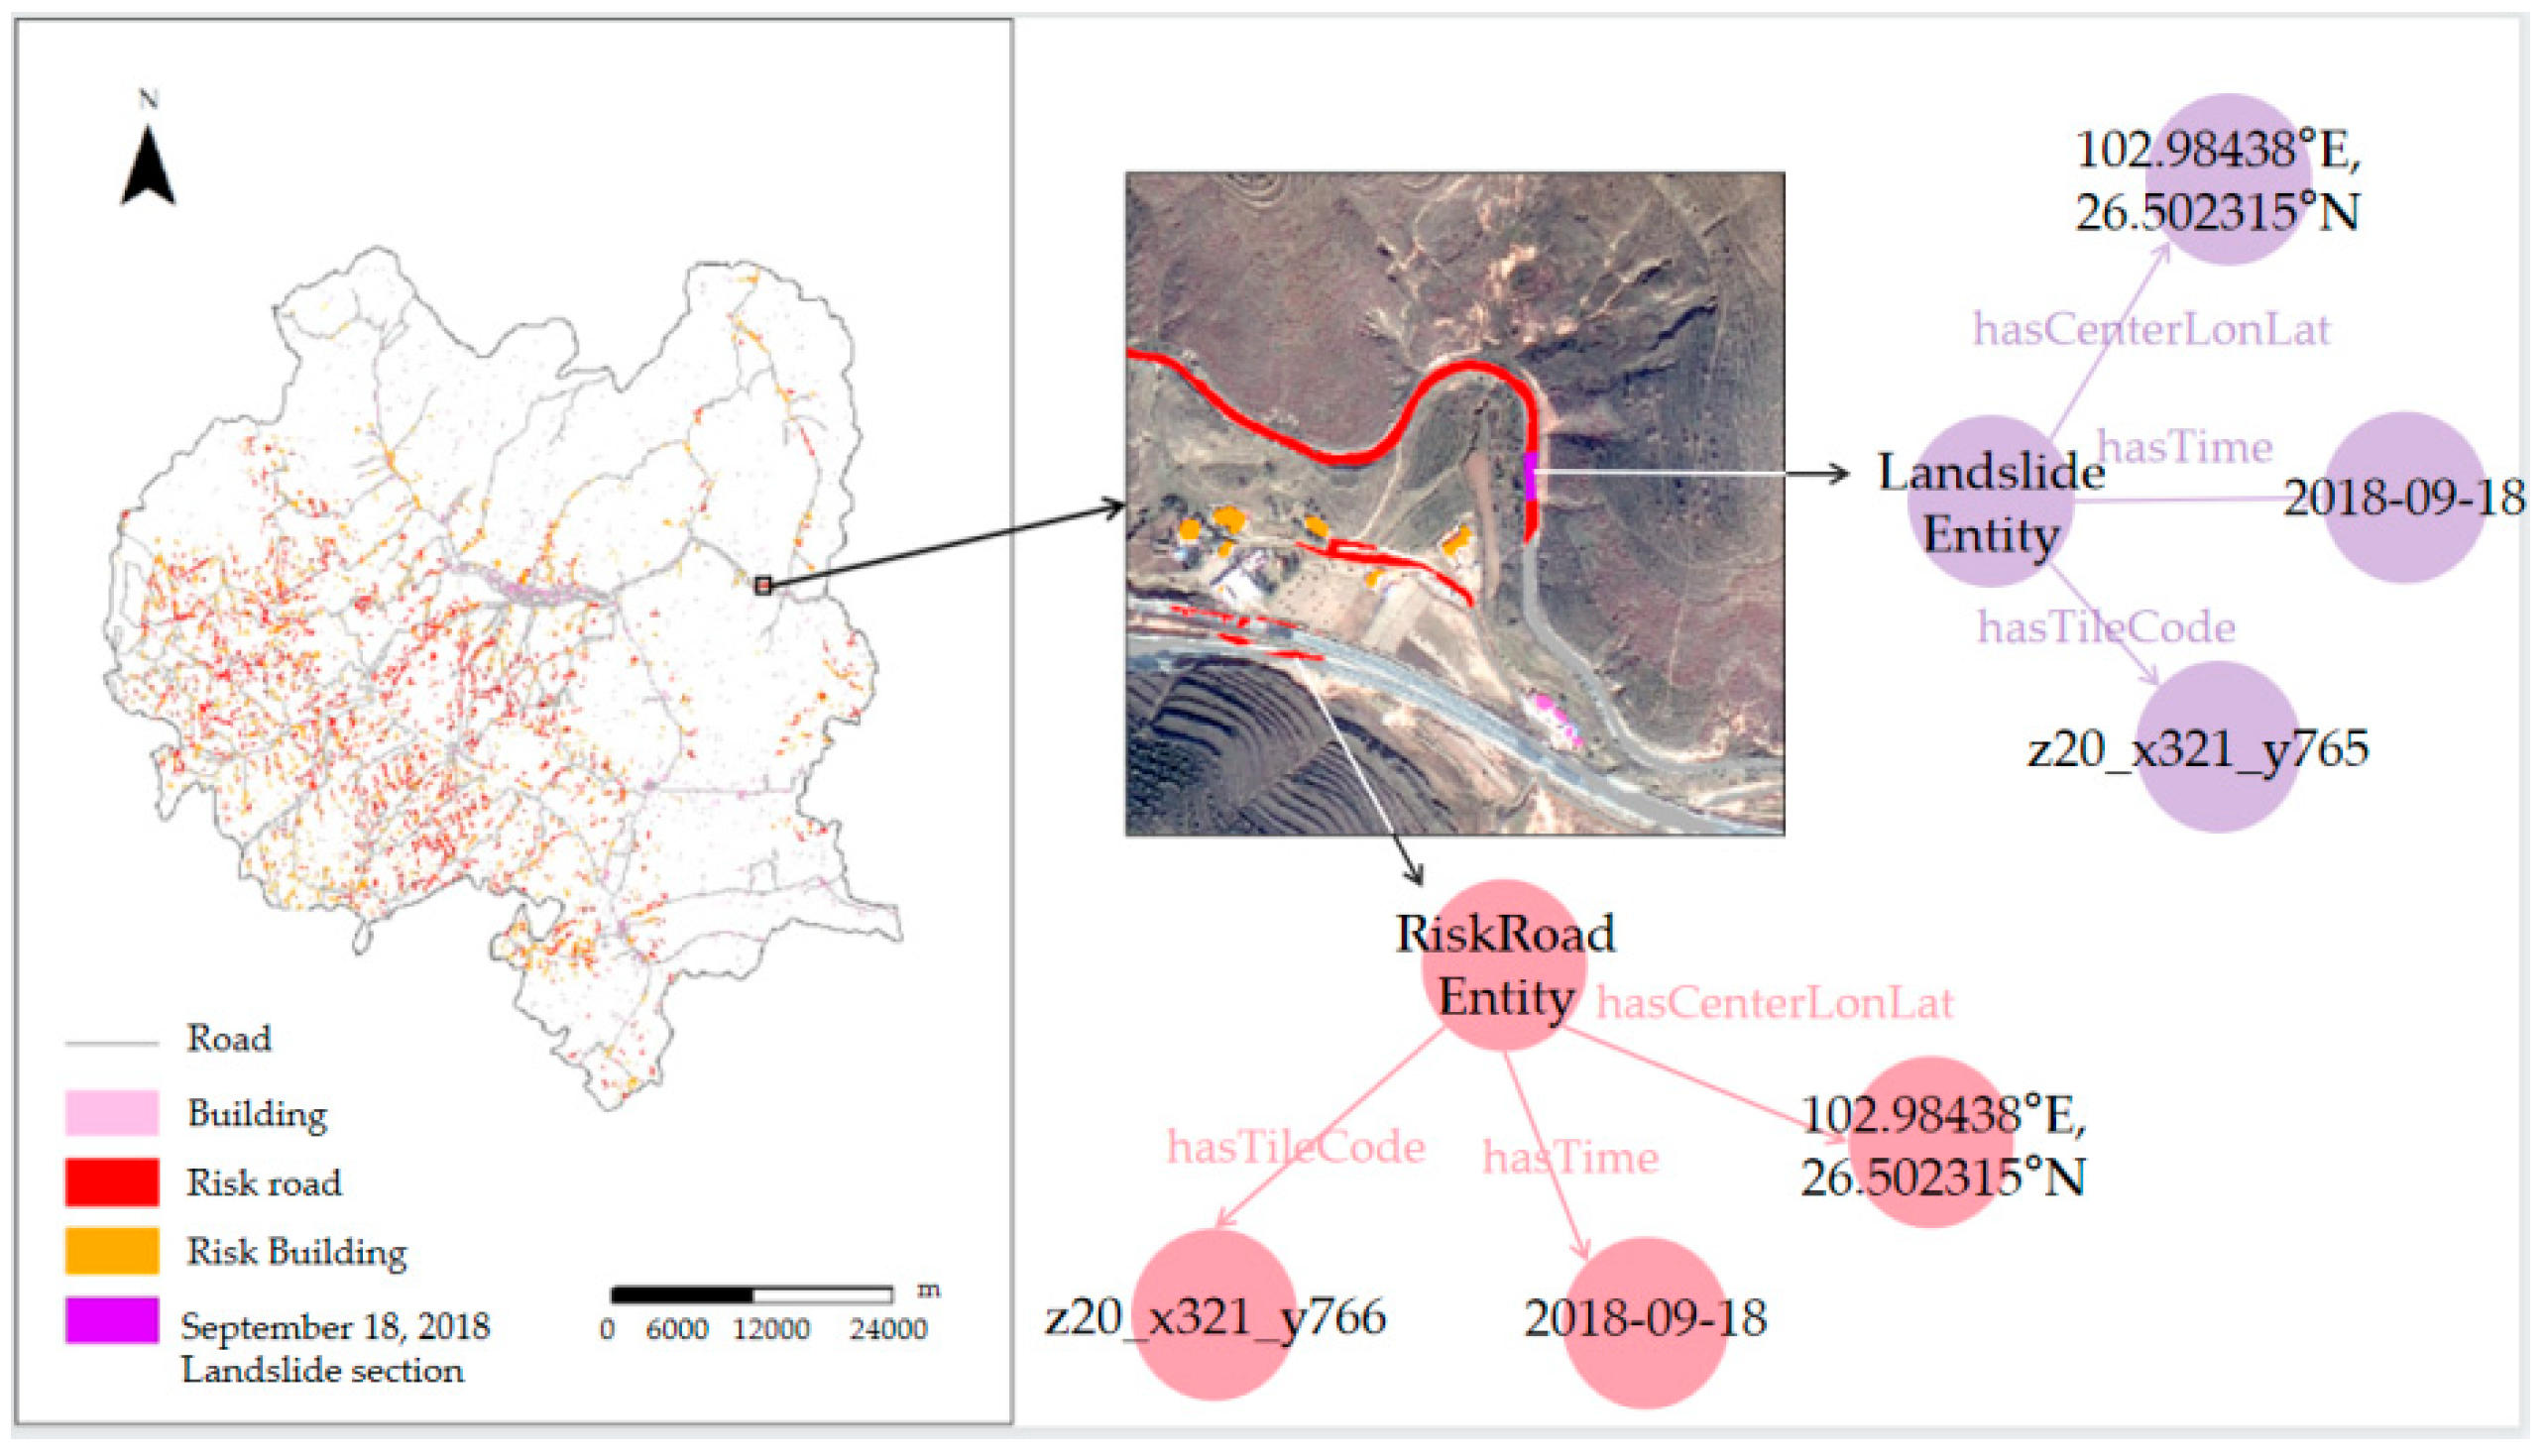
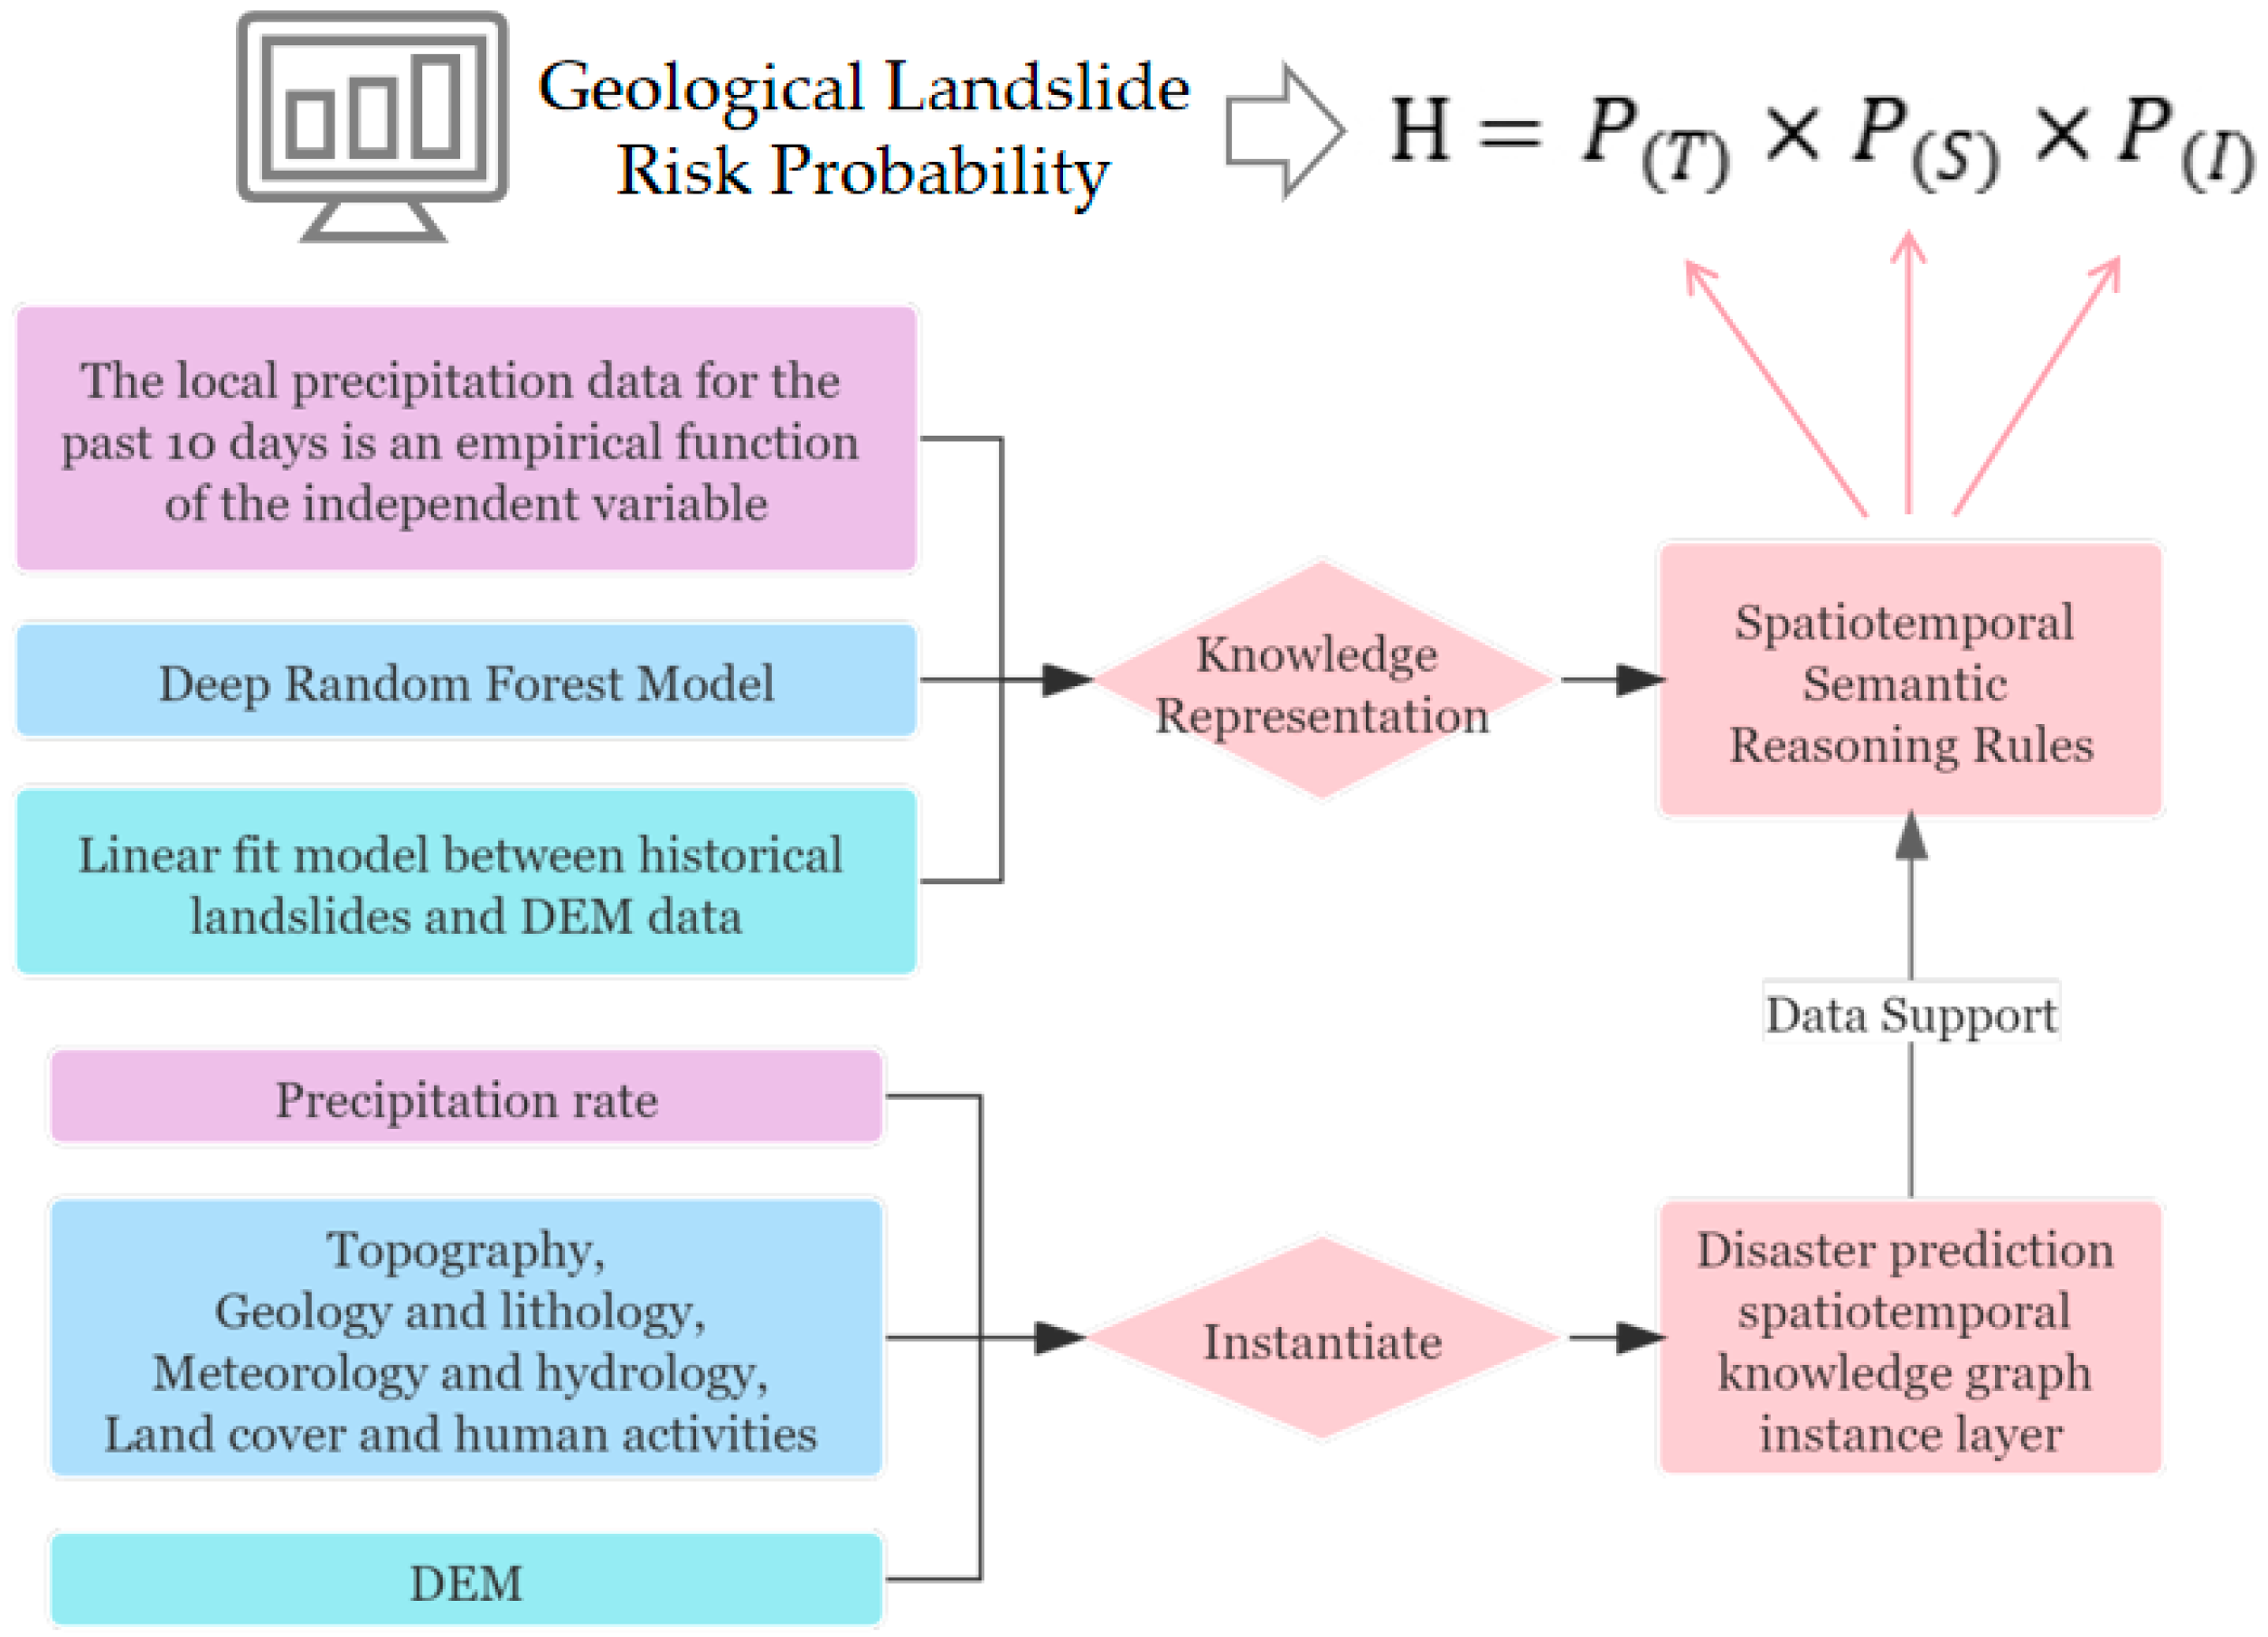
3.2. Case Study: Geological Landslide Risk Prediction
4. Discussion
5. Conclusions
- (1)
- From the perspective of cross-domain knowledge integration, knowledge graph integrates remote sensing knowledge and expert knowledge through semantic technology. It effectively connects multi-source heterogeneous data (GIS, meteorology, terrain, ground sensors, etc.) with expert knowledge in the field of disasters;
- (2)
- The DPKG contains dynamically updated spatio-temporal facts that reflect changes in the real world. Through knowledge graph query, the query performance in disaster emergency scenarios can be improved, and dynamic data updates can automatically drive prediction;
- (3)
- It provides efficient data storage and management methods for practitioners in the fields of remote sensing and geo-information, which helps to improve the efficiency of spatio-temporal data query. It reduces the manual effort by using reasoning of the knowledge graph.
Author Contributions
Funding
Institutional Review Board Statement
Informed Consent Statement
Data Availability Statement
Conflicts of Interest
References
- Chen, D.-Y.; Peng, L.; Li, W.-C.; Wang, Y.-D. Building Extraction and Number Statistics in WUI Areas Based on UNet Structureand Ensemble Learning. Remote Sens. 2021, 13, 1172. [Google Scholar] [CrossRef]
- Lu, F.; Yu, L.; Qiu, P.Y. On geographic knowledge graph. J. Geo-Inf. Sci. 2017, 19, 723–734. [Google Scholar]
- Sun, Y.; Yu, L.; Guo, Z.; Chen, G. Construction and Application of spatio-temporal Knowledge Graph. J. Inf. Eng. Univ. 2020, 21, 464–469. [Google Scholar]
- Zhang, X.Y.; Zhang, C.J.; Wu, M.G.; Lv, C. Spatio-temporal features based geographical knowledge graph construction. Sci. Sin. Inf. 2020, 50, 1019–1032. (In Chinese) [Google Scholar]
- Liu, J.; Liu, H.; Chen, X.; Zhao, Q.; Liu, J.; Kang, L.; Guo, X. Rapid Retrieval of Geospatial Data Considering Semantic Knowledge. Geomat. Inf. Sci. Wuhan Univ. 2020, 1–13. Available online: https://kns.cnki.net/kcms/detail/42.1676.tn.20201209.0957.001.html (accessed on 25 February 2022).
- Jiang, B.; Wan, G.; Xu, J.; Feng, L.I.; Wen, H. Geographic Knowledge Graph Building Extracted from Multi-sourced Heterogeneous Data. Acta Geod. Et Cartogr. Sin. 2018, 47, 1051–1061. [Google Scholar]
- Qiu, L.; Du, Z.; Zhu, Q.; Fan, Y. An integrated flood management system based on linking environmental models and disaster-related data. Environ. Model. Softw. 2017, 91, 111–126. [Google Scholar] [CrossRef]
- Xu, J.; Nyerges, T.L.; Nie, G. Modeling and representation for earthquake emergency response knowledge: Perspective for working with geo-ontology. Int. J. Geogr. Inf. Sci. 2014, 28, 185–205. [Google Scholar] [CrossRef]
- Scheuer, S.; Haase, D.; Meyer, V. Towards a flood risk assessment ontology—Knowledge integration into a multi-criteria risk assessment approach. Comput. Environ. Urban Syst. 2013, 37, 82–94. [Google Scholar] [CrossRef]
- Tao, K.; Zhao, Y.; Zhu, P.; Zhu, Y.; Liu, S.; Zhao, X. Knowledge Graph Construction for Integrated Disaster Reduction. Geomat. Inf. Sci. Wuhan Univ. 2020, 45, 1296–1302. [Google Scholar]
- Yang, W.; Xu, K.; Lian, J.; Ma, C.; Bin, L. Integrated flood vulnerability assessment approach based on TOPSIS and Shannon entropy methods. Ecol. Indic. 2018, 89, 269–280. [Google Scholar] [CrossRef]
- Li, W.; Zhu, J.; Zhang, Y.; Fu, L.; Gong, Y.; Hu, Y.; Cao, Y. An on-demand construction method of disaster scenes for multilevel users. Nat. Hazards 2020, 101, 409–428. [Google Scholar] [CrossRef]
- Xie, Y.; Wang, L.; Dong, C.; Kang, F. Research on the construction method of earthquake disaster prevention knowledge graph. Sci. Surv. Mapp. 2021, 46, 219–226. [Google Scholar]
- Du, Z.; Li, Y.; Zhang, Y.; Tan, Y.; Zhao, W. Knowledge Graph Construction Method on Natural Disaster Emergency. Geomat. Inf. Sci. Wuhan Univ. 2020, 45, 1344–1355. [Google Scholar]
- Sowa, J. Principles of Semantic Networks: Explorations in the Representation of Knowledge; Morgan Kaufmann Publishers, Inc.: San Mateo, CA, USA, 1991. [Google Scholar]
- O’Connor, M.J.; Das, A.K. A method for representing and querying temporal information in owl. In Proceedings of the International Joint Conference on Biomedical Engineering Systems and Technologies, Valencia, Spain, 20–23 January 2010; pp. 97–110. [Google Scholar]
- GeoSPARQL. Available online: http://www.geosparql.org/ (accessed on 25 February 2022).
- Duan, W. Key Technologies of Geographicity Query. Master’s Thesis, Wuhan University, Wuhan, China, 2013. [Google Scholar]
- Chen, R.; Li, X.; Hu, Y. Road Extraction from Remote Sensing Images in Wildland-Urban Interface Areas. Geosci. Remote Sens. Lett. 2020, 19, 3000705. [Google Scholar] [CrossRef]
- Corominas, J.; Copons, R.; Moya, J. Quantitative assessment of the residual risk in a rockfall protected area. Landslides 2005, 2, 343–357. [Google Scholar] [CrossRef]
- SPARQL-Semantic Web Standards. Available online: https://www.w3.org/2001/sw/wiki/SPARQL (accessed on 25 February 2022).
- Shang, H.; Ni, W.K.; Liu, H.S. Development Characteristics and Distribution of Earthquake-induced Loess Landslides in Xiji County of Ningxia Hui Autonomous Region. Bull. Soil Water Conserv. 2012, 32, 28–31. [Google Scholar]
- Musen, M.A. Encyclopedia of Systems Biology; Dubitzky, W., Wolkenhauer, O., Cho, K.-H., Yokota, H., The Protégé Team Protégé Ontology Editor, Eds.; Springer: New York, NY, USA, 2013; pp. 1763–1765. Available online: https://link.springer.com/referenceworkentry/10.1007%2F978-1-4419-9863-7_1104 (accessed on 25 February 2022).


| geof:sfEquals | geof:sfDisjoint | geof:sfIntersects | geof:sfTouches |
| geof:sfCrosses | geof:sfWithin | geof:sfContains | geof:sfOverlaps |
| Experimental Procedure | Prediction Precision | Calculation Time (Calculation Area Is 3130.00 km2) | |
|---|---|---|---|
| ArcGIS | 1. Load and query County data from types of raster datasets. 2. Uniform coordinate system, uniform pixel size. 3. Grid cropping and stitching are performed on each raster data. 4. Use the Raster Calculator tool to do a weighted sum of all factors. 5. Eliminate outliers and get disaster prediction results. | 1. The boundaries of various data are not completely coincident, which will lead to missing or abnormal results of the boundary area analysis, and wrong predictions. 2. Although it is possible to forcibly align the pixel positions by means of translation, it will cause errors by an operation that lacks a realistic basis and changes the spatial distribution of the original data. | 190 min |
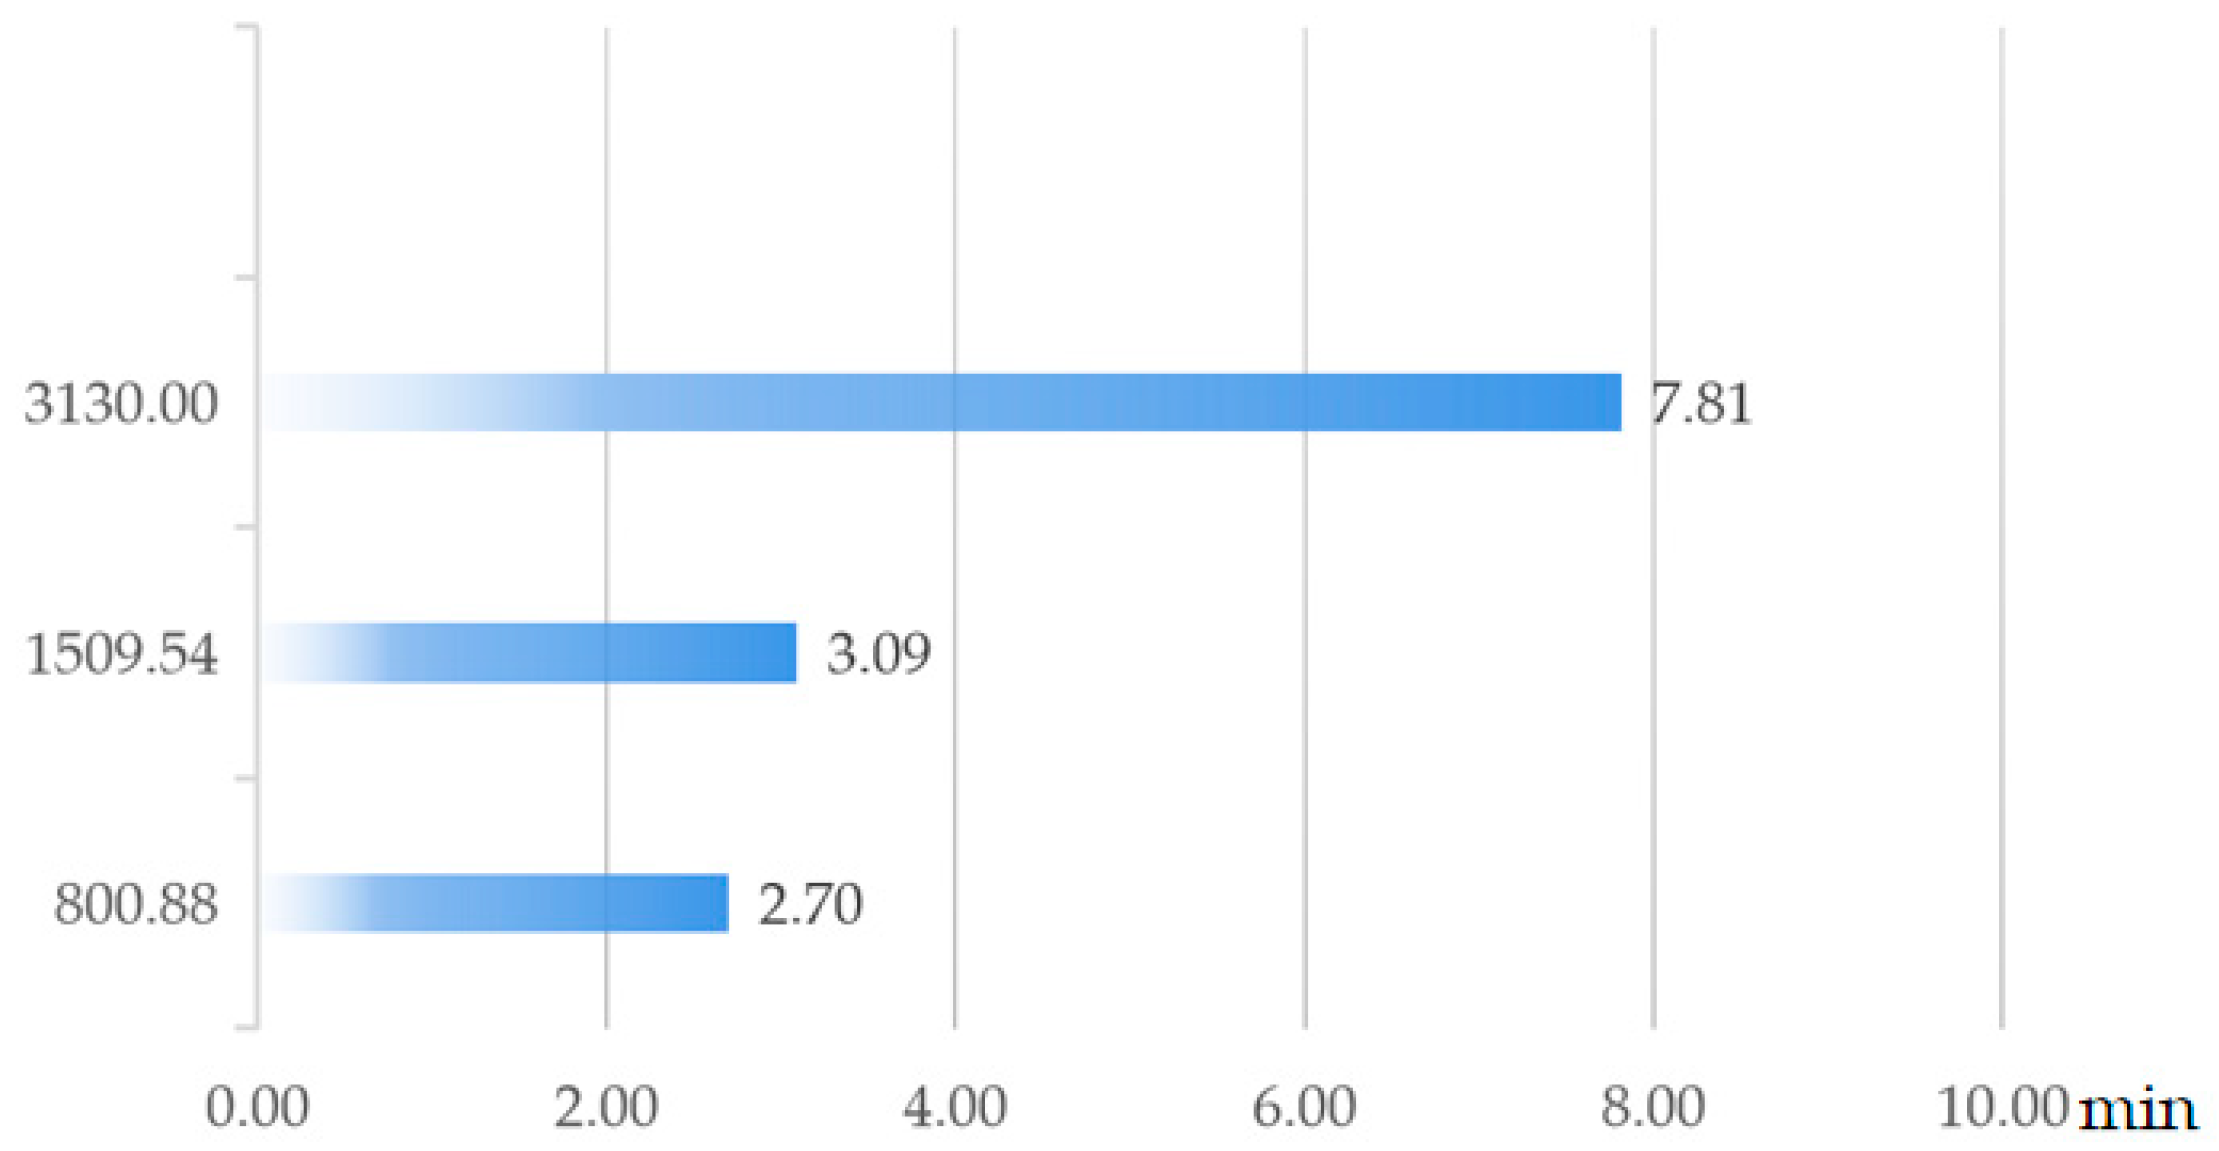
| DPKG | 1. Multi-source spatio-temporal data preprocessing; input into the knowledge graph. 2. Represent the prediction model as an inference rule and input it into the knowledge graph. 3. Calculate and obtain forecast results. | 1. More accurate spatial overlay analysis, when multi-source raster data is not spatially aligned; it will not cause calculation errors. 2. When multi-source data with different resolutions have overlapping areas, select data with higher resolution for calculation. | 7.81 min |
Publisher’s Note: MDPI stays neutral with regard to jurisdictional claims in published maps and institutional affiliations. |
© 2022 by the authors. Licensee MDPI, Basel, Switzerland. This article is an open access article distributed under the terms and conditions of the Creative Commons Attribution (CC BY) license (https://creativecommons.org/licenses/by/4.0/).
Share and Cite
Ge, X.; Yang, Y.; Chen, J.; Li, W.; Huang, Z.; Zhang, W.; Peng, L. Disaster Prediction Knowledge Graph Based on Multi-Source Spatio-Temporal Information. Remote Sens. 2022, 14, 1214. https://doi.org/10.3390/rs14051214
Ge X, Yang Y, Chen J, Li W, Huang Z, Zhang W, Peng L. Disaster Prediction Knowledge Graph Based on Multi-Source Spatio-Temporal Information. Remote Sensing. 2022; 14(5):1214. https://doi.org/10.3390/rs14051214
Chicago/Turabian StyleGe, Xingtong, Yi Yang, Jiahui Chen, Weichao Li, Zhisheng Huang, Wenyue Zhang, and Ling Peng. 2022. "Disaster Prediction Knowledge Graph Based on Multi-Source Spatio-Temporal Information" Remote Sensing 14, no. 5: 1214. https://doi.org/10.3390/rs14051214
APA StyleGe, X., Yang, Y., Chen, J., Li, W., Huang, Z., Zhang, W., & Peng, L. (2022). Disaster Prediction Knowledge Graph Based on Multi-Source Spatio-Temporal Information. Remote Sensing, 14(5), 1214. https://doi.org/10.3390/rs14051214