Article

On Transfer Learning for Building Damage Assessment from Satellite Imagery in Emergency Contexts

by
Isabelle Bouchard
1,
Marie-Ève Rancourt
2,
Daniel Aloise
1,* and
Freddie Kalaitzis
3
1
Polytechnique Montreal, Montreal, QC H3T 1J4, Canada
2
HEC Montreal, Montreal, QC H3T 2A7, Canada
3
Oxford University, Oxford OX1 2JD, UK
*
Author to whom correspondence should be addressed.
Remote Sens. 2022, 14(11), 2532; https://doi.org/10.3390/rs14112532
Submission received: 6 April 2022 / Revised: 20 May 2022 / Accepted: 20 May 2022 / Published: 25 May 2022

Abstract

:
When a natural disaster occurs, humanitarian organizations need to be prompt, effective, and efficient to support people whose security is threatened. Satellite imagery offers rich and reliable information to support expert decision-making, yet its annotation remains labour-intensive and tedious. In this work, we evaluate the applicability of convolutional neural networks (CNN) in supporting building damage assessment in an emergency context. Despite data scarcity, we develop a deep learning workflow to support humanitarians in time-constrained emergency situations. To expedite decision-making and take advantage of the inevitable delay to receive post-disaster satellite images, we decouple building localization and damage classification tasks into two isolated models. Our contribution is to show the complexity of the damage classification task and use established transfer learning techniques to fine-tune the model learning and estimate the minimal number of annotated samples required for the model to be functional in operational situations.

Graphical Abstract

1. Introduction

For decades, humanitarian agencies have been developing robust processes to respond effectively when natural disasters occur. As soon as the event happens, processes are triggered, and resources are deployed to assist and relieve the affected population. Nevertheless, from a hurricane in the Caribbean to a heavy flood in Africa, every catastrophe is different, thus requiring organizations to adapt within the shortest delay to support the affected population on the field. Hence, efficient yet flexible operations are essential to the success of humanitarian organizations.
Humanitarian agencies can leverage machine learning to automate traditionally labour-intensive tasks and speed up their crisis relief response. However, to assist decision-making in an emergency context, humans and machine learning models can be no different; they both need to adjust quickly to the new disaster. Climate conditions, construction types, and types of damage caused by the event may differ from those encountered in the past. Nonetheless, the response must be sharp and attuned to the current situation. Hence, a model must learn from past disaster events to understand what damaged buildings resemble, but it should first and foremost adapt to the environment revealed by the new disaster.
Damage assessment is the preliminary evaluation of damage in the event of a natural disaster, intended to inform decision-makers on the impact of the incident [1]. This work focuses on the building damage assessment. Damaged buildings are strong indicators of the humanitarian consequences of the hazard: they mark where people need immediate assistance. In this work, we address building damage assessment using machine learning techniques and remote sensing imagery. We train a neural network to automatically locate buildings from satellite images and assess any damages.
Given the emergency context, a model trained on images of past disaster events should be able to generalize to images from the current one, but the complexity lies in the data distribution shift between these past disaster events and the current disaster. A distribution describes observation samples in a given space; here, it is influenced by many factors such as the location, the nature, and the strength of the natural hazards.
Neural networks are known to perform well when the training and testing samples are drawn from the same distributions; however, they fail to generalize under important distribution shifts [2]. The implementation of machine learning solutions in real-world humanitarian applications is extremely challenging because of the domain gaps in between different disasters. This gap is caused by multiple factors such as the disaster’s location, the type of damages, the season and climate, etc. In fact, we show that a model trained with supervision on past disaster event images is not sufficient to guarantee good performance on a new disaster event, given the problem’s high variability. Moreover, given the urgency in which the model should operate, we limit the amount of labels produced for the new disaster with human-annotation. We thus suggest an approach where the model first learns generic features from many past disaster events to assimilate current disaster-specific features. This technique is known as transfer learning.
In this work, we propose a methodology based on a transfer learning setup that tries to replicate the emergency context. To do so, samples from the current disaster event must be annotated manually in order to fine-tune the model with supervision. However, data annotation is time-consuming and resource-costly, so it is crucial to limit the number of required annotated samples from the event’s aftermath. Here, we aim to estimate the minimal required number of annotated samples to fine-tune a model to infer the new disaster damages. Developed in a partnership with the United Nations World Food Program (WFP), this work broadly intends to reduce the turnaround time to respond after a natural disaster. This collaboration allowed us to ensure the relevance of our approach as well as its applicability in practice.
This paper directly contributes to the use of deep learning techniques to support humanitarian activities. We have developed an end-to-end damage assessment workflow based on deep learning specifically designed for the natural disaster response. As opposed to some of the work carried out in the field where the model’s performance does not necessarily reflect real-world applications, our work takes into account both the time and data limitations of the emergency context. State-of-the-art models in building damage assessment using deep learning use a definition of training and testing set where the natural disasters overlap. However, in this work, we argue that this setting is not consistent with the emergency context because a model cannot be trained after an event on satellite imagery of the current outcomes in reasonable delays. In contrast, we run extensive experiments across multiple disaster events and with no overlap in training and testing. The resulting performance measured is one that could be expected if the models were to be run as is after a natural disaster. As such, our method highlights the complexity of the task in an emergency scope and exposes the diversity of disaster damage outcomes.
Our work stands out in the literature by its approach aligned with the humanitarian application. While some work is more focused on developing a state-of-the-art model architecture, we develop an experimental setting consistent with the emergency context in which humanitarian organizations operate.
Our paper is organized as follows. First, we ground our work by describing the humanitarian and emergency context (Section 1.1) and present related works (Section 1.3). In the sequel, we present the dataset (Section 2), our methodology (Section 2.3), and the experimental setup (Section 2.7). Then, we discuss our computational experiments (Section 3) and propose a new incident workflow based on our results. Finally, we provide concluding remarks and open the discussion for future works (Section 5).

1.1. The Humanitarian Context

In this section, our goal is for deep learning experts to better understand the emergency context in which developed models operate.
Emergency assistance and relief is the immediate and direct response to the extreme and unexpected events leaving the population in scarcity. In humanitarian organizations’ responses to natural disasters, time is extremely sensitive. Each incident requires unique considerations, yet decision-makers must assess the situation quickly in order to deploy resources in the most effective way.
This project is carried out in collaboration with the emergency relief division of WFP, more specifically, the geospatial information system (GIS) unit. This team is responsible for integrating airborne imagery across the organization to make its processes more efficient. Such imagery includes satellite and unmanned aerial vehicle (UAV) images.

On the Use of Satellite Images

The humanitarian emergency response is complex, and multiple tasks can benefit from using remote sensing images. It allows humanitarian organizations to rapidly retrieve critical information from the ground without the need for human resources on the field. Indeed, involving field workers in life-threatening situations is precarious. Moreover, such ground effort requires a high degree of coordination and relies upon the availability of mobile services. Oftentimes, it leads to partial or incomplete information.
Compared to remote sensing, drone images have higher resolution and can typically be obtained more quickly. Furthermore, drones usually fly below the clouds, as opposed to satellites being above them, which allows them to capture images in almost any environmental condition, such as cloudy, foggy, or smoky air. On the other hand, remote sensing imagery offers more consistency (projection angle, ground resolution) and much higher coverage of the devastated area. Ultimately, those two approaches operate at very different scales: drones are preferred for quick micro assessment, whereas satellites are better suited for large-scale assessment.

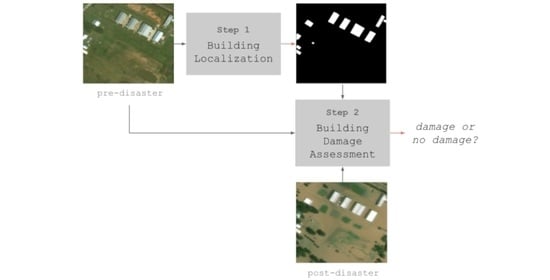
1.2. Damage Assessment

In this work, we study the damage assessment task from satellite imagery. As mentioned before, damage assessment may be based on ground observations. However, satellite images offer a safe, scalable, and predictable alternative source of information.
Damage assessment should be conducted as rapidly as possible, right after the rise of a natural disaster event. However, the process can only really begin after the reception of the post-disaster satellite images. This critical delay typically varies from hours to many days when the meteorological conditions do not allow image captures. When conditions allow, post-disaster satellite images are quickly shared through the strategic partnerships between Earth observation providers and humanitarian organizations. The delay to retrieve pre-disaster images is typically shorter; the data already exist, they only need to be retrieved from archives and shared. Upon reception of satellite images, the goal is to produce an initial damage assessment report as rapidly as possible. This process includes two main steps: mapping and data analytics (Figure 1).
Mapping is the backbone task in a damage assessment process. It consists of locating buildings from satellite imagery and tagging those which are damaged according to a predefined scale. Large devastated areas may be processed to find impaired structures. Maps can then be used as-is to seek precise information by field workers or further analyzed to inform decision-making. They include critical information, such as the density of damaged buildings in a given area.
The data analytics step combines the raw maps of damaged buildings along with other sources of demographic information to inform decision-making. It takes into account the disaster event’s specificity to organize an appropriate and dedicated response. For instance, demographic data may indicate if the disaster affected a vulnerable population, in which case the need for food assistance is even more important.

1.3. Related Works

Satellite images contain highly valuable information about our planet. They can inform and support decision-making about global issues, from climate changes [3] to water sustainability [4], food security [5], and urban planning [6]. Many applications, such as fire detection [7], land use monitoring [8], and disaster assistance [9], utilize remote sensing imagery.
The task of damage assessment can be decoupled into two separate tasks: building detection and damage classification. In the field of building detection, there have been a lot of approaches presented recently. In the literature, the task is typically framed as a semantic segmentation task.
On one side, refs. [10,11,12] all present variations of fully convolutional networks to detect buildings from aerial images. The differences mostly reside in the post-processing stages, to improve the detection performance. More recently, refs. [13,14] proposed architecture to leverage multi-scale features. In the same direction, refs. [15,16] presented encoder–decoder architectures, an approach that has proven to predict edges more precisely. Finally, ref. [17] not only used a multi-scale encoder–decoder architecture, but they introduced a morphological filter to better define building edges.
To help the model recognize buildings in a different context, ref. [18] proposed a multi-task setup to extract buildings and classify the scene (rural, industrial, high-rise urban, etc.) in parallel. Finally, ref. [19] proposed a methodology to update building footprint that rapidly becomes outdated due to constantly evolving cities. They proposed to use pre-change imagery and annotations and to update only 20 percent of the annotation to obtain a complete updated building footprint.
Data have limited the development of machine learning models for damage assessment since few suitable public datasets exist. The first works were conducted in the form of case studies, i.e., works that targeted one or few disaster events to develop and evaluate machine learning approaches.
Cooner et al. [20] took the 2010 Haiti earthquake case to apply machine learning techniques to the detection of damaged buildings in urban areas. Fujita et al. [21] took it a step further by applying CNN to solve damage assessment using pre- and post-disaster images from the 2011 Japan earthquake. They released the ABCD dataset as part of their work. Sublime and Kalinicheva [22] studied the same disaster by applying change detection techniques. Doshi et al. [23] leveraged two publicly available datasets for building and road detection: SpaceNet [24] and DeepGlobe [25], to develop a building damage detection model. Their approach relies on the relative changes of pre- and post-disaster building segmentation maps.
Since then, Gupta et al. [26] have released the xBD dataset, a vast collection of satellite images annotated for building damage assessment. It consists of very-high-resolution (VHR) pre- and post-disaster images from 18 disaster events worldwide, containing a diversity of climate, building, and disaster types. The dataset is annotated with building polygons classified according to a joint damage scale with four ordinal classes: No damage, Minor damage, Major damage, and Destroyed. A competition was organized along with the dataset release. The challenge’s first position went to [27], who proposed a two-step modelling approach composed of a building detector and a damage classifier.
The release of the xBD dataset sparked further research in the field. Shao et al. [28] investigated the use of pre- and post-disaster images as well as different loss functions to approach the task. Gupta and Shah [29] and Weber and Kané [30] proposed similar end-to-end per-pixel classification models with multi-temporal fusion. Hao et al. [31] introduced a self-attention mechanism to help the model capture long-range information. Shen et al. [32] studied the sophisticated fusion of pre- and post-disaster feature maps, presenting a cross-directional fusion strategy. Finally, Boin et al. [33] proposed to upsample the challenging classes to mitigate the class imbalance problem of the xBD dataset.
More recently, Khvedchenya and Gabruseva [34] proposed fully convolutional Siamese networks to solve the problem. They performed an ablation study over different architecture hyperparameters and loss functions, but did not compare their performance with the state-of-the-art. Xiao et al. [35] and Shen et al. [36] also presented innovative model architectures to solve the problem. The former used a dynamic cross-fusion mechanism (DCFNet) and the latter a multiscale convolutional network with cross-directional attention (BDANet). To our knowledge, DamFormer is the state-of-the-art in terms of model performance on the xBD original test set and metric. It consists of a transformer-based CNN architecture. The model learns non-local features from pre- and post-disaster images using a transformer-encoder and fuses the information for the downstream dual-tasks.
All of these methods share the same training and testing sets, and hence they can be easily compared. However, we argue that this dataset split does not suit the emergency context well since the train and test distribution is the same. Therefore, it does not show the ability of a model to generalize to an unseen disaster event. In this work, our main objective is to investigate a model’s ability to be trained on different disaster events to be ready when a new disaster unfolds.
Some studies focus on developing a specialized model. For example, ref. [37] studied the use of well-established convolutional neural networks and transfer learning techniques to predict building damages in the specific case of hurricane events.
The model’s ability to transfer to a future disaster was first studied by Xu et al. [38]. That work included a data generation pipeline to quantify the model’s ability to generalize to a new disaster event. The study was conducted before the release of xBD, being limited to three disaster events.
Closely aligned with our work, Valentijn et al. [39] evaluated the applicability of CNNs under operational emergency conditions. Their in-depth study of per-disaster performance led them to propose a specialized model for each disaster type. Benson and Ecker [40] highlighted the unrealistic test setting in which damage assessment models were developed and proposed a new formulation based on out-of-domain distribution. They experimented with two domain adaptation techniques, multi-domain AdaBN [41] and stochastic weight averaging [42].
The use of CNNs in the emergency context is also thoroughly discussed by Nex et al. [43], who evaluated the transferability and computational time needed to assess damages in an emergency context. This extensive study is conducted on heterogeneous sources of data, including both drone and satellite images.
To our knowledge, Lee et al. [44] is the first successful damage assessment application of a semi-supervised technique to leverage unlabelled data. They compared fully-supervised approaches with MixMatch [45] and FixMatch [46] semi-supervised techniques. Their study, limited to three disaster events, showed promising results. Xia et al. [47] applied emerging self-positive unlabelled learning (known as PU-learning) techniques. The approach is proven efficient when tested on the ABDC dataset and two selected disasters from the xBD dataset (Palu tsunami and Hurricane Michael).
Ismail and Awad [48] proposed a novel approach based on graph convolutional network to incorporate knowledge on similar neighbour buildings for the model to make a prediction. They have introduced this technique to help cross-disaster generalization in time-limited settings after a natural disaster.
The domain gap and the difficulty to gather annotation was acknowledged by Kuzin et al. [49]. The study proposed the use of crowdsourced point labels instead of polygons to accelerate the annotation time. They also presented a methodology to aggregate inconsistent labels accross crowdworkers.
Parallelly, Anand and Miura [50] proposed a model to predict the hazards’ damages before the event to allow humanitarian organizations to prepare their resources and be ready to respond. They used building footprints and predicted the damage locations and severity for different hazard scenarios. Presa-Reyes and Chen [51] suggested that building footprint information is a moving source of information. To alleviate the impact of noise, they introduced a noise reduction mechanism to embed the premise into training.
Finally, in this work, we focus on automatic damage assessment from satellite images, and more specifically, on very-high-resolution imagery. Some work has rather investigated the use of drone images [52,53], multi-sensors satellite images [54], social media images [55], and a mix of multiple data sources [56]. Recently, Weber et al. [57] shared a new large-scale and open-source dataset of natural images from natural disasters and other incidents. Detecting damages from natural images finds many applications using crowd-sourced information from social media.
It is clear that the xBD dataset of [26] boosted research in the field of building damage assessment after a natural disaster, and more specifically using deep learning techniques. The dataset is undoubtedly important; before their creation, the data were a major constraint to any research and development. It was introduced along with a traditional machine learning competition to find the best architecture. For the competition, the dataset that contains images from 18 different disaster events was randomly split into training and testing. These training and test sets remain the leading procedure to compare models and define the state-of-the-art.
However, we argue that this setting does not measure the capacity of a given model to replace human and effectively assess damage in an emergency context. In fact, the training and the testing sets share the same distribution. However, this layout is not possible after a natural disaster, where the distribution of images from the event that just happened is unknown, and therefore not guaranteed to fit into it. This domain gap can eventually lead to generalizability issues that should be quantified.
In this work, we propose to modify the dataset split. All images, except for those associated with a single disaster event, are used for training. Testing is performed on those set-apart disaster event images. This procedure ensures that the test set remains unknown during training such that the resulting score measures the effective score on the new distribution. We also expend this procedure to all 18 disaster events: one by one, each disaster event is set apart for training. To our knowledge, there is no other piece of work that runs such extensive study to quantify the model’s ability to generalize to a new disaster event. Thus, our study aims to better align research progress in machine learning with humanitarian applications in the hope of further narrowing the gap between research and this practice.

2. Materials and Methods
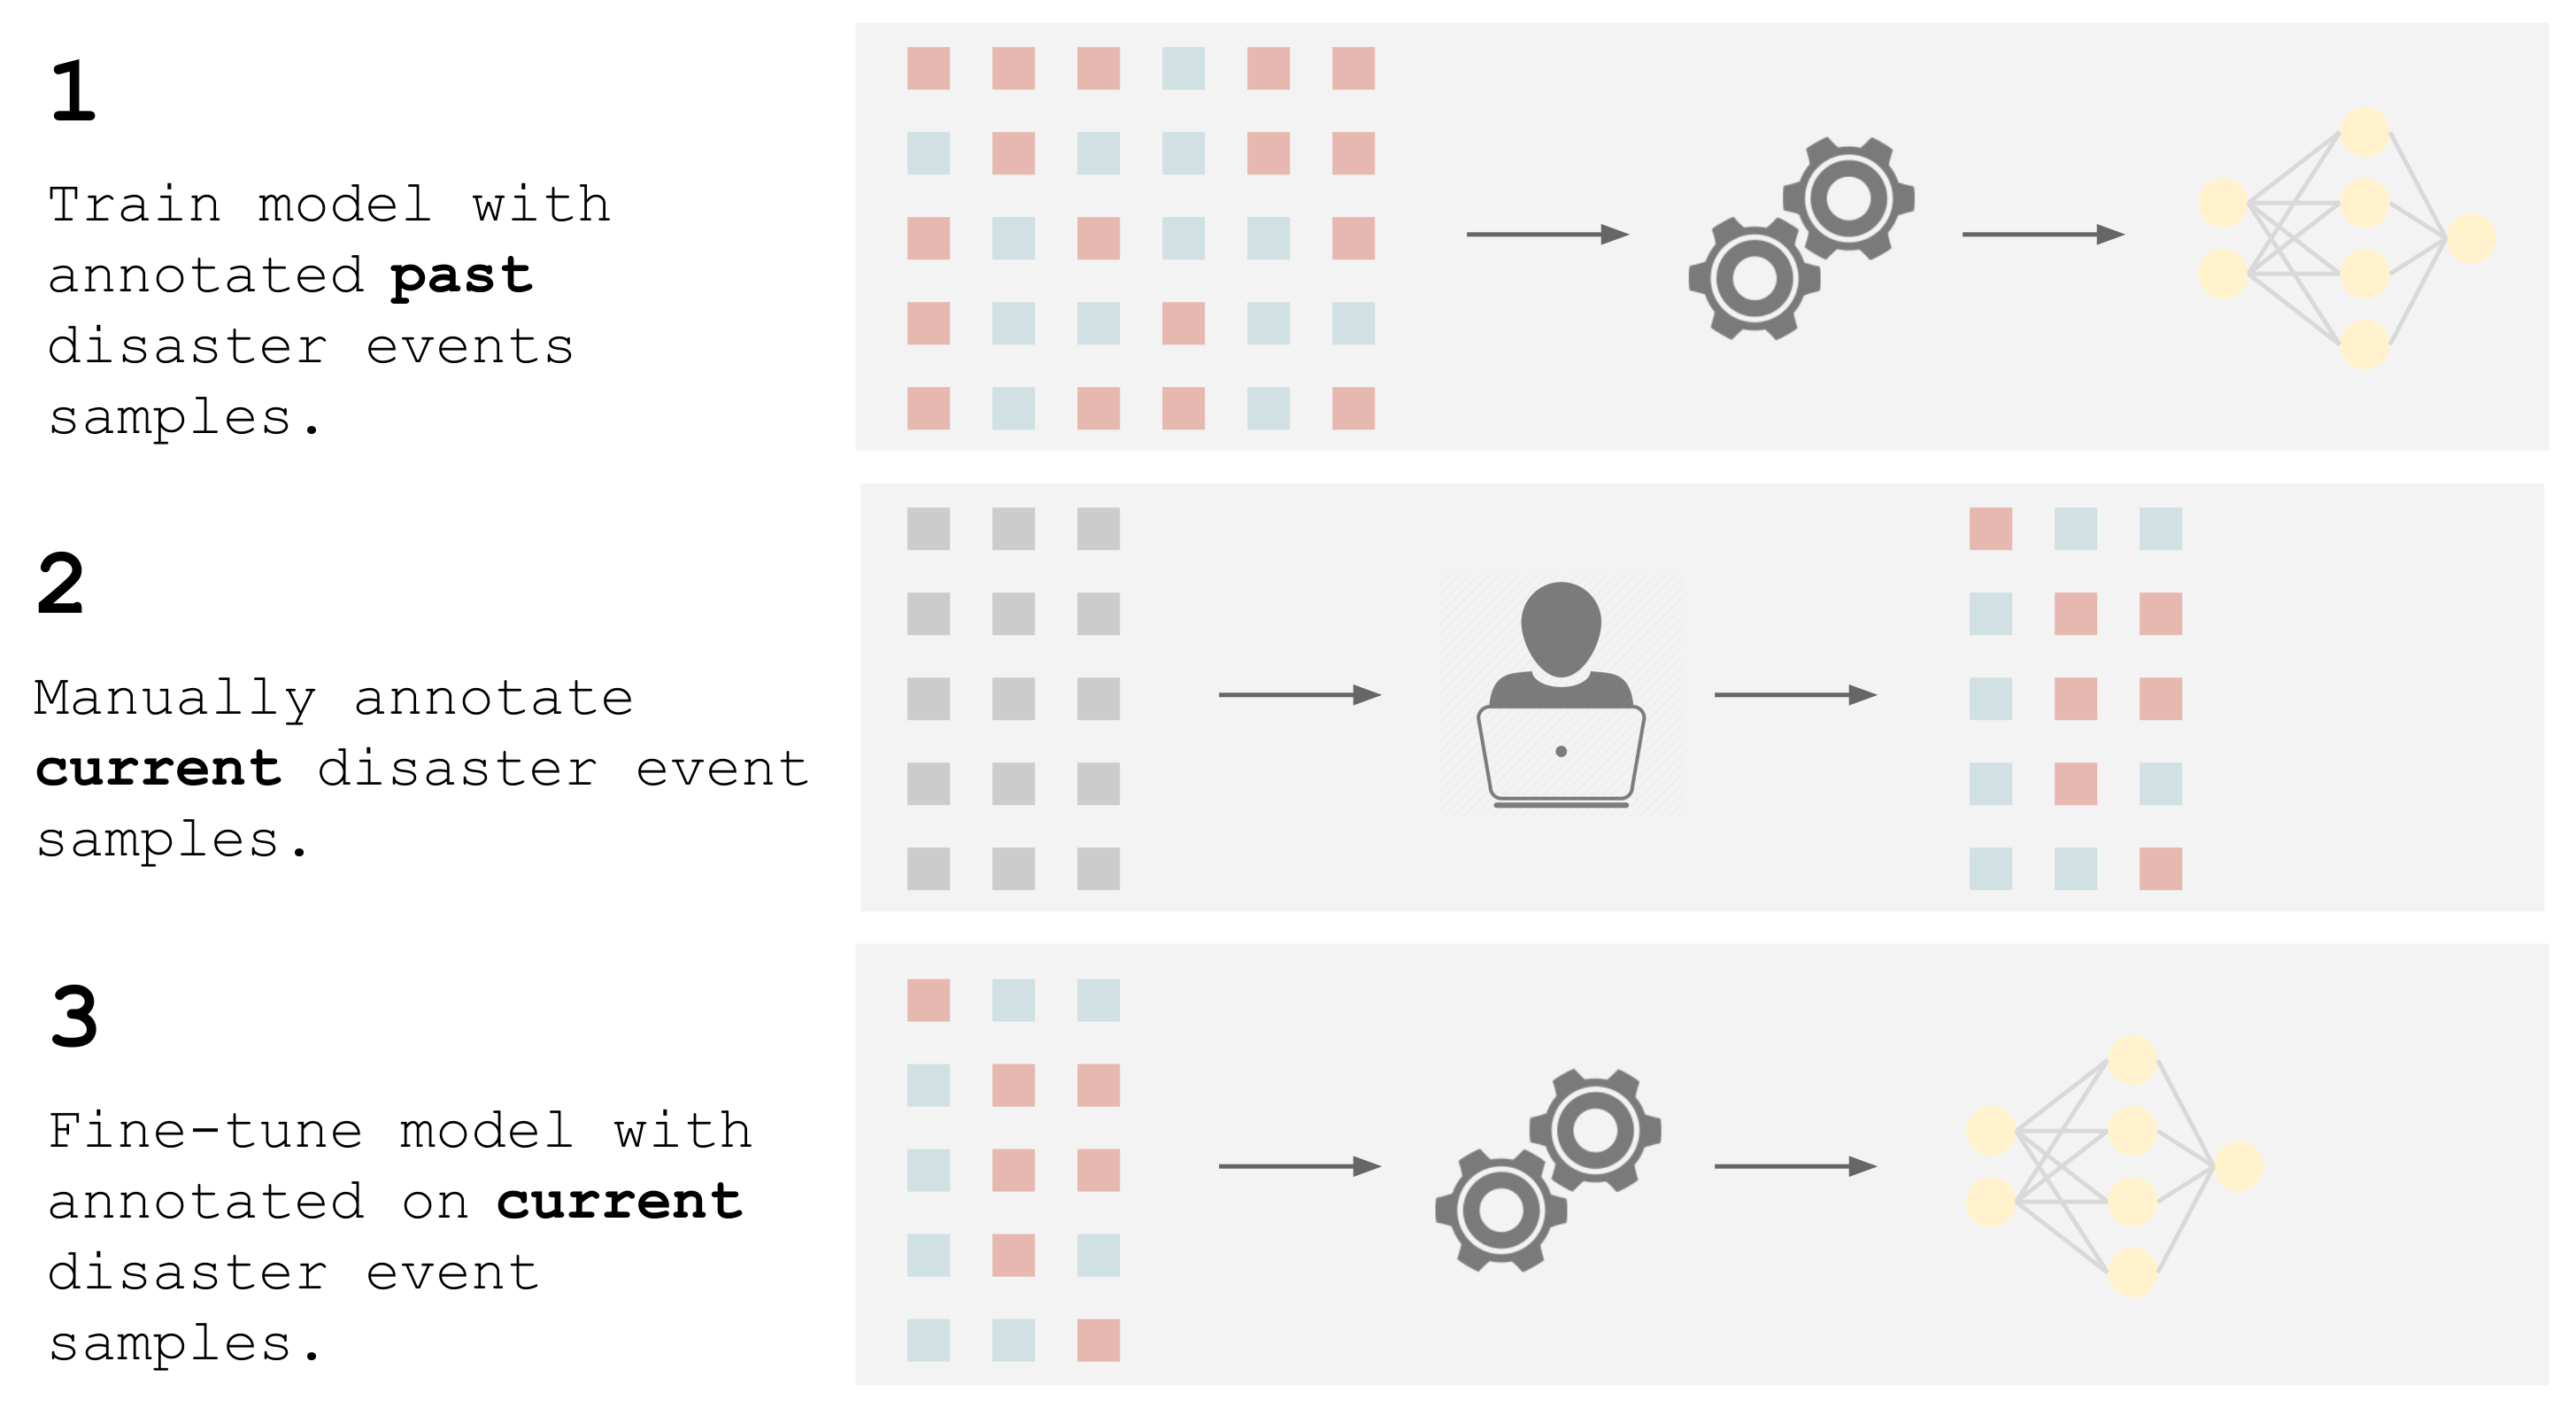
To train neural networks, large-scale and preferably annotated datasets are required. While everyday remote sensors are capturing a visual snapshot of our planet from above, the annotation of those images remains rare.
This work relies on the xBD dataset [26], a collection of RGB satellite images annotated for building damage assessment. Images are sourced from the Maxar/DigitalGlobe Open Data Program. To-date, xBD is the largest dataset for building damage assessment. It consists of very-high-resolution (VHR) pre- and post-disaster image pairs from 18 different disaster events worldwide. Images come along with building location and damage level tags. Overall, the dataset contains more than 800 k annotated buildings.
While tons of satellite data are made available every day with various resolutions and temporal samplings, annotation is limited. Multi-spectral images (e.g., Sentinel-2, Spot, Worldview, etc.) could potentially provide useful information for the model to learn. However, in this work, we only utilize the xBD dataset images sourced from Maxar/DigitalGlobe so that we can leverage the building polygons annotation. The spatial distribution of this dataset (18 different locations) also allows us to perform extensive generalization experiments.

2.1. Annotation

The xBD dataset is annotated for building damage assessment; therefore, each image pair is accompanied by building polygons corresponding to building locations along with damage assessment scores. These scores correspond to a joint damage scale with four ordinal classes: No damage, Minor damage, Major damage, and Destroyed. Each of these classes correspond to different damage features depending on the nature of the disaster. For instance, a partial roof collapse and water surrounding a building would be classified as Major damage (see Table 1).
In this work, we consider a simplified binary classification problem, grouping No damage and Minor damage into one category, and Major damage and Destroyed into another. We assume that damages classified as Minor damage do not require immediate emergency attention from humanitarian organizations and can therefore be ignored from the damage assessment. Ignoring Minor damage reduces the task’s complexity since, by definition, it is generally more subtle and consequently harder to predict.
The distribution of damage varies across disaster events (Figure 2), but it favours undamaged buildings for all disaster events. Over the whole dataset, there is a 5:1 ratio of No Damage versus Damage buildings. This data imbalance should be taken into account in the design of the optimization loss and the evaluation metric (see Section 2.6 and Section 2.6.2).

2.2. Images

The database contains image tiles of 512   ×   512 pixels, and the resolution is at most 0.3 m per pixel. Each sample consists of spatially aligned image pairs: a first snapshot is taken at any time before a natural disaster occurred in a given location, and a second, co-located, image is taken after the incident.
The coupling of pre- and post-disaster images reveals essential information to assess the damage. Although the post-disaster image alone might suffice in some cases, one can better evaluate damage knowing the building’s original state and its surrounding. Figure 3 shows a counterexample where the post-disaster image alone is insufficient for a confident damage assessment. The contrast between pre- and post-disaster image features helps distinguish the presence of damage and thus contributes to a more confident evaluation. This contrast is even more critical for detecting peripheral damages, as opposed to structural, and more specifically the less severe ones.
Each image pair covers roughly the same 150 m × 150 m ground area, which is larger than a regular building. The image provides a larger context to make a correct damage assessment. Figure 3 shows how floods, for instance, are hard to perceive given only the building and local context. Humans, too, reflect and evaluate potential damage to a building by seeking for visual cues in the surrounding area.
By nature, global remote sensing problems are often high-dimensional: they must include images from around the globe to capture the inherent geodiversity. For building damage assessment, the disaster types and the time dimension contribute to further complexity. Time contributes to complexity in view of the fact that any dynamic information must be captured.

2.2.1. Location

The xBD dataset includes events from 18 different locations throughout the world. It covers both rural and urban regions (respectively, sparse and dense in buildings). Each site is unique in its climate and demographic characteristics: climate determines the presence of grass, sand, snow, etc. Demographics influence the infrastructure, such as roads, buildings, etc. Buildings vary in shape, size, materials, and density of arrangement. For example, a low density of buildings is commonly found in rural areas, wealthier neighbourhoods tend to have bigger houses, Nordic countries require resistant construction materials, etc.
The distribution of samples across locations is not uniform either: the number of samples and buildings per site is not consistent. Moreover, although including worldwide images, the xBD dataset remains biased in favour of American locations. The dataset also does not fully capture the diversity in climate conditions: snow and ice climates, among others, do not appear in the dataset.
Table 2 serves as the abbreviations index to the disasters and locations used throughout this work.

2.2.2. Disaster and Damage Type

The dataset also contains numerous disaster types, leading to different damage types, depending on the event’s location. Disaster types include hurricane, earthquake, tornado, tsunami, wildfire, volcano eruption, and flooding.
Depending on the destructive force (wind, water, fire, etc.) and the location, different types of damage are visible from the satellite imagery: collapsed roofs, flooding, burned buildings, etc. Damages can be described by their severity and can be divided into two groups: peripheral and structural. Structural damages are on the building structure itself (e.g., collapsed roof), and peripheral damages are on its periphery (e.g., flooded area); for examples, see Figure 4. There is a reasonably uniform distribution of those two types of damage across the dataset. However, each disaster type is typically the cause of either peripheral or structural damages, but rarely both. Ultimately, regardless of the disaster type, buildings are classified under the binary schema of damage vs. no damage.

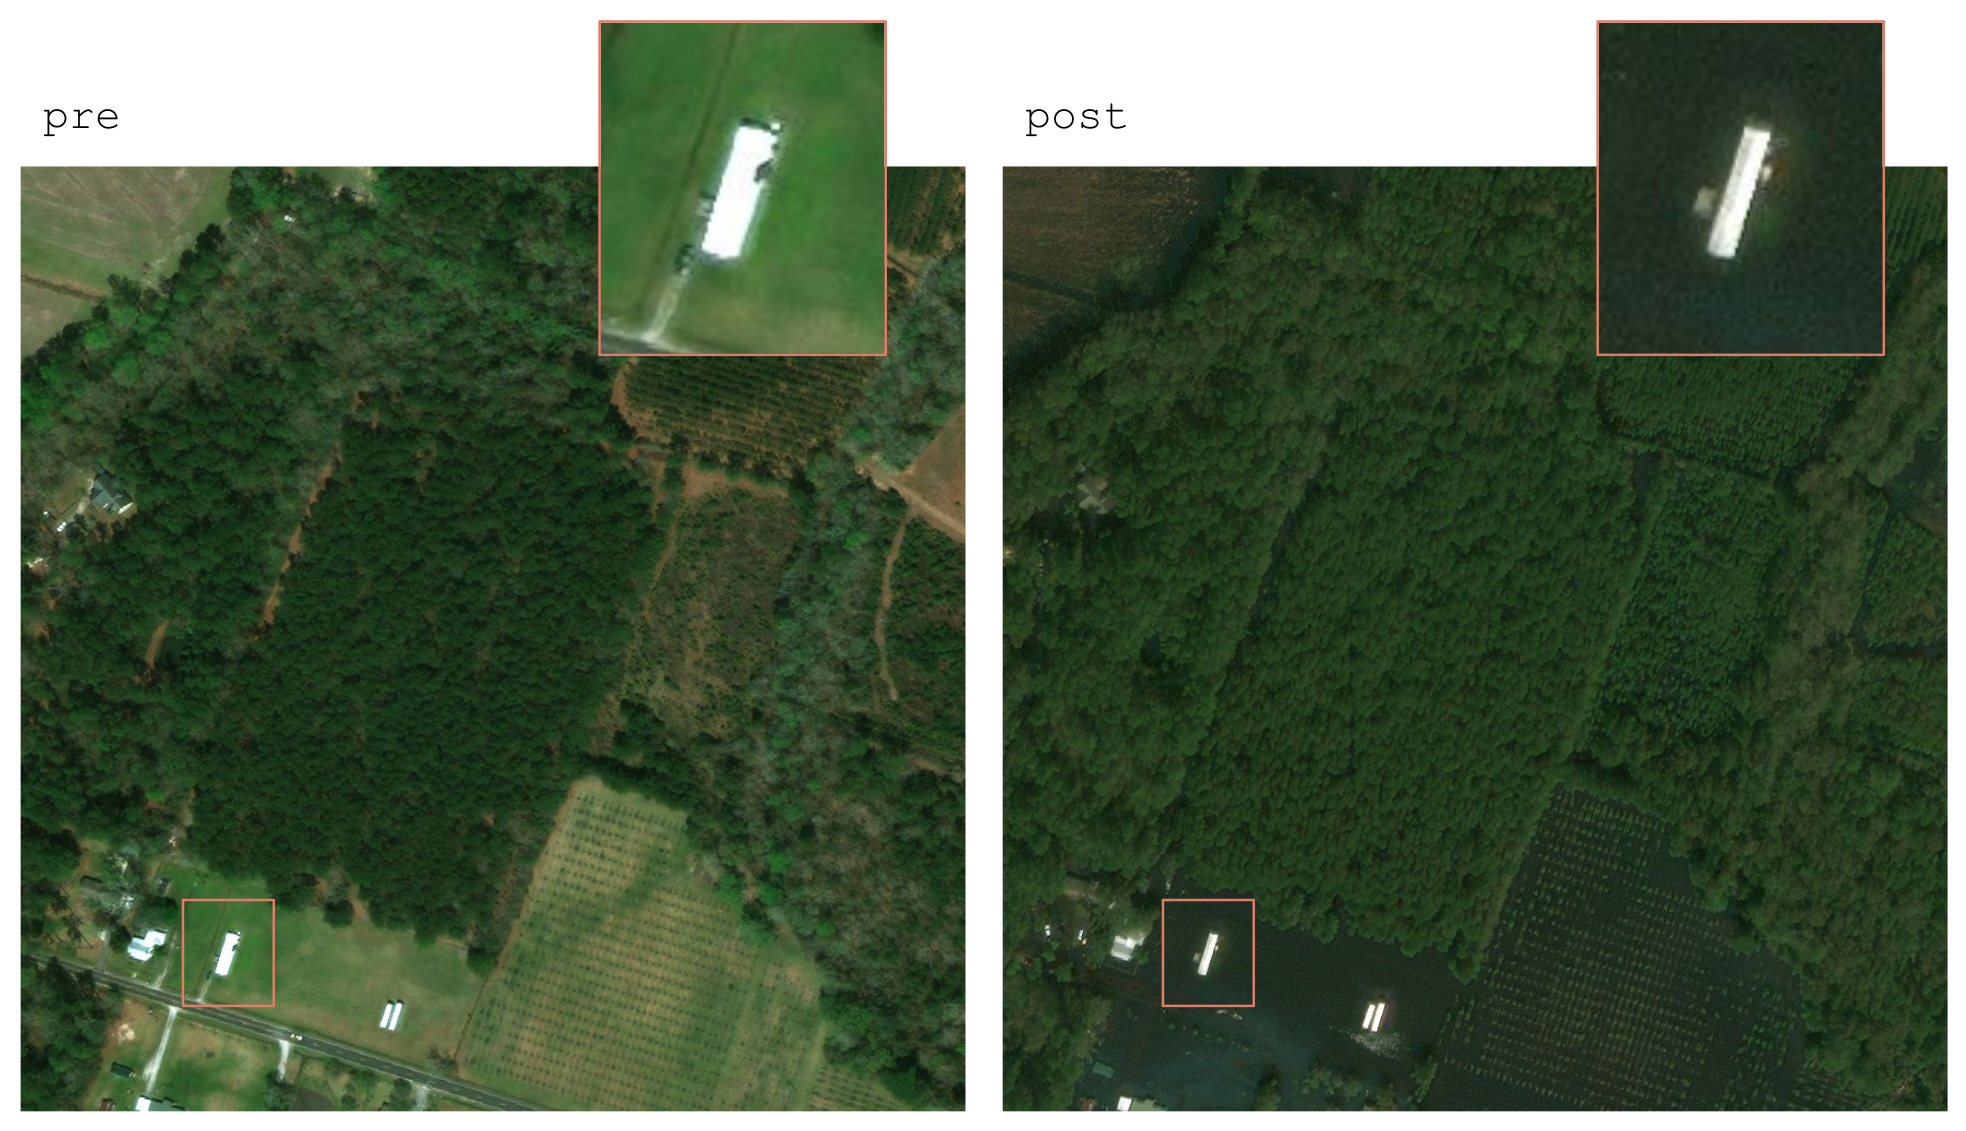
2.2.3. Time and Seasons

The temporal dimension tracks anything that differs between the pre- and post-disaster images, including damage-related changes. Changes can be due to moving objects, such as cars, new infrastructure, and seasonal changes, such as vegetation colour. The temporal dimension can be used to compare pre- and post-disaster images.
Although temporal information can be rich and informative, it adds further complexity to the modelling. Assessing damage based on the peripheral information is more challenging because the model must learn to discriminate based on damage information and ignore seasonal changes. For instance, it should detect the presence of water in a flooded region while ignoring change in vegetation colour due to seasonal change.
Temporal changes are usually effortless to identify: humans and machines are good at filtering through noise. However, for a model to be able to differentiate seasonal changes from damage changes, it must understand the semantics of the changes in remote sensing imagery. Performing this is therefore much more complex and requires a high diversity in seasonal changes and damage types. Irrelevant differences, such as sun exposure, can influence the model predictions. That said, the dataset contains only 18 instances with seasonal changes (one per location), which arguably does not cover enough temporal diversity for the model to generalize.

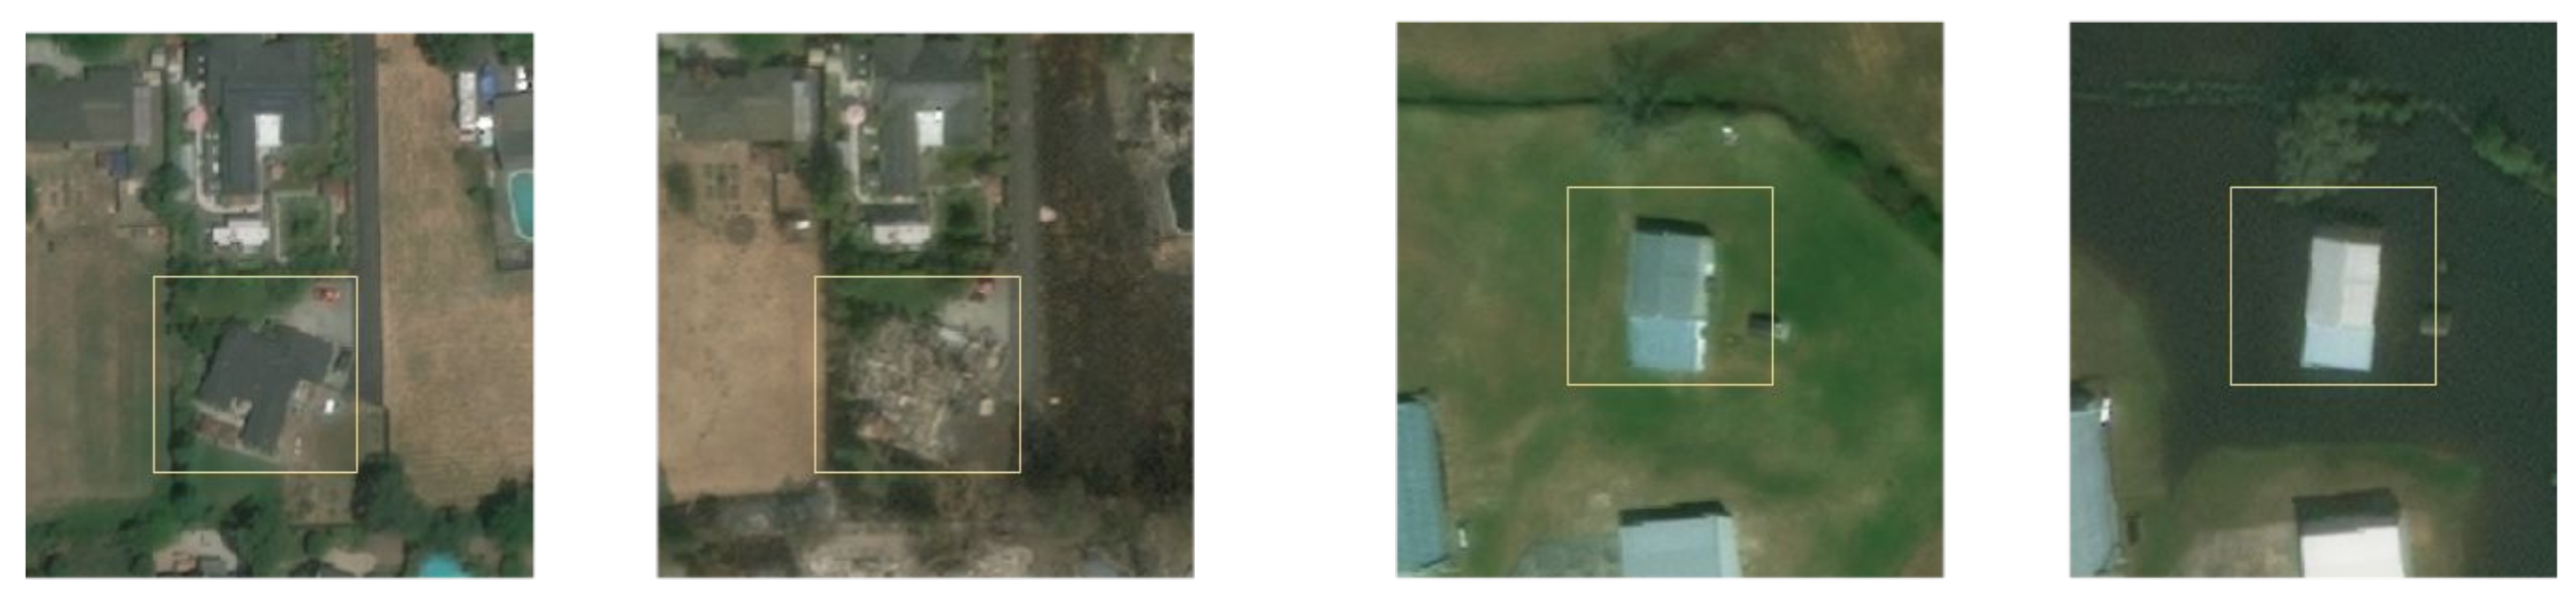
2.2.4. Other Factors

Finally, the variation in projection angles (also known as off-nadir angles) typically seen in satellite imagery is not captured in the dataset: all xBD samples are taken with nadir angles. Additionally, some limitations are not explicitly addressed in our work, nor included in the dataset: occlusions (cloud, tree canopies, etc.), damages invisible from above (broken windows, damaged wall, etc.) and noisy labels (unintended annotation errors due to fatigue, misinterpreted images, etc.).

2.3. Problem Complexity

The problem complexity relies on the thoroughly described high variability of the dataset. Solving the damage classification task thus require a fair amount of annotated data to cover all possible representations of a damaged building. In absence of enough data, more complex learning techniques (unsupervised or transfer) may be required.

2.4. Requirements

Our method predicts building damage maps from satellite images in the aftermath of a natural disaster. It aims to provide a machine learning workflow to reduce assessment delays and support faster decision-making. The method requirements can be broken down to three main topics: model readiness and post-incident execution time, performance, and interpretability.

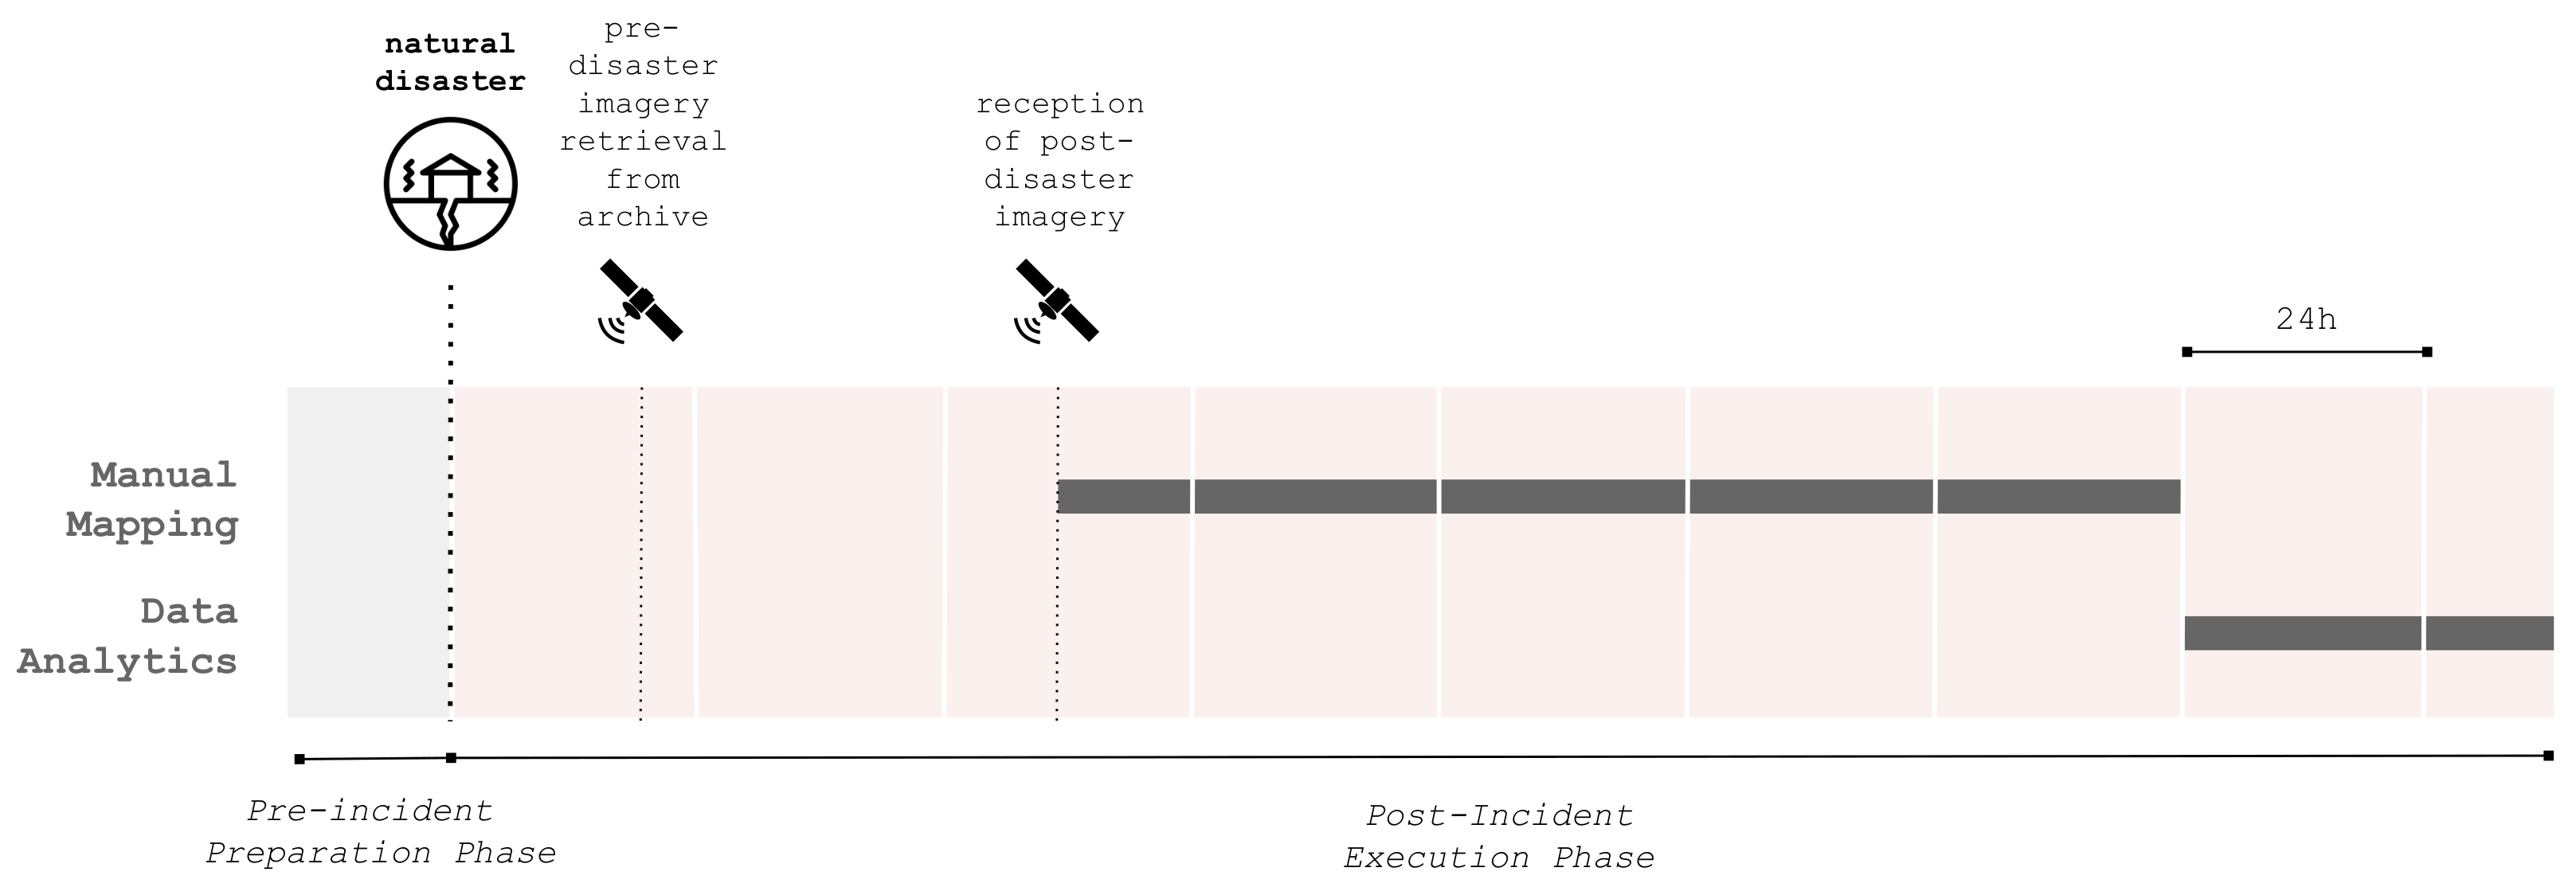
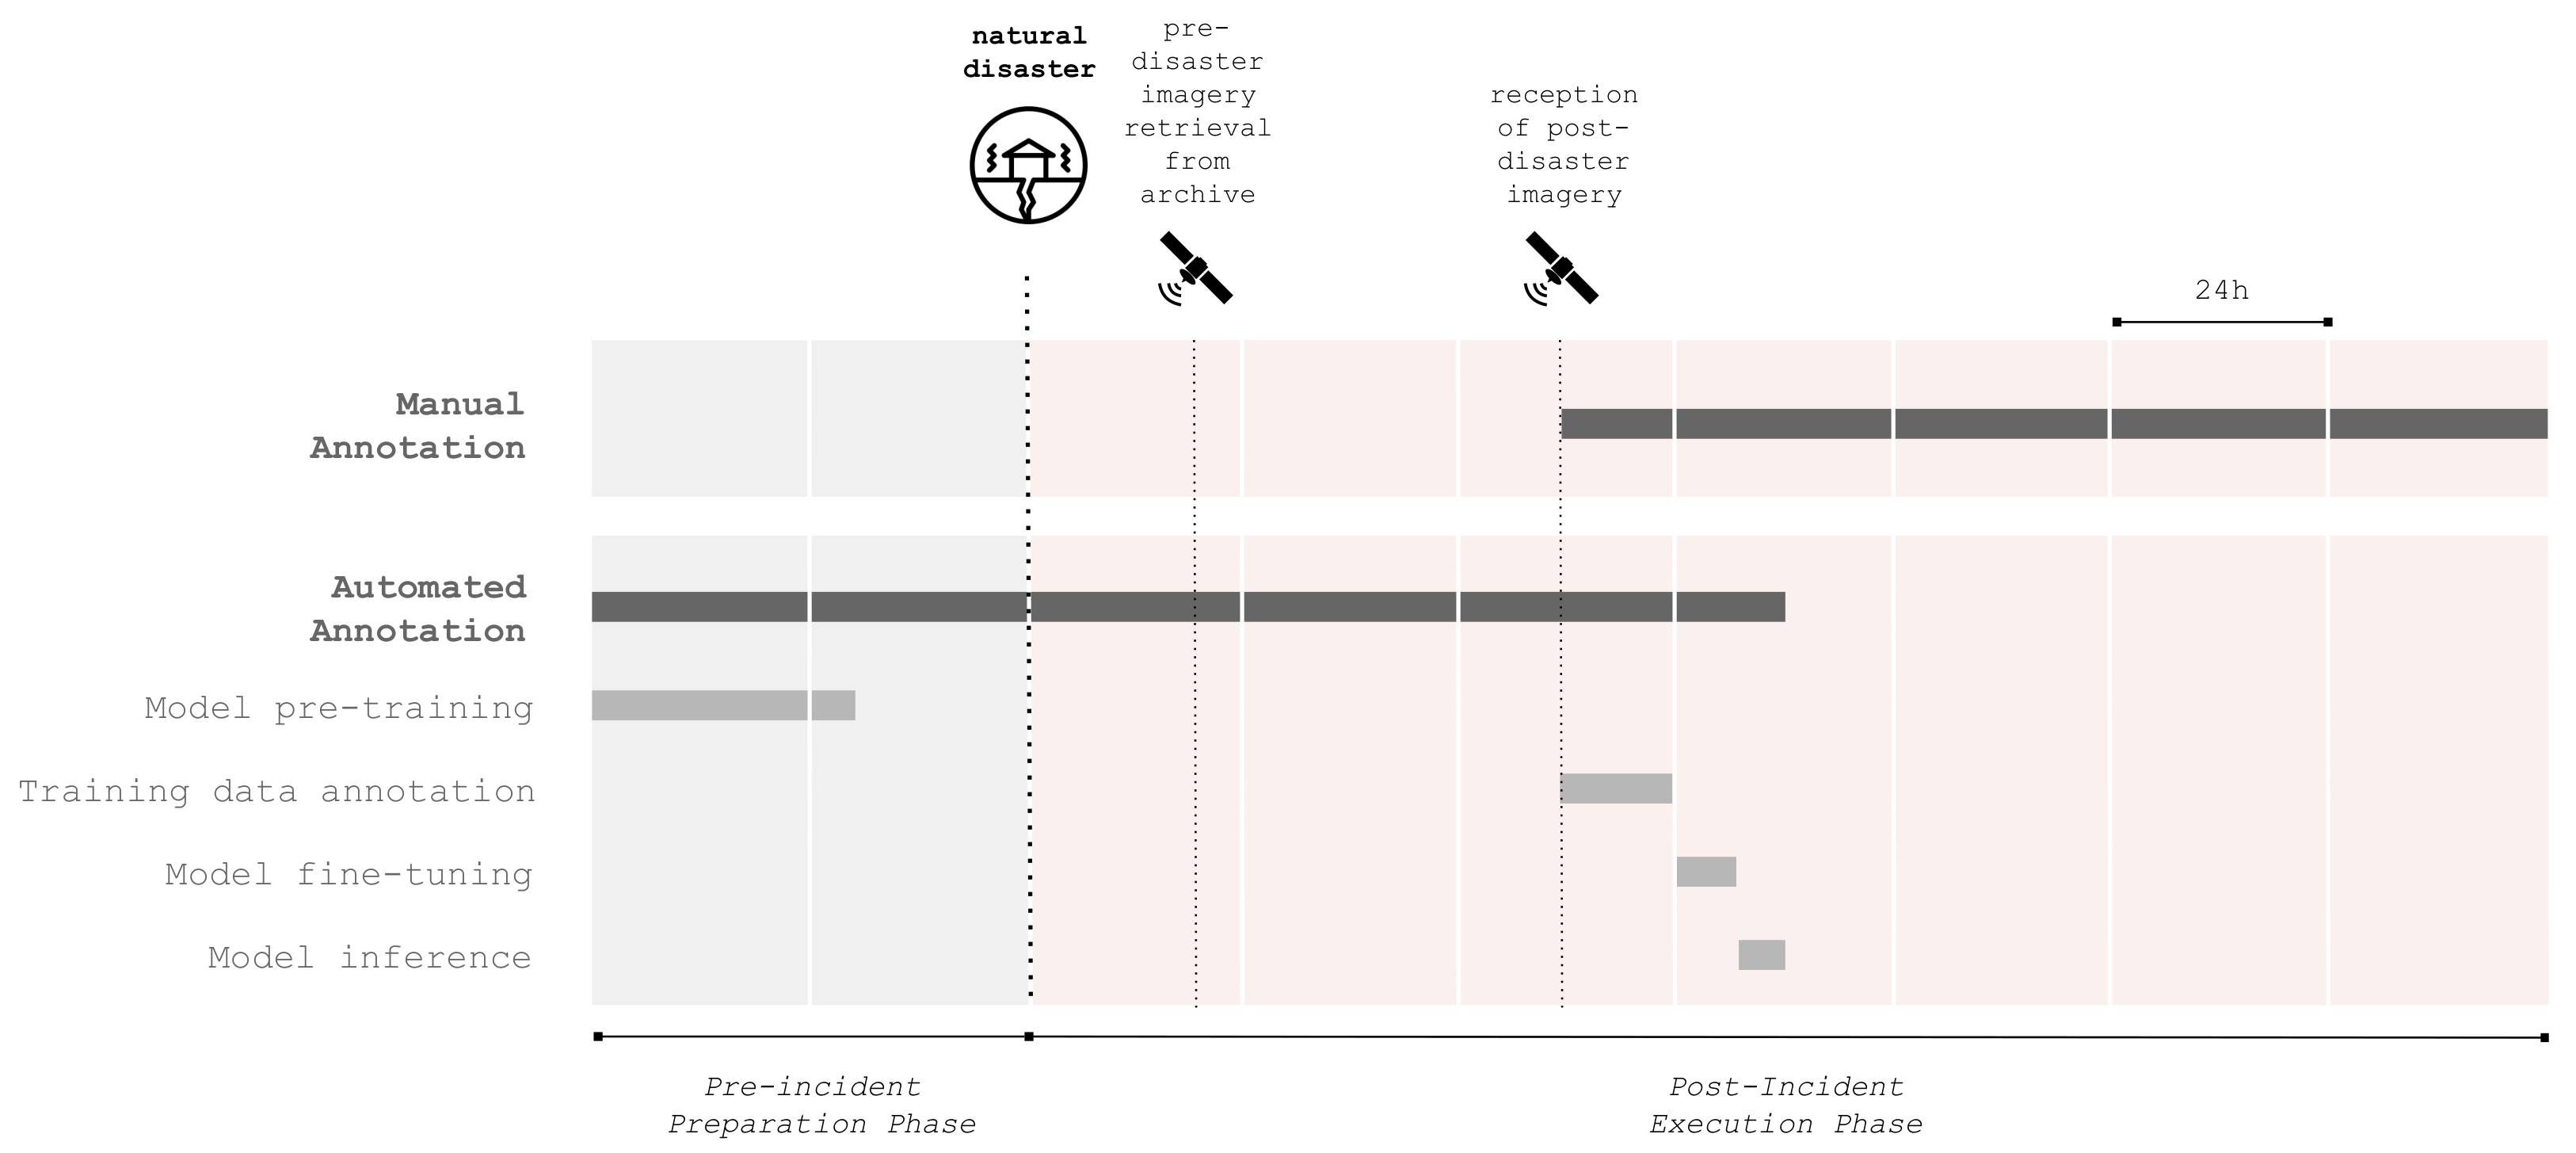
2.4.1. Model Readiness and Post-Incident Execution Time

For a mapping algorithm to be successfully applied in an emergency context, its post-incident execution time must be short. The post-incident execution phase includes any task that will be executed after the disaster, thereby influencing the response delay.
The model readiness refers to any ML model development tasks performed in the pre-incident preparation phase to shorten the post-incident execution time. An ML model development cycle typically includes data gathering and annotation, as well as the model training, evaluation, and inference phases. To perform these steps in the pre-incident phase, they must be independent of the current disaster data. This is because annotation is excessively time-costly and should be performed in the preparation phase as much as possible. Thus, the model should require as few annotated samples as possible from the current disaster event. The algorithm should leverage past events’ images and annotations to generalize to future disasters.
Similarly, deep learning model training may take up to many days. That said, whenever possible, the model should be pretrained on past disaster event samples as part of the pre-incident preparation phase for it to be ready to infer building locations and damage levels in a post-incident phase. Overall, the model post-incident execution time must be shorter than that of manual annotation for it to be of operational value.

2.4.2. Model Performance

Under distribution shifts, machine learning models tend to underperform. The training of models on past disaster events (to reduce the post-incident execution time) can be hindered by a gap between the distributions of the train set and the test set: there is a trade-off between model performance and execution time.
The model prediction should provide an overall picture of the situation to decision-makers. Thus, a building-level granularity may not be required for the initial assessment. For instance, if the model predicts nine buildings out of ten correctly, the ensuing decision to set up a food-distribution centre is likely to remain the same. Therefore, under emergency constraints, execution time might be favoured instead of performance. Incorrect information might gradually be corrected manually or based on ground observations to refine the mapping and support more low-level decisions eventually.

2.4.3. Interpretability

Damage maps derived from remote sensing are intended to be used to inform decision-making. Therefore, the output should be understandable and interpretable. The output of a deep learning model, such as for classification or semantic segmentation, can be interpreted as a conditional probability at the pixel level. Hence, depending on the situation and the risk level, data analysts may decide to accept a lower or higher level of confidence in the prediction to adjust the output. Generally speaking, lowering the confidence level threshold is likely to yield higher precision, but lower recall.

2.5. Approach

The building damage assessment task can be decomposed into two assignments: first, locating the buildings, and second, assessing their integrity. Therefore, we propose an intuitive two-step model design composed of a building localizer (BuildingNet), followed by a damage classifier (DamageNet), as shown in Figure 5.
In an emergency context, building detection does not require images from after the disaster, but damage detection does. Solving the task using two separate model allows for the separation of the concerns and a faster processing of the buildings in the emergency.
First, BuildingNet is a binary semantic segmentation model, i.e., every pixel is assigned one of two classes: building or background.
Image patches are then cropped around each detected building and passed on to the damage classification model. DamageNet is a binary classification model whose output is either Damage or No damage.
While designing a model that can solve both tasks end-to-end is feasible, we argue that a two-step model is more suitable in an emergency context. First, both models can be trained, evaluated, and deployed separately; thus, each model is computationally cheaper compared to the end-to-end approach. The decoupling may eventually reduce the post-incident execution time. Moreover, concurrently optimizing one model for building location and damage classification is demanding in terms of GPU computational resources, and a two-model approach is likely to converge faster. End-to-end learning is known to have scaling limitations and inefficiencies [58].
Another argument for a two-step approach is that the building detection task on its own only requires pre-disaster imagery and building location annotation. In a decoupled model design, the organization can proceed to building detection as soon as the pre-disaster imagery is made available. Only the damage classification task is awaiting post-disaster imagery to start. Objectively, building detection is also a much simpler task than damage classification because it does not suffer from complexity of the temporal dimension.
Finally, both model outputs are probabilistic, representing the probability of belonging to a given class. Decoupling them allows for more interpretability and flexibility as both the location and the damage sigmoid output can be thresholded separately.

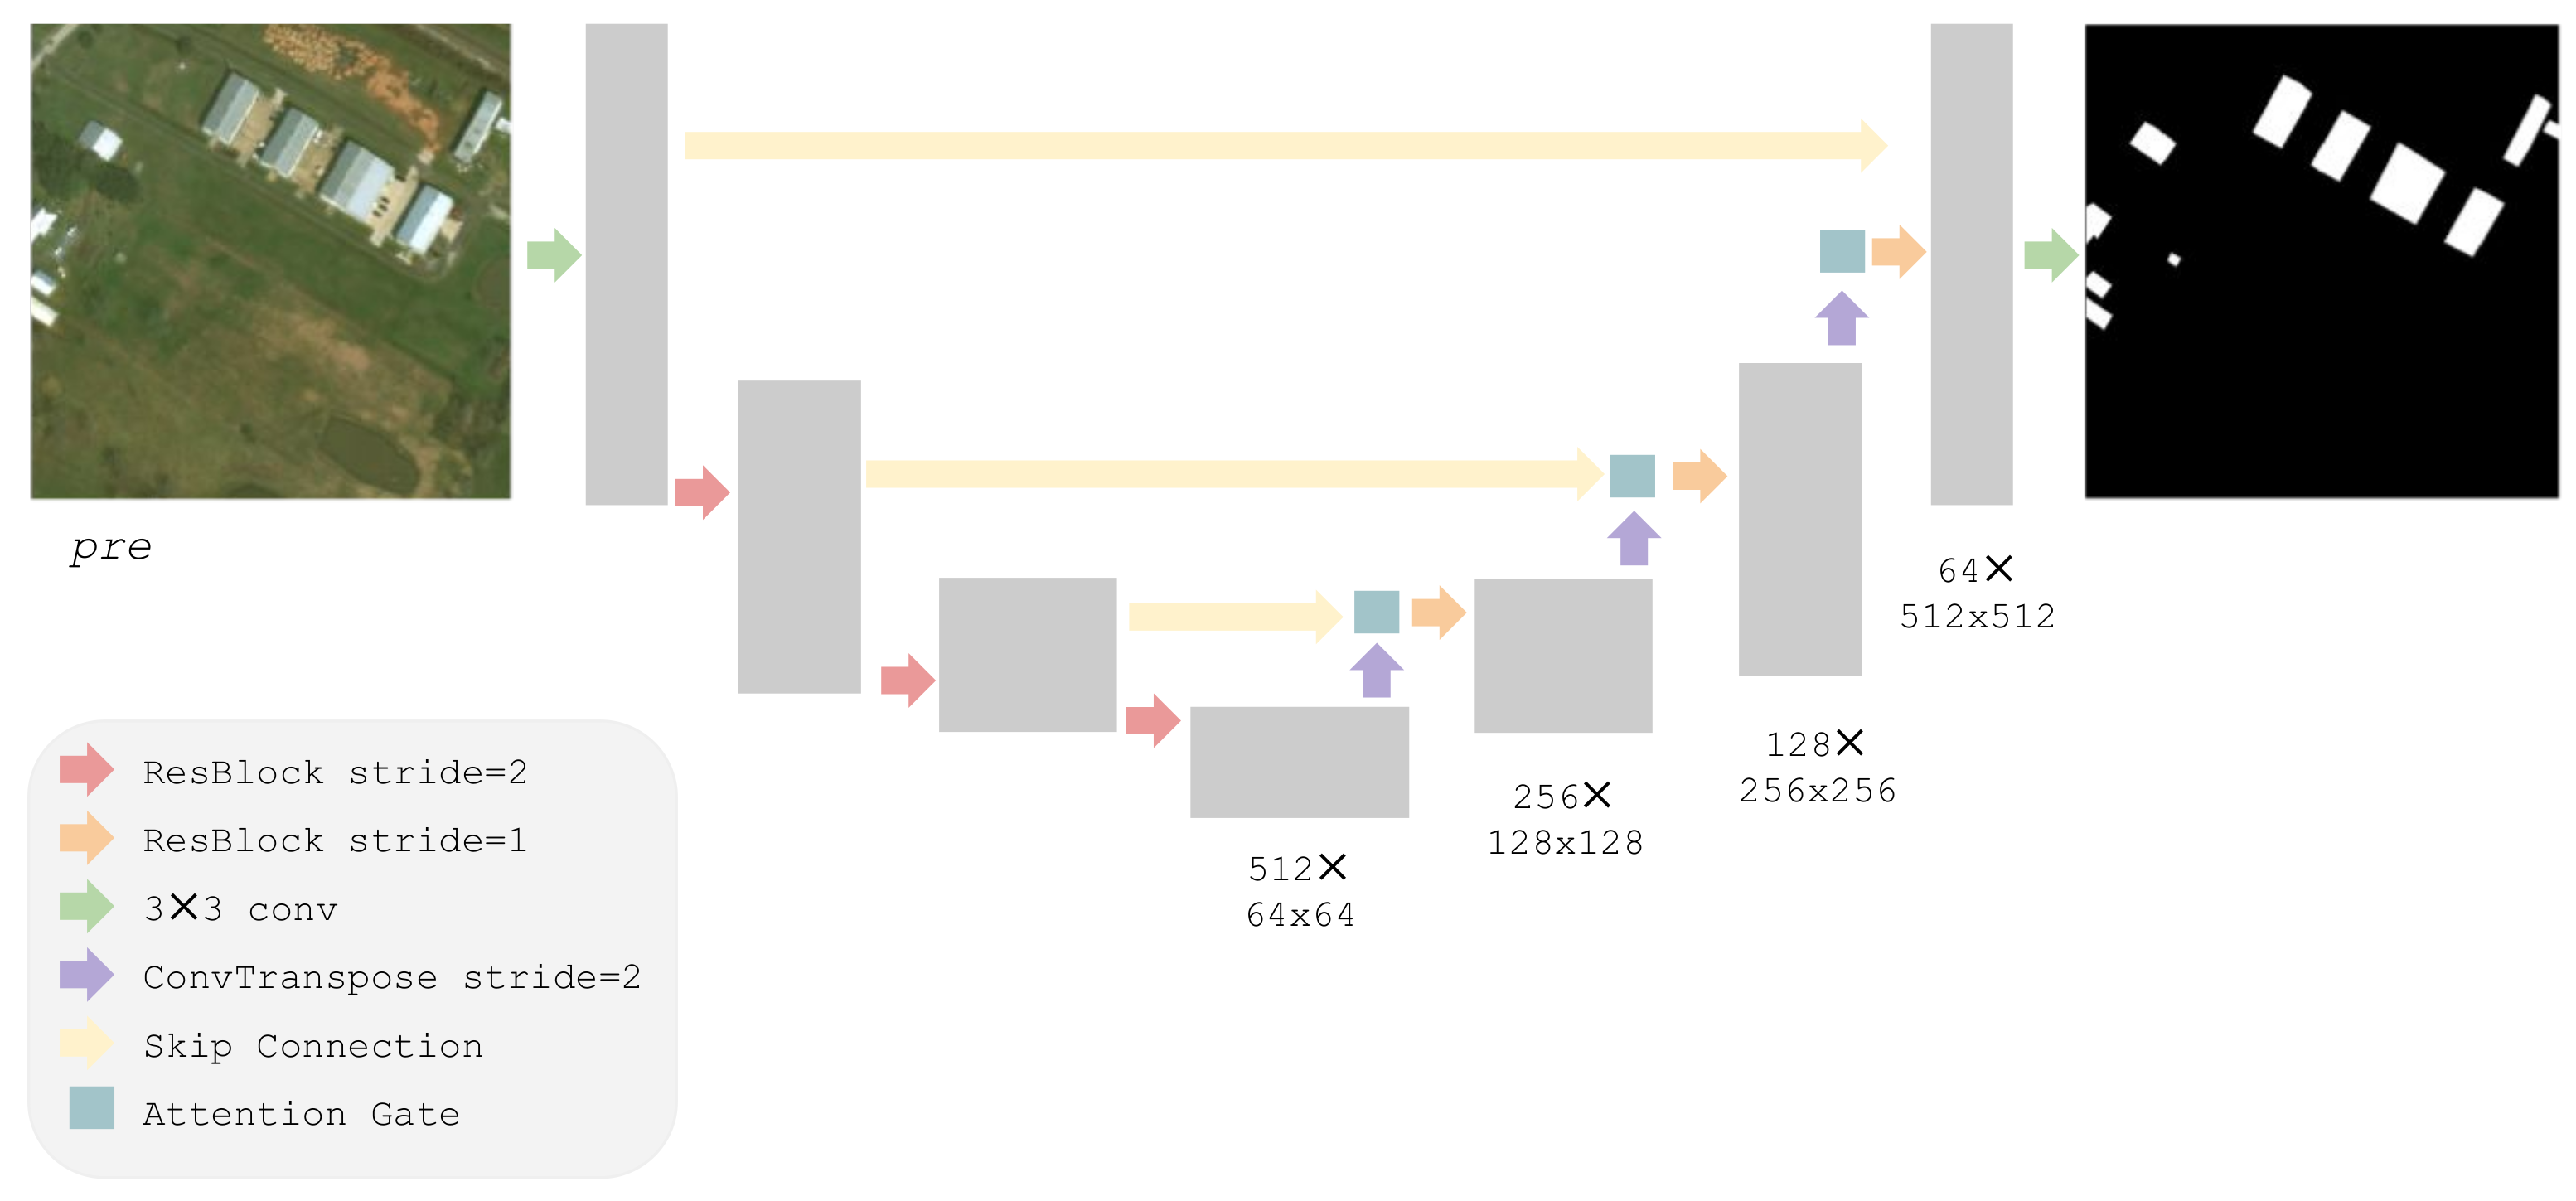
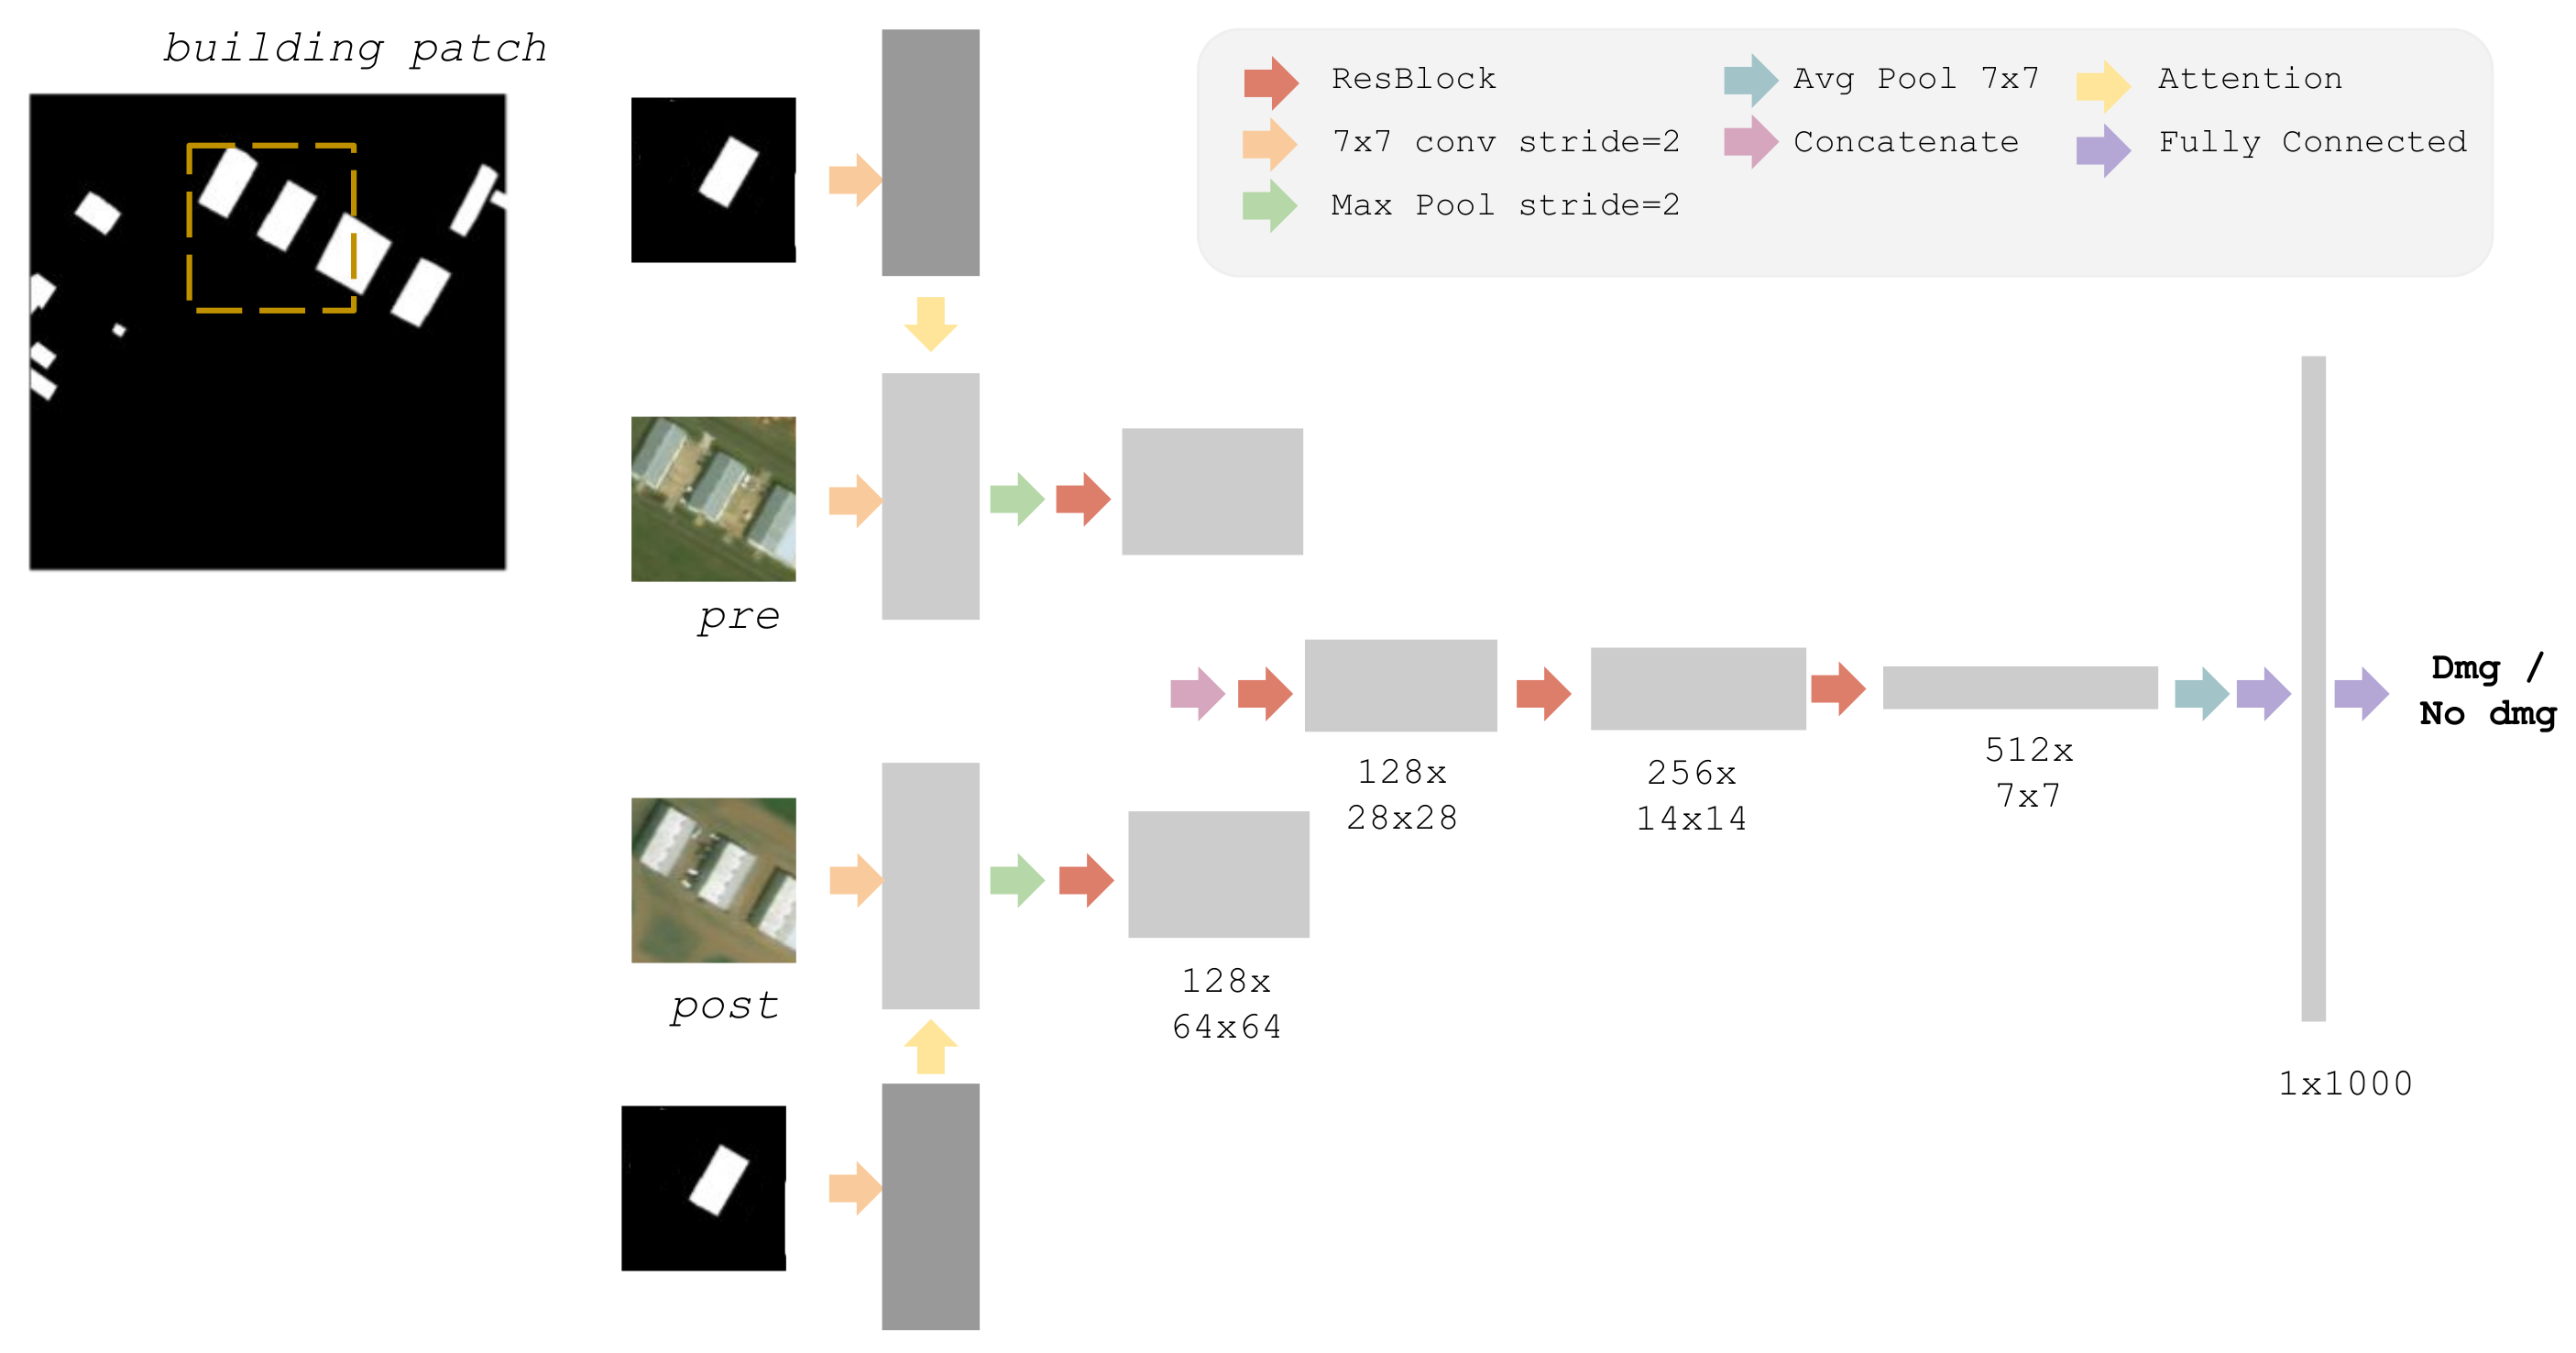
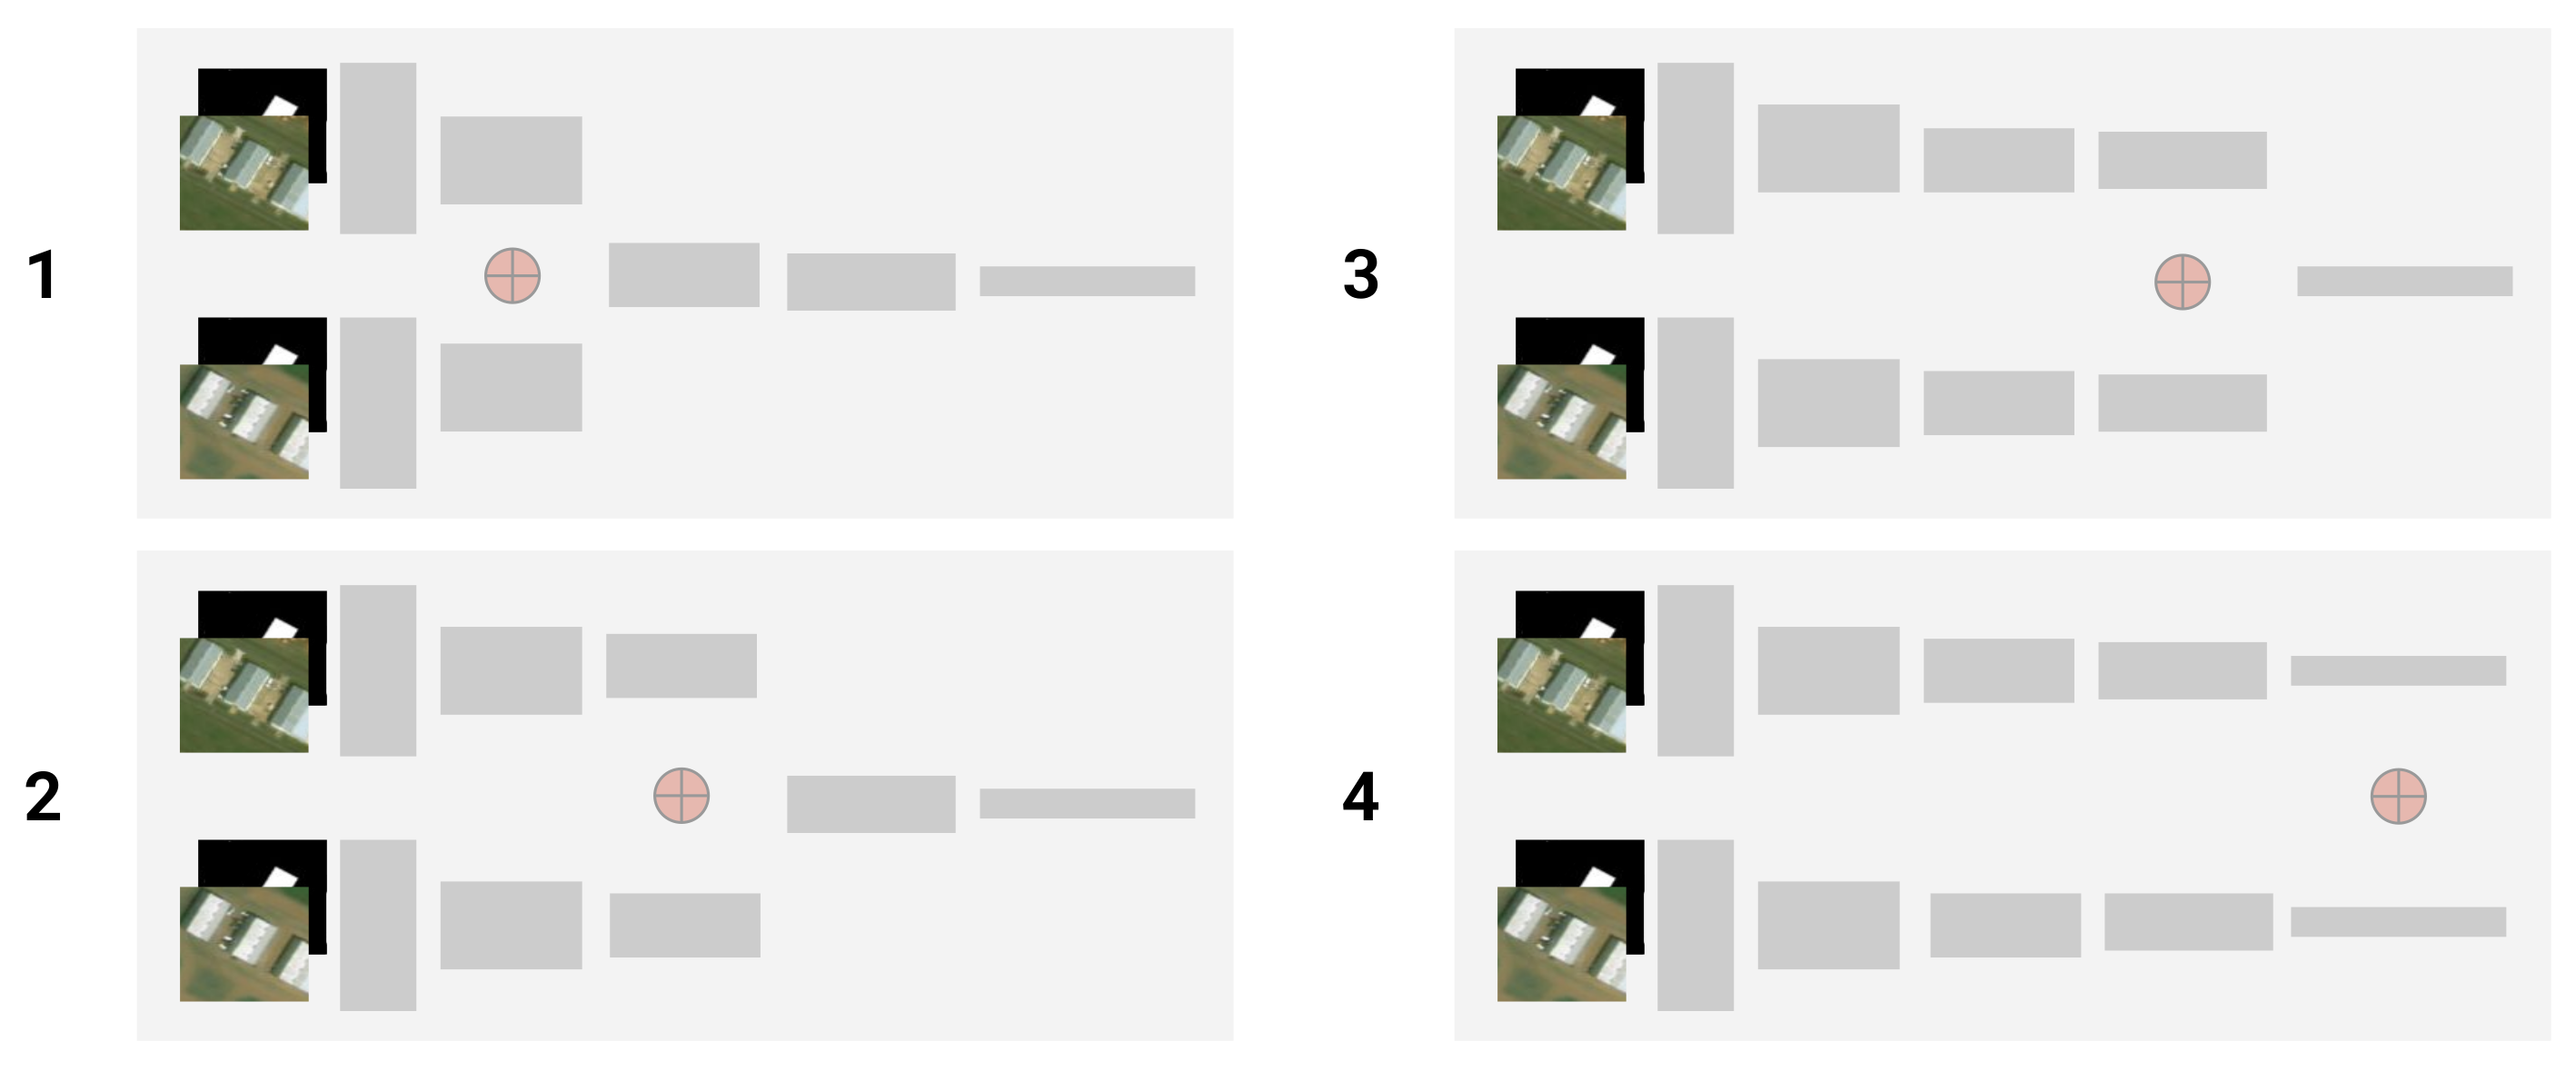
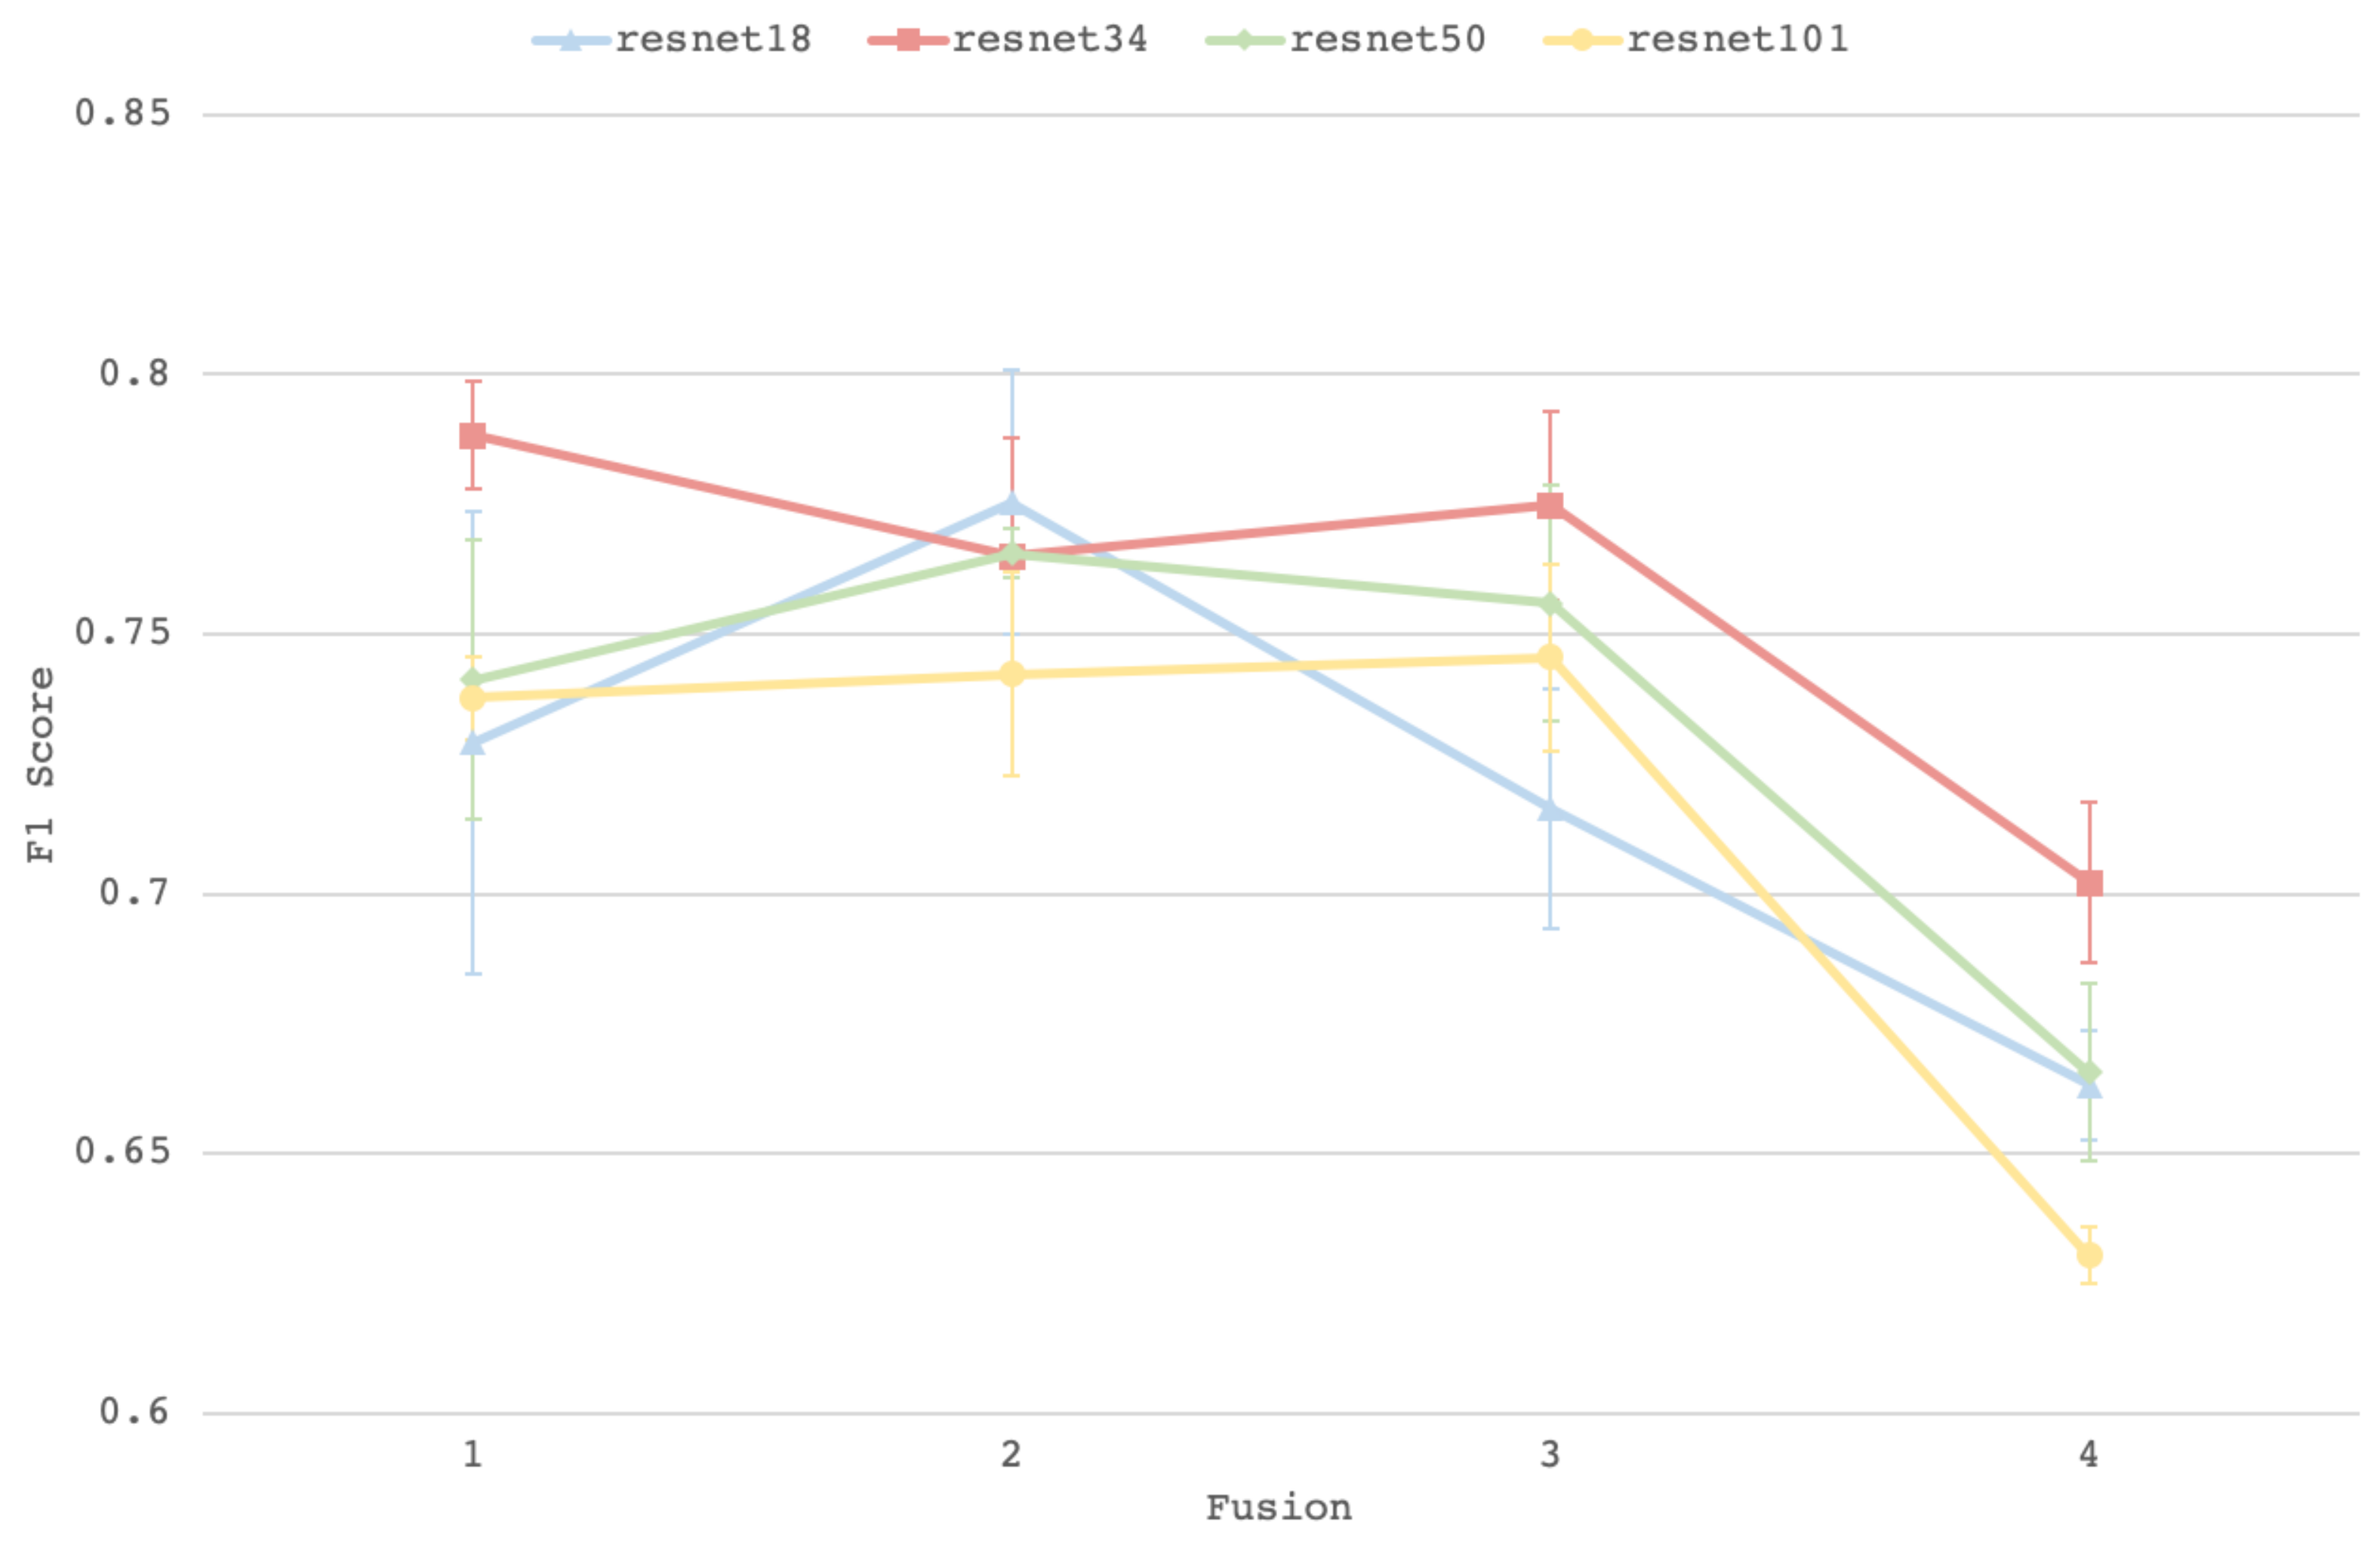
2.6. Model Architectures

The building localization is solved as a binary semantic segmentation problem using the Attention-U-Net architecture [59] with a binary cross-entropy loss (Figure 6). The model’s input is a 512   ×   512 pre-disaster image, and the output is a binary segmentation map.
Attention-U-Net is an extension of U-Net architectures [60] with attention gates that allows the model to focus on structures of different sizes. It was originally implemented for medical imaging, but has been commonly used in many other fields due to its efficiency and relatively low computational cost.
The damage assessment model is a Siamese ResNet [61,62] classifier (Figure 7). ResNet is a state-of-the-art classification architecture. The architecture performance relies on its skip connections that allow the gradient to back-propagate more easily as the model’s depth increases. We experiment with ResNet architectures of different capacities: with 18, 34, 50 and 101 layers. The model input is a 224   ×   224 patch of the aligned pre- and post-disaster images centred on the building to classify. The patch size is set so as to limit the memory usage while keeping sufficient contextual information. The first ResNet layers are computed in separate streams with shared weights for the pre- and post-disaster inputs. Then, the feature maps are concatenated, and the last convolutional layer blocks are applied.
The binary segmentation heatmap is multiplied with the 64-channels feature maps before the first downsampling layer. The mask is applied similar to an attention mechanism, such that the model focuses on the building but retains information on the whole image context. This mechanism is essential to make accurate predictions on certain types of damage, such as floods and volcanic eruptions, where there is no visible damage to the building structure itself, but only on its surrounding. The attention mechanism combines a convolution layer and a matrix multiplication that allows the model to up-weight only the most relevant of features.
The damage classification model is optimized using binary cross-entropy with a weight of five for positive samples, set according to the ratio of positive and negative samples in the overall dataset. The output is bounded between zero and one using a sigmoid activation function.
These two architectures (Attention UNet [59] for building detection, and ResNet Siamese [62] for damage classification) are well-used in the literature and have proven to be efficient in various computer vision tasks.

2.6.1. Training Strategy

To minimize the post-incident execution time, the training strategy consists of training both models prior to the disaster to be ready for inference. That said, both the building detection and damage classification models do not have access to data from the current disaster event.
We hypothesize that the building detection model can generalize well to the current disaster, given the simplicity of the task. However, the damage classification model is less likely to generalize to the current disaster event given the complexity of the task. We believe that the xBD dataset is not diverse enough in terms of location, seasonal changes, and disaster type for the model to learn features that transfer well to unseen disasters.

2.6.2. Evaluation

Both the building detection and the damage classification problems are imbalanced in favour of the negative class: building detection is imbalanced in favour of the background pixels, while damage classification favours undamaged buildings. Hence, as opposed to the accuracy, the F 1 metric is used for its ability to describe the performance of the model to predict both the majority and the minority class reasonably. The F 1 is the harmonic mean of recall and precision. For both tasks, the F 1 score over the minority class is measured, i.e., building pixels for the building detection model, and damaged buildings for the damage classification.
F 1   =   2   ·   p r e c i s i o n   ·   r e c a l l p r e c i s i o n   +   r e c a l l   =   T P T P   +   0.5 F N   +   0.5 F P
where T P represents the true positives, F N the false negatives, and F P the false positives.
To be aligned with the training strategy, the goal is to measure the model’s ability to generalize to the current disaster event or predict damages accurately for a disaster event that the model has not seen during training. Therefore, we use all samples from a given disaster event to create the test set, and the remaining samples from all other disasters form the train set.
As a result, train/test split uses 17 events for training and 1 event for testing. We create 18 different train/test splits, one for each event, to evaluate the model’s performance on unseen events. For example, detecting damage in areas devastated by a wildfire does not guarantee success in assessing damage in imagery from a flood; thus, this ablation experiment is performed for each disaster event to assess the methods’ generalizability under different circumstances.

2.7. Experimental Setting

Experiments are run to evaluate if building localization and damage detection models trained on past disaster events can generalize.
First, we conducted an ablation study to determine the best architecture for the damage classification task. The model capacity and the position fusion of the pre-incident and post-incident streams were analyzed. The study covered ResNet architectures with an increasing capacity: resnet-18, -34, -50, and -101, which refers to the total number of layers. The ResNet architecture consists of four blocks of convolutional layers that eventually output tensors with decreased shape in the spatial dimensions but with more feature maps (also known as channels). Our ablation study includes architectures where the streams (pre- and post-disasters) are fused after the first, second, third, and fourth convolutional blocks (Figure 8). The study was run on the Hurricane Florence dataset split for its reasonably challenging complexity. There were three runs per architecture to assess the training stability.

2.8. Transfer Learning

In addition to building detection and damage classification baseline models, we conduct further experiment using transfer learning techniques. We apply transfer learning techniques for the damage classification step only, where more variability is observed and an adaptation to the current disaster event technique is required.
To perform this, for each disaster event, we extracted 10 k building samples from the test set to fine-tune DamageNet using an increasing number of annotated current disaster samples from those withdrawn samples. We use 80% of the samples for training, 20% for validation, and evaluate the performance on the test set remaining samples. Again, the experiments were conducted for all 18 disaster events. We executed three trials with different random seeds for each combination of target disaster and number of training samples. The test set remains the same for each target disaster. We applied the same set of data augmentation (as described in earlier sections) during fine-tuning.
To assess the usability of both the building detection and the damage classification models in an emergency context, building localization and damage detection models are separately trained and evaluated on each of the 18 disaster splits individually. That said, a single run consists of training a model on all 17 disaster events and testing on the remaining samples of a single target disaster event. To assess each model’s training stability, the experiment was repeated three times with different random seeds for each target disaster event. The performance was measured with the F 1 score.

Training Hyperparameters

BuildingNet is trained with the Adam optimizer, with a learning rate of 0.001 and a batch size of 16. We use an early stopping policy with 10 epochs of patience, and learning rate scheduling with decay 0.5 and patience 5. We apply basic data augmentations during training: random flips, crops, and colour jitter.
DamageNet weights are pretrained on ImageNet, and we apply basic data augmentation during training. It is trained with the Adam optimizer, with learning rate 5   ×   10 5 , batch size 32, and weight decay 0.01. We use an early stopping policy with 15 epochs of patience, and learning rate scheduling with decay 0.5 and patience 2. The final fully connected classification layer includes dropout with a probability of 0.5 for an element to be zeroed out.
For both models, BuildingNet and DamageNet, a random search determines the best hyperparameters. Hyperparameter tuning is performed once using a shuffled dataset split with samples from all disasters in both the train and the test sets. All 18 disaster events are present in both the train and the test set, but with no overlap. The test set, therefore, includes representations of all disaster events. Although this method might not yield the optimal solution when applied to the individual disaster splits, this method seemed like a fair trade-off between performance and resource usage.

3. Results

In this section we cover BuildingNet and DamageNet performance results individually, and then analyze the resulting incident workflow, from pre-incident preparedness to post-incident execution.

3.1. Comparison to the State-of-the-Art Model
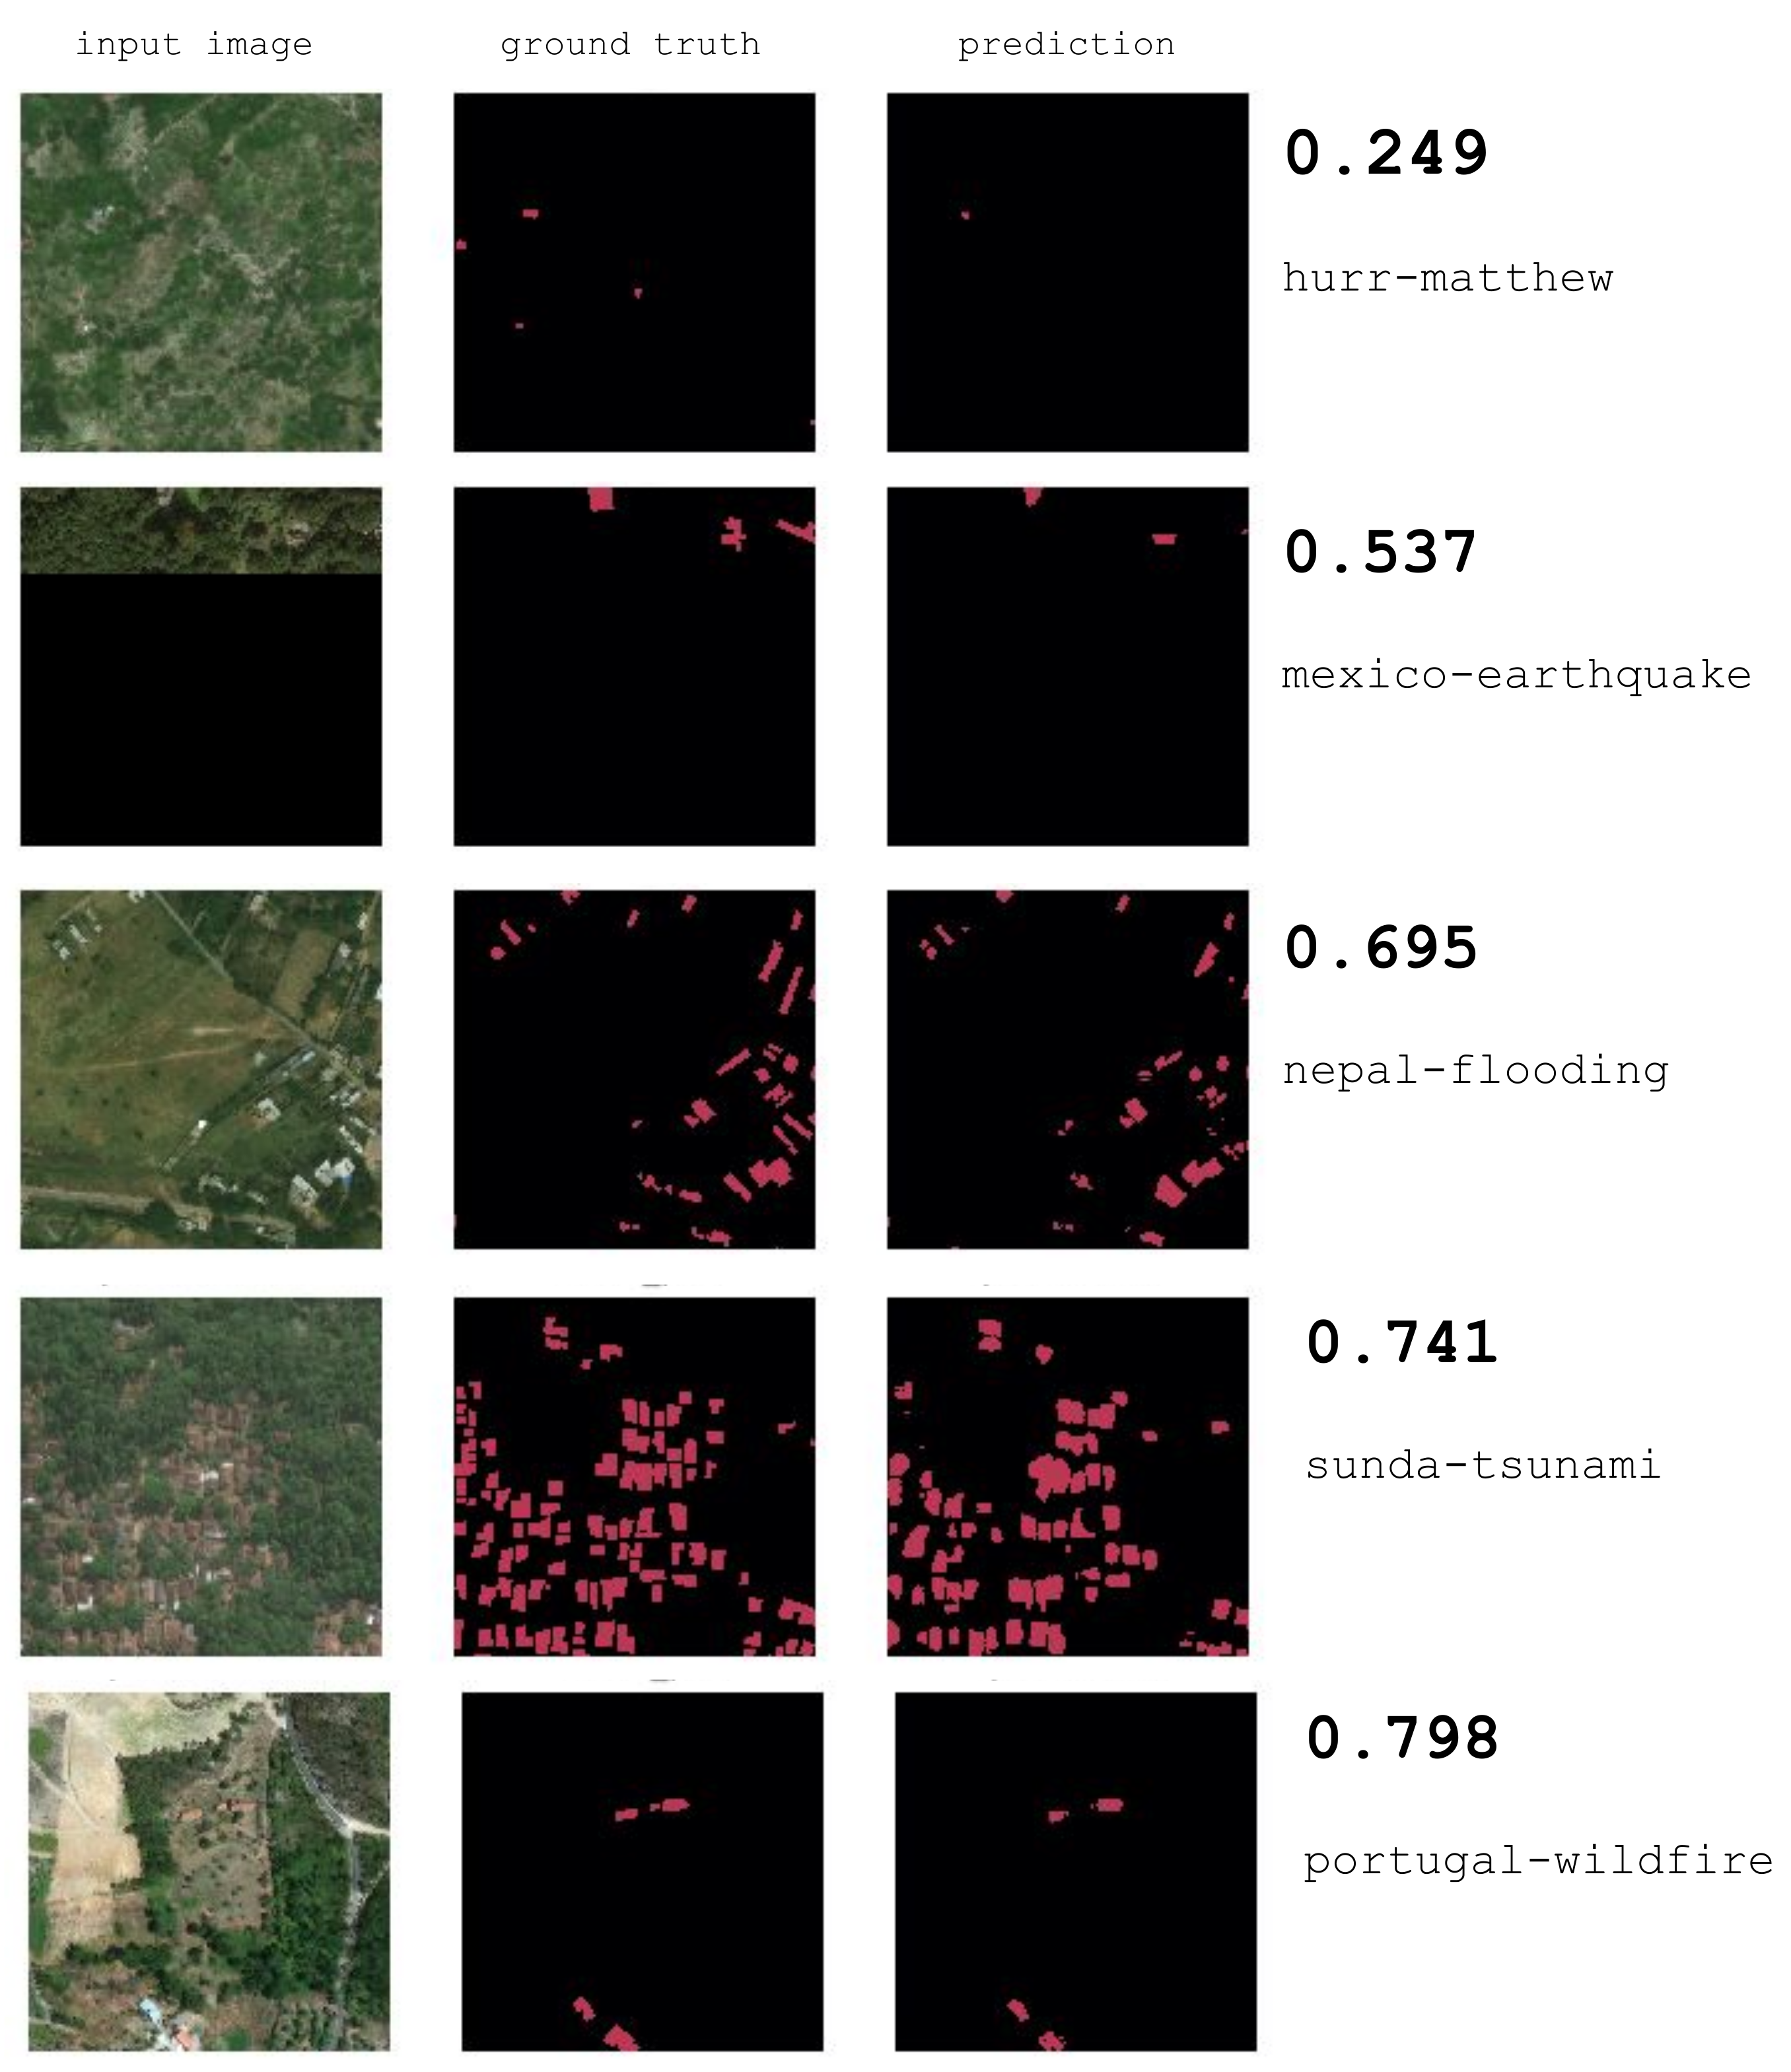
We compare our model using the original xBD test set and metric. Note that our work focuses on measuring the model’s performance for real-world scenarios, and we argue that the original xBD test set cannot measure this because it contains images from disasters that have been seen during training. Nevertheless, we compare our work with the state-of-the-art models using the original xBD benchmark to position our model in the literature.
Table 3 shows how our work compares with others, both for building localization and damage classification. We notice that our model is slightly less performant. However, we argue that the training and testing schema that these papers have used is not aligned with the humanitarian organization’s needs. In fact, in the following sections, we present the results obtained by means of our methodology that is better representing the emergency response context. Therefore, the results presented in Table 3 aim to show that our model provides a fair overall performance when trained using the state-of-the-art methods, which fail to generalize to unseen disaster events as opposed to our approach. Since the domain gap is responsible for this lack of generalizability, we believe that our conclusions are independent of the model architecture.

3.2. BuildingNet

Figure 9 shows the performance of the model to predict building location for each disaster event. The bar shows the average performance over the three runs, and the error bars the standard deviation. The F 1 score is measured per pixel with a threshold of 0.5 over the sigmoid output. The average score across all disaster events is 0.808 —shown with the dotted grey line. As shown by the error bars, the training of BuildingNet converges to stable solutions across the different disaster events, with nepal-flooding having the highest standard deviation ( 0.023 ).

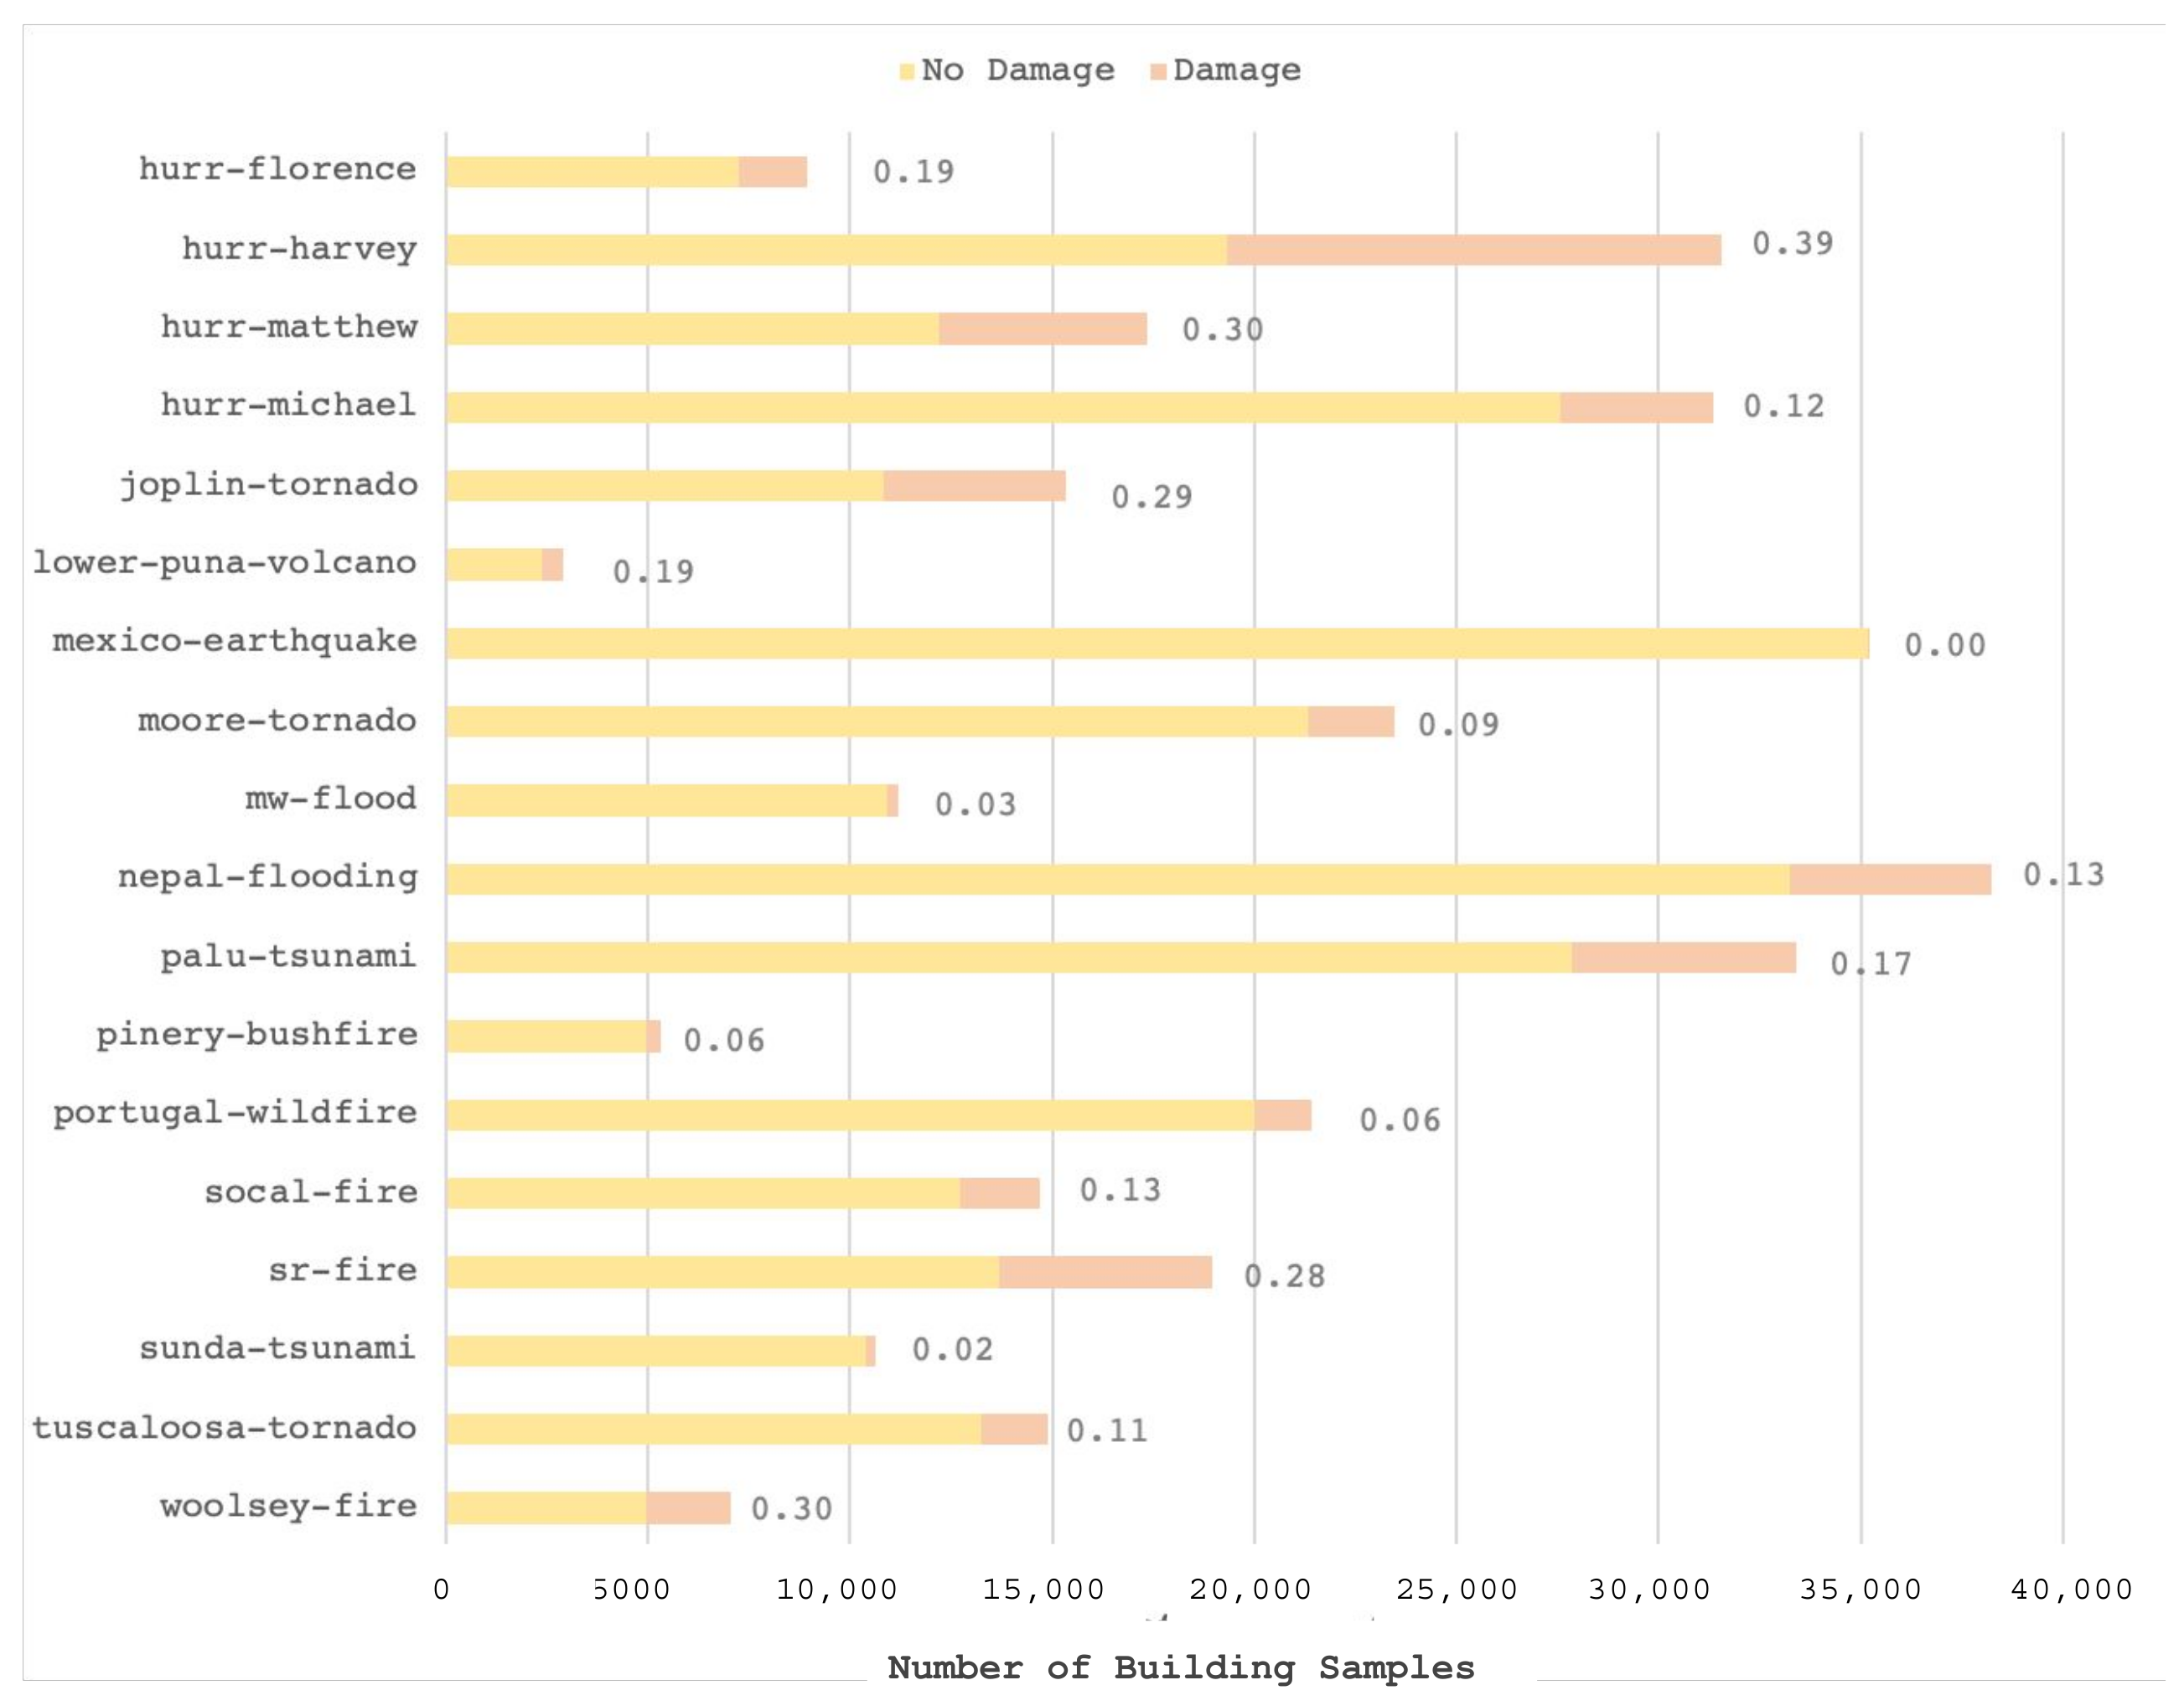
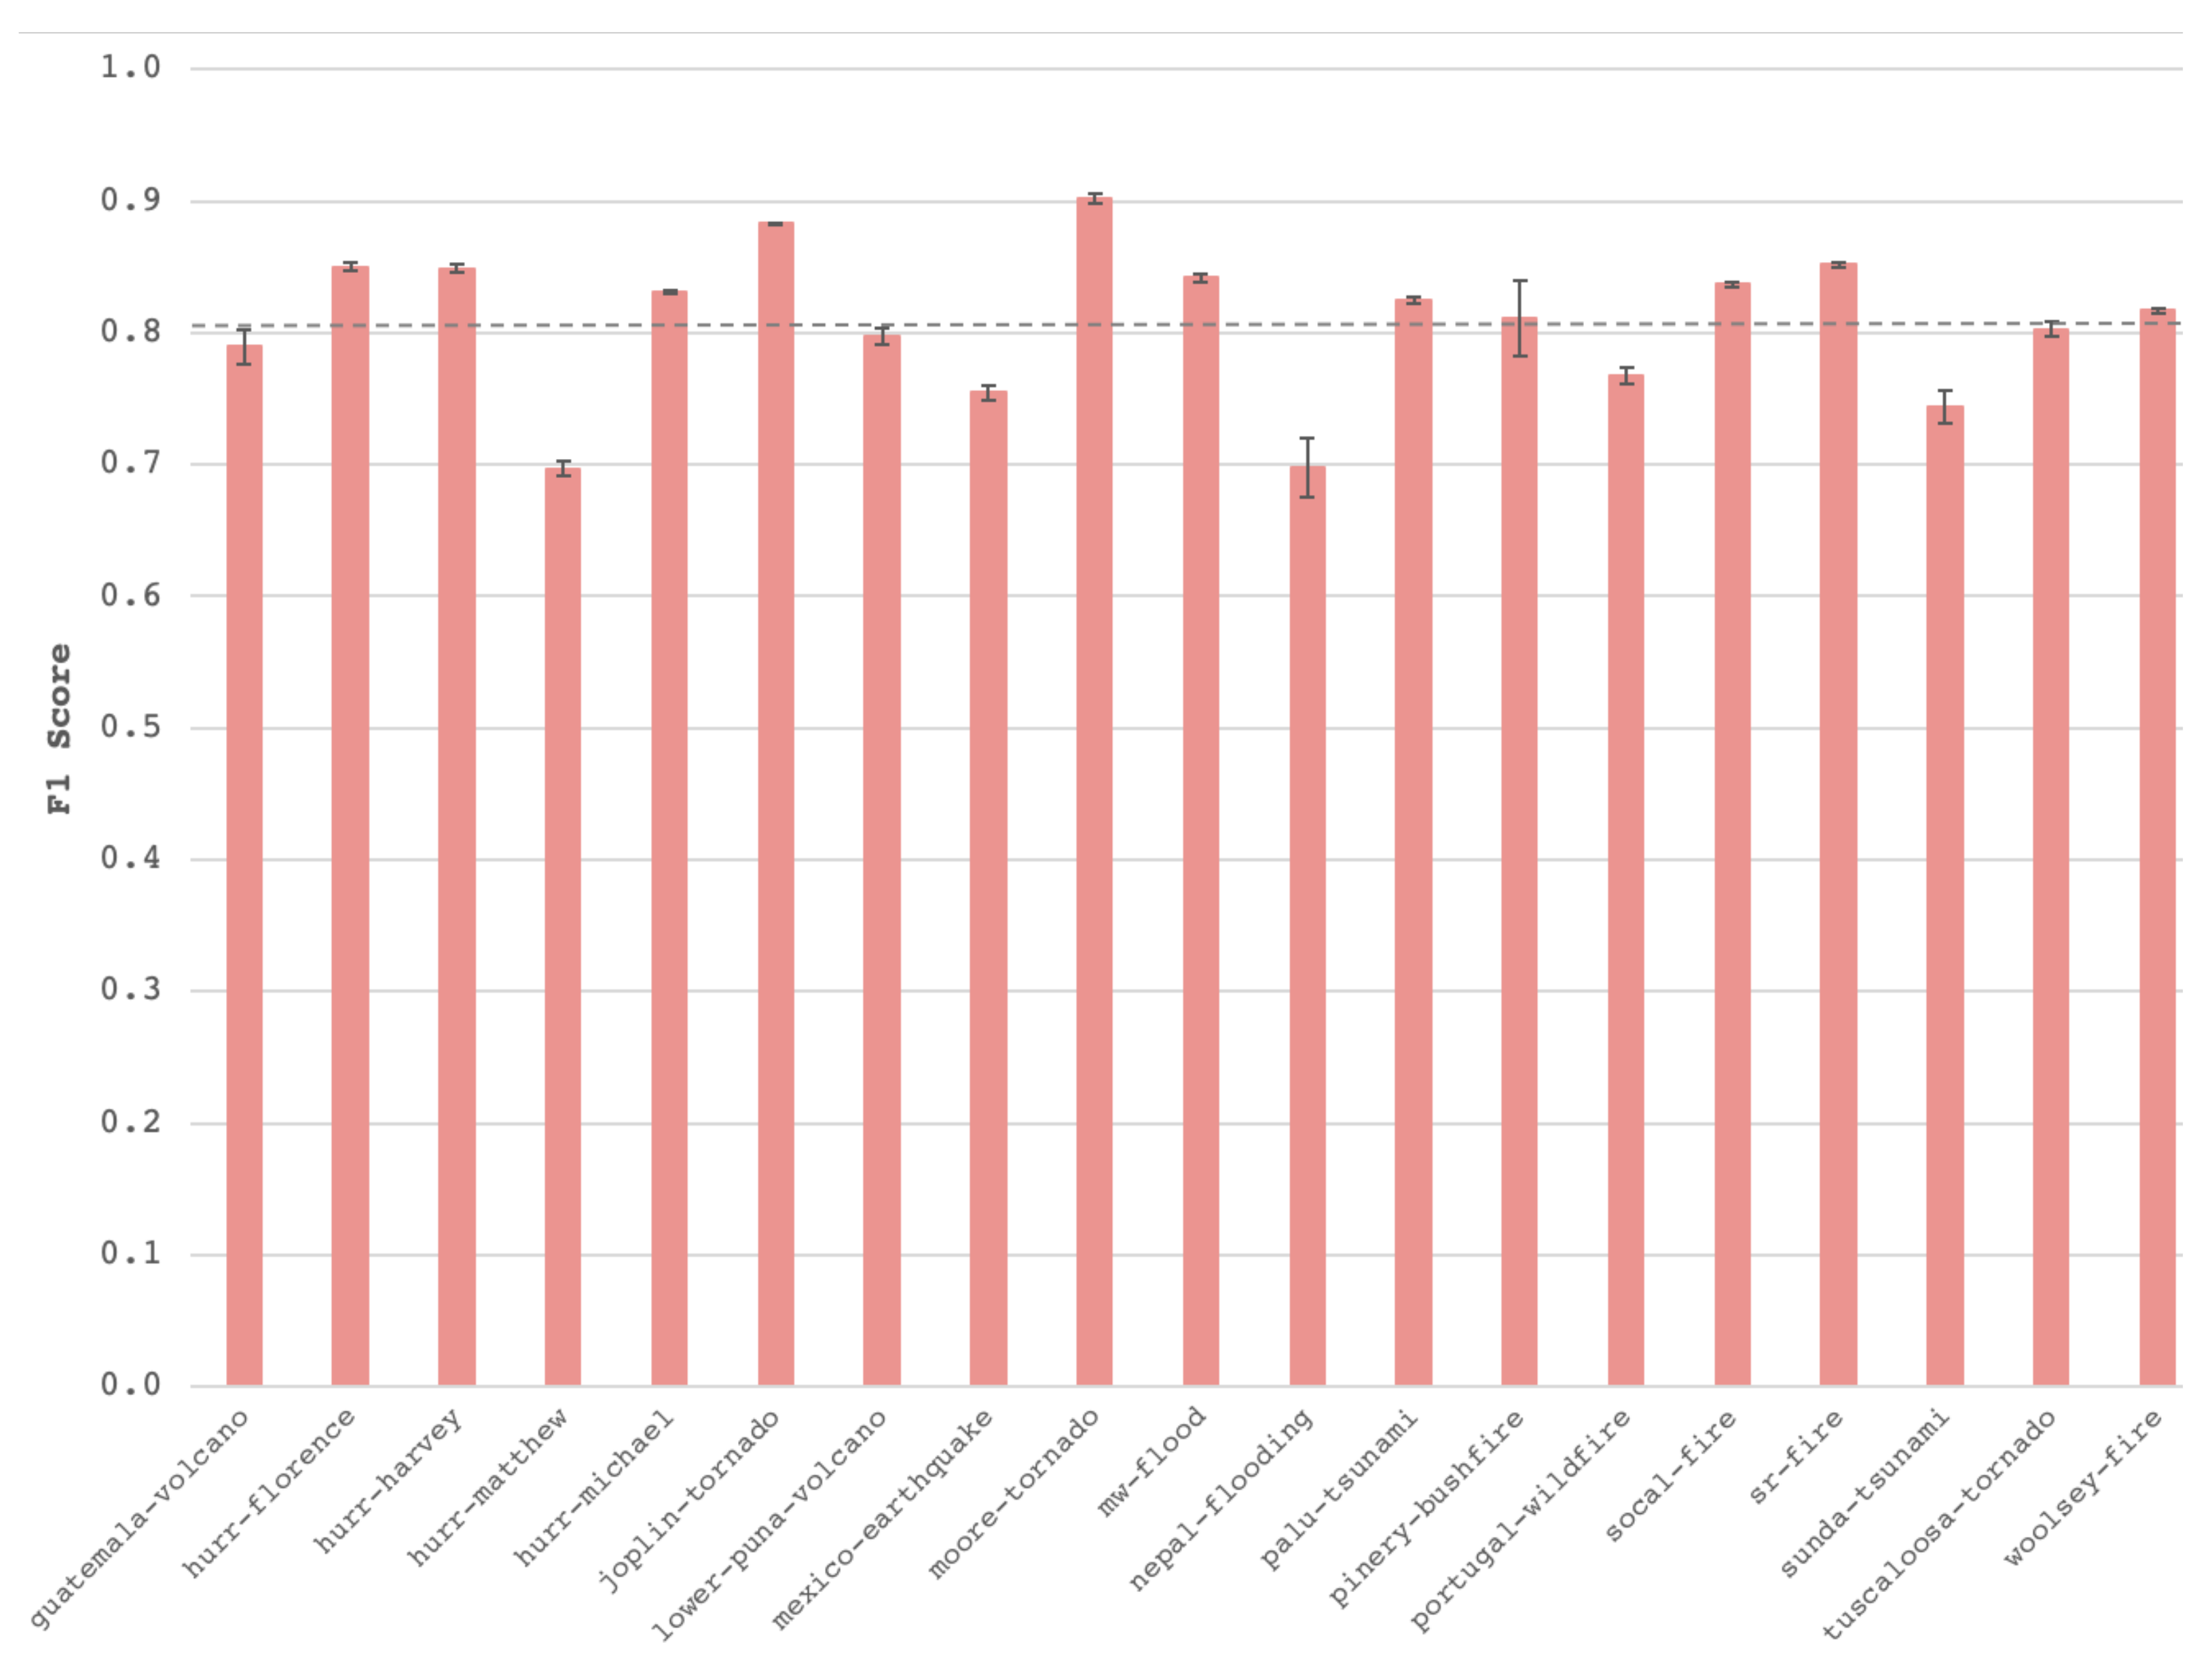
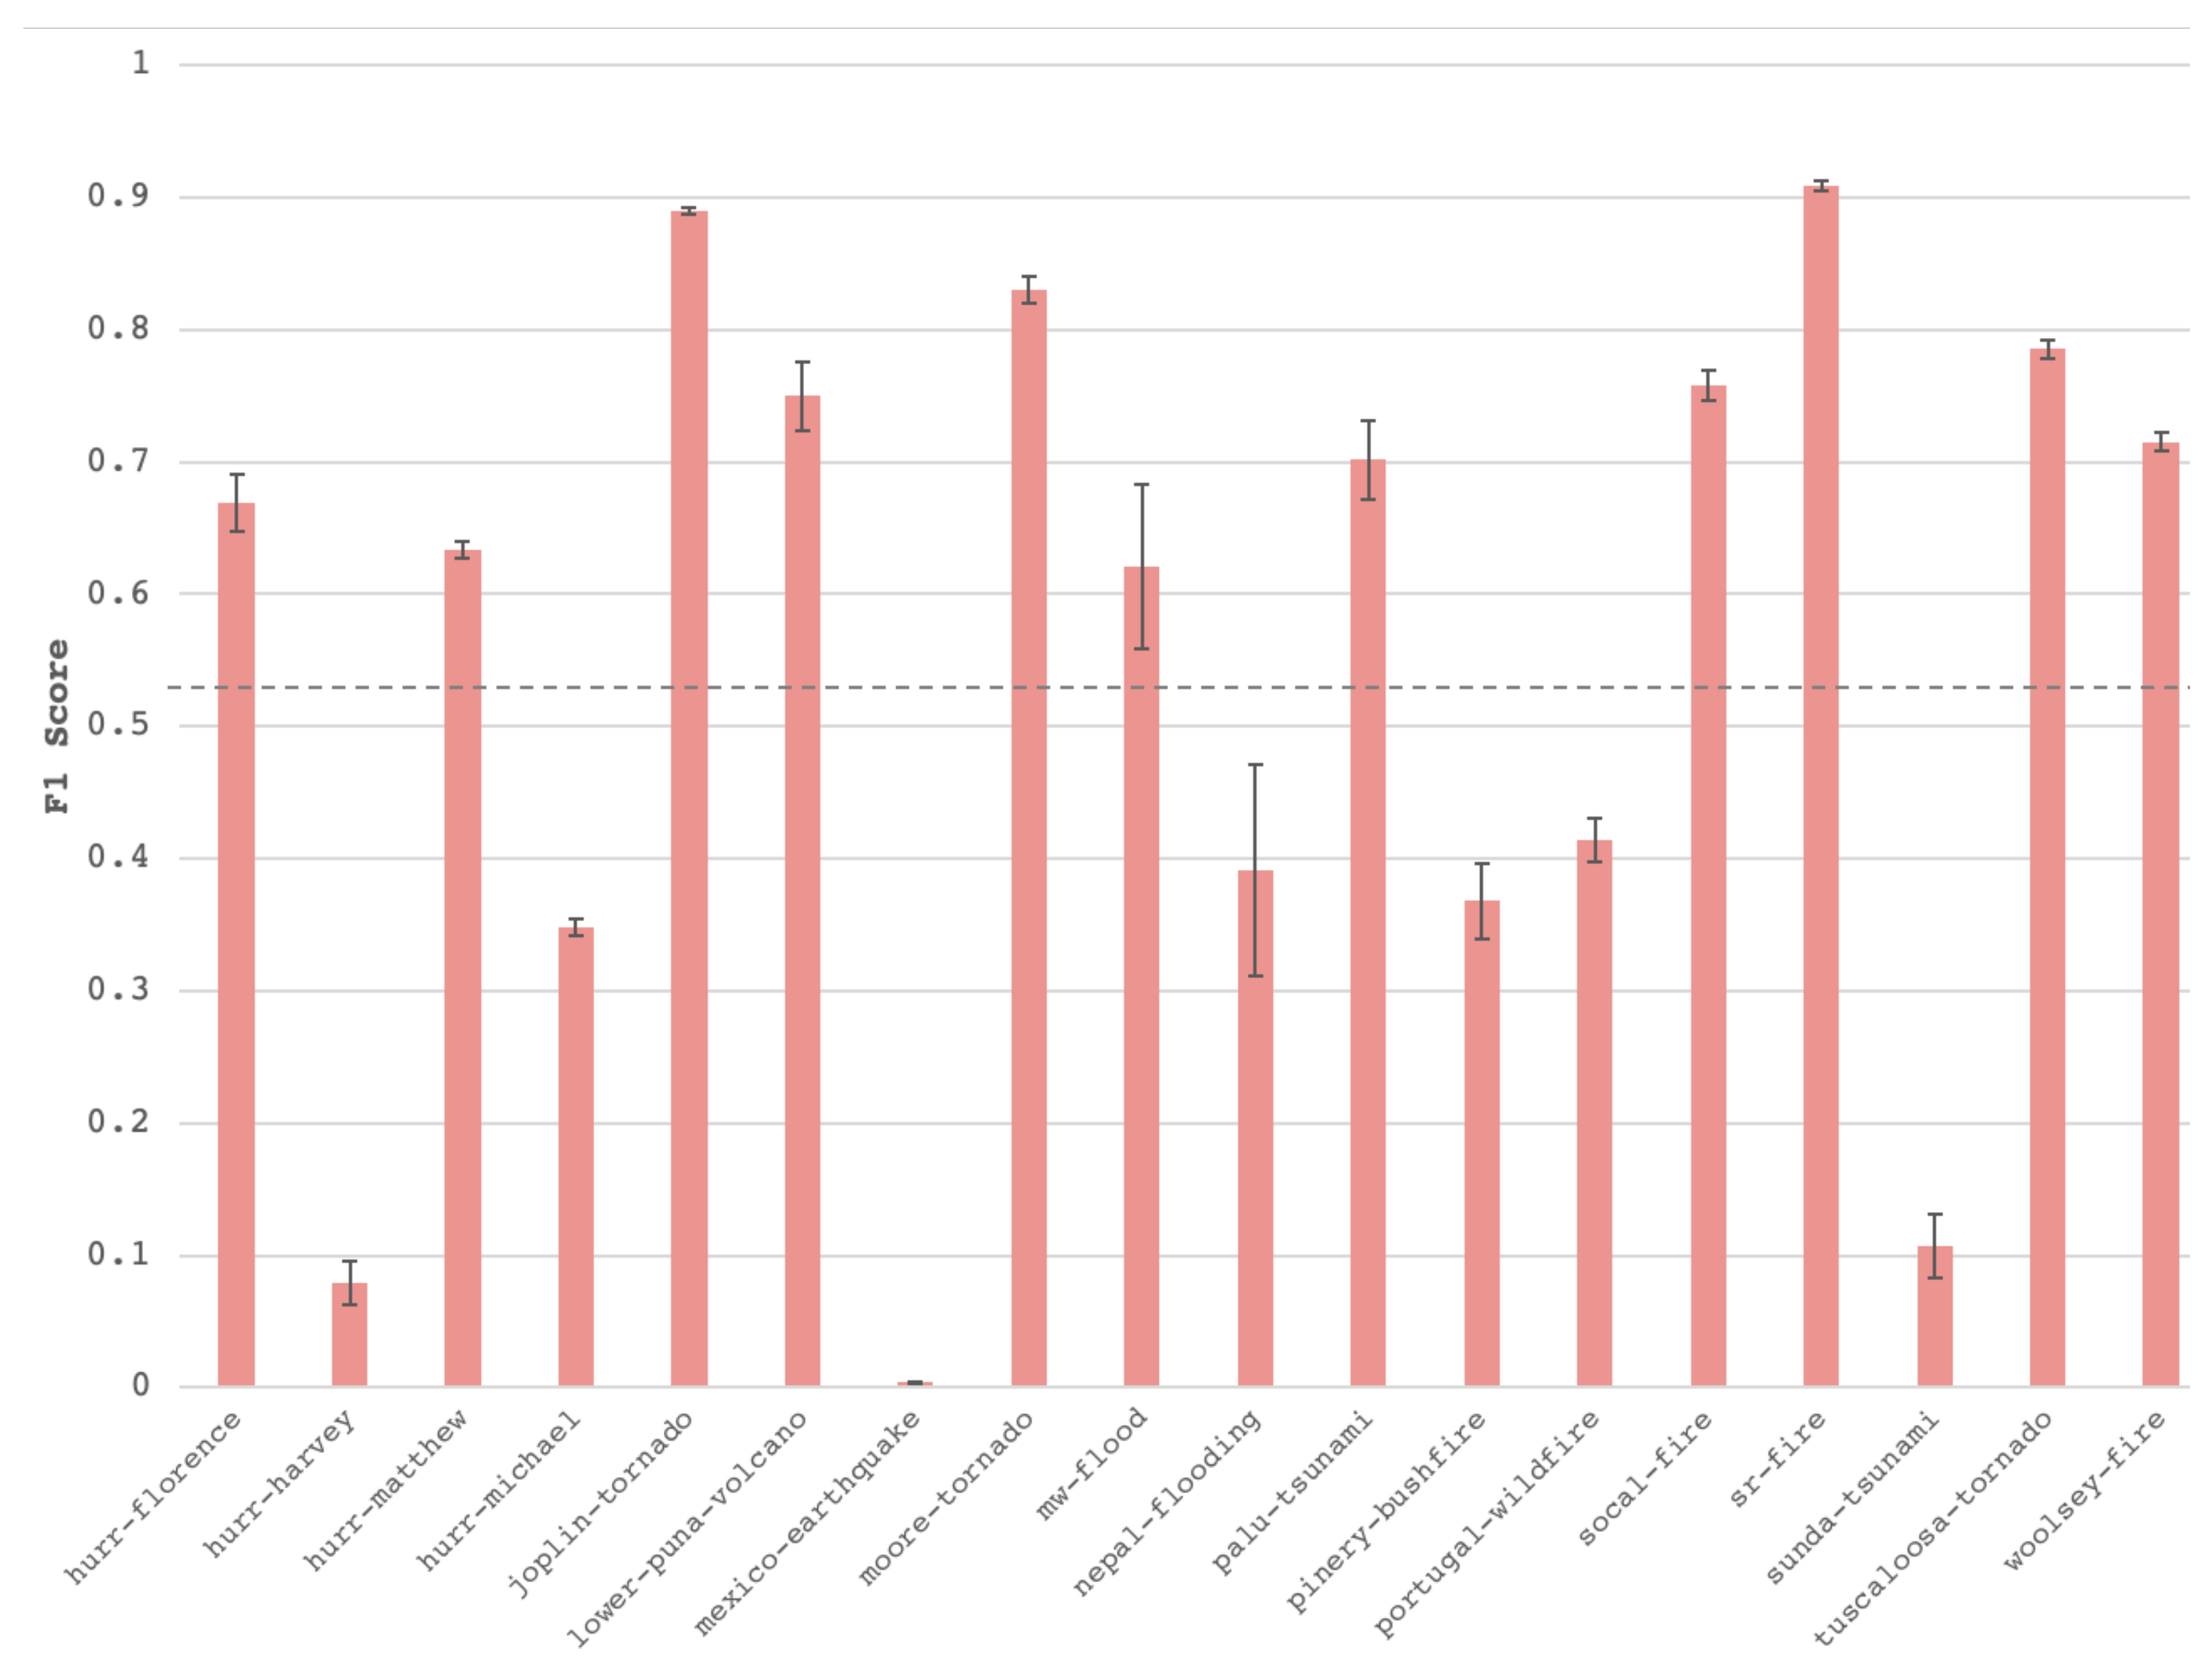
3.3. Damage Classification
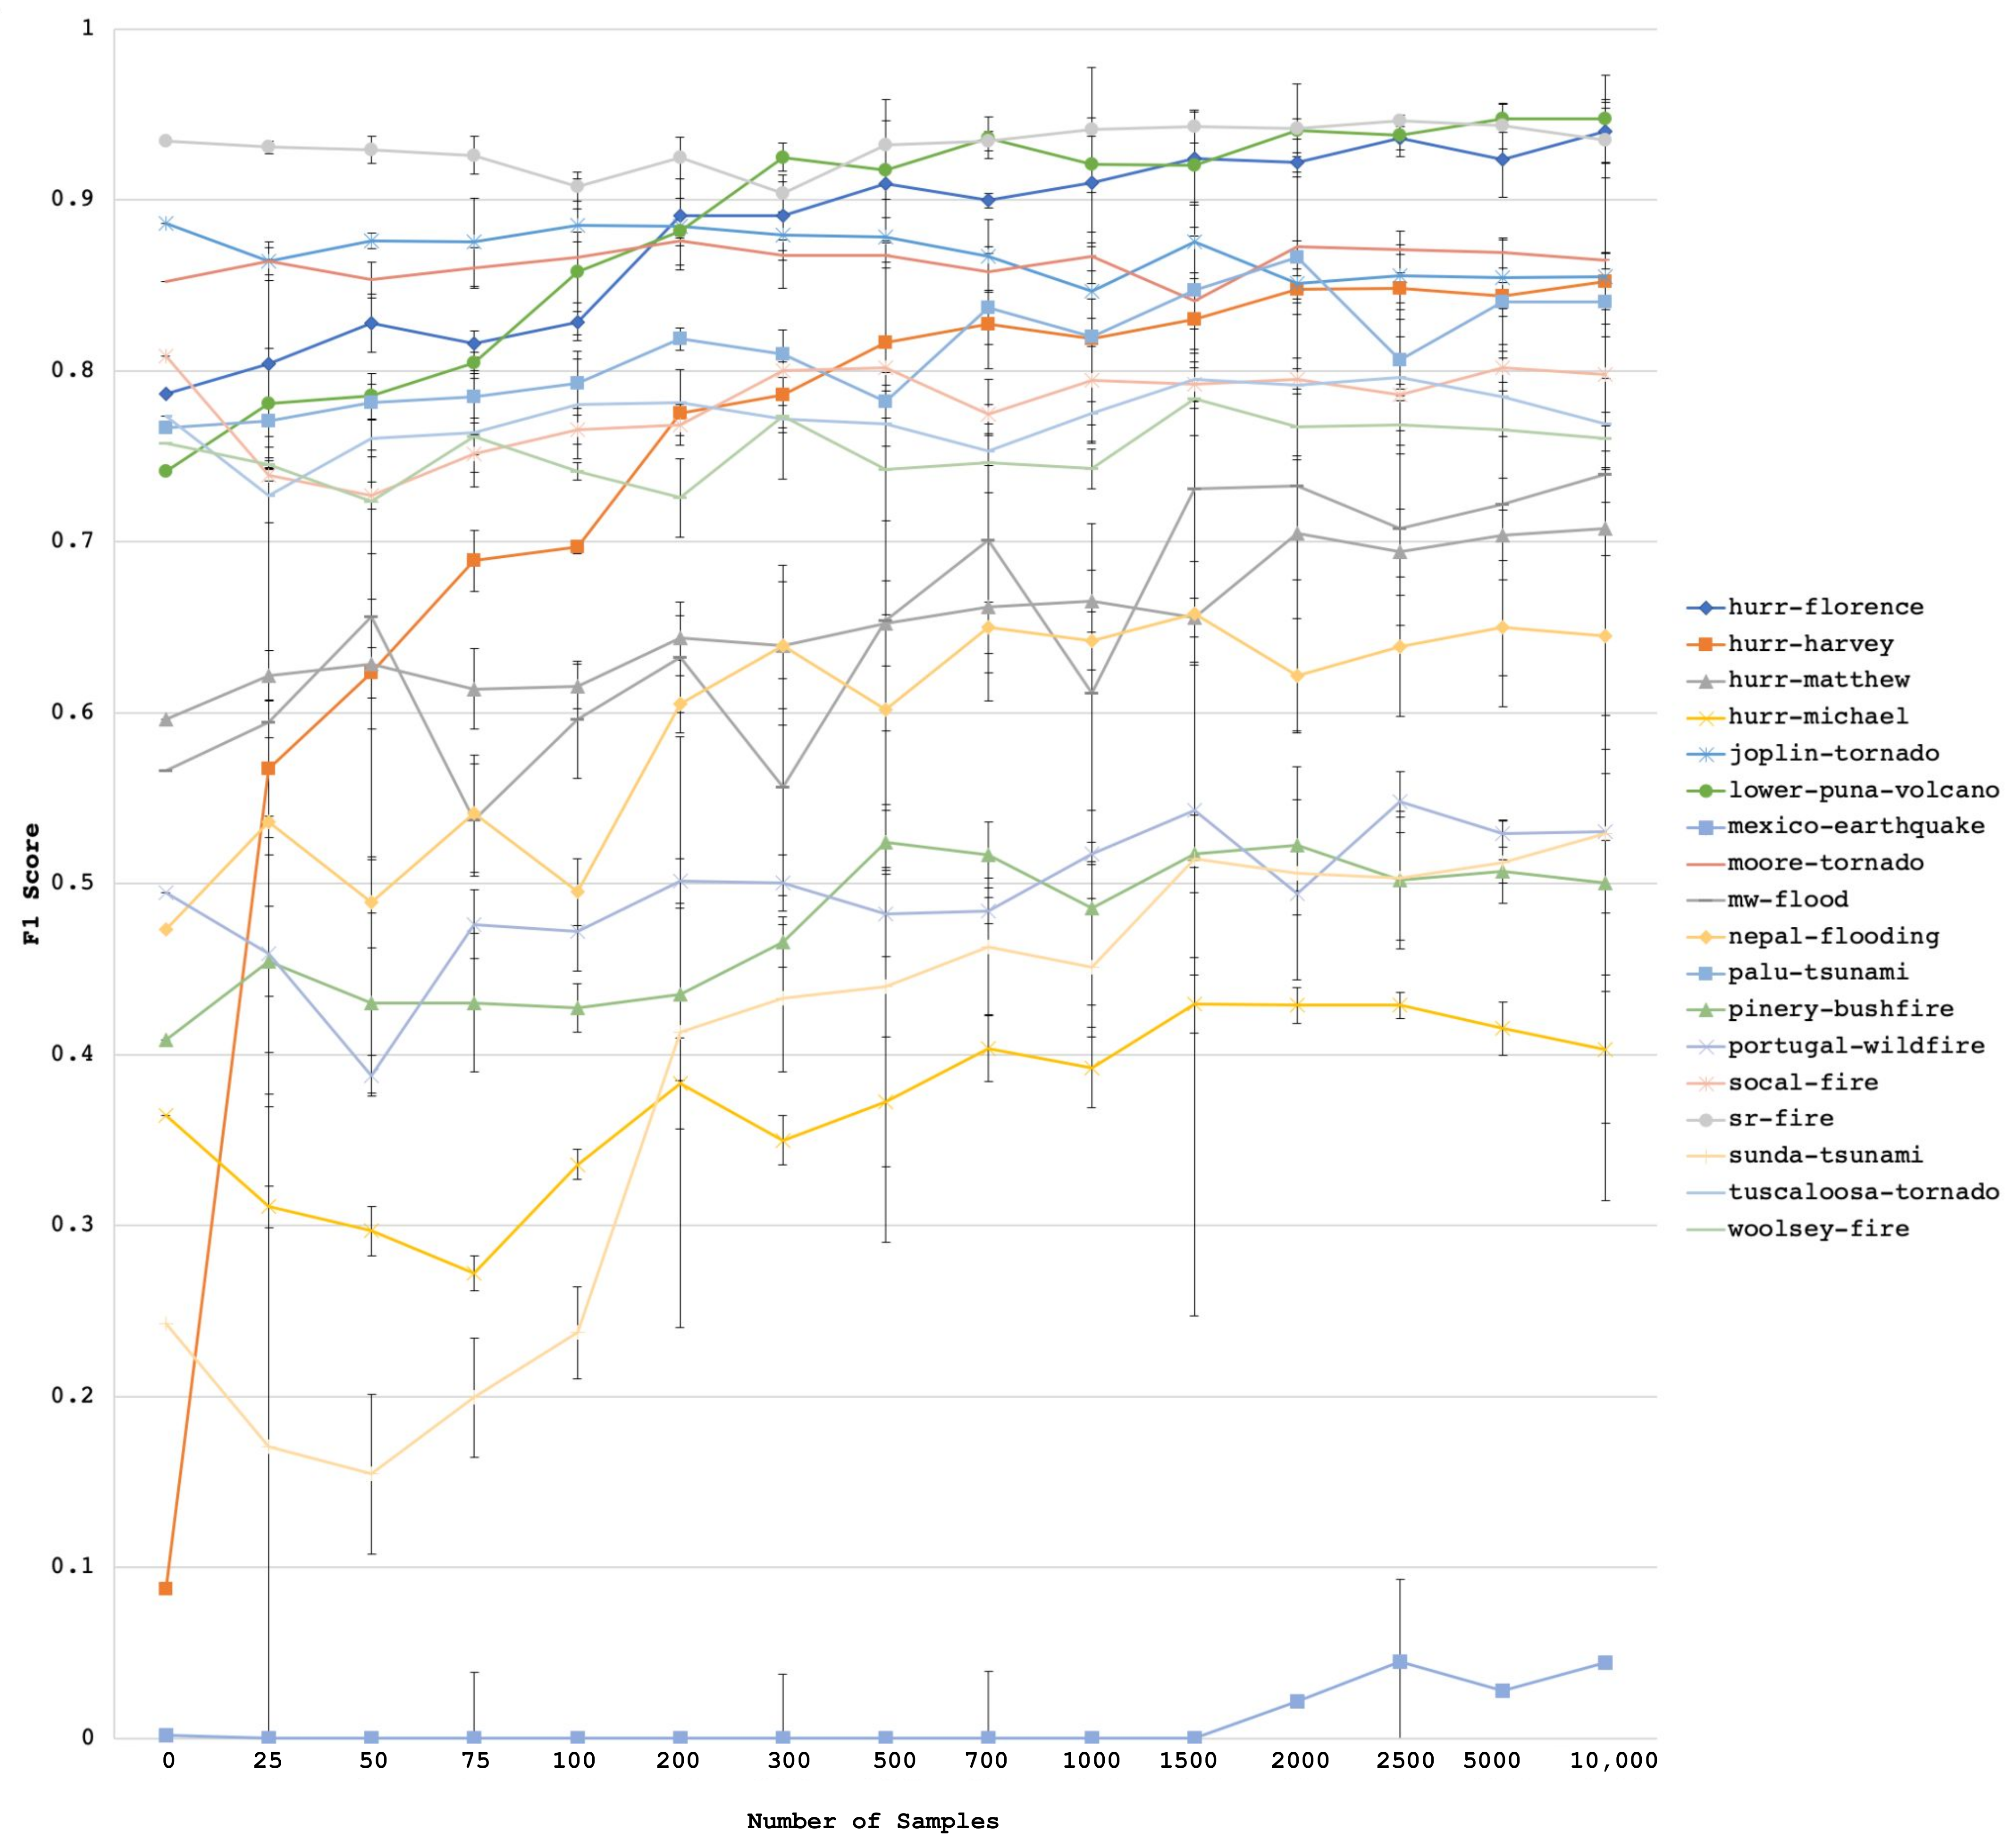
Figure 10 shows an ablation study over model capacity and streams fusion to determine the best architecture for DamageNet. Every data point represents the average performance over the three runs for each architecture, whereas the error bars represent the standard deviation. ResNet34, with the fusion of both streams after the first convolutional block, performs the best with good training stability. We use this architecture for all further experiments.
Figure 11 shows the performance of the model to predict building damage for each disaster event. The bar shows the average performance over the three runs, and the error bars the standard deviation. The average score across all disaster events is 0.590, which is represented by the dotted grey line. As shown by the error bars, the training of DamageNet converges to stable solutions across the different dataset events, with the highest standard deviation across the three runs being 0.048 for mw-flood.

Transfer Learning

Figure 12 shows the increasing performance of DamageNet for each disaster with a growing number of annotated samples. These results suggest that, given enough annotated samples from the current disaster event, DamageNet can predict damaged buildings: the model’s performance increases with the number of annotated samples until it reaches a plateau.
Table 4 presents the model’s performance before and after fine-tuning with 1500 annotated image samples. Out of the 18 natural disasters tested, there is only one where the performance slightly dropped (Joplin Tornado). That said, the score remains the same for four disaster events, and thirteen of them saw a considerable gain. The overall score is 0.594 with no fine-tuning, and 0.701 after fine-tuning with 1500 samples. In general, it seems fair to say that our method improves the model’s performance while keeping the delays reasonable and effective.

4. Discussion

4.1. Building Detection

The building detection model performs well on average and across disasters. Figure A1 and Figure A2 show the model predictions and their corresponding F 1 score.
The building detection task is independent of the disaster event since they can be identified from the pre-disaster imagery. Compared to damage classification, building detection is a relatively simple assignment: there is no temporal dimension involved. It is possible to identify buildings worldwide with different shapes and sizes. Climate also varies across locations. However, a building detection model quickly learns to ignore background pixels (snow, sand, grass, etc.) to focus on objects and structures. There are few objects or structures visible from satellite images. Roads, bridges, buildings, cars, and pools are the most common human-built structures, and a well-suited model can learn to extract features to discriminate between them.
Figure 9 indeed shows that the performance is reasonably uniform across all disasters. This suggests that it is possible to train a generic building detector to have it ready and prepared to make predictions when a new disaster occurs. The distribution shift is not significant between the training set and pre-disaster images from the area of interest of the last disaster. No annotation, fine-tuning, or adjustment is thus necessary to make predictions at test time.
By qualitatively assessing the model’s performance on the examples in Figure A1 and Figure A2, it is clear that the delineation of the buildings is not perfect. However, even with imprecise edges, buildings were detected; hence, their damage can be later assessed. In addition, building detection errors do not directly impact decision-making. Detecting edges becomes especially problematic when the building view is obstructed by tree canopies or clouds, for instance.
Nonetheless, entirely missing buildings can cause significant issues, as the damage classification model would ignore the building. However, in practice, data analysts do not look at precise numbers of damaged buildings; they are mostly interested in finding the hot spots or the most affected regions. Damaged buildings tend to be located within the same neighbourhood, and therefore skipping one building out of many is a tolerable error, as long as the recall does not influence the subsequent decisions. As per our visual observations of predicted buildings, we find that an F 1 score of 0.7 indicates that a fair number of buildings is detected, but that boundaries are not refined enough. The model stands above this threshold for almost all disaster events.
The five lowest performances are for hurr-matthew (Haiti), mexico-earthquake (Mexico), nepal-flooding (Nepal), portugal-wildfire (Portugal), and sunda-tsunami (Indonesia), for which the performance is below average. Lower performance is typically a result of distribution shifts. Those five disasters have common attributes. First, buildings tend to be smaller than average and, therefore, might be harder to detect. Their boundaries also tend to be blurrier, either because of the building density or the heterogeneous rooftop materials. These characteristics are specific to the location and the demographic of the region.
In addition, none of these five disasters occurred in the USA. As mentioned in the Methodology section, the xBD dataset contains mostly USA-based disaster events—an imbalance that biases the model against non-US locations. Unsurprisingly, the top five scores are for disaster events that happened in the USA: moore-tornado, joplin-tornado, sr-fire, hurr-florence, and hurr-harvey. It is essential to identify and mitigate these biases in such sensitive humanitarian applications. This is even more true when the model discriminates against more vulnerable populations, which have higher risk of food insecurity.
Having a building detector ready when a disaster arises simplifies the post-incident workflow. BuildingNet is pretrained in the pre-incident phase and makes predictions based on pre-disaster imagery. Hence, the inference can almost immediately start to predict the buildings’ locations. Upon the reception of post-disaster imagery, buildings’ areas are already known.

4.2. Damage Classification

Damage classification is a much more complicated task for two main reasons. First, the task involves a temporal dimension that is too diverse and hard to capture with the current sample size. Beyond that, the model must not only learn to ignore some of the temporal changes when they relate to season, but also discriminate over other temporal changes when they relate to damage. This is particularly complex for the model with no prior knowledge of the geographical region and the expected climate or disaster type as well as the expected damage. Damages may have very diverse definitions and representations, depending on the disaster type and the pre-incident environment. Hence, seizing the temporal changes and the variety of damages requires a larger sample size than that of the xDB dataset.
As expected, the xBD dataset does not seem to encompass enough diversity to train a generic damage classification model (Figure 11). The pretrained model results suggest that some disaster event test samples are out of distribution with respect to the training set; the model does not understand what damages look like in the current test disaster context. The performance across disasters is indeed far from uniform.
Disasters where the model performs the worst (hurr-harvey, sunda-tsunami, hurr-michael) are more challenging. First, these disaster events result mainly in peripheral damages, i.e., they are visible on the building’s surroundings, which may be easily confused with seasonal changes. Moreover, hurr-michael damages are very subtle and human annotation might be noisy. Similarly, hurr-harvey and sunda-tsunami buildings are partially or entirely obstructed either by trees or clouds, making the assignment more difficult. Note that mexico-earthquake results are not considered since there are too few positive samples (22 damaged buildings against 35,164 negatives) for the score to be significant.
Conversely, disaster events for which DamageNet performs well are defined by heavy, structural damages. Disaster events sr-fire, joplin-tornado, moore-tornado, and socal-fire leave buildings either intact or destroyed, and can be easily classified.
These unsatisfactory results suggest that the model should be fine-tuned to learn features from the current disaster event. Accordingly, these results invalidate the proposed training strategy on past disaster samples and need further tuning to predict the current disaster’s damage.

Transfer Learning

Since pretraining DamageNet on past disaster event samples is not sufficient for the model to generalize to the current disaster, we established a strategy to fine-tune the model weights but still limit the post-incident execution time. The goal is to readjust DamageNet weight with the current disaster event images. We propose to use standard transfer learning method with supervised fine-tuning. It relies on the human annotation of the current disaster event (Figure 13). Because it depends on post-disaster satellite imagery reception, annotation ought to be performed in the post-incident execution phase.
As illustrated in Figure 13, DamageNet is first pretrained on all past disaster events. Then, upon reception of recent satellite images, a minimal number of building samples are annotated for damage classification. Finally, DamageNet is trained again on the current disaster samples to adjust the model’s weights on the current disaster features.
Nonetheless, annotation is highly time-consuming, and the annotation of current disaster samples necessarily takes place after the event. To be consistent with the objective of minimizing the post-execution incident phase, fine-tuning a model should require as few training samples as possible. Therefore, to reduce the annotation effort to its bare minimum, we estimated the number of annotated building samples required to train a model for damage classification.
The distribution of damage classes per disaster confounds the comparison of the minimum number of annotated samples required. Fine-tuning indeed requires both positive and negative samples (or damaged and undamaged buildings). For instance, mw-flood and sunda-tsunami contain fewer damaged buildings in proportion compared to the average (see Figure 2), explaining the fine-tuning approach’s instability for these events. For that same reason, training is also fairly unstable with less than 100 samples.
The supervised fine-tuning method did not seem to hurt the performance for any of the disasters, and for most of them, there is no significant gain past 1500 annotated samples. On average, the disaster represented in the xBD dataset covers roughly 19,000 potentially damaged buildings. Based on visual assessment and after consulting with our domain experts from WFP, we consider that an F 1 score below 0.6 is unacceptable, while above 0.7 is within the error tolerance for operational purposes. Regarding those scores, the performance stagnates to scores below the acceptance level for disasters such as hurr-michael, sunda-tsunami, pinery-bushfire, and portugal-wildfire. These disasters’ scores were among the lowest before fine-tuning and the method did improve those scores. However, results suggest that the training distribution is too far from the test distribution for the weights to simply be readjusted with few samples. In contrast, hurr-harvey, which also had a low initial score, impressively benefits from the fine-tuning approach with very few samples.
The fine-tuning method saves considerable time compared to manual annotation (Figure 14). The approach relies on the pretraining of DamageNet in the pre-incident preparation phase; however, it still involves tedious annotation. Depending on the number of samples to annotate, the duration of the method varies greatly.
The results show that xBD alone is not diverse enough to help with damage classification within the proposed workflow. Some more straightforward use cases (sr-fire, joplin-tornado, and more) proved the method’s feasibility. However, the performance level is still not convincing enough among all disaster events for such a solution to be deployed in an emergency. Although data gathering and annotation are tedious, the time investment is essential for the long-term applicability of machine learning in supporting damage assessment. Additional data should include more instances of damage types and season changes.

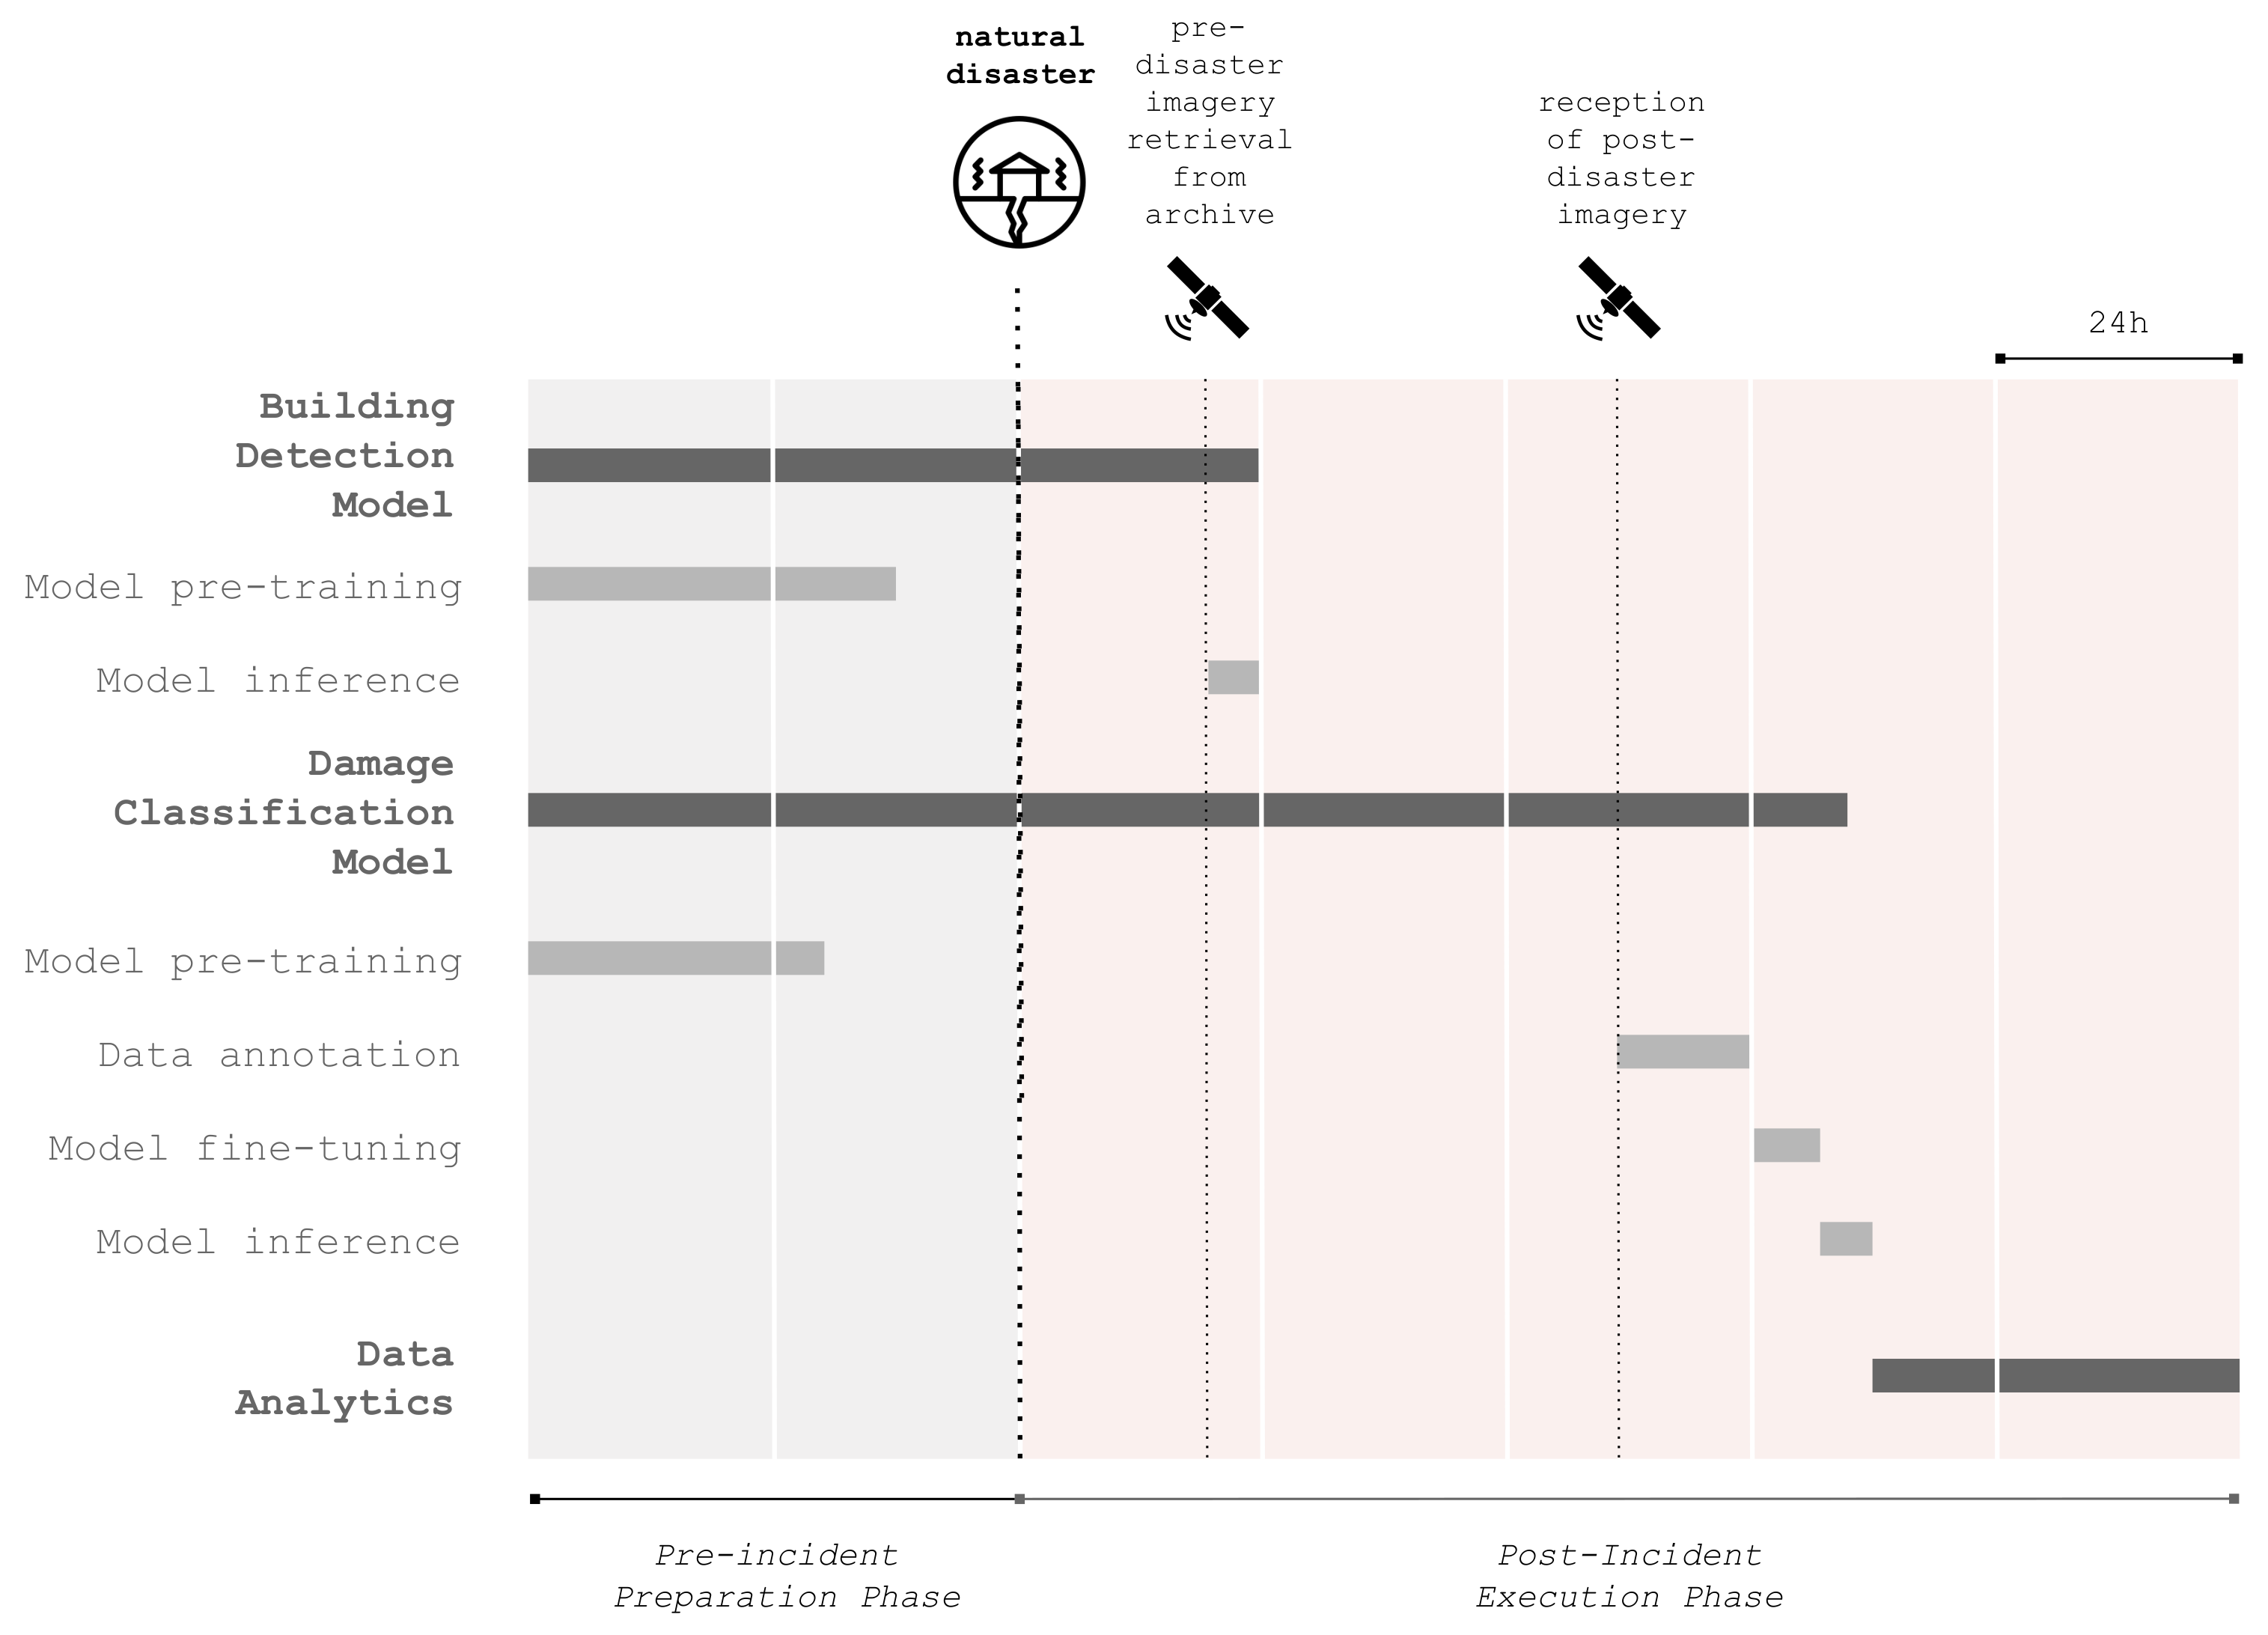
4.3. Proposed Incident Workflow

Figure 15 summarizes the final incident workflow supported by machine learning. In the pre-incident phase, both the building detection and damage classification models are pretrained in order to be ready to be queried at any time. The post-incident execution phase is triggered by the acknowledgement of a natural disaster. Quickly, the pre-disaster satellite images are retrieved, and the building detection model can predict the building locations in the area under investigation. Once building locations are known, the process awaits post-disaster satellite imagery. Only then can the damage classification process start. First, a minimum of 1500 buildings are annotated with damage classification: damage or no damage. Then, the damage classification model is fine-tuned and ready to infer damages for the entire affected area.
Ultimately, produced damage maps and demographic data are paired and analyzed to extract relevant information and support decision-making.

5. Conclusions

Natural disasters make affected populations vulnerable, potentially affecting their shelter and access to clean water and food. Humanitarian organizations play a critical role in rescuing and assisting people at risk, demanding a high level of preparedness and exemplary processes. Building damage assessment is the process by which humanitarian authorities identify areas of significant concerns. It directly informs decision-making to mobilize resources in these critical situations.
In this work, we proposed to leverage machine learning techniques to optimize the post-incident workflow with a two-step model approach composed of a building detector and a damage classifier. We have shown that our approach effectively shortens the damage assessment process compared to the manual annotation of satellite images. Our approach is designed for emergency context and takes into account time and data limitations.
First, we have shown that building detection is generalizable across locations. As a result, the building detector training may be performed during the pre-incident preparation phase, and the model may infer building location immediately after the event. However, our experiments showed a bias towards locations that are over-represented in the training set. Therefore, we advocate for a dataset intentionally sampled regarding population overexposed to natural disasters. Future work for building detection should focus on training on a more extensive collection of images annotated with building polygons and, more importantly, on more balanced datasets.
In addition, we have recognized through our extensive experiments across locations that damage classification is a high-dimensional problem that must be handled as a domain adaptation problem. A model solely trained on past disaster events is not guaranteed to detect damages on a newly unfolding disaster event. The diversity in climate, disaster type, and seasonal changes would require a massive dataset: the 18 disaster events represented in the xBD dataset are insufficient to represent the global diversity. We think that annotated data for damage assessment still represents a critical bottleneck in developing machine learning models for production. To overcome this, we proposed to fine-tune the model’s weights on the current disaster events. The approach boosted the model performance with only 1500 annotated buildings, representing roughly 8% of the average coverage. In practice, this significantly reduces the time to respond to a natural disaster compared to manual annotation.
Nevertheless, we believe that unsupervised or weakly supervised domain adaptation approaches are well suited for urgent situations and should be considered for further investigation [64,65,66]. The damage detection task is tightly coupled to the emergency context; therefore, any effort to increase the performance should consider the post-disaster execution time equally. Ultimately, the combination of multiple sources of information (drone and multi-spectral remote sensing, social media posts, etc.) may provide a more complete overview of the situation.
Finally, disaster relief deserves the scientific and research community’s attention to contribute to the humanitarian effort. Through this work, we aim to raise awareness in the machine learning community for the challenges of applying deep learning in humanitarian assistance and disaster response. It is crucial to design solutions with operational conditions in mind and to acknowledge the diversity of the damages caused by natural disasters.

Author Contributions

Conceptualization, I.B., M.-È.R., D.A. and F.K.; formal analysis, I.B.; investigation, I.B.; methodology: I.B., software: I.B., supervision: F.K.; writing—original draft: I.B.; writing—review and editing: M.-È.R., D.A. and F.K. All authors have read and agreed to the published version of the manuscript.

Funding

This project was funded by the Institute for Data Valorisation (IVADO) and the Canada Research Chair in Humanitarian Supply Chain Analytics. This support is gratefully acknowledged. F.K. was supported by the Alan Turing Institute.

Data Availability Statement

Data supporting the findings of this study are available from the author I.B. on request.

Acknowledgments

We give a very special thanks to Marco Codastefano and Thierry Crevoisier from the World Food Programme for their continuous feedback during the course of this project. We would also like to acknowledge the contribution of Element AI who provided resources throughout the project.

Conflicts of Interest

The authors declare no conflict of interest.

Appendix A. BuildingNet Results

Figure A1. Pre-disaster samples from different disaster events along with the ground-truth and BuildingNet prediction. Samples are from the five disaster events on which BuildingNet performs the worst.
Remotesensing 14 02532 g0a1
Figure A2. Pre-disaster samples from different disaster events along with the ground-truth and BuildingNet prediction. Samples are from the five disaster events on which BuildingNet performs the worst.
Remotesensing 14 02532 g0a2

References

  1. Voigt, S.; Giulio-Tonolo, F.; Lyons, J.; Kučera, J.; Jones, B.; Schneiderhan, T.; Platzeck, G.; Kaku, K.; Hazarika, M.K.; Czaran, L.; et al. Global trends in satellite-based emergency mapping. Science 2016, 353, 247–252. [Google Scholar] [CrossRef] [PubMed]
  2. Ben-David, S.; Blitzer, J.; Crammer, K.; Kulesza, A.; Pereira, F.; Vaughan, J.W. A theory of learning from different domains. Mach. Learn. 2010, 79, 151–175. [Google Scholar] [CrossRef] [Green Version]
  3. Rolnick, D.; Donti, P.L.; Kaack, L.H.; Kochanski, K.; Lacoste, A.; Sankaran, K.; Ross, A.S.; Milojevic-Dupont, N.; Jaques, N.; Waldman-Brown, A.; et al. Tackling climate change with machine learning. arXiv 2019, arXiv:1906.05433. [Google Scholar]
  4. Rausch, L.; Friesen, J.; Altherr, L.C.; Meck, M.; Pelz, P.F. A holistic concept to design optimal water supply infrastructures for informal settlements using remote sensing data. Remote Sens. 2018, 10, 216. [Google Scholar] [CrossRef] [Green Version]
  5. Kogan, F. Remote Sensing for Food Security; Springer: Berlin/Heidelberg, Germany, 2019. [Google Scholar]
  6. Nielsen, M.M. Remote sensing for urban planning and management: The use of window-independent context segmentation to extract urban features in Stockholm. Comput. Environ. Urban Syst. 2015, 52, 1–9. [Google Scholar] [CrossRef]
  7. Filipponi, F. Exploitation of sentinel-2 time series to map burned areas at the national level: A case study on the 2017 italy wildfires. Remote Sens. 2019, 11, 622. [Google Scholar] [CrossRef] [Green Version]
  8. Foody, G.M. Remote sensing of tropical forest environments: Towards the monitoring of environmental resources for sustainable development. Int. J. Remote Sens. 2003, 24, 4035–4046. [Google Scholar] [CrossRef]
  9. Schumann, G.J.; Brakenridge, G.R.; Kettner, A.J.; Kashif, R.; Niebuhr, E. Assisting flood disaster response with earth observation data and products: A critical assessment. Remote Sens. 2018, 10, 1230. [Google Scholar] [CrossRef] [Green Version]
  10. Alshehhi, R.; Marpu, P.R.; Woon, W.L.; Dalla Mura, M. Simultaneous extraction of roads and buildings in remote sensing imagery with convolutional neural networks. ISPRS J. Photogramm. Remote Sens. 2017, 130, 139–149. [Google Scholar] [CrossRef]
  11. Shrestha, S.; Vanneschi, L. Improved fully convolutional network with conditional random fields for building extraction. Remote Sens. 2018, 10, 1135. [Google Scholar] [CrossRef] [Green Version]
  12. Huang, J.; Zhang, X.; Xin, Q.; Sun, Y.; Zhang, P. Automatic building extraction from high-resolution aerial images and LiDAR data using gated residual refinement network. ISPRS J. Photogramm. Remote Sens. 2019, 151, 91–105. [Google Scholar] [CrossRef]
  13. Yuan, J. Learning building extraction in aerial scenes with convolutional networks. IEEE Trans. Pattern Anal. Mach. Intell. 2017, 40, 2793–2798. [Google Scholar] [CrossRef] [PubMed]
  14. Liu, P.; Liu, X.; Liu, M.; Shi, Q.; Yang, J.; Xu, X.; Zhang, Y. Building footprint extraction from high-resolution images via spatial residual inception convolutional neural network. Remote Sens. 2019, 11, 830. [Google Scholar] [CrossRef] [Green Version]
  15. Liu, Y.; Gross, L.; Li, Z.; Li, X.; Fan, X.; Qi, W. Automatic building extraction on high-resolution remote sensing imagery using deep convolutional encoder-decoder with spatial pyramid pooling. IEEE Access 2019, 7, 128774–128786. [Google Scholar] [CrossRef]
  16. Ma, J.; Wu, L.; Tang, X.; Liu, F.; Zhang, X.; Jiao, L. Building extraction of aerial images by a global and multi-scale encoder-decoder network. Remote Sens. 2020, 12, 2350. [Google Scholar] [CrossRef]
  17. Xie, Y.; Zhu, J.; Cao, Y.; Feng, D.; Hu, M.; Li, W.; Zhang, Y.; Fu, L. Refined extraction of building outlines from high-resolution remote sensing imagery based on a multifeature convolutional neural network and morphological filtering. IEEE J. Sel. Top. Appl. Earth Obs. Remote Sens. 2020, 13, 1842–1855. [Google Scholar] [CrossRef]
  18. Guo, H.; Shi, Q.; Du, B.; Zhang, L.; Wang, D.; Ding, H. Scene-driven multitask parallel attention network for building extraction in high-resolution remote sensing images. IEEE Trans. Geosci. Remote Sens. 2020, 59, 4287–4306. [Google Scholar] [CrossRef]
  19. Guo, H.; Shi, Q.; Marinoni, A.; Du, B.; Zhang, L. Deep building footprint update network: A semi-supervised method for updating existing building footprint from bi-temporal remote sensing images. Remote Sens. Environ. 2021, 264, 112589. [Google Scholar] [CrossRef]
  20. Cooner, A.J.; Shao, Y.; Campbell, J.B. Detection of urban damage using remote sensing and machine learning algorithms: Revisiting the 2010 Haiti earthquake. Remote Sens. 2016, 8, 868. [Google Scholar] [CrossRef] [Green Version]
  21. Fujita, A.; Sakurada, K.; Imaizumi, T.; Ito, R.; Hikosaka, S.; Nakamura, R. Damage detection from aerial images via convolutional neural networks. In Proceedings of the 2017 Fifteenth IAPR International Conference on Machine Vision Applications (MVA), Nagoya, Japan, 8–12 May 2017; pp. 5–8. [Google Scholar]
  22. Sublime, J.; Kalinicheva, E. Automatic post-disaster damage mapping using deep-learning techniques for change detection: Case study of the Tohoku tsunami. Remote Sens. 2019, 11, 1123. [Google Scholar] [CrossRef] [Green Version]
  23. Doshi, J.; Basu, S.; Pang, G. From satellite imagery to disaster insights. arXiv 2018, arXiv:1812.07033. [Google Scholar]
  24. Van Etten, A.; Lindenbaum, D.; Bacastow, T.M. Spacenet: A remote sensing dataset and challenge series. arXiv 2018, arXiv:1807.01232. [Google Scholar]
  25. Demir, I.; Koperski, K.; Lindenbaum, D.; Pang, G.; Huang, J.; Basu, S.; Hughes, F.; Tuia, D.; Raskar, R. Deepglobe 2018: A challenge to parse the earth through satellite images. In Proceedings of the IEEE Conference on Computer Vision and Pattern Recognition Workshops, Salt Lake City, UT, USA, 18–22 June 2018; pp. 172–181. [Google Scholar]
  26. Gupta, R.; Hosfelt, R.; Sajeev, S.; Patel, N.; Goodman, B.; Doshi, J.; Heim, E.; Choset, H.; Gaston, M. xbd: A dataset for assessing building damage from satellite imagery. arXiv 2019, arXiv:1911.09296. [Google Scholar]
  27. Durnov, V. Github—DIUx-xView/xView2_first_place: 1st Place Solution for ’xView2: Assess Building Damage’ Challenge. Available online: https://github.com/DIUx-xView/xView2_first_place (accessed on 1 March 2020).
  28. Shao, J.; Tang, L.; Liu, M.; Shao, G.; Sun, L.; Qiu, Q. BDD-Net: A General Protocol for Mapping Buildings Damaged by a Wide Range of Disasters Based on Satellite Imagery. Remote Sens. 2020, 12, 1670. [Google Scholar] [CrossRef]
  29. Gupta, R.; Shah, M. Rescuenet: Joint building segmentation and damage assessment from satellite imagery. arXiv 2020, arXiv:2004.07312. [Google Scholar]
  30. Weber, E.; Kané, H. Building disaster damage assessment in satellite imagery with multi-temporal fusion. arXiv 2020, arXiv:2004.05525. [Google Scholar]
  31. Hao, H.; Baireddy, S.; Bartusiak, E.R.; Konz, L.; LaTourette, K.; Gribbons, M.; Chan, M.; Comer, M.L.; Delp, E.J. An attention-based system for damage assessment using satellite imagery. arXiv 2020, arXiv:2004.06643. [Google Scholar]
  32. Shen, Y.; Zhu, S.; Yang, T.; Chen, C. Cross-directional Feature Fusion Network for Building Damage Assessment from Satellite Imagery. arXiv 2020, arXiv:2010.14014. [Google Scholar]
  33. Boin, J.B.; Roth, N.; Doshi, J.; Llueca, P.; Borensztein, N. Multi-class segmentation under severe class imbalance: A case study in roof damage assessment. arXiv 2020, arXiv:2010.07151. [Google Scholar]
  34. Khvedchenya, E.; Gabruseva, T. Fully convolutional Siamese neural networks for buildings damage assessment from satellite images. arXiv 2021, arXiv:2111.00508. [Google Scholar]
  35. Xiao, H.; Peng, Y.; Tan, H.; Li, P. Dynamic Cross Fusion Network for Building-Based Damage Assessment. In Proceedings of the 2021 IEEE International Conference on Multimedia and Expo (ICME), Shenzhen, China, 5–9 July 2021; pp. 1–6. [Google Scholar]
  36. Shen, Y.; Zhu, S.; Yang, T.; Chen, C.; Pan, D.; Chen, J.; Xiao, L.; Du, Q. Bdanet: Multiscale convolutional neural network with cross-directional attention for building damage assessment from satellite images. IEEE Trans. Geosci. Remote Sens. 2021, 60, 1–14. [Google Scholar] [CrossRef]
  37. Calton, L.; Wei, Z. Using Artificial Neural Network Models to Assess Hurricane Damage through Transfer Learning. Appl. Sci. 2022, 12, 1466. [Google Scholar] [CrossRef]
  38. Xu, J.Z.; Lu, W.; Li, Z.; Khaitan, P.; Zaytseva, V. Building damage detection in satellite imagery using convolutional neural networks. arXiv 2019, arXiv:1910.06444. [Google Scholar]
  39. Valentijn, T.; Margutti, J.; van den Homberg, M.; Laaksonen, J. Multi-hazard and spatial transferability of a cnn for automated building damage assessment. Remote Sens. 2020, 12, 2839. [Google Scholar] [CrossRef]
  40. Benson, V.; Ecker, A. Assessing out-of-domain generalization for robust building damage detection. arXiv 2020, arXiv:2011.10328. [Google Scholar]
  41. Li, Y.; Wang, N.; Shi, J.; Liu, J.; Hou, X. Revisiting batch normalization for practical domain adaptation. arXiv 2016, arXiv:1603.04779. [Google Scholar]
  42. Athiwaratkun, B.; Finzi, M.; Izmailov, P.; Wilson, A.G. There are many consistent explanations of unlabeled data: Why you should average. arXiv 2018, arXiv:1806.05594. [Google Scholar]
  43. Nex, F.; Duarte, D.; Tonolo, F.G.; Kerle, N. Structural building damage detection with deep learning: Assessment of a state-of-the-art CNN in operational conditions. Remote Sens. 2019, 11, 2765. [Google Scholar] [CrossRef] [Green Version]
  44. Lee, J.; Xu, J.Z.; Sohn, K.; Lu, W.; Berthelot, D.; Gur, I.; Khaitan, P.; Huang, K.-W.(F.); Koupparis, K.; Kowatsch, B. Assessing Post-Disaster Damage from Satellite Imagery using Semi-Supervised Learning Techniques. arXiv 2020, arXiv:2011.14004. [Google Scholar]
  45. Berthelot, D.; Carlini, N.; Goodfellow, I.; Papernot, N.; Oliver, A.; Raffel, C. Mixmatch: A holistic approach to semi-supervised learning. arXiv 2019, arXiv:1905.02249. [Google Scholar]
  46. Sohn, K.; Berthelot, D.; Li, C.L.; Zhang, Z.; Carlini, N.; Cubuk, E.D.; Kurakin, A.; Zhang, H.; Raffel, C. Fixmatch: Simplifying semi-supervised learning with consistency and confidence. arXiv 2020, arXiv:2001.07685. [Google Scholar]
  47. Xia, J.; Yokoya, N.; Adriano, B. Building Damage Mapping with Self-PositiveUnlabeled Learning. arXiv 2021, arXiv:2111.02586. [Google Scholar]
  48. Ismail, A.; Awad, M. Towards Cross-Disaster Building Damage Assessment with Graph Convolutional Networks. arXiv 2022, arXiv:2201.10395. [Google Scholar]
  49. Kuzin, D.; Isupova, O.; Simmons, B.D.; Reece, S. Disaster mapping from satellites: Damage detection with crowdsourced point labels. arXiv 2021, arXiv:2111.03693. [Google Scholar]
  50. Anand, V.; Miura, Y. PREDISM: Pre-Disaster Modelling With CNN Ensembles for At-Risk Communities. arXiv 2021, arXiv:2112.13465. [Google Scholar]
  51. Presa-Reyes, M.; Chen, S.C. Weakly-Supervised Damaged Building Localization and Assessment with Noise Regularization. In Proceedings of the 2021 IEEE 4th International Conference on Multimedia Information Processing and Retrieval (MIPR), Virtual, 8–10 September 2021; pp. 8–14. [Google Scholar]
  52. Pi, Y.; Nath, N.D.; Behzadan, A.H. Convolutional neural networks for object detection in aerial imagery for disaster response and recovery. Adv. Eng. Inform. 2020, 43, 101009. [Google Scholar] [CrossRef]
  53. Xiong, C.; Li, Q.; Lu, X. Automated regional seismic damage assessment of buildings using an unmanned aerial vehicle and a convolutional neural network. Autom. Constr. 2020, 109, 102994. [Google Scholar] [CrossRef]
  54. Rudner, T.G.J.; Rußwurm, M.; Fil, J.; Pelich, R.; Bischke, B.; Kopacková, V.; Bilinski, P. Rapid Computer Vision-Aided Disaster Response via Fusion of Multiresolution, Multisensor, and Multitemporal Satellite Imagery. In Proceedings of the First Workshop on AI for Social Good. Neural Information Processing Systems (NIPS-2018), Montreal, QC, Canada, 3–8 December 2018. [Google Scholar]
  55. Li, X.; Caragea, D.; Zhang, H.; Imran, M. Localizing and quantifying infrastructure damage using class activation mapping approaches. Soc. Netw. Anal. Min. 2019, 9, 44. [Google Scholar] [CrossRef]
  56. Duarte, D.; Nex, F.; Kerle, N.; Vosselman, G. Satellite image classification of building damages using airborne and satellite image samples in a deep learning approach. ISPRS Ann. Photogramm. Remote Sens. Spat. Inf. Sci. 2018, IV-2, 89–96. [Google Scholar] [CrossRef] [Green Version]
  57. Weber, E.; Papadopoulos, D.P.; Lapedriza, A.; Ofli, F.; Imran, M.; Torralba, A. Incidents1M: A large-scale dataset of images with natural disasters, damage, and incidents. arXiv 2022, arXiv:2201.04236. [Google Scholar]
  58. Glasmachers, T. Limits of End-to-End Learning. In Proceedings of the Asian Conference on Machine Learning, Seoul, Korea, 15–17 November 2017; pp. 17–32. [Google Scholar]
  59. Oktay, O.; Schlemper, J.; Folgoc, L.L.; Lee, M.C.H.; Heinrich, M.P.; Misawa, K.; Mori, K.; McDonagh, S.G.; Hammerla, N.Y.; Kainz, B.; et al. Attention U-Net: Learning Where to Look for the Pancreas. arXiv 2018, arXiv:1804.03999. [Google Scholar]
  60. Ronneberger, O.; Fischer, P.; Brox, T. U-Net: Convolutional Networks for Biomedical Image Segmentation. arXiv 2015, arXiv:1505.04597. [Google Scholar]
  61. Koch, G.; Zemel, R.; Salakhutdinov, R. Siamese neural networks for one-shot image recognition. In Proceedings of the ICML Deep Learning Workshop, Lille, France, 6–11 July 2015; Volume 2. [Google Scholar]
  62. He, K.; Zhang, X.; Ren, S.; Sun, J. Deep Residual Learning for Image Recognition. arXiv 2015, arXiv:1512.03385. [Google Scholar]
  63. Chen, H.; Nemni, E.; Vallecorsa, S.; Li, X.; Wu, C.; Bromley, L. Dual-Tasks Siamese Transformer Framework for Building Damage Assessment. arXiv 2022, arXiv:2201.10953. [Google Scholar]
  64. Li, Y.; Lin, C.; Li, H.; Hu, W.; Dong, H.; Liu, Y. Unsupervised Domain Adaptation with Self-attention for Post-disaster Building Damage Detection. Neurocomputing 2020, 415, 27–39. [Google Scholar] [CrossRef]
  65. Benjdira, B.; Bazi, Y.; Koubaa, A.; Ouni, K. Unsupervised Domain Adaptation Using Generative Adversarial Networks for Semantic Segmentation of Aerial Images. Remote Sens. 2019, 11, 1369. [Google Scholar] [CrossRef] [Green Version]
  66. Xu, Q.; Yuan, X.; Ouyang, C. Class-Aware Domain Adaptation for Semantic Segmentation of Remote Sensing Images. IEEE Trans. Geosci. Remote Sens. 2020, 60, 1–17. [Google Scholar] [CrossRef]
Figure 1. Building damage assessment incident workflow. The post-incident execution phase is triggered by a natural disaster but is only initiated upon retrieval of post-disaster satellite images from an imagery archive. Those images are then used to produce maps and analyzed to produce a damage assessment report. The duration of each task is approximate and depends upon many external factors.
Remotesensing 14 02532 g001
Figure 2. Per-disaster empirical distribution of building damage. The numbers are ratios of Damage buildings per disaster.
Remotesensing 14 02532 g002
Figure 3. Image pair before and after Hurricane Florence. The bounding box focuses on a single building. The area surrounding the building is flooded.
Remotesensing 14 02532 g003
Figure 4. Damage types: structural (left) and peripheral (right).
Remotesensing 14 02532 g004
Figure 5. Two-step modelling approach composed of (1) a building detection model (BuildingNet) and (2) a damage classification model (DamageNet). The input of BuildingNet is a pre-disaster image, and the output a binary segmentation heatmap, i.e., that each pixel has a sigmoid output. The input of DamageNet is both the pre- and post-disaster image patches centred on a single building along with the building mask. The two models are applied sequentially.
Remotesensing 14 02532 g005
Figure 6. BuildingNet follows an Attention-U-Net architecture. The pre-disaster image is downsampled and then upsampled (i.e., a bottleneck architecture) at different spatial scales. The skip connections allow an encoding at a certain scale to skip through further downscaling and to merge with the upsampling stream after being filtered through an attention gate. The attention gate learns to focus on different structures.
Remotesensing 14 02532 g006
Figure 7. DamageNet follows Siamese-ResNet architecture. Both pre- and post-disaster feature streams are eventually concatenated into one damage classification stream. The building mask is applied as an attention mechanism. This figure shows the feature map shape for ResNet34.
Remotesensing 14 02532 g007
Figure 8. Ablation study configurations for the fusion of the pre- and post-disaster streams after the first (1), second (2), third (3), and fourth (4) blocks.
Remotesensing 14 02532 g008
Figure 9. BuildingNet F 1 score per disaster event.
Remotesensing 14 02532 g009
Figure 10. Ablation study results for the fusion of the pre- and post-disaster streams after the first (1), second (2), third (3), and fourth (4) blocks. Each line represents ResNet with a different capacity.
Remotesensing 14 02532 g010
Figure 11. F 1 score of DamageNet per disaster event.
Remotesensing 14 02532 g011
Figure 12. Results of DamageNet fine-tuned with supervision on annotated samples of the current disaster event. Each line represents the F 1 score for a given disaster event with an increasing number of samples from the current disaster.
Remotesensing 14 02532 g012
Figure 13. Fine-tuning steps.
Remotesensing 14 02532 g013
Figure 14. Comparison of manual and automatic damage classification incident workflows. Manual annotation takes up to days after the reception of post-disaster satellite images. Supervised fine-tuning still involves manual annotation but for more than 10 times fewer samples. All durations are approximate. Data annotation durations are relative to each other.
Remotesensing 14 02532 g014
Figure 15. Complete building damage assessment incident workflow supported by machine learning. Building detection inference depends on the pre-disaster satellite images only. Damage classification depends on both the pre- and post-disaster images. It also depends on building detection model inference. Data analytics depend on the damage classification model inference. All durations are approximative.
Remotesensing 14 02532 g015
Table 1. Description of damage assessment scores. Our work is based on a simplified binary classification scheme. The original scheme is presented in [26].
xBD Original ClassSimplified ClassDescription
0 (No damage)0 (No damage)Undisturbed. No signs of water, structural or shingle damage, or burn marks.
1 (Minor Damage)0 (No damage)Building partially burnt, water surrounding structure, volcanic flow nearby, roof element missing, or visible crack.
2 (Major Damage)1 (Damage)Partial wall or roof collapse, encroaching volcanic flow, or surrounded by water/mud.
3 (Destroyed)1 (Damage)Scorched, completely collapsed, partially/completely covered with water/mud, or otherwise no longer present.
Table 2. Disaster event, abbreviation, and location represented in the xBD dataset.
Disaster EventAbbreviationCountry
Hurricane Florencehurr-florenceUSA
Hurricane Harveyhurr-harveyUSA
Hurricane Matthewhurr-matthewHaiti
Hurricane Michaelhurr-michaelUSA
Joplin Tornadojoplin-tornadoUSA
Lower Puna Volcanolower-puna-volcanoUSA (Hawai)
Mexico Earthquakemexico-earthquakeMexico
Moore Tornadomoore-tornadoUSA
Midwest Floodmw-floodUSA
Nepal Floodingnepal-floodingNepal
Palu Tsunamipalu-tsunamiIndonesia
Pinery Bushfirepinery-bushfireAustralia
Portugal Wildfireportugal-wildfirePortugal
Socal Firesocal-fireUSA
Santa Rosa Firesr-fireUSA
Sunda Tsunamisunda-tsunamiIndonesia
Tuscaloosa Tornadotuscaloosa-tornadoUSA
Woolsey Firewoolsey-fireUSA
Table 3. Comparison to the state-of-the-art model [30] on the xBD original dataset split. These metrics are defined in the xBD paper [26]. F 1 score values are between 0 and 1, where higher is better. The mean and standard deviation over three runs are reported for our work.
Localization F 1 Classification F 1
Weber [30]0.8350.697
RescueNet [29]0.8400.740
BDANet [36]0.8640.782
DCFNet [35]0.8640.795
DamFormer [63]0.8690.728
Our model0.846 (0.002)0.709 (0.003)
Table 4. Model F 1 Score with no fine-tuning, and with fine-tuning using 1500 samples. Boldness indicates a score that is higher by a margin of 0.01 and over.
Disaster EventNo Fine-TuningFine-Tuning
Hurricane Florence0.7920.931
Hurricane Harvey0.3720.402
Hurricane Matthew0.6970.702
Hurricane Michael0.0940.850
Joplin Tornado0.8890.853
Lower Puna Volcano0.7450.941
Mexico Earthquake0.010.027
Moore Tornado0.8590.879
Midwest Flood0.5700.737
Nepal Flooding0.4720.646
Palu Tsunami0.7770.833
Pinery Bushfire0.4050.498
Portugal Wildfire0.4930.540
Socal Fire0.8030.801
Santa Rosa Fire0.9240.920
Sunda Tsunami0.2450.523
Tuscaloosa Tornado0.7780.770
Woolsey Fire0.7650.766
Publisher’s Note: MDPI stays neutral with regard to jurisdictional claims in published maps and institutional affiliations.

