Article

Coastal Bathymetry Estimation from Sentinel-2 Satellite Imagery: Comparing Deep Learning and Physics-Based Approaches

1
LEGOS, CNRS, UMR-5566, 14 Avenue Edouard Belin, 31400 Toulouse, France
2
ISAE-SUPAERO, 10 Avenue Edouard Belin, 31055 Toulouse, France
3
LEGOS, IRD, UMR-5566, 14 Avenue Edouard Belin, 31400 Toulouse, France
4
Earth Observation Lab, CNES, 18 Avenue Edouard Belin, 31400 Toulouse, France
*
Author to whom correspondence should be addressed.
Remote Sens. 2022, 14(5), 1196; https://doi.org/10.3390/rs14051196
Submission received: 26 January 2022 / Revised: 4 February 2022 / Accepted: 10 February 2022 / Published: 28 February 2022

Abstract

:
The ability to monitor the evolution of the coastal zone over time is an important factor in coastal knowledge, development, planning, risk mitigation, and overall coastal zone management. While traditional bathymetry surveys using echo-sounding techniques are expensive and time consuming, remote sensing tools have recently emerged as reliable and inexpensive data sources that can be used to estimate bathymetry using depth inversion models. Deep learning is a growing field of artificial intelligence that allows for the automatic construction of models from data and has been successfully used for various Earth observation and model inversion applications. In this work, we make use of publicly available Sentinel-2 satellite imagery and multiple bathymetry surveys to train a deep learning-based bathymetry estimation model. We explore for the first time two complementary approaches, based on color information but also wave kinematics, as inputs to the deep learning model. This offers the possibility to derive bathymetry not only in clear waters as previously done with deep learning models but also at common turbid coastal zones. We show competitive results with a state-of-the-art physical inversion method for satellite-derived bathymetry, Satellite to Shores (S2Shores), demonstrating a promising direction for worldwide applicability of deep learning models to inverse bathymetry from satellite imagery and a novel use of deep learning models in Earth observation.

1. Introduction

Coastal areas are under a constant multitude of pressures resulting from different natural forces. The ability to reliably track and measure the nearshore bathymetry over time is critical for a wide array of applications including coastal development and management, coastal risk monitoring and mitigation, coastal science studies, among others [1,2]. Traditional in situ bathymetric measurements using echo-sounding or Light Detection and Ranging (LiDAR) are time-consuming and expensive [3] and are preconditioned on a number of environmental factors such as the navigability of the site to be surveyed [4], in addition to a multitude of logistical constraints [5,6].
Remote sensing tools have recently become an important tool to collect different types of data that allows the monitoring of coastal areas [7,8]. These tools differ in their temporal frequency and spatial coverage. Shore-based or drone-mounted video cameras provide high-resolution imagery frequently with a spatially limited coverage [9,10,11]. On the other hand, satellite constellations such as the European Space Agency’s (ESA) Sentinel-2 satellite constellation provide high resolution (10 m) imagery with global coverage at a relatively high revisit frequency (every 5 days with Sentinel-2) [12,13]. These remotely sensed satellite products have been shown to be a valuable resource in a wide variety of coastal science studies and applications. For example, a large body of work exists on the use of ocean color data to quantify water quality parameters [14,15,16]. Methods making use of satellite imagery to estimate water depth can be divided into two categories based on the target phenomena studied. Namely, the effect of bathymetry on the propagation and dispersion of surface waves (wave kinematics), as well as the relation between water depth and light penetration and reflectance in water (water color). Methods based on the radiative transfer of light in water as a function of depth and wavelength (i.e., color-based methods) can be used to estimate depth in optically shallow waters [17,18,19,20,21,22]. Such methods are sensitive to the optical properties of seawater and are generally limited to clear and non-turbid waters [1,23]. Other methods based on wave kinematics extract wave features from satellite imagery such as the wave phase shift and wave number to estimate depth using the linear dispersion relation [24] (described in more detail in Section 2). Both approaches offer different advantages. Methods based on the radiative transfer of light in water are more accurate in shallow waters (up to 15 m depth) and are able to detect smaller-scale bathymetric features, with an absolute error order of 10–20% of the target value, and an average RMSE of 1.5 m [25,26,27]. On the other hand, wave kinematics-based approaches are preconditioned on the observability of wave patterns in the input imagery, however, their detectable depth range is significantly larger than the typical range of color-based methods [20] but with less accuracy when applied globally (RMSE between 6–9 m, [23]). The task of constructing a depth estimation function applicable to satellite data is non-trivial and remains a topic of ongoing research due to the great potential it offers to in-expensively monitor coastal morphodynamics at a large scale.
Machine learning has been applied to satellite-derived bathymetry to automatically learn an estimation function, bringing great expectations to solve satellite-based bathymetry issues in areas of complex physics and environmental parameters. Early works made use of multi-layered perceptrons to estimate water depth as a function of spectral radiance in input satellite imagery [28]. Other works that make use of more traditional machine learning algorithms include [29], where support vector machines are used to estimate depth based on a transformed ratio between the blue and green bands of the National Aeronautics and Space Administration’s (NASA) EO-1 satellite imagery. In [22], random forests are used to analyze several Landsat 8 surface reflectance products over a specific site in order to create a map of the bathymetry in shallow waters (0 to 20 m).
Recently, numerous Earth observation and remote sensing applications have adopted deep learning (DL) methods using convolutional neural networks (CNN), due to their image processing and feature analysis abilities [30,31,32,33]. The use of DL for bathymetry estimation is a recent and growing application; Ref. [34] estimate river bed topography from depth-averaged flow velocity observations. Both [35,36] use aerial imagery to estimate water depth, on the surf zone of Duck, North Carolina (NC) and the floodplain of the Lech river, respectively. The use of DL on satellite products for bathymetry estimation is relatively unexplored but presents an opportunity for global, low-cost bathymetry estimation. In [37], DL is used to estimate seabed depth based on the radiative transfer of light in water in multispectral images from the Orbview-3 satellite. In [38], a CNN is used to estimate depths of the Devils Lake Area (ND, USA), casting estimation as a classification problem with classes at each foot of depth. The most convincing application of deep learning to coastal SDB currently appears to be from [39], which uses reflectance values from Sentinel-2 Level 2A images to estimate coastal water depth with high precision in clear waters (1.48 m RMSE). While machine learning and deep learning applications for satellite-derived bathymetry have—until now—mainly been applied to color-based approaches, great expectations come from the combination of different methods, in particular, based on wave information [40,41]. To our knowledge, this work’s contribution of DL for satellite-derived coastal bathymetry based on wave kinematics from real satellite products is novel.
In this work, we apply the previously developed Deep Single-Point Estimation of Bathymetry (DSPEB) method [42] and showcase its ability to reconstruct bathymetry using real-world data. We create a supervised dataset for bathymetry inversion using publicly available Sentinel-2 imagery [12] and a number of bathymetry surveys obtained from the French Naval Hydrographic and Oceanographic Service (SHOM). We present two different satellite image pre-processing techniques to augment wave kinematics and color information as inputs to two DSPEB models. We train our models in two different sites and compare the performance of color-based and wave kinematics-based DSPEB to one of the current state-of-the-art bathymetry inversion models based on wave kinematics, Satellite to Shores (S2Shores) [24,43]. The layout of this article is as follows. In Section 2, we present the DSPEB and S2Shores approaches for SDB. We then describe our dataset creation methodology and the datasets used in our experiments. In Section 3, we present our results and compare our DSPEB models to the physical method’s performances in two application sites. Section 4 concludes the work with a discussion of the results presented, highlighting possible further research paths. In the appendices, we include additional supporting results from the different models presented in the article, our first steps towards a hybrid approach to SDB using deep learning that makes use of the physical characteristics of surface waves in addition to water color to estimate depth, in addition to a full list of the Sentinel-2 images used in order to facilitate reproducibility.

2. Data and Methods

In this section, we first present the DSPEB approach for bathymetry estimation using deep learning, as well as the physics-based method S2Shores, which we use as a reference for comparison. We then describe our data setup and input data pre-processing for both wave kinematics-based and color-based DSPEB. We give an overview of the sites used in this study and the final supervised datasets used to train our DSPEB models. Finally, we present a summarized description of the functioning of DSPEB as a complete workflow.

2.1. Deep Single-Point Estimation of Bathymetry

Deep neural networks are a family of algorithms that are inspired by and modeled after the human brain. These networks are trained to approximate a mapping between inputs and outputs that minimizes an objective function. Training such networks is done through Stochastic Gradient Descent (SGD); a network’s prediction error is calculated according to the objective (loss) function over a batch of training samples and is then propagated backward through the different layers of the network using backpropagation, where an optimizer (SGD) is responsible for updating the different parameters of the network. This process is repeated over multiple iterations of the available data and is stopped according to varying criteria. As part of the optimization process, a learning rate is employed to control the scale of weight updates that are done at each step.
The Deep Single-Point Estimation of Bathymetry method [42] is a deep learning-based bathymetry inversion method that operates on 40 × 40 × 4 px multi-spectral input subtiles (corresponding to the blue (B2), green (B3), red (B4), and near-infrared (B8) bands of the Sentinel-2 satellite constellation [12] at 10 m resolution) to estimate the water depth corresponding to the center of each input subtile. The neural network input is an image of 40 × 40 × 4 px input channels conforming to our dataset of 40 × 40 × 4 satellite subtiles; and a single output neuron with a Rectified Linear Unit (ReLU) activation, corresponding to the average depth beneath the imaged area. Figure 1 presents the different steps of the DSPEB method.
The deep learning parameters for DSPEB, including the choice of the model architecture and learning hyperparameters, were studied in a previous work [42]. We found that while networks of varying depth can perform bathymetry estimation, small convolutional neural networks (CNN) are sufficient. The chosen architecture for this work is ResNet20 [44], a small version of a residual architecture that achieves state-of-the-art performance on many computer vision tasks [45]. The network is trained using Adam [46], a standard CNN optimization method based on stochastic gradient descent (SGD). In this work, the hyperparameters of Adam ( l r , gradient estimate decay factors β 1 and β 2 , and ϵ ) are optimized based on a grid search and findings from our previous work [42].

2.2. Satellite to Shores

We compare our deep learning-based approach (DSPEB) to a wave kinematics-based depth inversion model named Satellite to Shores (S2Shores) [24,47]. S2Shores employs a Fourier slicing method (FS), consisting of a combined radon transform (RT) and a discrete Fourier transform (DFT). The FS technique is used to detect spectral wave characteristics such as the spectral wave phase shift and the wave number to invert water depth using the linear dispersion relation for free surface waves (2). The depth estimation procedure is repeated for each sub-window around a point where one wants to know the depth (h). Each sub-window has a user-defined size in O(100 s m), as such that it contains at least 1–2 wavelengths ( λ ). The radon transform is applied to the sub-sampled image to produce a sinogram of integrated pixel-intensities per direction. The angle corresponding to the maximum variance in the RT-sinogram corresponds to the wave direction (see [24,47] for more details). A 1D DFT procedure per direction over the sinogram enables to pass from the spatial domain to a complex spectral domain in polar space. From the resulting polar spectrum, the wave phase and amplitude can be determined per wave number, per direction. The difference in phase ( Δ Φ ) can be found between (several) pairs of detector bands. Presuming that the wavenumber (k) is constant or near-constant over the sub-window, Δ Φ can be seen as representative of ω ( t ) , and given that the timing between the different detector bands ( Δ t ) is constant, the wave celerity (c) can be determined as:
c = Δ Φ 2 π k Δ t = Δ Φ λ 2 π Δ t
For each wavenumber or celerity pair, (2) can be solved for depth.
c 2 = g h t a n h ( k h ) h = t a n h 1 ( c 2 k g ) k
Estimates of water depth, wave celerity, wavenumber (wavelength), and direction are output by the S2Shores algorithm at each point on an output grid with a resolution of 500 m. To evaluate and compare S2Shores to the survey data and the DSPEB results, we use linear interpolation of the raw sparse output grid.

2.3. Sentinel-2 Data Pre-Processing

For this work, we apply our DSPEB method to two different types of inputs, corresponding to the wave kinematics-based DSPEB approach (W-DSPEB) and color-based DSPEB (C-DSPEB). Throughout the article, we make a distinction between two types of information included in raw satellite imagery over coastal areas. Signals and information corresponding to ocean waves are referred to as “wave kinematics information”. These signals are pre-processed (described further in this section) and used as inputs to the W-DSPEB model. The remaining signals, termed “color information”, are presumed to represent ocean water color as affected by the optical properties of water, water constituents, seabed reflectance and depth. These signals are filtered and used as inputs to the C-DSPEB model.
The inputs to both neural networks are 40 × 40 × 4 px satellite images. We noted that model training was sensitive to different dates with varying meteorological conditions. To construct a training dataset, we select dates based on high estimation correlation from the S2Shores method, which depends on visible waves. We provide a list of all images used in this work in Appendix A. While the focus of this work is to develop on our previous work on DSPEB, a less expensive and more general date selection method is a topic of on-going work.
The first step in our pre-processing workflow is cloud detection. We make use of a simple cloud detector based on the percentage of blue pixels in each subtile by looking at the RGB Sentinel-2 bands. We discard all subtiles where the percentage of blue pixels is less than 80%, allowing for a margin of noise in the input data.
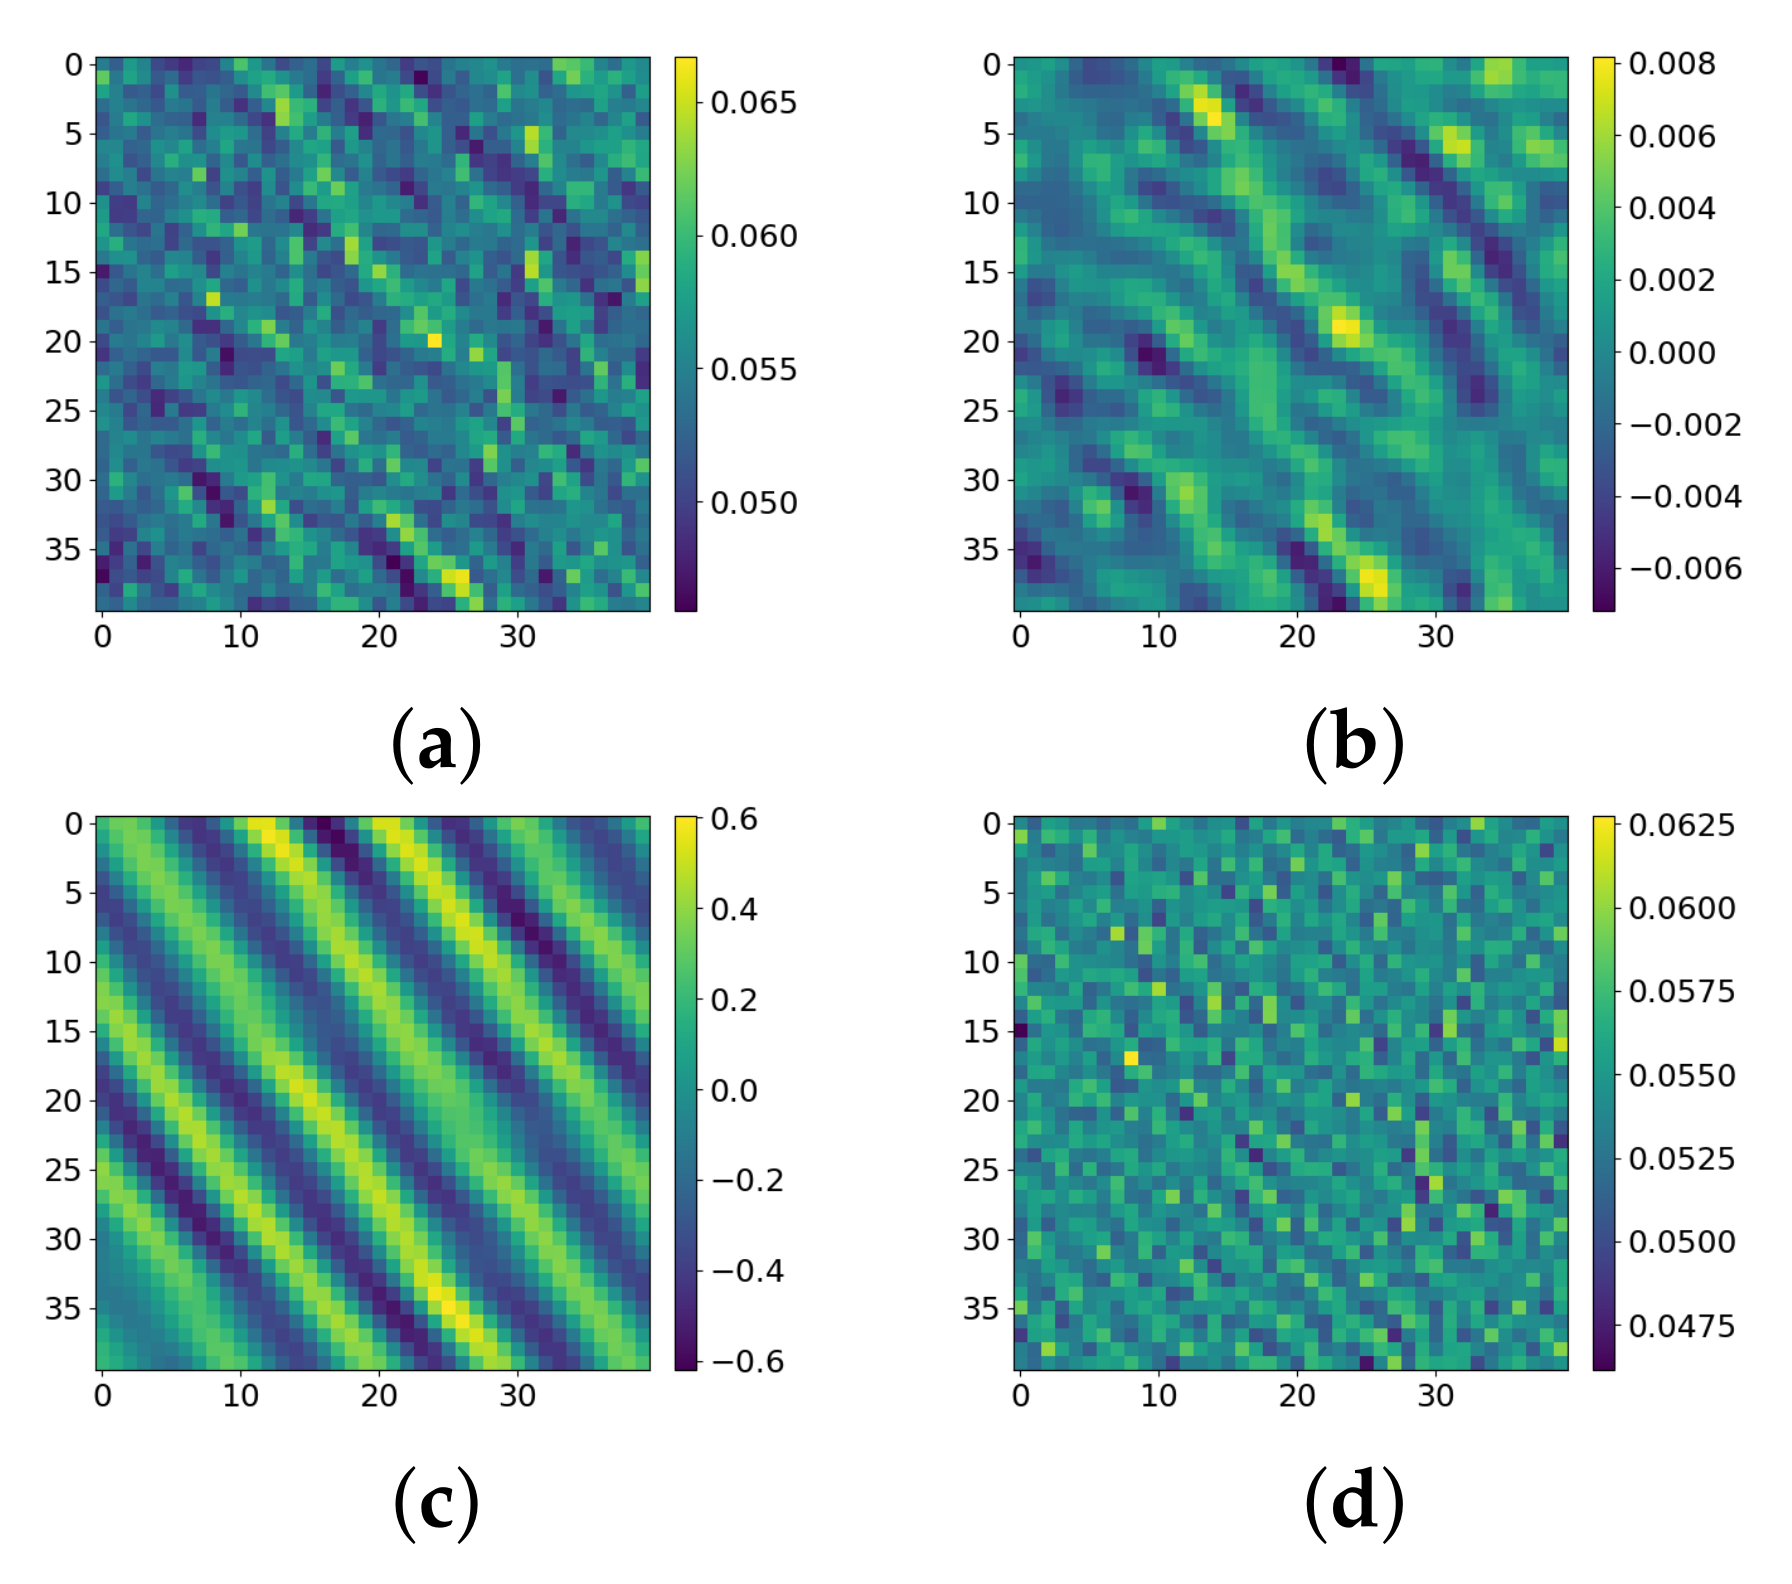
We apply a pass-band filter to our input subtiles in the range of ocean-specific wavelengths (periods T m i n = 5 s to T m a x = 25 s). First, we create a frequency filter based on T m i n and T m a x . Then, a discrete FFT is applied in two dimensions to the signals of each Sentinel-2 subtile band. The original filter is then used to filter the resulting frequencies, discarding all wave signals with periods outside of the specified range. For W-DSPEB, we further process our filtered subtiles by calculating the two-dimensional normalized cross-correlation (NORMXCORR) of each band, in order to extract the most consistent and recurring wave signals, which we presume correspond to the crests of actual ocean waves. For C-DSPEB, we subtract the filtered signals from the raw input image in order to retain the background color rather than the ocean wave signals. Figure 2 demonstrates our pre-processing workflow on an example 400 × 400 m Sentinel-2 subtile. For C-DSPEB, we scale all input images such that the minimum and maximum pixel values over the full dataset are equal to −0.9 and 0.9, respectively.

2.4. Study Sites

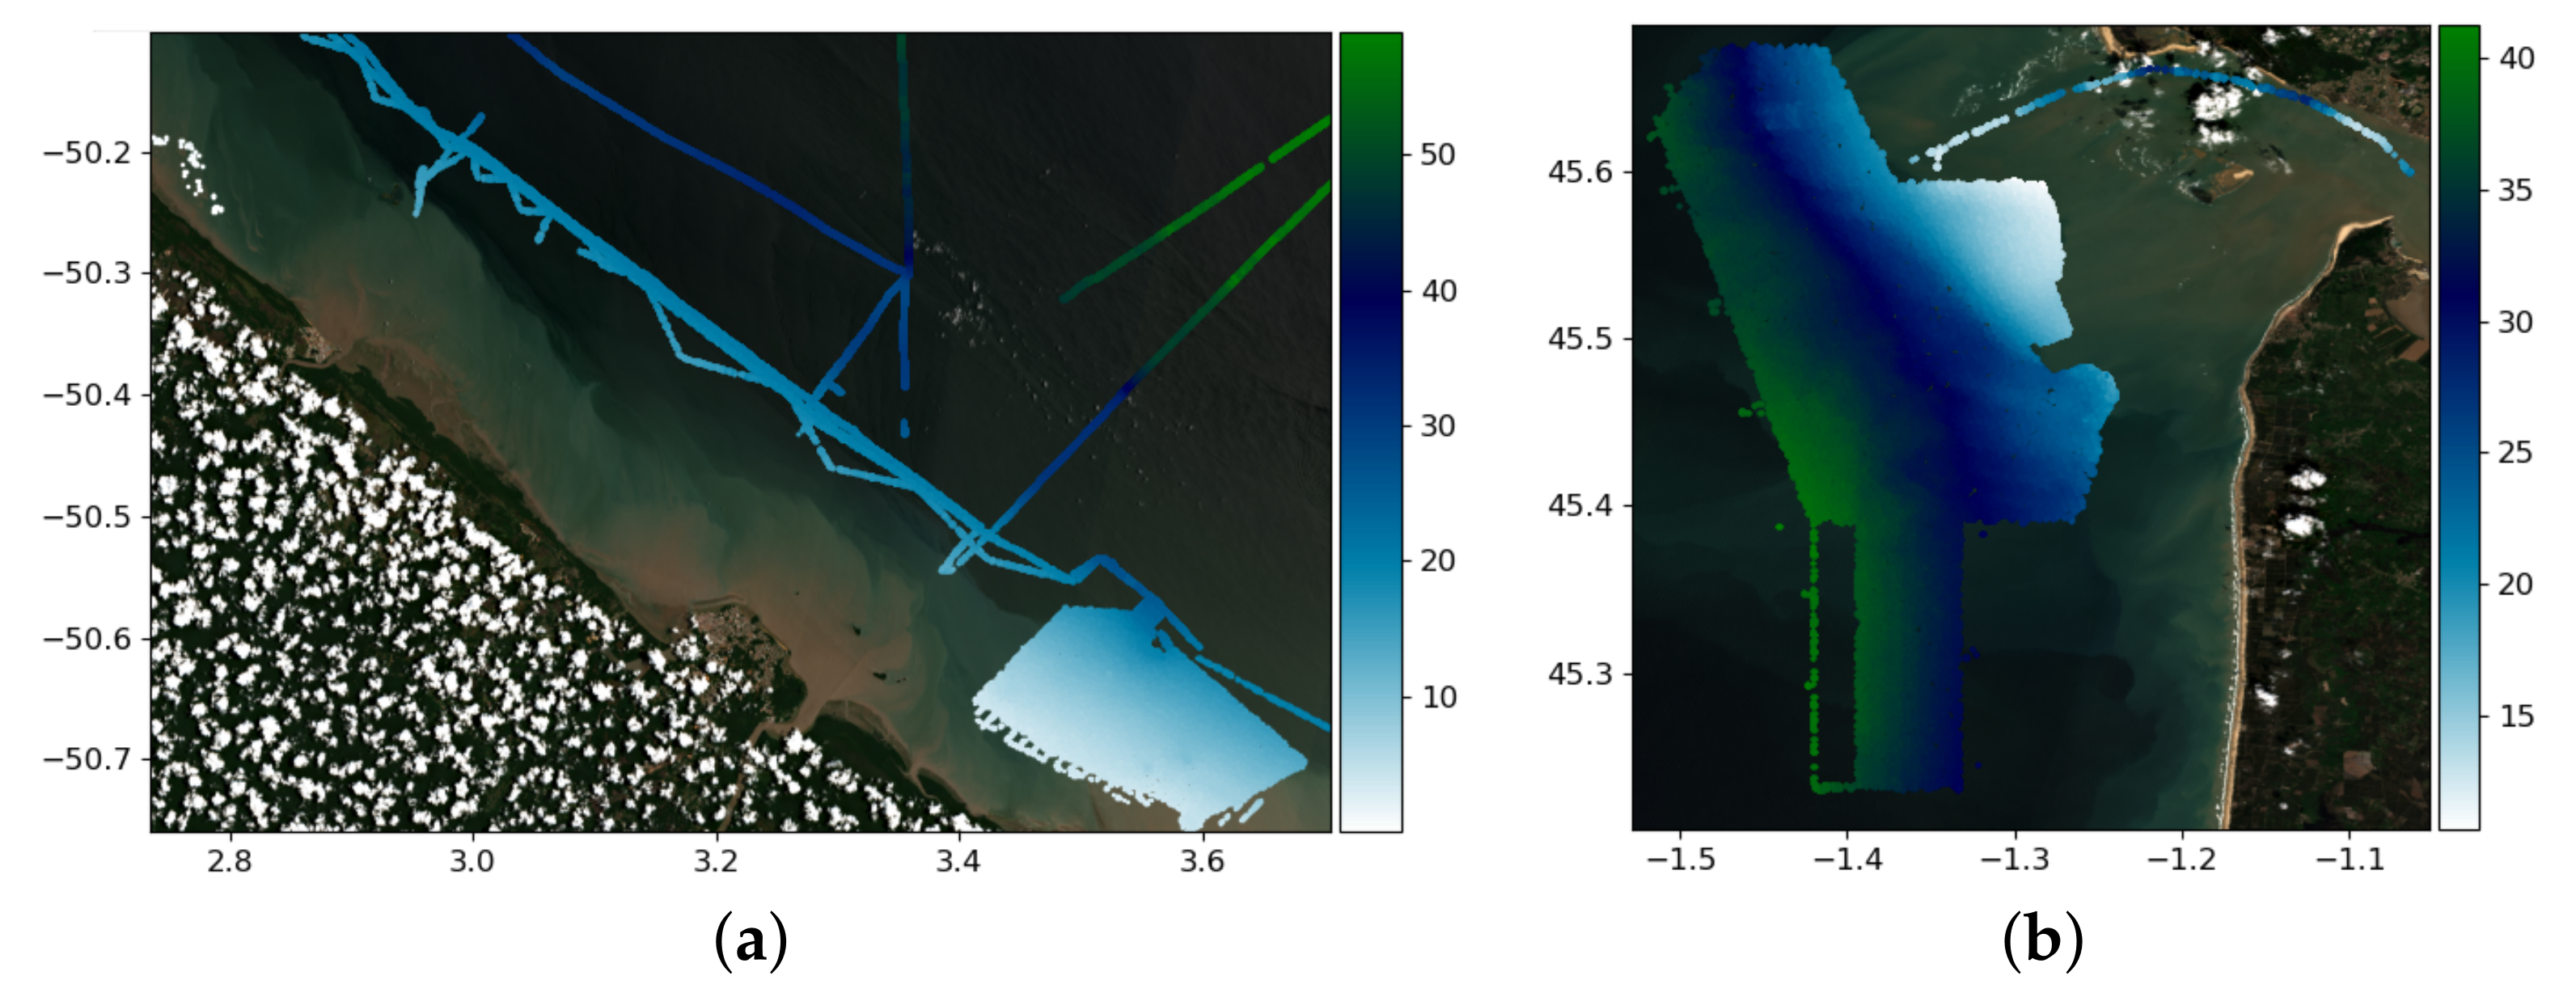
In this work, we apply and test our methods in French Guiana and in the Gironde area in France. For each site, we select a number of Sentinel-2 images according to cloud coverage and the visibility of wave patterns. A full list of images used and the wave conditions on those dates are provided in Appendix A. Figure 3 shows the measurement area and depth distribution of the surveys used in French Guiana and Gironde.
To create a supervised dataset for each site, the raw bathymetry survey is coupled with a set of Sentinel-2 images with varying wave conditions. The resulting subtiles and their corresponding depths are grouped into training and validation sets. For the final datasets, we make use of points with depth values ranging between 2 and 40 m only. The distributions of depths used in the training and validation sets are shown in Figure 4.
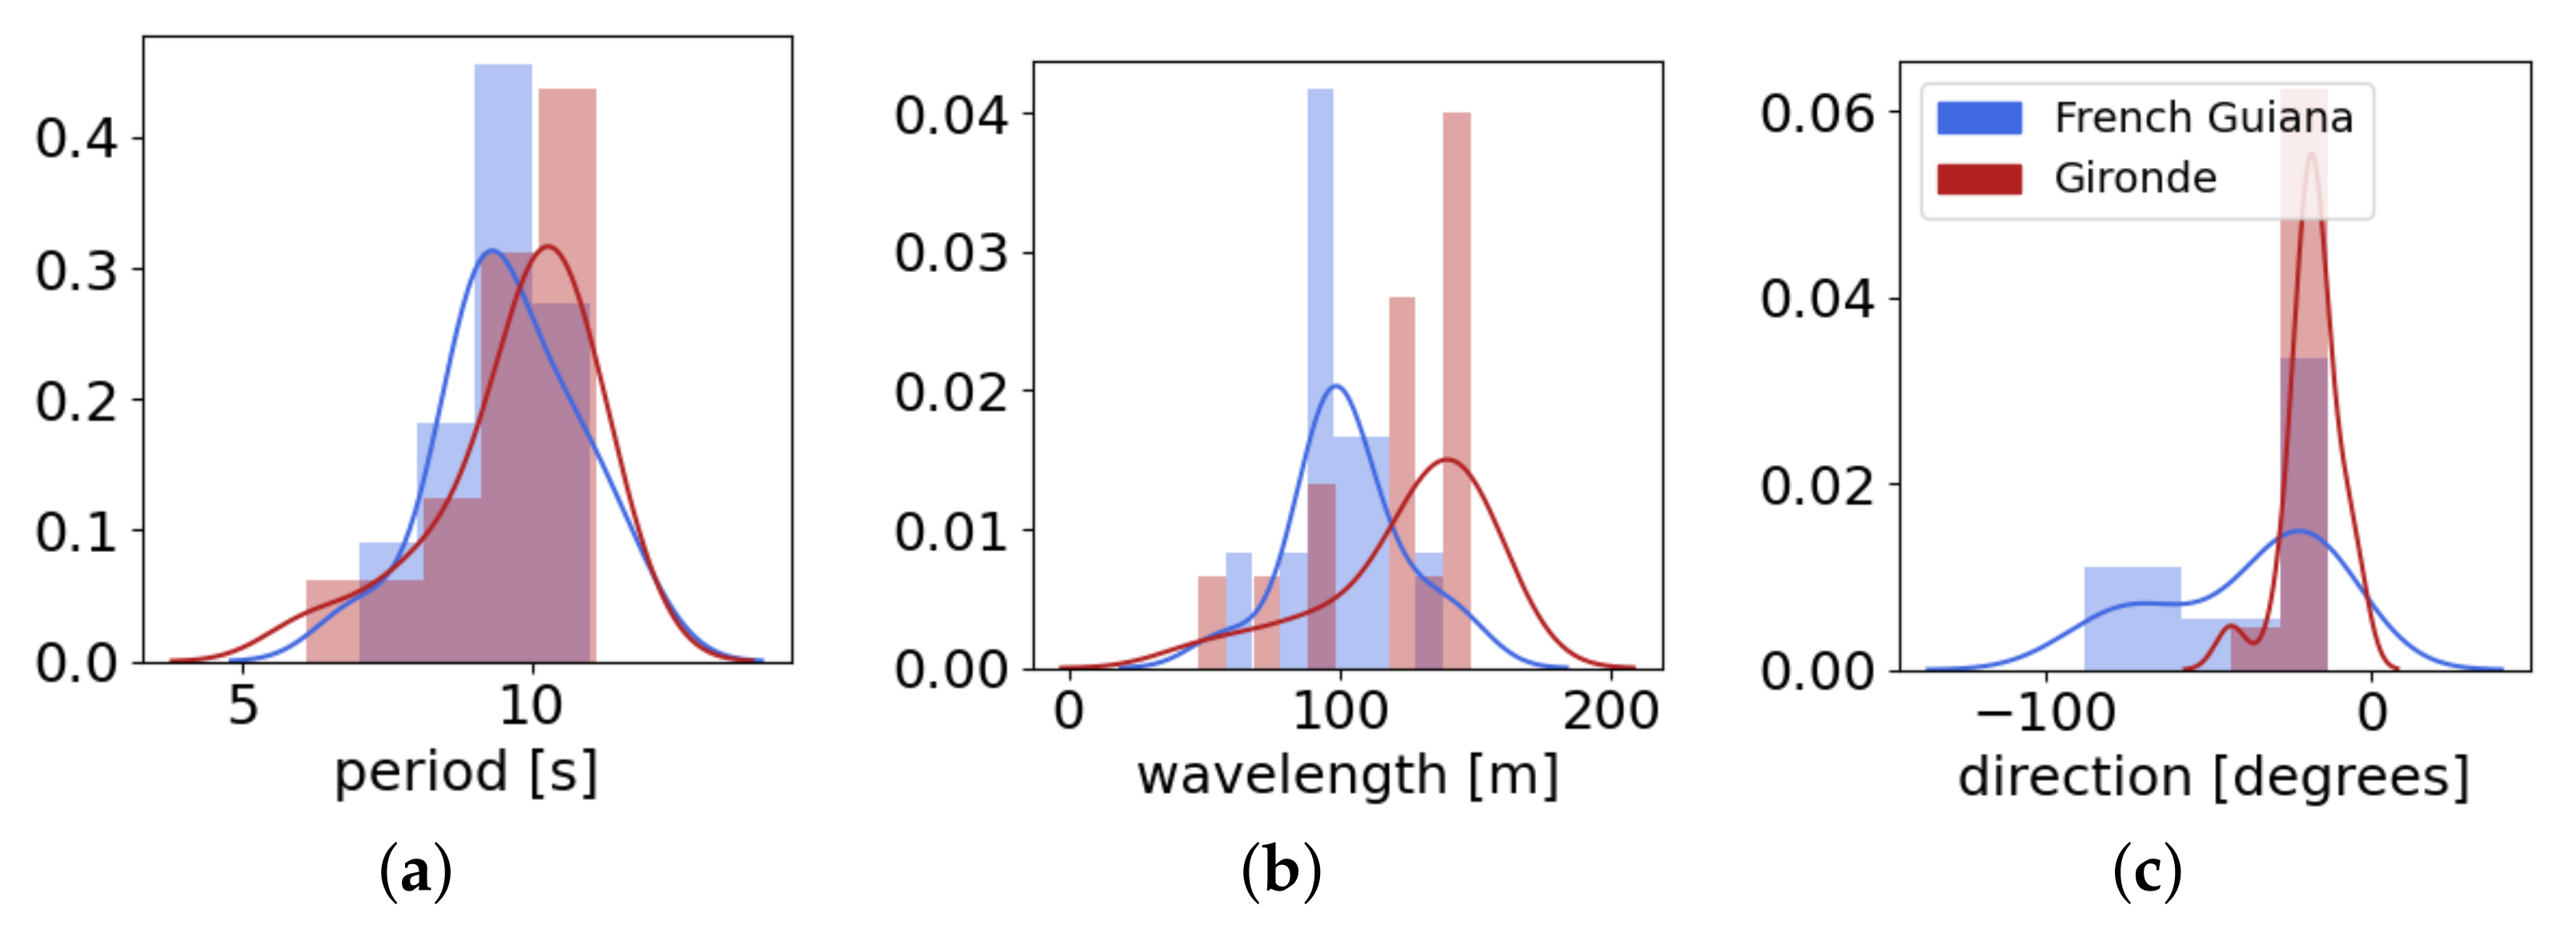
By including Sentinel-2 images from different dates in the training and validation sets, we expose the DSPEB models to a wide variety of wave conditions during training, reducing the models’ ability to overfit to any specific conditions. The distributions of wave period, wavelength, and the direction of propagation on the dates used for this study are documented in Figure 5.
To test our models, we create a test set for each site. In French Guiana, we use the south-eastern section of the raw bathymetry survey as our target area, and we collect Sentinel-2 images from six different dates in 2018 to create the inputs to the models during application. For Gironde, the whole area is reconstructed over four different 2018 dates.

2.5. Application Workflow

This section presents a summarized overview of the functioning of DSPEB as a complete workflow, going from raw Sentinel-2 imagery and raw bathymetry measurements to model application and the creation of composite estimates.
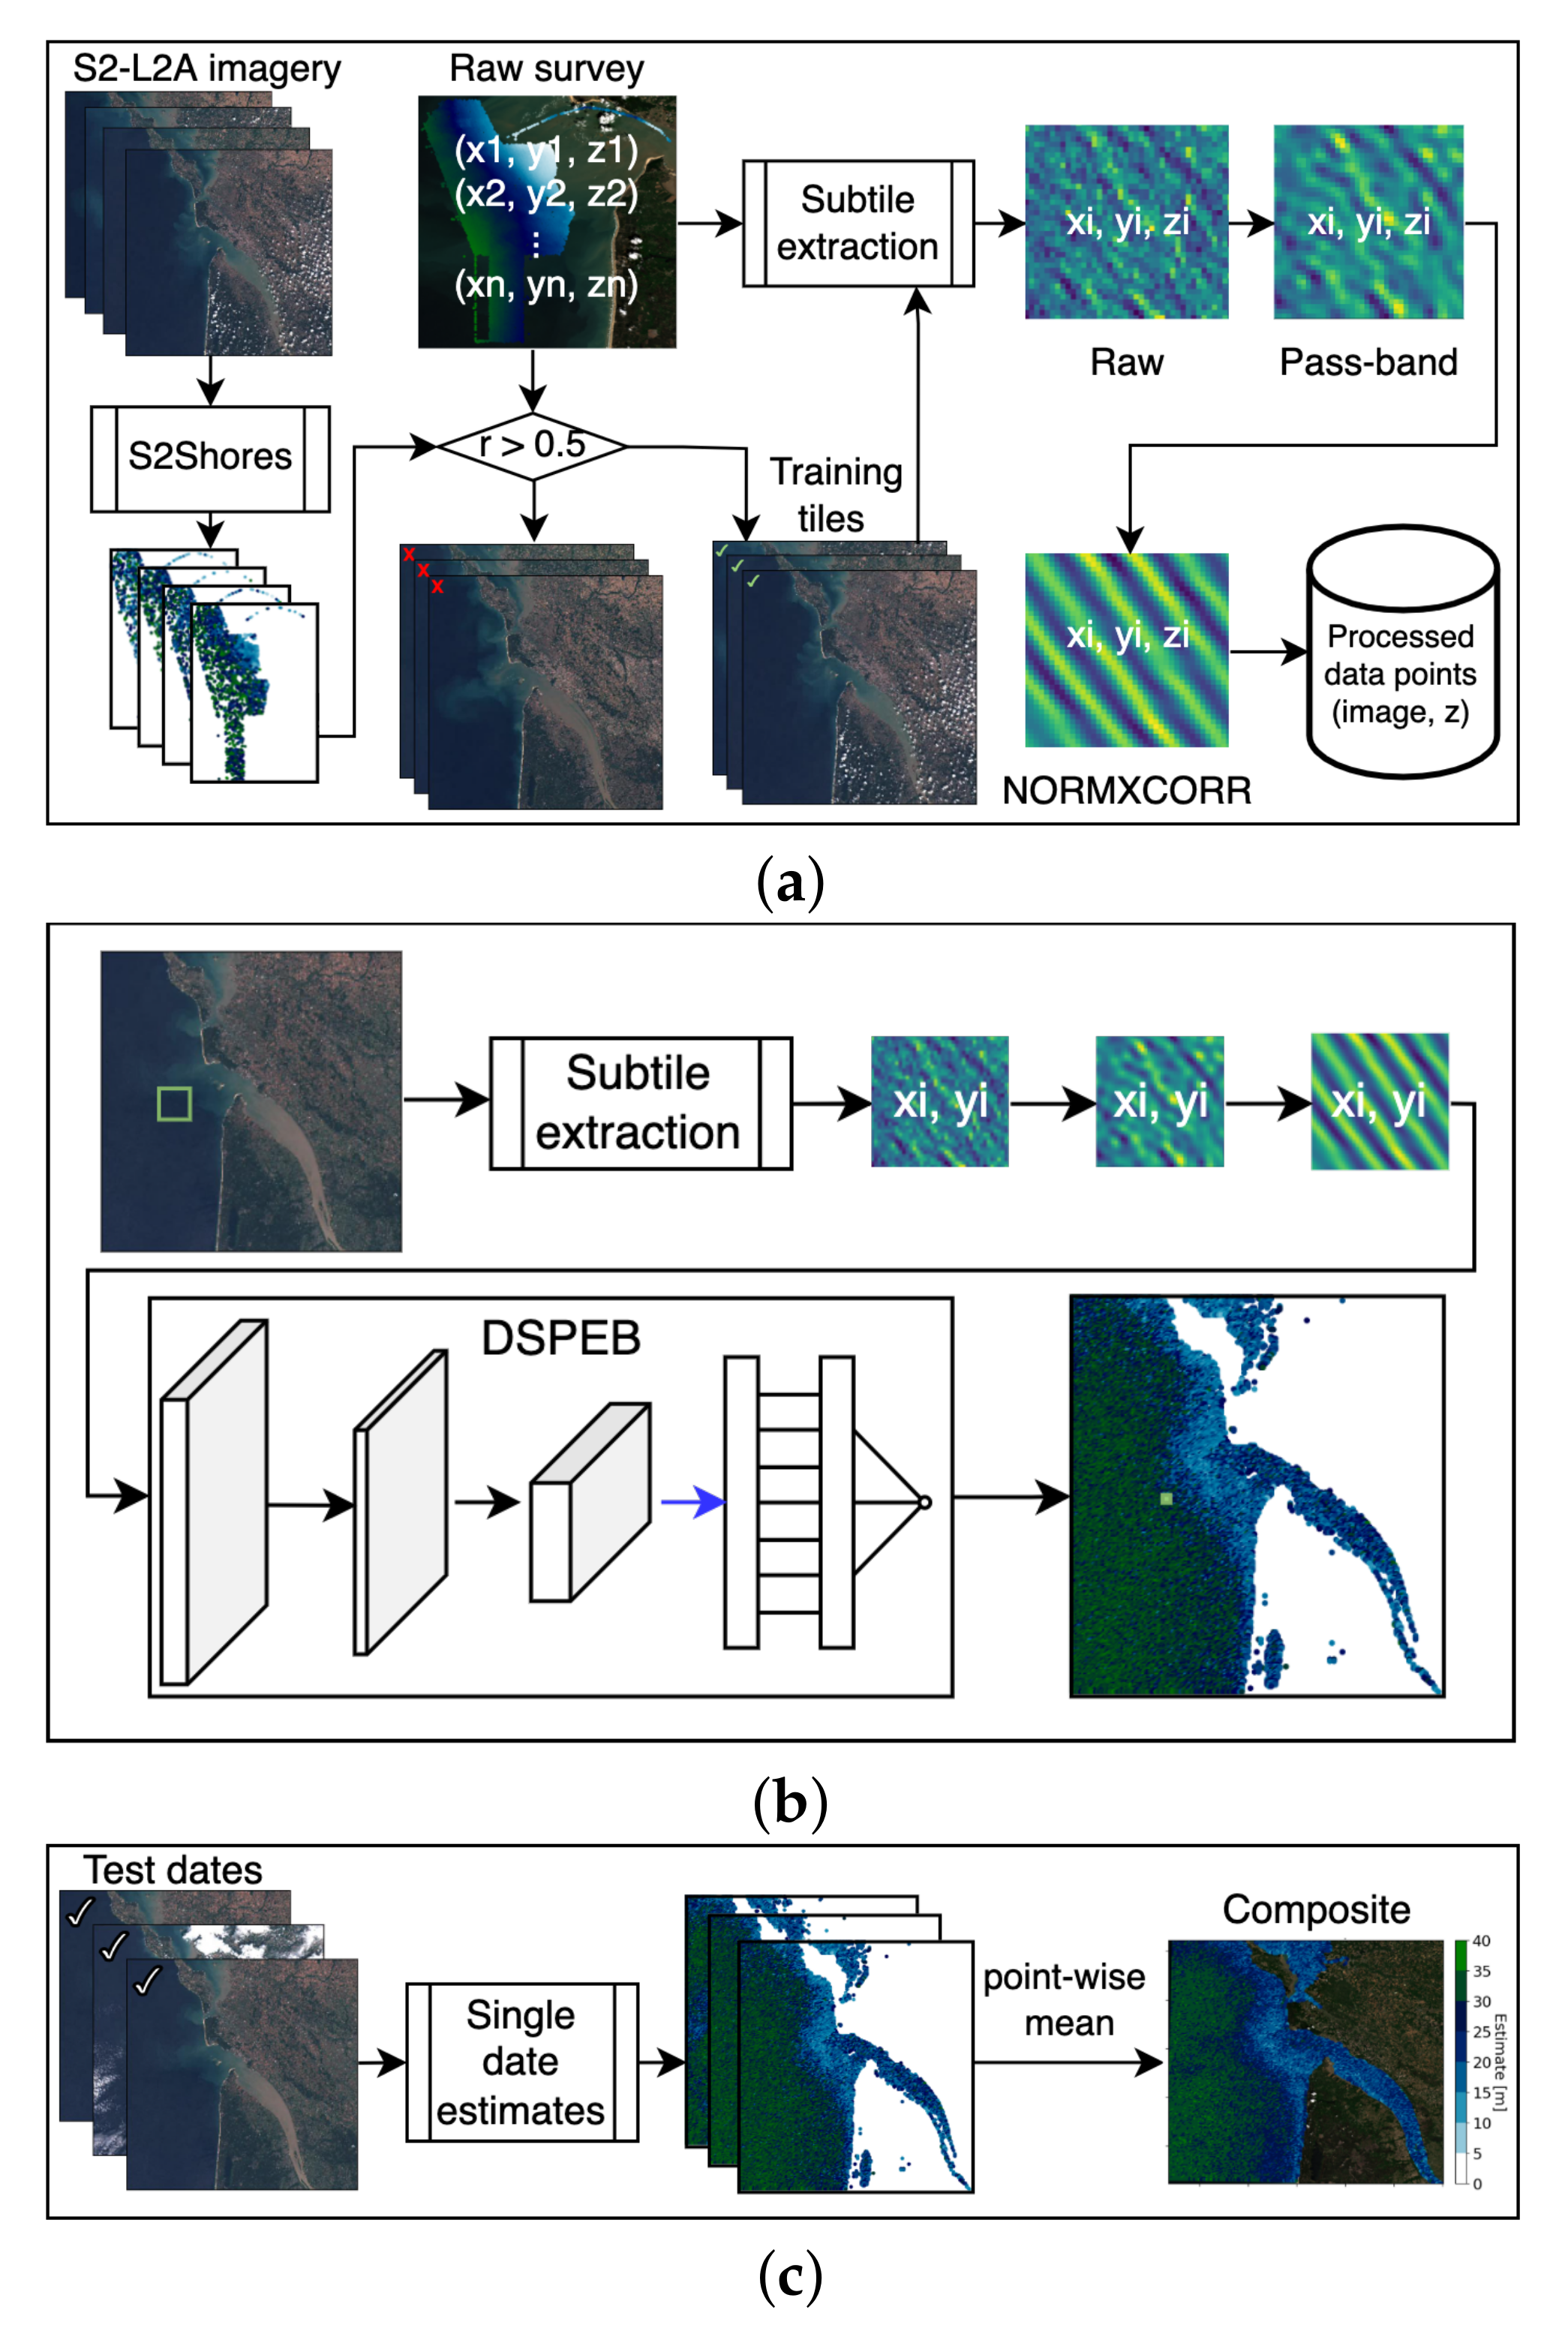
Figure 6a shows the first steps of DSPEB, where the exact dates for model training are selected. The first step in our workflow is concerned with the date preselection, where a set of Sentinel-2 images are filtered and only images where wave propagation and activity can be observed. As mentioned in Section 4, our current date selection criteria is based on S2Shores. Each of the initial images is used with S2Shores and a resulting bathymetry estimate is compared to the target bathymetry survey. The images are only kept in our pipeline if the correlation between S2Shores’ estimate and the target survey is higher or equal to 0.5. Next, a subtile is extracted from each of these images for each depth measurement point, such that the depth point is situated in the center of the extracted subtiles. These subtiles are then passed through our pre-processing chain, described in Section 2.3, subtiles are either pre-processed or recorded on disk to be used for model training. A test dataset is created following the same methodology using a different set of initial Sentinel-2 images with different dates.
The DSPEB model is then trained on the prepared training dataset following the method further described in Section 3.1. After model training, the DSPEB model is used to estimate bathymetry from a Sentinel-2 image using a sliding-window technique (Figure 6b), where each subtile is treated according to the previously described pre-processing scheme (Section 2), resulting in an estimate profile from a single date. Finally, a composite estimate can be created by grouping multiple single-date estimated profiles using a simple point-wise mean (Figure 6c).

3. Research and Results

This section evaluates and compares the performances of wave kinematics-based DSPEB (W-DSPEB), color-based DSPEB (C-DSPEB), and S2Shores. In the following, we analyze our results based on two different criteria. First, Section 3.2 compares the performance of the models in reconstructing bathymetry using a single Sentinel-2 image (single date) as input. Section 3.3 then compares the different models based on aggregate (composite) estimates, which are created by calculating the point-wise mean over all six dates.
The metrics used to evaluate the predictions of each of the models are the root mean squared error (RMSE), the Pearson correlation coefficient (r), the concordance correlation coefficient (CCC) [48], and the slope of the predictions compared to the target depths.

3.1. Model Training

We train the DSPEB models using the Adam optimizer [46], with mean squared error (MSE) loss and a batch size of 256. We optimize the learning process of W-DSPEB and C-DSPEB separately, using a simple grid-search procedure over a predefined set of values for the learning rate ( l r ) and Adam’s hyperparameters ( ϵ , β 1 and β 2 ) as described in our previous work [42]. The best-performing configurations were used to train the models used in this work. The l r , ϵ , β 1 , and β 2 were respectively set to 1 × 10⁻⁴, 1 × 10⁻⁸, 0.99 , and 0.999 for W-DSPEB, and to 1 × 10⁻³, 1 × 10⁻⁶, 0.5 , and 0.9 for C-DSPEB. To stop the training, we make use of an early stopping mechanism that stops training if no improvement in performance on the validation set is achieved for 10 consecutive epochs, known as a patience value of 10. The learning curves of the trained models are presented in Figure 7, showing the models’ errors on the training and validation sets at each training step.
Figure 7 shows the MSE training and validation losses of W-DSPEB and C-DSPEB on both study sites and demonstrates the difference in convergence speed between the two models due to the higher learning rate used for C-DSPEB. We note that W-DSPEB was unable to converge using larger learning rates. The training of W-DSPEB stops at 53 and 29 epochs in French Guiana and Gironde and achieves 4.2 and 5.9 m RMSE on the test set of each site respectively. The training of the C-DSPEB model halted at 30 and 13 epochs and achieves 5.8 and 7.8 m RMSE on the test sets in French Guiana and Gironde.

3.2. Single Date Estimation Comparison

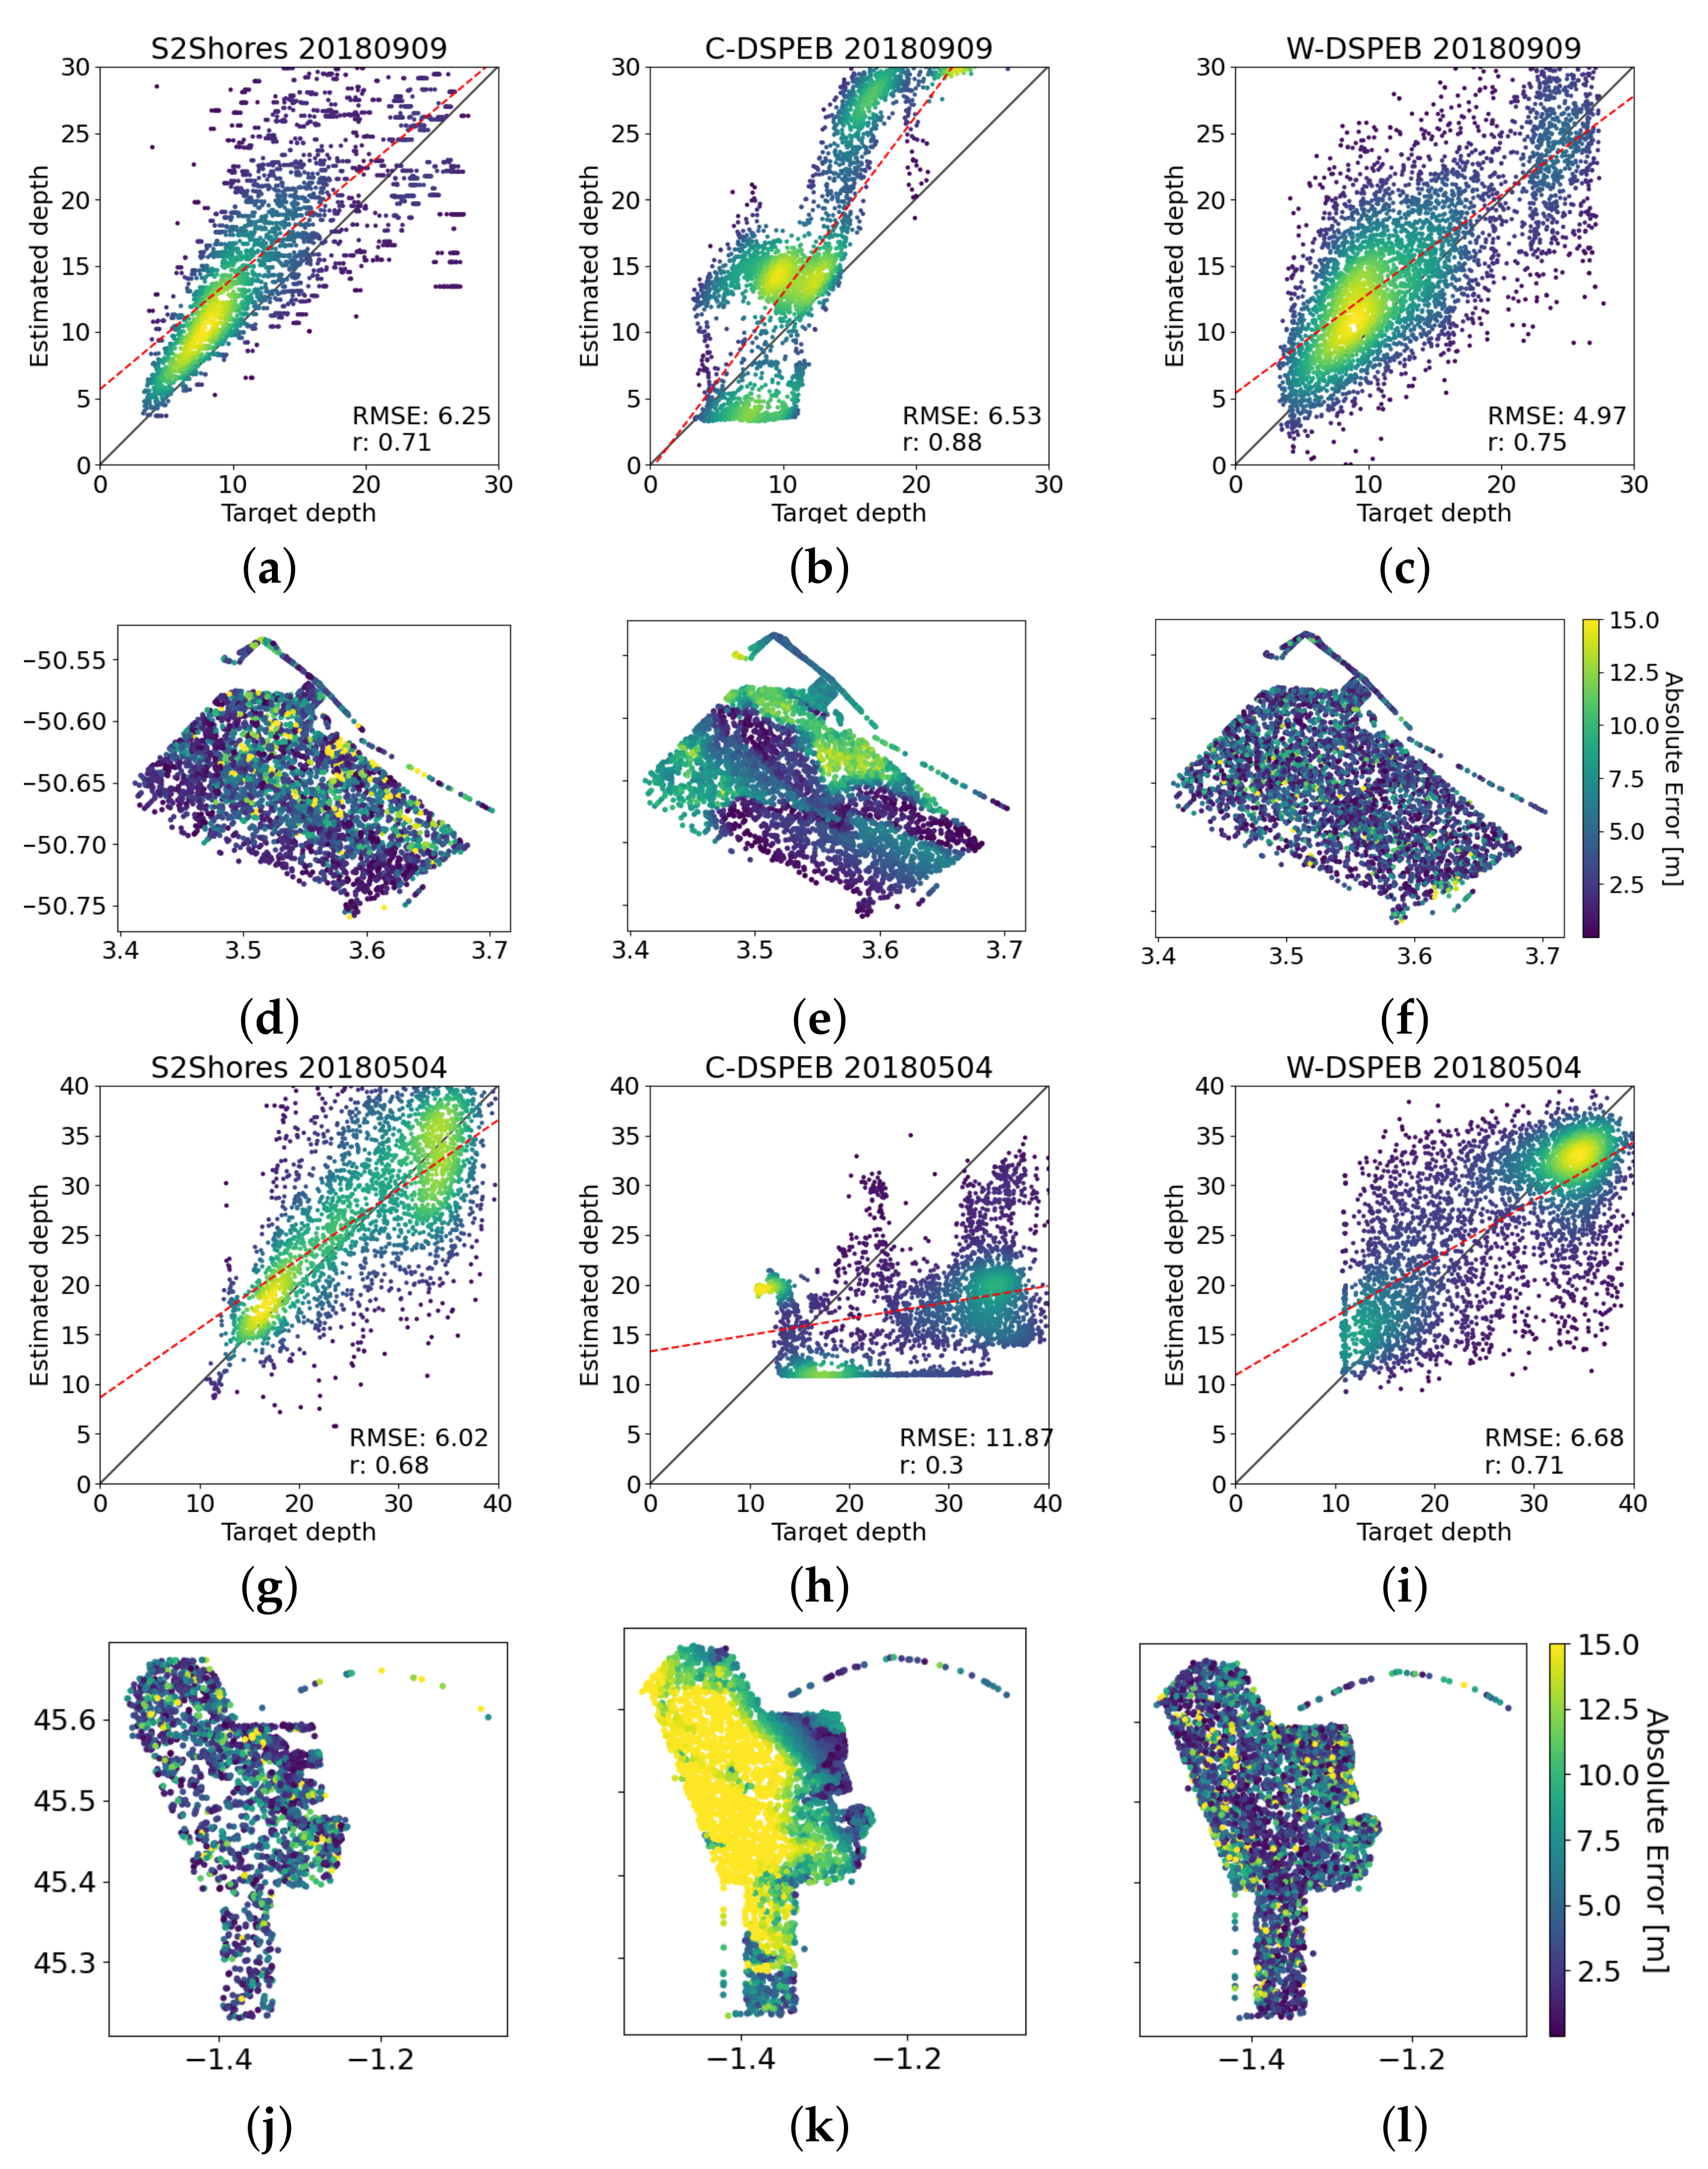
In this subsection, we compare the performances of the wave kinematics-based DSPEB model (W-DSPEB), color-based DSPEB (C-DSPEB), and S2Shores based on their single-date estimates. All test images date to 2018. Six images are collected for the tests in French Guiana, and four images for Gironde. Figure 8 shows an example single-date reconstruction over each of the test sites.
As seen in Figure 8, we note that W-DSPEB outperforms S2Shores on RMSE and correlation in the French Guiana site. While S2Shores predicts shallow depths with high accuracy, W-DSPEB maintains a higher correlation in deeper waters. On the selected date in the Gironde site, we observe a scattered estimate from the W-DSPEB method which has an overall high correlation but is outperformed by S2Shores in terms of RMSE.
The performance of C-DSPEB varied greatly over different dates due to its sensitivity to background color, which we further discuss in the next section. The highest single-date RMSE of C-DSPEB based on the selected dates is 15.26, whereas the lowest single-date RMSE of C-DSPEB in French Guiana was 4.33. We note that this lower RMSE is similar to the performance of other deep learning color-based methods, notably [39], which has an RMSE of 3.03 in San Juan for a single date; Ref. [39] notes that the performance of the color-based deep learning model highly depends on water turbidity, which we observe here in the difference of prediction between different dates.
We note that the training of both deep learning models C-DSPEB and W-DSPEB uses gradient estimates from mini-batches which can contain multiple dates together. The same point may therefore have multiple estimates attributed to it from different satellite images, and the gradient directions from these estimates will be averaged for the network update. We hypothesize that a training method focused on accuracy for a single date could improve the variability of estimates for the same date.

3.3. Composite Estimation Comparison

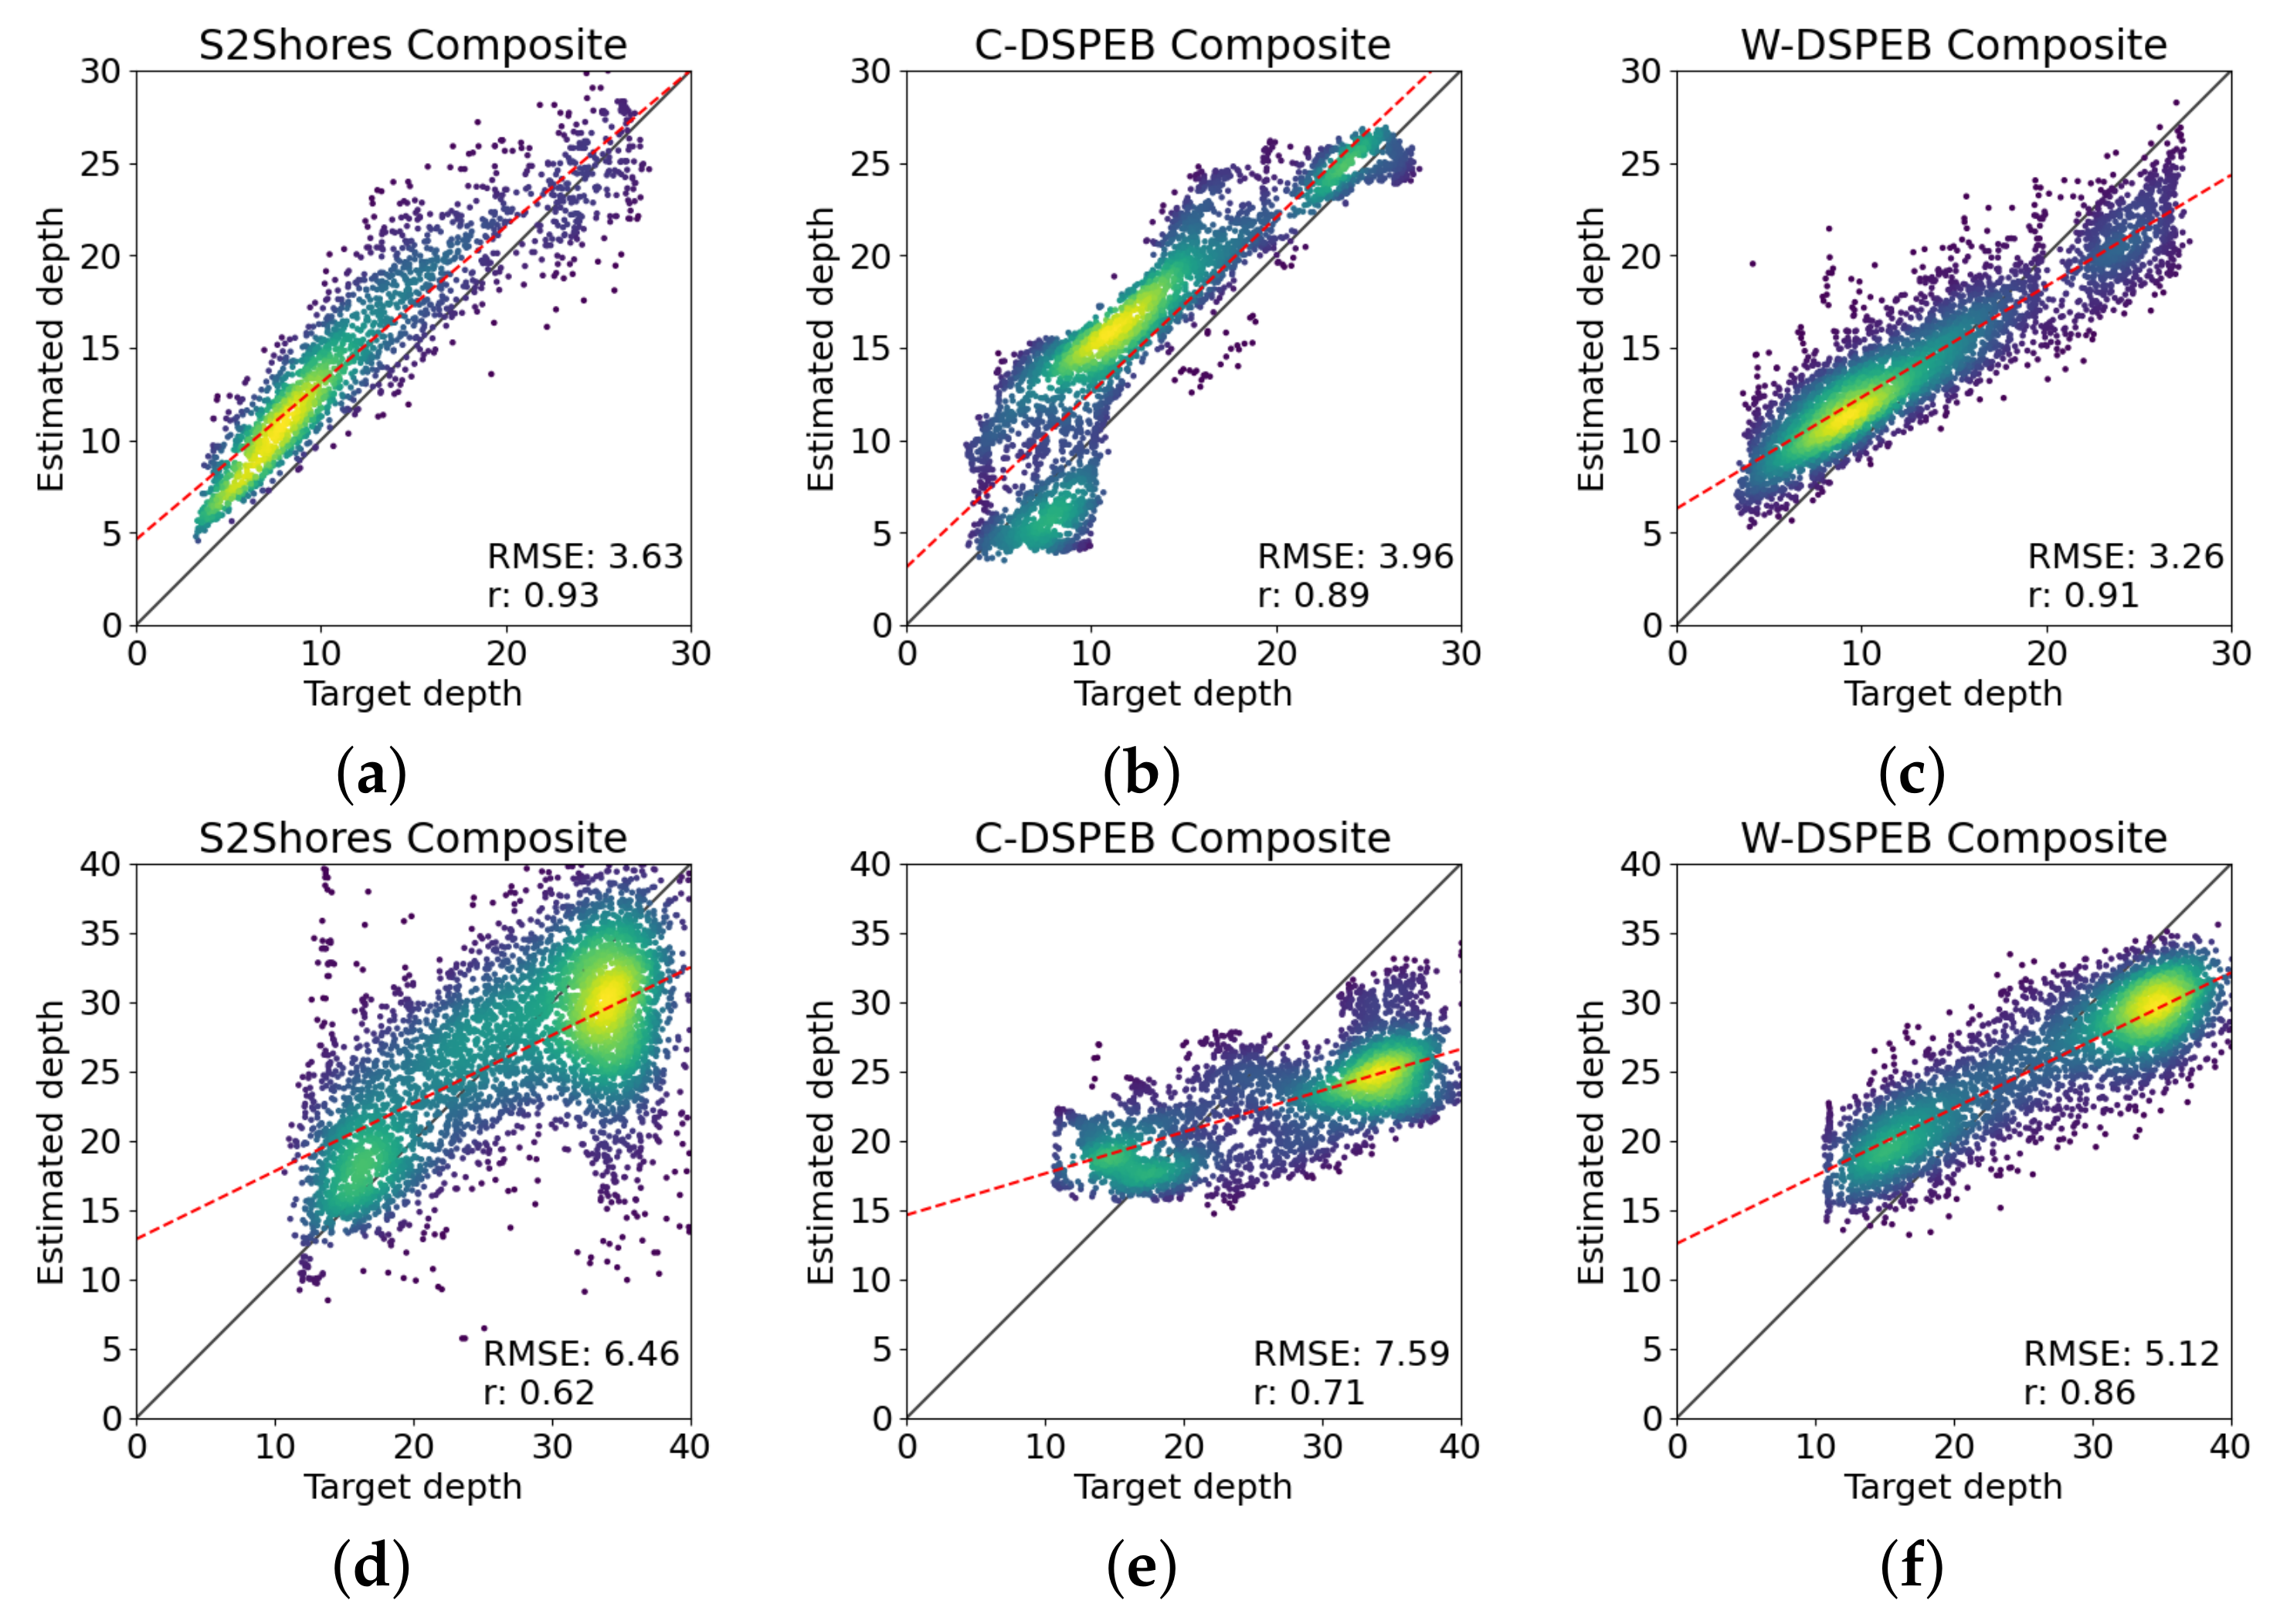
We observed that all three models performed inconsistently over Sentinel-2 images from different dates, which motivated the use of a composite estimate from multiple dates. For each model, a composite profile is created by calculating a point-wise average over selected dates (six for French Guiana and four for Gironde). In this section, we compare the composite estimates of W-DSPEB, C-DSPEB, and S2Shores, and further detail is provided in Appendix B, including the point-wise absolute errors of the final estimates as well as the point-wise standard deviation of each method’s single date estimates. Figure 9 presents the composite estimate of each of the models at French Guiana (top) and Gironde (bottom).
Compared to S2Shores and C-DSPEB, W-DSPEB achieves the lowest RMSE score over the entire bathymetry profiles in both test sites when a composite profile is considered. W-DSPEB also achieves a similar correlation to the S2Shores model on the French Guiana site and a much higher correlation on the Gironde site. We note that the use of a composite estimate appears to reduce outliers with high error in the two deep learning methods, but not in S2Shores. We assume that this is due to the batched training of the deep learning methods which tend to improve the average estimate of the models over multiple dates, as previously mentioned. All three methods, including S2Shores, benefit from a composite estimate over multiple dates rather than a single-date estimate. The composite results of the three methods are analyzed further in Table 1.
Table 1 shows that when using composite estimates, W-DSPEB outperforms S2Shores on almost all metrics for the two sites (correlation, RMSE, and standard deviation over individual estimates). On two metrics, it is slightly worse but competitive with S2Shores: W-DSPEB has a correlation of 0.91 in French Guiana compared to 0.93 for S2Shores, and it has a slightly higher standard deviation over the 4 estimates from different dates in Gironde (4.01 versus 3.89). We note that W-DSPEB has an overall low temporal STD, which is averaged over the entire area, even in Gironde where single date estimates had high error.
Compared to the wave kinematics-based methods, we observe a higher temporal variance from the color-based method C-DSPEB. In Figure 10, the sensitivity of C-DSPEB to background color change is evident as the prediction is highly influenced by turbidity. This variance due to turbidity has been noted in other deep learning approaches [39]. While other color-based methods may account for this variance, we consider it a strong argument for W-DSPEB over C-DSPEB.
When using the DSPEB methods to estimate bathymetry over a large area, as seen in Figure 11, we note the stability of the W-DSPEB method. This correctly predicts water depth around the coastline and up to 35 m of depth. We note the limit at 40 m, as these models were trained with samples only up to 40 m, and therefore do not predict greater values even in deeper waters.

4. Discussion

In this work, we have shown that deep learning can be used for SDB using wave kinematics information as well as color. We have evaluated the performance of a deep learning SDB approach (DSPEB) on real data using Sentinel-2 satellite imagery. We propose two different variants of DSPEB based on wave kinematics (W-DSPEB) and color (C-DSPEB; Section 2.3) and we compare them to a state-of-the-art physics-based SDB method, S2Shores [24,43], on two different sites. We show in Section 3.3 that the use of composite estimates over multiple dates compared to single-date estimates improves the performance of all methods tested. We show that the performance of the deep learning-based model (W-DSPEB) exceeds that of the physical method (S2Shores) and the deep learning color-based method (C-DSPEB) in correlation, RMSE, and temporal standard deviation on two test sites. W-DSPEB achieves an RMSE of 3.26 m in French Guiana and of 5.12 m in Gironde. While this does not yet meet international standards for bathymetry surveys, it demonstrates that deep learning can be applied to both spectral and wave kinematic information for coastal SDB, rivaling existing physics-based models.

4.1. Research Implications

We believe that this work has implications both for satellite-derived coastal bathymetry estimation and deep learning for Earth observation. We highlight the possibility to integrate wave and color information for SDB and the application of deep learning to physical modeling.
Color information is often used to estimate coastal bathymetry [20,21,22,25,26,27], but these methods can be sensitive to site and/or season-specific features such as turbidity and bottom reflectance. In this work, we observed a high sensitivity of our color-based model C-DSPEB to the background color, which led to high uncertainty in the estimated profiles. We propose that a wave kinematics-based method would have the potential for global application, which would be difficult with color-based estimation.
This work demonstrates that physical information, i.e., wave kinematics, can be used by deep neural networks for estimation. This follows a recent trend in machine learning for Earth system science where machine learning models use information from existing physical models [49]. W-DSPEB is a deep learning regression model based on physical information, which is a relatively unexplored model type as deep learning is more often used in classification tasks [50].

4.2. Limitations

While the results we present show that DSPEB is capable of reconstructing bathymetry, there are limitations to the current method. Specifically, we highlight the limitations of data pre-selection based on dates and the requirement to train on application sites.
The accuracy of W-DSPEB was found to be sensitive to the dates selected, as was S2Shores, indicating that the necessary wave kinematics information was lacking for certain dates. Currently, S2Shores is used as a date-selection method to dictate which images can be used for training W-DSPEB at a certain site, requiring large amounts of computing time before dataset construction. A possible solution to this limitation could be the use of a CNN as a binary classifier to dictate whether a Sentinel-2 image contains the necessary information for W-DSPEB. Such a model would greatly minimize the amount of computing power required for date selection, in addition to providing insight into this issue. Breaking this limitation is important in order to achieve the operational requirements of the International Hydrographic Organization (IHO).
Another limitation of DSPEB is that it currently requires local training before application, limiting the model to sites with existing survey data. A future direction of this work is to use trained models from individual sites and fine-tune them to unseen sites. Applying a network to a site for which no survey data is available is also a goal but requires further study in developing models capable of zero-shot learning [51].

4.3. Future Research

Beyond addressing the limitations of the current approach, DSPEB opens many directions that could be explored further. We believe that single-date estimation and a global model which combines wave and color information are important directions for future work.
The results presented in this work show the improvement of accuracy when integrating estimations from multiple dates to create a composite estimate, compared to using the original single-dates estimates. However, a model capable of obtaining single-date estimates with accuracy similar to the composite estimates would be preferable. As mentioned in Section 3.2, an interesting path for future work would be to design the training scheme to maximize single-date accuracy specifically (through e.g., training batch management). We also believe that study of the estimation variability between dates for wave kinematics-based methods such as W-DSPEB and S2Shores can lead to improvements for single-date SDB estimation.
A potential direction for SDB is to combine wave and color information to achieve local estimates with high accuracy and global applicability. In Appendix E, we explore a hybrid model which combines estimates from W-DSPEB and C-DSPEB. While the results from this experiment were inconclusive, with the hybrid model performing worse than W-DSPEB in some cases, we strongly believe that a combined model incorporating both types of methods (color-based and wave kinematics-based methods) is the way forward to unlock and extend the applicability of SDB to a global scale covering all types of coastal waters and coastal depths. While we present H-DSPEB as our first steps in this direction by engineering a hybrid model, other possibilities exist including traditional and/or deep learning-based data assimilation techniques for example [52].
A fundamental direction for future research in deep learning-based SDB is the development of a singular model which can be applied directly to sites without training. Such a model would require the inclusion of multiple sites in a single training dataset (mixed-site training), which should minimize the model’s ability to overfit to any site-specific features, and consequently increase the model’s ability to generalize to previously unseen sites. We also expect that it would need to include both wave kinematic information and color information, as proposed above. In this work, we demonstrate first steps in this direction with local site training of deep learning models using wave kinematics and color information, showing that deep learning can outperform existing physical methods for coastal bathymetry estimation.

5. Conclusions

This work showcases the performance of the W-DSPEB approach to satellite-derived bathymetry based on wave kinematics using deep convolutional neural networks and Sentinel-2 satellite imagery. In a direct comparison, W-DSPEB is shown to be competitive with a state-of-the-art physics-based SDB method, S2Shores, achieving RMSE performance of 3–5 m over areas reaching 40 m depths.
The wider applicability of wave kinematics-based approaches for SDB is demonstrated through a comparison with C-DSPEB, a color-based variant of DSPEB, showing a promising direction towards a more global application of wave kinematics-based SDB.
The use of composite bathymetry profiles over estimates from single dates is discussed and in shown to improve the test RMSE performance of all methods included in this study by ≃50%.
Finally, considering the impressive capabilities deep learning has recently demonstrated in image processing and model inversion applications, we strongly believe that the H-DSPEB model architecture presented in Appendix E is a strong motivation for further exploration in deep learning-based methods for satellite-derived bathymetry.

Author Contributions

Conceptualization, M.A.N., G.T., R.A., E.W.J.B. and D.G.W.; data curation, M.A.N., Y.E.B. and G.T.; formal analysis, M.A.N., Y.E.B., G.T., R.A., E.W.J.B. and D.G.W.; funding acquisition, R.A., R.B. and D.G.W.; investigation, M.A.N., Y.E.B. and G.T.; methodology, M.A.N., R.A., E.W.J.B., R.B., J.-M.D. and D.G.W.; project administration, M.A.N., R.A. and D.G.W.; resources, R.A., R.B. and D.G.W.; software, M.A.N., Y.E.B. and G.T.; supervision, M.A.N., R.A., E.W.J.B., R.B., J.-M.D. and D.G.W.; validation, R.A., E.W.J.B., R.B., J.-M.D. and D.G.W.; visualization, M.A.N.; writing—original draft, M.A.N. and D.G.W.; writing—review and editing, M.A.N., R.A. and D.G.W. All authors have read and agreed to the published version of the manuscript.

Funding

M.A.N. was partly funded by the STAE Foundation (Sciences et Technologies pour l’Aéronautique et l’Espace) and is currently supported by the CNRS (Centre National de la Recherche Scientifique). Y.E.B. was funded by the IRD institute (Institut de Recherche pour le Développement) and is currently supported by the Computer Science Research Institute of Toulouse (IRIT). G.T. was partly funded by the STAE Foundation and is currently funded by the IRD institute. All experiments were conducted on the CNES-HPC cluster HAL, granted as part of M.A.N.’s thesis contract.

Institutional Review Board Statement

Not applicable.

Informed Consent Statement

Not applicable.

Conflicts of Interest

The authors declare no conflict of interest. The funders had no role in the design of the study; in the collection, analyses, or interpretation of data; in the writing of the manuscript, or in the decision to publish the results.

Appendix A. Data Used in This Work

Table A1. A log of all Sentinel-2 images used in this work.
SiteSentinel-2 Image ID
GuyaneSENTINEL2B_20180417-140050-461_L2A_T22NCL_D_V1-7
SENTINEL2A_20180711-140053-463_L2A_T22NCL_D_V1-8
SENTINEL2A_20180731-140053-455_L2A_T22NCL_D_V1-8
SENTINEL2A_20180909-140049-464_L2A_T22NCL_D_V1-9
SENTINEL2B_20181024-140049-459_L2A_T22NCL_D_V1-9
SENTINEL2A_20181228-140102-278_L2A_T22NCL_D_V1-9
SENTINEL2B_20190919-140108-144_L2A_T22NCL_D_V2-2
SENTINEL2A_20200809-140115-000_L2A_T22NCL_D_V2-2
SENTINEL2B_20200814-140112-512_L2A_T22NCL_D_V2-2
SENTINEL2B_20200824-140112-496_L2A_T22NCL_D_V2-2
SENTINEL2A_20200918-140113-715_L2A_T22NCL_D_V2-2
SENTINEL2B_20201023-140112-483_L2A_T22NCL_D_V2-2
SENTINEL2A_20201107-140113-483_L2A_T22NCL_D_V2-2
GirondeSENTINEL2A_20160504-105917-634_L2A_T30TXR_D_V1-1
SENTINEL2A_20170618-110415-683_L2A_T30TXR_D_V1-4
SENTINEL2B_20180419-110127-730_L2A_T30TXR_C_V2-2
SENTINEL2A_20180504-110230-455_L2A_T30TXR_C_V2-2
SENTINEL2A_20180802-105938-888_L2A_T30TXR_C_V2-2
SENTINEL2B_20180817-110514-624_L2A_T30TXR_C_V2-2
SENTINEL2B_20190325-110833-768_L2A_T30TXR_C_V2-0
SENTINEL2B_20190424-110839-893_L2A_T30TXR_C_V2-0
SENTINEL2B_20190524-110841-657_L2A_T30TXR_C_V2-1
SENTINEL2B_20190703-110841-774_L2A_T30TXR_C_V2-2
SENTINEL2A_20190906-110832-459_L2A_T30TXR_C_V2-2
SENTINEL2A_20200622-110838-839_L2A_T30TXR_C_V2-2
SENTINEL2A_20210717-110836-344_L2A_T30TXR_C_V2-2

Appendix B. Detailed Composite Results
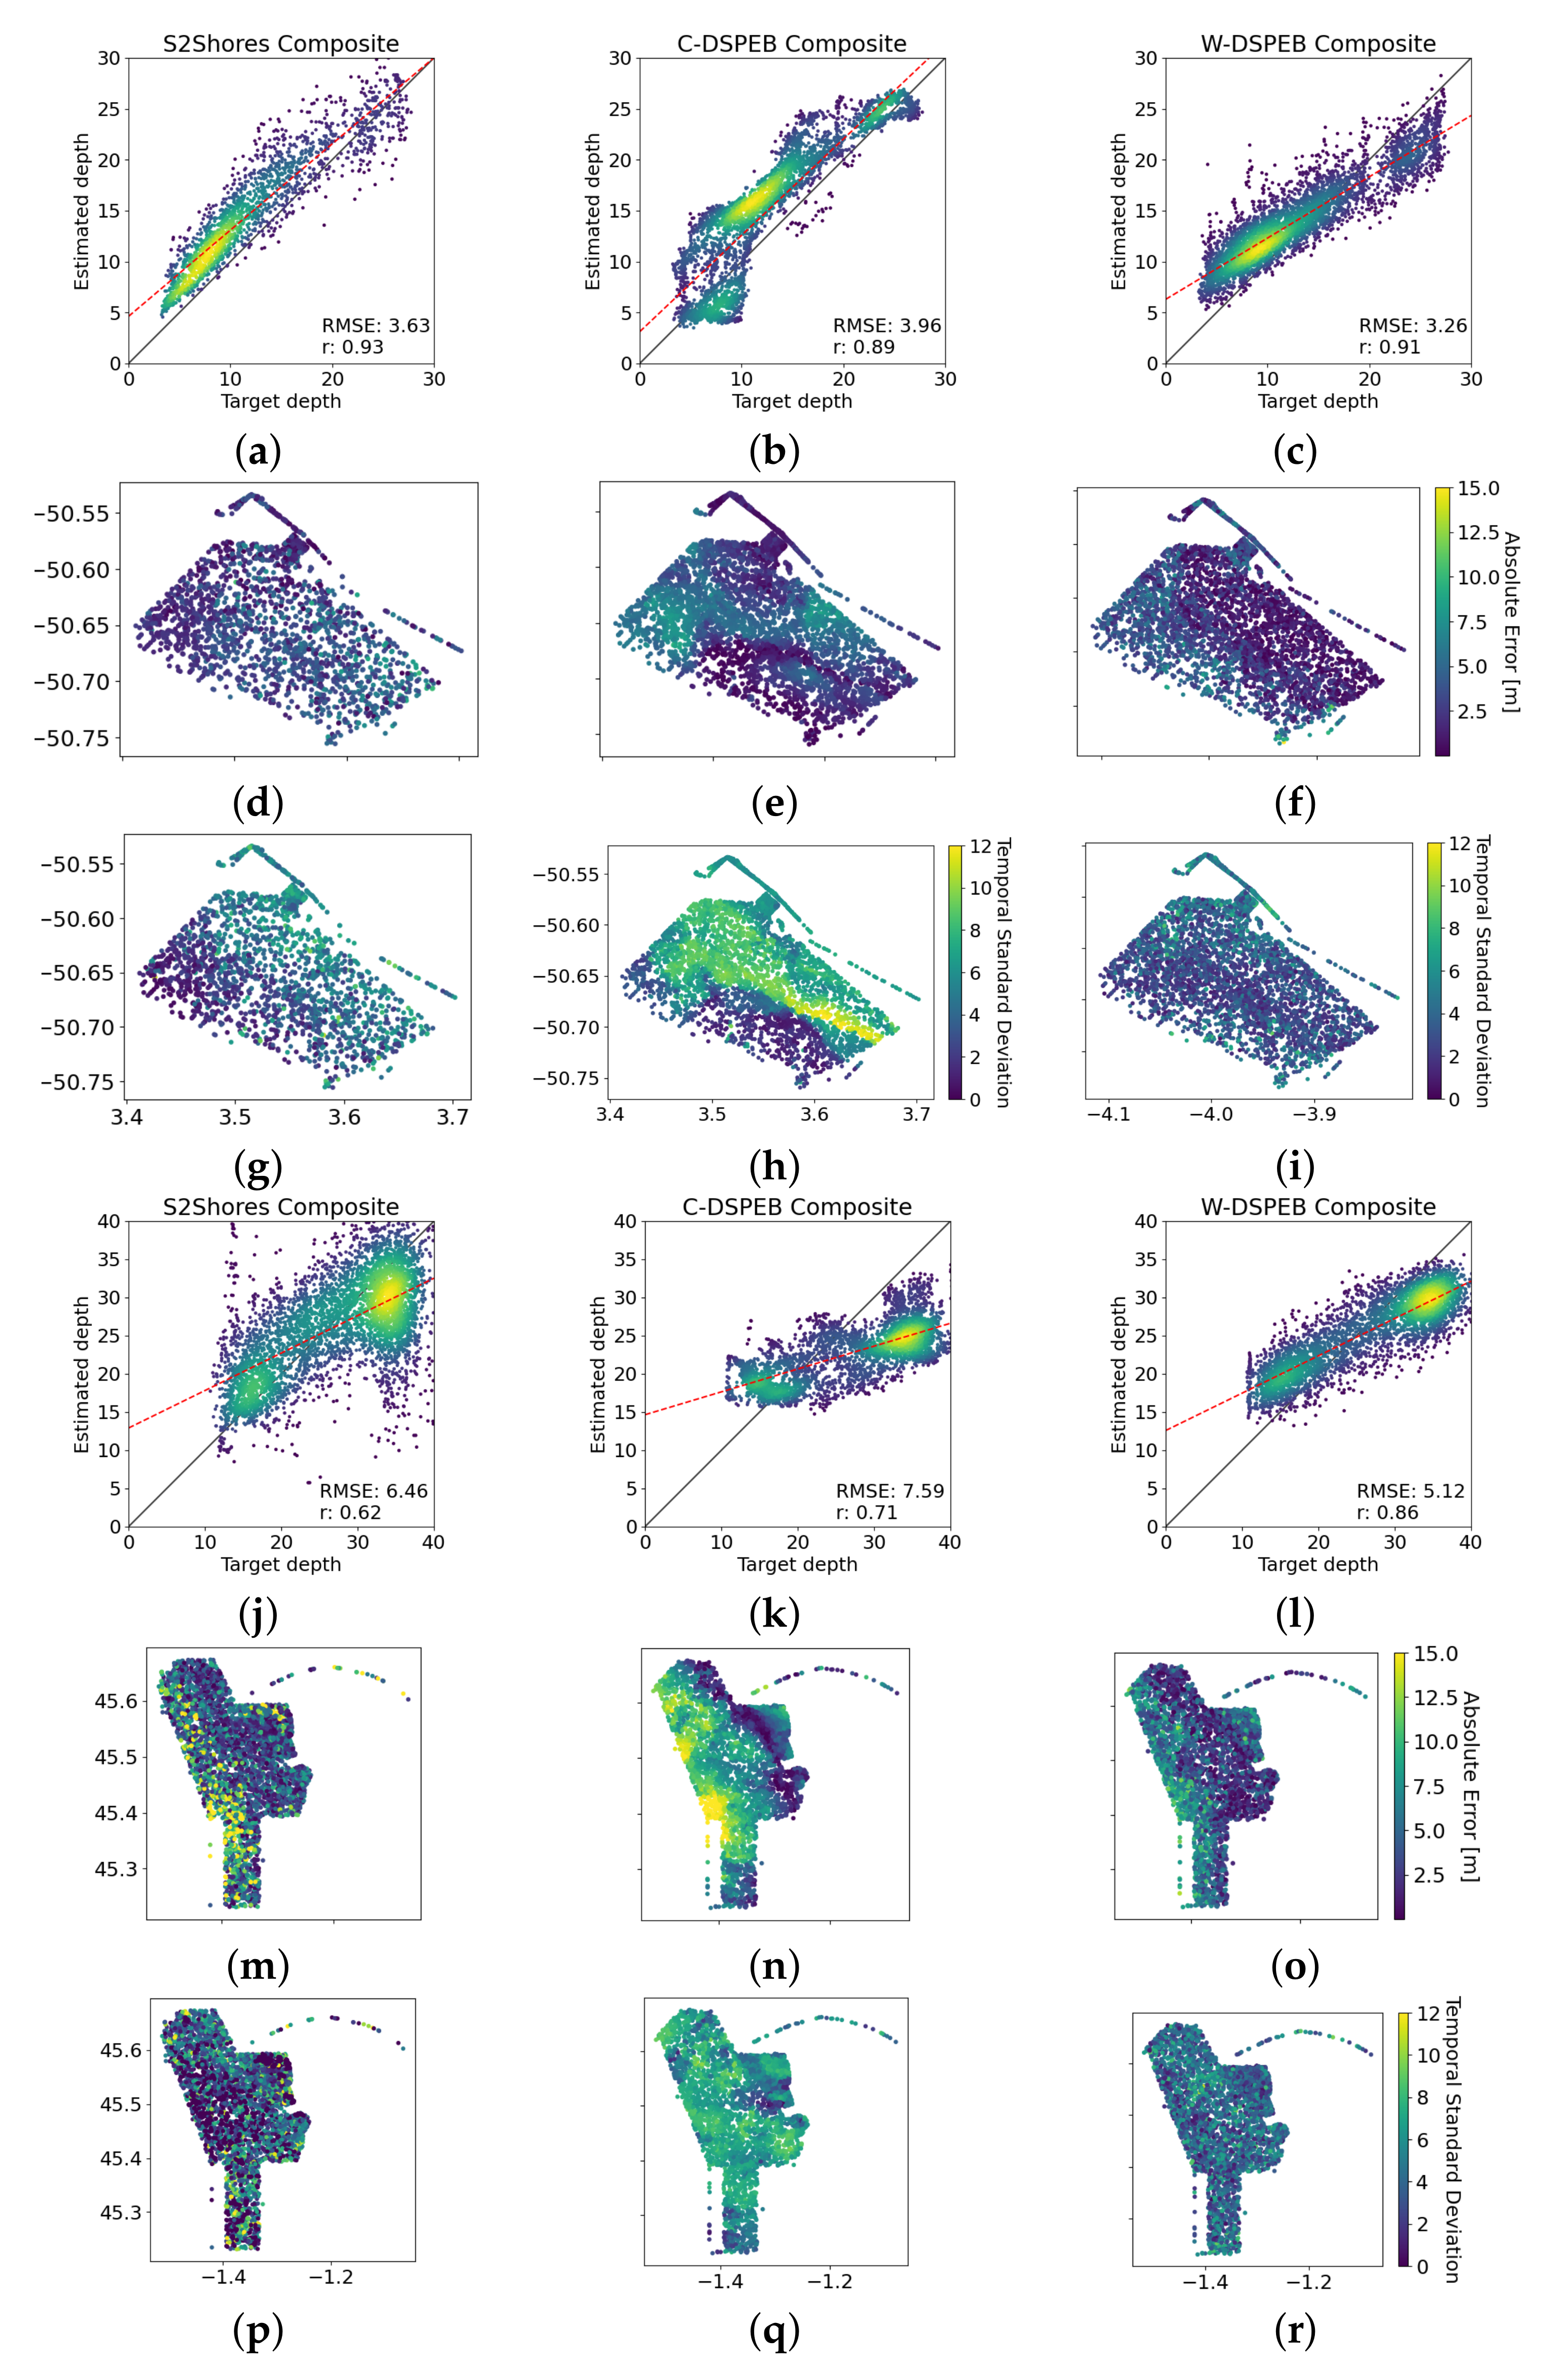
Figure A1. Composite estimation comparison of—from left to right—S2Shores, C-DSPEB, and W-DSPEB in French Guiana (ai) and Gironde (jr). (ac) Correlation with the target depths; (df,mo) The point-wise absolute error; (gi,pr) The point-wise standard deviation over the dates used to calculate the composite estimate at each site.
Remotesensing 14 01196 g0a1

Appendix C. Single Date Results

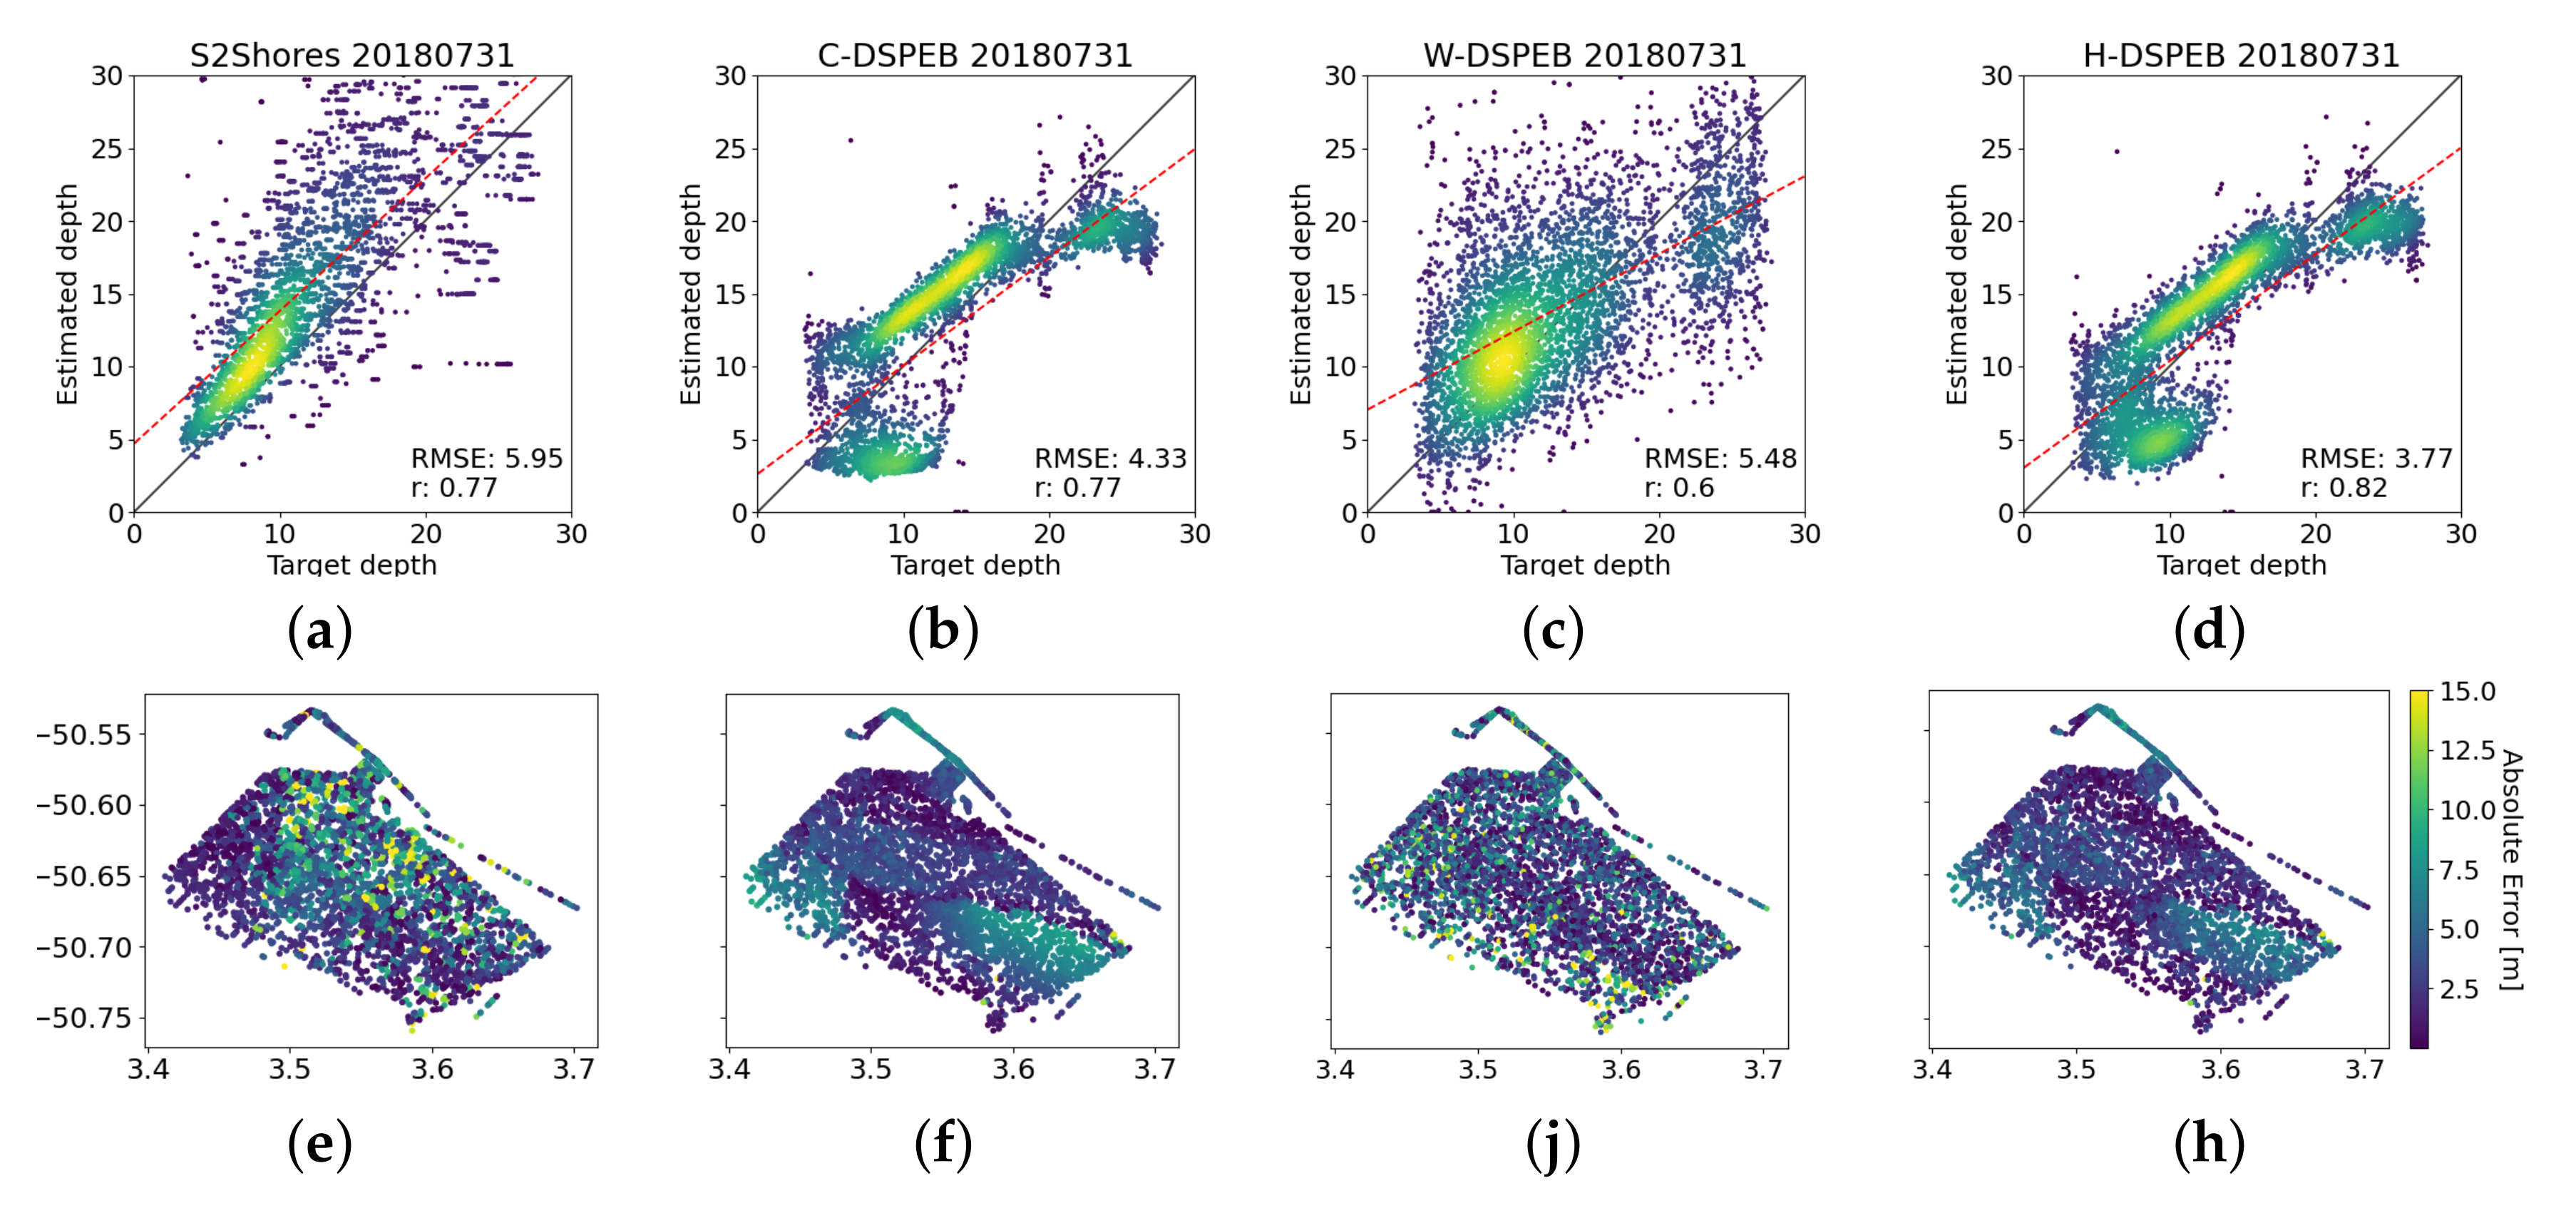
Figure A2. Comparison of—from left to right—S2Shores, C-DSPEB, W-DSPEB, and H-DSPEB over a single Sentinel-2 image of French Guiana. (ad) Correlation with the target depths. (eh) The point-wise absolute error.
Remotesensing 14 01196 g0a2

Appendix D. French Guiana Composite over the Full Water Body
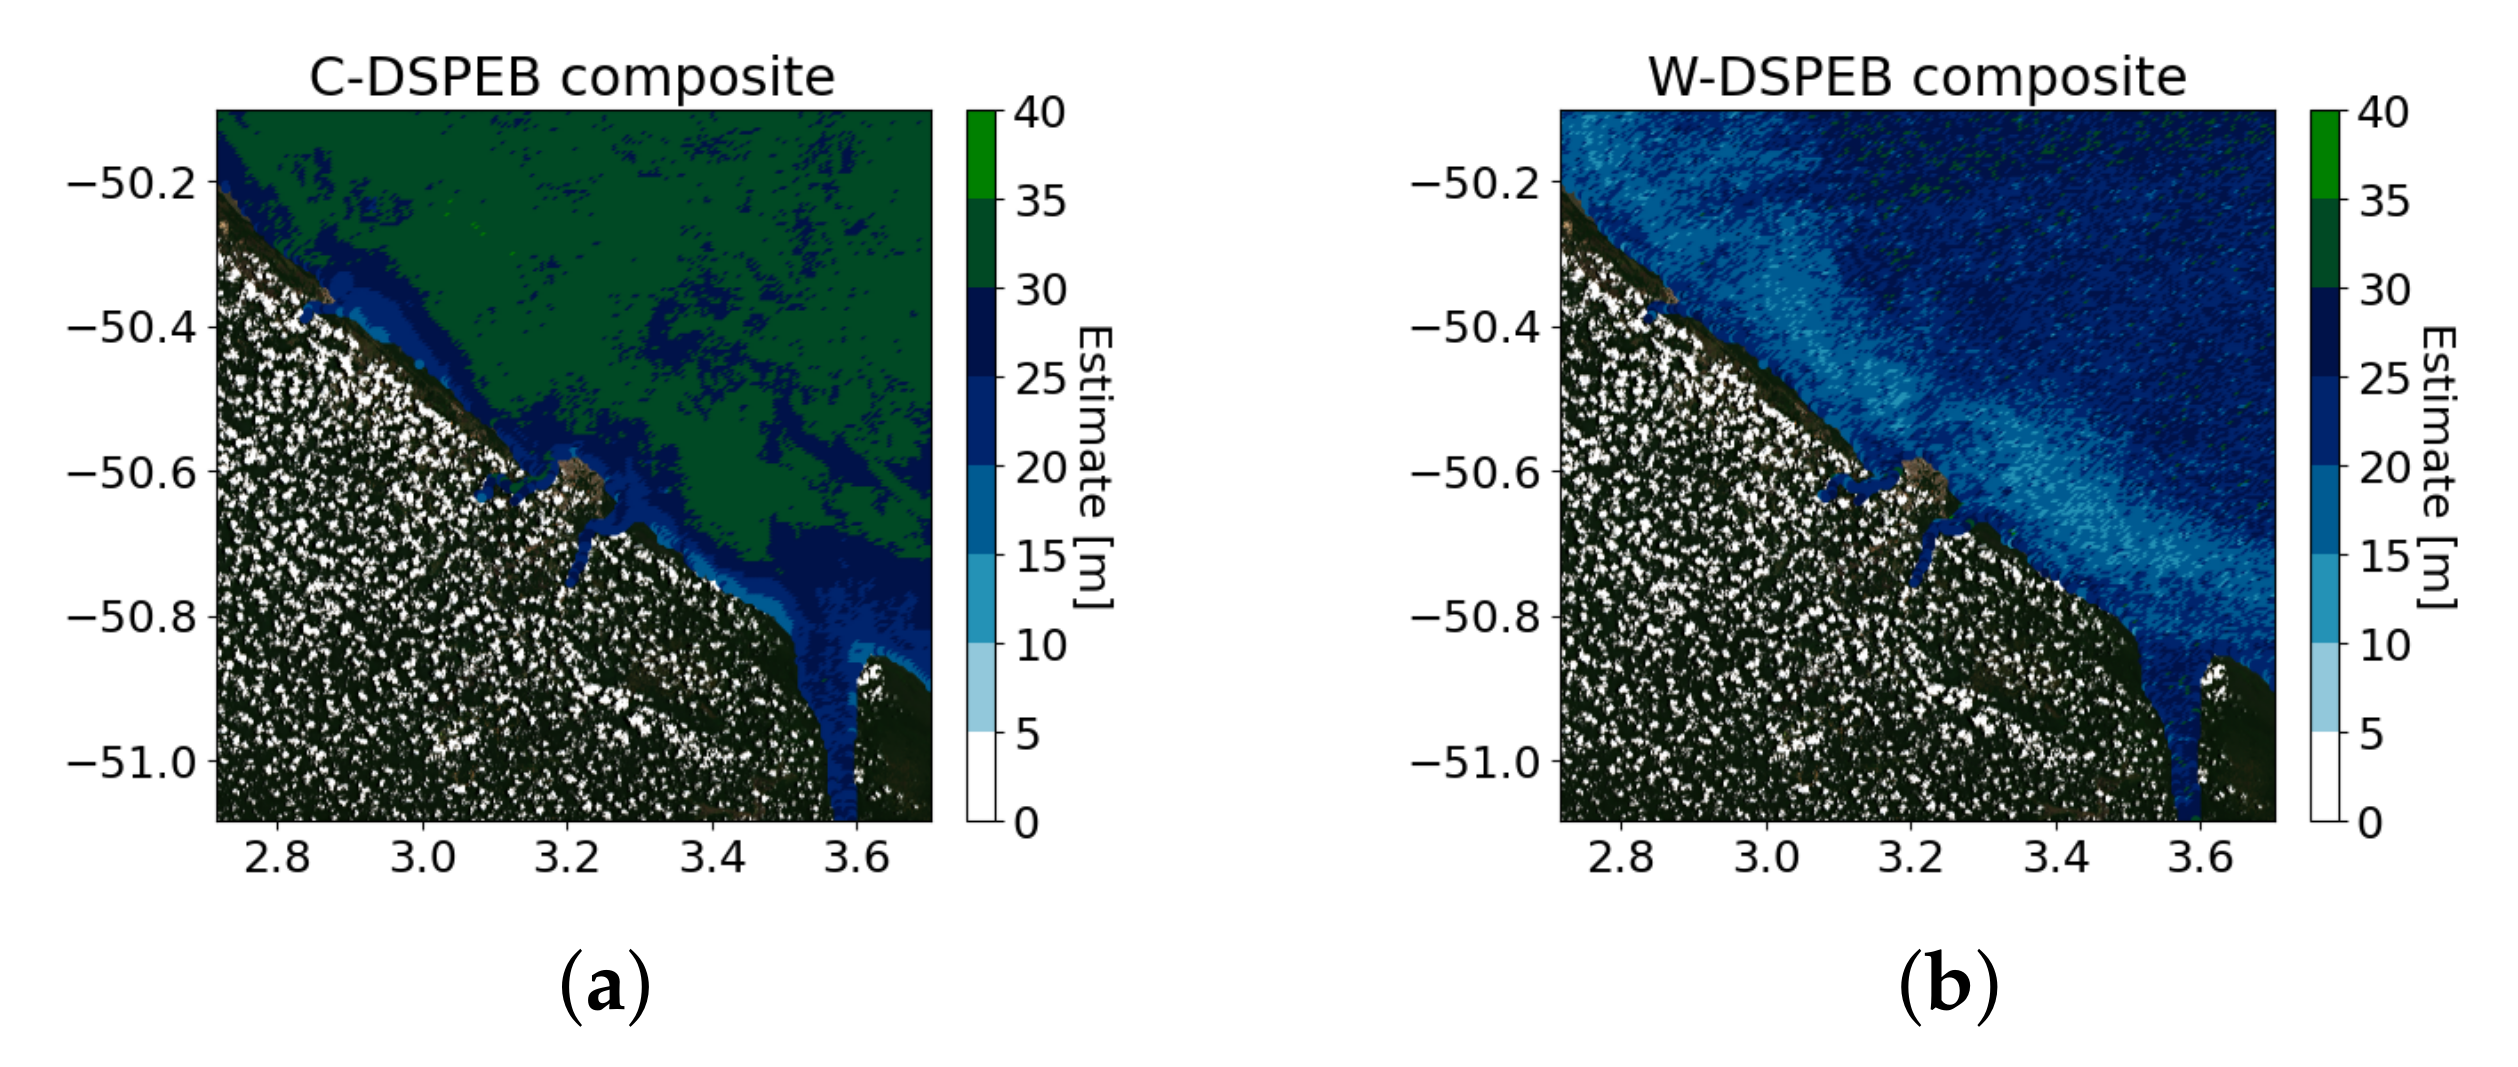
Figure A3. Reconstruction of a full Sentinel 2 tile in French Guiana using composite estimates from C-DSPEB (a) and W-DSPEB (b). The bathymetry survey data used for French Guiana is presented in Figure 3. The white spots in the image correspond to clouds over land areas.
Remotesensing 14 01196 g0a3

Appendix E. Hybrid-DSPEB Model

Previous work in deep learning for computer vision has proposed multi-input convolutional neural networks to improve performance on tasks where different views of the same input are useful for approximating a single output. This can be done by grouping multiple neural networks, or duplicating a single network architecture, through an MLP-like architecture near the output of the merged network [53,54,55]. In this experiment, we follow a similar methodology to create a hybrid model (H-DSPEB). We merge the output layers and the last fully connected layers of each of the two pretrained C-DSPEB and W-DSPEB models, forming the final output head of H-DSPEB. The architecture of H-DSPEB can be seen in Figure A4 (right).
Figure A4. The architectures of the three models C-DSPEB (top left), W-DSPEB (bottom left), and H-DSPEB (right). The blue arrows represent non-parametric connections (flattening layer). Dotted lines represent pre-trained layers that are frozen during H-DSPEB training.
Remotesensing 14 01196 g0a4
The MLP head which we append to the end of the two pre-trained models is composed of two new fully connected layers which connect to the last hidden layer of each sub-model, in addition to the output layer of each of the sub-models. The single output of the MLP head corresponds to the final output of H-DSPEB. We tested various architectures for the MLP head but noted little difference in performance. During training, we freeze all previously trained weights in C-DSPEB and W-DSPEB, as indicated by the dotted lines in Figure A4.
The aim of this architecture is to evaluate whether color and celerity information can be automatically combined for enhanced estimation, due to the different conditions in which these two model types function. By including higher-level features from the final layer, our goal is that the hybrid model learns to estimate depth using both color and celerity information. Because the two approaches are complementary for clear and turbid waters, contrary to previous deep learning bathymetry inversion applications, the combination of the two unlocks the potential of inversion of the bathymetry from a satellite at any coast worldwide. While the principal contribution of this work is the W-DSPEB method, we find the H-DSPEB idea to be motivating and deserving of further study.

Hybrid H-DSPEB Preliminary Results

In this section, we present our preliminary results using H-DSPEB and we evaluate its performance in a comparison to the results of DSPEB submodels and S2Shores presented in previous sections.
Figure A5 presents two example results obtained using H-DSPEB in the French Guiana site. The pattern produced by H-DSPEB in both single-date and composite estimates suggests that the model learns to rely on the C-DSPEB submodel more than W-DSPEB. We presume this is due to the higher accuracy of C-DSPEB on the training and validation sets compared to W-DSPEB in French Guiana, as can be seen in Figure 7, which could be leading the H-DSPEB model towards the same minima as C-DSPEB. However, a comparison to the DSPEB submodels’ results presented in Figure 8 shows that the hybrid model H-DSPEB does improve the accuracy estimation over the individual DSPEB submodels in cases where C-DSPEB is more accurate than W-DSPEB, suggesting that H-DSPEB does make use of the W-DSPEB submodel to perform the final (merged) approximation.
Figure A5. H-DSPEB composite results in French Guiana using dates from 2018 Showing the correlation and the point-wise errors of the estimations. (a,c) Single date result. (b,d) Composite estimate.
Remotesensing 14 01196 g0a5

References

  1. Cesbron, G.; Melet, A.; Almar, R.; Lifermann, A.; Tullot, D.; Crosnier, L. Pan-European Satellite-Derived Coastal Bathymetry—Review, User Needs and Future Services. Front. Mar. Sci. 2021, 8, 1591. [Google Scholar] [CrossRef]
  2. Gonçalves, G.; Santos, S.; Duarte, D.; Santos, J. Monitoring Local Shoreline Changes by Integrating UASs, Airborne LiDAR, Historical Images and Orthophotos. In Proceedings of the 5th International Conference on Geographical Information Systems Theory, Applications and Management GISTAM, Crete, Greece, 3–5 May 2019. [Google Scholar] [CrossRef]
  3. Jagalingam, P.; Akshaya, B.; Hegde, A.V. Bathymetry Mapping Using Landsat 8 Satellite Imagery. Procedia Eng. 2015, 116, 560–566. [Google Scholar] [CrossRef] [Green Version]
  4. Gao, J. Bathymetric mapping by means of remote sensing: Methods, accuracy and limitations. Prog. Phys. Geogr. 2009, 33, 103–116. [Google Scholar] [CrossRef]
  5. Salameh, E.; Frappart, F.; Almar, R.; Baptista, P.; Heygster, G.; Lubac, B.; Raucoules, D.; Almeida, L.P.; Bergsma, E.W.J.; Capo, S.; et al. Monitoring Beach Topography and Nearshore Bathymetry Using Spaceborne Remote Sensing: A Review. Remote Sens. 2019, 11, 2212. [Google Scholar] [CrossRef] [Green Version]
  6. Ashphaq, M.; Srivastava, P.K.; Mitra, D. Review of near-shore satellite derived bathymetry: Classification and account of five decades of coastal bathymetry research. J. Ocean. Eng. Sci. 2021, 6, 340–359. [Google Scholar] [CrossRef]
  7. Benveniste, J.; Cazenave, A.; Vignudelli, S.; Fenoglio-Marc, L.; Shah, R.; Almar, R.; Andersen, O.; Birol, F.; Bonnefond, P.; Bouffard, J.; et al. Requirements for a Coastal Hazards Observing System. Front. Mar. Sci. 2019, 6, 348. [Google Scholar] [CrossRef] [Green Version]
  8. Melet, A.; Teatini, P.; Le Cozannet, G.; Jamet, C.; Conversi, A.; Benveniste, J.; Almar, R. Earth observations for monitoring marine coastal hazards and their drivers. Surv. Geophys. 2020, 41, 1489–1534. [Google Scholar] [CrossRef]
  9. Almar, R.; Bonneton, P.; Senechal, N.; Roelvink, D. Wave celerity from video imaging: A new method. In Coastal Engineering 2008: (In 5 Volumes); World Scientific: Hackensack, NJ, USA, 2009; pp. 661–673. [Google Scholar]
  10. Holman, R.A.; Plant, N.; Holland, T. cBathy: A Robust Algorithm For Estimating Nearshore Bathymetry. J. Geophys. Res. Oceans 2013, 118, 2595–2609. [Google Scholar] [CrossRef]
  11. Bergsma, E.W.J.; Almar, R.; de Almeida, L.P.M.; Sall, M. On the operational use of UAVs for video-derived bathymetry. Coast. Eng. 2019, 152, 103527. [Google Scholar] [CrossRef]
  12. Drusch, M.; Bello, U.D.; Carlier, S.; Colin, O.; Fernandez, V.; Gascon, F.; Hoersch, B.; Isola, C.; Laberinti, P.; Martimort, P.; et al. Sentinel-2: ESA’s Optical High-Resolution Mission for GMES Operational Services. Remote Sens. Environ. 2012, 120, 25–36. [Google Scholar] [CrossRef]
  13. Bergsma, E.W.J.; Almar, R. Coastal coverage of ESA’ Sentinel 2 mission. Adv. Space Res. 2020, 65, 2636–2644. [Google Scholar] [CrossRef]
  14. Erena, M.; Domínguez, J.A.; Aguado-Giménez, F.; Soria, J.; García-Galiano, S. Monitoring coastal lagoon water quality through remote sensing: The Mar Menor as a case study. Water 2019, 11, 1468. [Google Scholar] [CrossRef] [Green Version]
  15. Liu, Y.; Islam, M.A.; Gao, J. Quantification of shallow water quality parameters by means of remote sensing. Prog. Phys. Geogr. 2003, 27, 24–43. [Google Scholar] [CrossRef]
  16. Brando, V.; Dekker, A. Satellite hyperspectral remote sensing for estimating estuarine and coastal water quality. IEEE Trans. Geosci. Remote Sens. 2003, 41, 1378–1387. [Google Scholar] [CrossRef]
  17. Lyzenga, D.R. Passive remote sensing techniques for mapping water depth and bottom features. Appl. Opt. 1978, 17, 379–383. [Google Scholar] [CrossRef] [PubMed]
  18. Giardino, C.; Candiani, G.; Bresciani, M.; Lee, Z.; Gagliano, S.; Pepe, M. BOMBER: A tool for estimating water quality and bottom properties from remote sensing images. Comput. Geosci. 2012, 45, 313–318. [Google Scholar] [CrossRef]
  19. Legleiter, C.J.; Roberts, D.A.; Lawrence, R.L. Spectrally based remote sensing of river bathymetry. Earth Surf. Process. Landforms 2009, 34, 1039–1059. Available online: https://onlinelibrary.wiley.com/doi/pdf/10.1002/esp.1787 (accessed on 13 December 2021). [CrossRef]
  20. Caballero, I.; Stumpf, R. Retrieval of nearshore bathymetry from Sentinel-2A and 2B satellites in South Florida coastal waters. Estuar. Coast. Shelf Sci. 2019, 226, 106277. [Google Scholar] [CrossRef]
  21. Evagorou, E.; Mettas, C.; Agapiou, A.; Themistocleous, K.; Hadjimitsis, D. Bathymetric maps from multi-temporal analysis of Sentinel-2 data: The case study of Limassol, Cyprus. Adv. Geosci. 2019, 45, 397–407. [Google Scholar] [CrossRef] [Green Version]
  22. Sagawa, T.; Yamashita, Y.; Okumura, T.; Yamanokuchi, T. Satellite Derived Bathymetry Using Machine Learning and Multi-Temporal Satellite Images. Remote Sens. 2019, 11, 1155. [Google Scholar] [CrossRef] [Green Version]
  23. Almar, R.; Bergsma, E.W.J.; Thoumyre, G.; Baba, M.W.; Cesbron, G.; Daly, C.; Garlan, T.; Lifermann, A. Global Satellite-Based Coastal Bathymetry from Waves. Remote Sens. 2021, 13, 4628. [Google Scholar] [CrossRef]
  24. Bergsma, E.W.; Almar, R.; Rolland, A.; Binet, R.; Brodie, K.L.; Bak, A.S. Coastal morphology from space: A showcase of monitoring the topography-bathymetry continuum. Remote Sens. Environ. 2021, 261, 112469. [Google Scholar] [CrossRef]
  25. Pacheco, A.; Horta, J.; Loureiro, C.; Ferreira, O. Retrieval of nearshore bathymetry from Landsat 8 images: A tool for coastal monitoring in shallow waters. Remote Sens. Environ. 2015, 159, 102–116. [Google Scholar] [CrossRef] [Green Version]
  26. Chénier, R.; Faucher, M.A.; Ahola, R. Satellite-Derived Bathymetry for Improving Canadian Hydrographic Service Charts. Int. J. Geo-Inf. 2018, 7, 306. [Google Scholar] [CrossRef] [Green Version]
  27. Traganos, D.; Poursanidis, D.; Aggarwal, B.; Chrysoulakis, N.; Reinartz, P. Estimating Satellite-Derived Bathymetry (SDB) with the Google Earth Engine and Sentinel-2. Remote Sens. 2018, 10, 859. [Google Scholar] [CrossRef] [Green Version]
  28. Sandidge, J.C.; Holyer, R.J. Coastal Bathymetry from Hyperspectral Observations of Water Radiance. Remote Sens. Environ. 1998, 65, 341–352. [Google Scholar] [CrossRef]
  29. Vojinovic, Z.; Abebe, Y.; Ranasinghe, R.; Vacher, A.; Martens, P.; Mandl, D.; Frye, S.; Van Ettinger, E.; De Zeeuw, R. A Machine Learning Approach for Estimation of Shallow Water Depths from Optical Satellite Images and Sonar Measurements. J. Hydroinform. 2013, 15, 1408–1424. [Google Scholar] [CrossRef] [Green Version]
  30. Iglovikov, V.; Mushinskiy, S.; Osin, V. Satellite imagery feature detection using deep convolutional neural network: A kaggle competition. arXiv 2017, arXiv:1706.06169. [Google Scholar]
  31. Zhu, X.X.; Tuia, D.; Mou, L.; Xia, G.S.; Zhang, L.; Xu, F.; Fraundorfer, F. Deep learning in remote sensing: A comprehensive review and list of resources. IEEE Geosci. Remote Sens. Mag. 2017, 5, 8–36. [Google Scholar] [CrossRef] [Green Version]
  32. Hoeser, T.; Kuenzer, C. Object Detection and Image Segmentation with Deep Learning on Earth Observation Data: A Review-Part I: Evolution and Recent Trends. Remote Sens. 2020, 12, 1667. [Google Scholar] [CrossRef]
  33. Ma, L.; Liu, Y.; Zhang, X.; Ye, Y.; Yin, G.; Johnson, B.A. Deep learning in remote sensing applications: A meta-analysis and review. ISPRS J. Photogramm. Remote Sens. 2019, 152, 166–177. [Google Scholar] [CrossRef]
  34. Ghorbanidehno, H.; Lee, J.; Farthing, M.; Hesser, T.; Darve, E.F.; Kitanidis, P.K. Deep learning technique for fast inference of large-scale riverine bathymetry. Adv. Water Resour. 2021, 147, 103715. [Google Scholar] [CrossRef]
  35. Collins, A.M.; Geheran, M.P.; Hesser, T.J.; Bak, A.S.; Brodie, K.L.; Farthing, M.W. Development of a Fully Convolutional Neural Network to Derive Surf-Zone Bathymetry from Close-Range Imagery of Waves in Duck, NC. Remote Sens. 2021, 13, 4907. [Google Scholar] [CrossRef]
  36. Mandlburger, G.; Kölle, M.; Nübel, H.; Soergel, U. BathyNet: A Deep Neural Network for Water Depth Mapping from Multispectral Aerial Images. PFG–J. Photogramm. Remote Sens. Geoinf. Sci. 2021, 89, 1–19. [Google Scholar] [CrossRef]
  37. Dickens, K.; Armstrong, A. Application of Machine Learning in Satellite Derived Bathymetry and Coastline Detection. SMU Data Sci. Rev. 2019, 2, 4. [Google Scholar]
  38. Wilson, B.; Kurian, N.C.; Singh, A.; Sethi, A. Satellite-Derived Bathymetry Using Deep Convolutional Neural Network. In Proceedings of the IGARSS 2020–2020 IEEE International Geoscience and Remote Sensing Symposium, Waikoloa, HI, USA, 26 September–2 October 2020; pp. 2280–2283. [Google Scholar]
  39. Lumban-Gaol, Y.; Ohori, K.; Peters, R. Satellite-derived bathymetry using convolutional neural networks and multispectral sentinel-2 images. Int. Arch. Photogramm. Remote Sens. Spat. Inf. Sci 2021, 43, 201–207. [Google Scholar] [CrossRef]
  40. Danilo, C.; Melgani, F. Wave period and coastal bathymetry using wave propagation on optical images. IEEE Trans. Geosci. Remote Sens. 2016, 54, 6307–6319. [Google Scholar] [CrossRef]
  41. Benshila, R.; Thoumyre, G.; Al Najar, M.; Abessolo, G.; Almar, R.; Bergsma, E.; Hugonnard, G.; Labracherie, L.; Lavie, B.; Ragonneau, T.; et al. A deep learning approach for estimation of the nearshore bathymetry. J. Coast. Res. 2020, 95, 1011–1015. [Google Scholar] [CrossRef]
  42. Al Najar, M.; Thoumyre, G.; Bergsma, E.W.J.; Almar, R.; Benshila, R.; Wilson, D.G. Satellite derived bathymetry using deep learning. Mach. Learn. 2021. [Google Scholar] [CrossRef]
  43. Baba, W.M.; Bergsma, E.W.J.; Almar, R.; Daly, C.J. Deriving large-scale coastal bathymetry from Sentinel-2 images using an High-Performance Cluster: A case study covering North Africa’s coastal zone. Sensors 2021, 21, 7006. [Google Scholar] [CrossRef] [PubMed]
  44. He, K.; Zhang, X.; Ren, S.; Sun, J. Deep Residual Learning for Image Recognition. In Proceedings of the 2016 IEEE Conference on Computer Vision and Pattern Recognition (CVPR), Las Vegas, NV, USA, 27–30 June 2016; pp. 770–778. [Google Scholar] [CrossRef] [Green Version]
  45. Wightman, R.; Touvron, H.; Jégou, H. Resnet strikes back: An improved training procedure in timm. arXiv 2021, arXiv:2110.00476. [Google Scholar]
  46. Kingma, D.P.; Ba, J. Adam: A Method for Stochastic Optimization. arXiv 2014, arXiv:1412.6980. [Google Scholar]
  47. Bergsma, E.W.J.; Almar, R.; Maisongrande, P. Radon-Augmented Sentinel-2 Satellite Imagery to Derive Wave-Patterns and Regional Bathymetry. Remote Sens. 2019, 11, 1918. [Google Scholar] [CrossRef] [Green Version]
  48. Lin, L.I.K. A Concordance Correlation Coefficient to Evaluate Reproducibility. Biometrics 1989, 45, 255–268. [Google Scholar] [CrossRef] [PubMed]
  49. Reichstein, M.; Camps-Valls, G.; Stevens, B.; Jung, M.; Denzler, J.; Carvalhais, N. Deep learning and process understanding for data-driven Earth system science. Nature 2019, 566, 195–204. [Google Scholar] [CrossRef] [PubMed]
  50. Lathuilière, S.; Mesejo, P.; Alameda-Pineda, X.; Horaud, R. A comprehensive analysis of deep regression. IEEE Trans. Pattern Anal. Mach. Intell. 2019, 42, 2065–2081. [Google Scholar] [CrossRef] [PubMed] [Green Version]
  51. Xian, Y.; Schiele, B.; Akata, Z. Zero-shot learning-the good, the bad and the ugly. In Proceedings of the IEEE Conference on Computer Vision and Pattern Recognition, Honolulu, HI, USA, 21–26 July 2017; pp. 4582–4591. [Google Scholar]
  52. Arcucci, R.; Zhu, J.; Hu, S.; Guo, Y.K. Deep data assimilation: Integrating deep learning with data assimilation. Appl. Sci. 2021, 11, 1114. [Google Scholar] [CrossRef]
  53. Dua, N.; Singh, S.N.; Semwal, V.B. Multi-input CNN-GRU based human activity recognition using wearable sensors. Computing 2021, 103, 1461–1478. [Google Scholar] [CrossRef]
  54. Oktay, O.; Bai, W.; Lee, M.; Guerrero, R.; Kamnitsas, K.; Caballero, J.; de Marvao, A.; Cook, S.; O’Regan, D.; Rueckert, D. Multi-input Cardiac Image Super-Resolution Using Convolutional Neural Networks. In Proceedings of the Medical Image Computing and Computer-Assisted Intervention—MICCAI 2016, Athens, Greece, 17–21 October 2016; Ourselin, S., Joskowicz, L., Sabuncu, M.R., Unal, G., Wells, W., Eds.; Springer International Publishing: Cham, Switzerland, 2016; pp. 246–254. [Google Scholar]
  55. Cheng, D.; Gong, Y.; Zhou, S.; Wang, J.; Zheng, N. Person Re-Identification by Multi-Channel Parts-Based CNN With Improved Triplet Loss Function. In Proceedings of the IEEE Conference on Computer Vision and Pattern Recognition (CVPR), Las Vegas, NV, USA, 27–30 June 2016. [Google Scholar]
Figure 1. The steps of the DSPEB method using a deep convolutional neural network. * The input and output data used in the figure are synthetic examples.
Remotesensing 14 01196 g001
Figure 2. Pre-processing of a single 400 × 400 m Sentinel-2 subtile band (10 m resolution). (a) Raw subtile. (b) Passband-filtered subtile. (c) Final NORMXCORR result used as input to W-DSPEB. (d) Color-augmented subtile.
Remotesensing 14 01196 g002
Figure 3. The bathymetry survey obtained from the French Naval Hydrographic and Oceanographic Service (SHOM). (a,b) show the positioning and depth distribution of survey points included in this study.
Remotesensing 14 01196 g003
Figure 4. Distribution of depths included in the training (a), validation (b), and test (c) sets in French Guiana (blue) and Gironde (red).
Remotesensing 14 01196 g004
Figure 5. The distributions of wave period (a), wavelength (b), and direction (c) at the different dates included in the training and validation sets in French Guiana and Gironde.
Remotesensing 14 01196 g005
Figure 6. The full workflow of dataset creation (a), single date estimation using DSPEB (b), and composite estimate creation in (c).
Remotesensing 14 01196 g006
Figure 7. Training of the W-DSPEB and C-DSPEB models, showing the MSE losses over the training and validation sets in French Guiana (a) and Gironde (b). Dashed lines represent performance on the validation set.
Remotesensing 14 01196 g007
Figure 8. Single-date estimation comparison of—from left to right—S2Shores, C-DSPEB and W-DSPEB in French Guiana and Gironde. (ac,df) show the correlations and point-wise absolute errors in French Guiana; (gi,jl) show the correlations and absolute errors in Gironde.
Remotesensing 14 01196 g008
Figure 9. Composite estimation correlation comparison of S2Shores (left), C-DSPEB (middle), and W-DSPEB (right) in French Guiana (ac) and Gironde (df).
Remotesensing 14 01196 g009
Figure 10. Sensitivity of C-DSPEB to background color. (a) C-DSPEB estimation standard deviation over six dates in French Guiana. (b) Example image of the test area in French Guiana showing high water turbidity which causes the large temporal variance in the C-DSPEB model estimates.
Remotesensing 14 01196 g010
Figure 11. Reconstruction of a full Sentinel-2 tile in Gironde using composite estimates from C-DSPEB (a) and W-DSPEB (b). The bathymetry survey data used for Gironde is presented in Figure 3.
Remotesensing 14 01196 g011
Table 1. Comparison of the composite estimates for the three methods. Temporal STD refers to the standard deviation over estimates of the same area from different dates.
SiteMetricS2ShoresC-DSPEBW-DSPEB
French Guianar0.930.890.91
RMSE (m)3.633.963.26
Temporal STD (m)3.996.233.49
Gironder0.620.710.86
RMSE (m)6.467.595.12
Temporal STD (m)3.896.134.01
Publisher’s Note: MDPI stays neutral with regard to jurisdictional claims in published maps and institutional affiliations.