
Detailed Mapping of Lava and Ash Deposits at Indonesian Volcanoes by Means of VHR PlanetScope Change Detection


Abstract
:1. Introduction
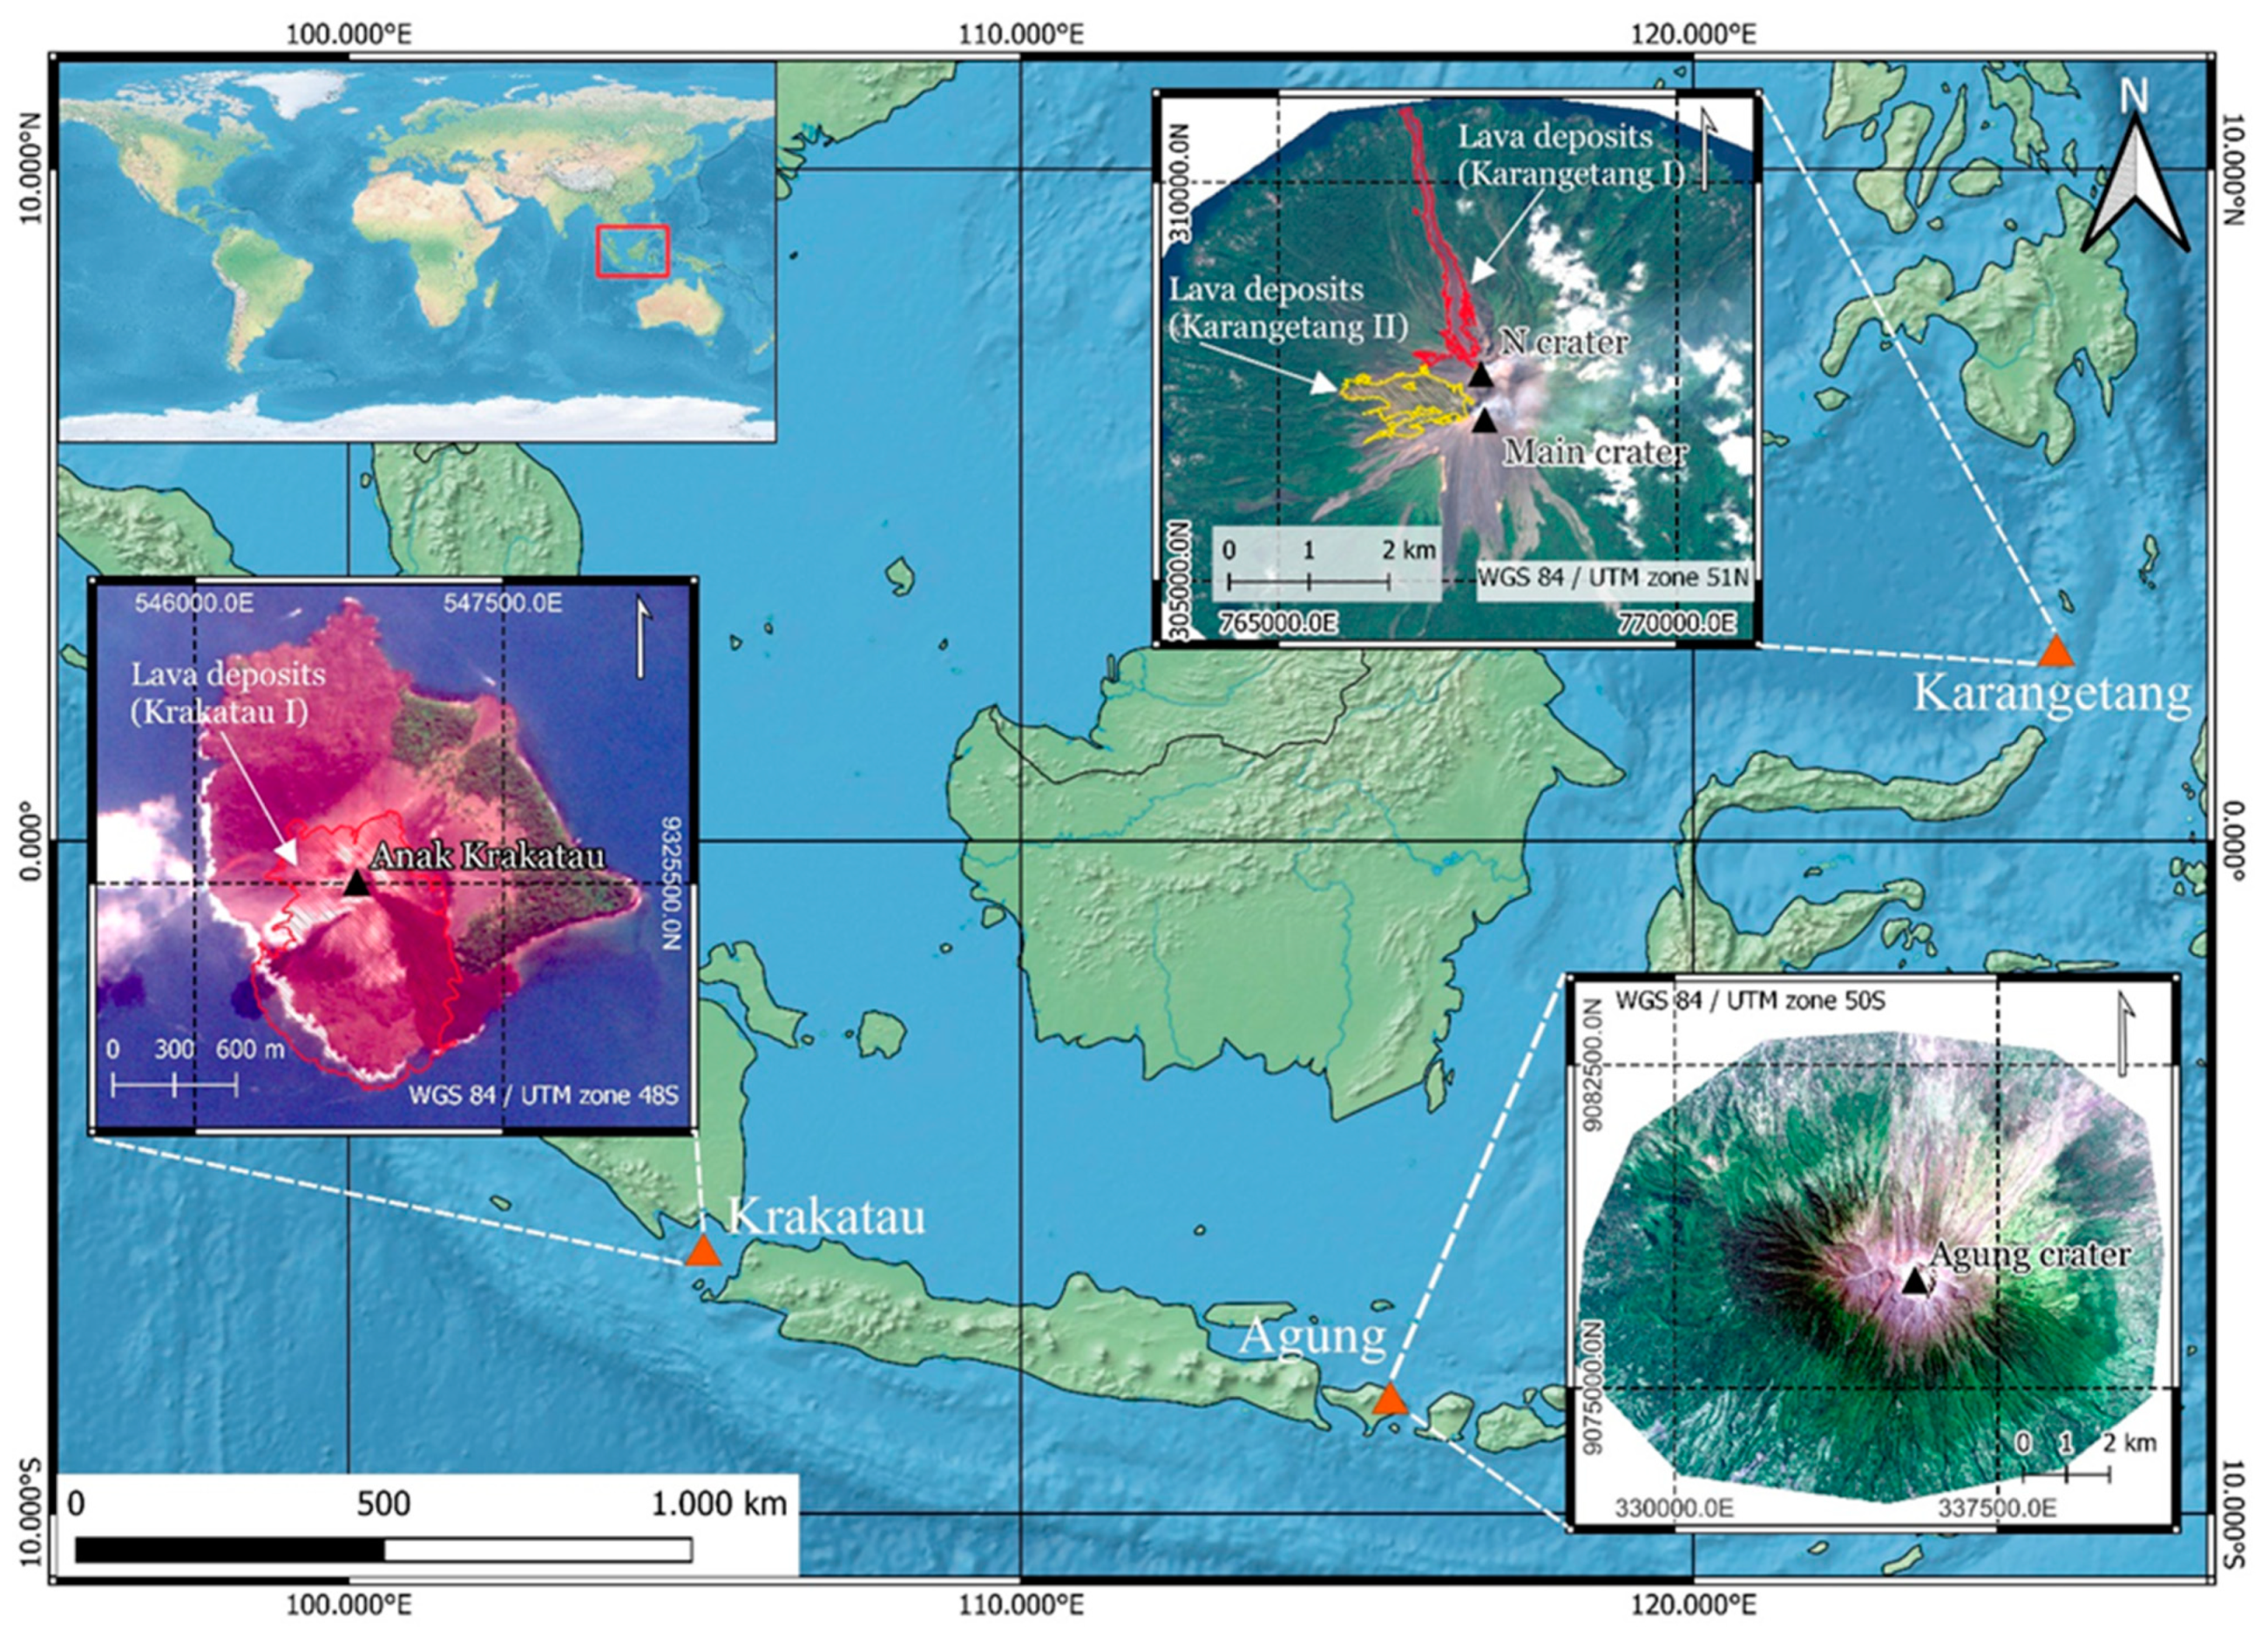
2. Study Area
3. Datasets
4. Methods
4.1. Pre-Processing
4.2. Volcanic Ash Deposits Mapping
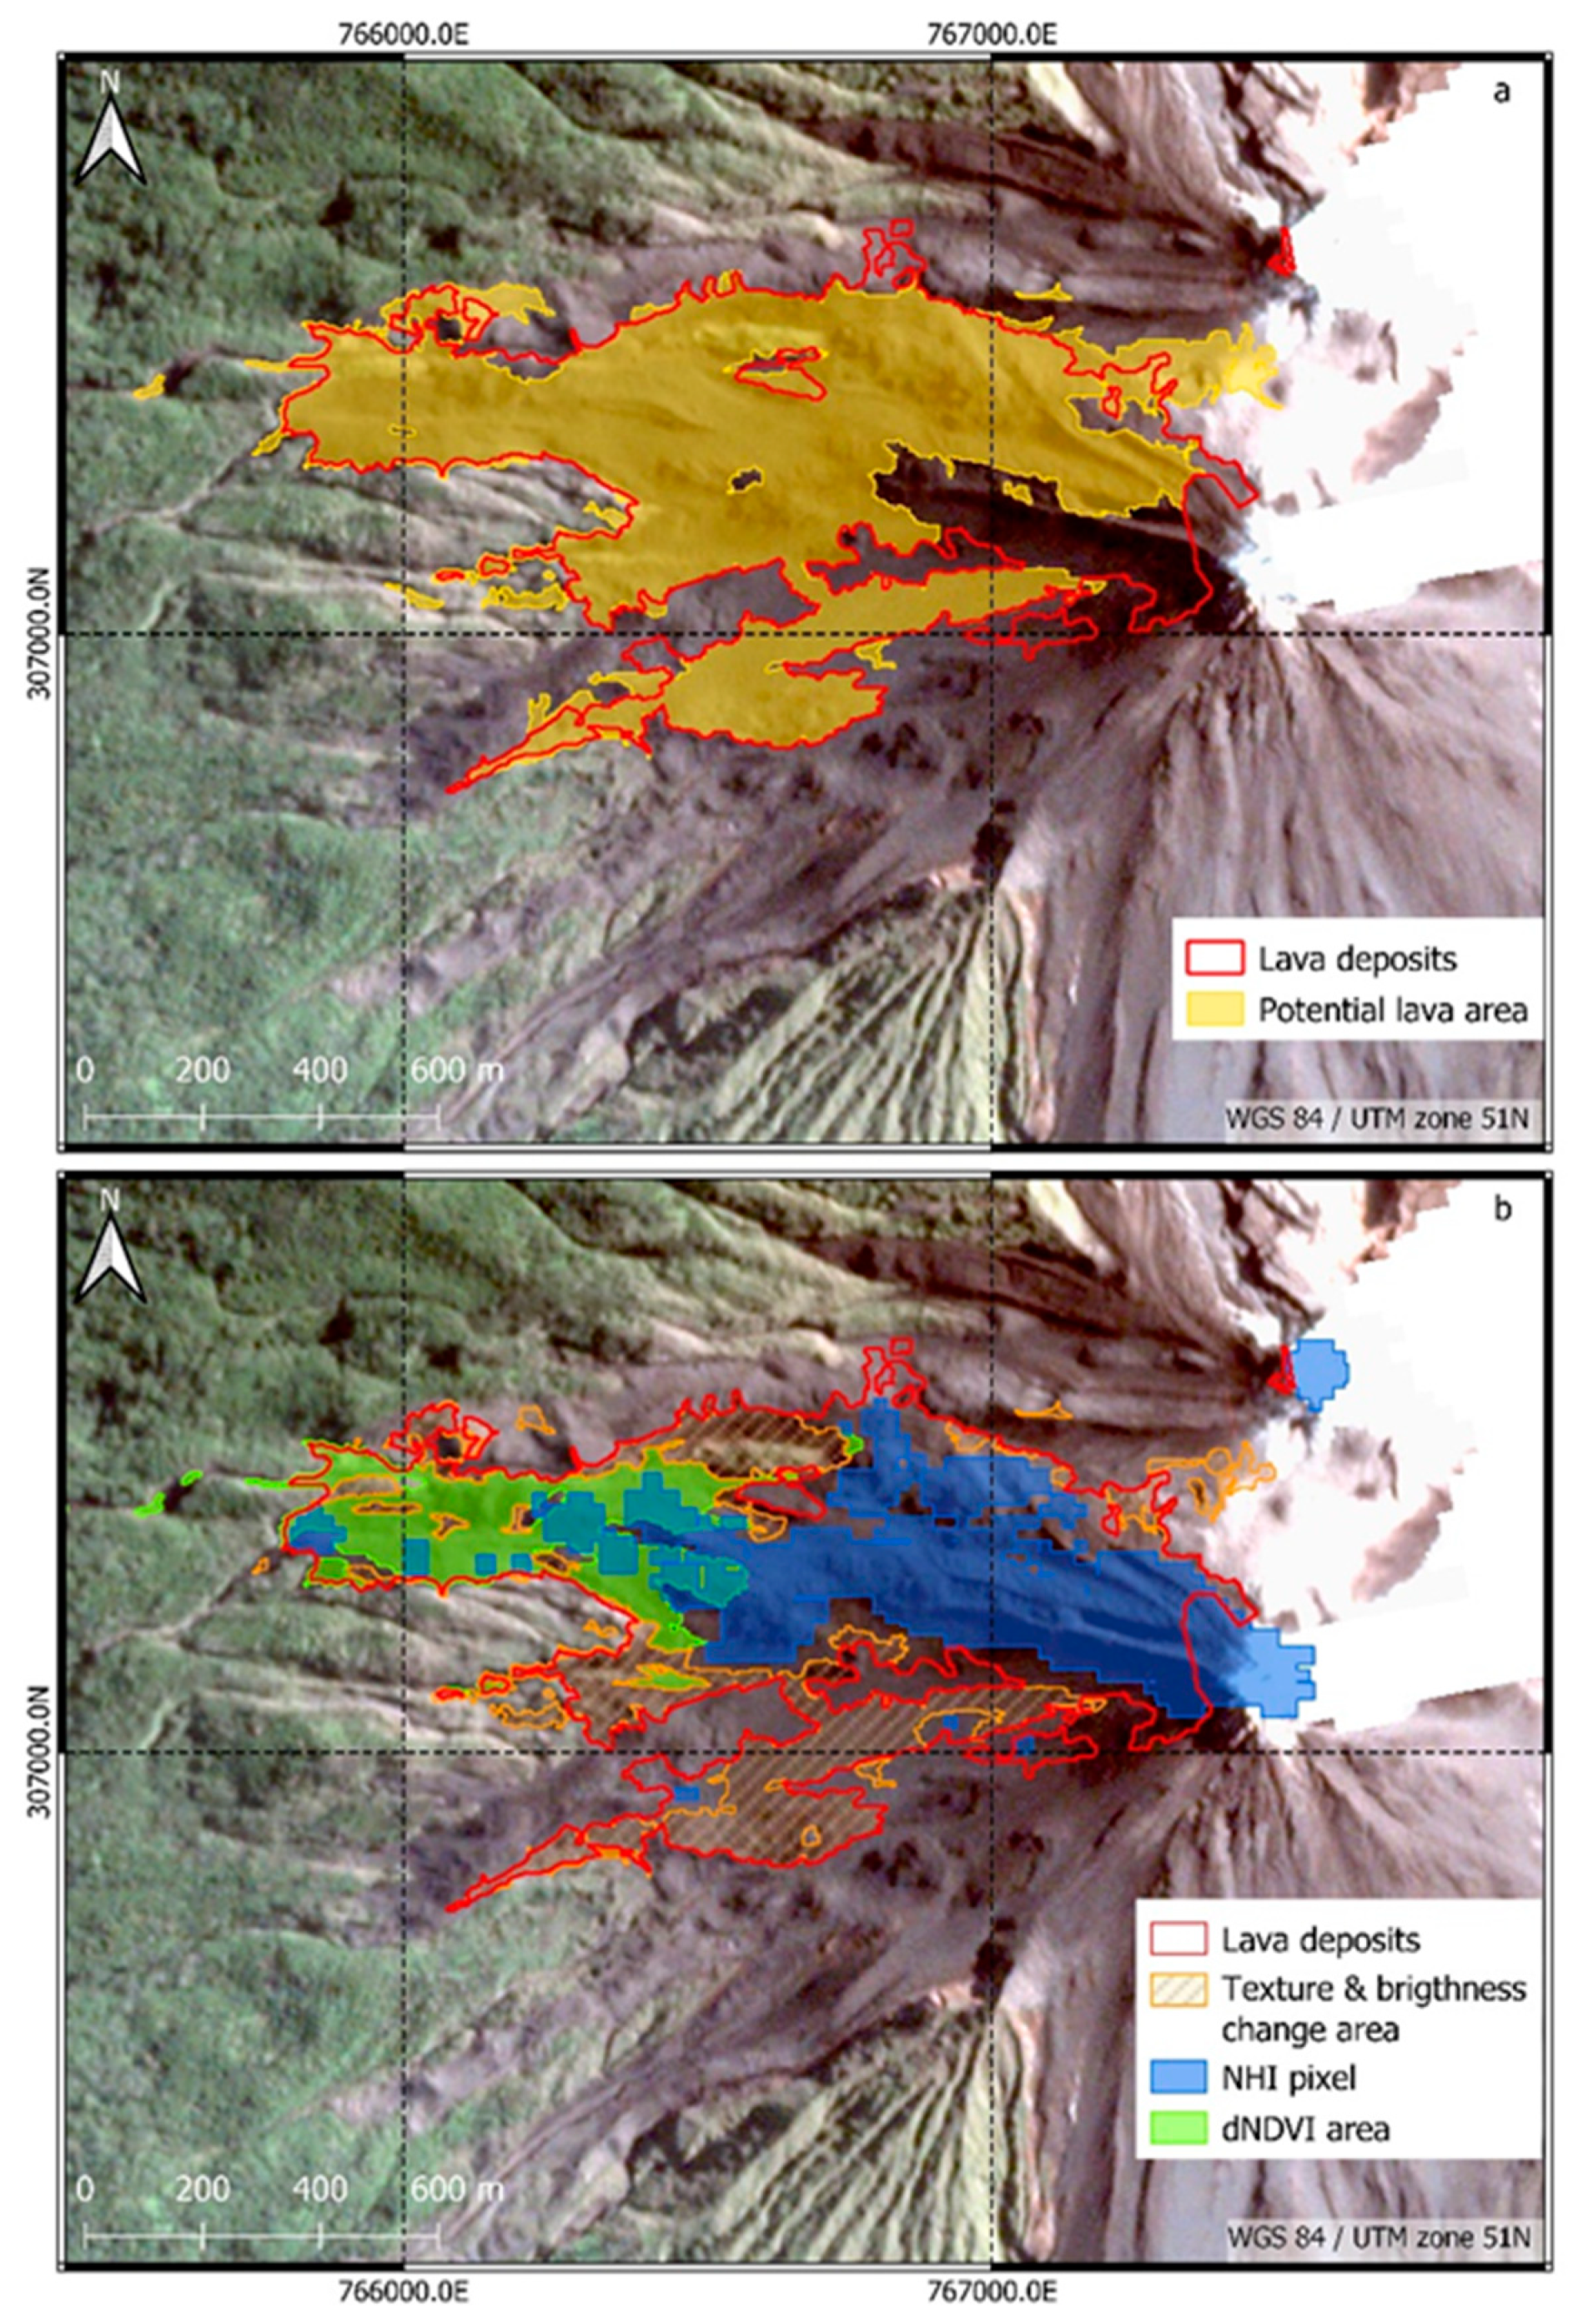
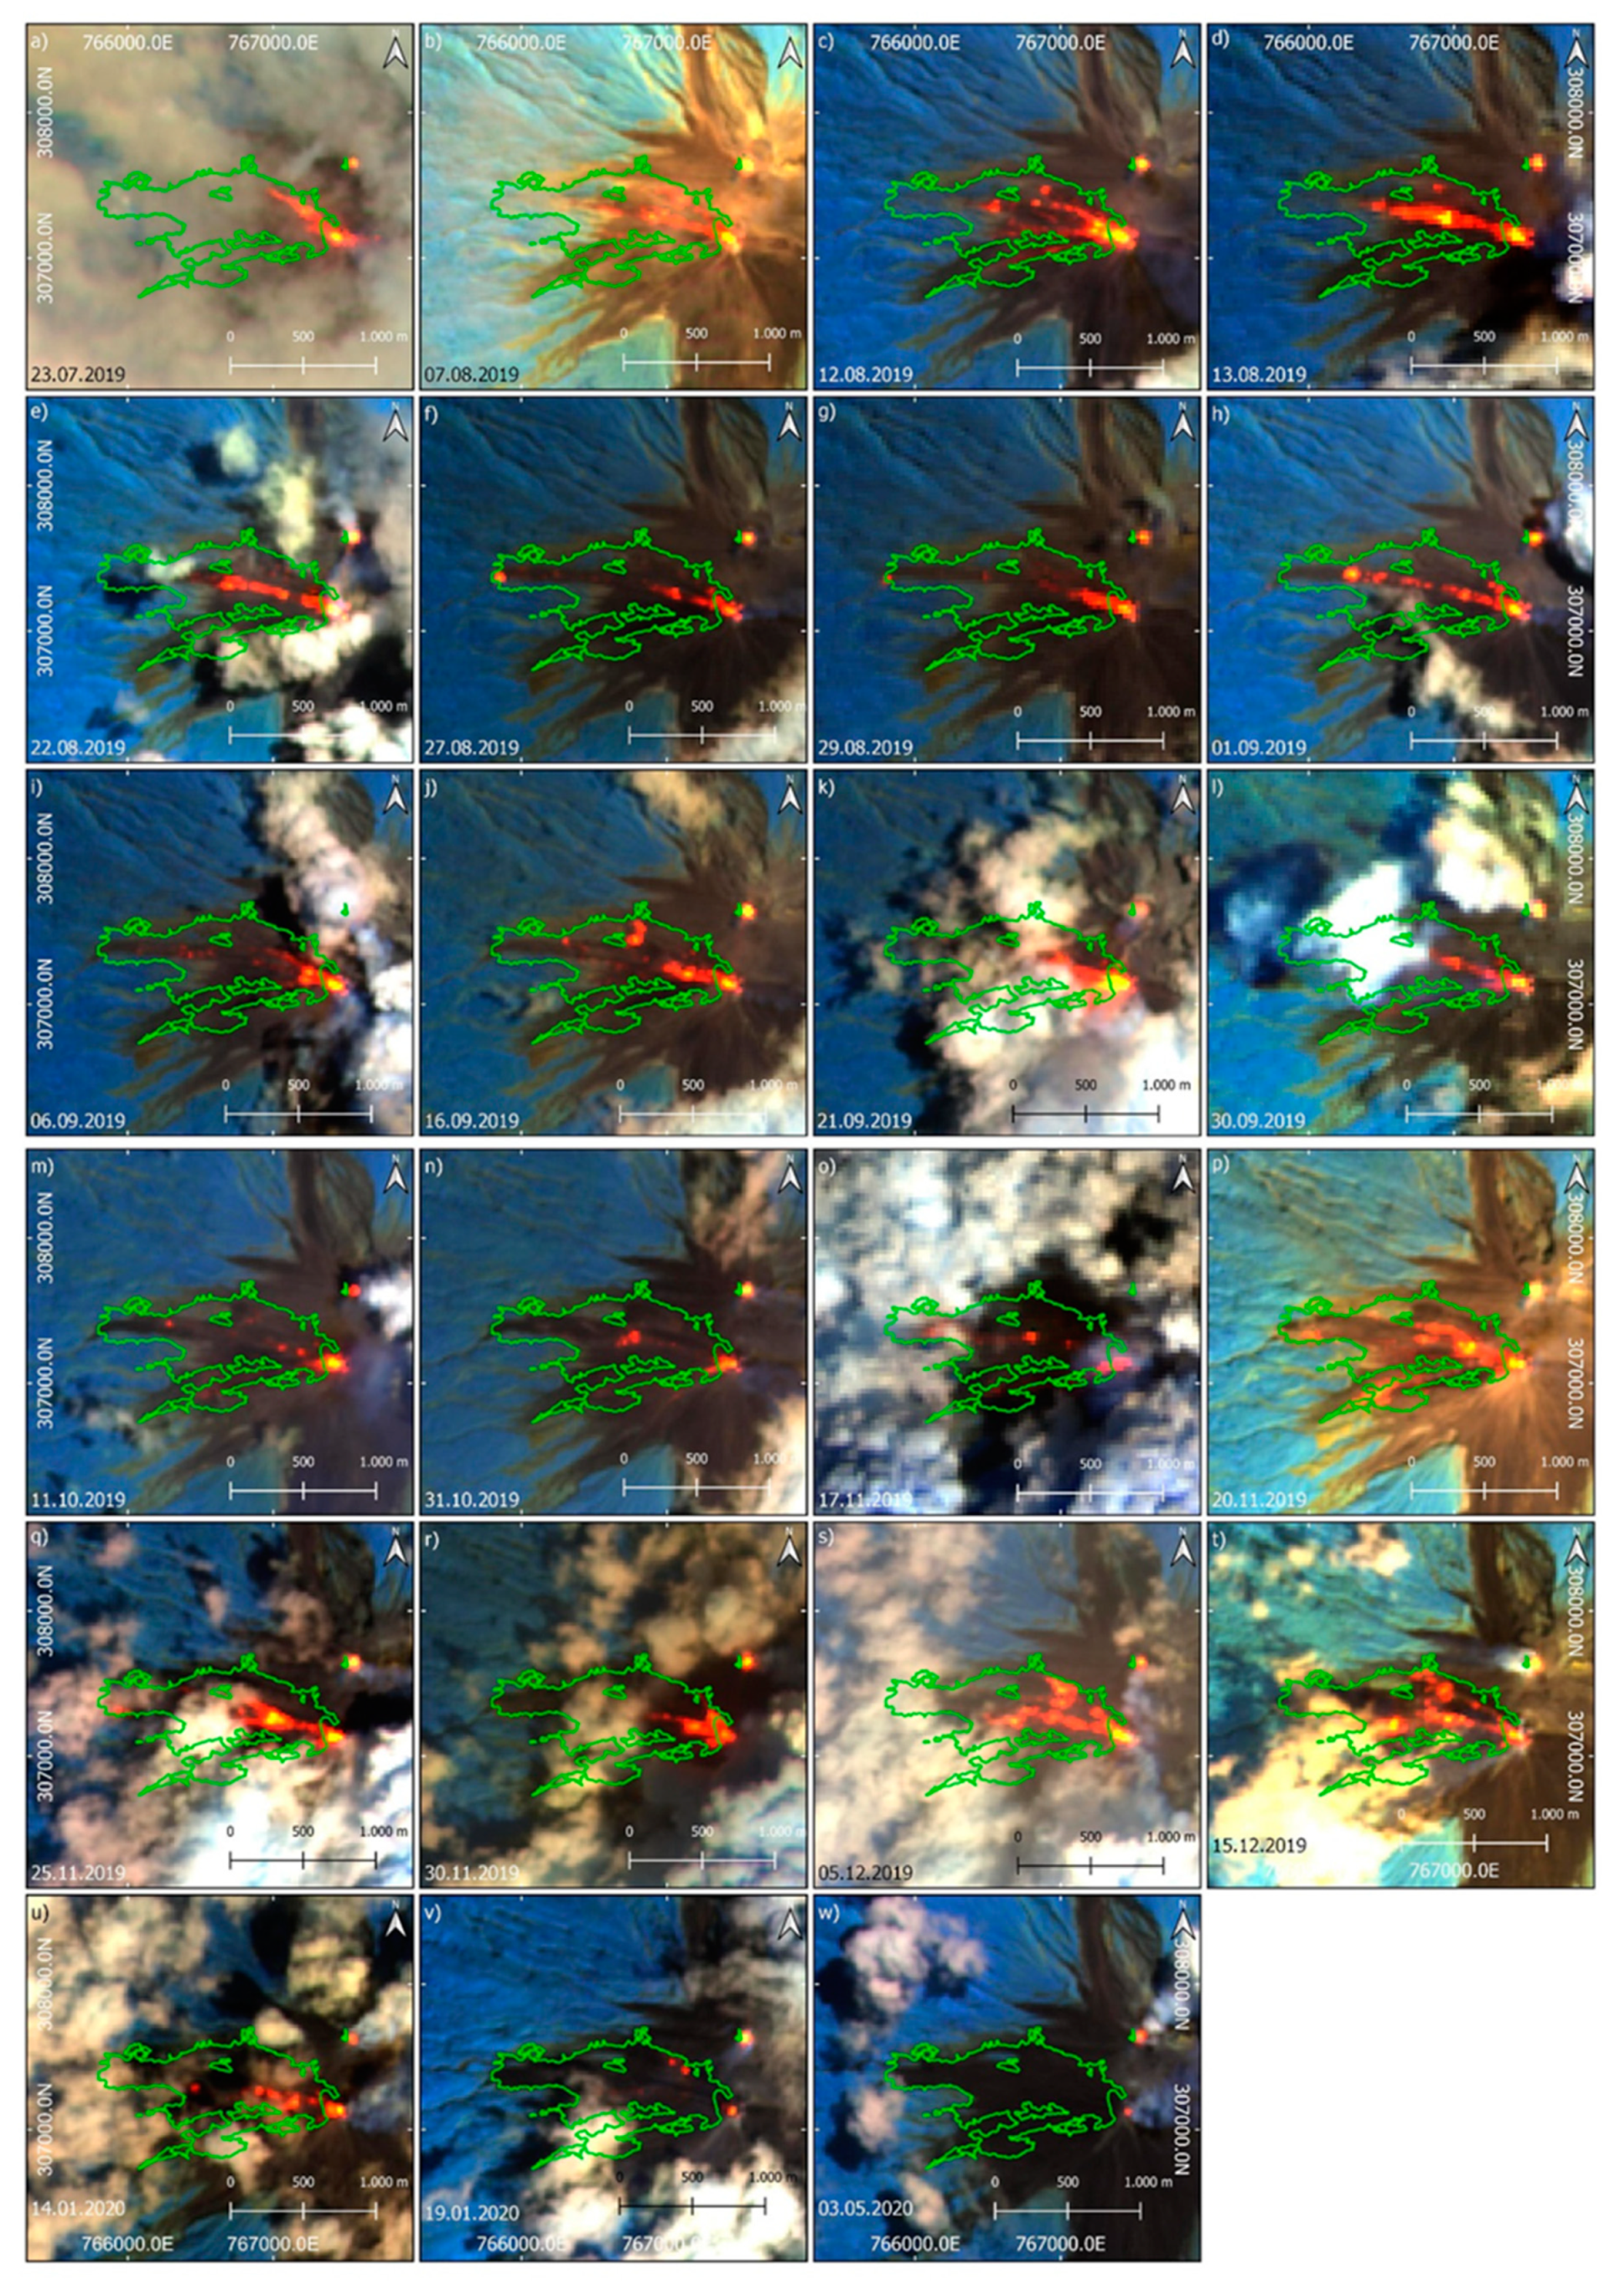
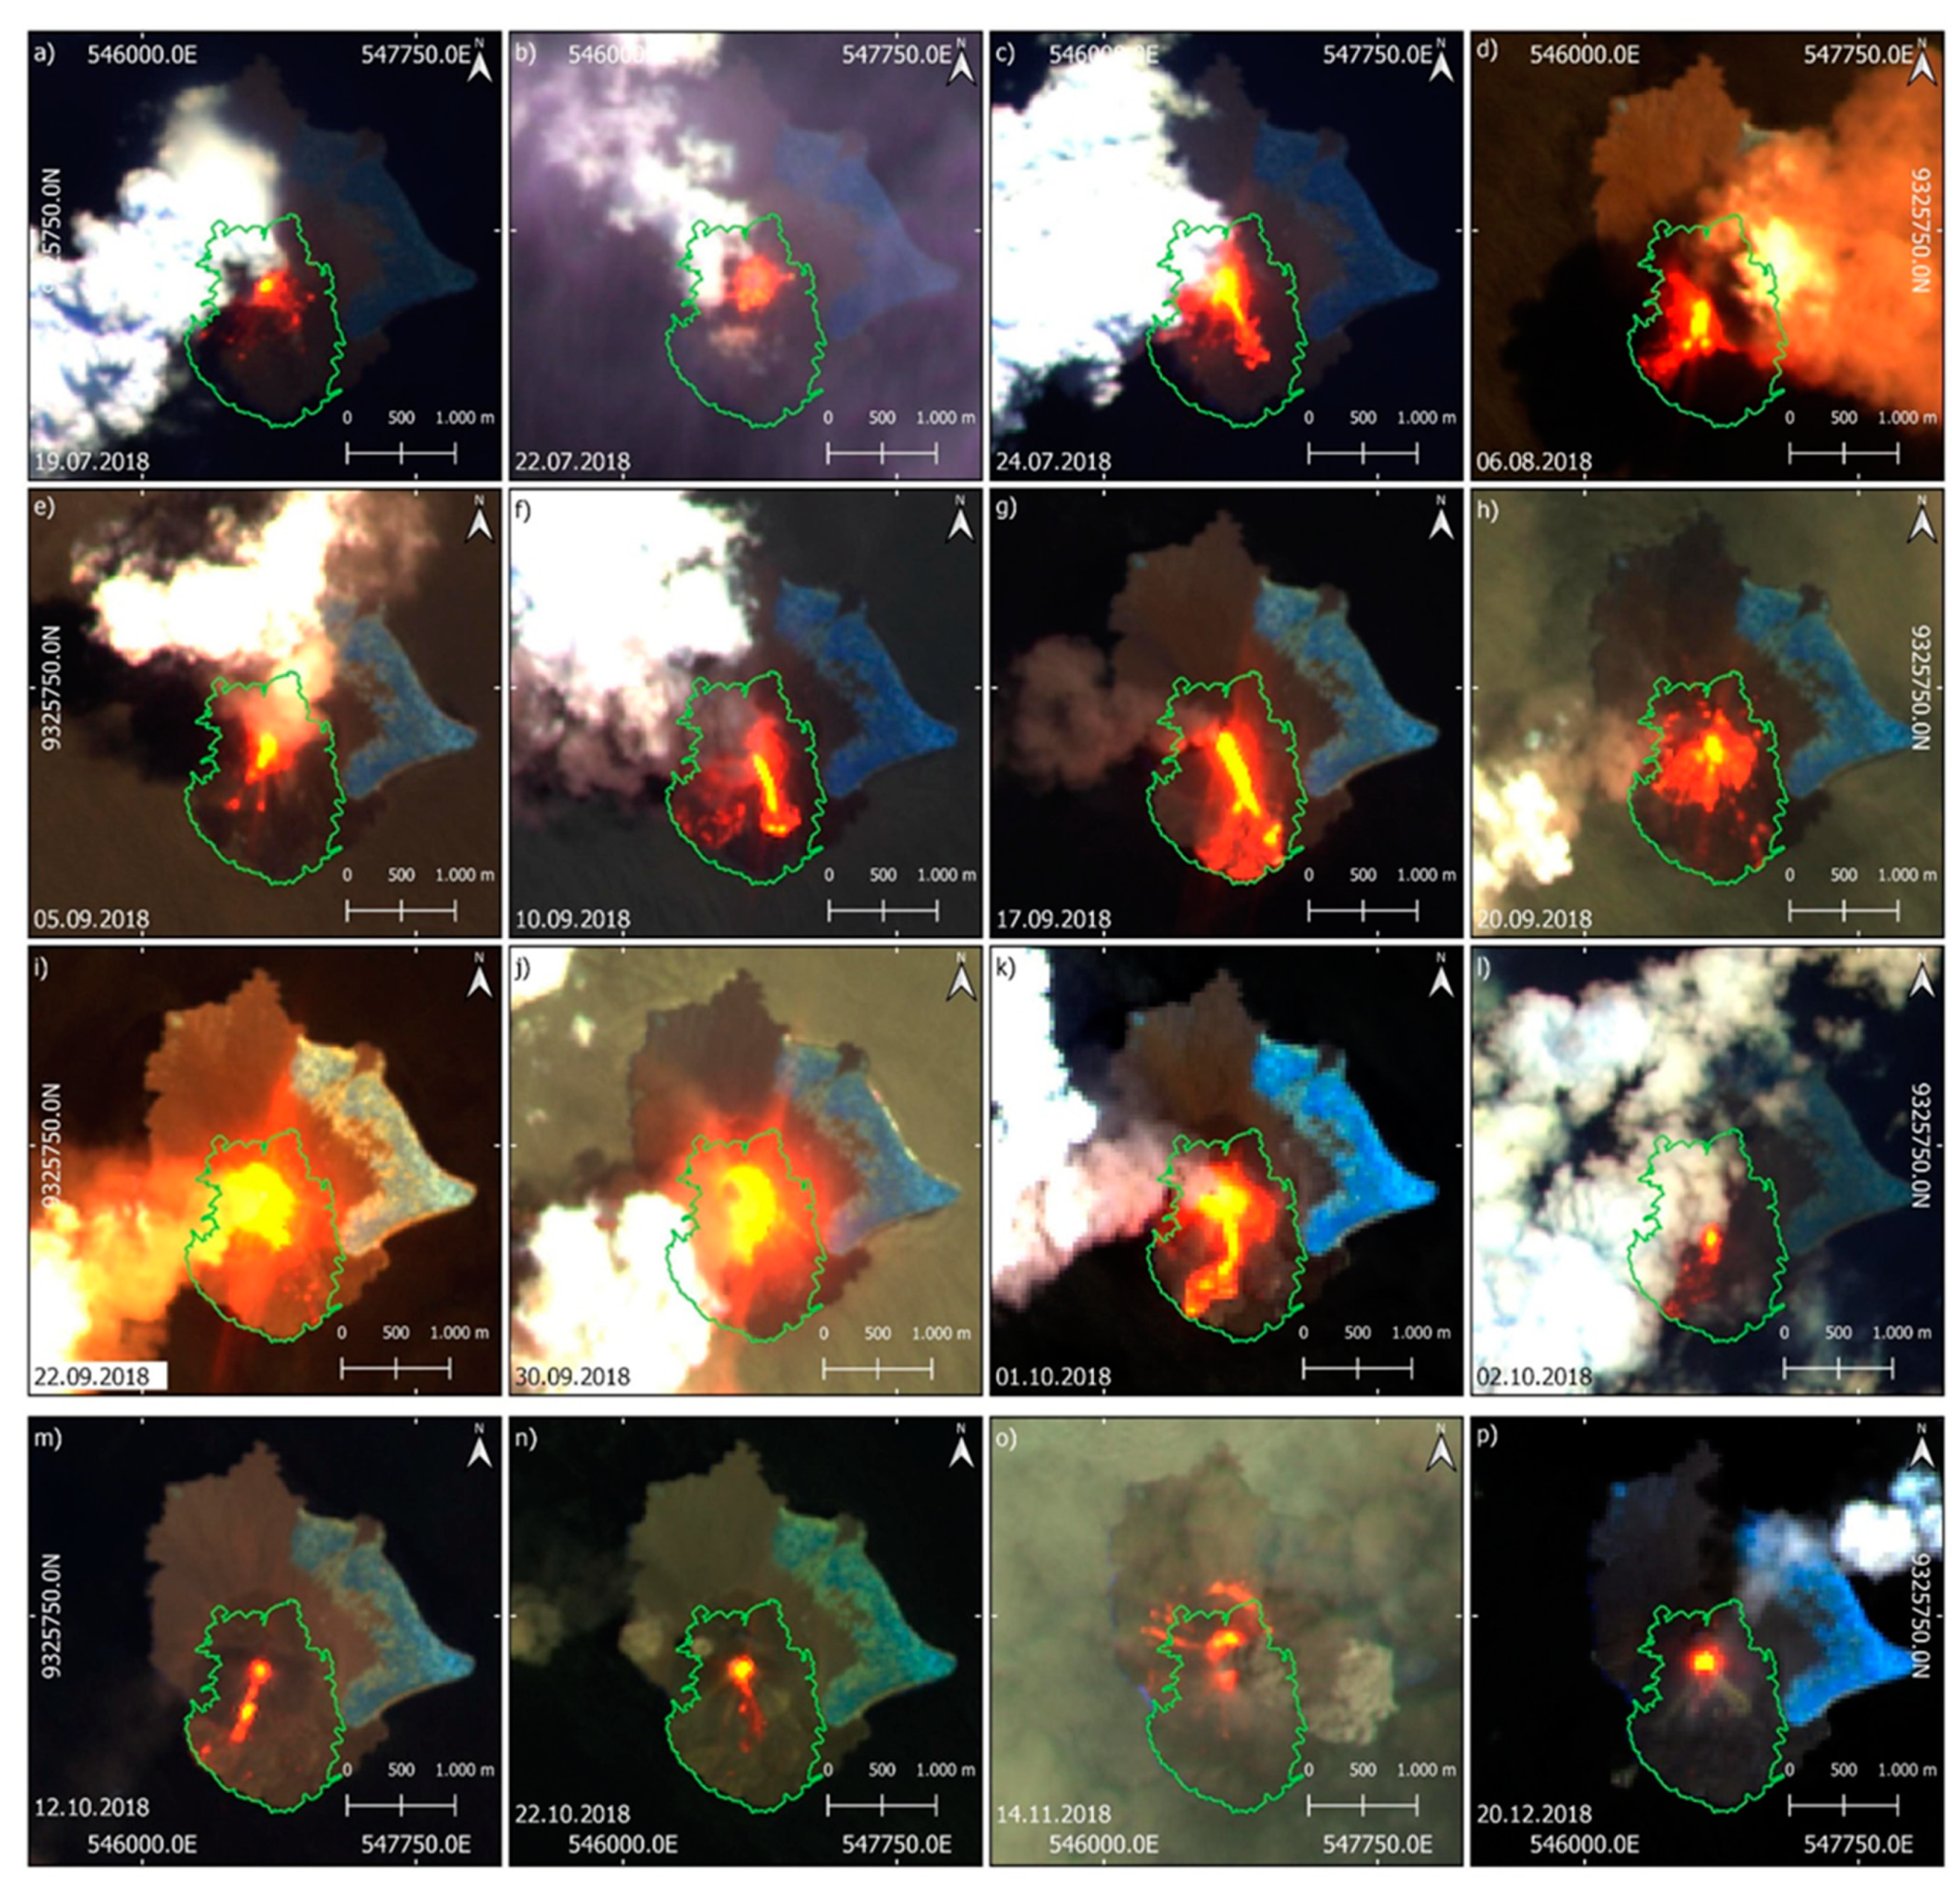
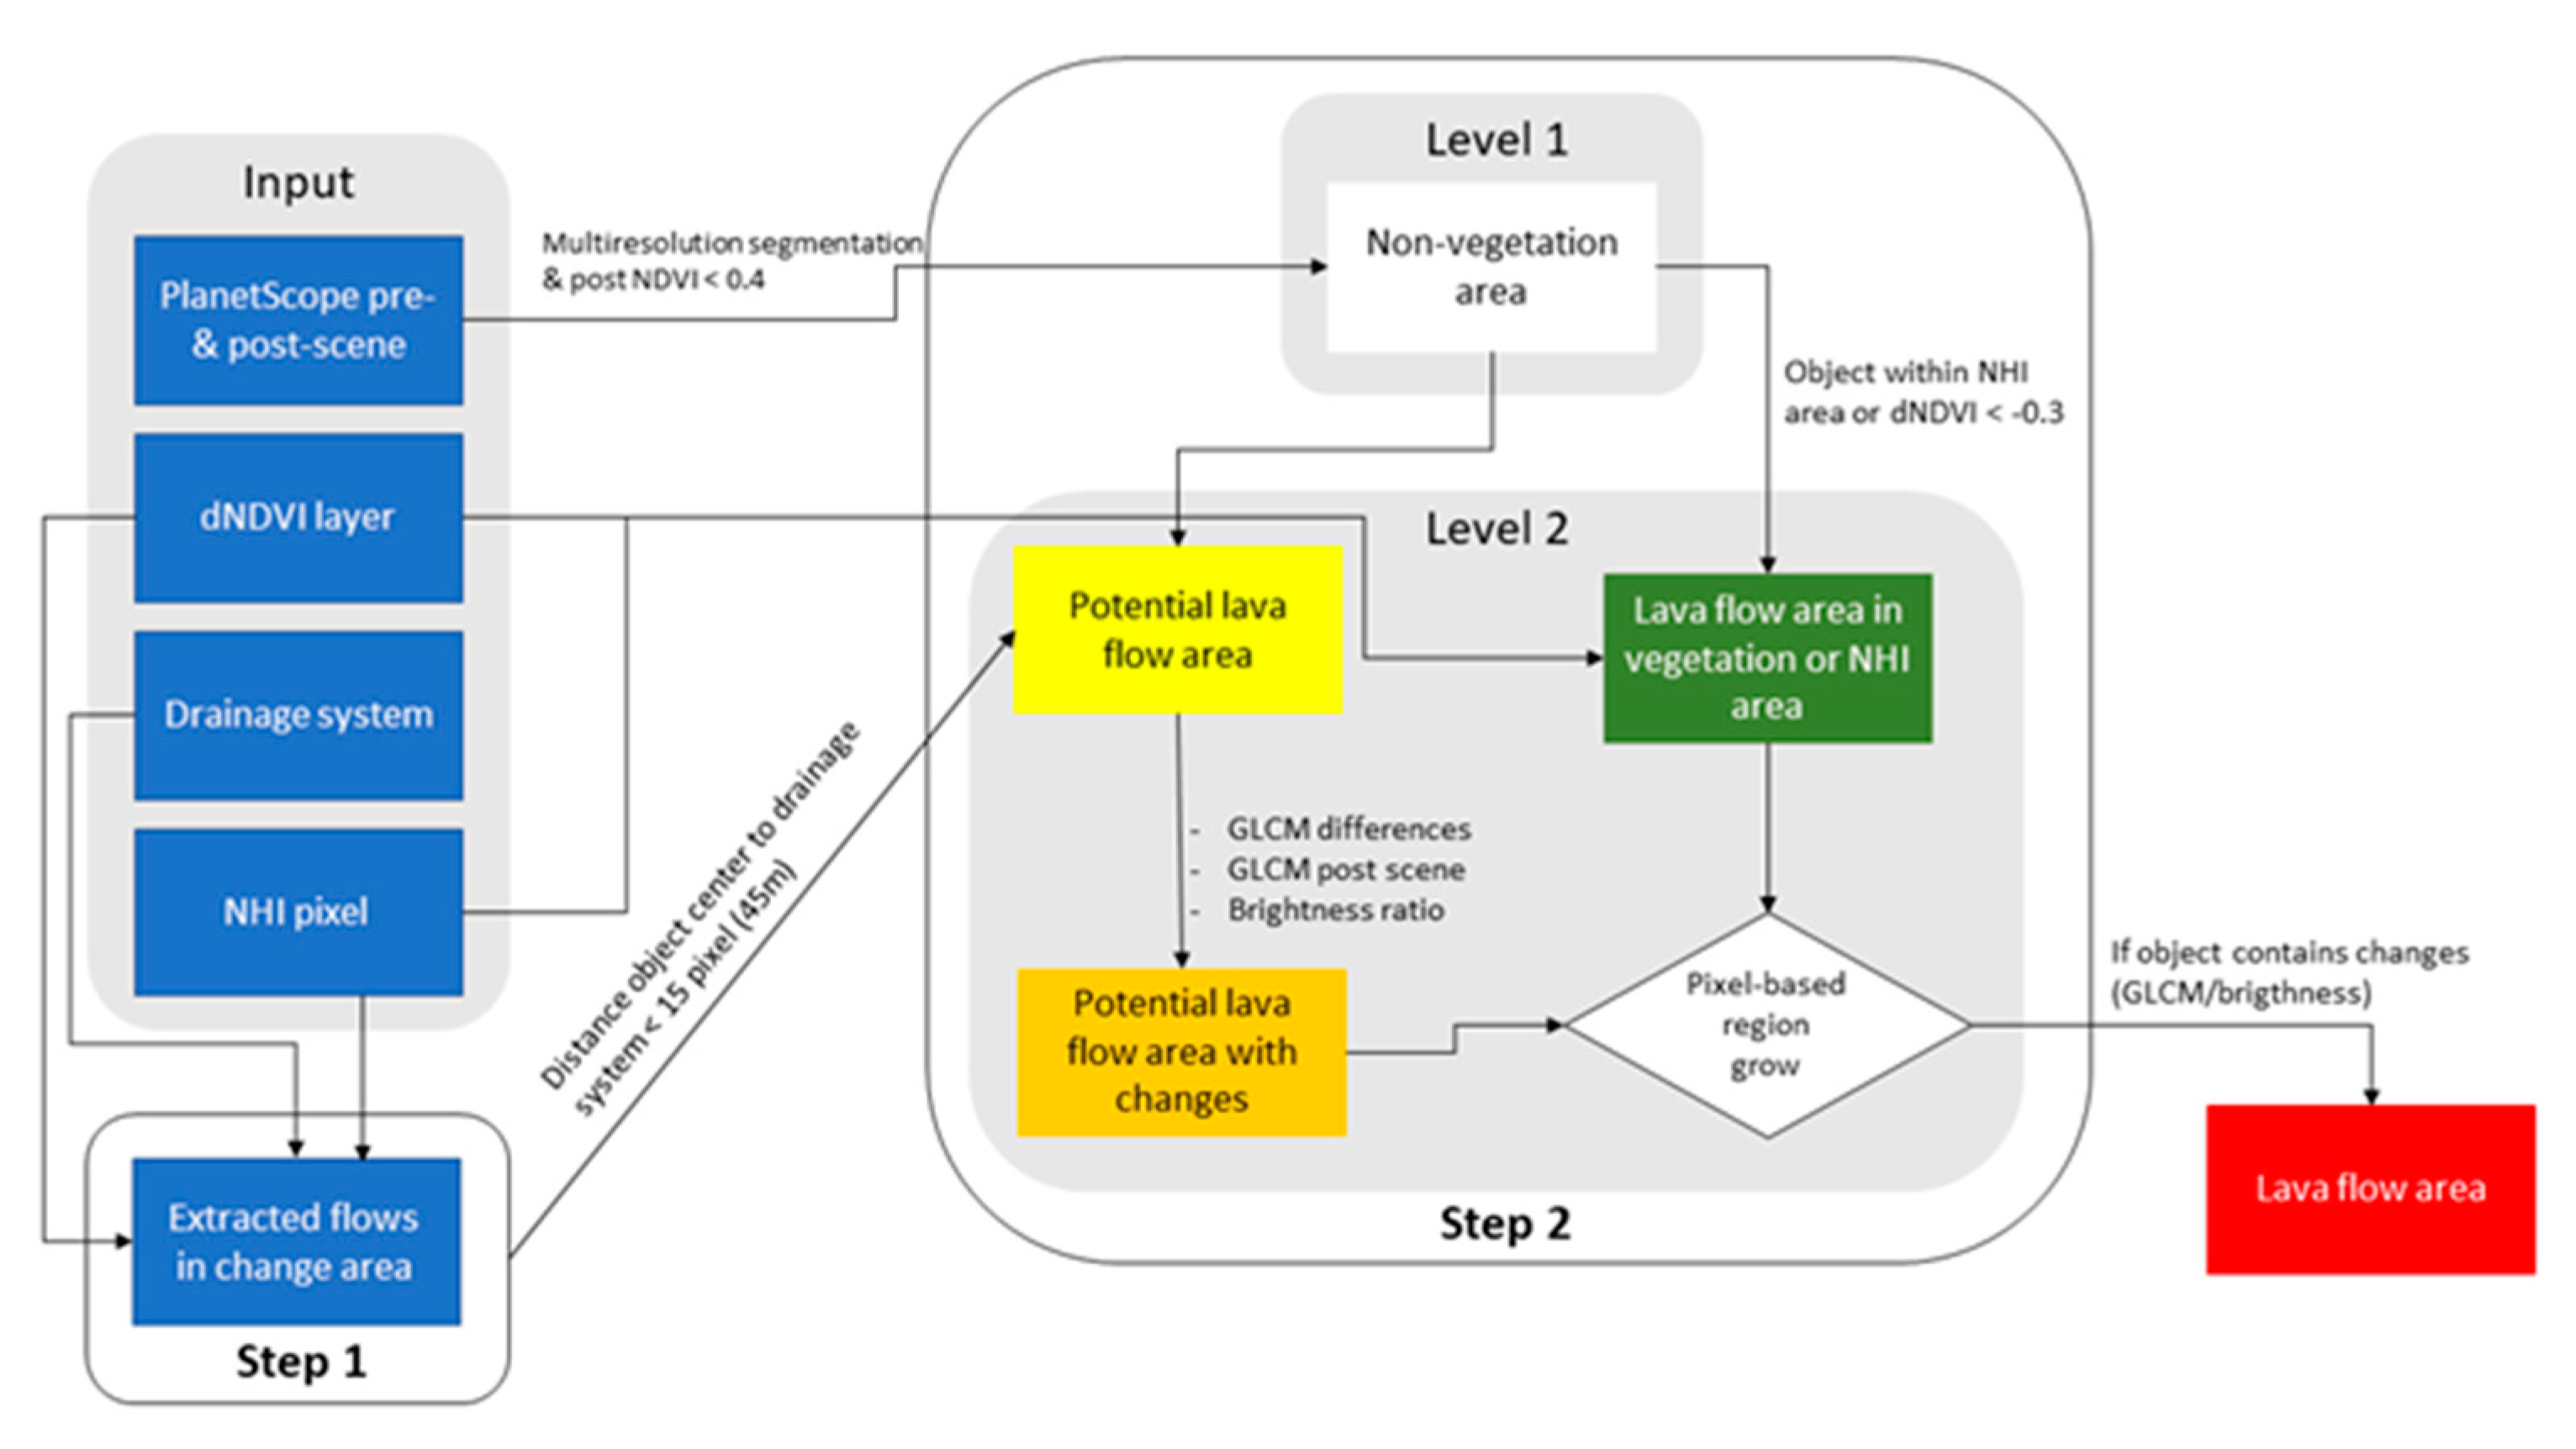
4.3. Lava Flow Mapping
5. Results
5.1. Volcanic Ash Deposits Mapping
5.2. Lava Flow Mapping
6. Discussion
6.1. Discussion of the Results
6.2. Advantages and Limitations of the Presented Lava Flow Mapping Approach
6.3. How Volcano Monitoring Benefits from PlanetScope Imagery
7. Conclusions
Author Contributions
Funding
Data Availability Statement
Acknowledgments
Conflicts of Interest
Appendix A

References
- Auker, M.R.; Sparks, R.S.J.; Siebert, L.; Crosweller, H.S.; Ewert, J. A statistical analysis of the global historical volcanic fatalities record. J. Appl. Volcanol. 2013, 2, 1–24. [Google Scholar] [CrossRef] [Green Version]
- Brown, S.K.; Loughlin, S.C.; Sparks, R.; Vye-Brown, C.; Barclay, J.; Calder, E.; Cottrell, E.; Jolly, G.; Komorowski, J.-C.; Mandeville, C.; et al. Global volcanic hazard and risk. In Global Volcanic Hazards and Risk; Loughlin, S., Sparks, S., Brown, S.K., Jenkins, S.F., Vye-Brown, C., Eds.; Cambridge University Press: Cambridge, UK; New York, NY, USA; Port Melbourne, Australia; New Delhi, India; Singapore, 2015; pp. 81–172. ISBN 9781316276273. [Google Scholar]
- Patrick, M.R.; Dietterich, H.R.; Lyons, J.J.; Diefenbach, A.K.; Parcheta, C.; Anderson, K.R.; Namiki, A.; Sumita, I.; Shiro, B.; Kauahikaua, J.P. Cyclic lava effusion during the 2018 eruption of Kīlauea Volcano. Science 2019, 366, eaay9070. [Google Scholar] [CrossRef] [PubMed]
- Wilson, T.M.; Stewart, C.; Sword-Daniels, V.; Leonard, G.S.; Johnston, D.M.; Cole, J.W.; Wardman, J.; Wilson, G.; Barnard, S.T. Volcanic ash impacts on critical infrastructure. Physics Chem. Earth Parts A/B/C 2012, 45–46, 5–23. [Google Scholar] [CrossRef]
- Horwell, C.J.; Baxter, P.J. The respiratory health hazards of volcanic ash: A review for volcanic risk mitigation. Bull. Volcanol. 2006, 69, 1–24. [Google Scholar] [CrossRef]
- Baxter, P.J.; Jenkins, S.; Seswandhana, R.; Komorowski, J.-C.; Dunn, K.; Purser, D.; Voight, B.; Shelley, I. Human survival in volcanic eruptions: Thermal injuries in pyroclastic surges, their causes, prognosis and emergency management. Burns 2017, 43, 1051–1069. [Google Scholar] [CrossRef]
- Charbonnier, S.J.; Germa, A.; Connor, C.B.; Gertisser, R.; Preece, K.; Komorowski, J.-C.; Lavigne, F.; Dixon, T.; Connor, L. Evaluation of the impact of the 2010 pyroclastic density currents at Merapi volcano from high-resolution satellite imagery, field investigations and numerical simulations. J. Volcanol. Geotherm. Res. 2013, 261, 295–315. [Google Scholar] [CrossRef]
- Vallance, J.W.; Iverson, R.M. Lahars and Their Deposits. In Encyclopedia of Volcanoes; Sigurdsson, H., Ed.; Academic Press: San Diego, CA, USA, 2015; pp. 649–665. [Google Scholar]
- Grilli, S.T.; Tappin, D.R.; Carey, S.; Watt, S.F.L.; Ward, S.N.; Grilli, A.R.; Engwell, S.L.; Zhang, C.; Kirby, J.T.; Schambach, L.; et al. Modelling of the tsunami from the December 22, 2018 lateral collapse of Anak Krakatau volcano in the Sunda Straits, Indonesia. Sci. Rep. 2019, 9, 11946. [Google Scholar] [CrossRef]
- Walter, T.R.; Haghshenas Haghighi, M.; Schneider, F.M.; Coppola, D.; Motagh, M.; Saul, J.; Babeyko, A.; Dahm, T.; Troll, V.R.; Tilmann, F.; et al. Complex hazard cascade culminating in the Anak Krakatau sector collapse. Nat. Commun. 2019, 10, 4339. [Google Scholar] [CrossRef]
- Francis, P.; Rothery, D. Remote Sensing of Active Volcanoes. Annu. Rev. Earth Planet. Sci. 2000, 28, 81–106. [Google Scholar] [CrossRef]
- Hidayat, A.; Marfai, M.A.; Hadmoko, D.S. Eruption on Indonesia’s volcanic islands: A review of potential hazards, fatalities, and management. IOP Conf. Ser. Earth Environ. Sci. 2020, 485, 12061. [Google Scholar] [CrossRef]
- Pallister, J.S.; Schneider, D.J.; Griswold, J.P.; Keeler, R.H.; Burton, W.C.; Noyles, C.; Newhall, C.G.; Ratdomopurbo, A. Merapi 2010 eruption—Chronology and extrusion rates monitored with satellite radar and used in eruption forecasting. J. Volcanol. Geotherm. Res. 2013, 261, 144–152. [Google Scholar] [CrossRef]
- Ganci, G.; Cappello, A.; Bilotta, G.; Del Negro, C. How the variety of satellite remote sensing data over volcanoes can assist hazard monitoring efforts: The 2011 eruption of Nabro volcano. Remote Sens. Environ. 2020, 236, 111426. [Google Scholar] [CrossRef]
- Marchese, F.; Neri, M.; Falconieri, A.; Lacava, T.; Mazzeo, G.; Pergola, N.; Tramutoli, V. The Contribution of Multi-Sensor Infrared Satellite Observations to Monitor Mt. Etna (Italy) Activity during May to August 2016. Remote Sens. 2018, 10, 1948. [Google Scholar] [CrossRef] [Green Version]
- Plank, S.; Marchese, F.; Genzano, N.; Nolde, M.; Martinis, S. The short life of the volcanic island New Late'iki (Tonga) analyzed by multi-sensor remote sensing data. Sci. Rep. 2020, 10, 22293. [Google Scholar] [CrossRef]
- Plank, S.; Walter, T.R.; Martinis, S.; Cesca, S. Growth and collapse of a littoral lava dome during the 2018/19 eruption of Kadovar Volcano, Papua New Guinea, analyzed by multi-sensor satellite imagery. J. Volcanol. Geotherm. Res. 2019, 388, 106704. [Google Scholar] [CrossRef]
- Aldeghi, A.; Carn, S.; Escobar-Wolf, R.; Groppelli, G. Volcano Monitoring from Space Using High-Cadence Planet CubeSat Images Applied to Fuego Volcano, Guatemala. Remote Sens. 2019, 11, 2151. [Google Scholar] [CrossRef] [Green Version]
- Ginting, F.I.; Nelson, M.; Minasny, B.; Fiantis, D. Changes in Anak Krakatau landscape after December 2018 eruption. IOP Conf. Ser. Earth Environ. Sci. 2021, 708, 12088. [Google Scholar] [CrossRef]
- Solikhin, A.; Thouret, J.-C.; Liew, S.C.; Gupta, A.; Sayudi, D.S.; Oehler, J.-F.; Kassouk, Z. High-spatial-resolution imagery helps map deposits of the large (VEI 4) 2010 Merapi Volcano eruption and their impact. Bull. Volcanol. 2015, 77, 1–23. [Google Scholar] [CrossRef]
- Thouret, J.-C.; Kassouk, Z.; Gupta, A.; Liew, S.C.; Solikhin, A. Tracing the evolution of 2010 Merapi volcanic deposits (Indonesia) based on object-oriented classification and analysis of multi-temporal, very high resolution images. Remote Sens. Environ. 2015, 170, 350–371. [Google Scholar] [CrossRef]
- Corradino, C.; Ganci, G.; Cappello, A.; Bilotta, G.; Hérault, A.; Del Negro, C. Mapping Recent Lava Flows at Mount Etna Using Multispectral Sentinel-2 Images and Machine Learning Techniques. Remote Sens. 2019, 11, 1916. [Google Scholar] [CrossRef] [Green Version]
- Harris, A.J.L.; Vallance, J.W.; Kimberly, P.; Rose, W.I.; Matías, O.; Bunzendahl, E.; Flynn, L.P.; Garbeil, H. Downstream aggradation owing to lava dome extrusion and rainfall runoff at Volcán Santiaguito, Guatemala. In Volcanic hazards in Central America; Rose, W.I., Bluth, G.J.S., Carr, M.J., Ewert, J.W., Patino, L.C., Vallance, J.W., Eds.; Geological Society of America: Boulder, CO, USA, 2006; pp. 85–104. ISBN 9780813724126. [Google Scholar]
- Li, L.; Solana, C.; Canters, F.; Kervyn, M. Testing random forest classification for identifying lava flows and mapping age groups on a single Landsat 8 image. J. Volcanol. Geotherm. Res. 2017, 345, 109–124. [Google Scholar] [CrossRef] [Green Version]
- Lavigne, F.; Thouret, J.; Voight, B.; Suwa, H.; Sumaryono, A. Lahars at Merapi volcano, Central Java: An overview. J. Volcanol. Geotherm. Res. 2000, 100, 423–456. [Google Scholar] [CrossRef]
- Aufaristama, M.; Hoskuldsson, A.; Jonsdottir, I.; Ulfarsson, M.; Thordarson, T. New Insights for Detecting and Deriving Thermal Properties of Lava Flow Using Infrared Satellite during 2014–2015 Effusive Eruption at Holuhraun, Iceland. Remote Sens. 2018, 10, 151. [Google Scholar] [CrossRef] [Green Version]
- Bignami, C.; Chini, M.; Amici, S.; Trasatti, E. Synergic Use of Multi-Sensor Satellite Data for Volcanic Hazards Monitoring: The Fogo (Cape Verde) 2014–2015 Effusive Eruption. Front. Earth Sci. 2020, 8, 22. [Google Scholar] [CrossRef] [Green Version]
- Plank, S.; Marchese, F.; Filizzola, C.; Pergola, N.; Neri, M.; Nolde, M.; Martinis, S. The July/August 2019 Lava Flows at the Sciara del Fuoco, Stromboli–Analysis from Multi-Sensor Infrared Satellite Imagery. Remote Sens. 2019, 11, 2879. [Google Scholar] [CrossRef] [Green Version]
- Morrice, M.G.; Jezek, P.A.; Gill, J.B.; Whitford, D.J.; Monoarfa, M. An introduction to the Sangihe arc: Volcanism accompanying arc—Arc collision in the Molucca Sea, Indonesia. J. Volcanol. Geotherm. Res. 1983, 19, 135–165. [Google Scholar] [CrossRef]
- Global Volcanism Program. Karangetang (267020). In Volcanoes of the World, v. 4.10.1 (29 Jun 2021); Venzke, E., Ed.; Smithsonian Institution: Washington, DC, USA, 2013; Available online: https://volcano.si.edu/volcano.cfm?vn=267020 (accessed on 29 June 2021).
- Global Volcanism Program. Report on Karangetang (Indonesia)—May 2019. Bull. Glob. Volcanism Netw. 2019, 44, 5. [CrossRef]
- Global Volcanism Program. Report on Karangetang (Indonesia)—December 2019. Bull. Glob. Volcanism Netw. 2019, 44, 12. [CrossRef]
- Global Volcanism Program. Report on Karangetang (Indonesia)—June 2020. Bull. Glob. Volcanism Netw. 2020, 4, 6. [CrossRef]
- Fontijn, K.; Costa, F.; Sutawidjaja, I.; Newhall, C.G.; Herrin, J.S. A 5000-year record of multiple highly explosive mafic eruptions from Gunung Agung (Bali, Indonesia): Implications for eruption frequency and volcanic hazards. Bull. Volcanol. 2015, 77, 1–15. [Google Scholar] [CrossRef]
- Global Volcanism Program. Agung (264020). In Volcanoes of the World, v. 4.10.1 (29 Jun 2021); Venzke, E., Ed.; Smithsonian Institution: Washington, DC, USA, 2013; Available online: https://volcano.si.edu/volcano.cfm?vn=264020 (accessed on 29 June 2021).
- Global Volcanism Program. Report on Agung (Indonesia)—January 2018. Bull. Global Volcanism Netw. 2018, 43, 1. [CrossRef]
- Marchese, F.; Falconieri, A.; Pergola, N.; Tramutoli, V. Monitoring the Agung (Indonesia) Ash Plume of November 2017 by Means of Infrared Himawari 8 Data. Remote Sens. 2018, 10, 919. [Google Scholar] [CrossRef] [Green Version]
- Global Volcanism Program. Krakatau (262000). In Volcanoes of the World, v. 4.10.1 (29 Jun 2021); Venzke, E., Ed.; Smithsonian Institution: Washington, DC, USA, 2013; Available online: https://volcano.si.edu/volcano.cfm?vn=262000 (accessed on 29 June 2021).
- Self, S.; Rampino, M.R. The 1883 eruption of Krakatau. Nature 1981, 294, 699–704. [Google Scholar] [CrossRef]
- Mutaqin, B.W.; Lavigne, F.; Hadmoko, D.S.; Ngalawani, M.N. Volcanic Eruption-Induced Tsunami in Indonesia: A Review. IOP Conf. Ser. Earth Environ. Sci. 2019, 256, 12023. [Google Scholar] [CrossRef] [Green Version]
- Global Volcanism Program. Report on Krakatau (Indonesia)—October 2018. Bull. Glob. Volcanism Netw. 2018, 43, 10. [CrossRef]
- Global Volcanism Program. Report on Krakatau (Indonesia)—March 2019. Bull. Glob. Volcanism Netw. 2019, 44, 3. [CrossRef]
- Ghuffar, S. DEM Generation from Multi Satellite PlanetScope Imagery. Remote Sens. 2018, 10, 1462. [Google Scholar] [CrossRef] [Green Version]
- Planet Labs. PlanetScope Product Specifications. 2021. Available online: https://assets.planet.com/docs/Planet_PSScene_Imagery_Product_Spec_June_2021.pdf (accessed on 8 July 2021).
- Kääb, A.; Altena, B.; Mascaro, J. River-ice and water velocities using the Planet optical cubesat constellation. Hydrol. Earth Syst. Sci. 2019, 23, 4233–4247. [Google Scholar] [CrossRef] [Green Version]
- Marchese, F.; Genzano, N.; Neri, M.; Falconieri, A.; Mazzeo, G.; Pergola, N. A Multi-Channel Algorithm for Mapping Volcanic Thermal Anomalies by Means of Sentinel-2 MSI and Landsat-8 OLI Data. Remote Sens. 2019, 11, 2876. [Google Scholar] [CrossRef] [Green Version]
- European Space Agency. Sentinel-2 User Handbook. Available online: https://sentinel.esa.int/documents/247904/0/Sentinel-2_User_Handbook/8869acdf-fd84-43ec-ae8c-3e80a436a16c (accessed on 20 July 2021).
- U.S. Geological Survey. Landsat 8 (L8) Data Users Handbook. Available online: https://prd-wret.s3.us-west-2.amazonaws.com/assets/palladium/production/atoms/files/LSDS-1574_L8_Data_Users_Handbook-v5.0.pdf (accessed on 15 July 2021).
- Massimetti, F.; Coppola, D.; Laiolo, M.; Valade, S.; Cigolini, C.; Ripepe, M. Volcanic Hot-Spot Detection Using SENTINEL-2: A Comparison with MODIS–MIROVA Thermal Data Series. Remote Sens. 2020, 12, 820. [Google Scholar] [CrossRef] [Green Version]
- Genzano, N.; Pergola, N.; Marchese, F. A Google Earth Engine Tool to Investigate, Map and Monitor Volcanic Thermal Anomalies at Global Scale by Means of Mid-High Spatial Resolution Satellite Data. Remote Sens. 2020, 12, 3232. [Google Scholar] [CrossRef]
- Krieger, G.; Moreira, A.; Fiedler, H.; Hajnsek, I.; Werner, M.; Younis, M.; Zink, M. TanDEM-X: A Satellite Formation for High-Resolution SAR Interferometry. IEEE Trans. Geosci. Remote Sens. 2007, 45, 3317–3341. [Google Scholar] [CrossRef] [Green Version]
- Fahrland, E. Copernicus Digital Elevation Model (DEM): Product Handbook. 2020. Available online: https://spacedata.copernicus.eu/documents/20126/0/GEO1988-CopernicusDEM-SPE-002_ProductHandbook_I1.00.pdf/082dd479-f908-bf42-51bf-4c0053129f7c?t=1586526993604 (accessed on 20 July 2021).
- U.S. Geological Survey. USGS EROS Archive—Digital Elevation: Shuttle Radar Topography Mission (SRTM) 1 Arc-Second Global. Available online: https://www.usgs.gov/centers/eros/science/usgs-eros-archive-digital-elevation-shuttle-radar-topography-mission-srtm-1-arc?qt-science_center_objects=0#qt-science_center_objects (accessed on 20 July 2021).
- Alaska Satellite Facility. ALOS PALSAR—Radiometric Terrain Correction. Available online: https://asf.alaska.edu/data-sets/derived-data-sets/alos-palsar-rtc/alos-palsar-radiometric-terrain-correction/ (accessed on 20 July 2021).
- Tucker, C.J.; Sellers, P.J. Satellite remote sensing of primary production. Int. J. Remote Sens. 1986, 7, 1395–1416. [Google Scholar] [CrossRef]
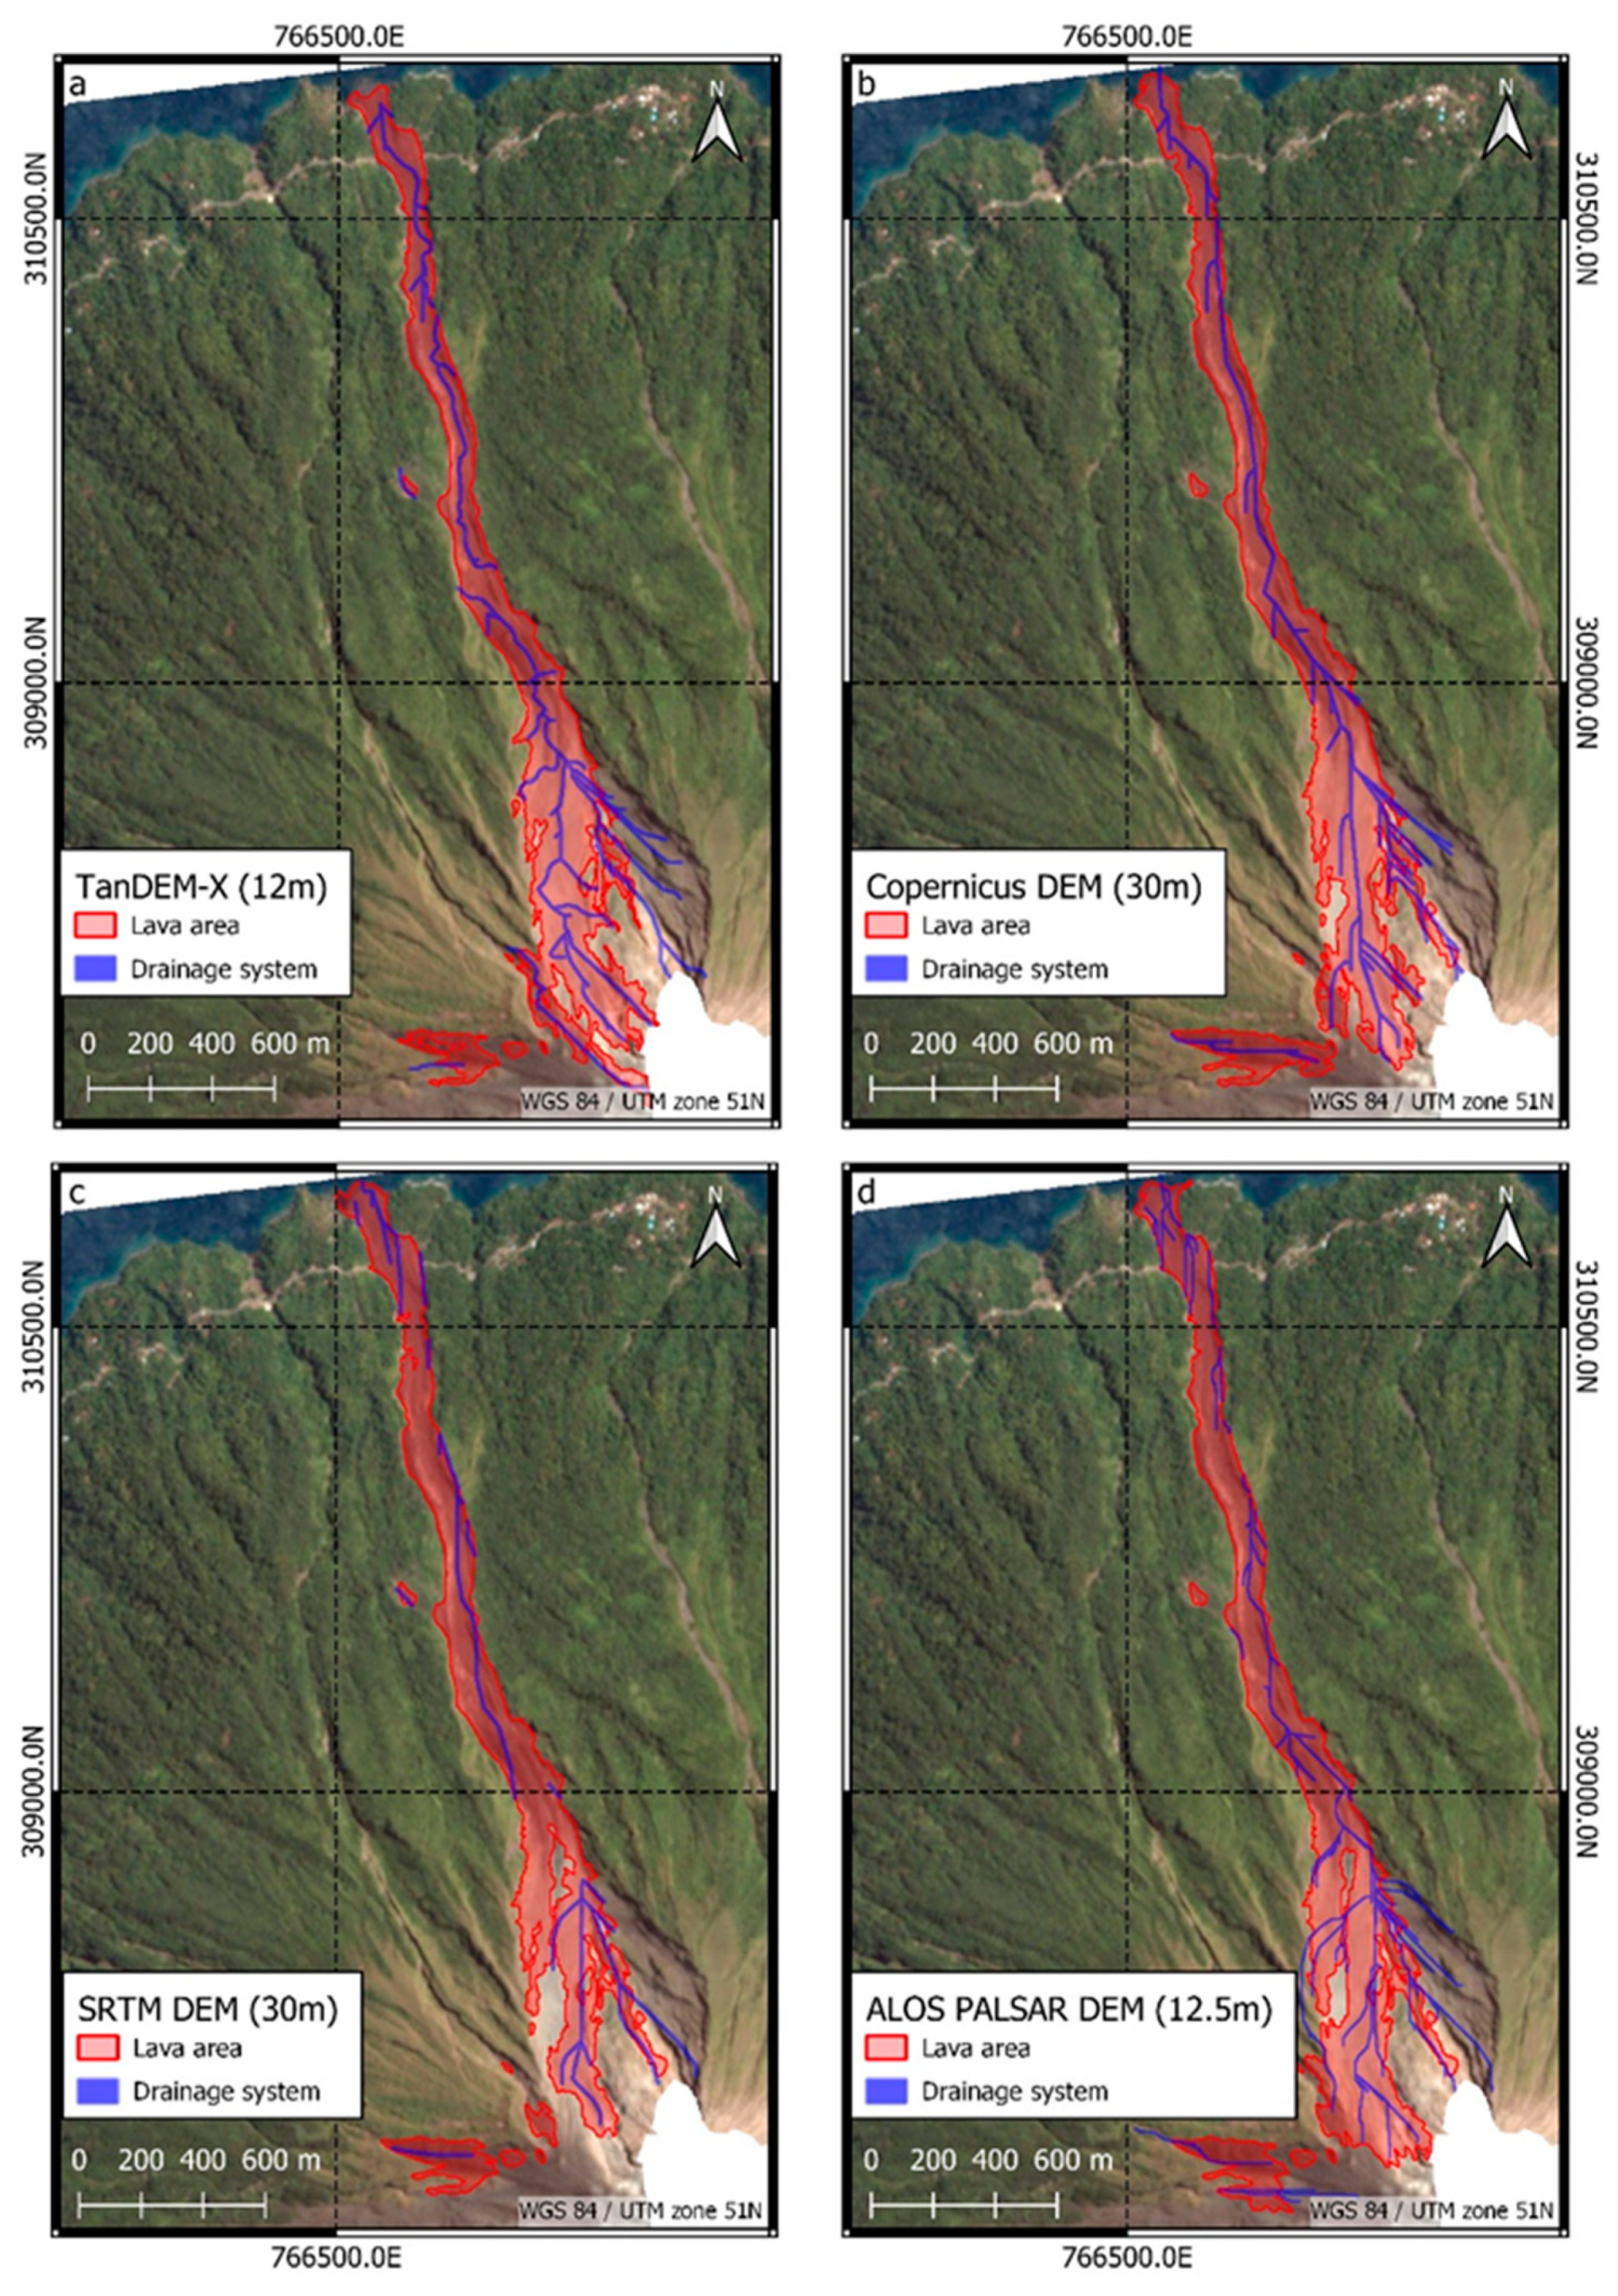
- O`Callaghan, J.F.; Mark, D.M. The Extraction of Drainage Networks from Digital Elevation Data. Comput. Vis. Graph. Image Processing 1984, 28, 323–344. [Google Scholar] [CrossRef]
- Jenson, S.K.; Domingue, J.O. Extracting Topographic Structure from Digital Elevation Data for Geographic Information System Analysis. Photogramm. Eng. Remote Sens. 1988, 54, 1593–1600. [Google Scholar]
- Cando-Jácome, M.; Martínez-Graña, A. Determination of Primary and Secondary Lahar Flow Paths of the Fuego Volcano (Guatemala) Using Morphometric Parameters. Remote Sens. 2019, 11, 727. [Google Scholar] [CrossRef] [Green Version]
- Tarboton, D.G.; Bras, R.L.; Rodriguez-Iturbe, I. On the extraction of channel networks from digital elevation data. Hydrol. Process. 1991, 5, 81–100. [Google Scholar] [CrossRef]
- Panuju, D.R.; Paull, D.J.; Griffin, A.L. Change Detection Techniques Based on Multispectral Images for Investigating Land Cover Dynamics. Remote Sens. 2020, 12, 1781. [Google Scholar] [CrossRef]
- Li, L.; Bakelants, L.; Solana, C.; Canters, F.; Kervyn, M. Dating lava flows of tropical volcanoes by means of spatial modeling of vegetation recovery. Earth Surf. Process. Landf. 2018, 43, 840–856. [Google Scholar] [CrossRef]
- Blaschke, T. Object based image analysis for remote sensing. ISPRS J. Photogramm. Remote Sens. 2010, 65, 2–16. [Google Scholar] [CrossRef] [Green Version]
- Benz, U.C.; Hofmann, P.; Willhauck, G.; Lingenfelder, I.; Heynen, M. Multi-resolution, object-oriented fuzzy analysis of remote sensing data for GIS-ready information. ISPRS J. Photogramm. Remote Sens. 2004, 58, 239–258. [Google Scholar] [CrossRef]
- Haralick, R.M.; Shanmugam, K.; Dinstein, I. Textural Features for Image Classification. IEEE Trans. Syst. Man, Cybern. 1973, SMC-3, 610–621. [Google Scholar] [CrossRef] [Green Version]
- Harris, A.J.L.; Rowland, S.K. Lava Flows and Rheology. In Encyclopedia of Volcanoes; Sigurdsson, H., Ed.; Academic Press: San Diego, CA, USA, 2015; pp. 321–343. [Google Scholar]
- Calvari, S.; Di Traglia, F.; Ganci, G.; Giudicepietro, F.; Macedonio, G.; Cappello, A.; Nolesini, T.; Pecora, E.; Bilotta, G.; Centorrino, V.; et al. Overflows and Pyroclastic Density Currents in March-April 2020 at Stromboli Volcano Detected by Remote Sensing and Seismic Monitoring Data. Remote Sens. 2020, 12, 3010. [Google Scholar] [CrossRef]
- Otsu, N.A. Threshold Selection Method from Gray-Level Histograms. IEEE Trans. Syst. Man Cybern. 1979, 9, 62–66. [Google Scholar] [CrossRef] [Green Version]
- Del Negro, C.; Fortuna, L.; Herault, A.; Vicari, A. Simulations of the 2004 lava flow at Etna volcano using the magflow cellular automata model. Bull. Volcanol. 2008, 70, 805–812. [Google Scholar] [CrossRef] [Green Version]
- Iverson, R.M.; Schilling, S.P.; Vallance, J.W. Objective delineation of lahar-inundation hazard zones. Geol. Society Am. Bull. 1998, 110, 972–984. [Google Scholar] [CrossRef]
- Huggel, C.; Schneider, D.; Miranda, P.J.; Delgado Granados, H.; Kääb, A. Evaluation of ASTER and SRTM DEM data for lahar modeling: A case study on lahars from Popocatépetl Volcano, Mexico. J. Volcanol. Geotherm. Res. 2008, 170, 99–110. [Google Scholar] [CrossRef] [Green Version]
- Kassouk, Z.; Thouret, J.-C.; Gupta, A.; Solikhin, A.; Liew, S.C. Object-oriented classification of a high-spatial resolution SPOT5 image for mapping geology and landforms of active volcanoes: Semeru case study, Indonesia. Geomorphology 2014, 221, 18–33. [Google Scholar] [CrossRef]
- Qin, C.; Zhu, A.-X.; Pei, T.; Li, B.; Zhou, C.; Yang, L. An adaptive approach to selecting a flow-partition exponent for a multiple-flow-direction algorithm. Int. J. Geogr. Inf. Sci. 2007, 21, 443–458. [Google Scholar] [CrossRef]
- Quinn, P.; Beven, K.; Chevallier, P.; Planchon, O. The prediction of hillslope flow paths for distributed hydrological modelling using digital terrain models. Hydrol. Process. 1991, 5, 59–79. [Google Scholar] [CrossRef]
- Tarboton, D.G. A new method for the determination of flow directions and upslope areas in grid digital elevation models. Water Resour. Res. 1997, 33, 309–319. [Google Scholar] [CrossRef] [Green Version]
- Rennó, C.D.; Nobre, A.D.; Cuartas, L.A.; Soares, J.V.; Hodnett, M.G.; Tomasella, J.; Waterloo, M.J. HAND, a new terrain descriptor using SRTM-DEM: Mapping terra-firme rainforest environments in Amazonia. Remote Sens. Environ. 2008, 112, 3469–3481. [Google Scholar] [CrossRef]
- Wadge, G.; Cole, P.; Stinton, A.; Komorowski, J.-C.; Stewart, R.; Toombs, A.C.; Legendre, Y. Rapid topographic change measured by high-resolution satellite radar at Soufriere Hills Volcano, Montserrat, 2008–2010. J. Volcanol. Geotherm. Res. 2011, 199, 142–152. [Google Scholar] [CrossRef]
- Dietterich, H.R.; Poland, M.P.; Schmidt, D.A.; Cashman, K.V.; Sherrod, D.R.; Espinosa, A.T. Tracking lava flow emplacement on the east rift zone of Kīlauea, Hawai‘i, with synthetic aperture radar coherence. Geochem. Geophys. Geosyst. 2012, 13, 1–17. [Google Scholar] [CrossRef]


| Volcano | Eruption Event | Time Period | Description |
|---|---|---|---|
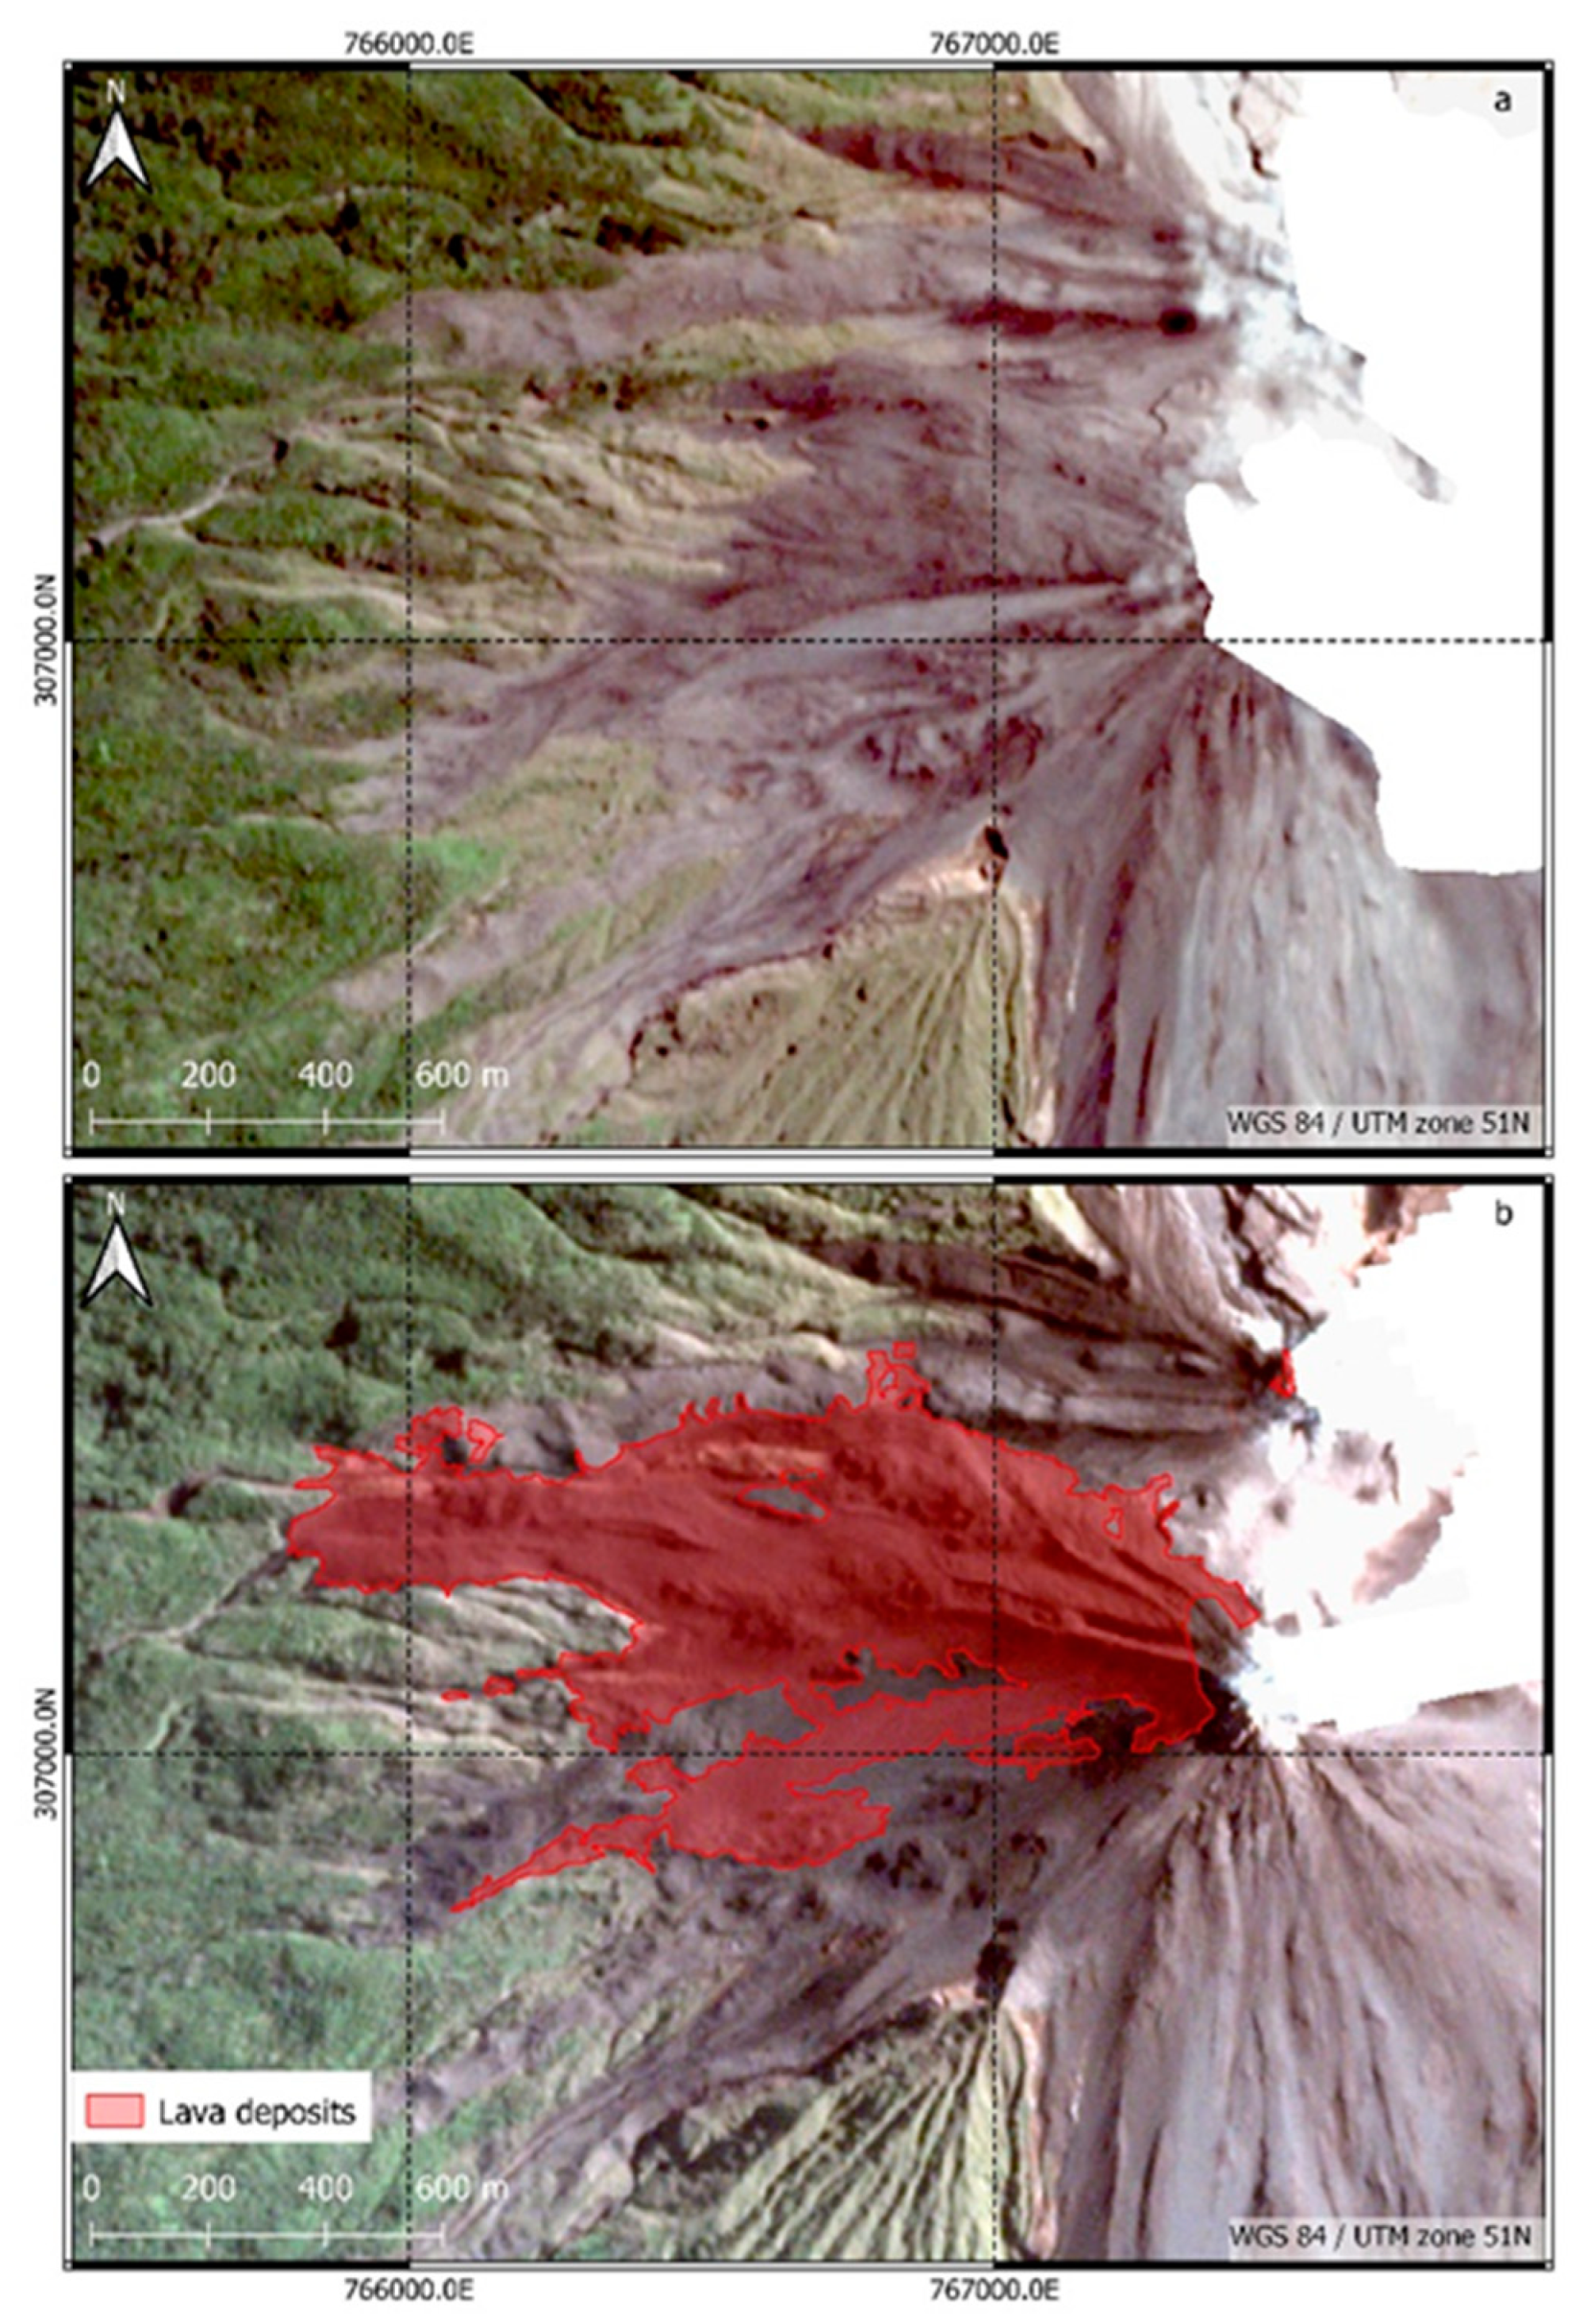
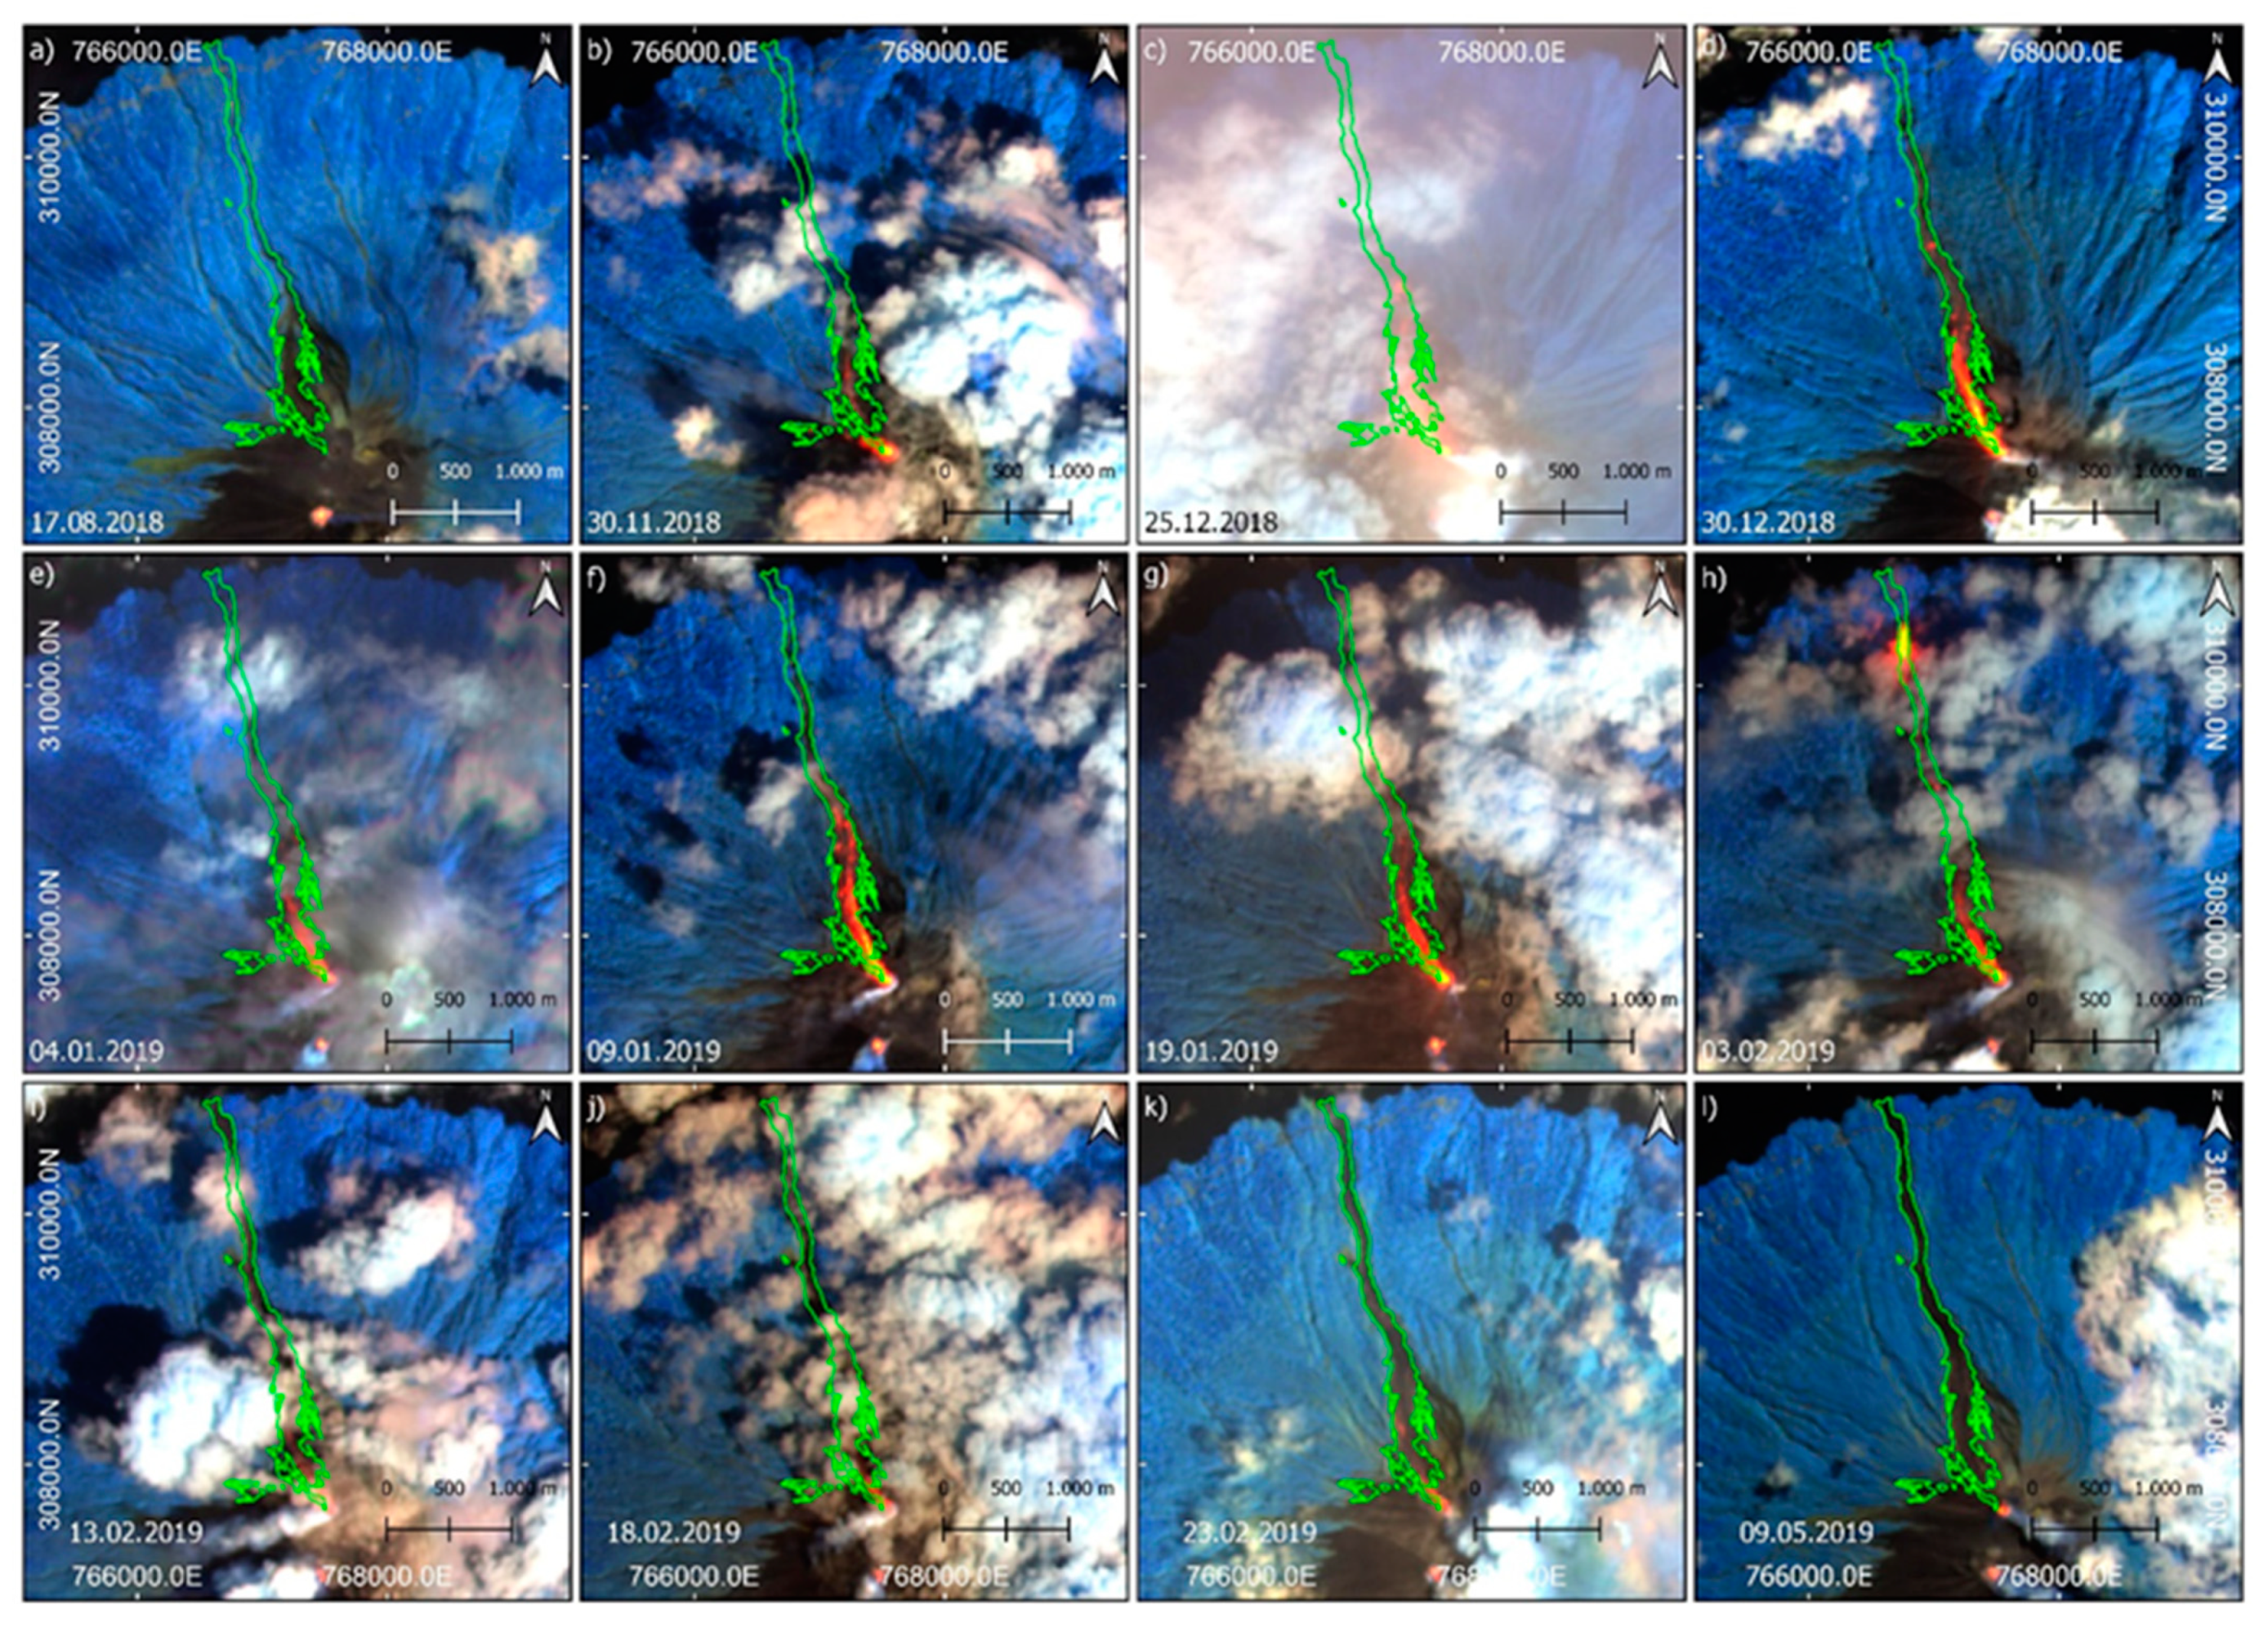
| Karangetang | Karangetang I | November 2018–March 2019 | Lava flow from the N crater towards NNW and WNW |
| Karangetang II | July 2019–January 2020 | Lava flow from the main crater towards W | |
| Agung | Agung I | 21 November 2017–30 November 2017 | Multiple ash eruptions with large ash and tephra deposits |
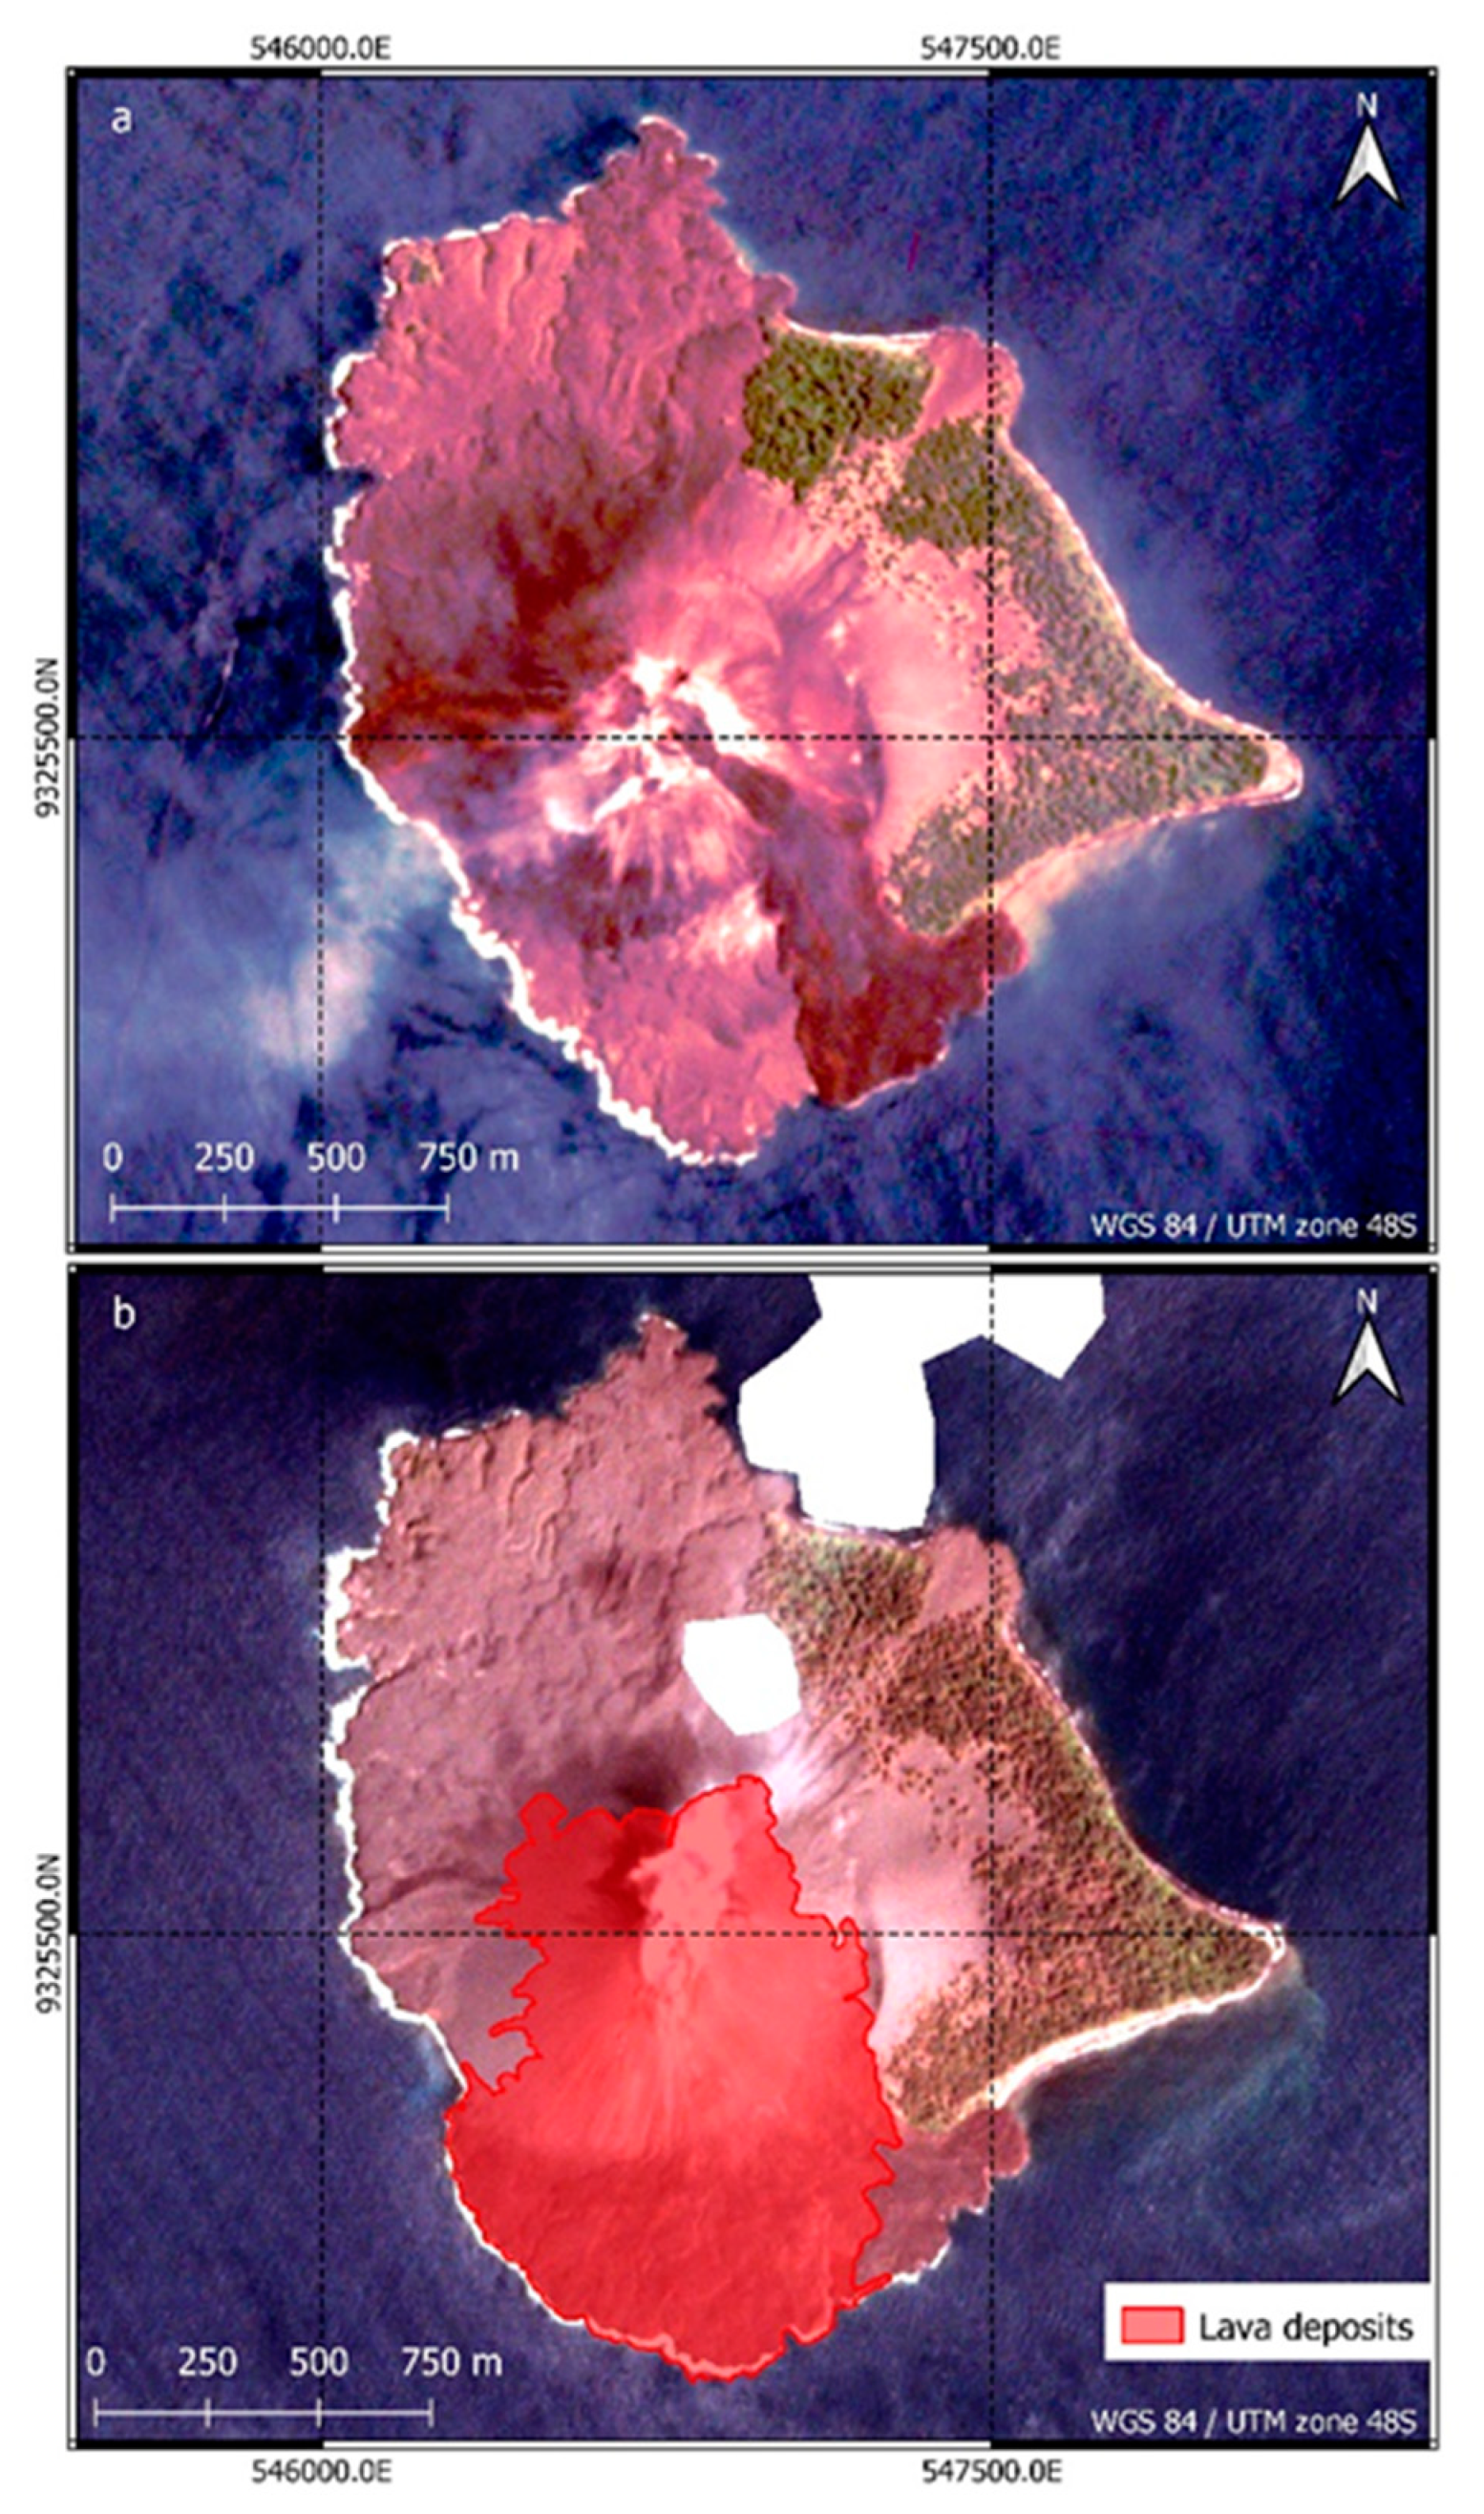
| Krakatau | Krakatau I | June 2018–December 2018 | Strombolian activity with lava flows towards S |
| Krakatau II | 22 December 2018 | Explosive eruption with flank collapse triggering tsunami |
| Classification Feature | Karangetang I | Karangetang II | Krakatau I |
|---|---|---|---|
| GLCM difference homogeneity | >0.02125 | >0.02125 | >0.005 |
| GLCM difference contrast | <−1000 | <−600 | <−250 |
| GLCM difference entropy | <−0.075 | <−0.05 | <−0.5 |
| GLCM contrast (post-scene) | <710 | <900 | <1000 |
| GLCM spatial standard deviation (post scene) | <44 | <44 | <42.5 |
| Overall brightness ratio | <0.8 | <1.8 | <0.8 |
Publisher’s Note: MDPI stays neutral with regard to jurisdictional claims in published maps and institutional affiliations. |
© 2022 by the authors. Licensee MDPI, Basel, Switzerland. This article is an open access article distributed under the terms and conditions of the Creative Commons Attribution (CC BY) license (https://creativecommons.org/licenses/by/4.0/).
Share and Cite
Rösch, M.; Plank, S. Detailed Mapping of Lava and Ash Deposits at Indonesian Volcanoes by Means of VHR PlanetScope Change Detection. Remote Sens. 2022, 14, 1168. https://doi.org/10.3390/rs14051168
Rösch M, Plank S. Detailed Mapping of Lava and Ash Deposits at Indonesian Volcanoes by Means of VHR PlanetScope Change Detection. Remote Sensing. 2022; 14(5):1168. https://doi.org/10.3390/rs14051168
Chicago/Turabian StyleRösch, Moritz, and Simon Plank. 2022. "Detailed Mapping of Lava and Ash Deposits at Indonesian Volcanoes by Means of VHR PlanetScope Change Detection" Remote Sensing 14, no. 5: 1168. https://doi.org/10.3390/rs14051168
APA StyleRösch, M., & Plank, S. (2022). Detailed Mapping of Lava and Ash Deposits at Indonesian Volcanoes by Means of VHR PlanetScope Change Detection. Remote Sensing, 14(5), 1168. https://doi.org/10.3390/rs14051168