Article

Long-Periodic Analysis of Boresight Misalignment of Ziyuan3-01 Three-Line Camera

1
The Land Satellite Remote Sensing Application Center, Ministry of Natural Resources, Beijing 100048, China
2
The State Key Laboratory of Information Engineering in Surveying, Mapping and Remote Sensing, Wuhan University, Wuhan 430079, China
3
College of Geomatics, Shandong University of Science and Technology, Qingdao 266590, China
4
State Key Laboratory of Remote Sensing Science, Aerospace Information Research Institute, Chinese Academy of Sciences, Beijing 100101, China
5
The National Joint Engineering Laboratory of Internet Applied Technology of Mines, China University of Mining and Technology, Xuzhou 221116, China
6
The School of Geosciences and Info-Physics, Central South University, Changsha 410083, China
*
Author to whom correspondence should be addressed.
Remote Sens. 2022, 14(5), 1157; https://doi.org/10.3390/rs14051157
Submission received: 17 January 2022 / Revised: 21 February 2022 / Accepted: 22 February 2022 / Published: 26 February 2022

Abstract

:
The Ziyuan3-01 (ZY3-01) satellite is China’s first civilian stereo surveying and mapping satellite to meet the 1:50,000 scale mapping requirements, and has been operated in orbit for 10 years. The boresight misalignment of the three-line camera (TLC) is an essential factor affecting the geolocation accuracy, which is a principal concern for stereo mapping satellites. However, the relative relationships of TLC are often regarded as fixed for the same ground scene in most traditional geometric calibrations, without considering the on-orbit long-periodic changes. In this paper, we propose a long-periodic method to analyze and estimate the boresight misalignments between three cameras, with the attitude estimation of a nadir (NAD) camera as the benchmark. Offsets and drifts of the three cameras were calculated and calibrated with different compensation models using scale invariant feature transform (SIFT) points as the ground control. Ten simultaneous NAD–Forward (FWD)–Backward (BWD) imagery of the ZY3-01 satellite acquired from 2012 to 2020 were selected to verify the long-periodic changes in TLC boresight misalignments. The results indicate that the boresight alignment angles of ZY3-01 TLC are dynamic during the long-periodic flight, but the structure of TLC is stable for the misalignments of both FWD and BWD within only 7 arc seconds, which can provide a positive reference for subsequent satellite design and long-periodic on-orbit geometric calibration.

1. Introduction

Stereo surveying and mapping satellites have been widely used in Earth and planet observation for their excellent performance in acquiring stereo images [1,2,3,4]. High-precision topographical mapping can be derived from the satellite stereo imagery of the same target area from different view directions [5]. In the geometric processing of high-resolution satellite images, establishing a rigorous geometric model is a key step. Exterior orientation parameters (EOPs), interior orientation parameters (IOPs) and mounting parameters of cameras are required in direct georeferencing using a rigorous geometric model [6,7,8]. The dynamic EOPs can be obtained with attitude determination and positioning devices, such as GPS receivers, star trackers and gyroscopes, while the IOPs and mounting parameters are accurately calibrated in the laboratory before launch. However, camera parameters calibrated in the laboratory often change due to some unavoidable factors, such as space environment variation, especially temperature changes [9,10], equipment aging, geometric alignment of cameras and many other factors [11,12,13,14,15,16].
In order to guarantee the geometric accuracy of the geospatial information products, on-orbit geometric calibration of cameras is an essential step to obtain accurate interior orientation parameters and mounting parameters, which directly determine the geo-positioning accuracy. Many studies have conducted research on geometric calibration and analysis of cameras for currently available satellite sensors [2,6,17,18,19,20,21,22,23,24], such as Ikonos, OrbView-3, SPOT-5, IRS-P6, MISR, ALOS/PRISM, MOMS-2P and HRSC of Mars [2,24], and China’s Tianhui, Gaofen and ZY-3 [25,26,27,28,29]. These approaches mainly improve the image georeferencing accuracy and thus the mapping product accuracy. For example, the tilting angles of camera boresight and IOPs are calibrated using large stereo image blocks; the geo-positioning accuracy of Ikonos images has reached about 8 m with ground control information [4,17]. The direct georeferencing accuracy of IRS-P6 images was improved from about 2000 to 250 m after calibration of the individual sensor alignment, the inter-camera alignment and the focal plane [19]. The geo-positioning accuracy was improved to 15 m with geometric camera calibration [18]. Calibrations such as block adjustments or image self-calibration are also used to improve the georeferencing accuracy for ALOS/PRISM images [30] or the quality of the Digital Elevation Model (DEM) for the SPOT 5 satellite [6].
As the first domestic stereo mapping optical satellite in China, the ZY3-01 satellite was launched in January 2012 and equipped with a multispectral camera (four bands: blue, green, red and near infrared) and panchromatic TLC (spectral range: 0.5–0.88 um) [31]. The FWD and BWD cameras are installed at inclinations of ±22° from the NAD camera with a base-to-height ratio of 0.87. The spatial resolution is 3.5 m for the FWD and BWD cameras, and 2.1 m for the NAD camera. These satellite images are widely used for mapping and production of 1:50,000 scale cartographic products. There have been several geometric calibrations of cameras to assess, validate and improve the geometric positioning accuracy [7,8,11,12,13,14,32,33,34,35,36]. Tang et al. (2012, [29]) proposed an image geometry model of the ZY3-01 satellite using virtual CCD line-array imaging. Zhang et al. (2014, [14]) proposed a bias compensation model of TLC for each virtual strip scene. Cao (2016, [8]) used a line-based geometric model of ZY3-01 TLC to improve the direct georeferencing accuracy, and a better georeferencing accuracy of about 3.0 m in planimetry and 2.5 m in height was achieved. Similarly, the nonlinear bias compensation model with cubic splines [32], the compensation model with the shift and drift of both pitch and roll angle [33] and the integrated geometric self-calibration of stereo cameras [34] for ZY3-01 TLC provide satisfactory compensation or calibration for the TLC. Moreover, after these geometric calibrations, the direct geo-positioning accuracy can be significantly improved with GCPs, line features or other extracted features as the control information. High-resolution linear array satellite images have an extremely small field of view (FoV), resulting in high correlation between attitude errors and mounting angle errors, or interior errors [15,16]. Thus, most of these methods distinguish the attitude errors and mounting angles errors of TLC less, or ignore the dynamic changes in the relative positions of the cameras. There are also some studies that consider the relative differences between cameras. MISR compensates the attitude of each camera separately, but does not address the mounting angles of cameras [1]. MODIS has studied the geometric accuracy changes in 36 years caused by the effective focal length of camera, while the attitudes and installation structure are not considered [37]. Pan et al. (2016, [33]) validate that the relationships among TLCs are dynamic during imaging for the same ground scene, and compensation for the TLC as a unit introduces a height error of about 1 m for the ZY3-01 satellite. However, the long-periodic dynamic changes of TLC on orbit during the operation are less studied, especially for the ZY3-01 satellite.
The ZY3-01 satellite has been operated in orbit for 10 years. An integrated and stable structure of the star trackers and TLC was adopted to reduce the relative pointing changes between them [38]. Long-periodic analyses of boresight misalignment for TLC are needed to model the geometric characteristics of sensors during the long-term on-orbit operation, which can help precisely investigate the image error sources and propagation, and then provide better service for on-orbit geometry calibration and thus improve the quality of geolocation. Moreover, long-periodic geometric accuracy analysis and prediction are also needed to study and verify without ground control measurements. In this study, a method with long-periodic analysis of boresight misalignment of TLC is proposed to estimate and validate the stability of ZY3-01 satellite TLC. Ten simultaneous NAD–FWD–BWD imagery of the ZY3-01 satellite acquired from 2012 to 2020 were selected to build the time series and verify the characteristics and variations of long-periodic TLC boresight misalignments using SIFT points as the ground control points (GCPs).
The remainder of this paper is organized as follows. In Section 2, the rigorous imaging geometric model of the TLC and the analysis approach of long-periodic TLC boresight misalignment are introduced. Experiments and corresponding results are described in Section 3. Then, camera stability, error sources and the effect of long time series are discussed in Section 4. Finally, Section 5 presents the conclusions.

2. Methodology

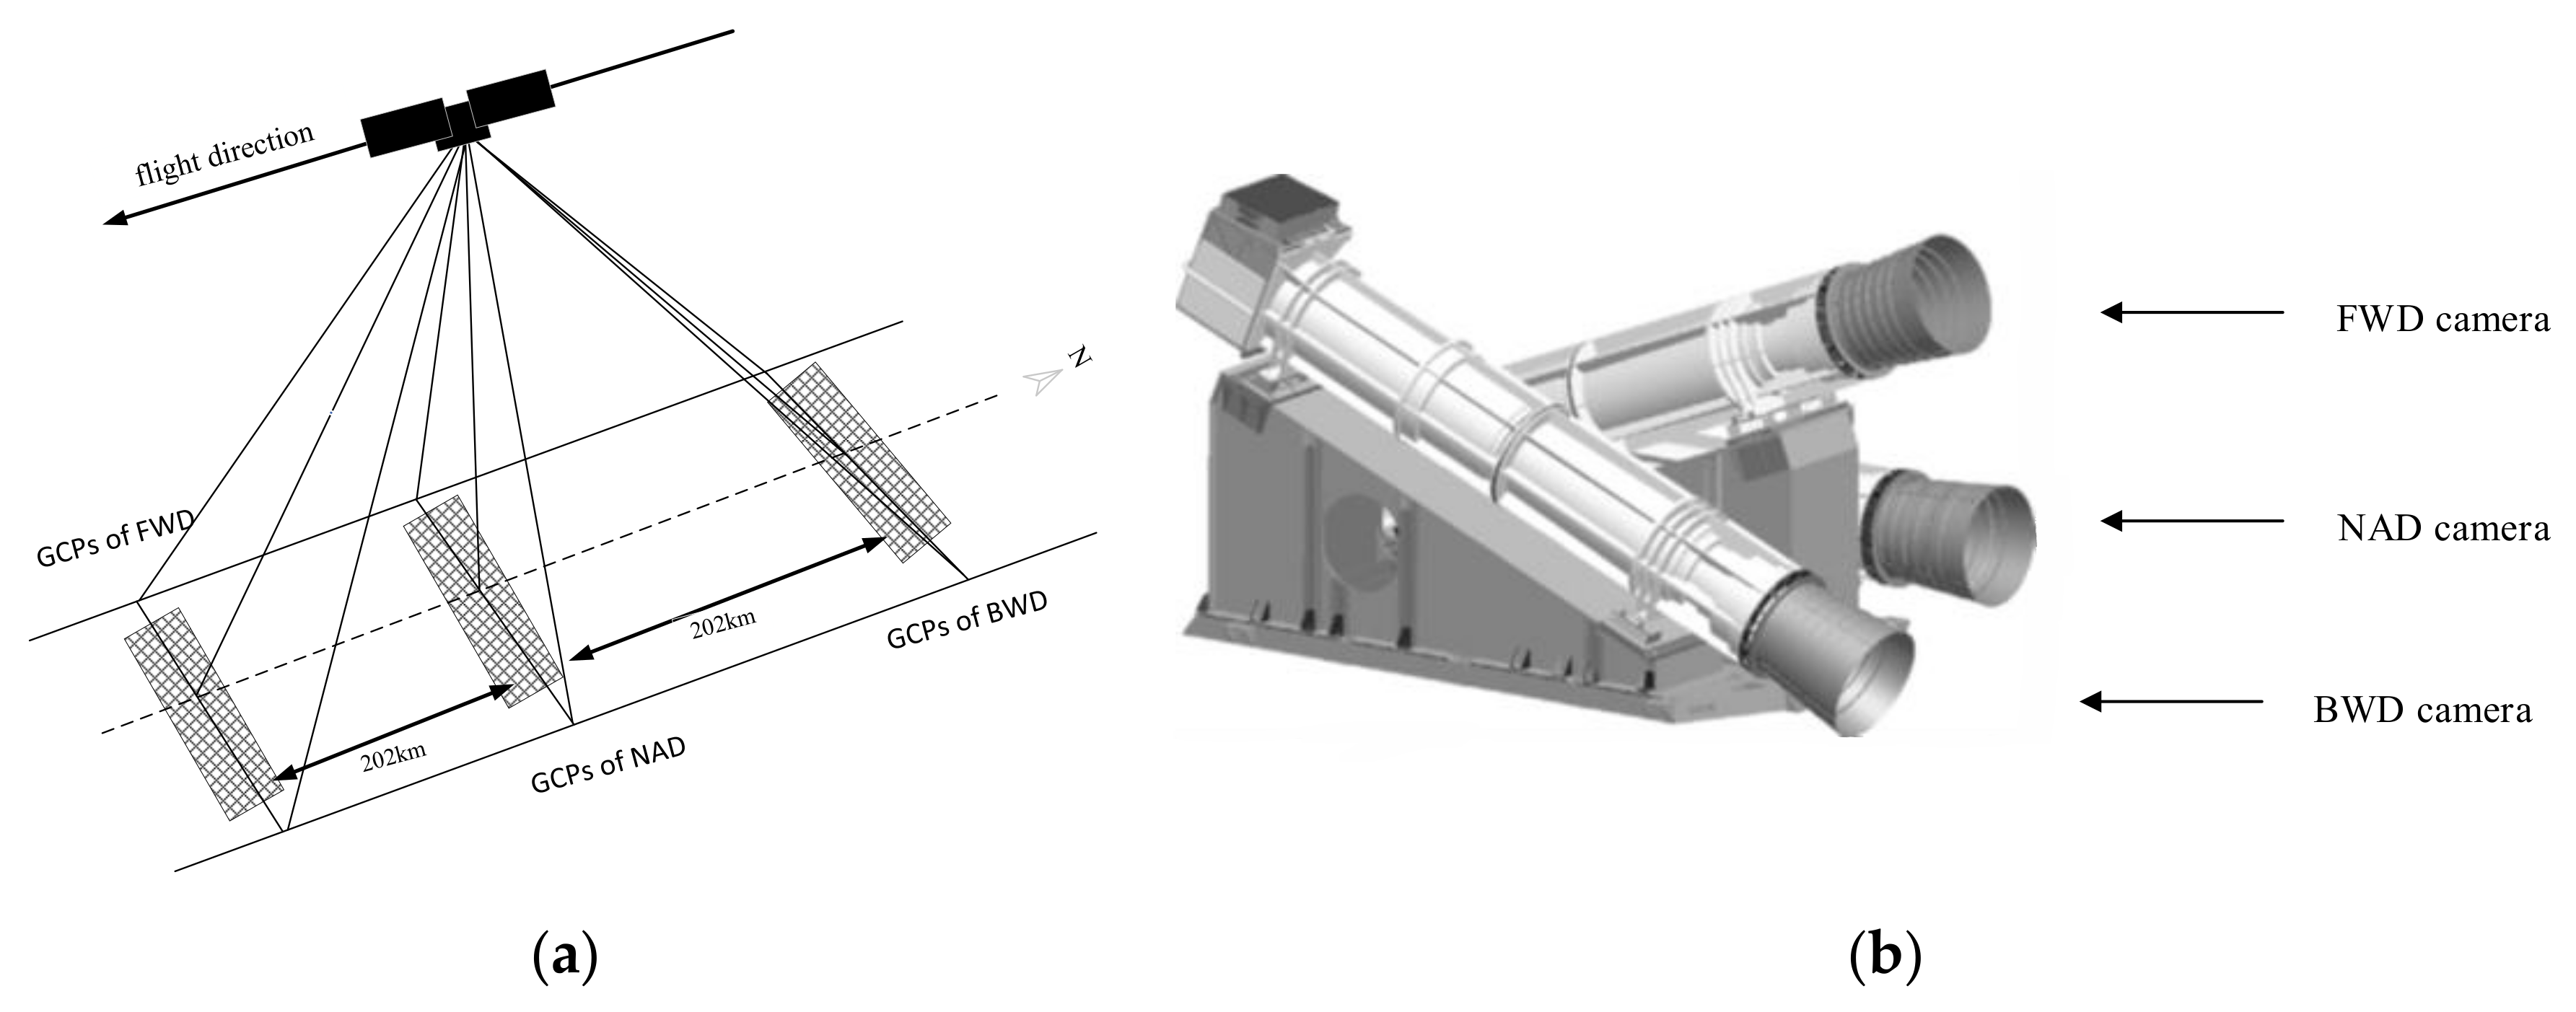
2.1. Imaging Geometric Model of TLC

The ZY3-01 satellite operates in a sun-synchronous orbit with an orbital altitude of about 505.98 km, the semi-major axis and eccentricity of which are about 6876.98 km and 0, respectively. The orbital inclination is about 97.42° and the orbit recursive period is about 59 days [31]. As shown in Figure 1, the TLC consists of three linear CCD arrays on the focal plane of the optical system, which are arranged in parallel and perpendicular to the flight direction. During the satellite flight, the three independent cameras image the ground target from different observation angles with a synchronous scanning period, so as to obtain the FWD, NAD and BWD images. The rigorous imaging geometric model of the TLC is as follows.
X g Y g Z g E C E F = X S t F Y S t F Z S t F E C E F + m F R n a v E C E F t F R F t a n ψ F y c F t a n ψ F x c F 1 = X S t N Y S t N Z S t N E C E F + m N R n a v E C E F t N R N t a n ψ N y c N t a n ψ N x c N 1 = X S t B Y S t B Z S t B E C E F + m B R n a v E C E F t B R B t a n ψ B y c B t a n ψ B x c B 1
where X g Y g Z g E C E F T represents the ground coordinates under the Earth-centered, Earth-fixed (ECEF) coordinate frame; t F , t N and t B are the imaging time of the FWD, NAD and BWD cameras, respectively; X S t Y S t Z S t E C E F T is the camera position; m F , m N and m B are the scale factors of the TLC; and R n a v E C E F t is the transformation matrix from the navigation coordinate system to the ECEF coordinate frame, which is calculated using the attitude model. R F , R N , R B are the boresight calibration matrices. ψ F y c F , ψ F x c F ,   ψ N y c N , ψ N x c N and   ψ B y c B , ψ B x c B are the interior orientation elements, representing the CCD detector look angles corresponding to the image point in the body coordinates for FWD, NAD and BWD cameras, respectively.

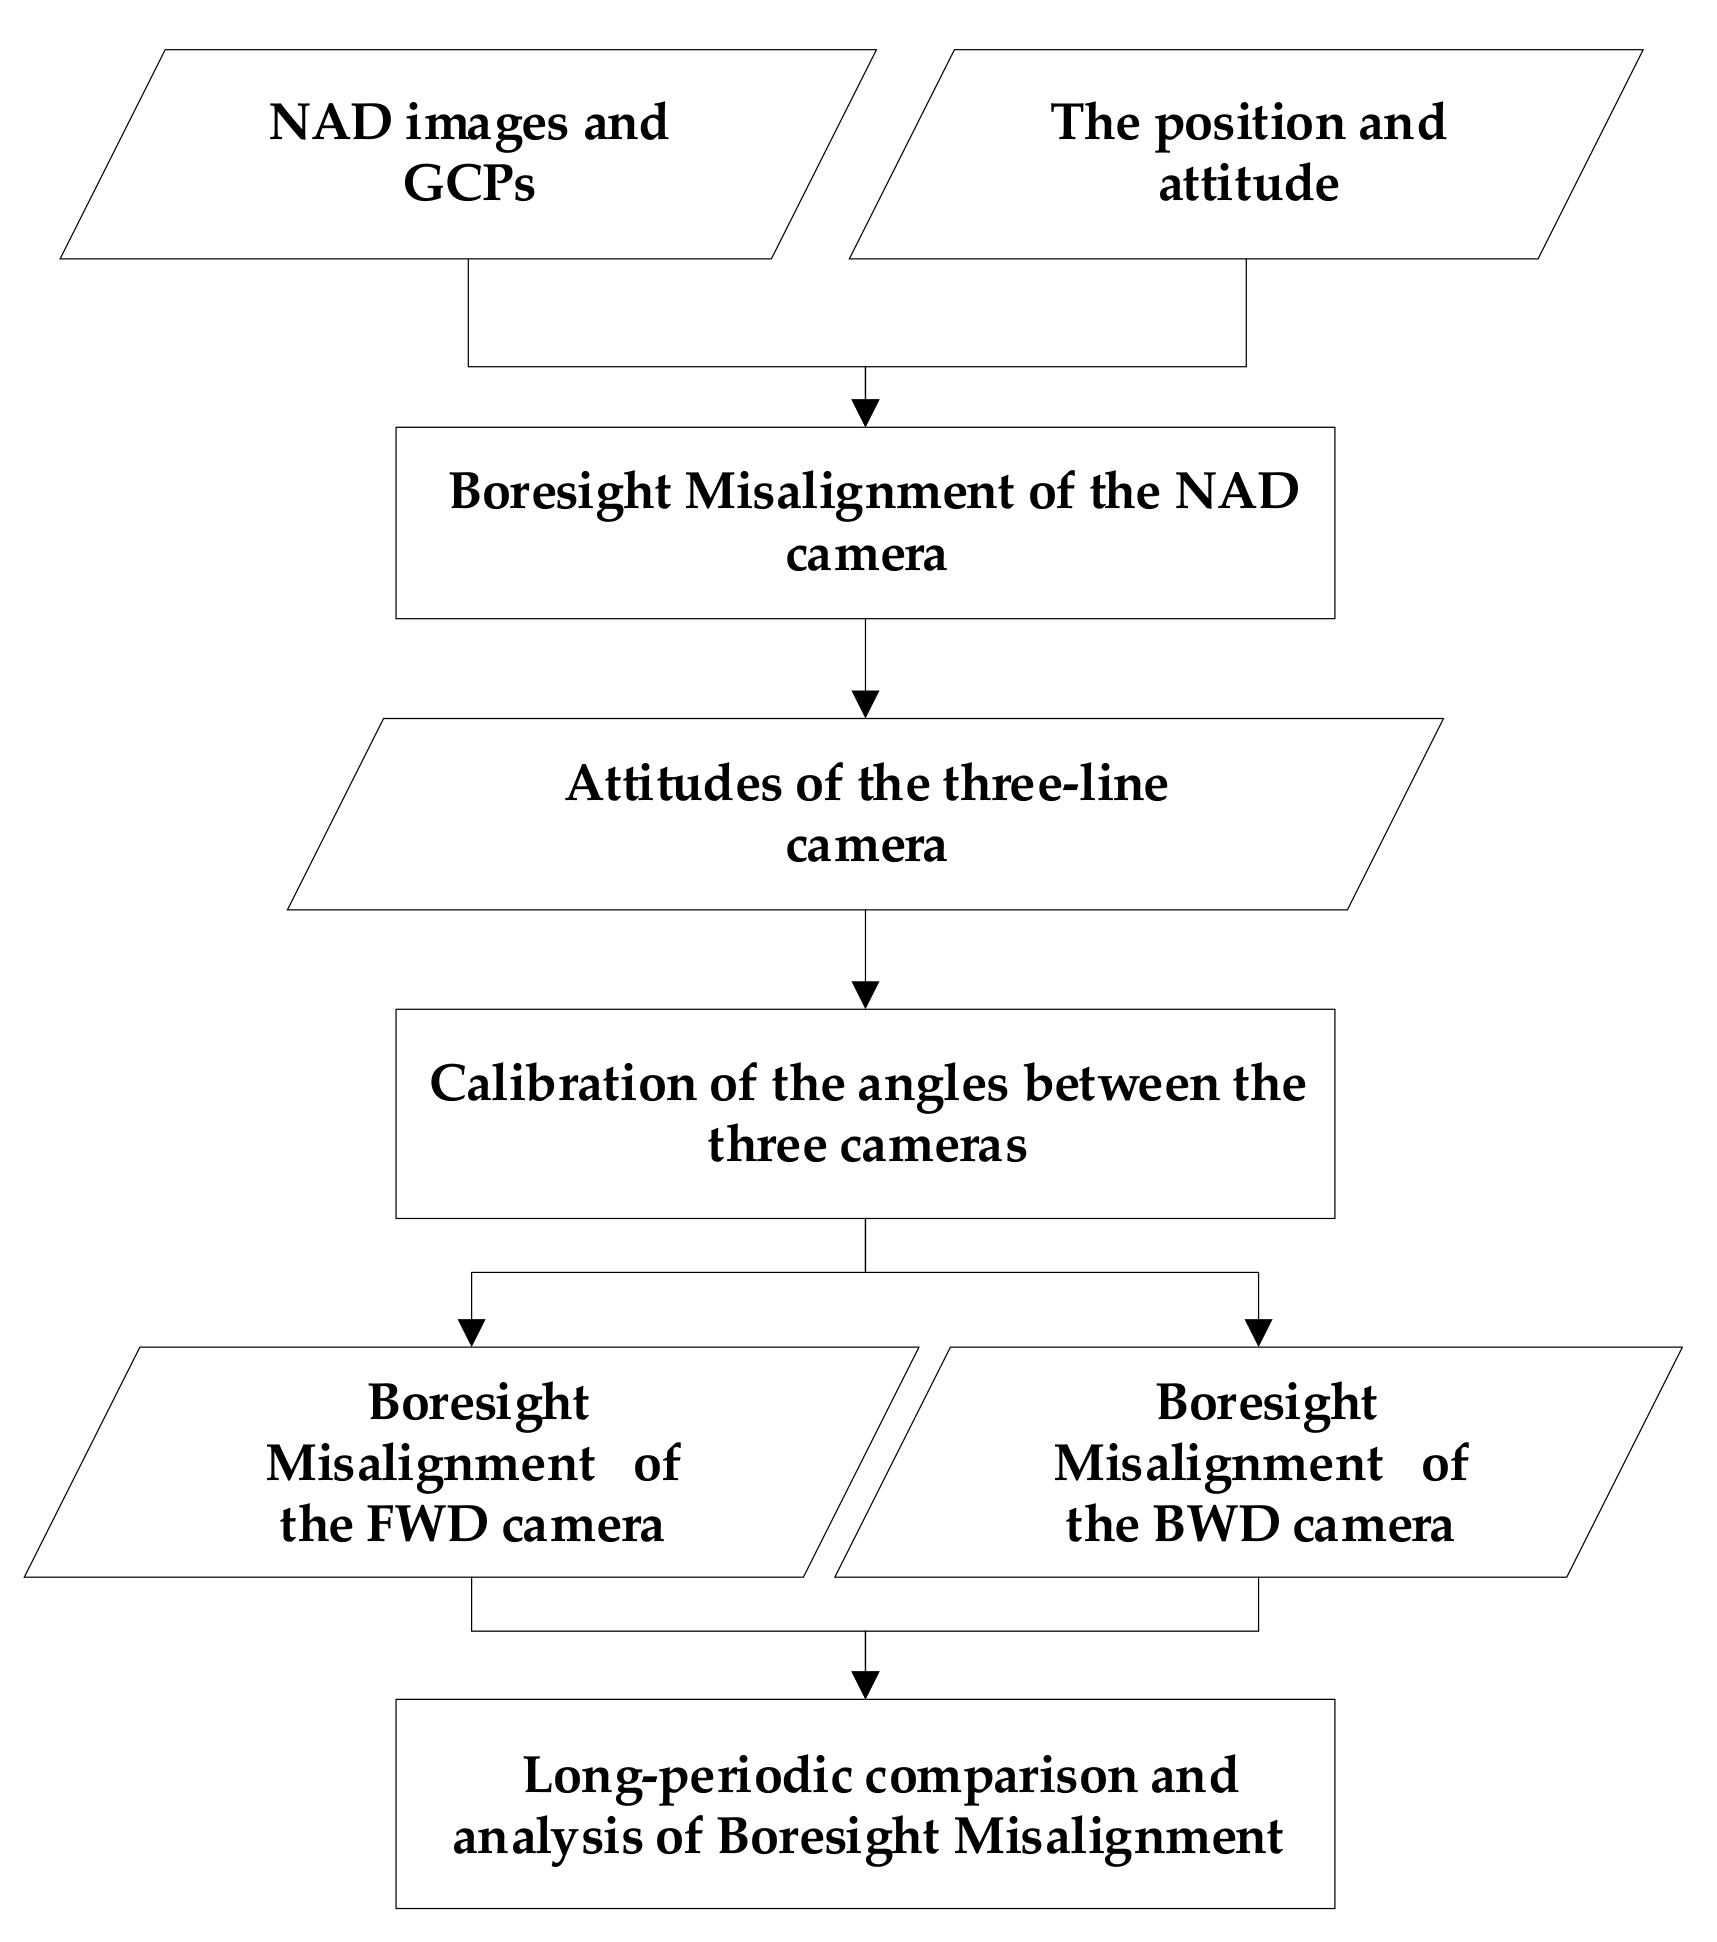
2.2. Geometric Calibration of the TLC Boresight Misalignment

According to Equation (1), the model errors mainly come from satellite positioning deviations, attitude errors and camera placement angle errors. Moreover, the influences on geometric accuracy from satellite position deviations and attitude error are basically the same because of the high correlation of model parameters, so the satellite position deviations can be equivalent to attitude errors [36]. Pitch, roll and yaw are used to describe the deviations between the corresponding axes of camera coordinates and satellite body coordinates. Then, the boresight calibration matrices in Equation (1) can be described as follows.
R N = R p i t c h R r o l l R y a w
This indicates that there are errors in both R n a v E C E F t N and R N in Formula (1) for the NAD camera model, and the same for FWD and BWD cameras. During the imaging, the real-time positions of the satellite are obtained by a GPS receiver, while the attitude parameters are determined by star trackers and a gyroscope. High-precision GCPs are used in the geometric calibration of ZY3-01TLC. However, the attitude errors of pitch ( δ φ t ), roll ( δ ω t ) and yaw ( δ κ t ) cannot be separated from the mounting angle error using this point-based calibration model. That means,
R ^ F = δ R t F R F R ^ N = δ R t N R N R ^ B = δ R t B R B
where R ^ F , R ^ N , R ^ B are the estimated matrices of the mounting angles for FWD, NAD and BWD cameras, respectively. δ R t F , δ R t N and δ R t B are the corresponding matrices of attitude error corrections.
Attitude errors should be eliminated before calibrating the TLC boresight misalignment. For short-time imaging, linear models as follows are used to estimate the attitude errors of the pitch, roll and yaw angles at the imaging time t.
δ φ t = φ 0 + φ 1 t δ ω t = ω 0 + ω 1 t δ κ t = κ 0 + κ 1 t
where φ 0 ,   ω 0 ,   κ 0 represent the offsets and φ 1 ,   ω 1 ,   κ 1 represent the drifts of three angles varying over time. Considering the integrated structure of three cameras, the attitude errors can eliminate the attitude errors, and can also counteract the boresight misalignment of the NAD camera for FWD and BWD images acquired at the same imaging time t. In other words, the relative misalignment between cameras can be estimated. Here, a nadir camera is used as the benchmark for its nadir looking angle and its higher resolution compared with the FWD and BWD cameras. Even the attitude errors of pitch, roll and yaw cannot be separated from the mounting angle errors for each independent camera; it can be inferred that the errors estimated from GCPs are mainly caused by the boresight misalignment between the FWD and NAD cameras, or the BWD and NAD cameras. On this basis, Equation (1) can be rewritten as follows.
X F g Y F g Z F g E C E F = X S t Y S t Z S t E C E F + m F R n a v E C E F t δ R N F R F t a n ψ F y c F t a n ψ F x c F 1
X B g Y B g Z B g E C E F = X S t Y S t Z S t E C E F + m B R n a v E C E F t δ R N B R B t a n ψ B y c B t a n ψ B x c B 1
where δ R N F is the error matrix of the boresight misalignment between the FWD camera and the NAD camera, and δ R N B is that between the NAD camera and BWD camera, respectively.
According to Formula (2), the three mounting angles of boresight misalignment can be derived from the following equations.
δ R N F = δ R φ N F δ R ω N F δ R κ N F = c o s δ φ N F 0 s i n δ φ N F 0 1 0 s i n δ φ N F 0 c o s δ φ N F 1 0 0 0 c o s δ ω N F s i n δ ω N F 0 s i n δ ω N F c o s δ ω N F c o s δ κ N F s i n δ κ N F 0 s i n δ κ N F c o s δ κ N F 0 0 0 1
δ R N B = δ R φ N B δ R ω N B δ R κ N B = c o s δ φ N B 0 s i n δ φ N B 0 1 0 s i n δ φ N B 0 c o s δ φ N B 1 0 0 0 c o s δ ω N B s i n δ ω N B 0 s i n δ ω N B c o s δ ω N B c o s δ κ N B s i n δ κ N B 0 s i n δ κ N B c o s δ κ N B 0 0 0 1
where δ φ N F , δ ω N F and δ κ N F are the correction values of the angles between the FWD camera and NAD the camera, and δ φ N B , δ ω N B and δ κ N B are those of the angles between the BWD camera and the NAD camera. Since the angles are very small, Equation (7) and Equation (8) can be simplified as follows.
δ R N F = 1 δ κ N F δ φ N F δ κ N F 1 δ ω N F δ φ N F δ ω N F 1
δ R N B = 1 δ κ N B δ φ N B δ κ N B 1 δ ω N B δ φ N B δ ω N B 1
Taking X = [ δ φ N F , δ ω N F , δ κ N F ] T and X = δ φ N B , δ ω N B , δ κ N B T as unknowns, Equations (9) and (10) are substituted into Equations (5) and (6), respectively. Then, using GCPs in each camera coverage, the error equations can be established as follows.
V = A X L
where V is the correction to the observation’s errors, A is the coefficient matrix according to Equations (5) and (6) and L is the matrix of the point observations. These values are solved by the least squares method.
GCPs are extracted by the SIFT algorithm [39], which maintains invariance to rotation, scale scaling and brightness changes to a certain extent. The image and the Gaussian function are convolved to build scale space of the image with different Gaussians.
L x , y , σ = G x , y , σ * I x , y
where L x , y , σ represents the image scale space, G x , y , σ is the Gaussian kernel function at scale σ and I x , y represents the original scale pixels. Key points can be determined by extreme value detection of the extracted feature points on different Gaussian scales; then, the feature descriptor with 128 dimensions can be generated. The key points are determined as follows.
m x , y = L x + 1 , y L x 1 , y 2 + L x , y + 1 L x , y 1 2 θ x , y = t a n 1 L x , y + 1 L x , y 1 / L x + 1 , y L x 1 , y
where m x , y and θ x , y are the amplitude and phase of gradient at the position   x , y ,   and   L x , y is the pixel value at a corresponding scale.

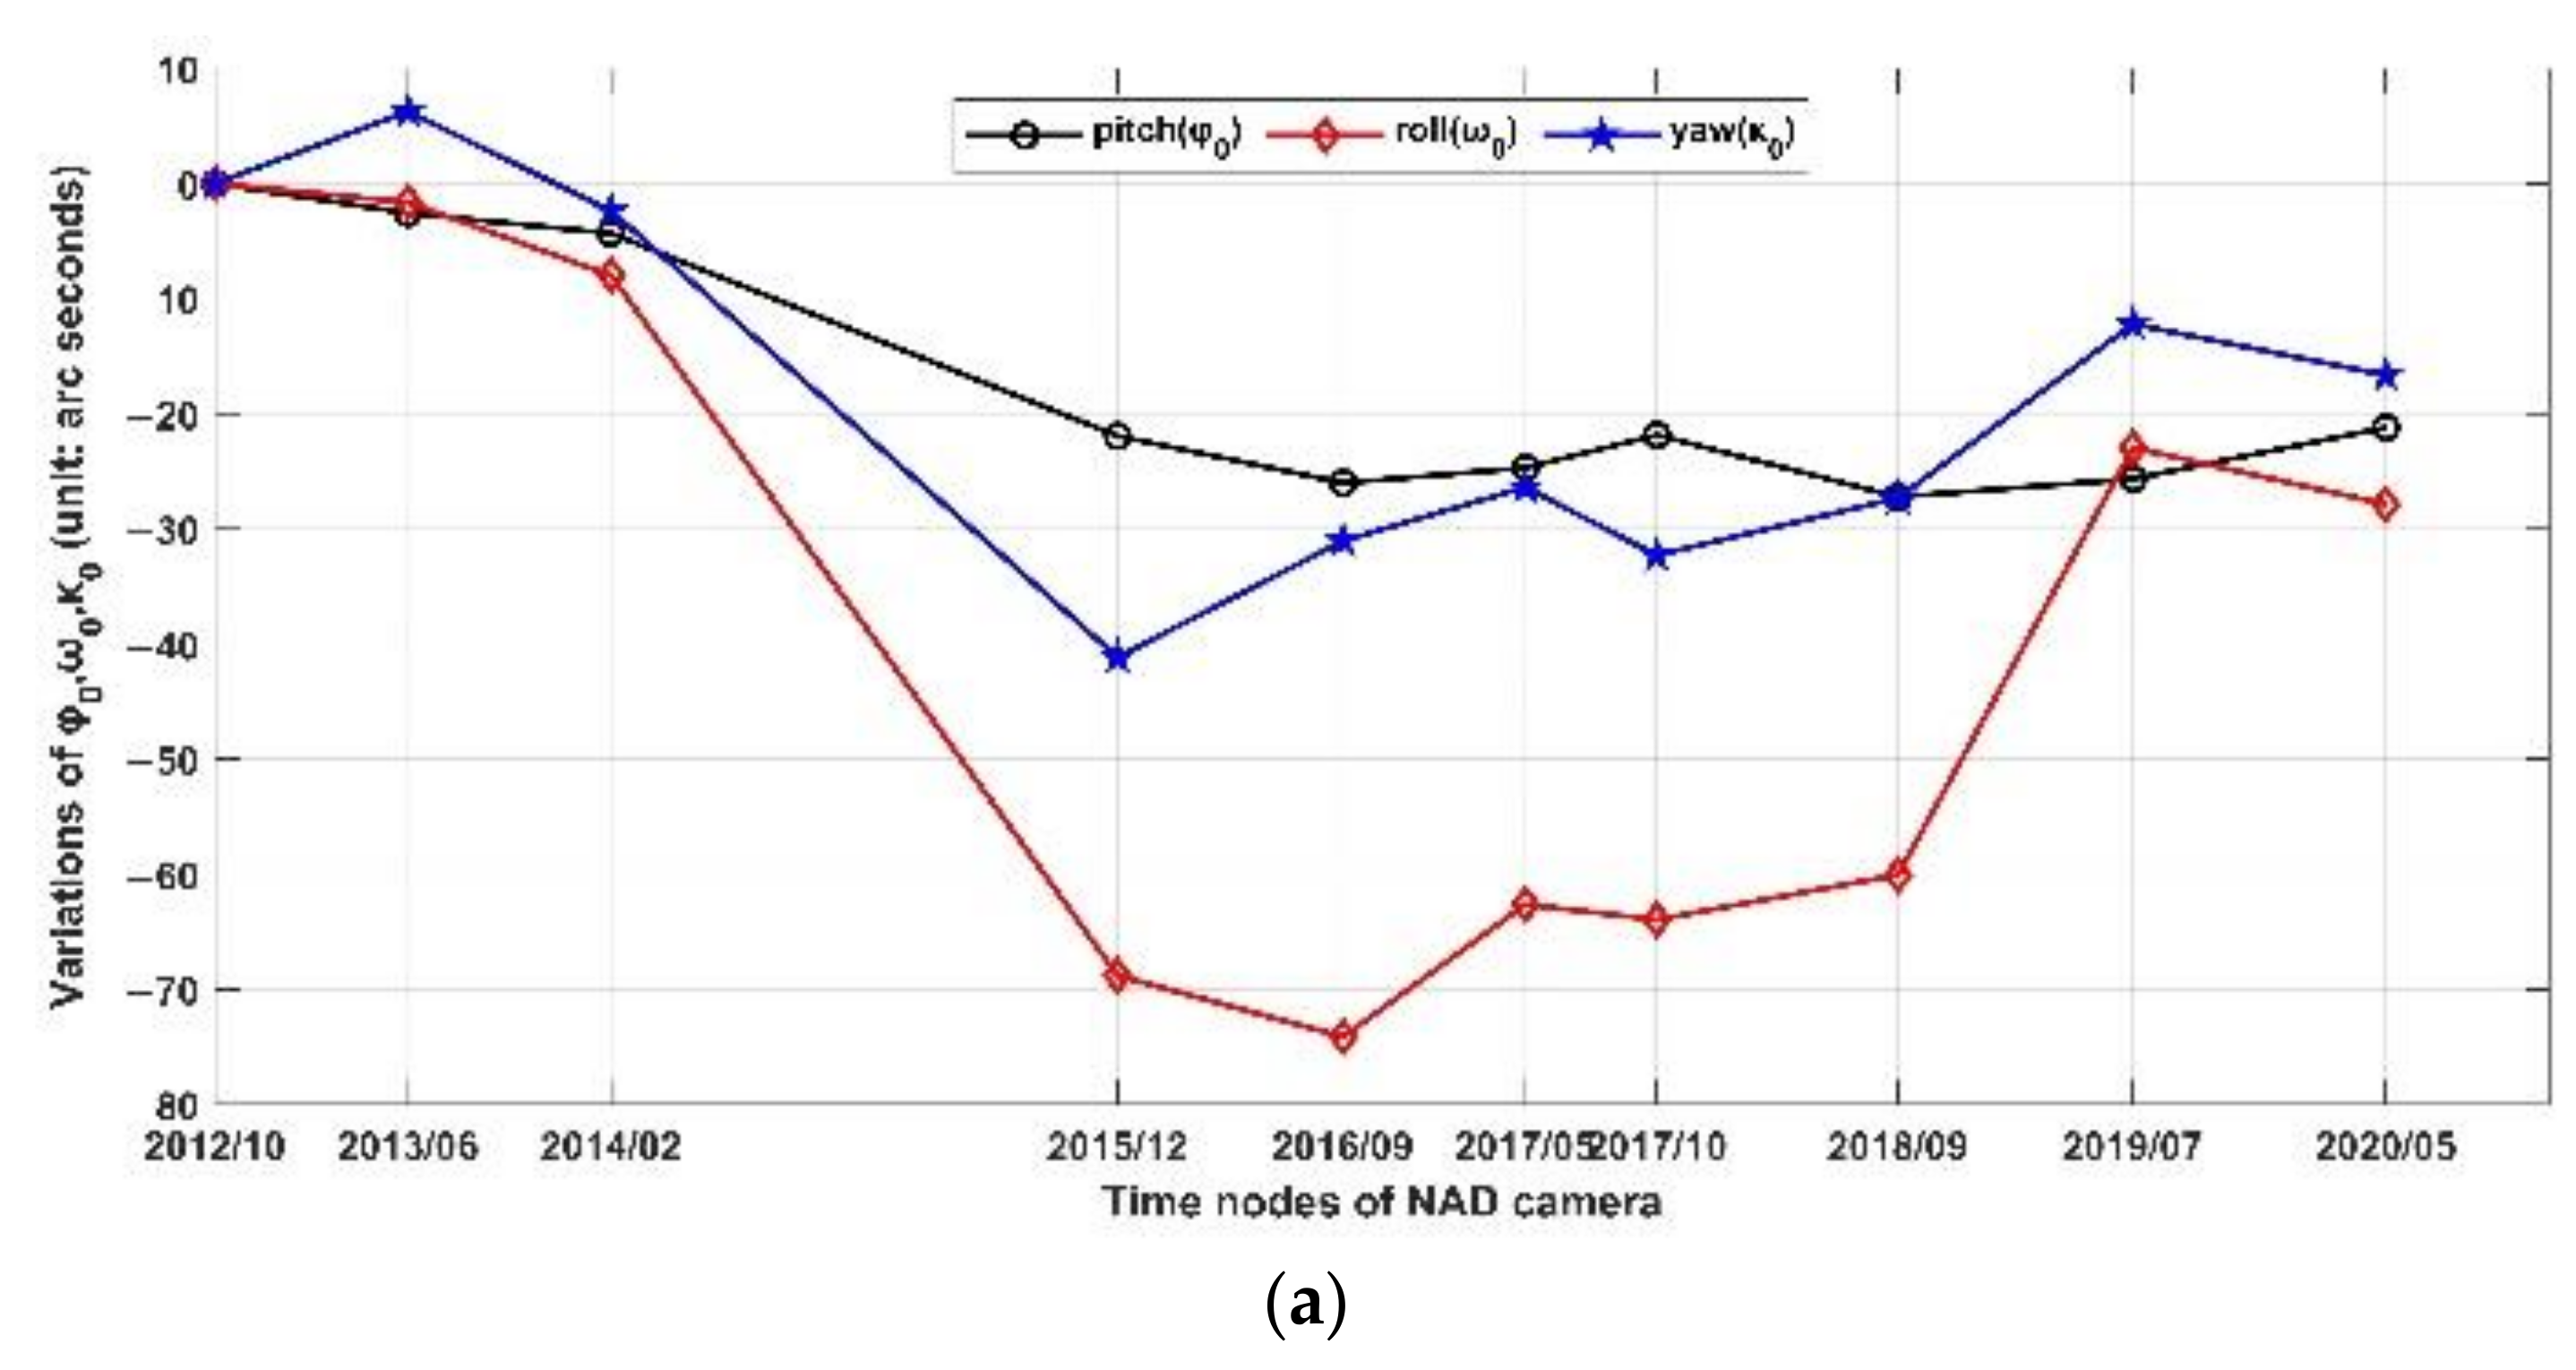
2.3. Long-Periodic Analysis of Boresight Misalignment

Time series of related parameters, including   φ 0 ,   ω 0 ,   κ 0 , φ 1 ,   ω 1 ,   κ 1 and the values of RMSEs of sample and line directions in the image space, are built to analyze and evaluate the changes in boresight misalignments during the ten years of operation of the ZY3-01 satellite. The values of average, variance and cross-covariance of time series are mainly used to describe the variation characteristics of boresight misalignments, and thus reflect the stability of cameras in the long-time operation. Assuming that the time series of one boresight misalignment parameter Z t   is { Z t 1 , Z t 2 ,   ... ,   Z t n } , t 1 , t 2 ,   ,   t n represent n observation time nodes. Then, the average μ t , variance σ 2   and cross-covariance γ of Z t are as follows.
μ t = E Z t ,   t = t 1 , t 2 ,   ,   t n σ 2 = Z t μ t 2 n γ = C o v ( Z t , Z s ) = E Z t μ t ( Z s μ s ] ,   t ,   s = t 1 , t 2 ,   ,   t n
It should be noted that the boresight analysis in this study is based on the geometric calibrations of the ZY3-01 satellite (see the method in references [13,15]). The iterative method is used to solve the interior orientations. Such errors are not the focus of this study and are not covered here. The approach of boresight misalignment calibration for ZY3-01 TLC is shown in Figure 2. First, the attitude errors of the NAD camera are calculated by Equation (4) using the GCPs, EOPs and IOPs calibrated in the laboratory before the satellite’s launch. The attitude errors of pitch, roll and yaw angles represent the misalignment of the NAD camera in the body coordinate. Second, the FWD and BWD images at the same imaging time with the NAD camera are selected. GCPs in the FWD and BWD coverage are used to estimate the errors in FWD and BWD cameras. Then, boresight misalignment between the FWD and NAD cameras, and between the BWD and NAD cameras are calculated based on Equations (5)–(11). After the least squares adjustment, the misalignment of the FWD and BWD cameras can be accurately restored relative to the NAD camera. At last, time series of related parameters for boresight misalignments are analyzed and evaluated using Equation (14).

3. Results

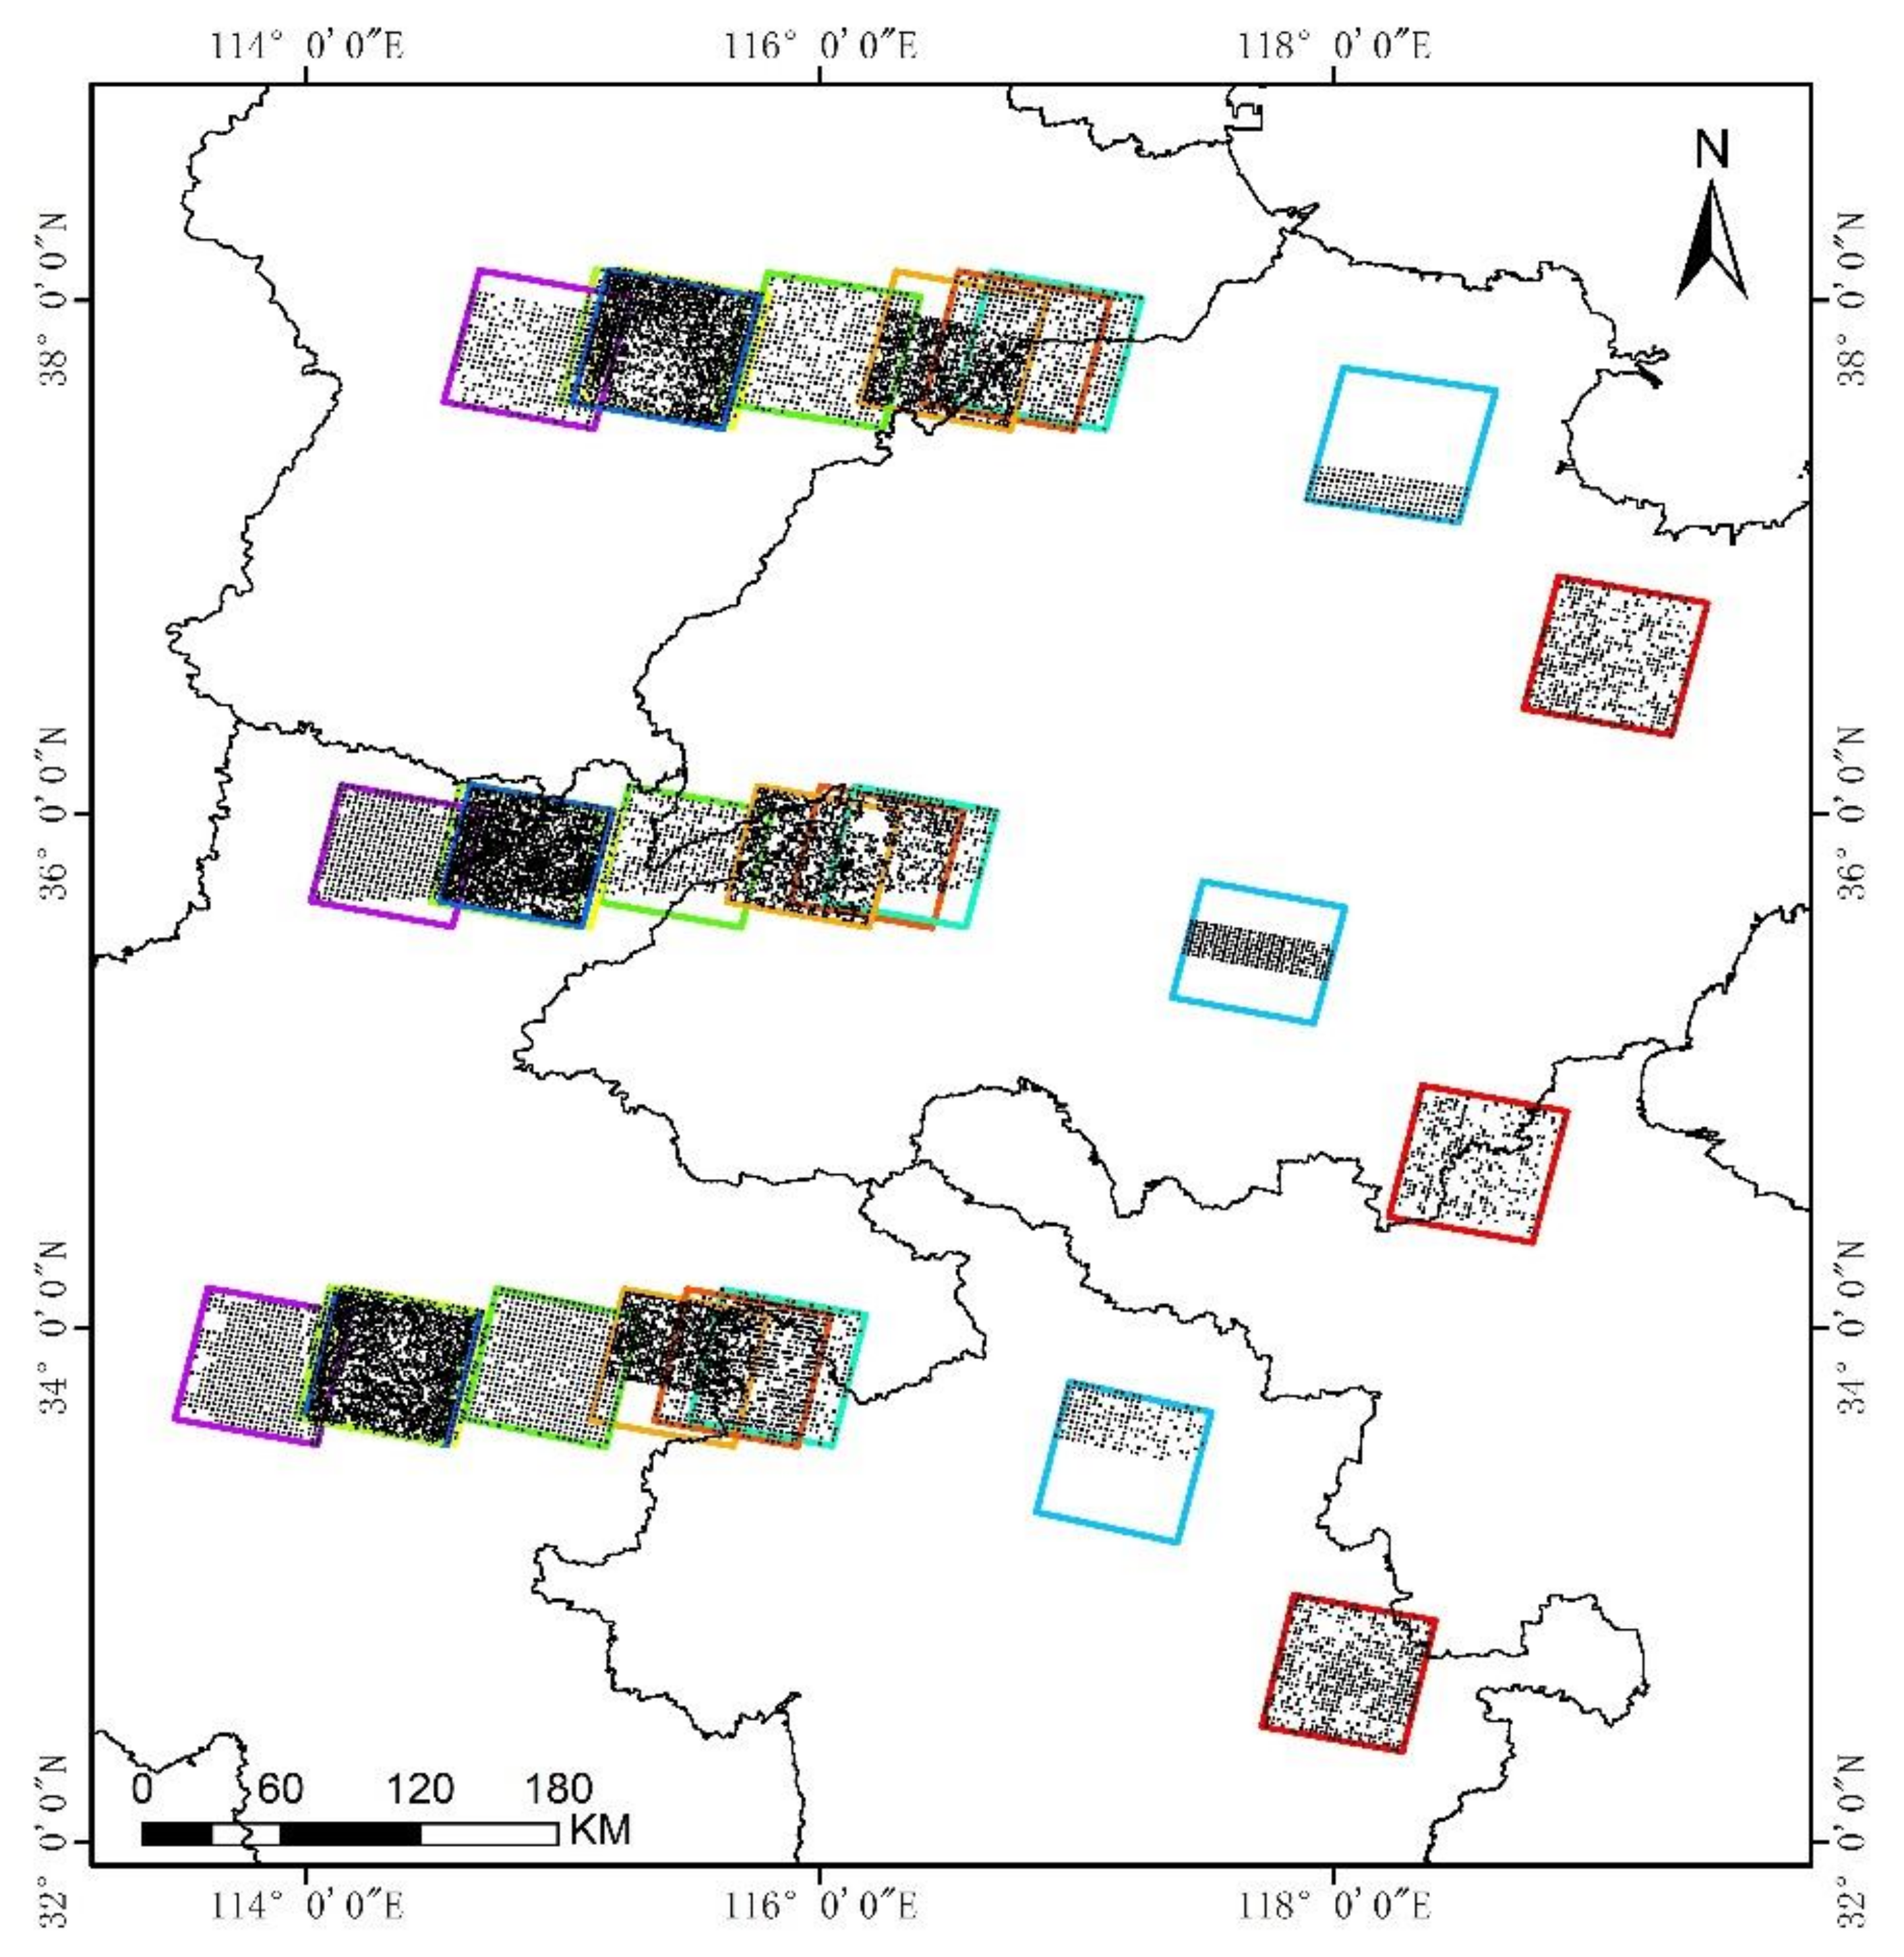
3.1. Experimental Datasets

In this study, 10 ZY3-01 datasets acquired from 2012 to 2020 were selected to verify the changes and calibrations of TLC boresight misalignment, as listed in Table 1. Each dataset has FWD, NAD and BWD images, which were imaged simultaneously by the three cameras. The time spans of each dataset are about 5 s. As shown in Figure 3, the spatial coverage of these images is in the range of 113.5°–119.5° E and 32.5°–38.5° N, where the terrain is relatively flat with the elevation varying from 10 m to 450 m above sea level. The DEM and Digital Orthophoto Map (DOM) generated from ZY3-01 stereo images were used as the reference data. The GSD of the DOMs and DEMs are 2 m and 15 m, respectively. The planimetric accuracy of the DOMs is about 2 m, while the vertical accuracy of the DEMs is about 3 m. Here, the DOM is taken as the base image, and 13,581 SIFT points are extracted to be the virtual GCPs. After that, the object–space coordinates of these GCPs were measured manually from the reference DOMs and DEMs. First, the object–space coordinates of these points are measured from the reference DOMs and DEMs. Then, the image–space coordinates of these points are measured in the corresponding TLC image. According to the procedure of attitude error estimation, the boresight misalignment of the NAD camera is first performed, the results of which would be the reference to analyze the changes in the mounting angles between the navigation coordinate and the NAD camera coordinate. Then, the simultaneous FWD and BWD cameras are evaluated with GCPs in the corresponding FWD and BWD coverage. After that, the boresight misalignments of FWD and BWD cameras relative to the NAD camera would be estimated and compensated by the mounting angle parameters.

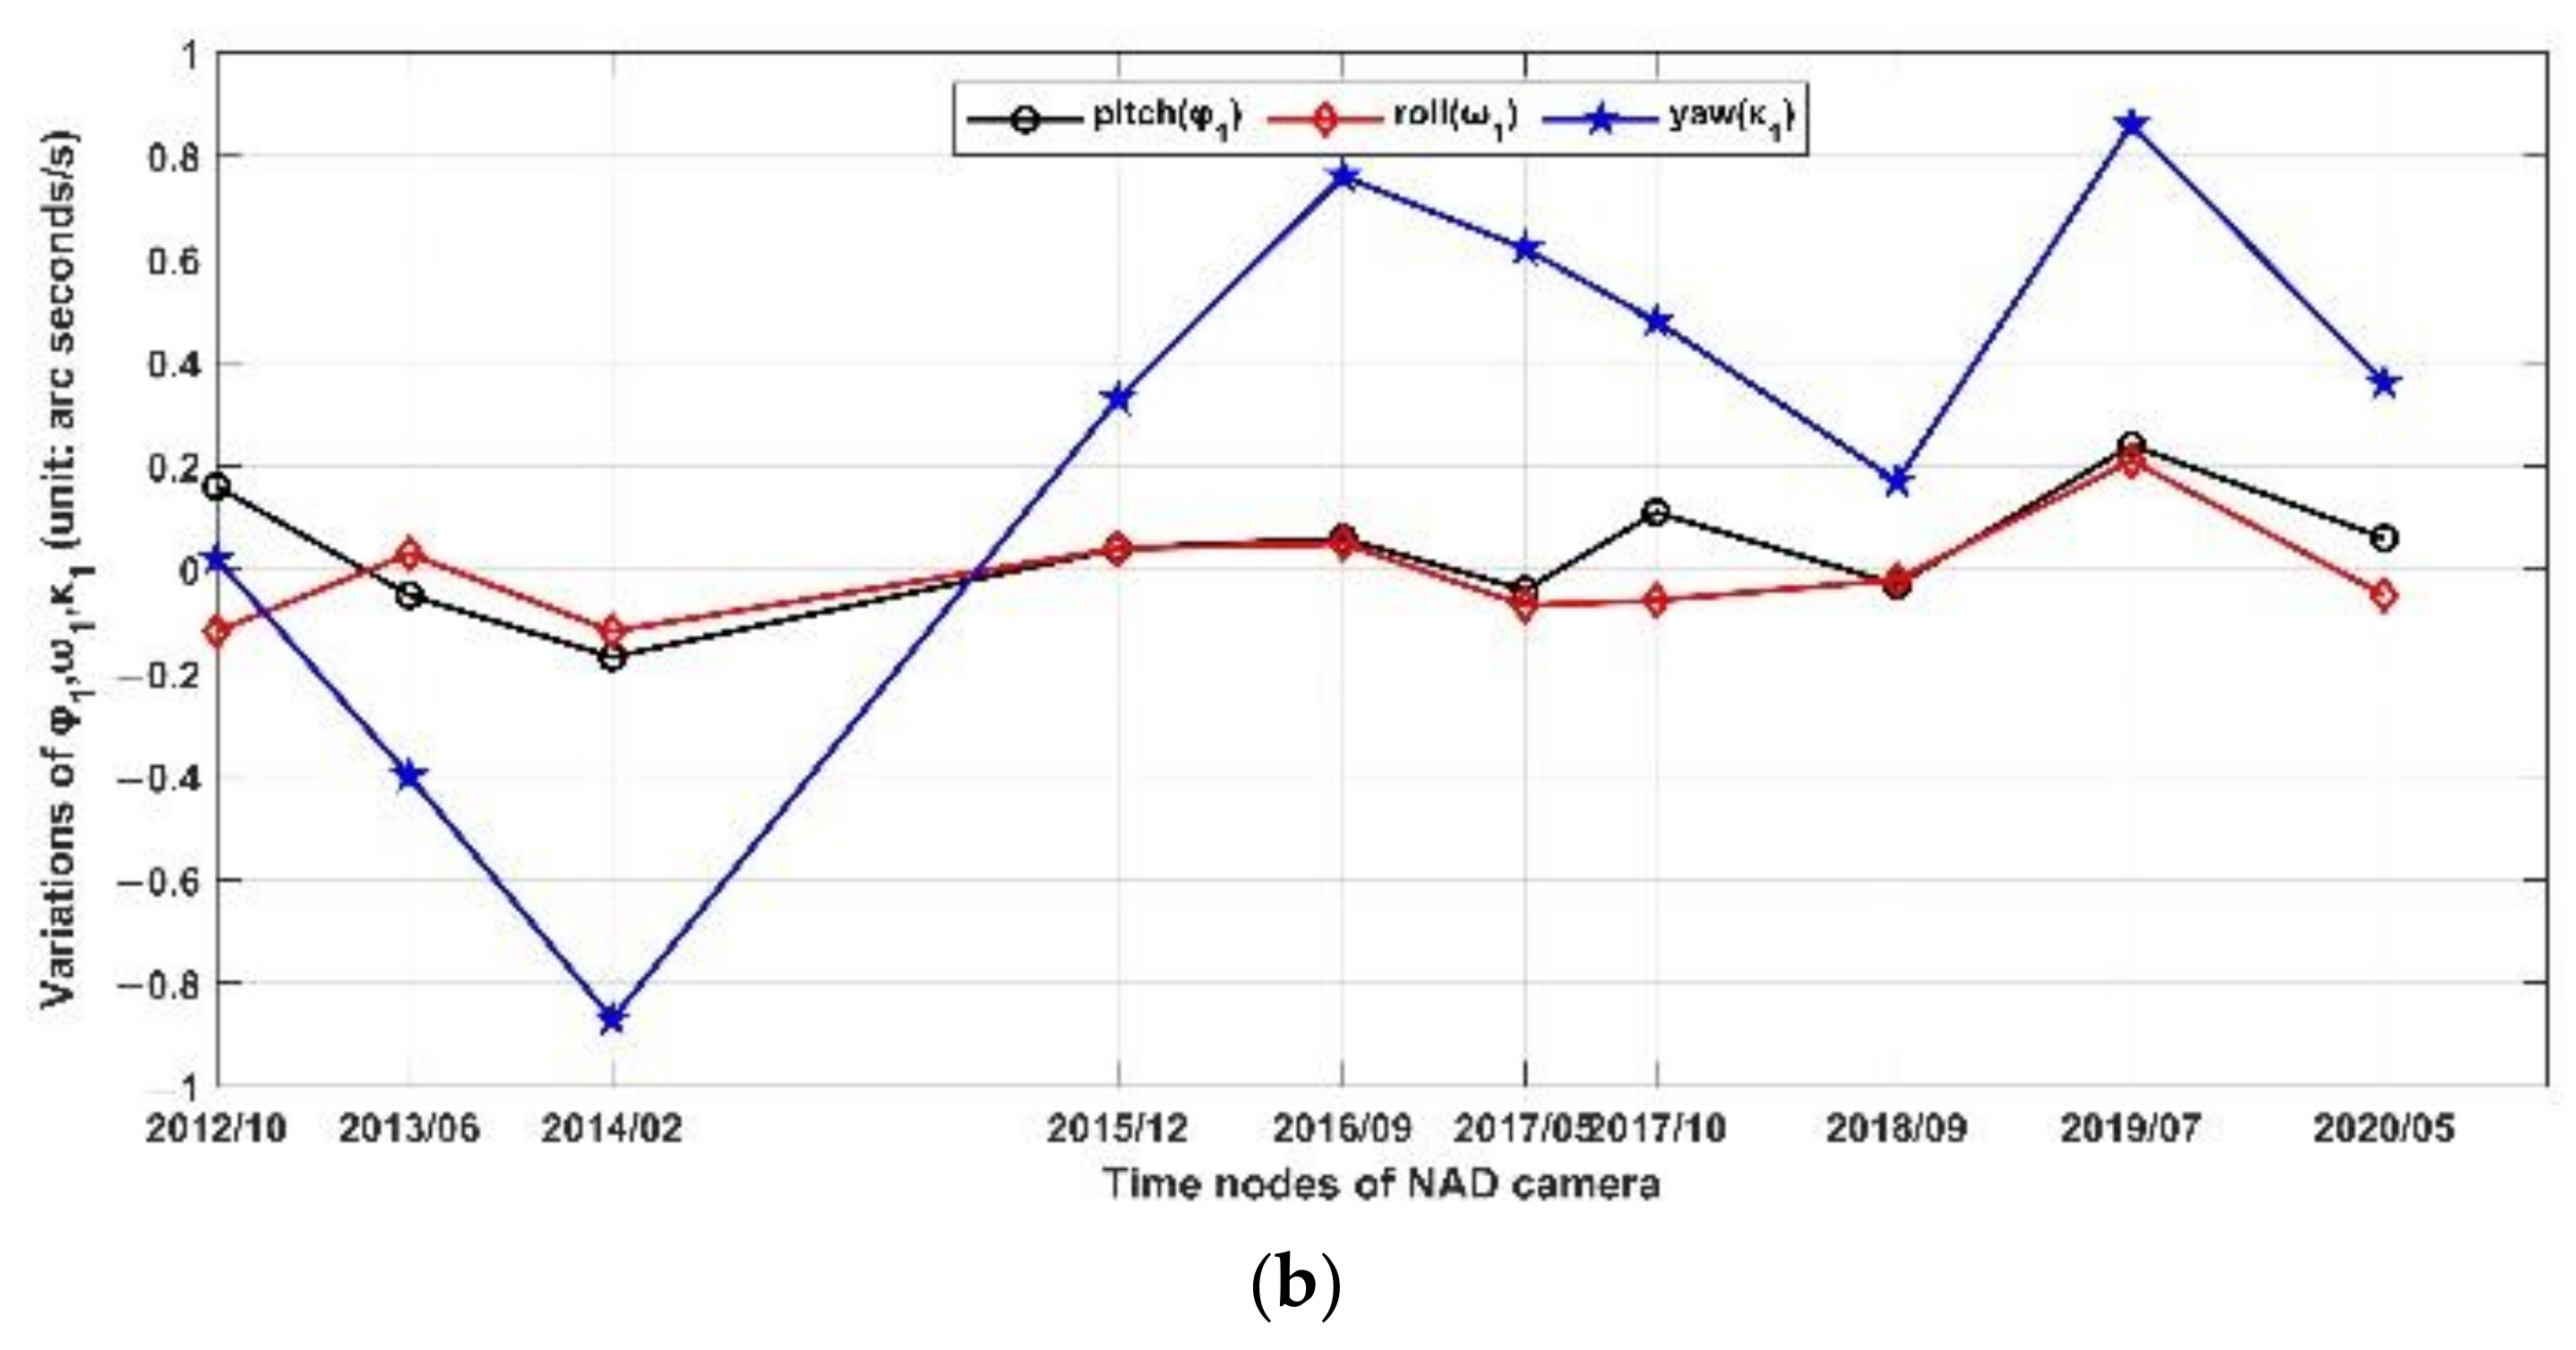
3.2. Calibration of NAD Camera

It is more rigorous to separately calculate the boresight changes of each camera in a unified reference. Considering the complexity of calculation led by the coupling relationship between attitude errors and boresight changes, the NAD camera is selected as the benchmark for a more robust solution. It should be pointed out that the IOPs of all datasets are normalized to exclude their influence, and the mounting angle calibrated in October 2012 is taken as the initial matrix. Table 2 shows the detailed results of φ 0 , ω 0 , κ 0 , φ 1 , ω 1   and κ 1   of the NAD camera in Equation (4) calculated using the GCPs. Figure 3 shows the curves of φ 0 , ω 0 and κ 0 angles changing over time. It can be seen from Table 2 and Figure 4 that the mounting angles of the NAD camera change significantly over time. The angles of roll and yaw vary more dramatically than pitch angle, and the maximum change of the roll angle reaches 74.13 arc seconds. The most significant changes appeared during the period from 2014 to 2015, where all three angles showed great fluctuation because the restart of the satellite temperature control system led by a solar panel fault on one side of the satellite occurred in October 2015.
In addition, the average angular velocity of the yaw angle is 0.23 arc seconds/s, which is much larger than that of the pitch and the roll angles, while the averages of the latter two are 0.04 arc seconds/s and −0.01 arc seconds/s, respectively. The maximum angular velocity of the yaw angle reaches 0.87 arc seconds/s, which is also larger than that of pitch and roll angles. This means the yaw angle of the ZY3-01 satellite has more uncertainties than the other two angles. Figure 5 shows the cross-covariances of time series among φ 0 , ω 0 and κ 0 angles. All the peaks occur at lag 0, which means that φ 0 , ω 0 and κ 0 angles have the greatest correlation with themselves. However, the curves with similar oscillation are not close to 0, which also indicates that there are cross-correlations between the three time series.
With the boresight misalignment of the NAD camera above, the mean orientation errors of all three cameras in image space are calculated using ground check points. Table 3 shows the accuracies of the Sample and Line directions in the image space of the TLC. From the results, the orientation accuracy of the NAD camera is 0.6 pixels in the Sample direction and 0.39 pixels in the Line direction, which reached the sub-pixel level after compensation with the boresight misalignment in Table 2. However, the averages of Sample and Line of the FWD camera are 1.27 pixels and 2.11 pixels, respectively, and 1.90 pixels and 3.39 pixels for the BWD camera. Both the FWD and BWD cameras have significant orientation deviations in the along-track and cross-track directions, and those of the BWD camera are especially obvious. This also indicates that the angles between the three cameras are not fixed.

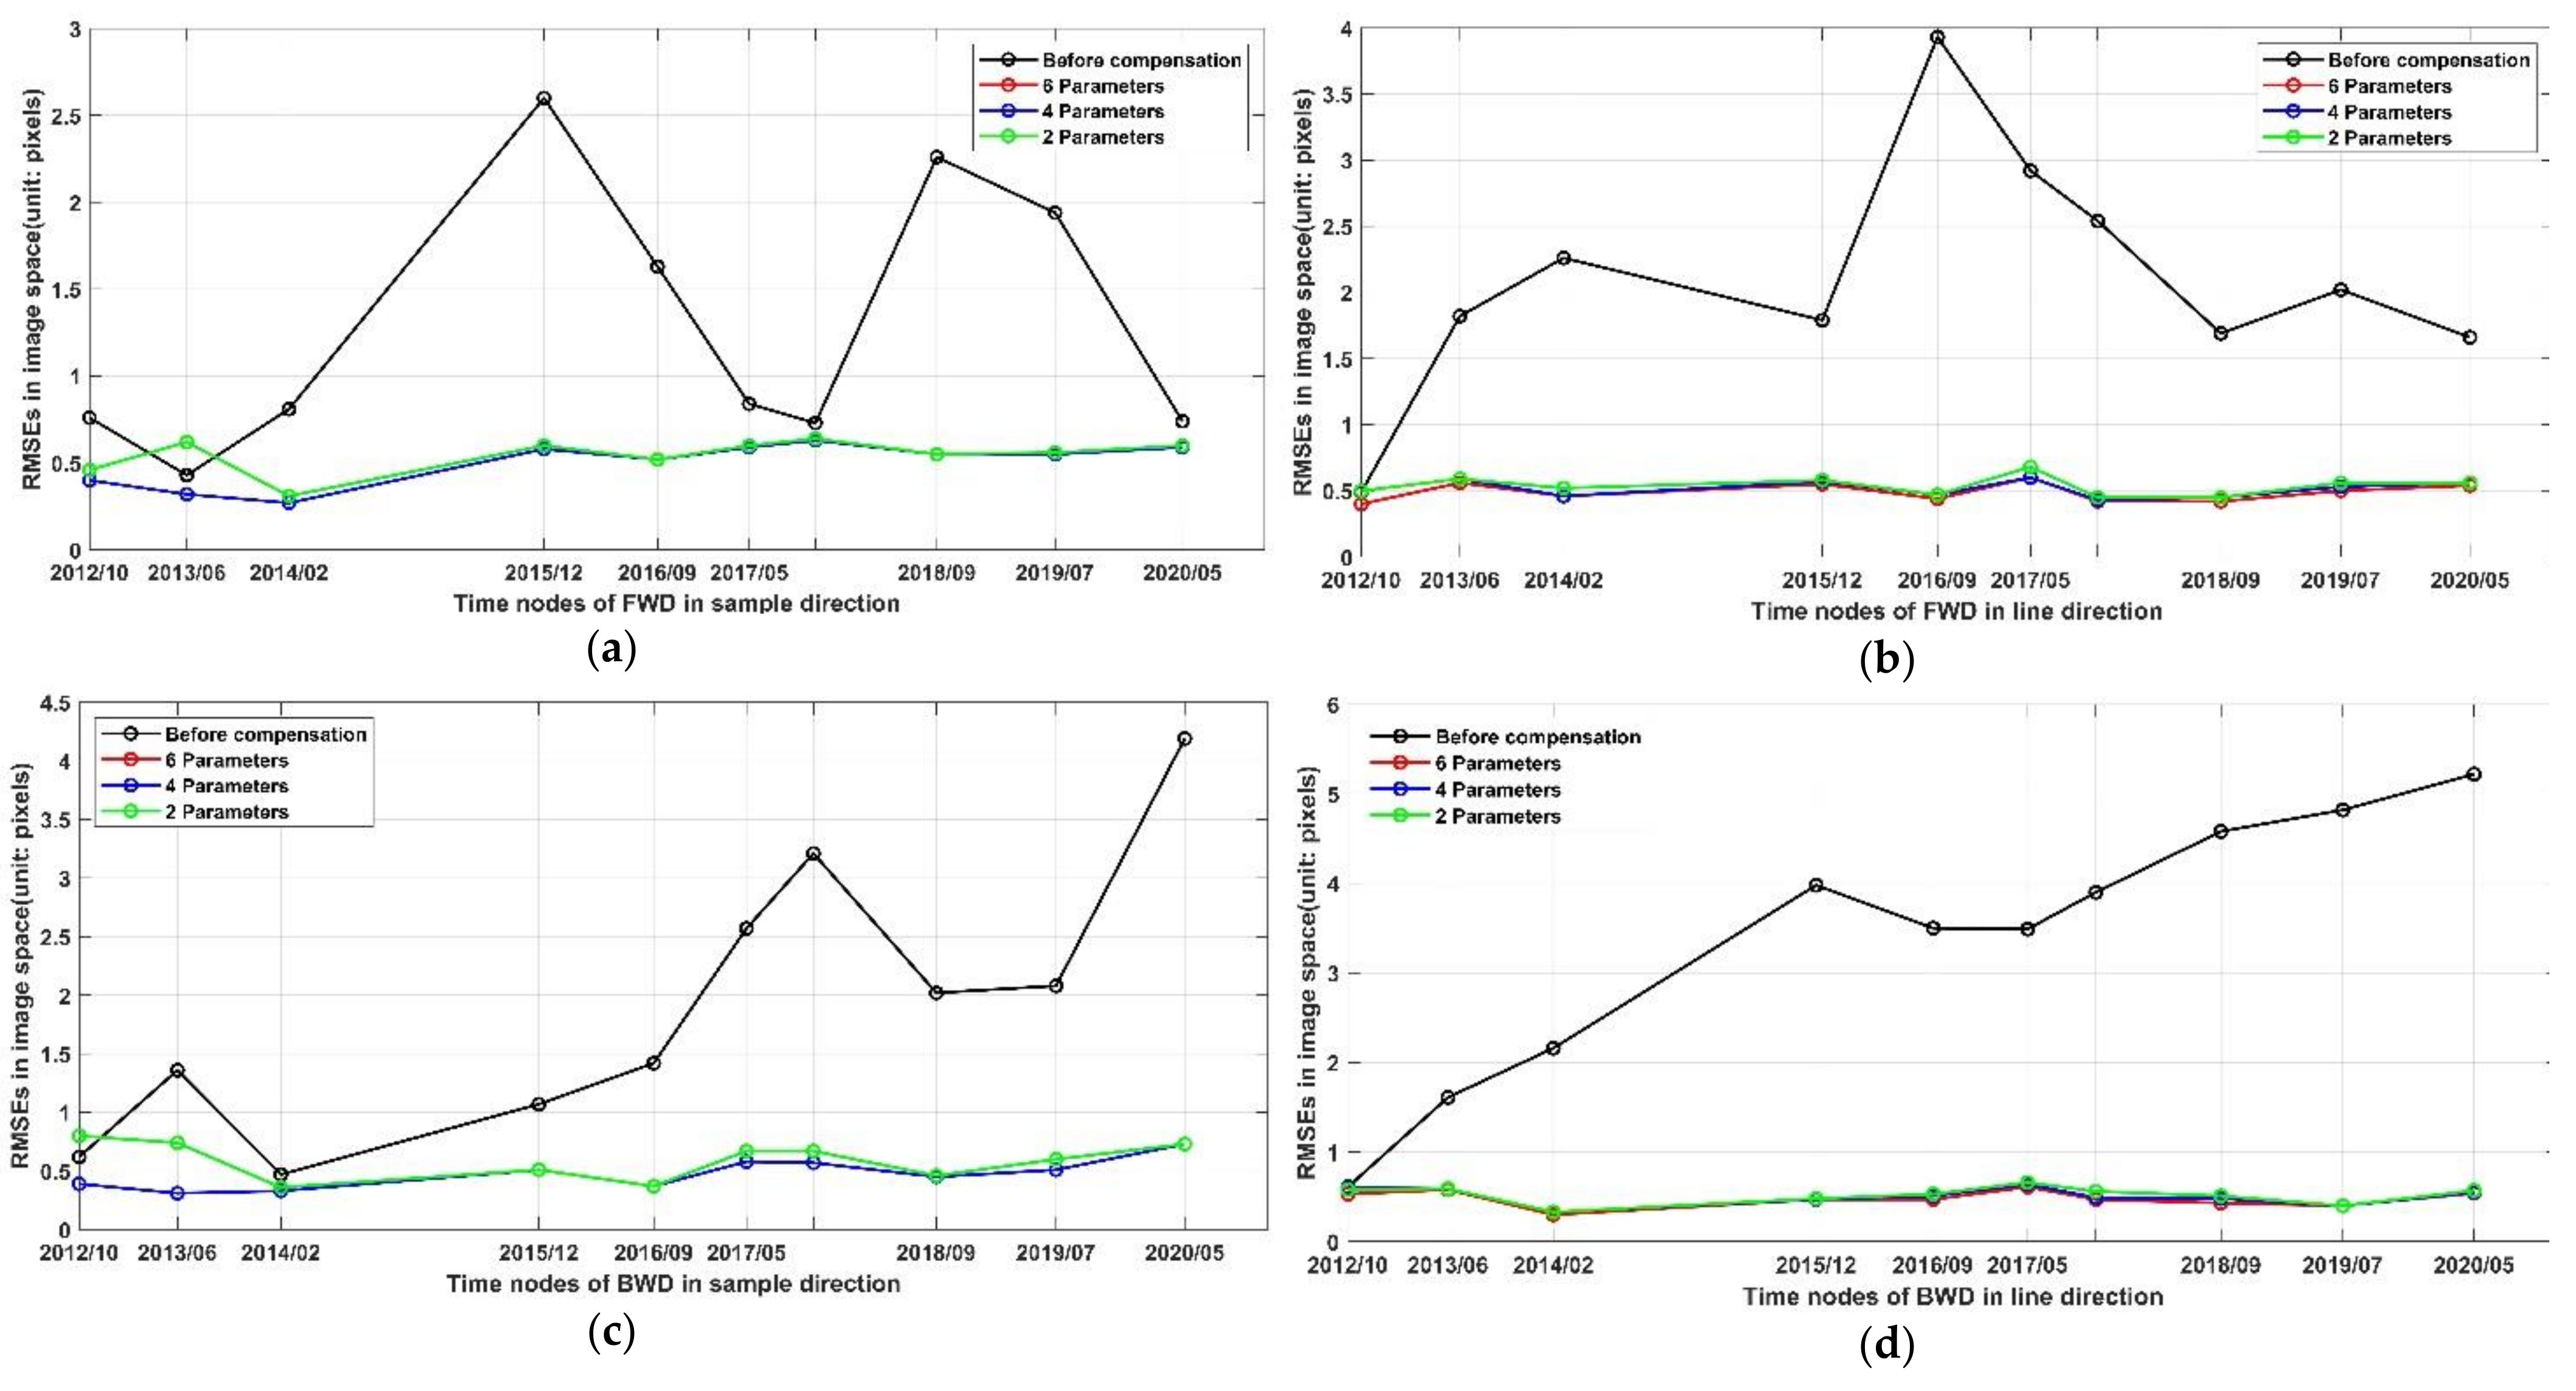
3.3. Boresight Misalignment Calibration and Characteristics of FWD and BWD Cameras

Taking the estimated mounting angle matrix of the NAD camera as the reference, the boresight misalignments of the FWD and BWD cameras are further calibrated. Since the misalignment between the navigation coordinates and the camera coordinates is time-dependent, the offsets and drifts of three angles for the FWD and BWD cameras are estimated and calibrated consistent with the NAD camera using Equation (4). It is represented by six specific parameters, which are δ φ N F 0 ,   δ φ N F 1 ,   δ ω N F 0 ,   δ ω N F 1 ,   δ κ N F 0 ,   δ κ N F 1 for the FWD camera, and ( δ φ N B 0 ,   δ φ N B 1 ,   δ ω N B 0 ,   δ ω N B 1 ,   δ κ N B 0 , δ κ N B 1 ) for the BWD camera. Considering that the angles between the three cameras are relatively stable and the yaw angle of the ZY3-01 satellite has more uncertainty than the other two angles, a model with four parameters, ( δ φ N F 0 , δ φ N F 1 , δ ω N F 0 , δ ω N F 1 ) and ( δ φ N B 0 , δ φ N B 1 , δ ω N B 0 , δ ω N B 1 ), would be selected to estimate the misalignments and accuracy in image space. Then, ignoring the time variation parameters, a model with only two parameters, δ φ N F 0 , δ ω N F 0 and δ φ N B 0 , δ ω N B 0 , are set to estimate the misalignment and accuracy in image space.
Table 4 and Table 5 list the statistical accuracies in image space before and after the compensation of misalignment for FWD and BWD cameras, respectively. The root mean square errors (RMSEs) in the image space of both FWD and BWD cameras are significantly reduced, reaching the sub-pixel level. The accuracy of the BWD camera is improved more obviously for the average RMSEs in the Sample and Line directions, which are less than 0.5 pixels with six parameters, while the average RMSEs were 1.90 and 3.39 pixels, respectively, before the compensation. After the compensation, the accuracies of the FWD and BWD cameras are almost the same.
Figure 6 displays the variations in RMSEs in the image Sample and Line directions before and after compensation for the FWD and BWD cameras. It can be seen that the accuracies using four parameters are similar to those using six parameters, especially in the Sample direction for both FWD and BWD cameras. The RMSEs in the image space of the FWD camera using two time-independent parameters are slightly larger than those using four or six parameters. This also indicates that the misalignment of the TLC is also associated with time parameters, but the effect is not significant. According to the estimations of FWD and BWD cameras using two parameters, the boresight misalignments of FWD and BWD cameras are calculated using the method described in Section 2.2. Figure 7 and Figure 8 show the angle changes and normalized autocovariance sequences of FWD and BWD cameras with the NAD camera as the benchmark. The misalignments of both FWD and BWD cameras are within 7 arc seconds, which indicates that the structure of the TLC is relatively stable. Moreover, the misalignment of the BWD camera is larger than that of the FWD camera. Pitch and roll angles between the BWD camera and the NAD camera present some gradual accumulation over time, while the angles between the FWD camera and the NAD camera change randomly. From Figure 8, the randomness of the pitch angles between the FWD and NAD cameras is more obvious than others, while the roll angles between the FWD and NAD cameras show some correlation over time. Since the curves decline on both sides in Figure 8c,d, the autocovariance sequences of pitch and roll angles between the BWD and NAD cameras are similar, which is consistent with the gradual accumulation in Figure 7.

4. Discussion

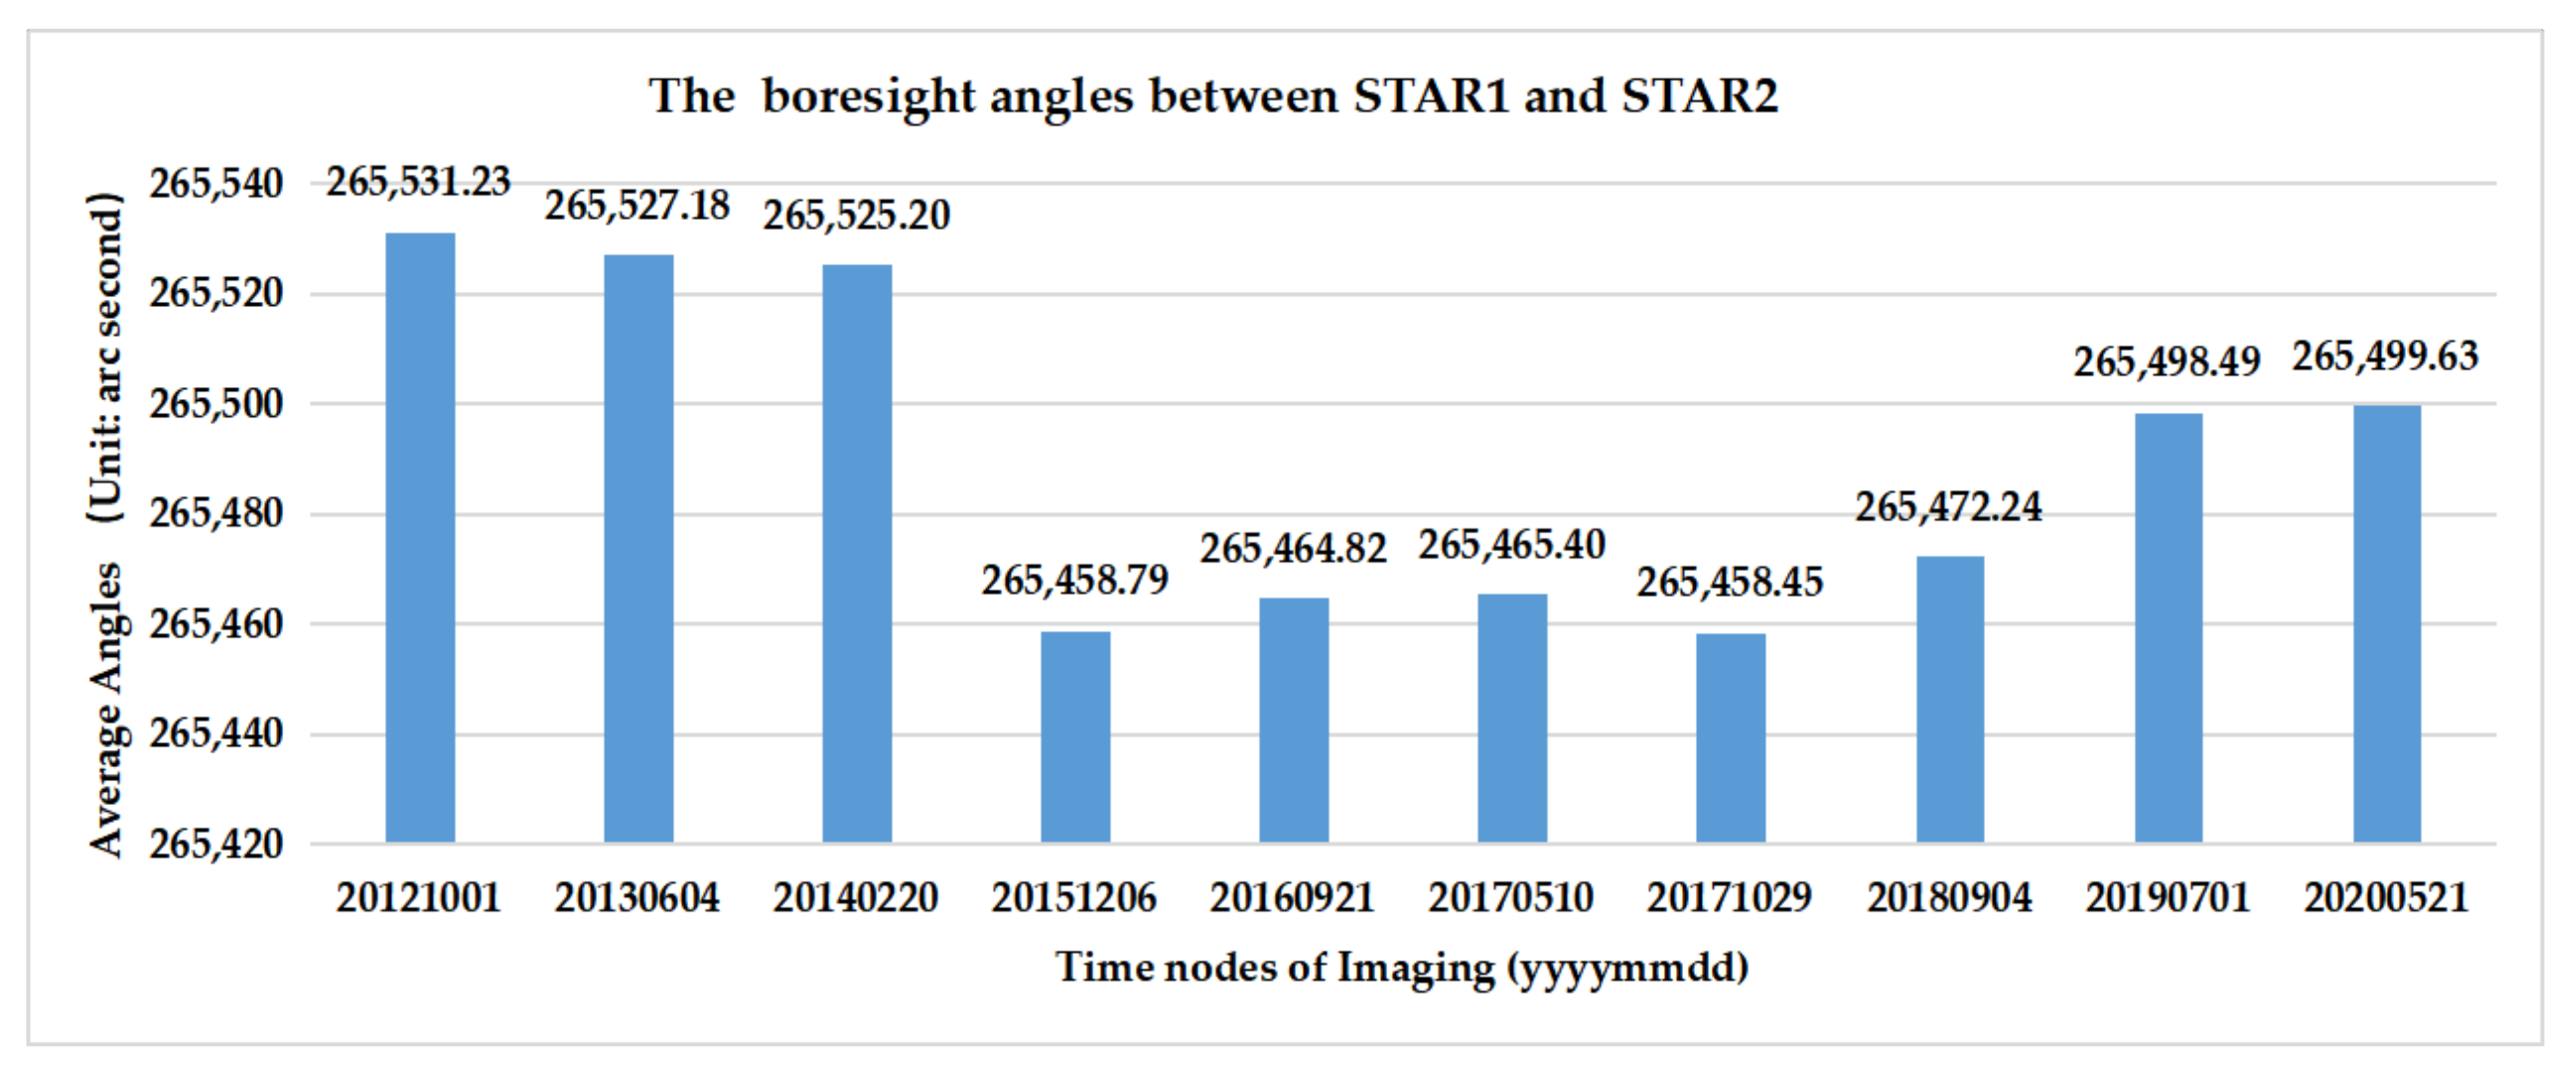
4.1. Camera stability from Boresight Misalignment Calibration

The TLC of the ZY3-01 satellite is relatively stable overall, as the installation deviation of the whole TLC and the attitude measurement system varies by tens of arc seconds (See Figure 4), and the boresight misalignments of FWD and BWD cameras are both within 7 arc seconds during its 10 years of operation. These results can provide reference for subsequent satellite design and long-time on-orbit calibration. Moreover, attitude errors are often the main errors compared with errors of alignment angles [29,38]. Combined with the changes in the mounting angles of the NAD camera in Figure 4 and the variations in boresight angles between ZY3-01’s two star trackers shown in Figure 9, it can be seen that all errors above 10 arc seconds are caused by attitude errors. However, the positioning accuracies of FWD and BWD cameras in the image space are still large when only one compensation matrix of the NAD camera is applied for three cameras. The RMSE in the Sample direction is more than 1 pixel, while the RMSE in the Line direction is more than 2 pixels or even 3 pixels. That means the alignment angles of ZY3-01 TLC are dynamic during the operation. The reason for this misalignment may be the influences of the temperature, radiation or other environmental factors, which are also worthy of investigation and would be helpful for camera stability.
In addition, the three angles of boresight misalignments of TLC are also different. The shifts of pitch are relatively stable and smaller than the other two, and the drifts of pitch and roll angles are almost the same from the change curves. The drastic changes in roll and yaw parameters maybe caused by inaccurate control points or narrow FoV. In general, the pitch parameter affects the accuracy in the Line direction, while roll and yaw affect the Sample direction. When the values of roll and yaw parameters are small, they are correlated. Moreover, the yaw angle of the ZY3-01 satellite has more uncertainties than the other two angles. Considering that the yaw angle introduces a very small error in the image space for very narrow FoV images [32], the compensation model with four parameters omitted the yaw angle. The results also show that the results of the four-parameter model and the six-parameter model are almost the same.

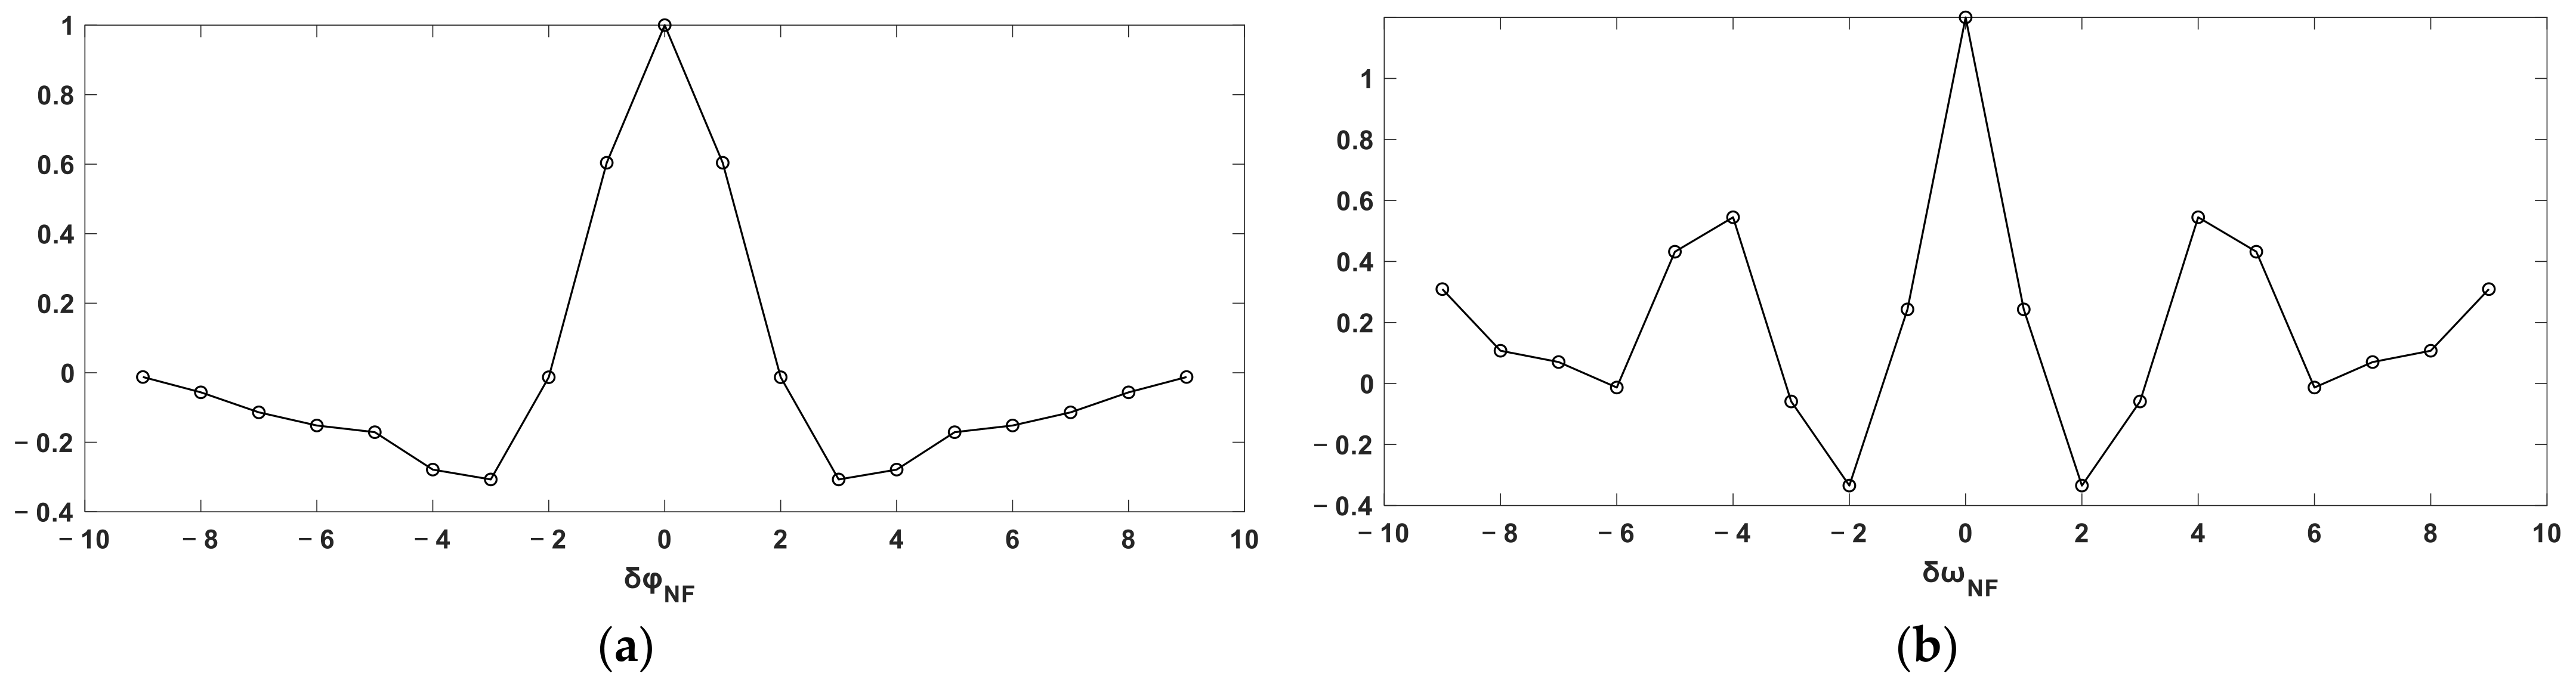
4.2. Error Sources for Boresight Misalignment Calibration

Imaging geometric model of TLC denotes the geometric relationship between the payload and the satellite measurement equipment. The factors, including time synchronization, attitude, orbit measurements, on-orbit equipment installation and camera distortions, are the main error sources for stereo mapping of the ZY3-01 satellite. The boresight misalignments of TLC will affect the geolocation accuracy. There are deviations between the attitudes determined by the navigation coordinates system and the real camera attitudes. These deviations can be eliminated through removing the misalignment between the camera and the navigation coordinates by geometric calibration or by offset compensation. The attitude deviations are highly intercorrelated for single-camera satellites such as agile satellites, while the attitude deviations of TLC can be further divided into the misalignments between the navigation coordinates and the satellite body coordinates, and the deviations between TLC coordinates and the satellite body coordinates. In other words, both R n a v E C E F t and R N , R F , R B in the geometric model are related to misalignments of TLC and require error corrections.
However, the geometric calibration of the ZY3-01 satellite is carried out step by step based on the internal and external elements. For cameras, the internal calibration mainly focuses on the focal length of camera and the look angle of every detector on CCD arrays, which reflect the internal geometric relationship of the camera. Their accuracy mainly depends on the distortion errors of cameras. The external calibration is concerned with changes in attitudes and mounting matrix of cameras, and the georeferencing accuracy is mainly influenced by on-orbit equipment installation errors. It is difficult to calibrate each separate parameter because of their strong correlations. In this study, errors of cameras are all absorbed by the boresight misalignments caused by the installation, which is why the three FWD–NAD–BWD images simultaneously captured are used to ensure as consistent attitude parameters as possible in the body coordinates. The misalignments of the three cameras estimated here reflect the relative relationship between FWD and NAD cameras, and FWD and NAD cameras. The detailed misalignment for each individual camera needs further study. Moreover, the misalignment difference between FWD and BWD shown in Figure 6 and Figure 7 also indicate that the factors influencing the boresight misalignment of each camera are not exactly the same. The remaining errors should be further considered with internal calibration.
In addition, the accuracy of ground points is also an important factor affecting boresight misalignment calibration of TLC. From Equation (1), the accuracy of the GCP measurements should be improved to ensure the direct georeferencing accuracy. However, such a number of high-precision points are difficult to obtain in the case of long time series image coverage. The SIFT points used as the ground points in this study can be acquired easily and can guarantee the distribution in the coverage area. Moreover, the close accuracies of these points ensure the consistency of all ground points in the misalignment calibration, and therefore, the effect on three cameras can be seen as same as one another. Thus, they do not change the relative relationship of the three cameras. However, high-precision ground points such as observations from Real-Time Kinematic (RTK) would improve the georeferencing accuracy. If the geometric calibration is performed in the same area, then the accuracy of ground points will be closely related to the boresight misalignment calibration.

4.3. Effects of Long Time Series

Different compensation models for TLC are required for further high-precision geolocation or mapping. Geometric boresight calibration is needed for improving the geometric accuracy of imagery because of the errors. As the time interval of TLC is 28 s for the ZY3-01 satellite imaging the same ground target, the compensation models of boresight misalignments are different for the same ground scene. Even in the case of simultaneous imaging, the same boresight misalignment calibration is not suitable for the three cameras for improving the accuracy. The shifts of the BWD camera accumulate over time but those of the FWD camera do not, which means that the misalignments of three cameras are different. Therefore, more validations combined with long time series and short-term calibrations are needed for further study. Moreover, orientation parameters R n a v E C E F t and R N , R F , R B in the geometric model are also time-dependent; these instantaneous and long-term characteristics of TLC would directly affect the accuracy of positioning. Because the installation matrices of three cameras often change during the flight, the calibration in orbit should consider the instantaneous and long-term changes, which form the dynamical characters and differences of TLC. The advantages and necessity of long time series analysis deserve more attention.

5. Conclusions

This study presents a long-periodic method to analyze and calculate the boresight misalignments between three cameras, with the attitude estimation of a nadir (NAD) camera as the benchmark. Experiments using ten simultaneous NAD–FWD–BWD imagery of the ZY3-01 satellite acquired from 2012 to 2020 were performed to estimate the offsets and drifts of the three cameras and thus the relative position between the three cameras with the alignment angles. Time series of related parameters for boresight misalignments were built and analyzed. Our conclusions are as follows.
(1)
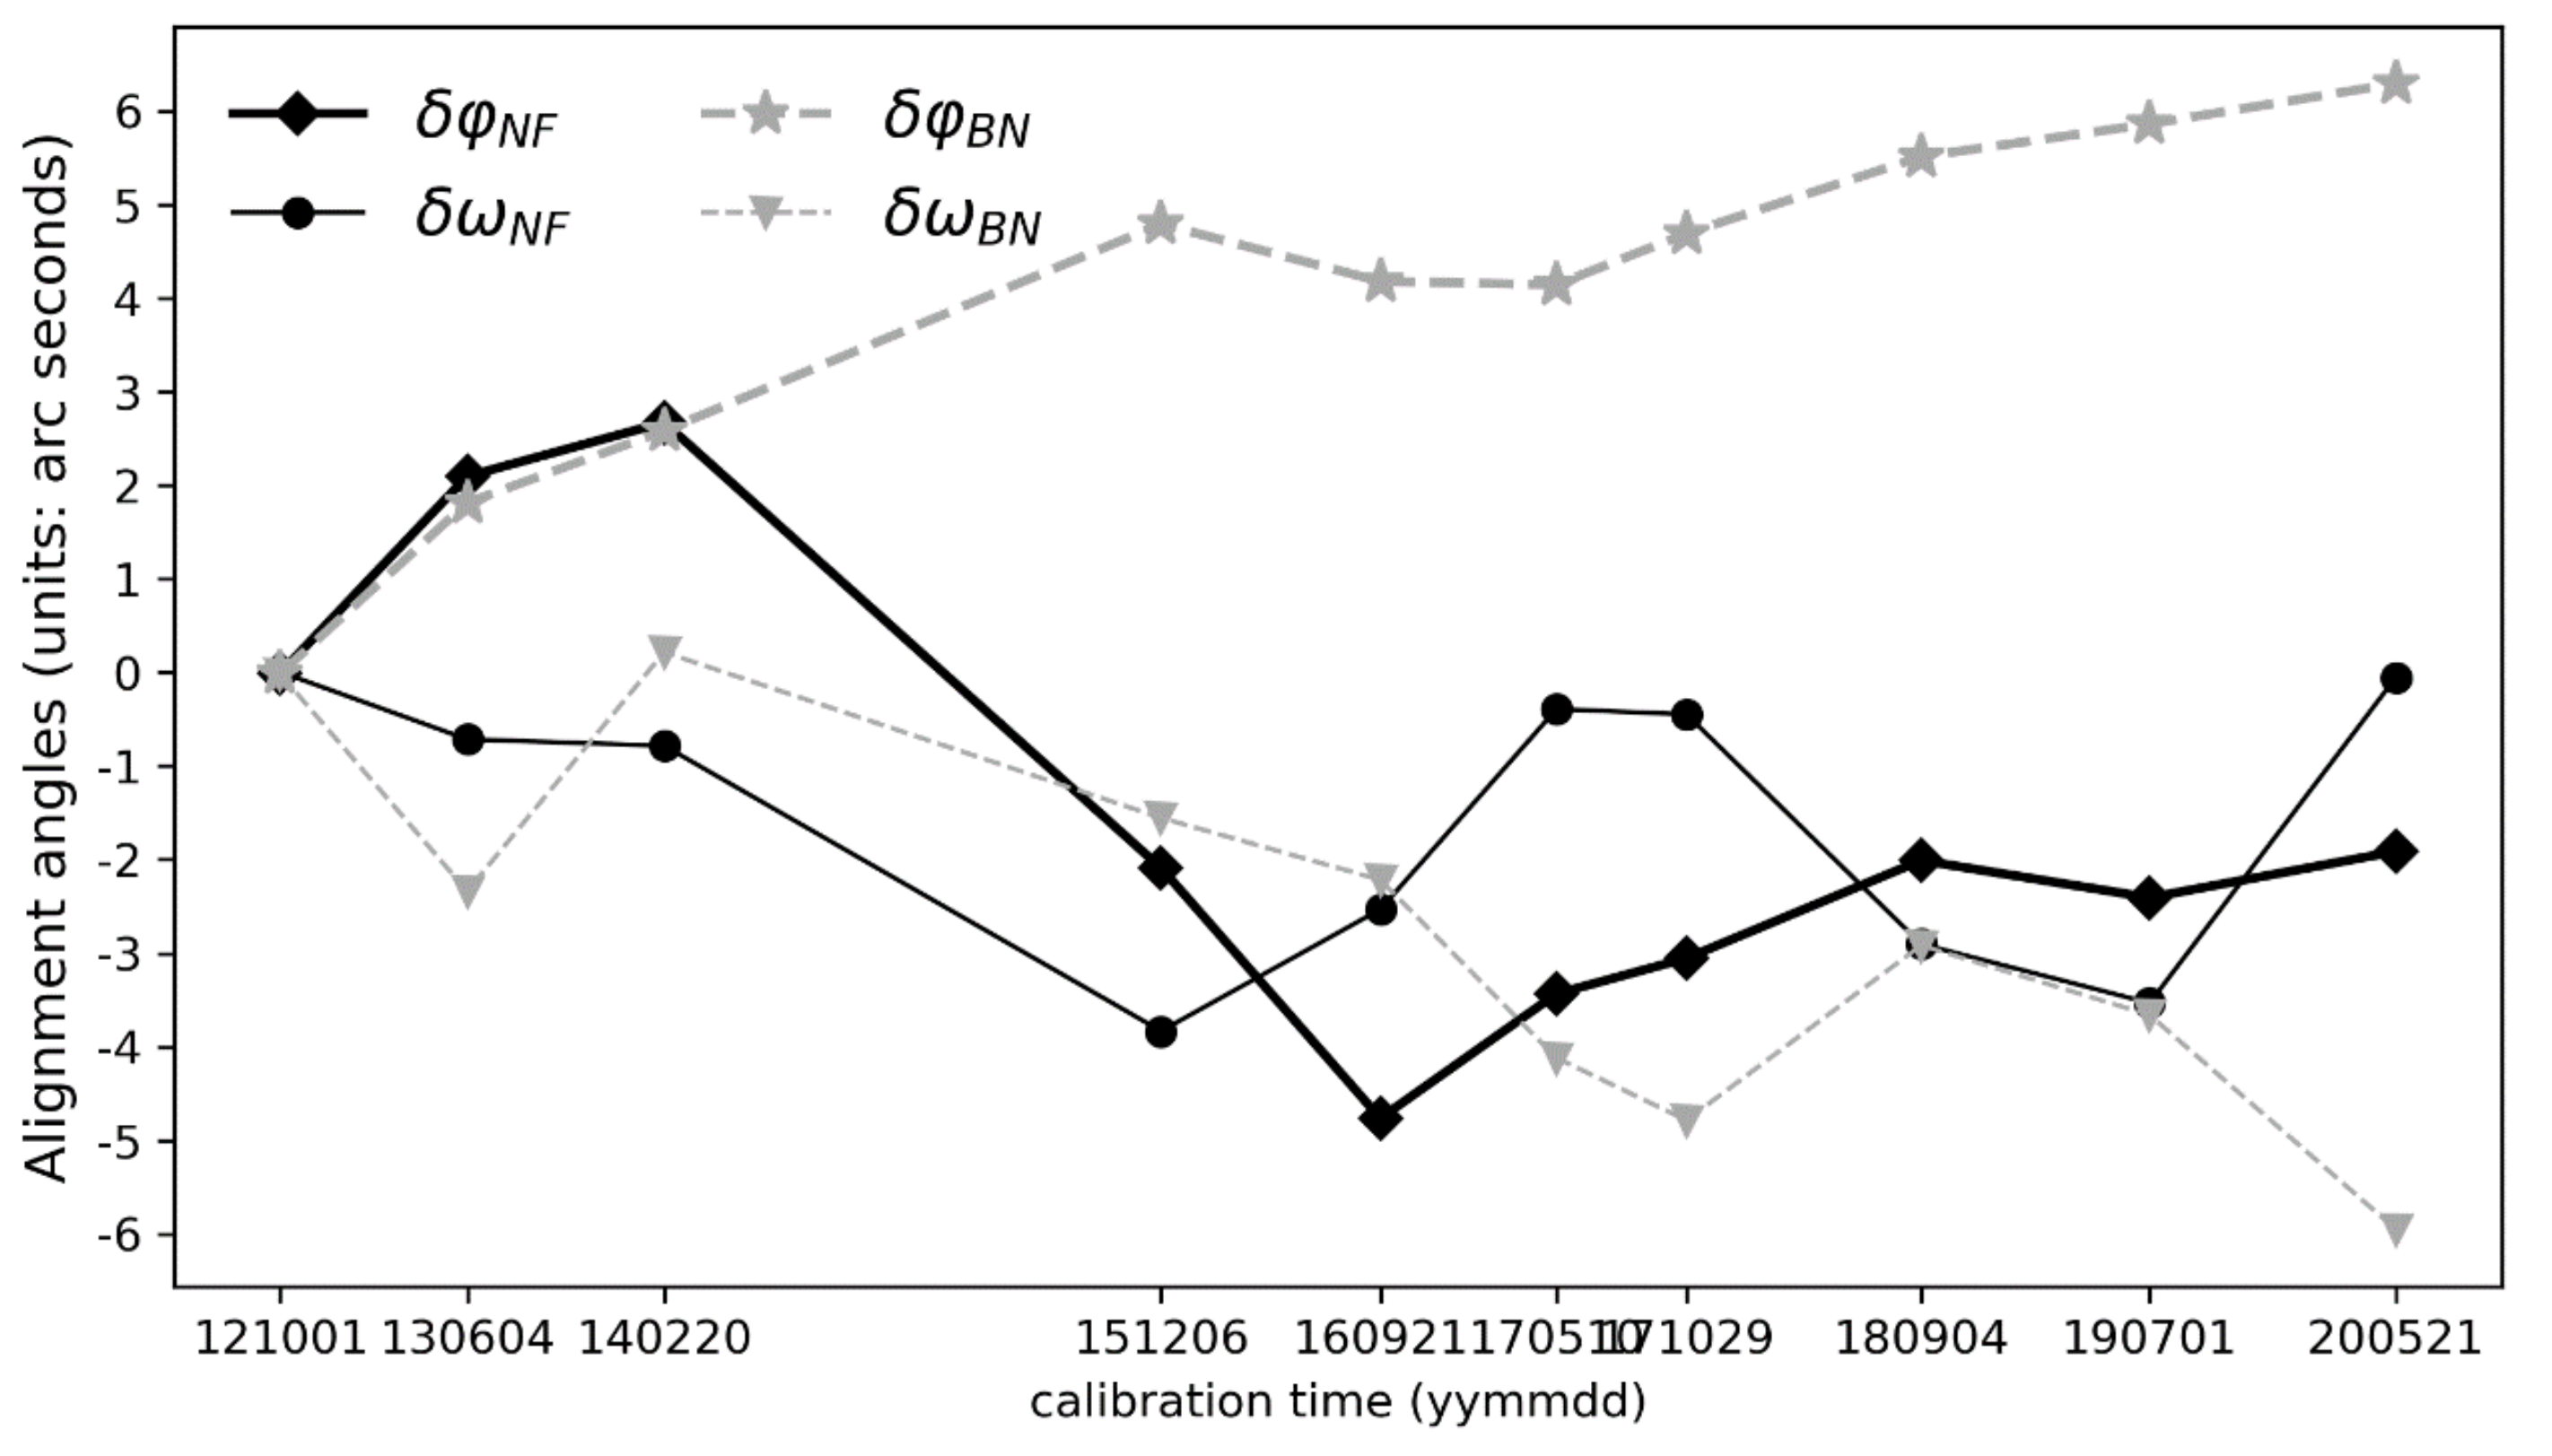
The structure of ZY3-01 TLC was stable overall in the 10 years of operation, and the alignment angles of TLC were dynamic over time.
(2)
Compensation models of TLC are different for each camera. High-precision geo-positioning or mapping should consider the differences and relations of each camera rather than only a unified installation matrix.
(3)
Both the camera coordinates and the navigation coordinates change significantly with time. Therefore, regular geometric calibration is necessary for improving the positioning accuracy of high-resolution satellites.
(4)
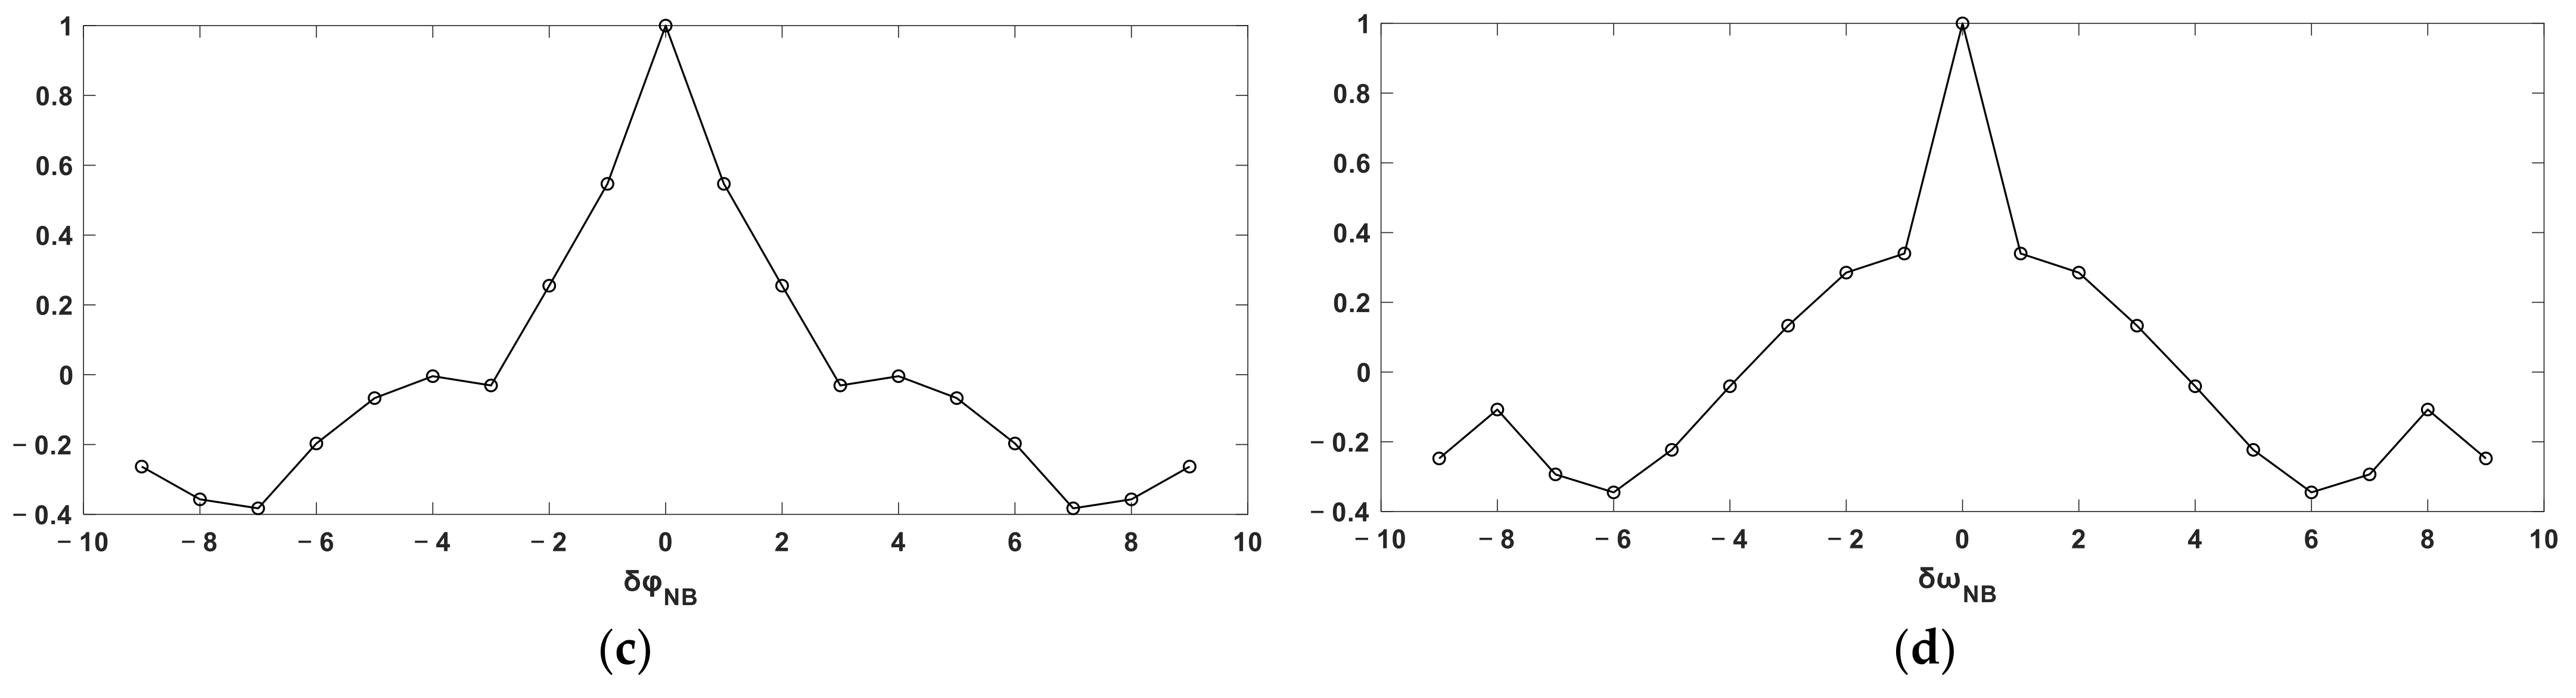
Long-periodic analyses of TLC boresight misalignments indicate the changes in TLC angles, but the change patterns need further investigation.

Author Contributions

X.Z. and B.L., developed the main idea of this study and performed the data processing and analysis. X.T., G.Z. and H.P. gave support to the data accuracy analysis and the discussion of the results. The detailed information is as follows: data curation, X.Z. and B.L; formal analysis, X.Z., G.Z. and B.L.; methodology, X.Z., B.L. and W.H.; project administration, X.Z. and X.T.; supervision, G.Z. and H.P.; diagrams, X.Z. and W.H. All authors have read and agreed to the published version of the manuscript.

Funding

This research was supported by the National Key Research and Development Program of China (no. 2018YFB0504903); the High Resolution Remote Sensing, Surveying and Mapping Application Demonstration System (Phase II) (no. 42-Y30B04-9001-19/21); and the Major Project of High Resolution Earth Observation System (no. GFZX0404130302), by the National Natural Science Foundation of China (grant no. 51874278 and 41971418). We appreciate the editorial help as well as academic suggestions from the anonymous reviewers.

Data Availability Statement

ZY3-01 imagery used in this study can be inquired through the website for Natural Resource Satellite Remote Sensing Cloud Service Platform (http://sasclouds.com/english/home). Illustrations in this paper were subject to no copyright restrictions.

Conflicts of Interest

The authors declare no conflict of interest.

References

  1. Jovanovic, V.; Moroney, C.; Nelson, D. Multi-angle geometric processing for globally geo-located and co-registered MISR image data. Remote Sens. Environ. 2007, 107, 22–32. [Google Scholar] [CrossRef]
  2. Heipke, C.; Oberst, J.; Albertz, J.; Attwenger, M.; Dorninger, P.; Dorrer, E.; Ewe, M.; Gehrke, S.; Gwinner, K.; Hirschmueller, H.; et al. Evaluating planetary digital terrain models - The HRSC DTM test. Planet. Space Sci. 2007, 55, 2173–2191. [Google Scholar] [CrossRef]
  3. Tadono, T.; Shimada, M.; Takaku, J.; Kawamoto, S. Accuracy assessments of standard products of ALOS optical instruments and their high level products. In Proceedings of the Conference on Sensors, Systems, and Next-Generation Satellites XI, Florence, Italy, 17–20 September 2007. [Google Scholar]
  4. Grodecki, J.; Dial, G. Block adjustment of high-resolution satellite images described by rational polynomials. Photogramm. Eng. Remote Sens. 2003, 69, 59–68. [Google Scholar] [CrossRef]
  5. Hofmann, O.; Navé, P.; Ebner, H. DPS-A digital photogrammetric system for producing digital elevation models and orthophotos by means of linear array scanner imagery. Photogramm. Eng. Remote Sens. 1984, 50, 1135–1142. [Google Scholar]
  6. Bouillon, A.; Bernard, M.; Gigord, P.; Orsonia, A.; Rudowski, V. SPOT5 HRS geometric performances: Using block adjustment as a key issue to improve quality of DEM generation. ISPRS J. Photogramm. 2006, 60, 134–146. [Google Scholar] [CrossRef]
  7. Cao, J.; Yuan, X.; Gong, J. In-orbit geometric calibration and validation of ZY-3 three-line cameras based on CCD-detector look angles. Photogramm. Rec. 2015, 30, 211–226. [Google Scholar] [CrossRef]
  8. Cao, J.; Yuan, X.; Fang, Y.; Gong, J. Geometric calibration of Ziyuan-3 three-line cameras using ground control lines. Photogramm. Eng. Remote Sens. 2016, 82, 893–902. [Google Scholar] [CrossRef]
  9. Xing, L.; Dai, W.; Zhang, Y. Improving displacement measurement accuracy by compensating for camera motion and thermal effect on camera sensor. Mech. Syst. Signal Processing 2022, 167, 108525. [Google Scholar] [CrossRef]
  10. Zhang, X.; Zeinali, Y.; Story, B.A.; Rajan, D. Measurement of three-dimensional structural displacement using a hybrid inertial vision-based system. Sensors 2019, 19, 4083. [Google Scholar] [CrossRef] [Green Version]
  11. Chen, Y.; Qiu, Z.; Xie, Z.; Le, Y.; Fang, S.H. Detection of attitude constant error and in-orbit calibration for the three-line CCD sensor of the ZY-3 satellite. Int. J. Remote Sens. 2017, 38, 7333–7356. [Google Scholar] [CrossRef]
  12. Tang, X.; Zhu, X. The geometric calibration and validation for the ZY3-02 satellite optical image. In Proceedings of the ISPRS—International Archives of the Photogrammetry, Remote Sensing and Spatial Information Sciences, Hannover, Germany, 6–9 June 2017. [Google Scholar]
  13. Zhang, G.; Jiang, Y.; Li, D.; Huang, W.; Pan, H.; Tang, X.; Zhu, X. In-orbit geometric calibration and validation of ZY-3 linear array sensors. Photogramm. Rec. 2014, 29, 68–88. [Google Scholar] [CrossRef]
  14. Zhang, Y.; Zheng, M.; Xiong, J.; Lu, Y.; Xiong, X. On-orbit geometric calibration of ZY-3 three-line array imagery with multistrip data sets. IEEE Trans. Geosci. Remote Sens. 2014, 52, 224–234. [Google Scholar] [CrossRef]
  15. Wang, M.; Yang, B.; Hu, F.; Zang, X. On-orbit geometric calibration model and its applications for high-resolution optical satellite imagery. Remote Sens. 2014, 6, 4391–4408. [Google Scholar] [CrossRef] [Green Version]
  16. Toutin, T. Geometric processing of remote sensing images: Models, algorithms and methods. Int. J. Remote Sens. 2010, 25, 1893–1924. [Google Scholar] [CrossRef]
  17. Grodecki, J.; Dial, G. IKONOS geometric accuracy validation. Int. Arch. Photogramm. Remote Sens. Spat. Inf. Sci. 2002, 34, 50–55. [Google Scholar]
  18. Mulawa, D. On-orbit geometric calibration of the OrbView-3 high resolution imaging satellite. Int. Arch. Photogramm. Remote Sens. Spat. Inf. Sci. 2004, 35, 1–6. [Google Scholar]
  19. Radhadevi, P.V.; Solanki, S.S. In-flight geometric calibration of different cameras of IRS-P6 using a physical sensor model. Photogramm. Rec. 2008, 23, 69–89. [Google Scholar] [CrossRef]
  20. Tadono, T.; Shimada, M.; Hashimoto, T.; Takaku, J.; Mukaida, A.; Kawamoto, S. Results of calibration and validation of ALOS optical sensors, and their accuracy assesments. In Proceedings of the IEEE International Geoscience and Remote Sensing Symposium, Barcelona, Spain, 23–27 July 2007. [Google Scholar]
  21. Kornus, W.; Lehner, M.; Schroeder, M. Geometric in-flight calibration of the stereoscopic line-CCD scanner MOMS-2P. ISPRS J. Photogramm. Remote Sens. 2000, 55, 59–71. [Google Scholar] [CrossRef]
  22. Gascon, F.; Bouzinac, C.; Thépaut, O.; Jung, M.; Francesconi, B.; Louis, J.; Lonjou, V.; Lafrance, B.; Massera, S.; Gaudel-Vacaresse, A. Copernicus Sentinel-2A calibration and products validation status. Remote Sens. 2017, 9, 584. [Google Scholar] [CrossRef] [Green Version]
  23. De Lussy, F.; Greslou, D.; Dechoz, C.; Amberg, V.; Delvit, J.M.; Lebegue, L.; Blanchet, G.; Fourest, S. Pleiades HR in flight geometrical calibration: Location and mapping of the focal plane. Int. Arch. Photogramm. Remote Sens. Spat. Inf. Sci. 2012, 39, 519–523. [Google Scholar] [CrossRef] [Green Version]
  24. Spiegel, M. Improvement of interior and exterior orientation of the three-line camera HRSC with a simultaneous adjustment. Int. Arch. Photogramm. Remote Sens. 2007, 36, 161–166. [Google Scholar]
  25. Wang, J.; Wang, R.; Hu, X.; Su, Z. The on-orbit calibration of geometric parameters of the Tian-Hui 1 (TH-1) satellite. ISPRS J. Photogramm. Remote Sens. 2017, 124, 144–151. [Google Scholar] [CrossRef]
  26. Wang, M.; Guo, B.; Zhu, Y.; Cheng, Y.; Nie, C. On-Orbit Calibration Approach Based on Partial Calibration-Field Coverage for the GF-1/WFV Camera. Photogramm. Eng. Remote Sens. 2019, 85, 815–827. [Google Scholar] [CrossRef]
  27. Wang, M.; Cheng, Y.; Chang, X.; Jin, S.; Zhu, Y. On-orbit geometric calibration and geometric quality assessment for the high-resolution geostationary optical satellite GaoFen4. ISPRS J. Photogramm. Remote Sens. 2017, 125, 63–77. [Google Scholar] [CrossRef]
  28. Wang, M.; Cheng, Y.; Tian, Y.; He, L.; Wang, Y. A new on-orbit geometric self-calibration approach for the high-resolution geostationary optical satellite GaoFen4. IEEE J. Sel. Top. Appl. Earth Obs. Remote Sens. 2018, 11, 1670–1683. [Google Scholar] [CrossRef]
  29. Tang, X.; Zhang, G.; Zhu, X.; Pan, H.; Jiang, Y.; Zhou, P.; Wang, X.; Guo, L. Triple linear-array image geometry model of ZiYuan-3 surveying satellite and its validation. Acta Geod. Et Cartogr. Sin. 2012, 41, 191–198. (In Chinese) [Google Scholar] [CrossRef]
  30. Kocaman, S.; Armin, G. Orientation and self-calibration of ALOS PRISM imagery. Photogramm. Rec. 2008, 23, 323–340. [Google Scholar]
  31. Li, D. China’s first civilian three-line-array stereo mapping satellite: ZY-3. Acta Geod. Et Cartogr. Sin. 2012, 41, 317–322. (In Chinese) [Google Scholar]
  32. Cao, J.; Fu, J.; Yuan, X.; Gong, J. Nonlinear bias compensation of ZiYuan-3 satellite imagery with cubic splines. ISPRS J. Photogramm. Remote Sens. 2017, 133, 174–185. [Google Scholar] [CrossRef]
  33. Pan, H.; Tao, C.; Zou, Z. Precise georeferencing using the rigorous sensor model and rational function model for ZiYuan-3 strip scenes with minimum control. ISPRS J. Photogramm. Remote Sens. 2016, 119, 259–266. [Google Scholar] [CrossRef]
  34. Yang, B.; Pi, Y.; Li, X.; Yang, Y. Integrated geometric self-calibration of stereo cameras onboard the ZiYuan-3 satellite. ISPRS J. Photogramm. Remote Sens. 2020, 162, 173–183. [Google Scholar] [CrossRef]
  35. Xu, K.; Jiang, Y.; Zhang, G.; Zhang, Q.; Wang, X. Geometric potential assessment for ZY3-02 triple linear array imagery. Remote Sens. 2017, 9, 658. [Google Scholar] [CrossRef] [Green Version]
  36. Jiang, Y.; Zhang, G.; Tang, X.; Zhu, X.; Qin, Q.; Li, D.; Fu, X. High accuracy geometric calibration of ZY-3 three-line image. Acta Geod. Et Cartogr. Sin. 2013, 42, 523–529. (In Chinese) [Google Scholar]
  37. Lin, G.; Wolfe, R.E.; Zhang, P.; Tilton, J.C.; Dellomo, J.J.; Tan, B. Thirty-six combined years of MODIS geolocation trending. In Proceedings of the Conference on Earth Observing Systems XXIV, San Diego, CA, USA, 11–15 August 2019. [Google Scholar]
  38. Gao, H.; Luo, W.; Shi, H.; Mo, F.; Li, S.; Zhang, X.; Liu, X.; Cao, H. Structural stability design and implementation of ZY-3 satellite. Spacecr. Eng. 2016, 25, 18–24. (In Chinese) [Google Scholar]
  39. Lowe, D.G. Distinctive image features from scale-invariant key points. Int. J. Comput. Vision. 2004, 60, 91–110. [Google Scholar] [CrossRef]
Figure 1. Imaging schematics of the ZY3-01 satellite. (a) Schematic for the imaging process of the TLC; (b) schematic of three cameras.
Remotesensing 14 01157 g001
Figure 2. The approach of long-periodic analysis of the TLC boresight misalignment.
Remotesensing 14 01157 g002
Figure 3. Spatial coverage of ZY3-01 TLC images and SIFT points used in this study.
Remotesensing 14 01157 g003
Figure 4. The changes in the mounting angles of the NAD camera of the ZY3-01 satellite. (a) The curves of the offsets; (b) the curves of the drifts.
Remotesensing 14 01157 g004aRemotesensing 14 01157 g004b
Figure 5. The cross-covariances of time series (a) φ 0 and ω 0 ; (b) φ 0 and κ 0 ; (c) ω 0 and κ 0 .
Remotesensing 14 01157 g005
Figure 6. The RMSEs in the image Sample and Line directions before and after compensation for the FWD and BWD cameras. (a) RMSEs of FWD in Sample direction; (b) RMSEs of FWD in Line direction; (c) RMSEs of BWD in Sample direction; (d) RMSEs of BWD in Line direction.
Remotesensing 14 01157 g006
Figure 7. The mounting angles trends of the FWD and BWD cameras of the TLC.
Remotesensing 14 01157 g007
Figure 8. The normalized autocovariance sequences of boresight misalignments of FWD and BWD cameras with the NAD camera as the benchmark. (a) The autocovariance sequences of pitch between FWD and NAD cameras; (b) the autocovariance sequences of roll between FWD and NAD cameras; (c) the autocovariance sequences of pitch between BWD and NAD cameras; (d) the autocovariance sequences of roll between BWD and NAD cameras.
Remotesensing 14 01157 g008aRemotesensing 14 01157 g008b
Figure 9. The variations in boresight angles between two star trackers of the ZY3-01 satellite during the experimental period.
Remotesensing 14 01157 g009
Table 1. Spatial coverage of the images acquired by the TLC of satellite ZY3-01.
DatasetsFWDNADBWD
20121001113.831° E33.852° N114.353° E35.838° N114.898° E37.807° N
20130604114.401° E34.110° N114.916° E36.061° N115.472° E38.069° N
20140220117.181° E33.480° N117.705° E35.462° N118.261° E37.435° N
20151206116.728° E37.268° N117.272° E39.224° N117.856° E41.214° N
20160921115.018° E34.101° N115.534° E36.061° N116.093° E38.059° N
20170510114.368° E34.101° N114.876° E36.060° N115.421° E38.059° N
20171029114.430° E34.102° N114.950° E36.061° N115.508° E38.060° N
20180904115.516° E34.102° N116.035° E36.061° N116.591° E38.059° N
20190701115.764° E34.102° N116.281° E36.061° N116.835° E38.059° N
20200521118.121° E32.913° N118.625° E34.874° N119.165° E36.873° N
Table 2. The boresight alignment of the NAD camera of the ZY3-01 satellite.
Datasets φ 0 ω 0 κ 0 φ 1 ω 1 κ 1
(Arc Seconds)(Arc Seconds/s)
201210010.000.000.000.16−0.120.02
20130604−2.59−1.646.25−0.050.03−0.40
20140220−4.34−7.99−2.38−0.17−0.12−0.87
20151206−21.94−68.81−41.160.040.040.33
20160921−26.02−74.13−31.040.060.050.76
20170510−24.70−62.63−26.39−0.04−0.070.62
20171029−21.85−63.96−32.300.11−0.060.48
20180904−27.23−60.05−27.32−0.03−0.020.17
20190701−25.66−22.96−12.220.240.210.86
20200521−21.20−27.87−16.660.06−0.050.36
Average−17.55−39.00−18.320.04−0.010.23
Absolute Maximum27.2374.1341.160.240.210.87
Variance115.53889.64250.930.0140.00980.29
Table 3. The RMSEs in the image space of the TLC using only the mounting angle of the NAD camera (pixels).
DatasetNADFWDBWD
SampleLineSampleLineSampleLine
201210010.790.190.760.490.620.61
201306040.570.460.431.821.361.61
201402200.620.260.812.260.472.16
201512060.450.432.601.791.073.98
201609210.500.361.633.931.423.50
201705100.730.510.842.922.573.49
201710290.590.390.732.543.213.90
201809040.490.392.261.692.024.58
201907010.520.351.942.022.084.82
202005210.770.510.741.664.195.22
Average0.600.391.272.111.903.39
Variance0.0150.010.580.821.372.21
Table 4. The RMSEs in the image space of the FWD camera before and after compensation (unit: pixels).
DatasetsBeforeSample DirectionBeforeLine Direction
After CompensationAfter Compensation
6 par.4 par.2 par.6 par.4 par.2 par.
201210010.760.400.400.460.490.400.500.50
201306040.430.320.320.621.820.560.590.59
201402200.810.270.270.312.260.460.460.52
201512062.600.580.580.601.790.550.570.58
201609211.630.520.520.523.930.440.470.47
201705100.840.590.590.602.920.600.600.68
201710290.730.630.630.642.540.420.430.45
201809042.260.550.550.551.690.420.450.45
201907011.940.550.550.562.020.500.530.56
202005210.740.590.590.601.660.540.560.56
Average1.270.50.50.552.110.490.520.54
Note: par. means parameters.
Table 5. The RMSEs in the image space of the BWD camera before and after compensation (unit: pixels).
DatasetsBeforeSample DirectionBeforeLine Direction
After CompensationAfter Compensation
6 par.4 par.2 par.6 par.4 par.2 par.
201210010.620.390.390.800.610.530.600.58
201306041.360.310.310.741.610.580.590.59
201402200.470.330.330.362.160.300.330.33
201512061.070.510.510.513.980.470.470.48
201609211.420.370.370.373.500.470.510.53
201705102.570.580.580.673.490.610.640.66
201710293.210.570.570.673.900.470.490.56
201809042.020.450.450.464.580.430.480.51
201907012.080.510.510.604.820.400.400.40
202005214.190.730.730.735.220.540.550.57
Average1.900.480.480.593.390.480.510.52
Note: par. means parameters.
Publisher’s Note: MDPI stays neutral with regard to jurisdictional claims in published maps and institutional affiliations.

