Technical Note

Image Correction and In Situ Spectral Calibration for Low-Cost, Smartphone Hyperspectral Imaging

1
Department of Electronic & Electrical Engineering, University of Sheffield, Sheffield S1 4ET, UK
2
Department of Geography, University of Sheffield, Sheffield S10 2TN, UK
*
Author to whom correspondence should be addressed.
Remote Sens. 2022, 14(5), 1152; https://doi.org/10.3390/rs14051152
Submission received: 21 January 2022 / Revised: 16 February 2022 / Accepted: 22 February 2022 / Published: 25 February 2022
(This article belongs to the Special Issue Hyperspectral Remote Sensing Data Calibration and Validation)

Abstract

:
Developments in the portability of low-cost hyperspectral imaging instruments translate to significant benefits to agricultural industries and environmental monitoring applications. These advances can be further explicated by removing the need for complex post-processing and calibration. We propose a method for substantially increasing the utility of portable hyperspectral imaging. Vertical and horizontal spatial distortions introduced into images by ‘operator shake’ are corrected by an in-scene reference card with two spatial references. In situ light-source-independent spectral calibration is performed. This is achieved by a comparison of the ground-truth spectral reflectance of an in-scene red–green–blue target to the uncalibrated output of the hyperspectral data. Finally, bias introduced into the hyperspectral images due to the non-flat spectral output of the illumination is removed. This allows for low-skilled operation of a truly handheld, low-cost hyperspectral imager for agriculture, environmental monitoring, or other visible hyperspectral imaging applications.

1. Introduction

Hyperspectral imaging has risen to prominence in recent years due to its growing role in sensing applications in agriculture and environmental [1,2,3,4] monitoring, civil engineering [5,6] and medical applications such as cancer and Alzheimer’s detection [7,8]. It is suited to these applications because it comprises additional information that is contained within a hyperspectral image. A specific example used in this work to demonstrate the advantage of defect detection and quality assurance in fruit afforded by hyperspectral imaging over conventional monitoring techniques is well documented in the literature. It is shown not as a novel application but to illustrate the utility of the technique we propose in this work. In digital photography, the pixel brightness of an image, measured in digital levels (DL) corresponds to wavelength-integrated radiance, either across the spectral range of the sensor for monochromatic cameras or within the spectral bands of the Bayer filter in colour imaging. A hyperspectral image is, in contrast, a multitude of images all captured contemporaneously. Each image corresponds to a narrow band of wavelengths (typically 1–10 nm full width half maximum (FWHM) [9,10]) and each pixel value is the wavelength-integrated radiance across that band. This allows features to be detected in a reflection spectrum that are otherwise lost in traditional imaging techniques. For instance, this is applied to aerial monitoring of large ground areas, disease detection in plants and to aid the segmentation of cells in microscopy [11,12,13].
Hyperspectral imaging can be prohibitively expensive and so different approaches have been taken to produce hyperspectral images at reduced cost [14]. Coded aperture snapshot spectral imaging (CASSI)-based hyperspectral imaging systems use a coded aperture to encode spectral information and produce hyperspectral images. This technique can produce hyperspectral images at high frame rates but requires intensive post-processing [15]. Scanning systems offer the advantage of producing images that can be easily extracted from raw data captured where high-speed acquisition is not required, for example, in agricultural measurements. Rapid data collection is often not necessary because vegetation changes over time scales of tens of minutes or hours [16]. Such systems are often attached to drones to produce hyperspectral images of large areas such as fields to assess characteristics of large numbers of plants simultaneously [17]. Lab-based systems are also used to assess individual plant properties, such as damage and/or deterioration in fruits and other fresh produce for non-destructive quality control and assessment [9,16]. Wider availability of low-cost, easy to operate systems that require minimal post-processing would enable better individual plant monitoring during growth and improved quality control in food distribution.
The maturity of silicon focal plane array (FPA) camera sensors, coupled with advances in smartphone technology affords significant developments in handheld scientific instrumentation [18]. Smartphones can be easily adopted as platforms for prototype and commercial instruments in a wide variety of scientific fields due to the fast on-board computing power and built-in sensors [9,19,20,21,22,23,24,25,26,27]. In a previous publication, a smartphone-based hyperspectral imaging device was reported and demonstrated as a viable, low-cost alternative to more expensive lab-based systems [9]. This device was very simple in its design but demonstrated the potential of smartphone technology in a side-by-side comparison with a non-portable lab setup.
Push-broom scanning systems, such as the one described above, are limited in two ways. Firstly, when operated as a handheld scanner, they suffer serious image distortion due to ‘operator shake’; the inability of users of hand-held devices to translate the instrument across a scene with perfectly linear motion and constant velocity [9]. This results in distorted images with regions of spatial compressions and expansion. This can be avoided using a motorised translation stage either to translate the imaging system [9] or the target of the imaging [28,29]. Alternatively, a three-axis gimbal has been shown to reduce the effect of operator shake [30]. However, these systems require bulky or expensive equipment and somewhat reduce the utility and cost-effectiveness of a handheld system.
We address the aforementioned deficiencies of push-broom hyperspectral imaging systems in this work utilising two in-scene spatial refences; one to correct horizontal distortion and the other for vertical distortion. Both references leave measurable traces in the hyperspectral images that can be used to correct the images for spatial distortion. This is an ultra-low-cost solution because the in-scene reference is simply printed on a sheet of white paper, with the added novel complexity hidden within a software algorithm. Slight rotation of the system during a scan does produce distortions in the final image but are negligible compared to the horizontal and vertical distortions.
The second limitation is that of calibration drift. Calibration of such systems is generally performed using known spectral sources such as a xenon, mercury or sodium lamp [31,32]. Spectral features can be identified from instrument output, and these are used to establish the range and resolution of the instrument. For push-broom design imagers [9,30], where a vertical slice of the scene is captured while the system scans in the other spatial dimension, any change in alignment between the slit, grating and imaging optics of the system causes the spectral calibration to drift. This is because the spectrum of the scene alters and is no longer projected onto the same region of the FPA. The probability of this is greater for low-cost systems, where mechanical rigidity is traded for ease of production and reduction in price; especially where the system is being deployed for long periods of time in a field environment.
In situ calibration is ideal for any instrument because it reduces the probability of drift in the instrument between the measurement and the calibration. However, it is not always practical or even possible to perform an in situ calibration due to the need for extra equipment and the subsequent increase in measurement duration and post-processing.
Our solution to this problem is a ground-truth in-scene reference target. This is imaged simultaneously with the object of the imaging providing a known spectral reflection. The target is three colours, red–green–blue, each of which have had their reflection spectrum measured beforehand with a spectrometer (Thorlabs CCS200). A comparison of the ground-truth reflection spectrum to the measured, uncalibrated spectrum from the instrument allows for the hyperspectral image to be calibrated. Specific features in the measured spectrum relate to those of the ground-truth spectrum and provide reference points for spectral calibration.
There are many sources of systematic error in a hyperspectral image. For example, the spectral response of silicon is temperature dependent [33]. More importantly, the light source that illuminates the scene is not spectrally flat, which introduces a spectral bias and can vary significantly with time in the case of natural light [34]. The in-scene reference determines, and removes, the spectral bias inherent in raw hyperspectral images. The removal of the spectral biases on the measured reflection spectrum is shown in our results to be robust to different sources of illumination. This is demonstrated in this work for natural light, LED illumination and incandescent light.
In this work, we utilised the ultra-low-cost system described by Stuart et al. [9] to highlight the existing limitations of handheld scanning techniques before presenting an innovative solution to these problems and demonstrating the potential of the instrument as a handheld hyperspectral imager in a range of environmental monitoring applications. An in-scene reference target and an algorithm coded in MATLAB for vertical and horizontal spatial correction are used alongside an in situ light-source-independent spectral calibration. The result is a spatially accurate hyperspectral image which is spectrally calibrated, captured with a low-cost, fully handheld, and portable smartphone hyperspectral imaging system. This provides a novel, low-cost alternative to existing hyperspectral imaging techniques and can be applied to a wide range of handheld imaging applications that have been hitherto limited by spectral and spatial distortions.
Figure 1 shows a brief overview of the stages detailed in this work in the form of a workflow diagram. This describes the steps sequentially as they were performed during the work, but not necessarily the order they are covered in the body of the work.

2. Materials and Methods

2.1. Image Acquisition

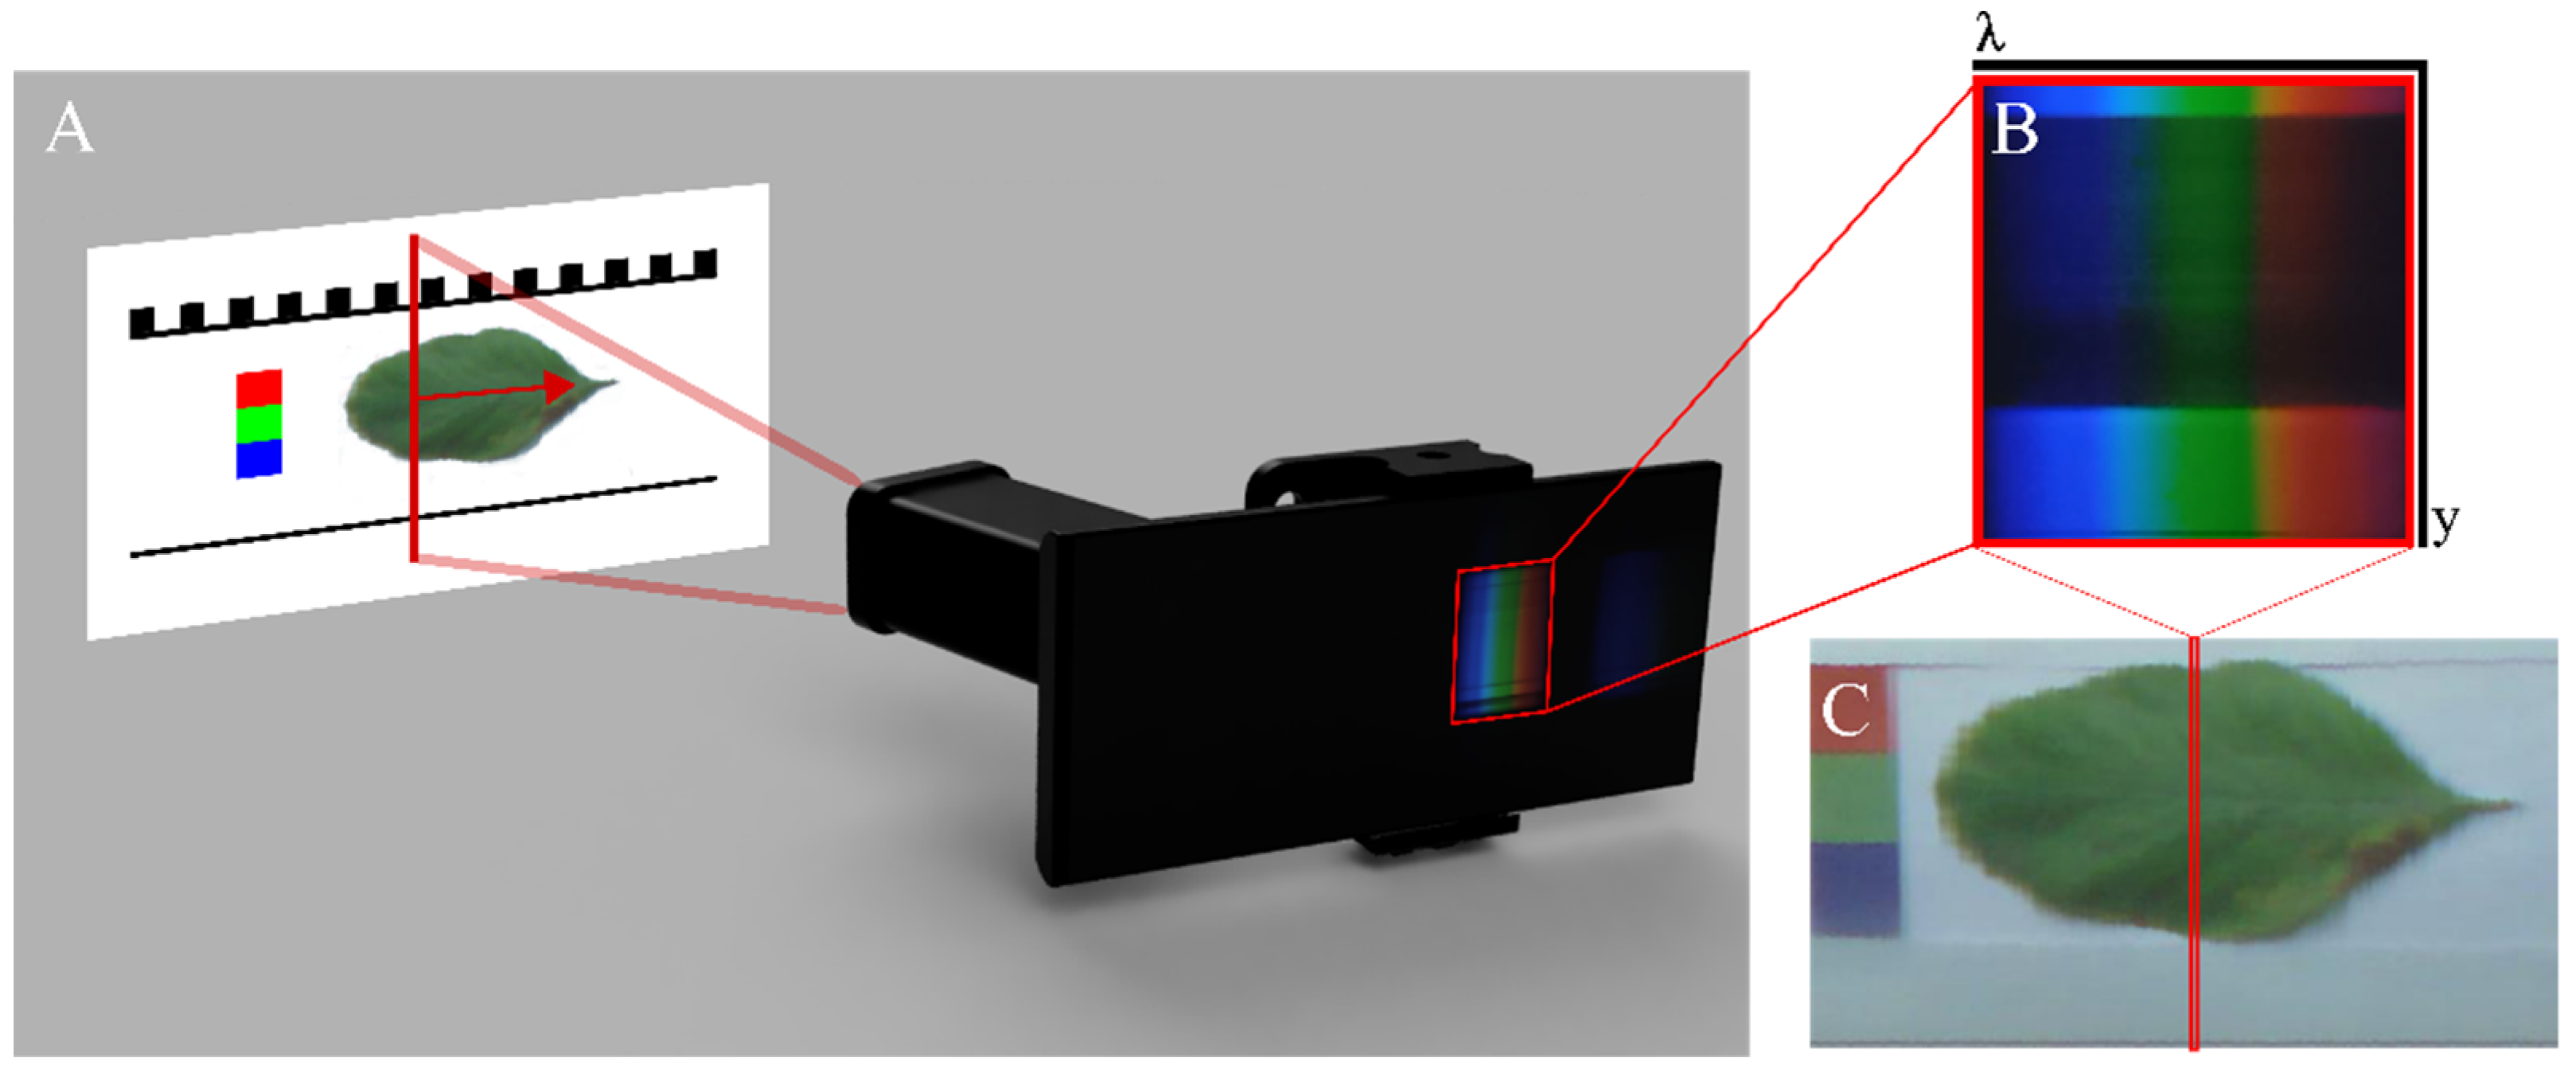
A smartphone-based hyperspectral imaging system was used throughout this work. The system has a 14 nm full width half maximum spectral resolution and a spectral range of 400–700 nm. The field of view of this instrument is determined by the slit height and scan duration. The system was the same system characterised and presented by Stuart et al. [9] and a more detailed breakdown of this instrument and its components is available in that work. The hyperspectral imaging system used in our developments was a push-broom style scanning system, utilising the two spatial dimensions within the FPA of the smartphone camera to capture a vertical ‘slice’ of a scene in the spectral plane. A series of such slices are acquired at 30 frames per second by the FPA and combined to produce a hyperspectral image by way of a translational scan of the full scene. Each frame captured by the camera corresponds to the visible spectrum of one of these vertical slices of the image, as shown in Figure 2. A typical scan duration was between 6 and 12 s for an object at a working distance of 40 cm.
Once the full scene had been scanned, each column of pixels in the captured spectrum was assembled into a series of images. Each of these corresponded to a different band of the visible spectrum. This formed a data cube; a stack of images where the x–y axes relate to spatial dimensions and the third axis relates to the spectral plane. This idea is illustrated in Figure 3. A colour image could be created as a convenient reference by selecting three images from the red, green, and blue parts of the spectrum and using these as colour channels.
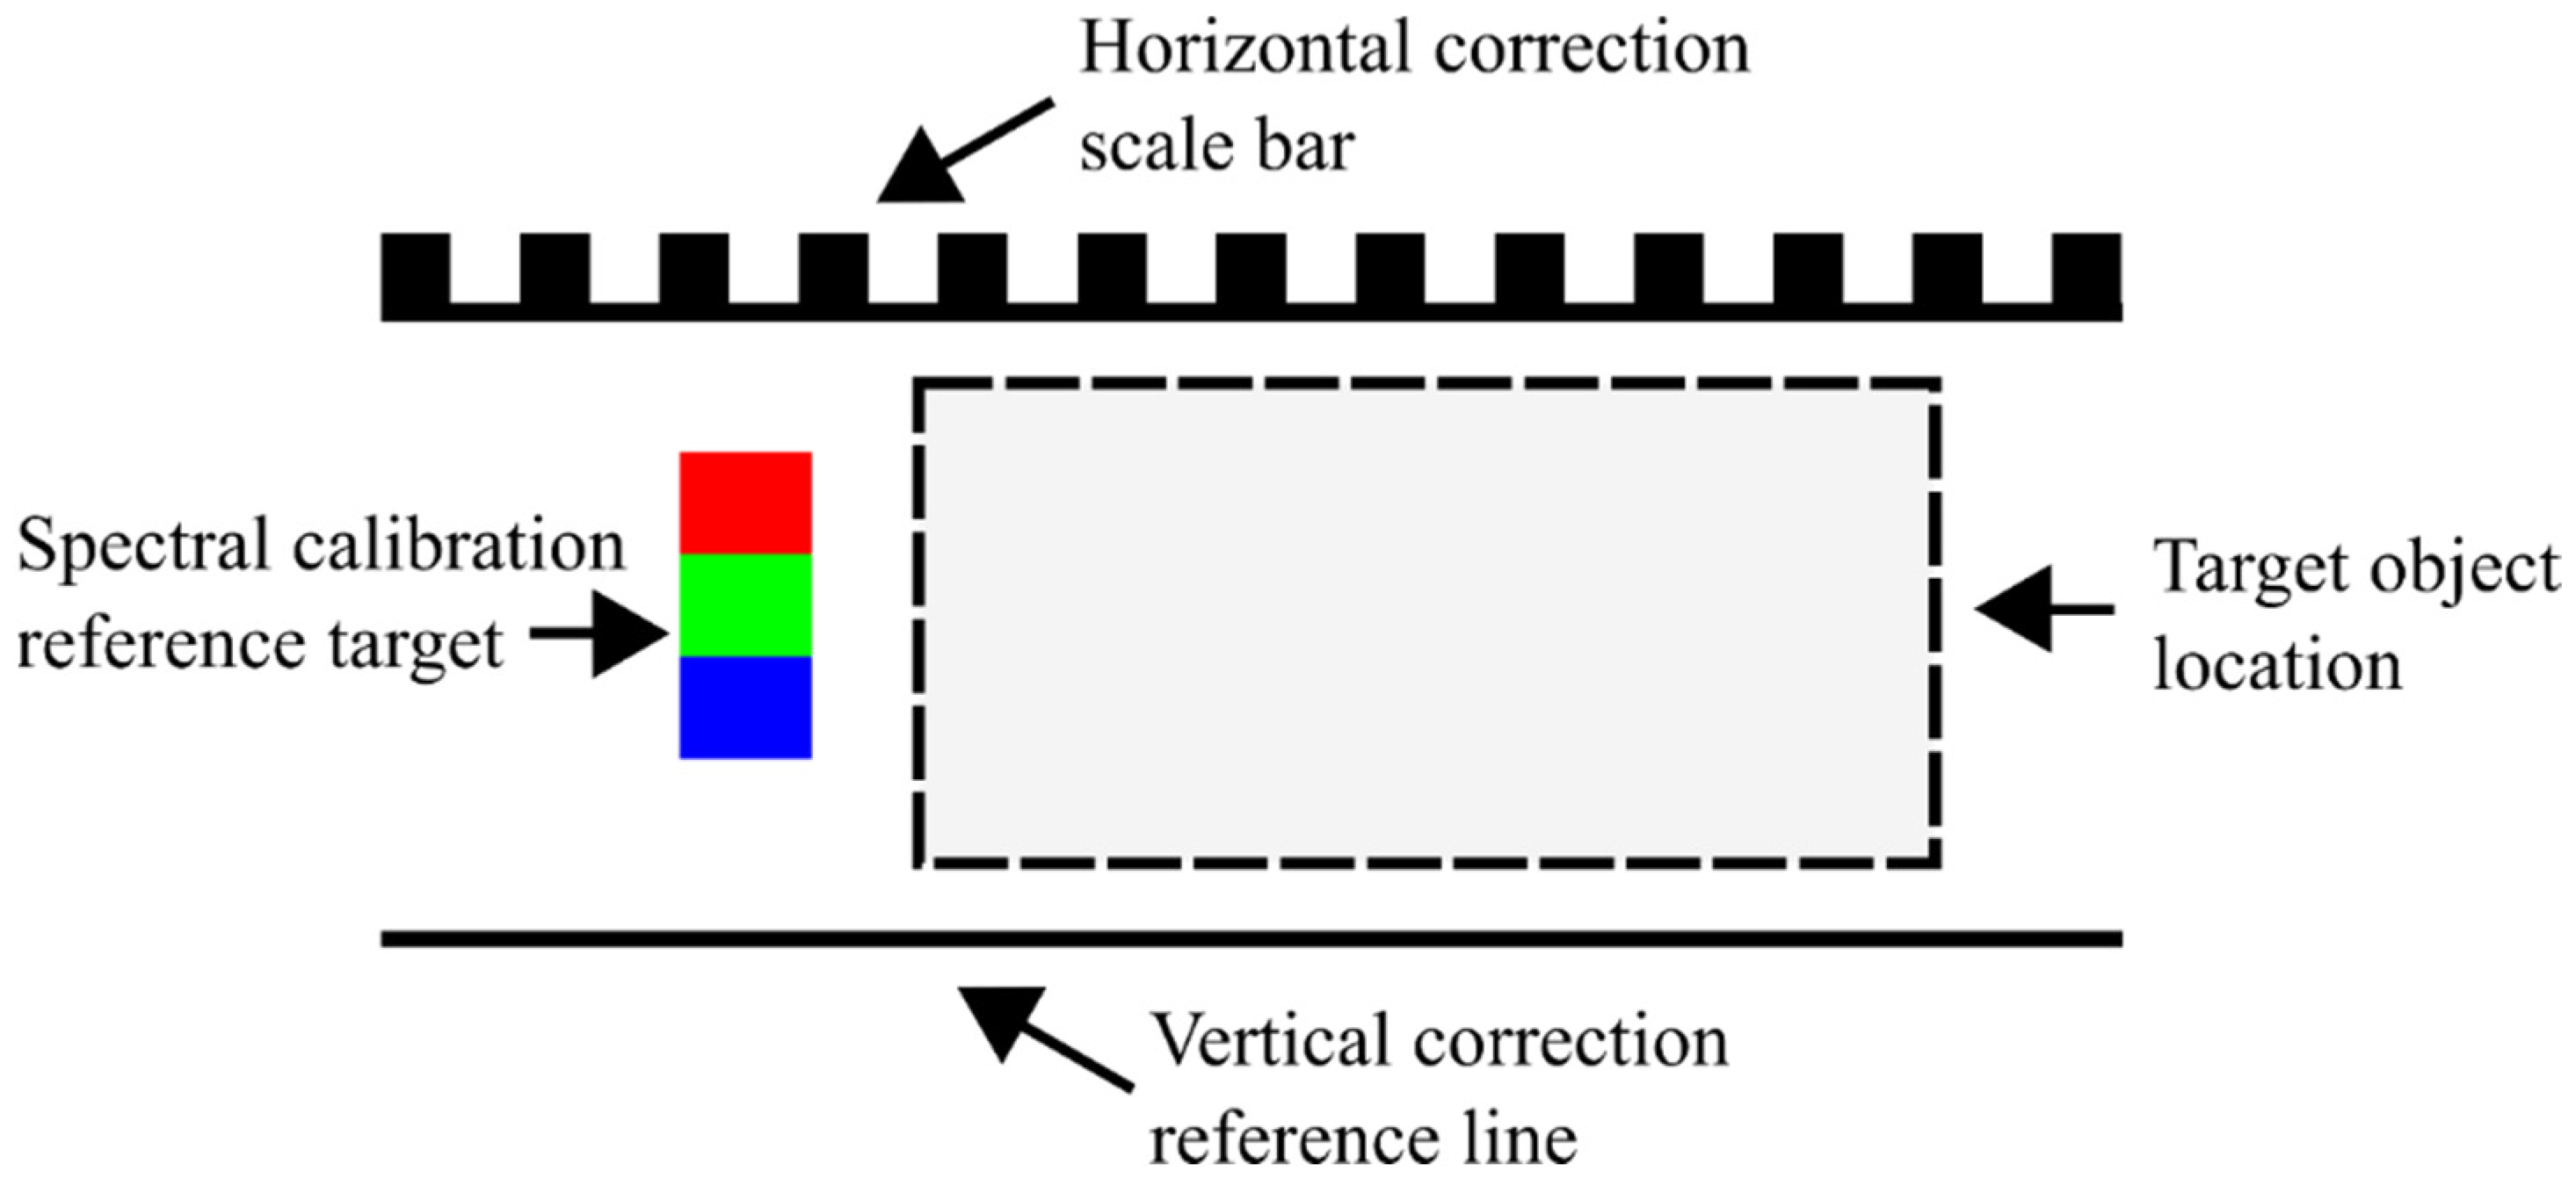
To obtain a hyperspectral dataset using our handheld setup, the target object was placed within the “target object location” section of a calibration card, as shown in Figure 4. The vertical correction reference line, located at the bottom of the calibration card is a straight line that runs parallel to the scan direction. This was used to determine the amount of vertical distortion within a captured scene. The line will deviate in the output images proportionally to the amount that the scanner deviates from the ideal path. A correction algorithm written in MATLAB was then used to carry out a correction. The calibration card was printed on a sheet of A4 paper for this work.
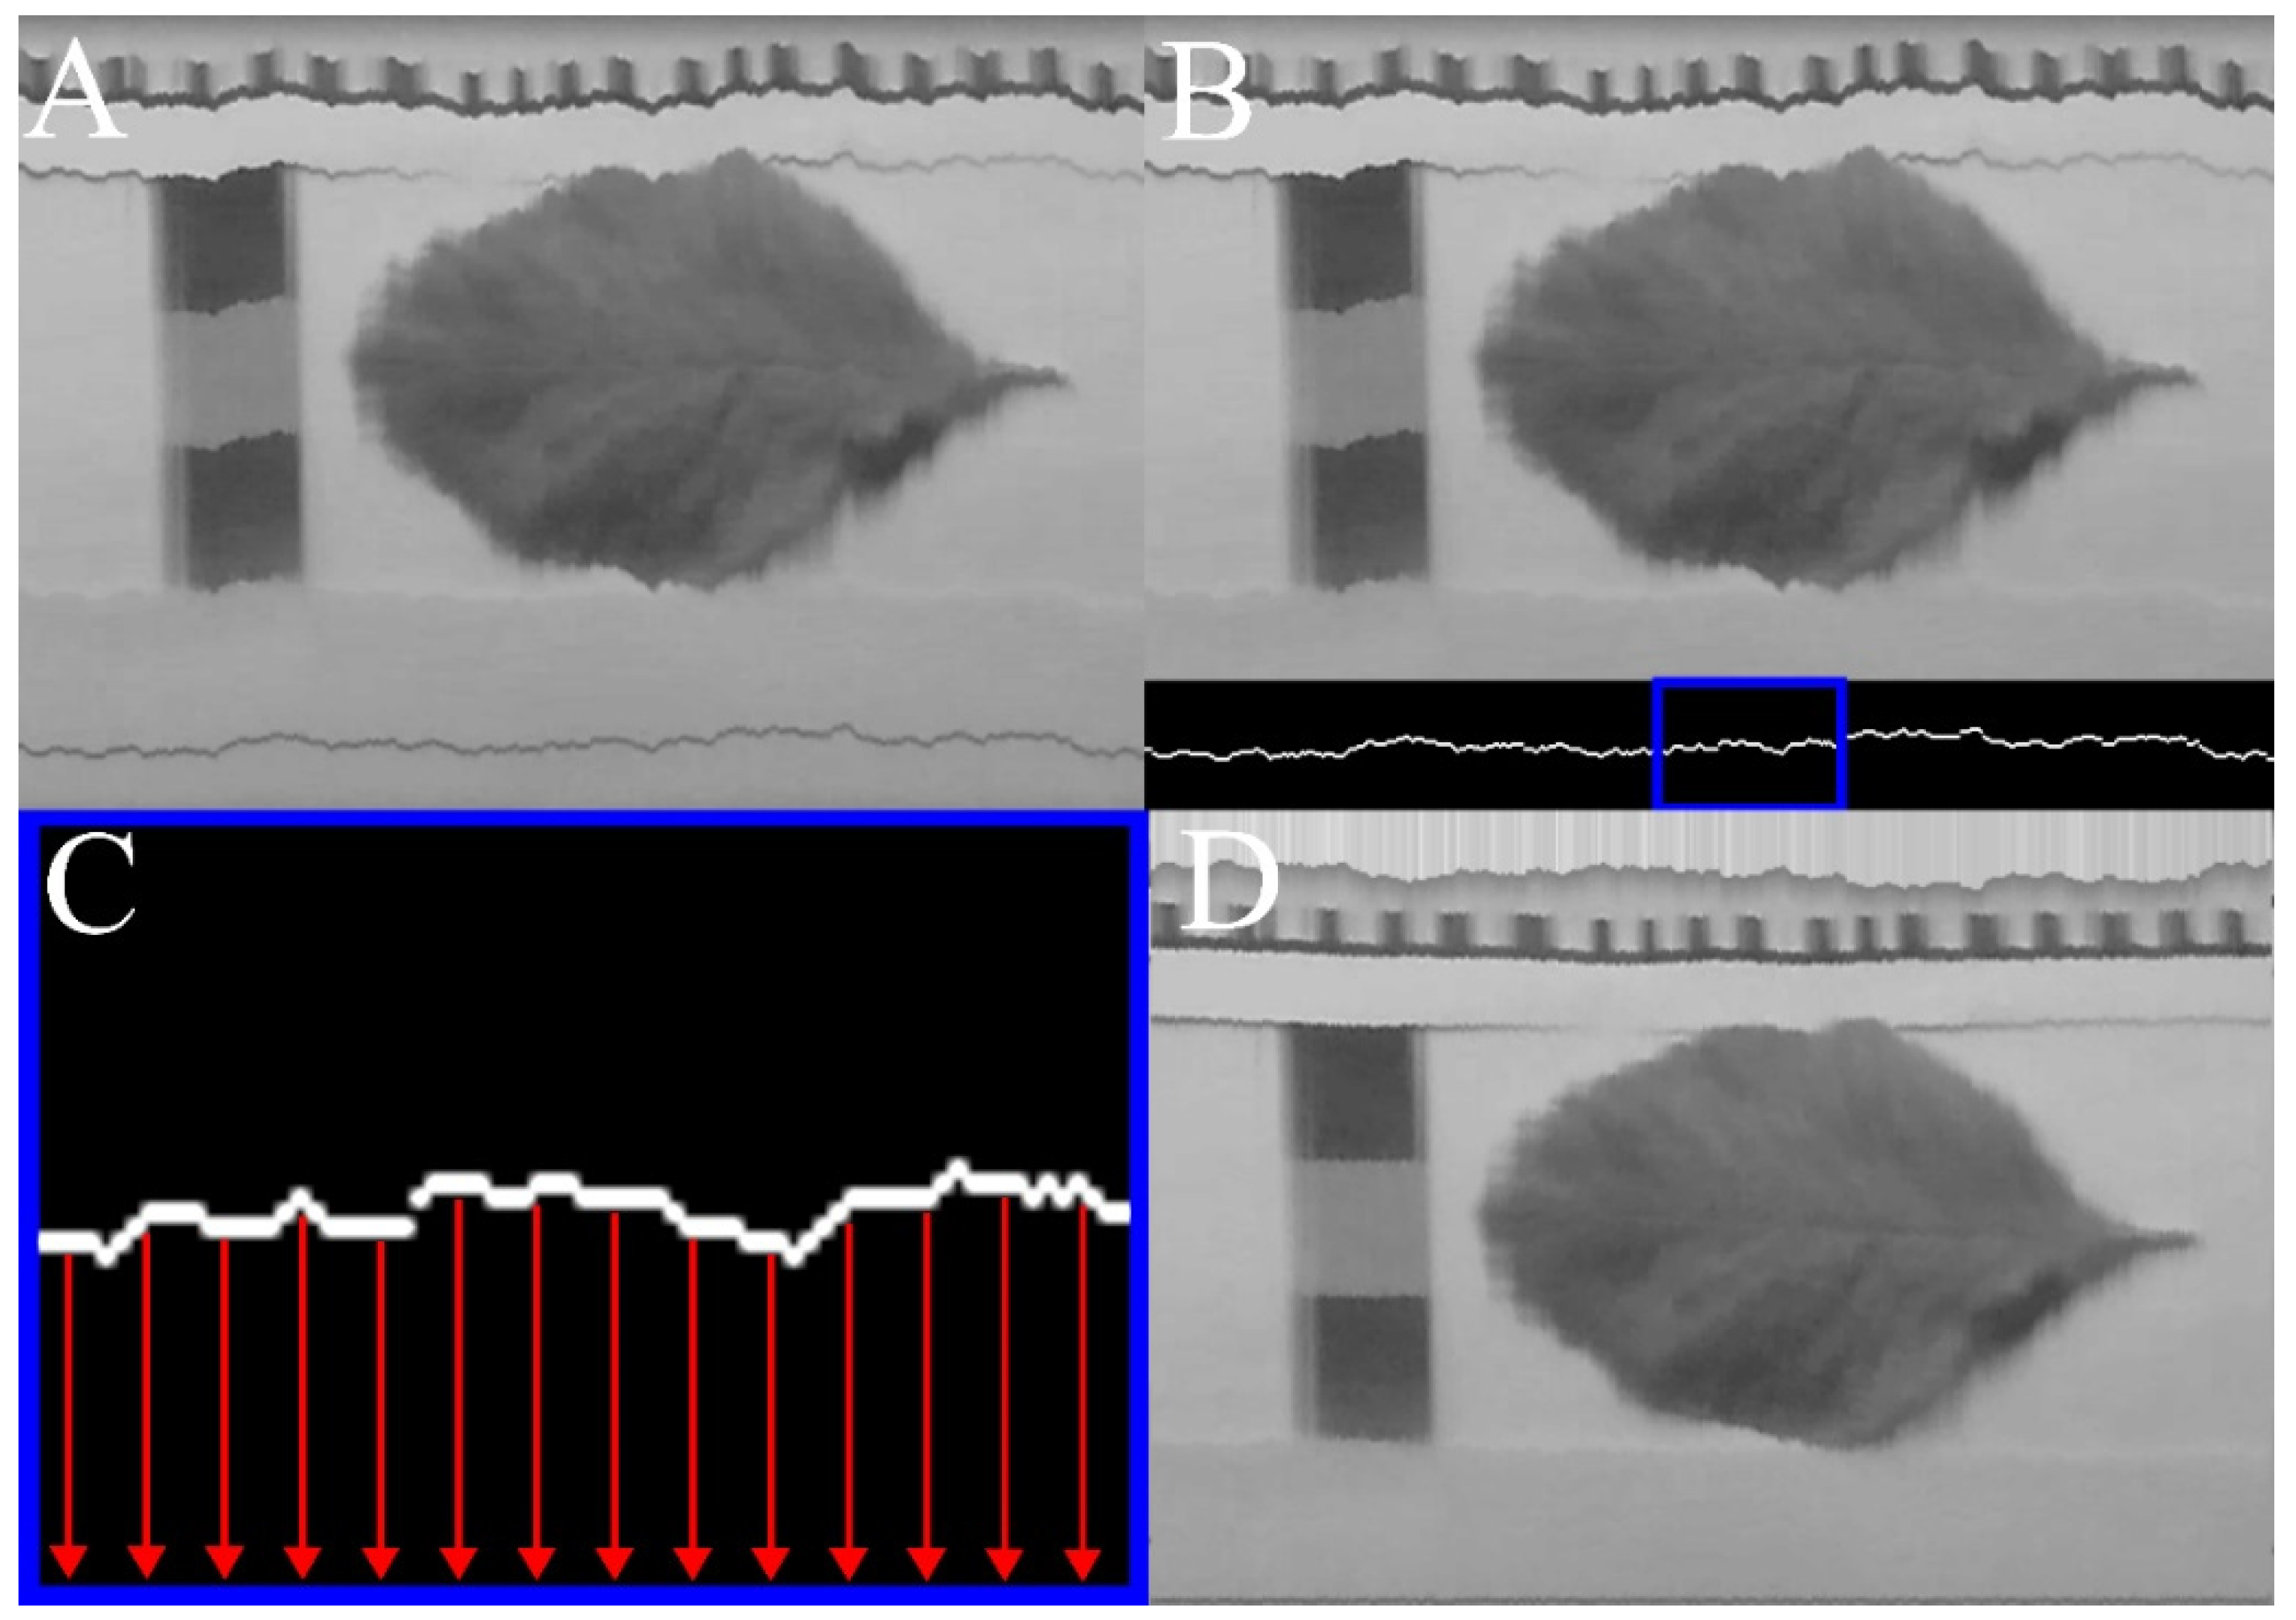
The bottom section of the image was thresholded according to the minimum brightness value of the column in question. This allowed the distance in pixels that the line had deviated from straight (the y-deviation value) to be measured for each x-value of the line-mask. Each column of pixels was then shifted down by the corresponding y-deviation value. Figure 5 show this process visually in stages.
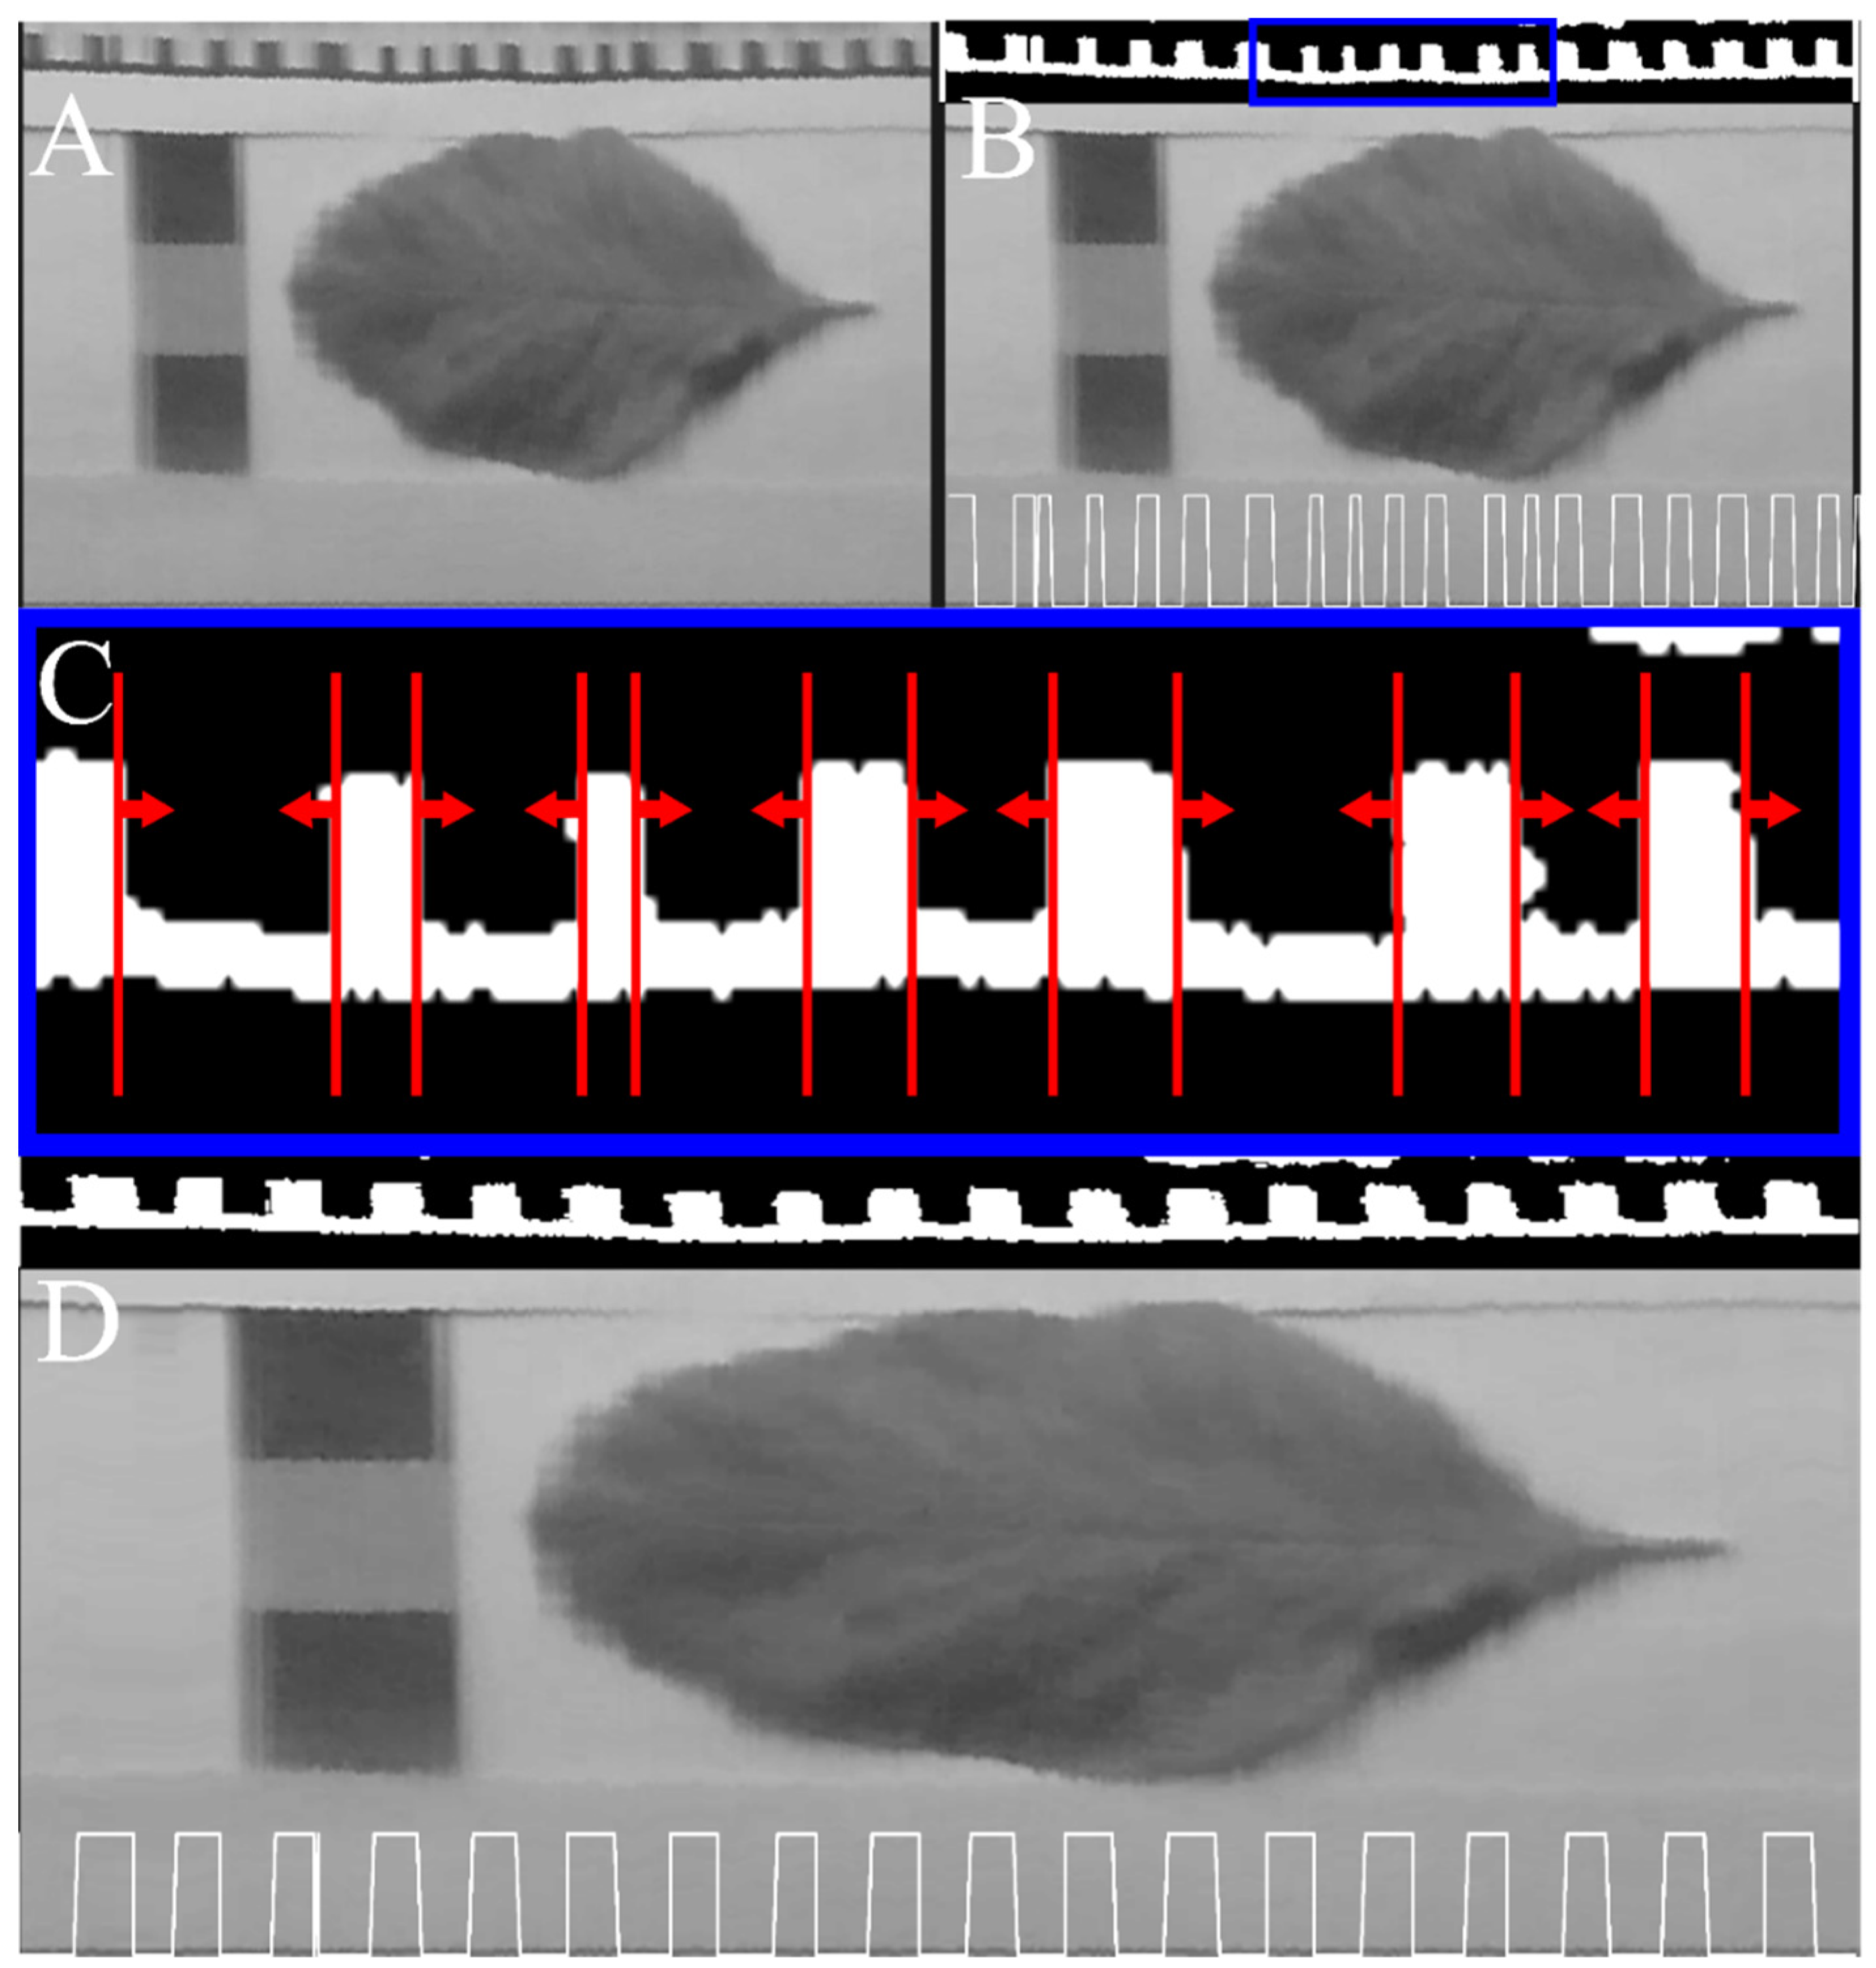
The horizontal correction scale bar was used to determine the compression or expansion of the image due to the varying velocity of the scan along the scan direction. It was comprised of alternating black and white squares and the widths of these squares varied with scan speed. The top region of the images was thresholded to produce a mask which allowed the widths of the squares to be measured for each square. A line profile in MATLAB allowed the widths of the black and white thresholded regions to be quantified in pixels. The threshold value was half the height of the top hat function produced by taking a line profile of the horizontal correction scale bar and is expressed in Equation (1):
Threshold = mask min + mask max mask min 2
where mask min and mask max were the minimum and maximum values of the selected region, respectively. The image was then sliced into vertical segments of widths corresponding to the widths of the squares of the horizontal correction scale bar. Each of these slices was then automatically resized using the imresize function in MATLAB to have width equal to that of the height of the horizontal correction squares. The resized image slices were then recombined to produce the corrected images. This corrected for the horizontal distortion induced by non-constant scanning speed. The steps of this process are shown visually in Figure 6.

2.2. Bias Correction

The images of the data cube needed to be sensor-bias corrected before they could be spectrally calibrated. The dark signal (signal present due to the offset voltage of the sensor, thermal noise, etc.) was subtracted RGB channel-wise to dark correct the images.
The resulting measured signal in each image was dependent on many influences as shown below in Equation (2) below:
S image ( λ , x , y ) = QE ( λ ) × T Optics ( λ ) × T Bayer ( λ ) × Q e ( λ ) × R object ( λ , x , y ) × G eff ( λ )
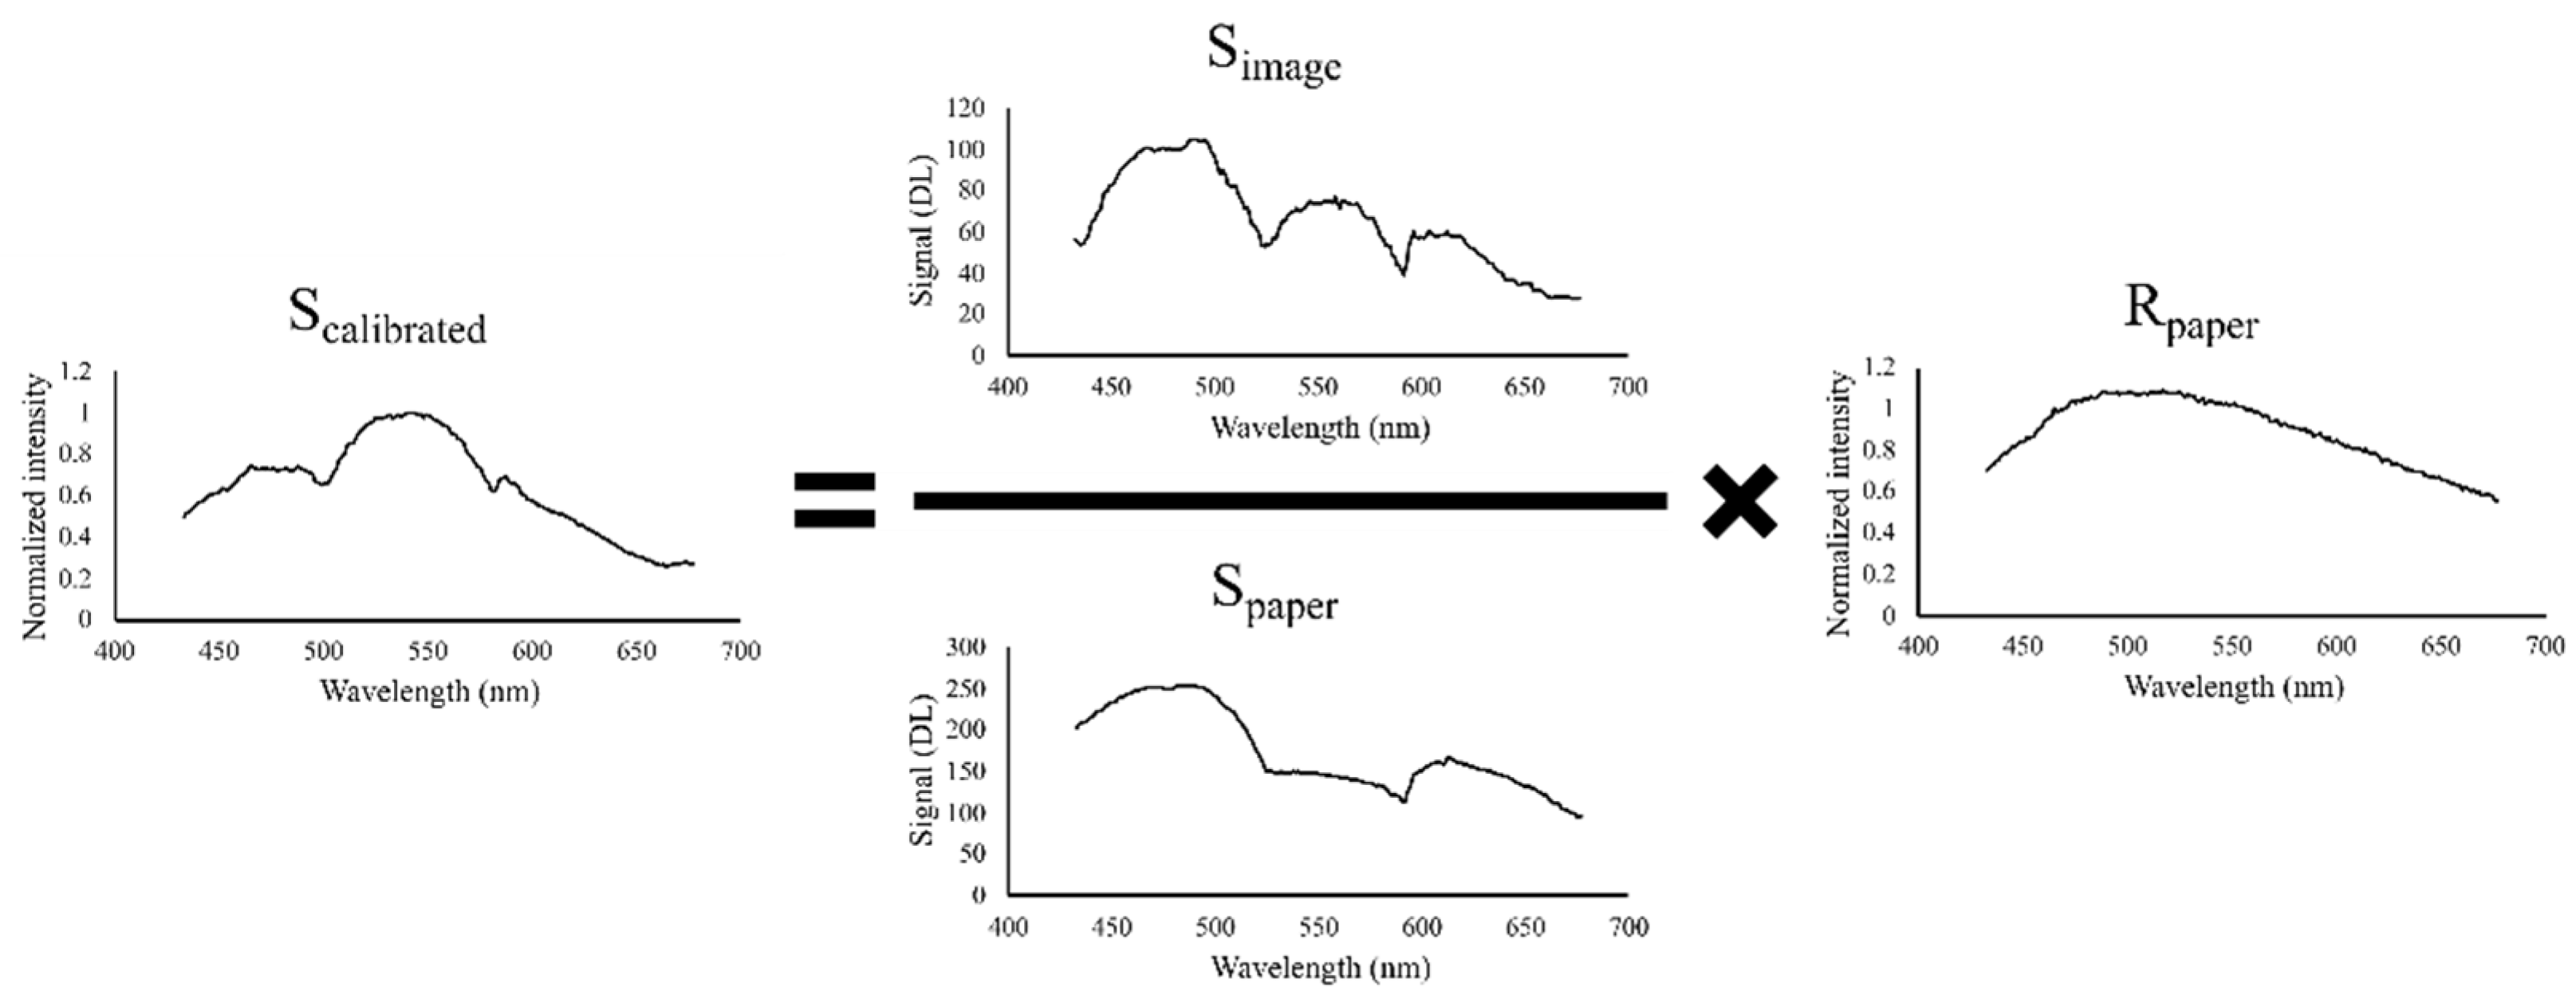
where S image is the measured signal in an image, QE is the quantum efficiency of the silicon sensor, T Optics is the spectral transmission of the optical system, T Bayer is the spectral transmission of the Bayer filter on the sensor, Q e is the spectral radiant energy from the light source, R object is the spectral reflectivity of each point in the scene and G eff is the grating efficiency. Ideally, hyperspectral images are a measure of the spectral reflectivity only. A ratio of the measured signal at each point in the image to the signal at a point in the scene, specifically a white point on the paper test card, was taken to achieve this. This result is expressed in Equation (3) below:
S calibrated ( λ , x , y ) = S image ( λ , x , y ) S paper ( λ ,   x ,   y ) × R paper ( λ )
where the ratio must be multiplied by the reflection spectrum of the paper, R paper , because its inverse was introduced when the ratio was taken. This was achieved after the spectral calibration (Section 2.3) had been performed but is shown here because it was the last stage of the bias correction. All the other terms cancelled because they were present and equal in both signals and only the reflection spectrum of the object at a point ( x , y ) in the image remained. This is illustrated in Figure 7.

2.3. Spectral Calibration

The methodology described above produced an uncalibrated hyperspectral image, corrected for light-source bias and sensor bias. The images were then calibrated for wavelength, which was achieved through the use of an in-scene reference.
The spectral calibration reference target shown in Figure 4 was used to calibrate the images after spatial correction and bias correction with the reflection spectrum measured using a spectrometer (Thorlabs CCS200). The target was illuminated with a broad-spectrum white LED and the reflection spectrum of the red, green, and blue sections of the target were measured. The LED light source emission spectrum was then measured and the reflection spectra were corrected as per Equation (4).
R corr = S RGB S LED
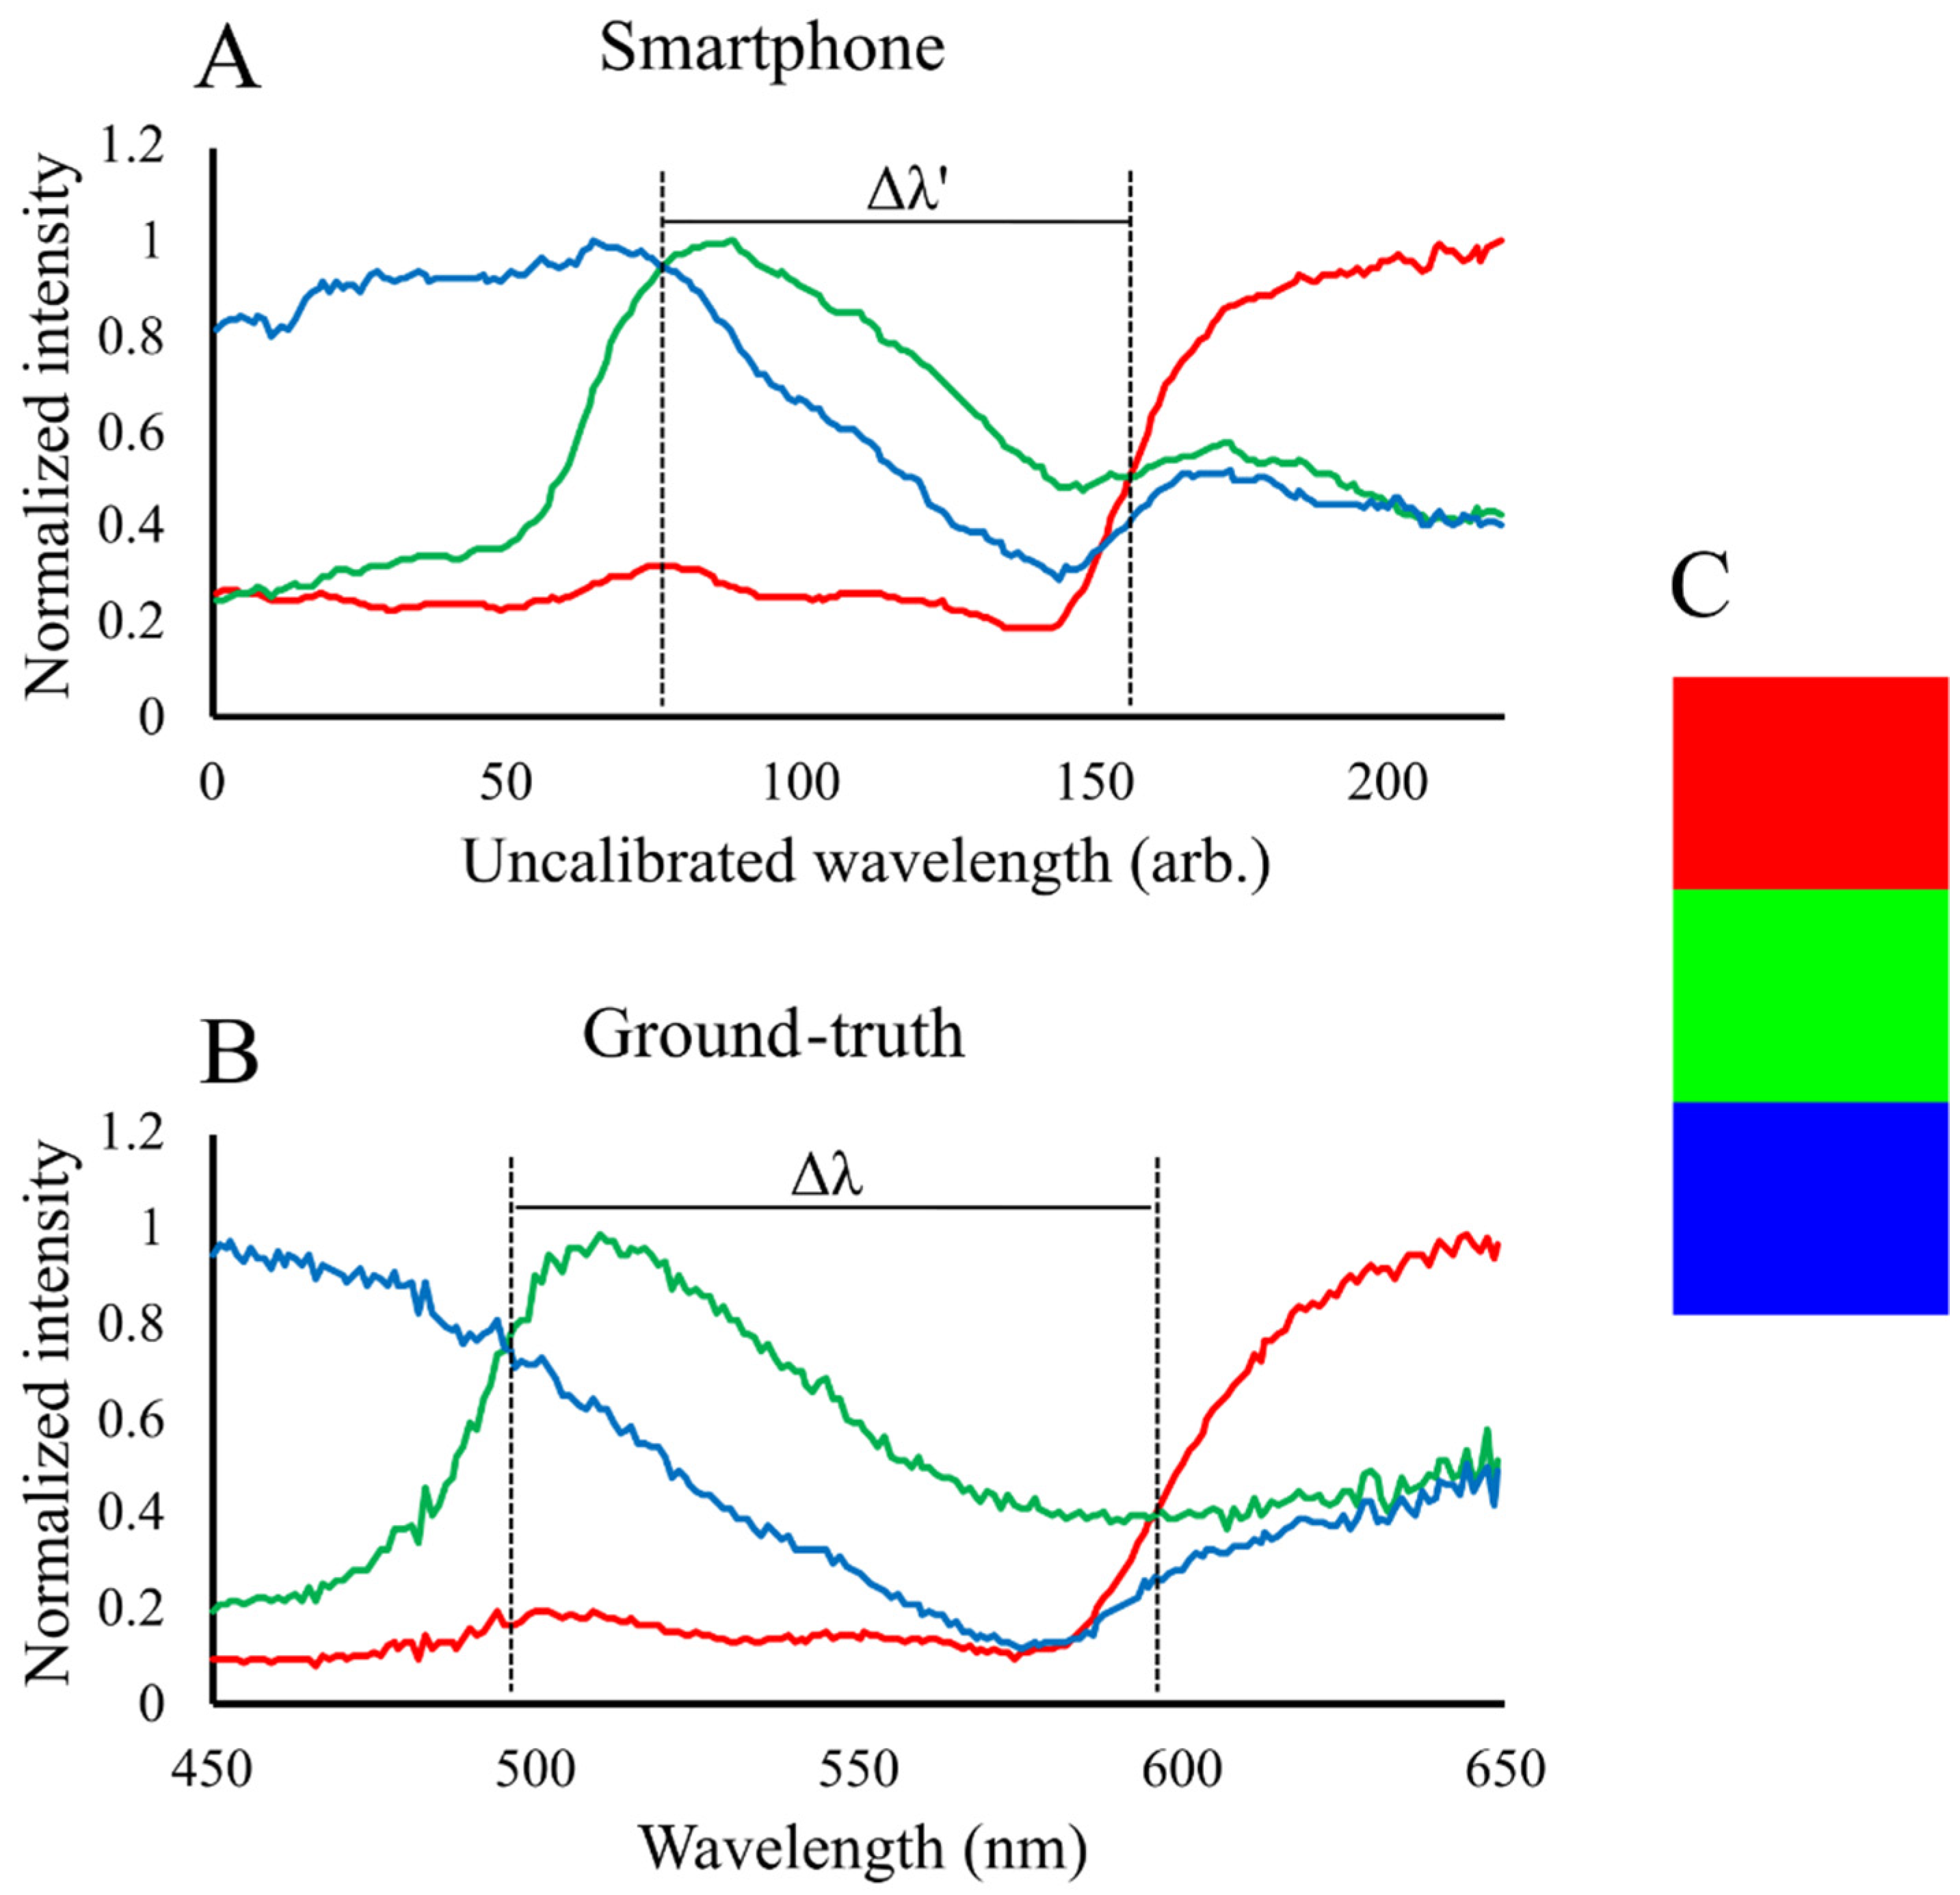
where R corr is the true reflection spectrum of the spectral calibration reference target section, S RGB is the measured reflection spectrum of the test card section and S LED is the measured signal of the emission spectrum of the light source. R corr was then normalised to unity for each colour section of the spectral calibration reference target. After the data cube was assembled, the normalised, ground-truth intensity for the spectral calibration reference target could be compared with the calibrated spectra of the spectral calibration reference target. The crossover points between blue and green and green and red were recorded from the calibrated spectra as 495 nm and 596 nm, respectively. These features could be identified in the uncalibrated spectra and gave known points to interpolate between, and extrapolate from, to provide quantitative wavelength values for each image.
The light source correction could not be fully applied until the spectral calibration was complete; the paper’s reflection spectrum could not be multiplied by the data until there was a 1:1 wavelength correspondence. However, the ratio of S image and S paper was still taken, and the reflection spectrum of the paper was introduced to the ground-truth reflectance spectrum of the spectral calibration reference target. Both the ground-truth and smartphone-measured reflectance spectra of the spectral calibration reference target had the influence of the inverse reflection spectrum of the paper. Figure 8 shows a comparison of the S image / S paper ratio signal and the lab-measured spectral reflection of the spectral calibration reference target with the ©nverse of the paper’s reflection spectrum introduced.
The widths of Δλ’ and Δλ were used to calculate the wavelength increment between images in nanometres by taking the ratio of Δλ to Δλ’. This increment was then applied to each image from the starting point of the known point at 495 nm and allowed a wavelength value to be assigned to each image in the data cube, thus spectrally calibrating the data.

3. Results

The robustness of the spatial correction to operator shake is shown in Figure 9. The image from the data cube is significantly less recognisable before the spatial correction was applied. The corrected image shows how effective the spatial correction algorithm can be, even when supplied with images heavily affected by operator shake. The improvement is sufficient as to provide context to the spectral data. This is critical for field use where capturing images by hand in potentially inhospitable environments means operator shake is a serious problem. The spectral data is not affected by the spatial correction, being able to relate spectral information to a spatial reference within the image is key to extracting the relevant information from the hyperspectral image.
Although additional optics in the imaging system could produce better spectral and spatial resolution, they significantly increase the cost of the system, therefore reducing the low-cost accessibility of the instrument. Figure 9 presents the utility of the spatial correction. The scan time is short and so the horizontal resolution is limited. This demonstrates that spatial correction significantly improves the utility of the handheld system by providing better context for the spectral information allowing for more convenient retrieval of spectral artifacts of interest within the scene.
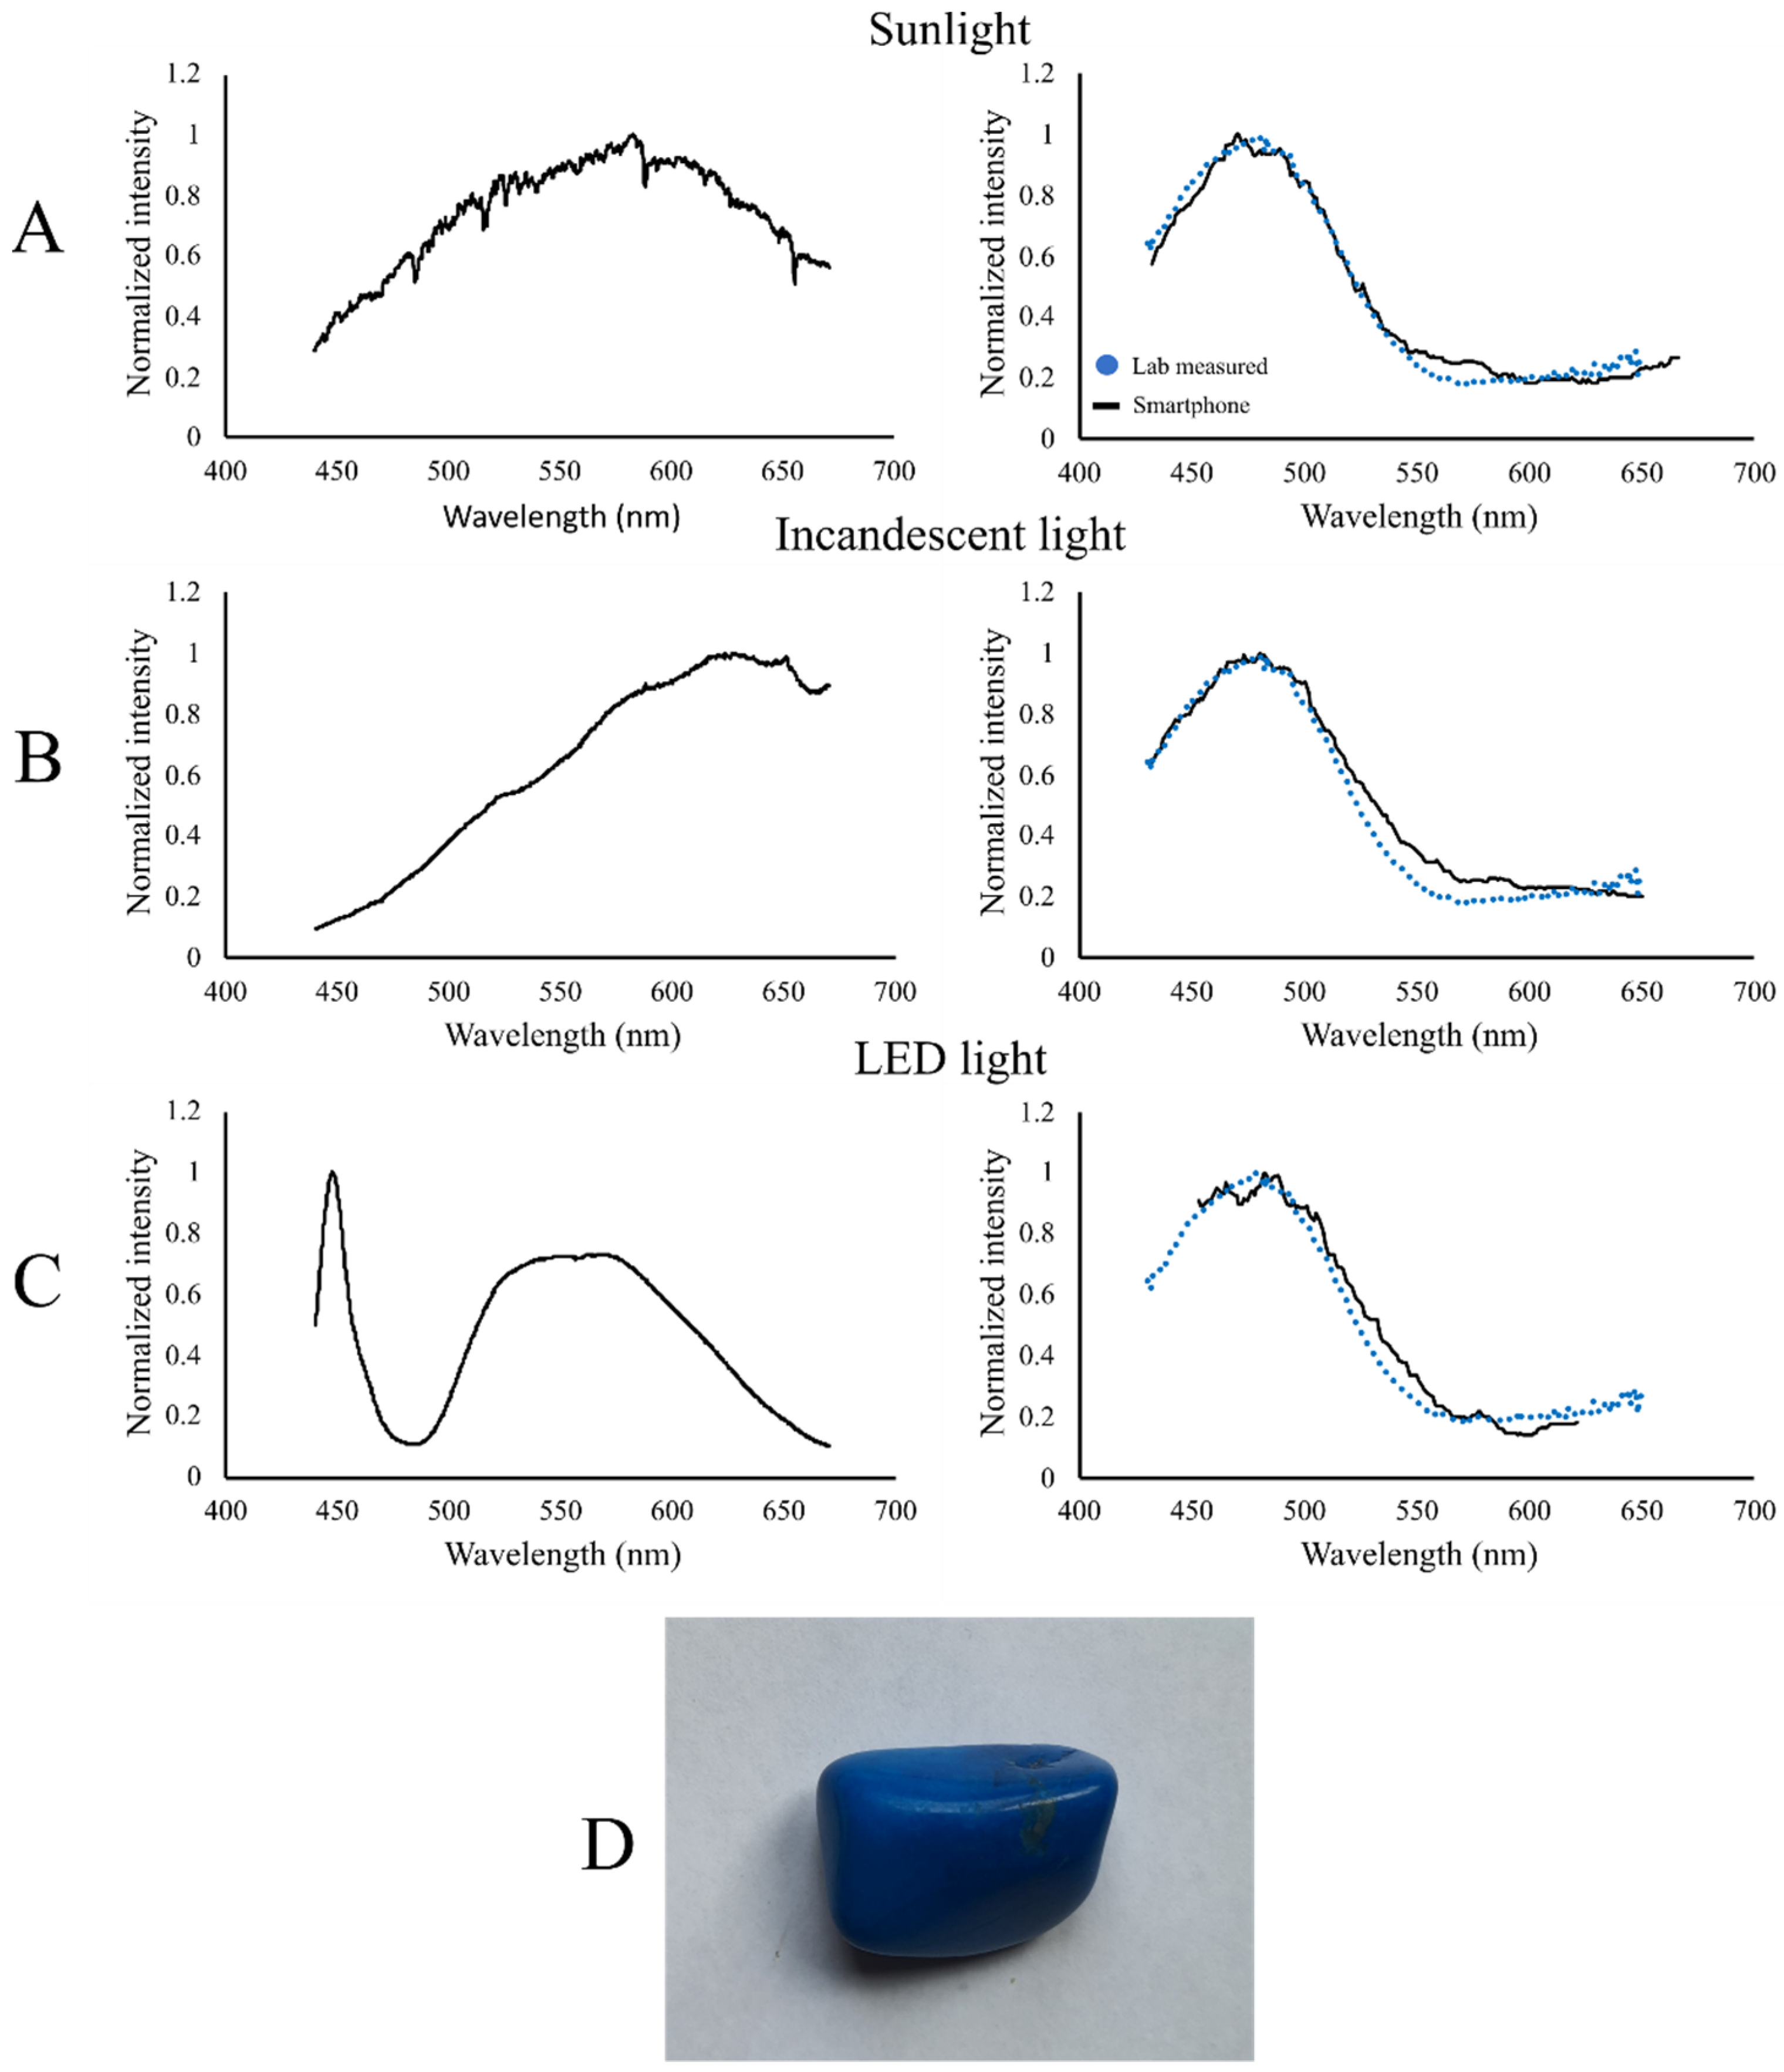
The instrument’s light-source-independent spectral calibration is demonstrated in Figure 10. The reflection spectra of a sample of lapis lazuli are shown, measured with illumination from three different light sources. ©e reflection spectrum as measured with the Thorlabs CCD spectrometer as a reference as the blue dotted line. All three of the measured spectra from the smartphone show agreement on the trend of a peak in the blue at 485 nm with a tail off towards the red before showing the indication of an increase towards the near infrared.
The data shown in Figure 10 were captured with a single scan for each light source. The natural sunlight plot shows the closest resemblance to the lab-measured spectrum with a root mean squared error (RMSE) of 0.014 and this is to be expected because it was a more intense light source and provided strong illumination at all wavelengths. The spectrum measured under incandescent illumination shows a closer resemblance to the lab-measured spectrum than does the LED illuminated measurement below 525 nm. However, the LED data have a marginally lower RMSE compared to the incandescent data with a RMSE of 0.0030 and 0.0033, respectively. There is more noise present in the LED measurement indicative of low signal. However, the LED spectrum in Figure 10 shows there are lower levels of illumination across the spectrum when compared to the natural and incandescent illumination spectra. The LED spectrum also contains a strong localised peak at 450 nm; however, this presents in the measured spectrum of the sample only as a slight increase which is within the variation due to noise. All of this indicates a resilience to uneven spectral illumination in our approach to in situ calibration. This demonstrates the instrument’s ability to work effectively in a range of illumination conditions, allowing for accurate spectral calibrations to be achieved in both outdoor and indoor settings. This further demonstrates the utility of this instrument as a whole, as a fully portable handheld hyperspectral imaging device, capable of accurate and robust hyperspectral analysis.

4. Discussion

Example Applications

Hyperspectral imaging is an invaluable tool, benefitting a wide range of environmental monitoring applications [18]. In vegetation monitoring and precision agriculture applications in particular, the need for early and accurate diagnosis of plant stress is critical to the mitigation of crop losses [35,36,37,38]. Furthermore, the accurate and early detection of poor-quality produce can significantly reduce losses due to spoiling products destined for customers and further food production [14,39]. To date, a range of hyperspectral imaging systems have been utilised as effective, non-destructive means of vegetation health monitoring and quality assessment in food products [1,40,41,42].
Hyperspectral imaging provides a non-invasive, rapid means of determining plant quality and health, delivering significant benefits over traditional monitoring methods. The handheld hyperspectral smartphone system further benefits these applications by the user-friendly nature of the instrument and combined with the benefits of the spectral and spatial calibration techniques discussed within this article, this makes it a highly effective accessible hyperspectral imaging system and a powerful tool for accurate quality assessment.
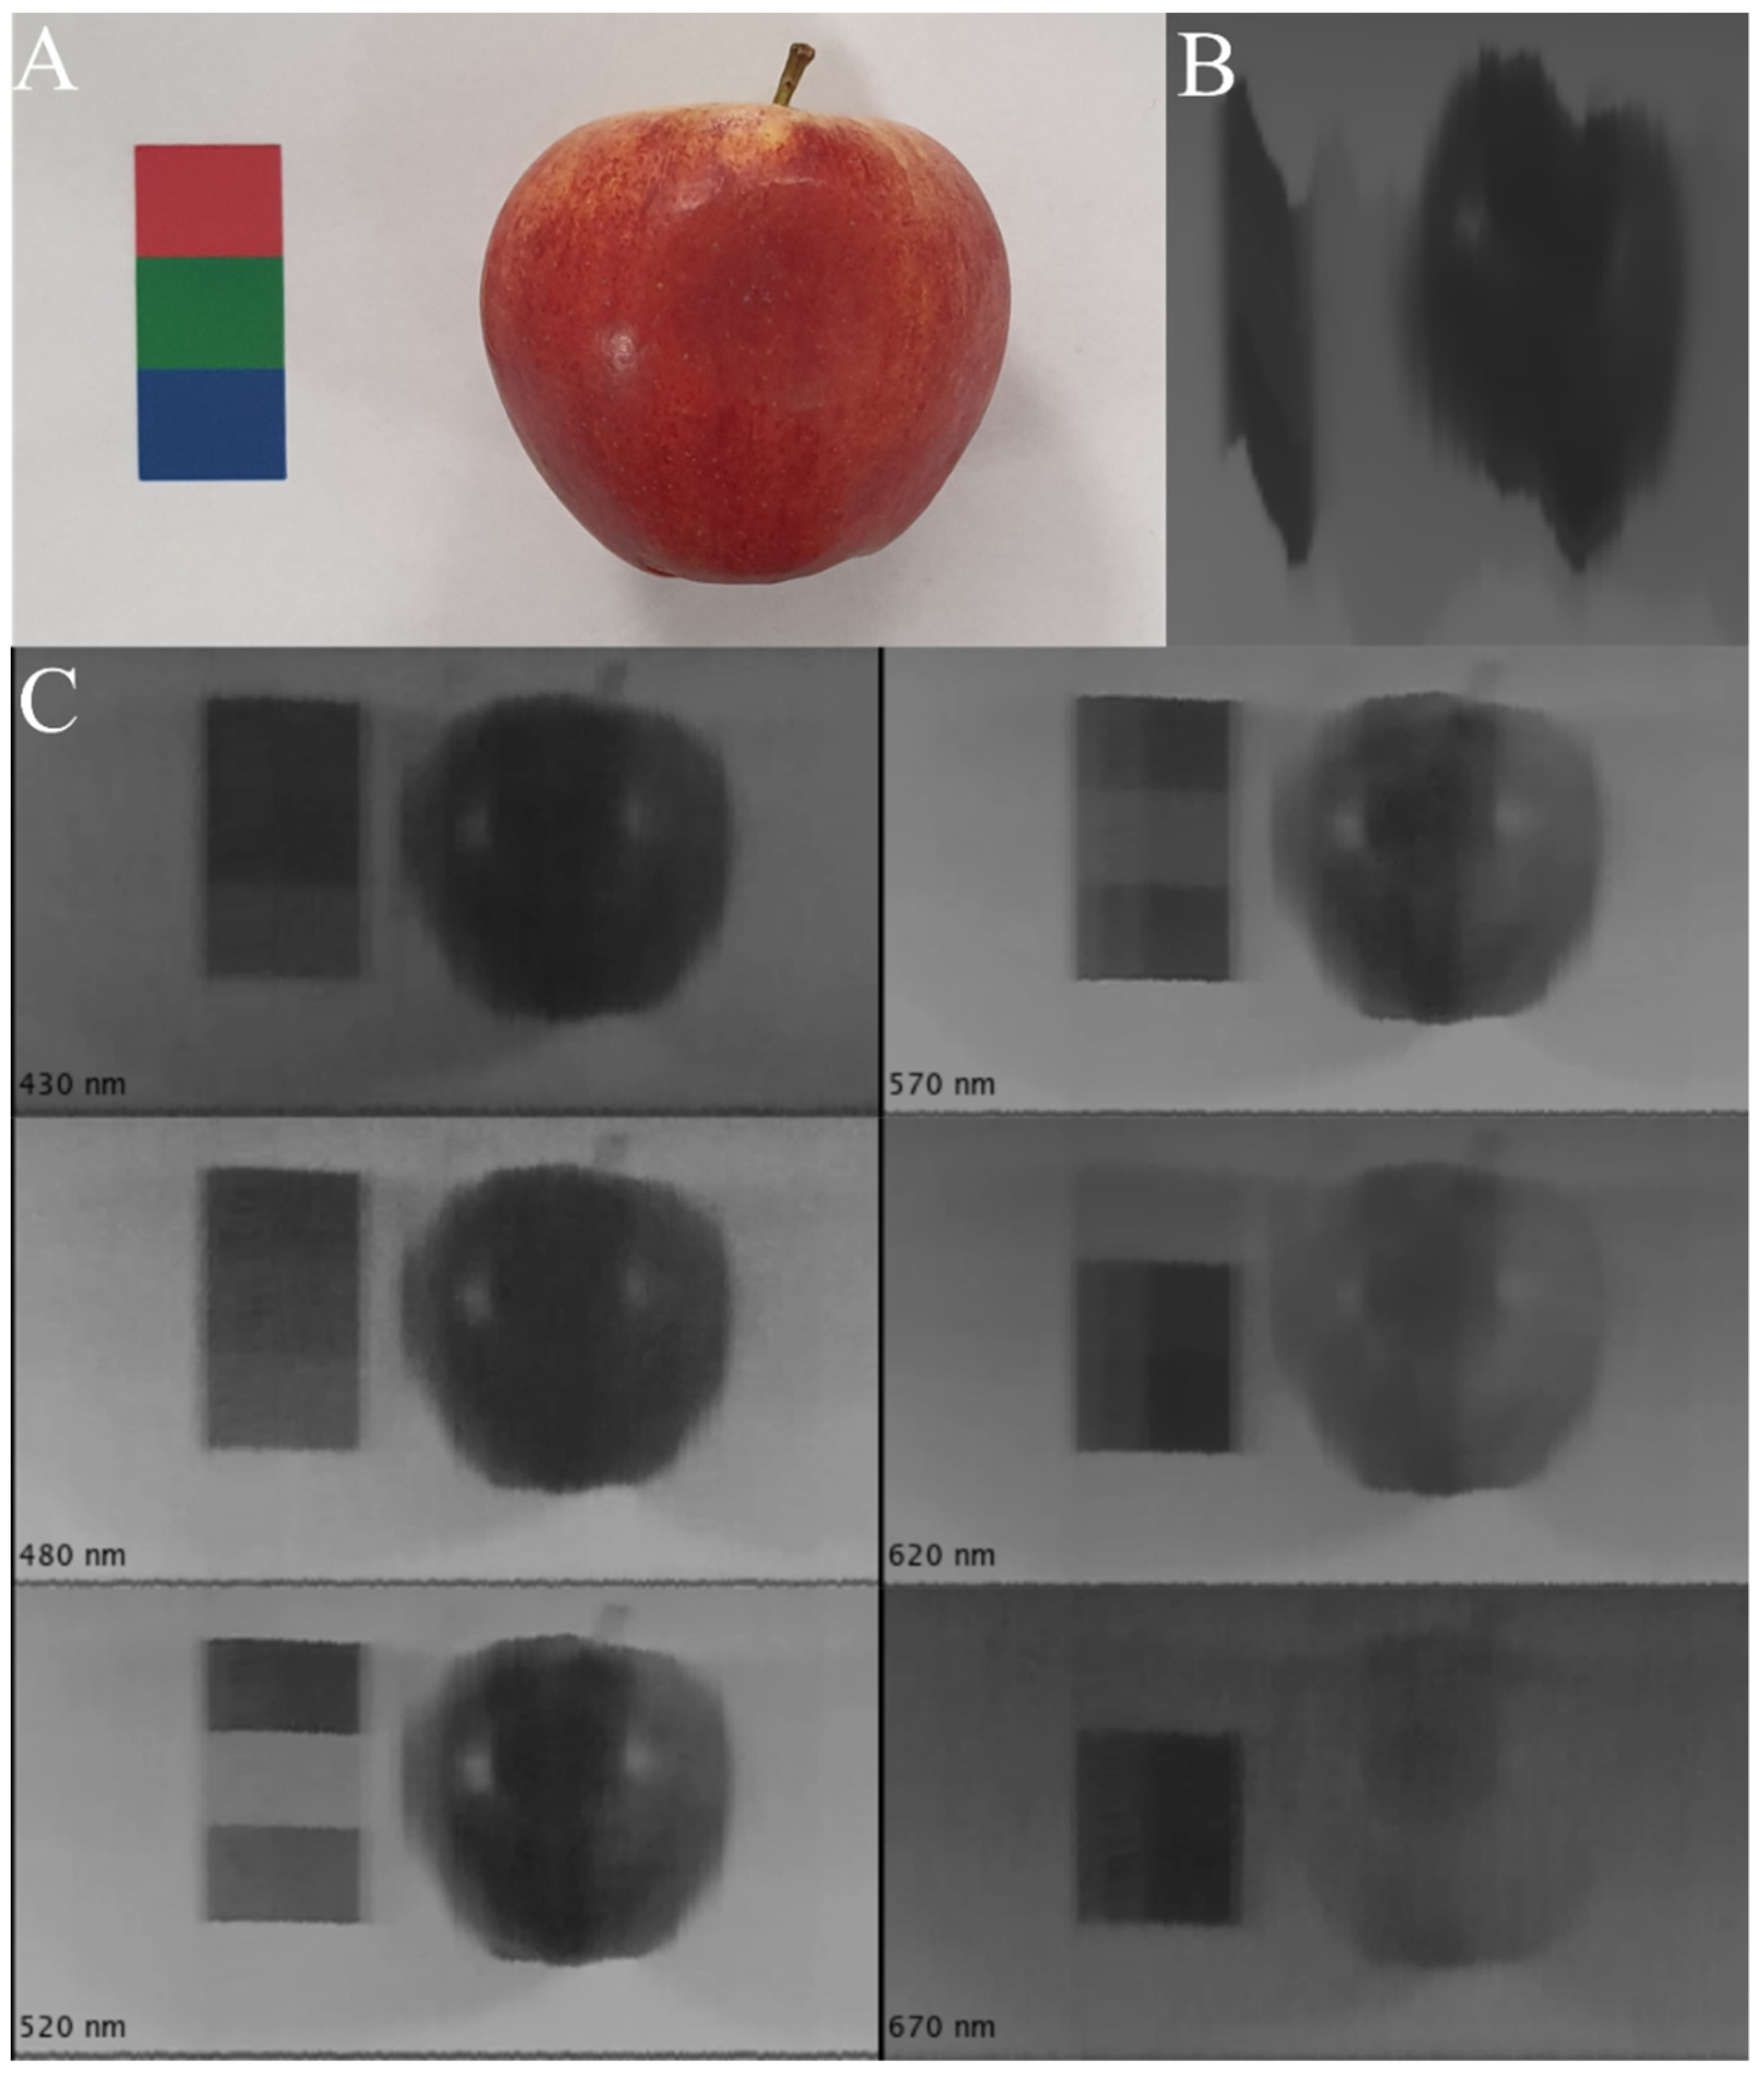
The instrument’s utility as a hyperspectral imaging system in quality assessment applications is shown in Figure 11, where a red Gala apple with bruising damage is used as the target object. The apple has a bruise in its centre which is more apparent at certain wavelengths than others, e.g., 670 nm. This demonstrates the ability of this instrument because it is capable of detecting damage and defects before they become apparent to the naked eye, providing valuable time to prevent the loss of further products within a large batch [43,44]. Figure 11 shows bruising is much more apparent withing the red portion of the spectrum due to the increased reflectivity of healthy tissues at these wavelengths. This can be compared to the reduced visibility, particularly within the blue portion of the spectrum due to the lower reflectance of fruit tissue at these wavelengths [14]. This demonstrates the utility of hyperspectral imaging for the purpose of quality control because the imaging allows for enhanced contrast of certain features that present at specific wavelengths that are lost when imaged using Bayer-filter photography that integrates over wider bands of wavelengths. This is particularly pertinent in fruits with darker pigmentation because the damage can remain undetectable by traditional methods for extended periods, increasing the potential of further losses [45,46].

5. Conclusions

A method for spatially correcting for operator shake and performing in situ spectral calibration in handheld hyperspectral imaging has been reported alongside a demonstration of its application withing the field of fruit quality assessment. This technique dramatically improves the utility of a low-cost, smartphone-based hyperspectral imaging system using a printed in-scene reference card enabling accurate measurements to be taken in the field without need for translation stages. This work broadens the application of low-cost hyperspectral imaging to industries and scientific investigations for which it would otherwise be insufficiently robust to long measurement sessions in the field. The in situ light-source-independent calibration allows for extended field operation while minimising the influence of calibration drift and removing the need for calibration after the imaging has been completed. The foundations have been laid for agricultural and environmental monitoring studies that require non-destructive testing where the availably of data is afforded by the low cost of the systems.

Author Contributions

Conceptualization, M.D.; Data curation, M.D.; Formal analysis, M.D.; Funding acquisition, J.R.W.; Investigation, M.D.; Methodology, M.D. and M.B.S.; Project administration, J.R.W.; Resources, J.R.W.; Software, M.D.; Supervision, J.R.W. and A.J.S.M.; Writing—original draft, M.D.; Writing—review & editing, M.D., M.J.H., M.B.S., A.J.S.M. and J.R.W. All authors have read and agreed to the published version of the manuscript.

Funding

This work was supported by the Engineering and Physical Sciences Research Council (EPSRC) EP/V012126/1 and doctoral training grant scholarship EP/R513313/1.

Institutional Review Board Statement

Not applicable.

Informed Consent Statement

Not applicable.

Data Availability Statement

All relevant data are shown in the paper or could be recreated by following the methodology in the paper.

Conflicts of Interest

The authors declare no conflict of interest.

References

  1. Kim, Y.; Glenn, D.M.; Park, J.; Ngugi, H.K.; Lehman, B.L. Hyperspectral image analysis for water stress detection of apple trees. Comput. Electron. Agric. 2011, 77, 155–160. [Google Scholar] [CrossRef]
  2. Adão, T.; Hruška, J.; Pádua, L.; Bessa, J.; Peres, E.; Morais, R.; Sousa, J.J. Hyperspectral imaging: A review on UAV-based sensors, data processing and applications for agriculture and forestry. Remote Sens. 2017, 9, 1110. [Google Scholar] [CrossRef] [Green Version]
  3. Mahlein, A.; Kuska, M.; Thomas, S.; Bohnenkamp, D.; Alisaac, E.; Behmann, J.; Wahabzada, M.; Kersting, K. Plant disease detection by hyperspectral imaging: From the lab to the field. Adv. Anim. Biosci. 2017, 8, 238–243. [Google Scholar] [CrossRef]
  4. Lu, B.; Dao, P.D.; Liu, J.; He, Y.; Shang, J. Recent advances of hyperspectral imaging technology and applications in agriculture. Remote Sens. 2020, 12, 2659. [Google Scholar] [CrossRef]
  5. Aryal, S.; Chen, Z.; Tang, S. Mobile hyperspectral imaging for material surface damage detection. J. Comput. Civ. Eng. 2021, 35, 04020057. [Google Scholar] [CrossRef]
  6. Lavadiya, D.N.; Sajid, H.U.; Yellavajjala, R.K.; Sun, X. Hyperspectral imaging for the elimination of visual ambiguity in corrosion detection and identification of corrosion sources. Struct. Health Monit. 2021. [Google Scholar] [CrossRef]
  7. Akbari, H.; Uto, K.; Kosugi, Y.; Kojima, K.; Tanaka, N. Cancer detection using infrared hyperspectral imaging. Cancer Sci. 2011, 102, 852–857. [Google Scholar] [CrossRef]
  8. Hadoux, X.; Hui, F.; Lim, J.K.; Masters, C.L.; Pébay, A.; Chevalier, S.; Ha, J.; Loi, S.; Fowler, C.J.; Rowe, C. Non-invasive in vivo hyperspectral imaging of the retina for potential biomarker use in Alzheimer’s disease. Nat. Commun. 2019, 10, 4227. [Google Scholar] [CrossRef] [Green Version]
  9. Stuart, M.B.; McGonigle, A.J.; Davies, M.; Hobbs, M.J.; Boone, N.A.; Stanger, L.R.; Zhu, C.; Pering, T.D.; Willmott, J.R. Low-Cost Hyperspectral Imaging with A Smartphone. J. Imaging 2021, 7, 136. [Google Scholar] [CrossRef]
  10. Aasen, H.; Honkavaara, E.; Lucieer, A.; Zarco-Tejada, P.J. Quantitative Remote Sensing at Ultra-High Resolution with UAV Spectroscopy: A Review of Sensor Technology, Measurement Procedures, and Data Correction Workflows. Remote Sens. 2018, 10, 1091. [Google Scholar] [CrossRef] [Green Version]
  11. Zabalza, J.; Ren, J.; Wang, Z.; Marshall, S.; Wang, J. Singular spectrum analysis for effective feature extraction in hyperspectral imaging. IEEE Geosci. Remote Sens. Lett. 2014, 11, 1886–1890. [Google Scholar] [CrossRef] [Green Version]
  12. Singh, V.; Sharma, N.; Singh, S. A review of imaging techniques for plant disease detection. Artif. Intell. Agric. 2020, 4, 229–242. [Google Scholar] [CrossRef]
  13. Yu, C.; Yang, J.; Song, N.; Sun, C.; Wang, M.; Feng, S. Microlens array snapshot hyperspectral microscopy system for the biomedical domain. Appl. Opt. 2021, 60, 1896–1902. [Google Scholar] [CrossRef]
  14. Stuart, M.B.; Stanger, L.R.; Hobbs, M.J.; Pering, T.D.; Thio, D.; McGonigle, A.J.; Willmott, J.R. Low-Cost Hyperspectral Imaging System: Design and Testing for Laboratory-Based Environmental Applications. Sensors 2020, 20, 3293. [Google Scholar] [CrossRef]
  15. Hagen, N.; Kudenov, M. Review of snapshot spectral imaging technologies. Opt. Eng. 2013, 52, 090901. [Google Scholar] [CrossRef] [Green Version]
  16. Tang, Y.; Gao, S.; Zhuang, J.; Hou, C.; He, Y.; Chu, X.; Miao, A.; Luo, S. Apple bruise grading using piecewise nonlinear curve fitting for hyperspectral imaging data. IEEE Access 2020, 8, 147494–147506. [Google Scholar] [CrossRef]
  17. Saha, A.K.; Saha, J.; Ray, R.; Sircar, S.; Dutta, S.; Chattopadhyay, S.P.; Saha, H.N. IOT-based drone for improvement of crop quality in agricultural field. In Proceedings of the 2018 IEEE 8th Annual Computing and Communication Workshop and Conference (CCWC), Las Vegas, NV, USA, 8–10 January 2018; IEEE: Piscataway, NJ, USA, 2018; pp. 612–615. [Google Scholar]
  18. Stuart, M.B.; McGonigle, A.J.; Willmott, J.R. Hyperspectral imaging in environmental monitoring: A review of recent developments and technological advances in compact field deployable systems. Sensors 2019, 19, 3071. [Google Scholar] [CrossRef] [Green Version]
  19. Stampfer, C.; Heinke, H.; Staacks, S. A lab in the pocket. Nat. Rev. Mater. 2020, 5, 169–170. [Google Scholar] [CrossRef]
  20. Onorato, P.; Rosi, T.; Tufino, E.; Caprara, C.; Malgieri, M. Quantitative experiments in a distance lab: Studying blackbody radiation with a smartphone. Eur. J. Phys. 2021, 42, 045103. [Google Scholar] [CrossRef]
  21. Singh, M.; Singh, G.; Singh, J.; Kumar, Y. Design and Validation of Wearable Smartphone Based Wireless Cardiac Activity Monitoring Sensor. Wirel. Pers. Commun. 2021, 119, 441–457. [Google Scholar] [CrossRef]
  22. Cao, Y.; Zheng, T.; Wu, Z.; Tang, J.; Yin, C.; Dai, C. Lab-in-a-Phone: A lightweight oblique incidence reflectometer based on smartphone. Opt. Commun. 2021, 489, 126885. [Google Scholar] [CrossRef]
  23. McGonigle, A.J.; Wilkes, T.C.; Pering, T.D.; Willmott, J.R.; Cook, J.M.; Mims, F.M.; Parisi, A.V. Smartphone spectrometers. Sensors 2018, 18, 223. [Google Scholar] [CrossRef] [PubMed] [Green Version]
  24. Wilkes, T.C.; McGonigle, A.J.; Pering, T.D.; Taggart, A.J.; White, B.S.; Bryant, R.G.; Willmott, J.R. Ultraviolet imaging with low cost smartphone sensors: Development and application of a raspberry Pi-based UV camera. Sensors 2016, 16, 1649. [Google Scholar] [CrossRef] [PubMed] [Green Version]
  25. Turner, J.; Igoe, D.; Parisi, A.V.; McGonigle, A.J.; Amar, A.; Wainwright, L. A review on the ability of smartphones to detect ultraviolet (UV) radiation and their potential to be used in UV research and for public education purposes. Sci. Total Environ. 2020, 706, 135873. [Google Scholar] [CrossRef]
  26. Wilkes, T.C.; McGonigle, A.J.; Willmott, J.R.; Pering, T.D.; Cook, J.M. Low-cost 3D printed 1 nm resolution smartphone sensor-based spectrometer: Instrument design and application in ultraviolet spectroscopy. Opt. Lett. 2017, 42, 4323–4326. [Google Scholar] [CrossRef]
  27. Stanger, L.R.; Wilkes, T.C.; Boone, N.A.; McGonigle, A.J.S.; Willmott, J.R. Thermal imaging metrology with a smartphone sensor. Sensors 2018, 18, 2169. [Google Scholar] [CrossRef] [Green Version]
  28. Lü, Q.; Tang, M. Detection of hidden bruise on kiwi fruit using hyperspectral imaging and parallelepiped classification. Procedia Environ. Sci. 2012, 12, 1172–1179. [Google Scholar] [CrossRef] [Green Version]
  29. Gao, Y.; Li, Q.; Rao, X.; Ying, Y. Precautionary analysis of sprouting potato eyes using hyperspectral imaging technology. Int. J. Agric. Biol. Eng. 2018, 11, 153–157. [Google Scholar] [CrossRef] [Green Version]
  30. Sigernes, F.; Syrjäsuo, M.; Storvold, R.; Fortuna, J.; Grøtte, M.E.; Johansen, T.A. Do it yourself hyperspectral imager for handheld to airborne operations. Opt. Express 2018, 26, 6021–6035. [Google Scholar] [CrossRef]
  31. Yu, X.; Sun, Y.; Fang, A.; Qi, W.; Liu, C. Laboratory spectral calibration and radiometric calibration of hyper-spectral imaging spectrometer. In Proceedings of the 2014 2nd International Conference on Systems and Informatics (ICSAI 2014), Shanghai, China, 15–17 November 2014; IEEE: Piscataway, NJ, USA, 2014; pp. 871–875. [Google Scholar]
  32. Polder, G.; van der Heijden, G.W. Calibration and characterization of spectral imaging systems. In Proceedings of the Multispectral and Hyperspectral Image Acquisition and Processing, Wuhan, China, 22–24 October 2001; International Society for Optics and Photonics: Bellingham, WA, USA, 2001; pp. 10–17. [Google Scholar]
  33. Hartmann, J.; Fischer, J.; Johannsen, U.; Werner, L. Analytical model for the temperature dependence of the spectral responsivity of silicon. JOSA B 2001, 18, 942–947. [Google Scholar] [CrossRef]
  34. Kumar, J.; Gupta, P.; Naseem, A.; Malik, S. Light spectrum and intensity, and the timekeeping in birds. Biol. Rhythm Res. 2017, 48, 739–746. [Google Scholar] [CrossRef]
  35. Abdulridha, J.; Ampatzidis, Y.; Kakarla, S.C.; Roberts, P. Detection of target spot and bacterial spot diseases in tomato using UAV-based and benchtop-based hyperspectral imaging techniques. Precis. Agric. 2020, 21, 955–978. [Google Scholar] [CrossRef]
  36. Zhou, J.-J.; Zhang, Y.-H.; Han, Z.-M.; Liu, X.-Y.; Jian, Y.-F.; Hu, C.-G.; Dian, Y.-Y. Evaluating the Performance of Hyperspectral Leaf Reflectance to Detect Water Stress and Estimation of Photosynthetic Capacities. Remote Sens. 2021, 13, 2160. [Google Scholar] [CrossRef]
  37. Van De Vijver, R.; Mertens, K.; Heungens, K.; Somers, B.; Nuyttens, D.; Borra-Serrano, I.; Lootens, P.; Roldán-Ruiz, I.; Vangeyte, J.; Saeys, W. In-field detection of Alternaria solani in potato crops using hyperspectral imaging. Comput. Electron. Agric. 2020, 168, 105106. [Google Scholar] [CrossRef]
  38. Jones, C.L.; Weckler, P.R.; Maness, N.O.; Stone, M.L.; Jayasekara, R. Estimating water stress in plants using hyperspectral sensing. In Proceedings of the 2004 ASAE Annual Meeting, Ottawa, ON, Canada, 1–4 August 2004; American Society of Agricultural and Biological Engineers: St. Joseph, MI, USA, 2004; p. 1. [Google Scholar]
  39. Li, J.; Luo, W.; Wang, Z.; Fan, S. Early detection of decay on apples using hyperspectral reflectance imaging combining both principal component analysis and improved watershed segmentation method. Postharvest Biol. Technol. 2019, 149, 235–246. [Google Scholar] [CrossRef]
  40. Cheng, J.-H.; Sun, D.-W. Rapid and non-invasive detection of fish microbial spoilage by visible and near infrared hyperspectral imaging and multivariate analysis. LWT-Food Sci. Technol. 2015, 62, 1060–1068. [Google Scholar] [CrossRef]
  41. Abdulridha, J.; Ampatzidis, Y.; Qureshi, J.; Roberts, P. Laboratory and UAV-based identification and classification of tomato yellow leaf curl, bacterial spot, and target spot diseases in tomato utilizing hyperspectral imaging and machine learning. Remote Sens. 2020, 12, 2732. [Google Scholar] [CrossRef]
  42. Liu, D.; Zeng, X.-A.; Sun, D.-W. Recent developments and applications of hyperspectral imaging for quality evaluation of agricultural products: A review. Crit. Rev. Food Sci. Nutr. 2015, 55, 1744–1757. [Google Scholar] [CrossRef]
  43. Xing, J.; Bravo, C.; Jancsók, P.T.; Ramon, H.; De Baerdemaeker, J. Detecting bruises on ‘Golden Delicious’ apples using hyperspectral imaging with multiple wavebands. Biosyst. Eng. 2005, 90, 27–36. [Google Scholar] [CrossRef]
  44. Wang, N.; ElMasry, G. Bruise detection of apples using hyperspectral imaging. In Hyperspectral Imaging for Food Quality Analysis and Control; Elsevier: Amsterdam, The Netherlands, 2010; pp. 295–320. [Google Scholar]
  45. Kim, M.S.; Chen, Y.; Mehl, P. Hyperspectral reflectance and fluorescence imaging system for food quality and safety. Trans. ASAE 2001, 44, 721. [Google Scholar]
  46. Wang, T.; Chen, J.; Fan, Y.; Qiu, Z.; He, Y. SeeFruits: Design and evaluation of a cloud-based ultra-portable NIRS system for sweet cherry quality detection. Comput. Electron. Agric. 2018, 152, 302–313. [Google Scholar] [CrossRef]
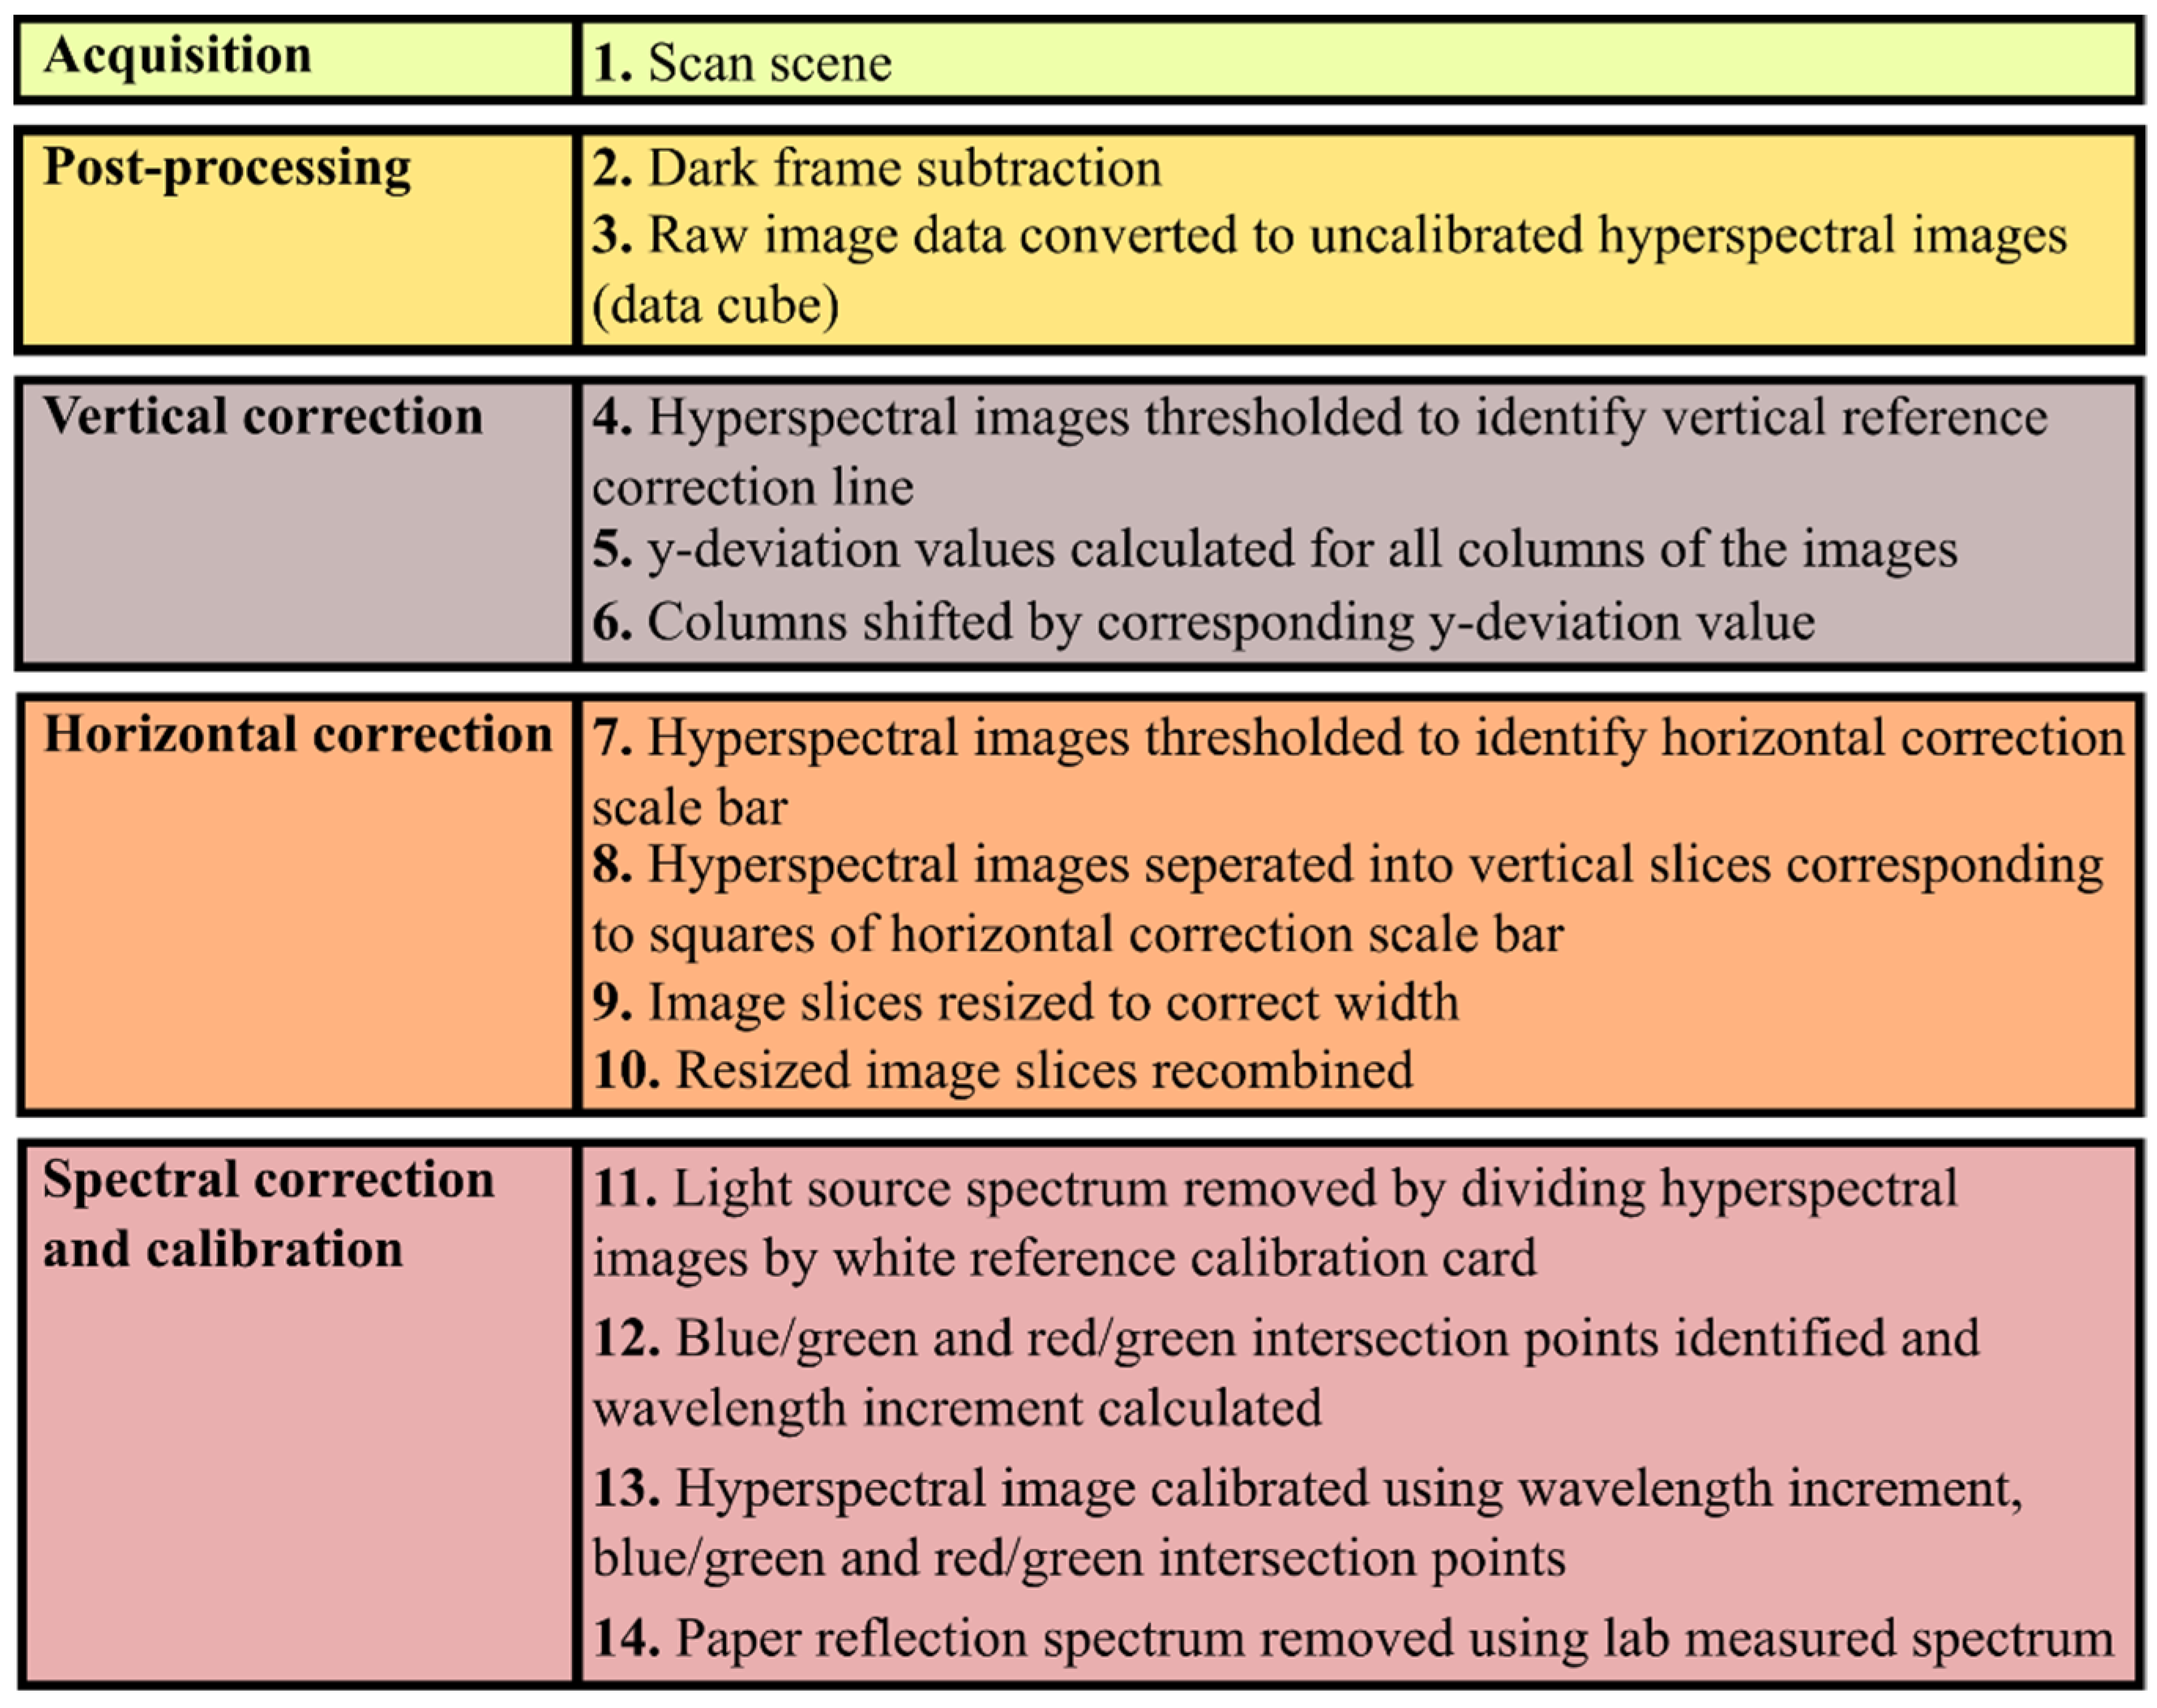
Figure 1. Workflow diagram for each stage of the image acquisition, pre-processing, vertical and horizontal correction and spectral correction and calibration.
Remotesensing 14 01152 g001
Figure 2. (A) A 3D render of the operating principle of the push-broom scanning smartphone hyperspectral imager. The red arrow shows the scan direction. (B) The spectrum of a vertical slice of a scene captured during a scan. (C) A colour image constructed of the colours captured during the scan. The red highlighted column of pixels corresponds to the spectrum in (B).
Remotesensing 14 01152 g002
Figure 3. A visualisation of our hyperspectral data cube. The x and y axes correspond to pixel positions in the image with the λ axis corresponding to the hyperspectral plane.
Remotesensing 14 01152 g003
Figure 4. The calibration card. The subject of the imaging (the measurand) was placed in the target object location. The horizontal correct scale bar, spectral calibration refence target and vertical correction refence line were then used as in-scene references for spectral calibration and spatial correction.
Remotesensing 14 01152 g004
Figure 5. The stages of the vertical spatial correction. (A) is the raw output from the data cube. (B) shows the masked area of the vertical correction reference line overlayed onto the original image. The area highlighted in blue is shown, enlarged, in (C). The red arrows show the motion of the columns of pixels. (D) shows the corrected image. The top of the image has been left uncropped to make the effect of the column shifts clearer.
Remotesensing 14 01152 g005
Figure 6. (A) shows the output from the column correction shown in Figure 5D. (B) shows the masked area of the horizontal correction scale bar overlayer onto the image. A line profile of the masked area is shown at the bottom of the image to emphasise the non-uniformity of the image. The area highlighted in blue is shown, enlarged in (C). The red arrows represent the scaling of each vertical slice of the image that correspond to the squares or gaps in the horizontal correction scale bar. (D) shows the horizontally corrected output. The bottom of the image has a line profile like in B, which shows the greater uniformity of the corrected image.
Remotesensing 14 01152 g006
Figure 7. A graphical representation of Equation (3). The calibrated wavelength has been added retroactively for reference.
Remotesensing 14 01152 g007
Figure 8. (A) An uncalibrated spectral reflectance plot of from the uncalibrated data cube for three x–y points corresponding to the red, green, and blue parts of the spectral calibration reference target. (B) The ground-truth reflection spectrum for each colour of the spectral calibration reference target measured using a Thorlabs CCD spectrometer. The similarity between the two enabled points to be selected as known wavelength calibration points (highlighted with vertical dotted lines). (C) shows the spectral calibration reference target.
Remotesensing 14 01152 g008
Figure 9. (A) An RGB reconstruction from the non-spatially corrected data cube. (B) The same image from (A) but spatially corrected.
Remotesensing 14 01152 g009
Figure 10. The spectra of the light sources (left) used during the acquisition of the reflection spectra of a sample of lapis lazuli and the measured reflection spectrum (right) with the lab-measured reflection spectrum overlayed in blue where the light sources were (A) natural sun light, (B) incandescent light and (C) LED light. (D) shows the sample of the lapis lazuli that was measured.
Remotesensing 14 01152 g010
Figure 11. (A) A photograph of the measurand apple. (B) A raw frame from the data cube. (C) Six spectral bands of a hyperspectral image of a red Gala apple demonstrating the varying levels of detection across the wavelength range of the instrument.
Remotesensing 14 01152 g011
Publisher’s Note: MDPI stays neutral with regard to jurisdictional claims in published maps and institutional affiliations.