Abstract
The Dabie Mountain area is a typical poverty-stricken area in China. It is of great significance to evaluate the ecosystem service value and its impact mechanism toward optimizing the ecological structure and coordinating ecological protection and economic development. This study determined the ecosystem service value coefficient and calculated the ecosystem service value (ESV) according to the regional economic development in the past ten years, and the ESV was spatialized based on NPP, which is closely related to ecological function. The temporal and spatial variation of ESV was then analyzed, and an RDE index was proposed to describe its response to land cover change. Further, the relationship between ESV and several parameters that reflect socioeconomic development was researched and analyzed. The results show that the total ESV in the study area first decreased and then increased, with an overall increase of CNY 3.895 billion. Among the land cover types, forest land had the greatest impact, contributing more than 70%. In the ecosystem service functions, the contribution of regulation function exceeded 50%. ESV was found to be sensitive to land cover change. On average, every 1 km2 change leads to an ESV change of about CNY 1 million. Socioeconomic-related parameters were negatively correlated with ESV, among which the correlation with per capita disposable income was the weakest, indicating that there was no obvious contradiction between human well-being and ESV. Therefore, a path for harmonious symbiotic development can be found between man and nature.
1. Introduction
Ecosystems consist of plant, animal, and microorganism communities and the nonliving environment, which interact as a functional unit [1,2]. Through its structure, processes, and functions, an ecosystem can directly or indirectly provide life support products and services. These are important for maintaining the natural environmental conditions and facilitating human survival [3,4]. Ecosystem service is a general term referring to human beings obtaining benefits from an ecosystem [5]. Research ecosystem services are of great significance for the construction of ecological civilization, the exploration of ecological security patterns, and the improvement of human well-being [6,7,8].
Human society and ecological environment interact, are closely related and mutually beneficial and have formed an inseparable complex [9]. However, the rapid development of human society leads to the destruction of the ecological environment. In 1992, the report issued by the United Nations Environment Office on the state of the world environment sounded the alarm for environmental protection to countries all over the world. In 2000, the United Nations listed “ensuring environmental sustainability” as one of the Millennium Development Goals, and ecological protection has since gradually become an important development issue. Ecosystem services have received extensive attention since 2005, due to the Millennium Ecosystem Assessment (MEA) of the United Nations, and both policy communities and the level of research activity have since received increased interest in this field [10,11]. The widespread recognition of ecosystem services reframes the relationship between humans and the rest of nature. It has led humanity to emphasize that natural assets are a key component of inclusive wealth, well-being, and sustainability [12].
Ecosystem service value (ESV) is a quantitative estimate of ecosystem service capacity and an important indicator of ecological security. Scientific evaluation of ESV and quantitative description of its temporal and spatial dynamic characteristics can provide an important reference for formulating reasonable ecological protection policies. Quantifying ESV is an important approach to raise awareness, develop knowledge, improve decision making, and formulate policies [13,14,15,16,17] while also being an important measure to attract social attention toward protecting the environment [18]. ESV evaluation approaches are mainly divided into monetary form and energy form [19]. Among them, the ESV is easy to understand in monetary form and for people to use in making decisions, and this form is also the most widely used. The evaluation results can effectively assist spatial planning, ecological regulation, and ecological restoration [20,21,22]. In this kind of model, the ecosystem service value coefficients of biomes were set up to determine ESV based on land use/land cover categories, which has been applied in a large number of studies [23,24,25], though was also criticized because of its uncertainties, regional applicability, and ignoring the vegetation growth status of the same biome [26,27,28,29,30]. Remote sensing is an effective means to objectively monitor the growth status of vegetation [31]. Some parameters retrieved by remote sensing, such as net primary productivity (NPP), can show the continuous change of vegetation status in space. Therefore, integrating remote sensing information into ESV is very useful for analyzing its temporal and spatial changes.
In the process of the earlier rapid development of human society, unreasonable use of natural resources leads to the destruction of the ecosystem, which in turn affects human well-being [32]. For instance, the increasing demand for agriculture, industry, and the urban area has led to changes in land use/land cover, reducing the ability of the ecosystem to support human beings. This has become an important aspect of global ecological environment change [33,34]. In recent decades, large-scale changes in land use/land cover have been observed, caused by different socioeconomic and biophysical drivers, such as population growth, agricultural expansion, and intensification, accessibility to infrastructure and markets, water availability, or climate [35]. The harmonious development of the social economy and the ecological environment has become a common problem and global challenge faced by mankind [36]. However, the interaction mechanisms between socioeconomic and ecosystem services remain unclear. Currently, most studies focus on the accounting methods, driving mechanism, and scale effect of ESV [5,6,7,8,9,10,11,12,37,38,39,40,41,42]. Little attention has been paid to the relationship between ESV and socioeconomic, especially human well-being. Therefore, exploring the relationship between the changes in ESV and socioeconomic development is of great significance and can provide support for promoting ecological protection and high-quality development.
The Dabie Mountain area is a typical poverty-stricken area in China, with serious soil and water loss. As the social economy is still at a low stage of development, it is easier to explore the interaction mechanism between social economy and ESV. Meanwhile, it is an important area of ecological function in Central China and an important ecological barrier in the middle and lower reaches of the Yangtze River [43]. In the context of China’s target of poverty alleviation, strengthening the research on ecosystem services in Dabie Mountains has important theoretical and practical significance [37] and is useful for optimizing the ecological structure and coordinating ecological protection and economic development. In 2020, Henan Dabieshan National Field Observation and Research Station of Forest Ecosystem, led by Henan University, was officially established, and it provides important support for the study of ecosystem services in this area.
As China enters the stage of high-quality development, the supporting role of the ecological environment is becoming increasingly obvious. Respecting nature, conforming to nature, protecting nature, and promoting the harmonious coexistence between man and nature has become an inevitable choice. It is meaningful to correctly handle the relationship between production, life, and the ecological environment and explore the coordinated development mechanisms of the social economy and the ecosystem. This can provide a scientific basis for the construction of human and natural living communities. Therefore, the aims of this study are (1) to ensure the ESV can truly and objectively reflect the spatial distribution of the growth state of vegetation by integrating remote sensing technology and the value coefficient method; (2) to reveal the spatiotemporal differentiation characteristics and mechanisms driving ESV in the Dabie Mountain area; and (3) to explore the temporal and spatial relationship between the changes in ESV and local socioeconomic development, to provide a theoretical basis for decision making in relation to the regulation of ecosystem function, the construction of ecological security pattern, and the construction of ecological civilization in Dabie Mountains.
2. Study Area and Materials
2.1. Study Area
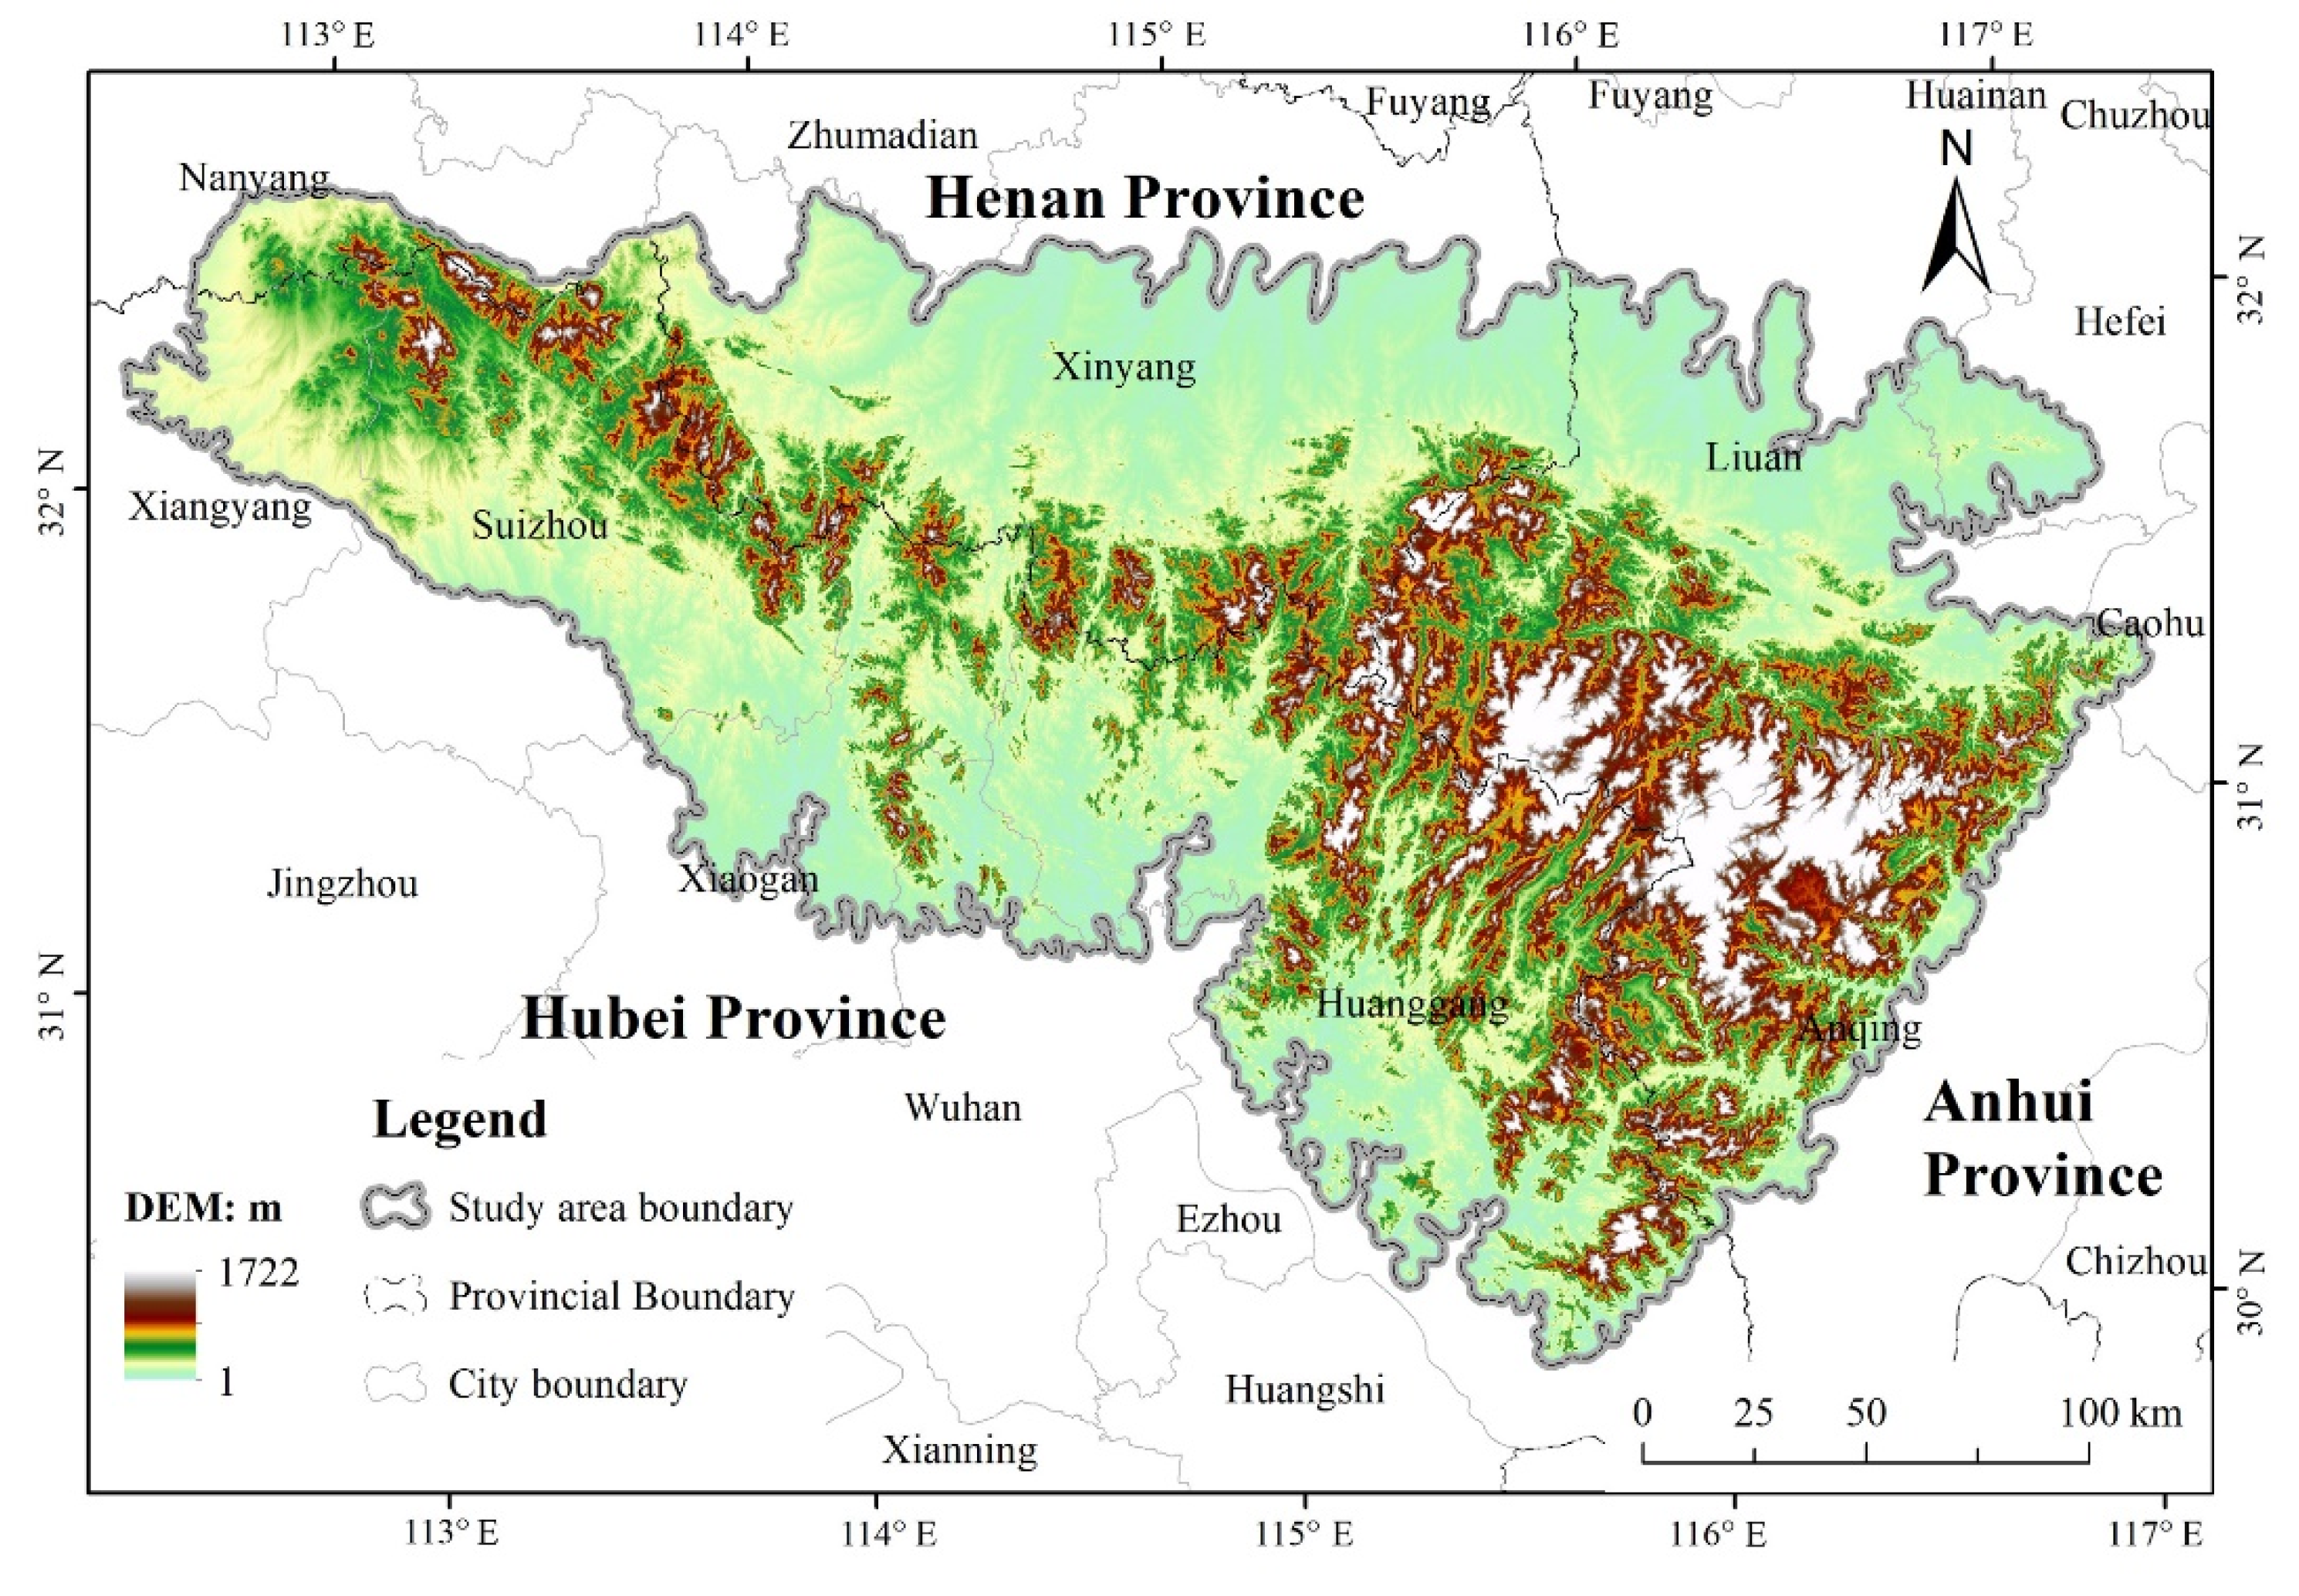
The Dabie Mountains are located at the junction of Anhui, Hubei, and Henan Provinces in China, and lie between 30°10′–32°30′ N and 112°40′–117°10′ E (Figure 1). They are connected to Tongbai Mountain in the west and Huoshan and Zhangbaling in the east, stretching about 380 km from east to west and 175 km from north to south. Dabie Mountains are a natural watershed of the Yangtze and Huaihe Rivers. The main part of the mountain is about 1500 m above sea level, and the main peak Baimajian (1777 m above sea level) is located in Huoshan County, Liuan City, Anhui Province.
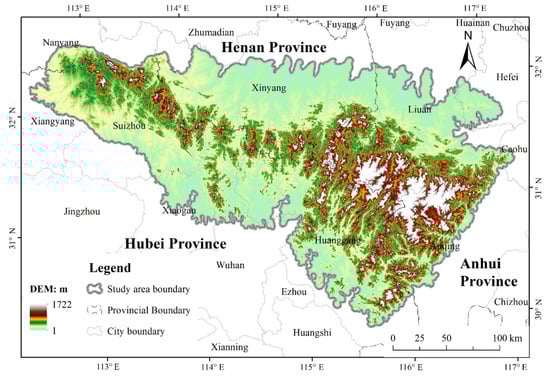
Figure 1.
The location of the study area is at the junction of Henan, Hubei, and Anhui Provinces.
The Dabie Mountains are part of a northern area characterized by a subtropical warm and humid monsoon climate, with typical mountain climate characteristics, mild climate, and abundant rainfall. The annual average temperature is 12.5 °C, the maximum temperature is 18.7 °C, and the minimum temperature is 8.8 °C. The average precipitation is 1832.8 mm, with 161 annual precipitation days. The average annual sunshine hours are 1400–1600 h, and the frost-free period is 179–190 days. The floristic composition is complex, and mixing and interleaving are particularly prominent. The distribution of evergreen deciduous broad-leaved mixed forest with the characteristics of both north and south plants in the Dabie Mountain area is the first of its kind in China, and it also represents a zonal vegetation community in this area.
2.2. Datasets
Google Earth Engine is a cloud platform provided by Google for online visual calculation, analysis, and processing of global-scale geoscience data [44]. It combines a massive archive of remote sensing data and geospatial datasets with planetary-scale analysis capabilities. Based on the CASA model, this study uses Landsat 8 OLI data to obtain the annual NPP of the study area through the GEE platform.
The land-use datasets of 2010, 2015, and 2020 were downloaded from the national earth system science data-sharing infrastructure, China [45]. They were extracted from Landsat images and calibrated based on field data. The data were further calibrated in the study area before use. With the aid of the field data, the land use data were corrected by visual interpretation based on Landsat images.
The statistical data were collected from the statistics department based on the statistical yearbooks of Henan, Anhui, and Hubei Provinces which are sufficient for guaranteeing the acquisition of social and economic indicators. Among them, grain planting area and yield were used to determine the ecosystem service value coefficients. County-scale population and GDP were used to obtain the population density and GDP per unit area. Per capita, disposable income was used to reflect human well-being.
3. Methodology
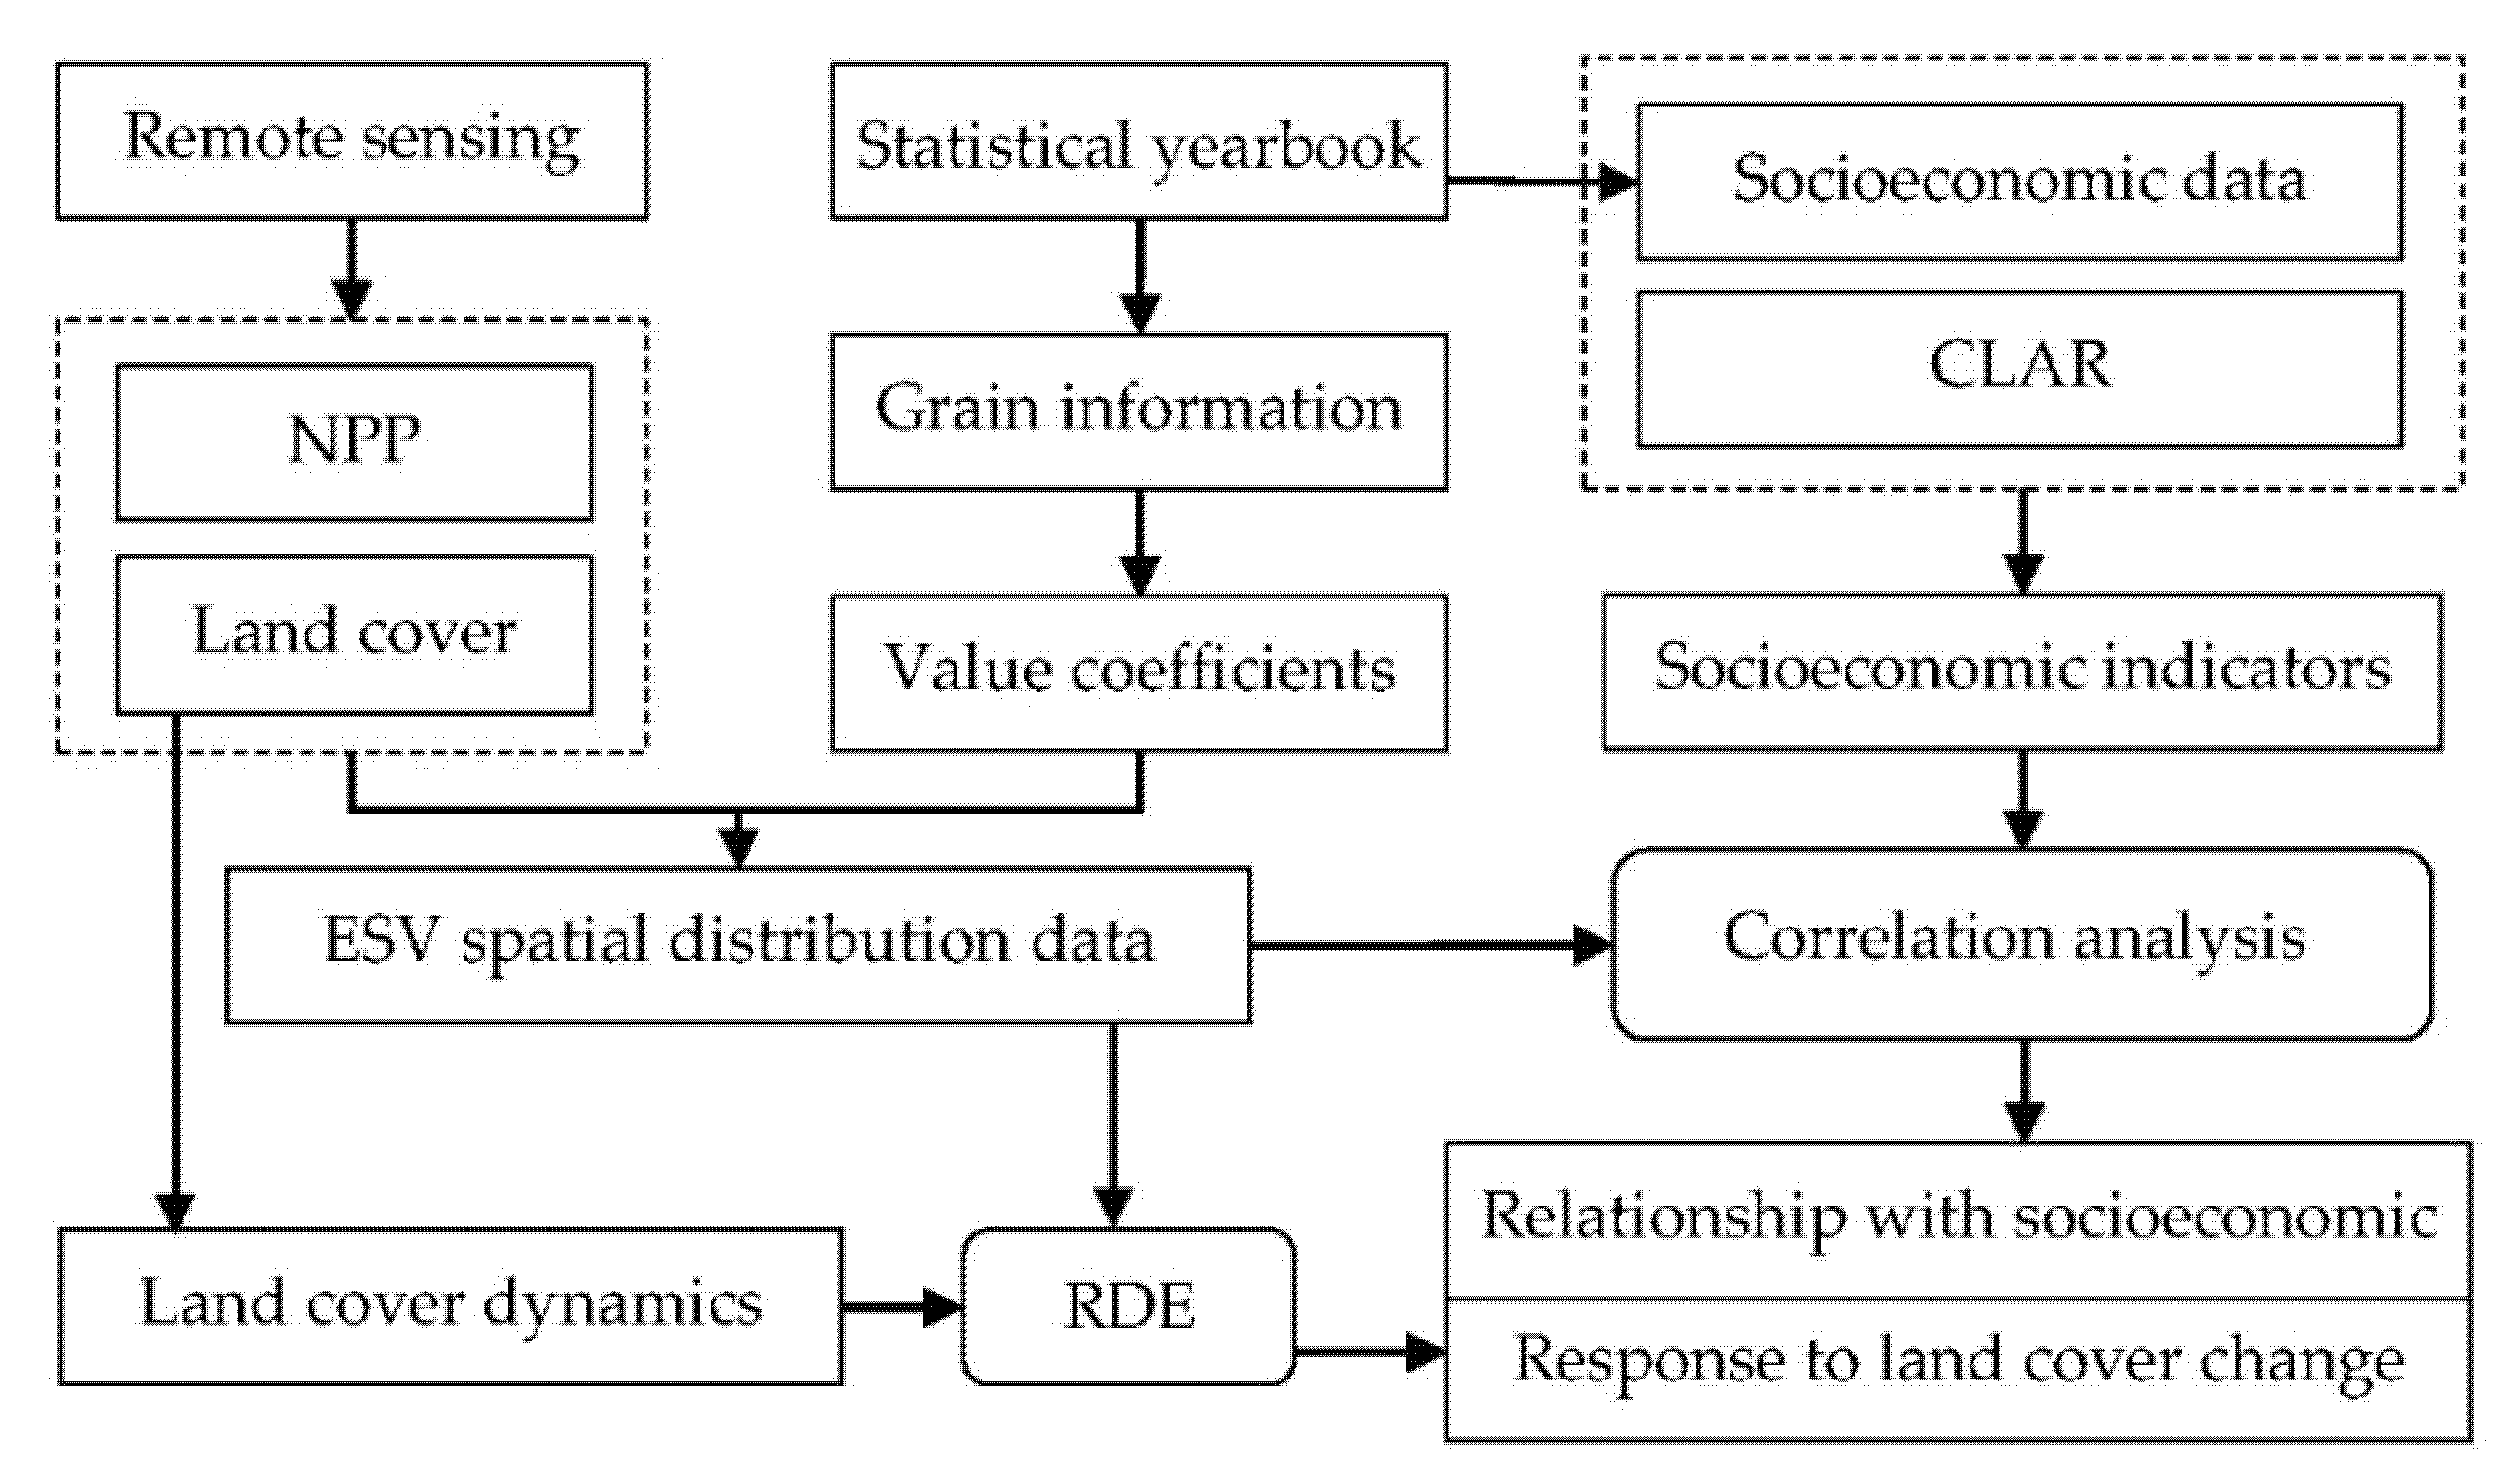
This study mainly uses remote sensing data, statistical data, and land use data to evaluate ESV, and the relationship between ESV dynamics and socioeconomic development was then analyzed. The purpose of this study is to provide scientific support for the coordinated development of the social economy and ecosystem. The technical process is shown in Figure 2.
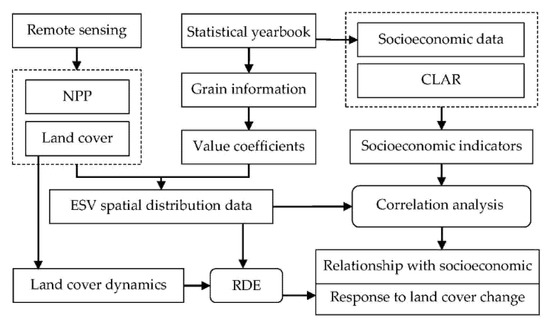
Figure 2.
The technical flow chart in this study. CLAR: county-level administrative region; NPP: net primary productivity; RDE: response degree of ecosystem service value relative to land cover change.
The research is carried out according to the following five aspects. (1) The planting area and yield of grain in the study area are obtained from the statistical yearbooks. Based on previous research [41], the value coefficients of each land cover type and each ecosystem service function type are determined. (2) The ESV is determined using land cover data and value coefficients and NPP reflecting the vegetation growth status is used to adjust the ESV spatial distribution. (3) By combining the statistical data and county-level administrative division data, the relevant indicators reflecting social and economic development are calculated. (4) Based on the method proposed in this study, the response degree of ESV to land cover change is analyzed. (5) Then the relationship between ESV and socioeconomic related parameters is then analyzed.
3.1. Determination of Ecosystem Service Value Coefficient
Land use/land cover change affects ecosystem service function, and it is also the external embodiment of the complex coupling between human socioeconomic activities and natural ecosystems [38,39]. Based on the research results of previous researchers [6,39], the grain yield per unit area (6441.12 kg/ha) and the market price (1.3663 CNY/kg) for this study area in the recent ten years were obtained by consulting the statistical yearbooks of Henan, Anhui, and Hubei Provinces. It was calculated according to the ecosystem service value of farmland per unit area being equal to 1/7 of the market economic value of the average unit yield of grain [41]. Finally, the ecosystem service value coefficients per unit area of different land types were determined for Dabie Mountains (Table 1).

Table 1.
Value coefficients of ecosystem service function types for land cover types in Dabie Mountains (CNY/ha·a).
3.2. Method for Spatial Distribution Adjustment of ESV
The ecosystem services directly depend on the type of ecosystem and their status in a given area. Land use can distinguish the types of ecosystem, while NPP retrieved from remote sensing images can reflect the ecosystem status. NPP is directly related to the functions of organic matter production, nutrient circulation, atmospheric regulation, hydrological regulation, and soil conservation [46,47]. Therefore, this study uses the annual NPP data to adjust the ESV at the pixel scale. This is useful for spatial analysis. The method is as Formula (1).
where ESVik is the ecosystem service value of pixel i in land cover category k; NPPik is the net primary productivity of pixel i; is the average value of net primary productivity in the land cover category k where pixel i is located; and Ck is the ecosystem service value coefficient of class k.
Thus, the total ESV of the study area is shown in Formula (2).
where, ESV is the ecosystem service value of the study area; m is the number of land cover categories, and i is the number of pixels in category k.
3.3. Analysis of Correlation between ESV Dynamics and Socioeconomic Development
3.3.1. ESV Dynamic Change
Using GIS technology, this study analyzes the temporal and spatial changes of ESV from the perspective of ecosystem types (Formula (3)) and service function types (Formula (4)), and the ESV dynamics of in Dabie Mountain area during the past ten years are also analyzed.
where ESVk and ESVf are the ecosystem service value of land cover category k and the ESV of ecosystem service function f, respectively.
3.3.2. Response of ESV to Land Cover Change
In this section, the relationship between land cover change and ESV change is analyzed by combining land cover data, and the impact of land cover change on the ESV has also been studied based on Formula (5).
where RDEf is the response degree of ecosystem service value relative to land cover change; ESVft0 and ESVft1 represent the ESV of an ecosystem service function at time t0 and t1, respectively; and ∆LCk is the area change for land cover category k.
3.3.3. Analysis of Correlation between ESV Dynamics and Socioeconomic Factors
Previous studies have shown that an increase in population density may lead to a reduction in per capita resources, and increased pollution, disease, and crime [48,49]. At the same time, it can also promote the exchange of ideas, which will lead to the improvement of productivity and innovation in these areas [50]. Therefore, population density is closely related to human life. The increase in people’s production activities can increase the local economic volume, so the economic volume per unit area can reflect the intensity of local production activities [51]. The expansion of built-up land inevitably lead to the occupation of ecological space, which reflects the human demand for ecological space [52]. However, human beings tend to ensure the balance with ecological protection by optimizing the regional spatial structure and increasing the green area in the built-up land [53]. The level of happiness is positively correlated with higher income [54]. This study uses people’s income to reflect the well-being of local people.
The combination of production and life can reflect the overall situation of the social economy. Then, by combining people’s income, built-up land demand, and the change in ESV, the impact of human socioeconomic activities on ESV and then the impact of changes in ESV on human well-being, in turn, can be determined via comprehensive analysis.
The parameters of proportion of land cover types, population density, GDP per unit area, and per capita disposable income were selected in this study. Taking the county as a unit, the correlation between the chosen parameters and ESV was studied. By analyzing the correlation between ESV and socioeconomic development, the influencing factors of ESV and its impact on human well-being are explored.
4. Results and Analysis
4.1. Total ESV and Its Temporal and Spatial Variation in Dabie Mountains
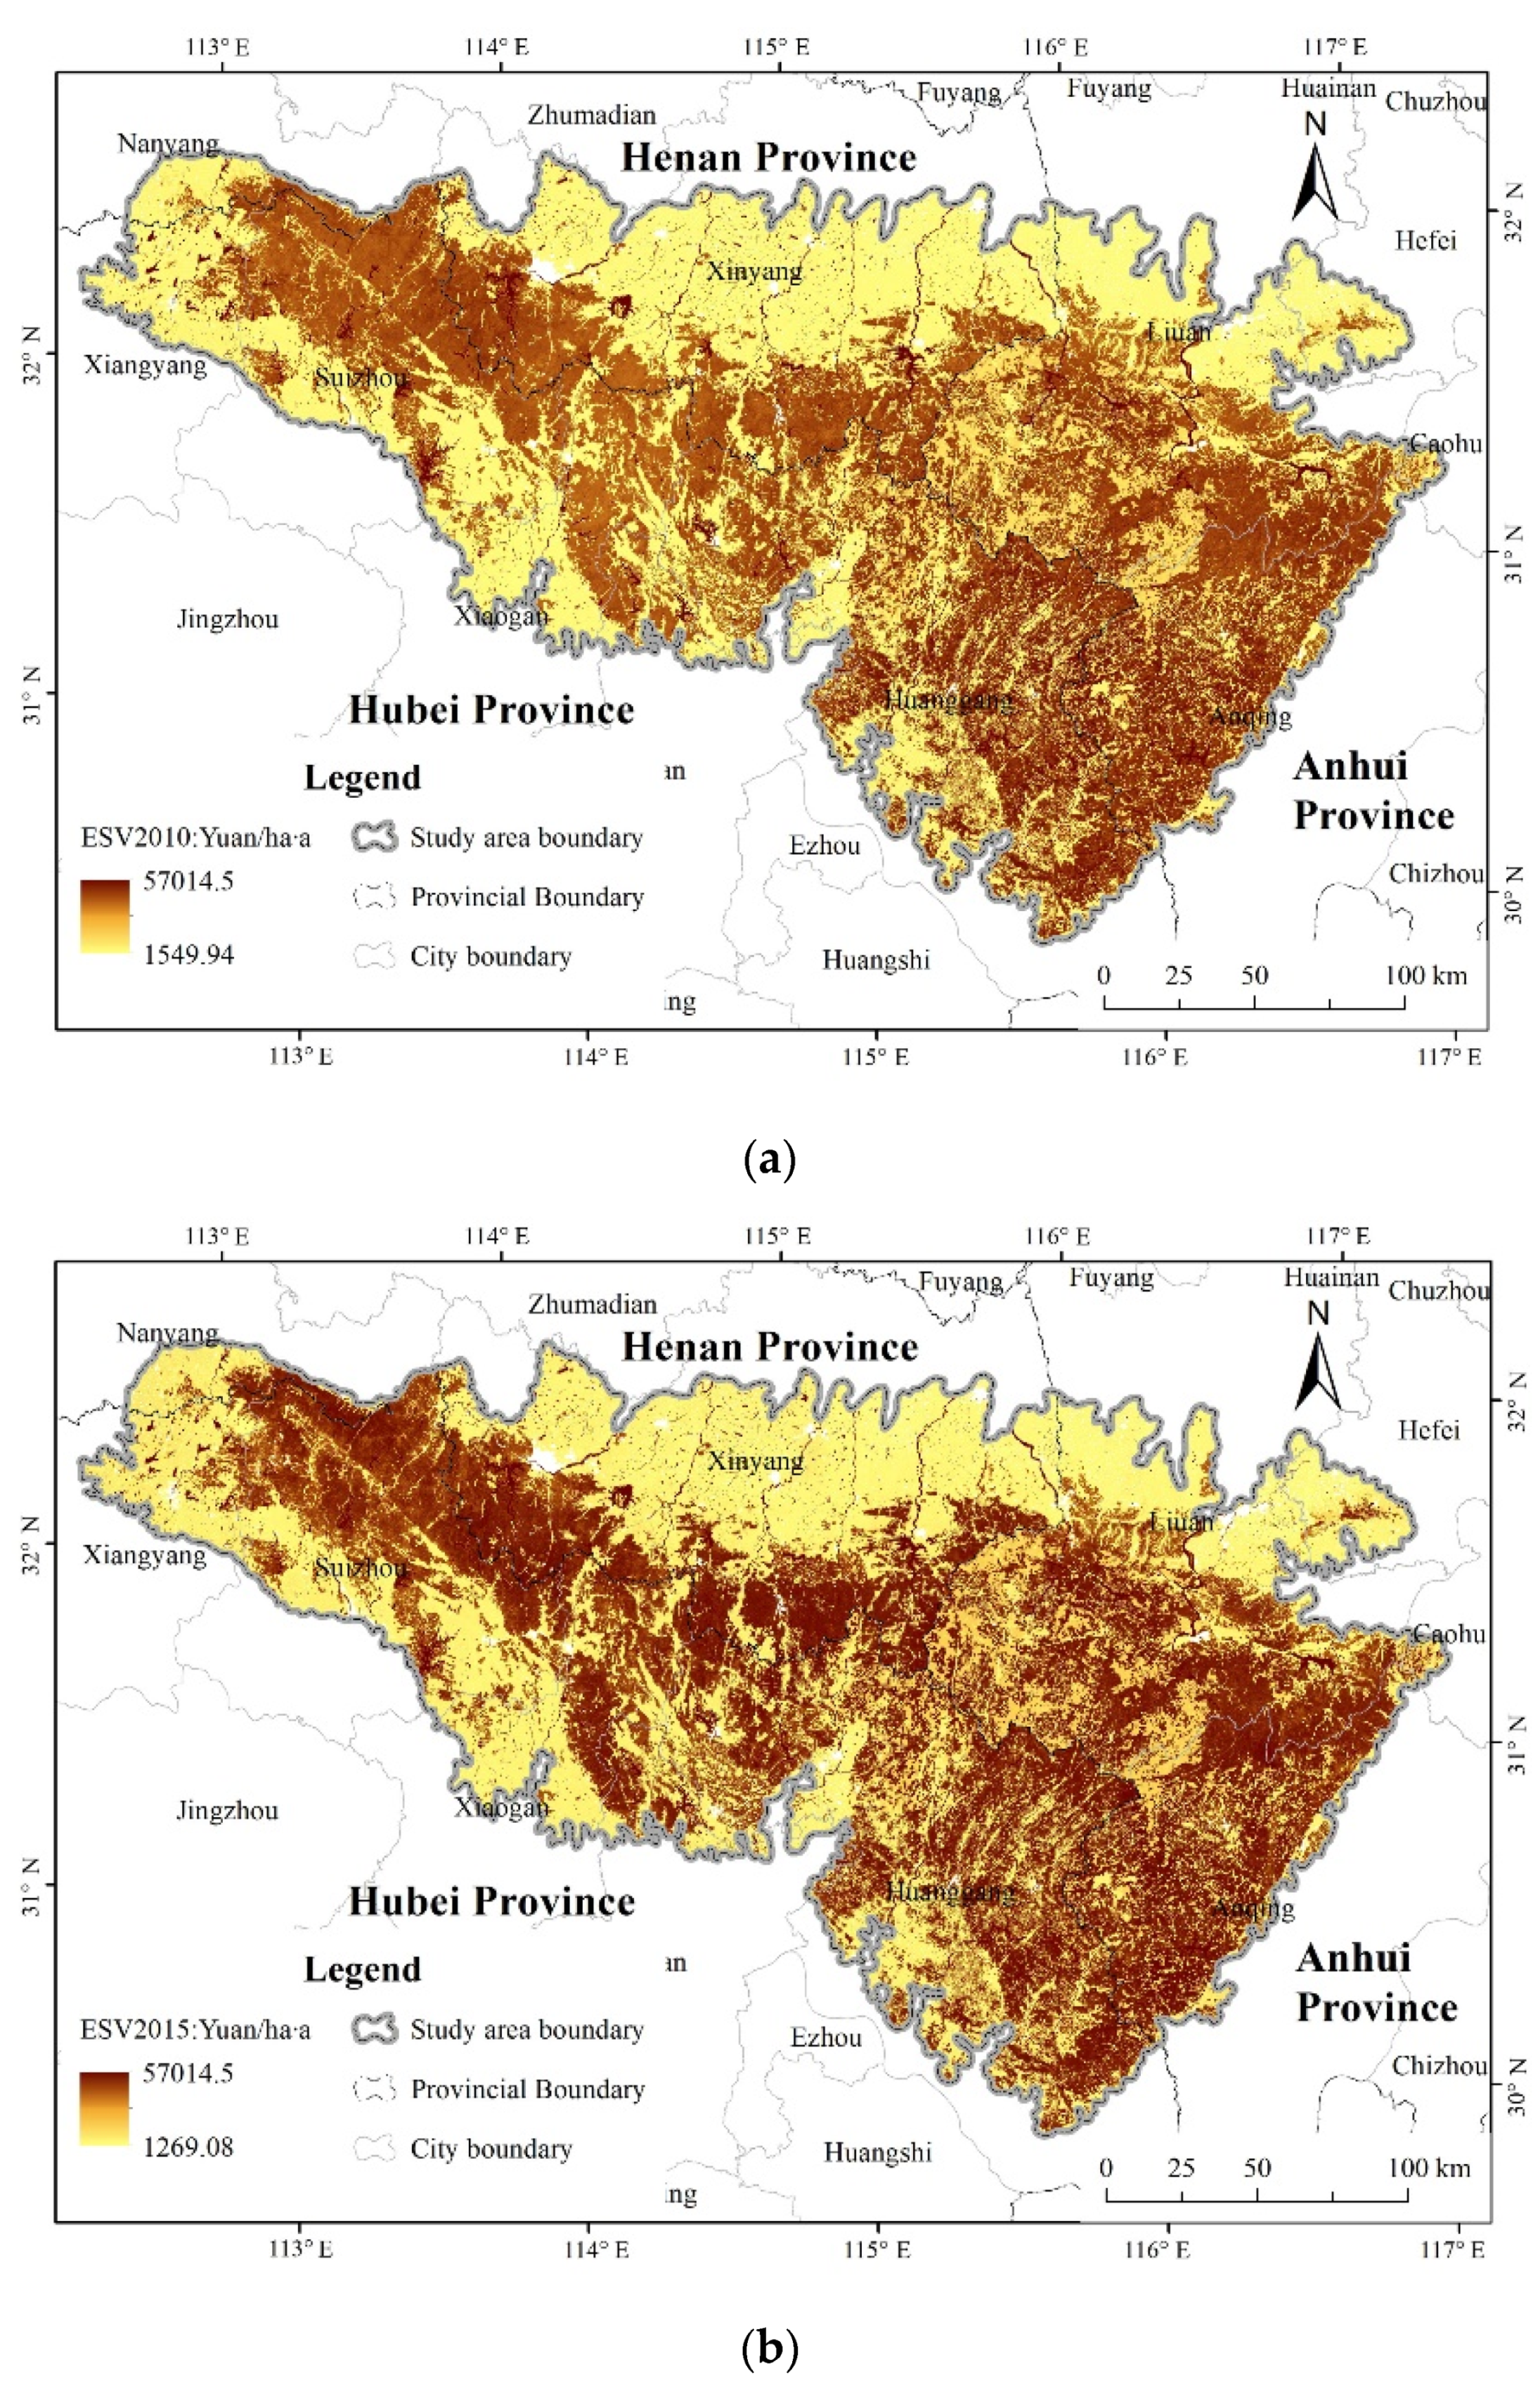
According to the aforementioned ESV evaluation method, the spatial distribution adjustment method (Formula (1)) was used to obtain the spatial distribution data of ESV in the Dabie Mountain area (Figure 3). The spatial distribution details and size of ESV in different location can be seen in Figure 3. These data play an important role in comparing regional differences and discovering the problems existing in ecosystem protection of the Dabie Mountain area.

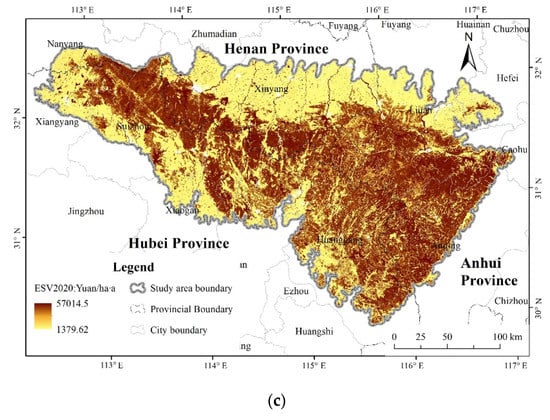
Figure 3.
Spatial distribution of ecosystem service value (ESV) in Dabie Mountains for the years (a) 2010, (b) 2015, and (c) 2020.
The ESV of vegetation cover types and the difference between the years in the study area were counted. The statistical results are shown in Table 2. The total ESV of the study area in 2010, 2015, and 2020 is CNY 139.396 billion, 139.052 billion, and 143.291 billion, respectively. Overall, the proportion of forest land ESV is the largest in the study area, which is about CNY 100 billion during this period. The second is farmland ecosystem, with an ESV of about CNY 25 billion during this period. The water ecosystem ESV has increased year by year, from CNY 9.934 billion in 2010 to CNY 11.885 billion in 2020.
Table 2.
Ecosystem service value and its change according to land cover types in the study area (108 CNY/ha·a).
From 2010 to 2015, the total ESV decreased by CNY 344 million, of which the ESV of forest land and farmland decreased by CNY 286 million and CNY 228 million, respectively. From 2015 to 2020, the total ESV increased by CNY 4.239 billion. Among the land cover types, forest land increased the most, reaching CNY 5.964 billion, water ecosystem ESV increased by CNY 1.782 billion, while the ESV of grassland, farmland, and unused land decreased by CNY 2900 million, 601 million, and 5 million, respectively.
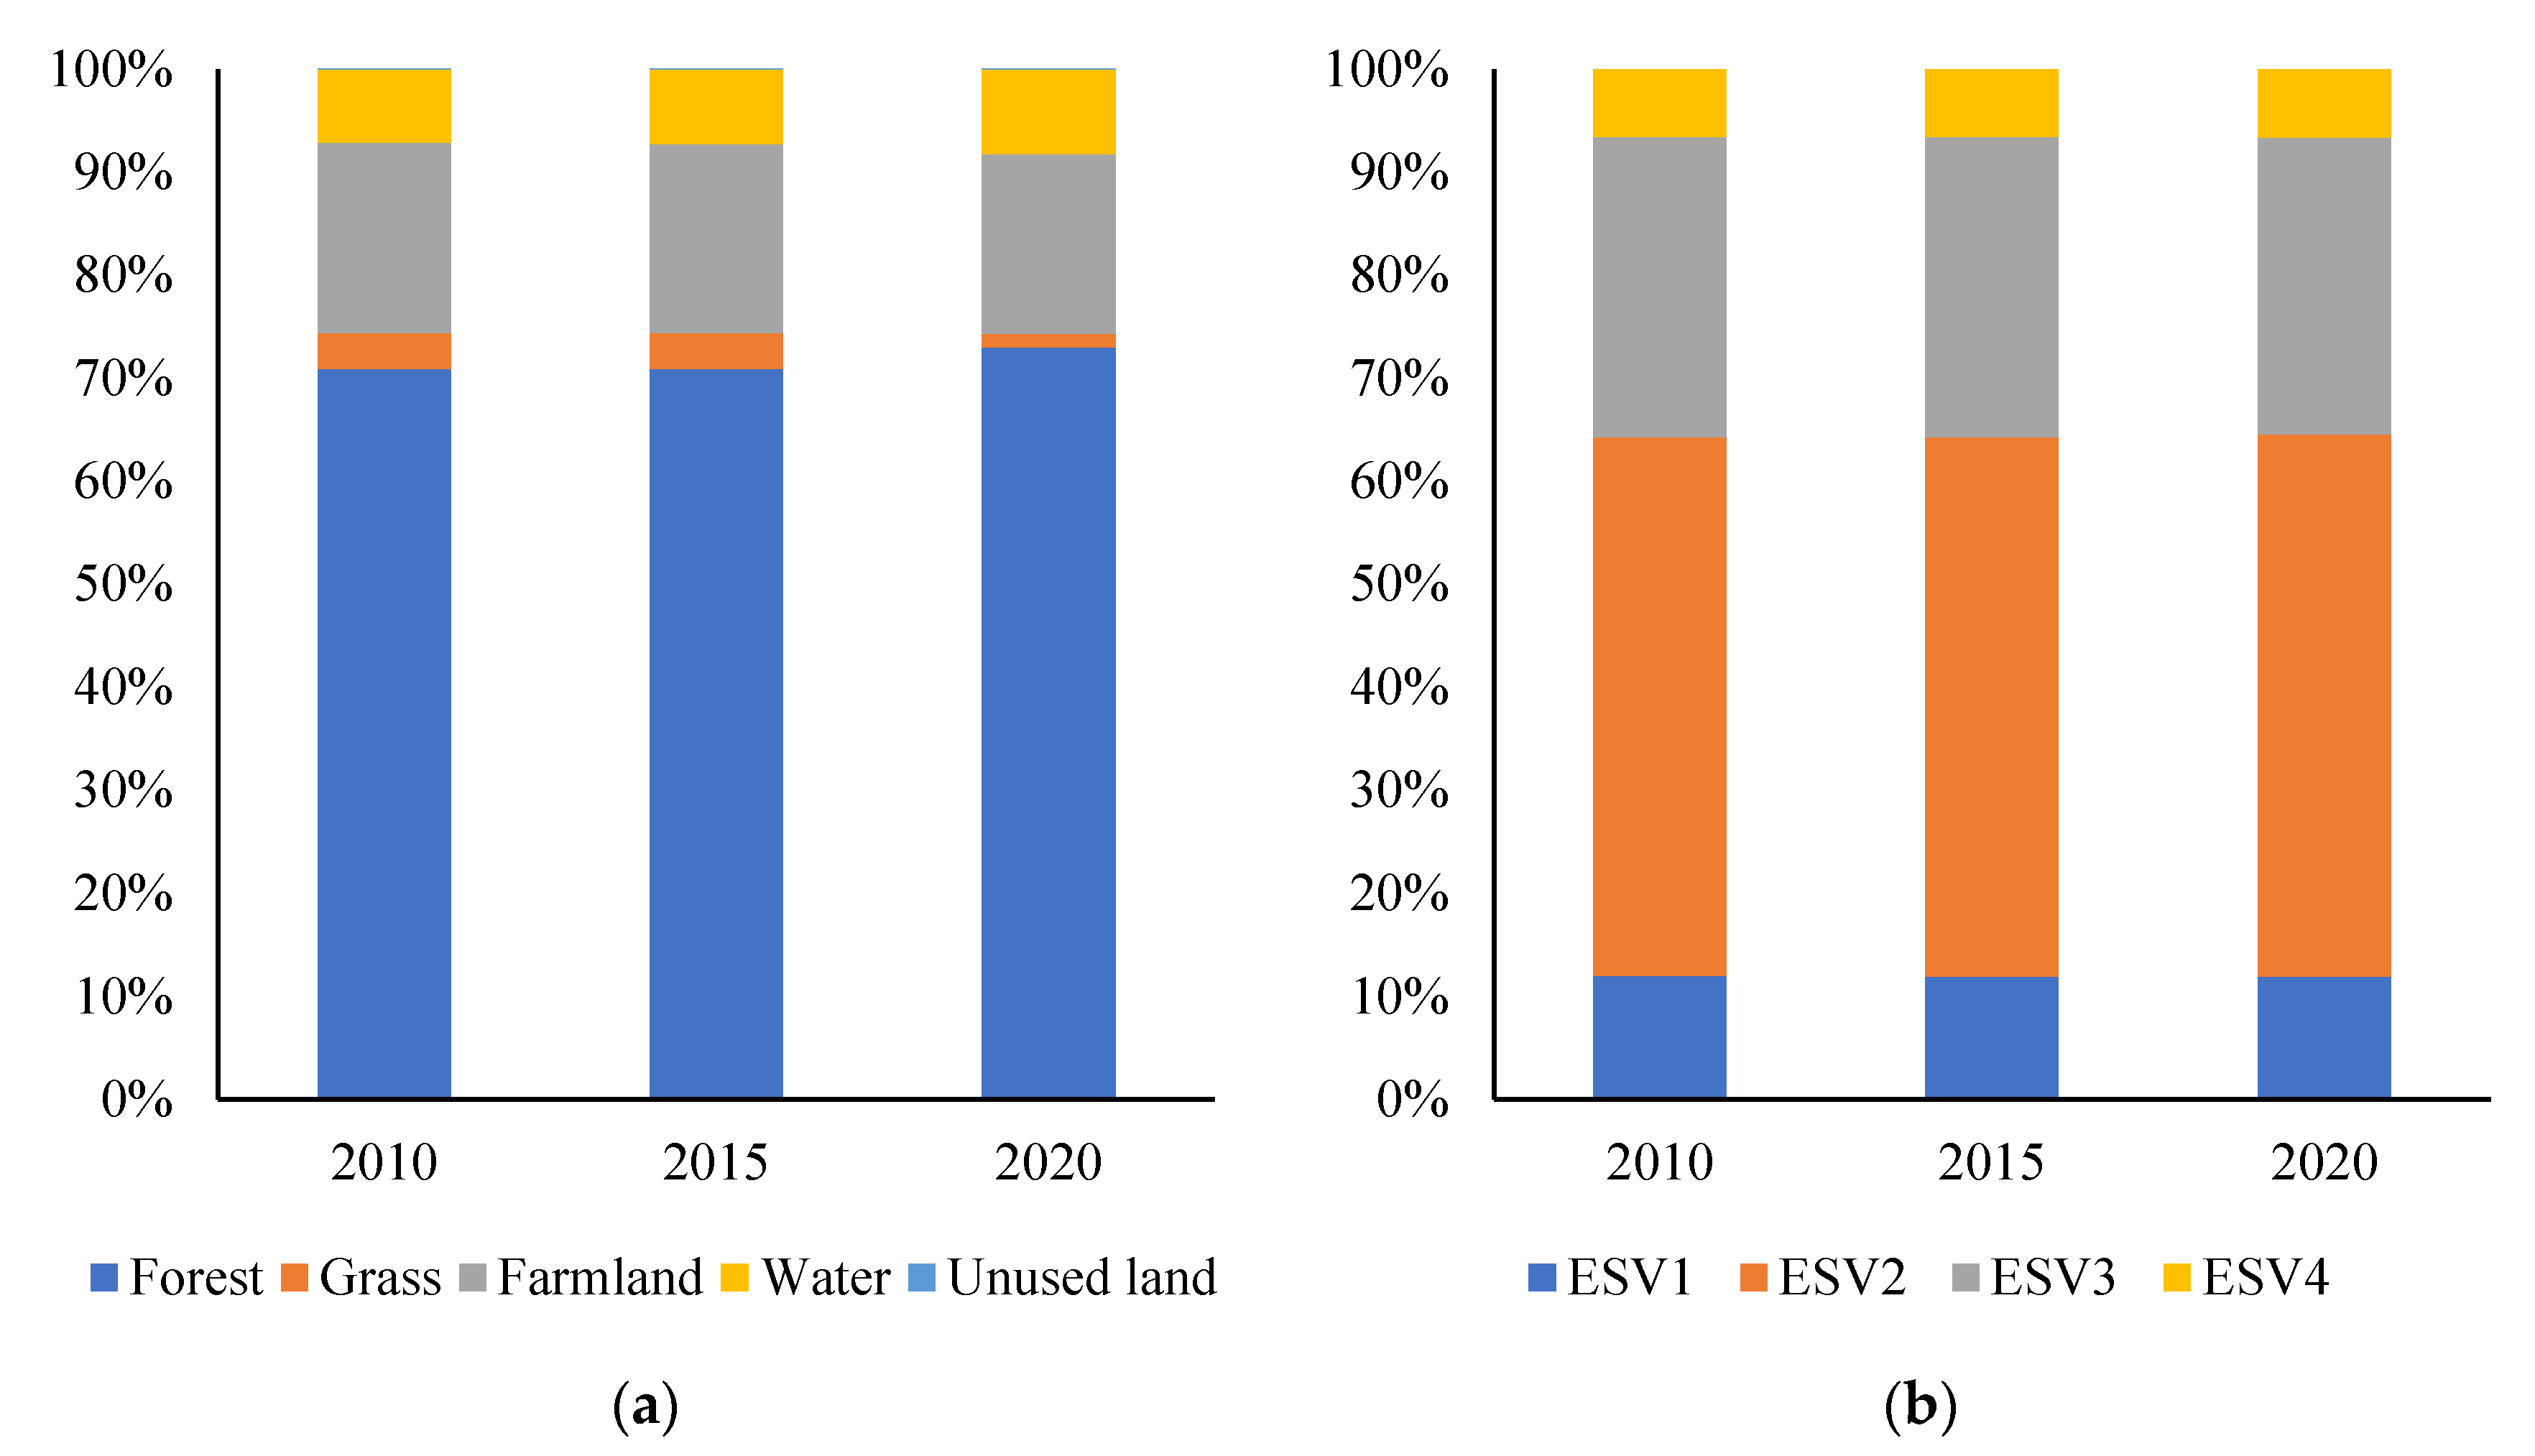
The proportions of ESV for land cover types and ecosystem service function types in the total ESV are shown in Figure 4.
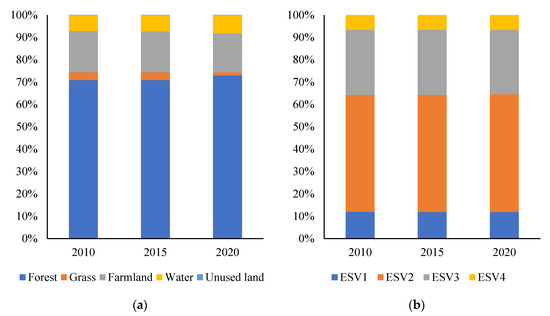
Figure 4.
Proportions of ESV in the Dabie Mountain area in 2010, 2015, and 2020 according to (a) land cover types and (b) ecosystem service function types. ESV1: supply service, ESV2: regulation service, ESV3: support service, ESV4: cultural service.
The proportion of forest land ESV increased most significantly, from 70.92% in 2010 to 72.96% in 2020. Grassland ESV decreased the most, from 3.44% in 2010 to 1.33% in 2020. The farmland ESV continued to decrease, from 18.50% in 2010 to 18.39% in 2015 and 17.42% in 2020. The water body continued to increase, from 7.13% in 2010 to 8.29% in 2020. Because of the very small area of unused land, the proportion of ESV is almost negligible. Compared to land cover types, the change in ESV for ecosystem service function types is very small. ESV1 and ESV3 are decreasing continuously, by 0.08% and 0.37%, respectively, from 2010 to 2020. ESV2 and ESV4 continued to increase, by 0.36% and 0.08%, respectively, from 2010 to 2020.
4.2. Response of ESV Dynamics to Land Cover Change
The area changes in land cover types in 2010, 2015, and 2020 are shown in Table 3. On the whole, the area of farmland and unused land continues to decrease, especially farmland, from 25,970.71 km2 in 2010 to 25,135.80 km2 in 2020. The area of built-up land and water body continues to increase, of which the built-up land increased from 2158.78 km2 in 2010 to 3051.68 km2 in 2020. The area of forest land first decreased and then increased. Overall, it increased by 1605.92 km2 during this period. The grassland area first increased and then decreased, and on the whole, it decreased by 1976.02 km2 during this period.
Table 3.
Area change according to land cover types in 2010, 2015, and 2020 (km2).
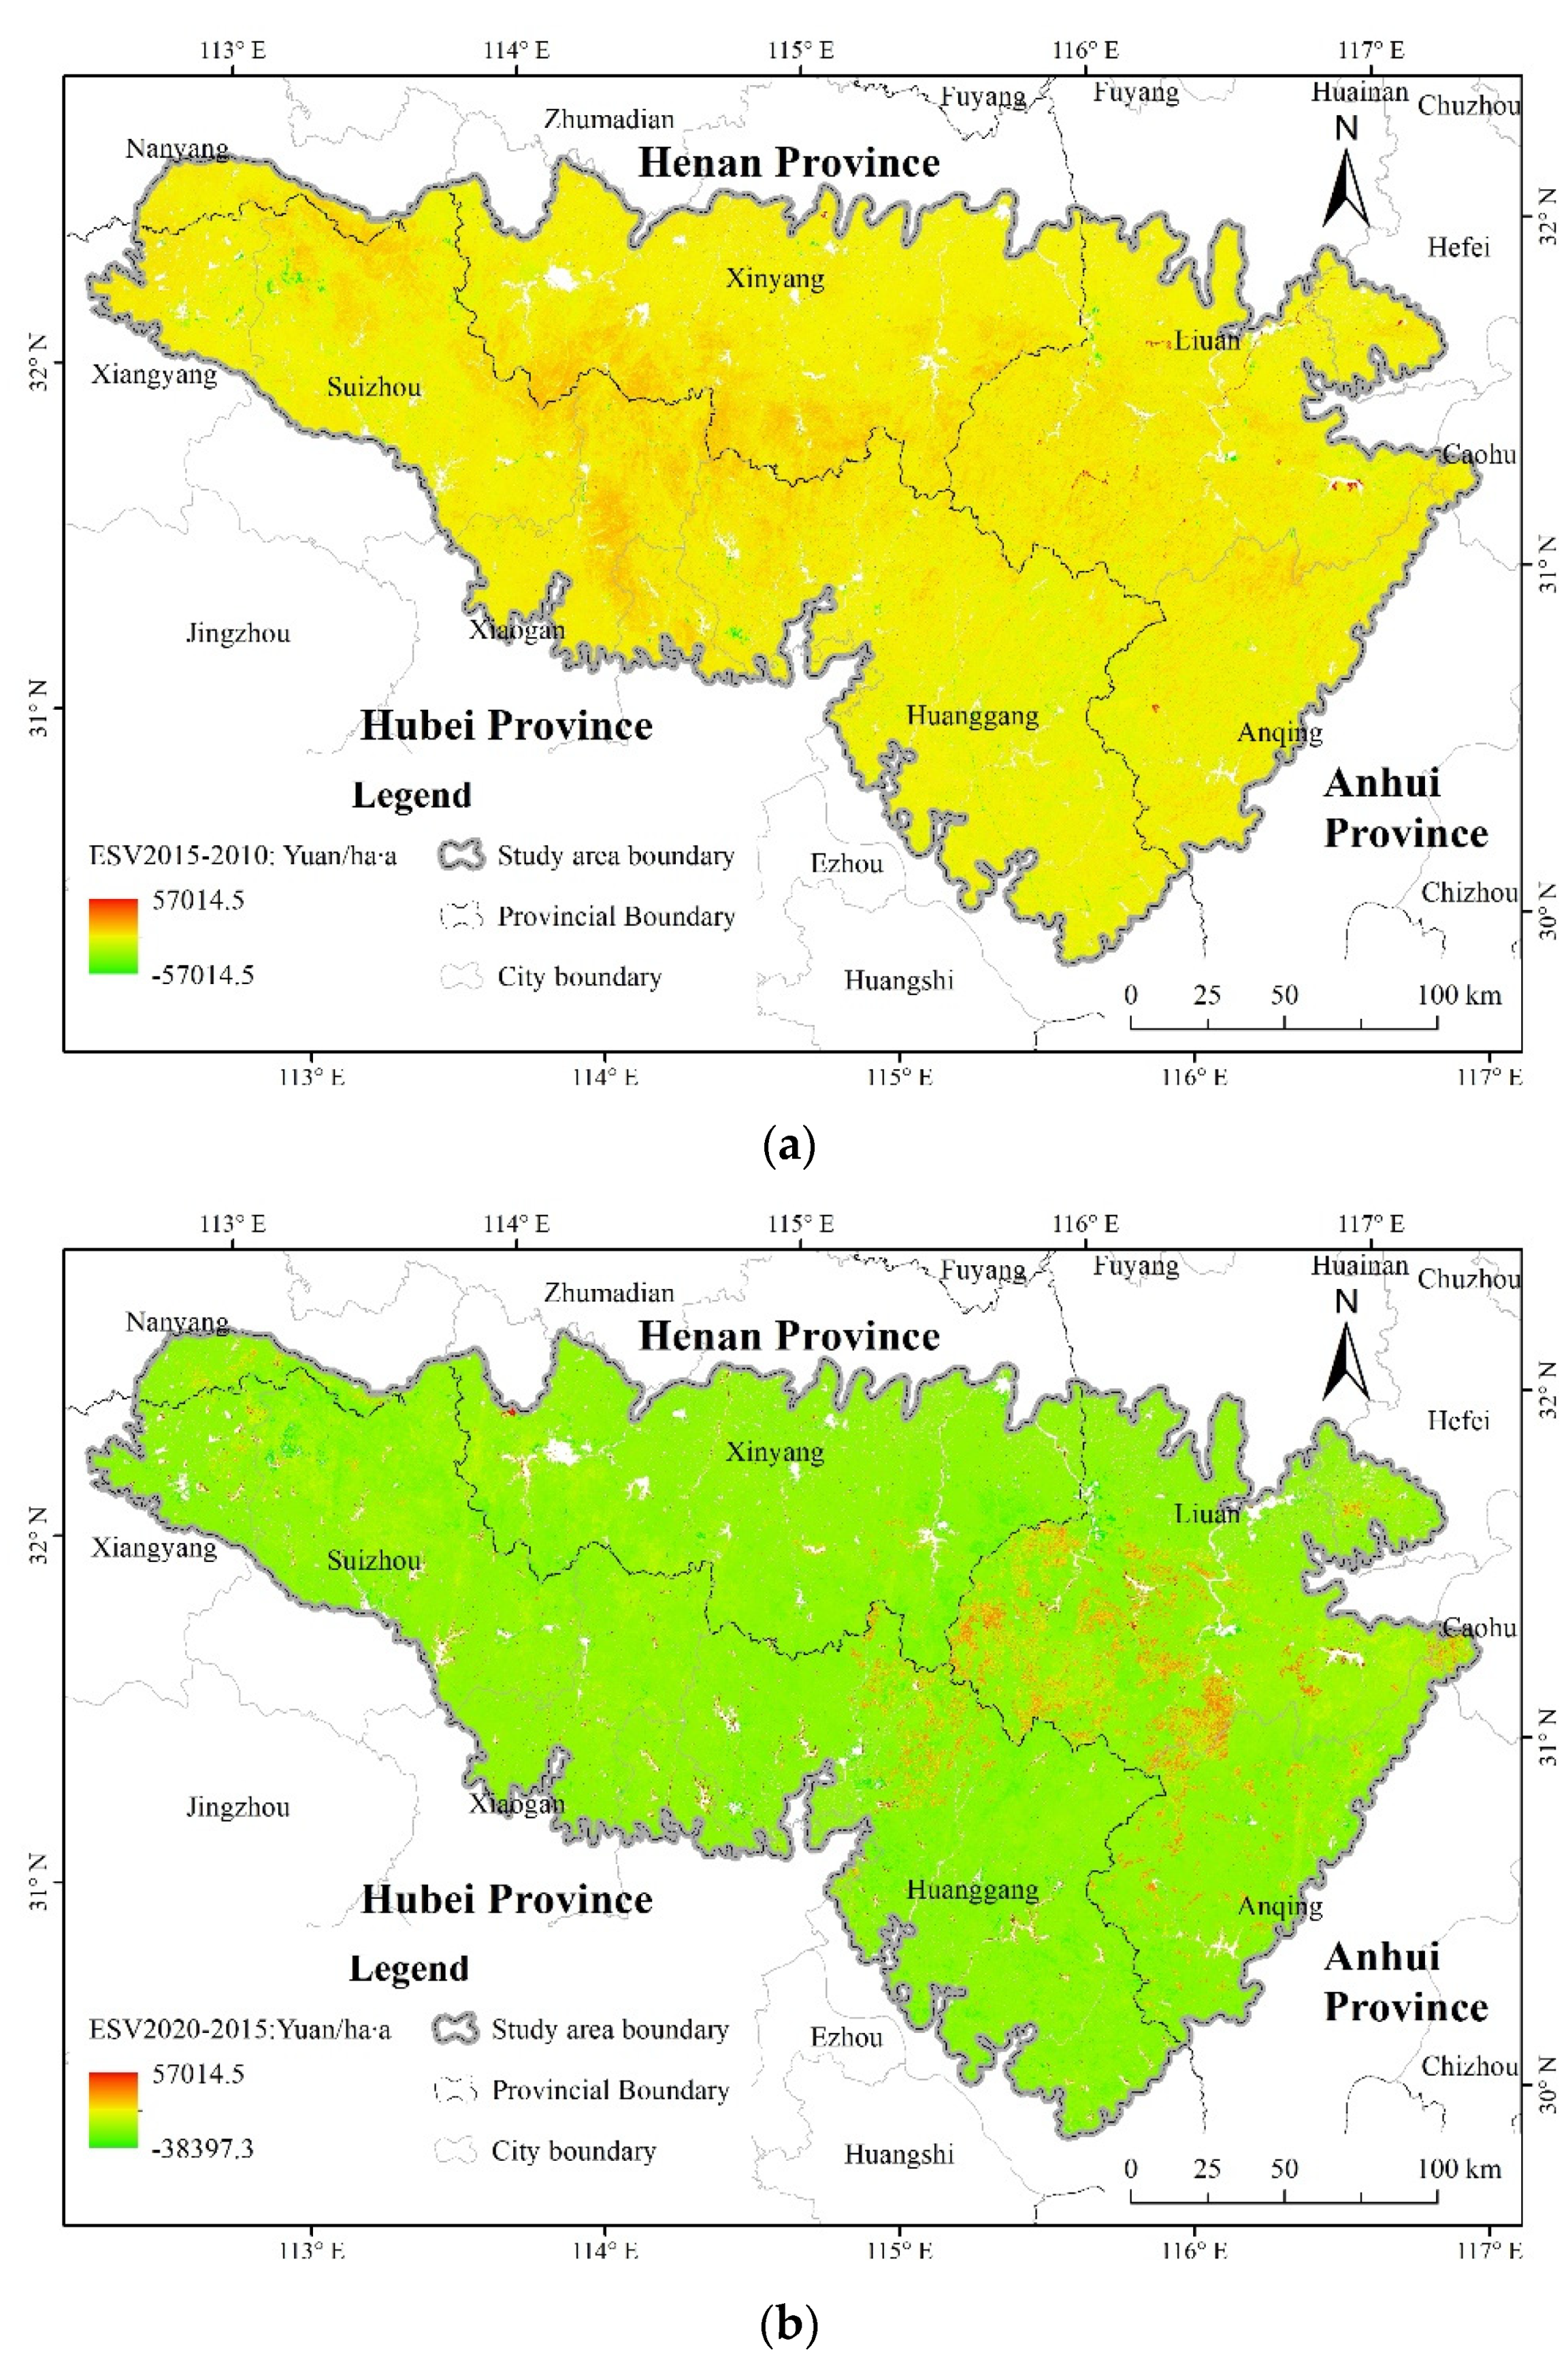
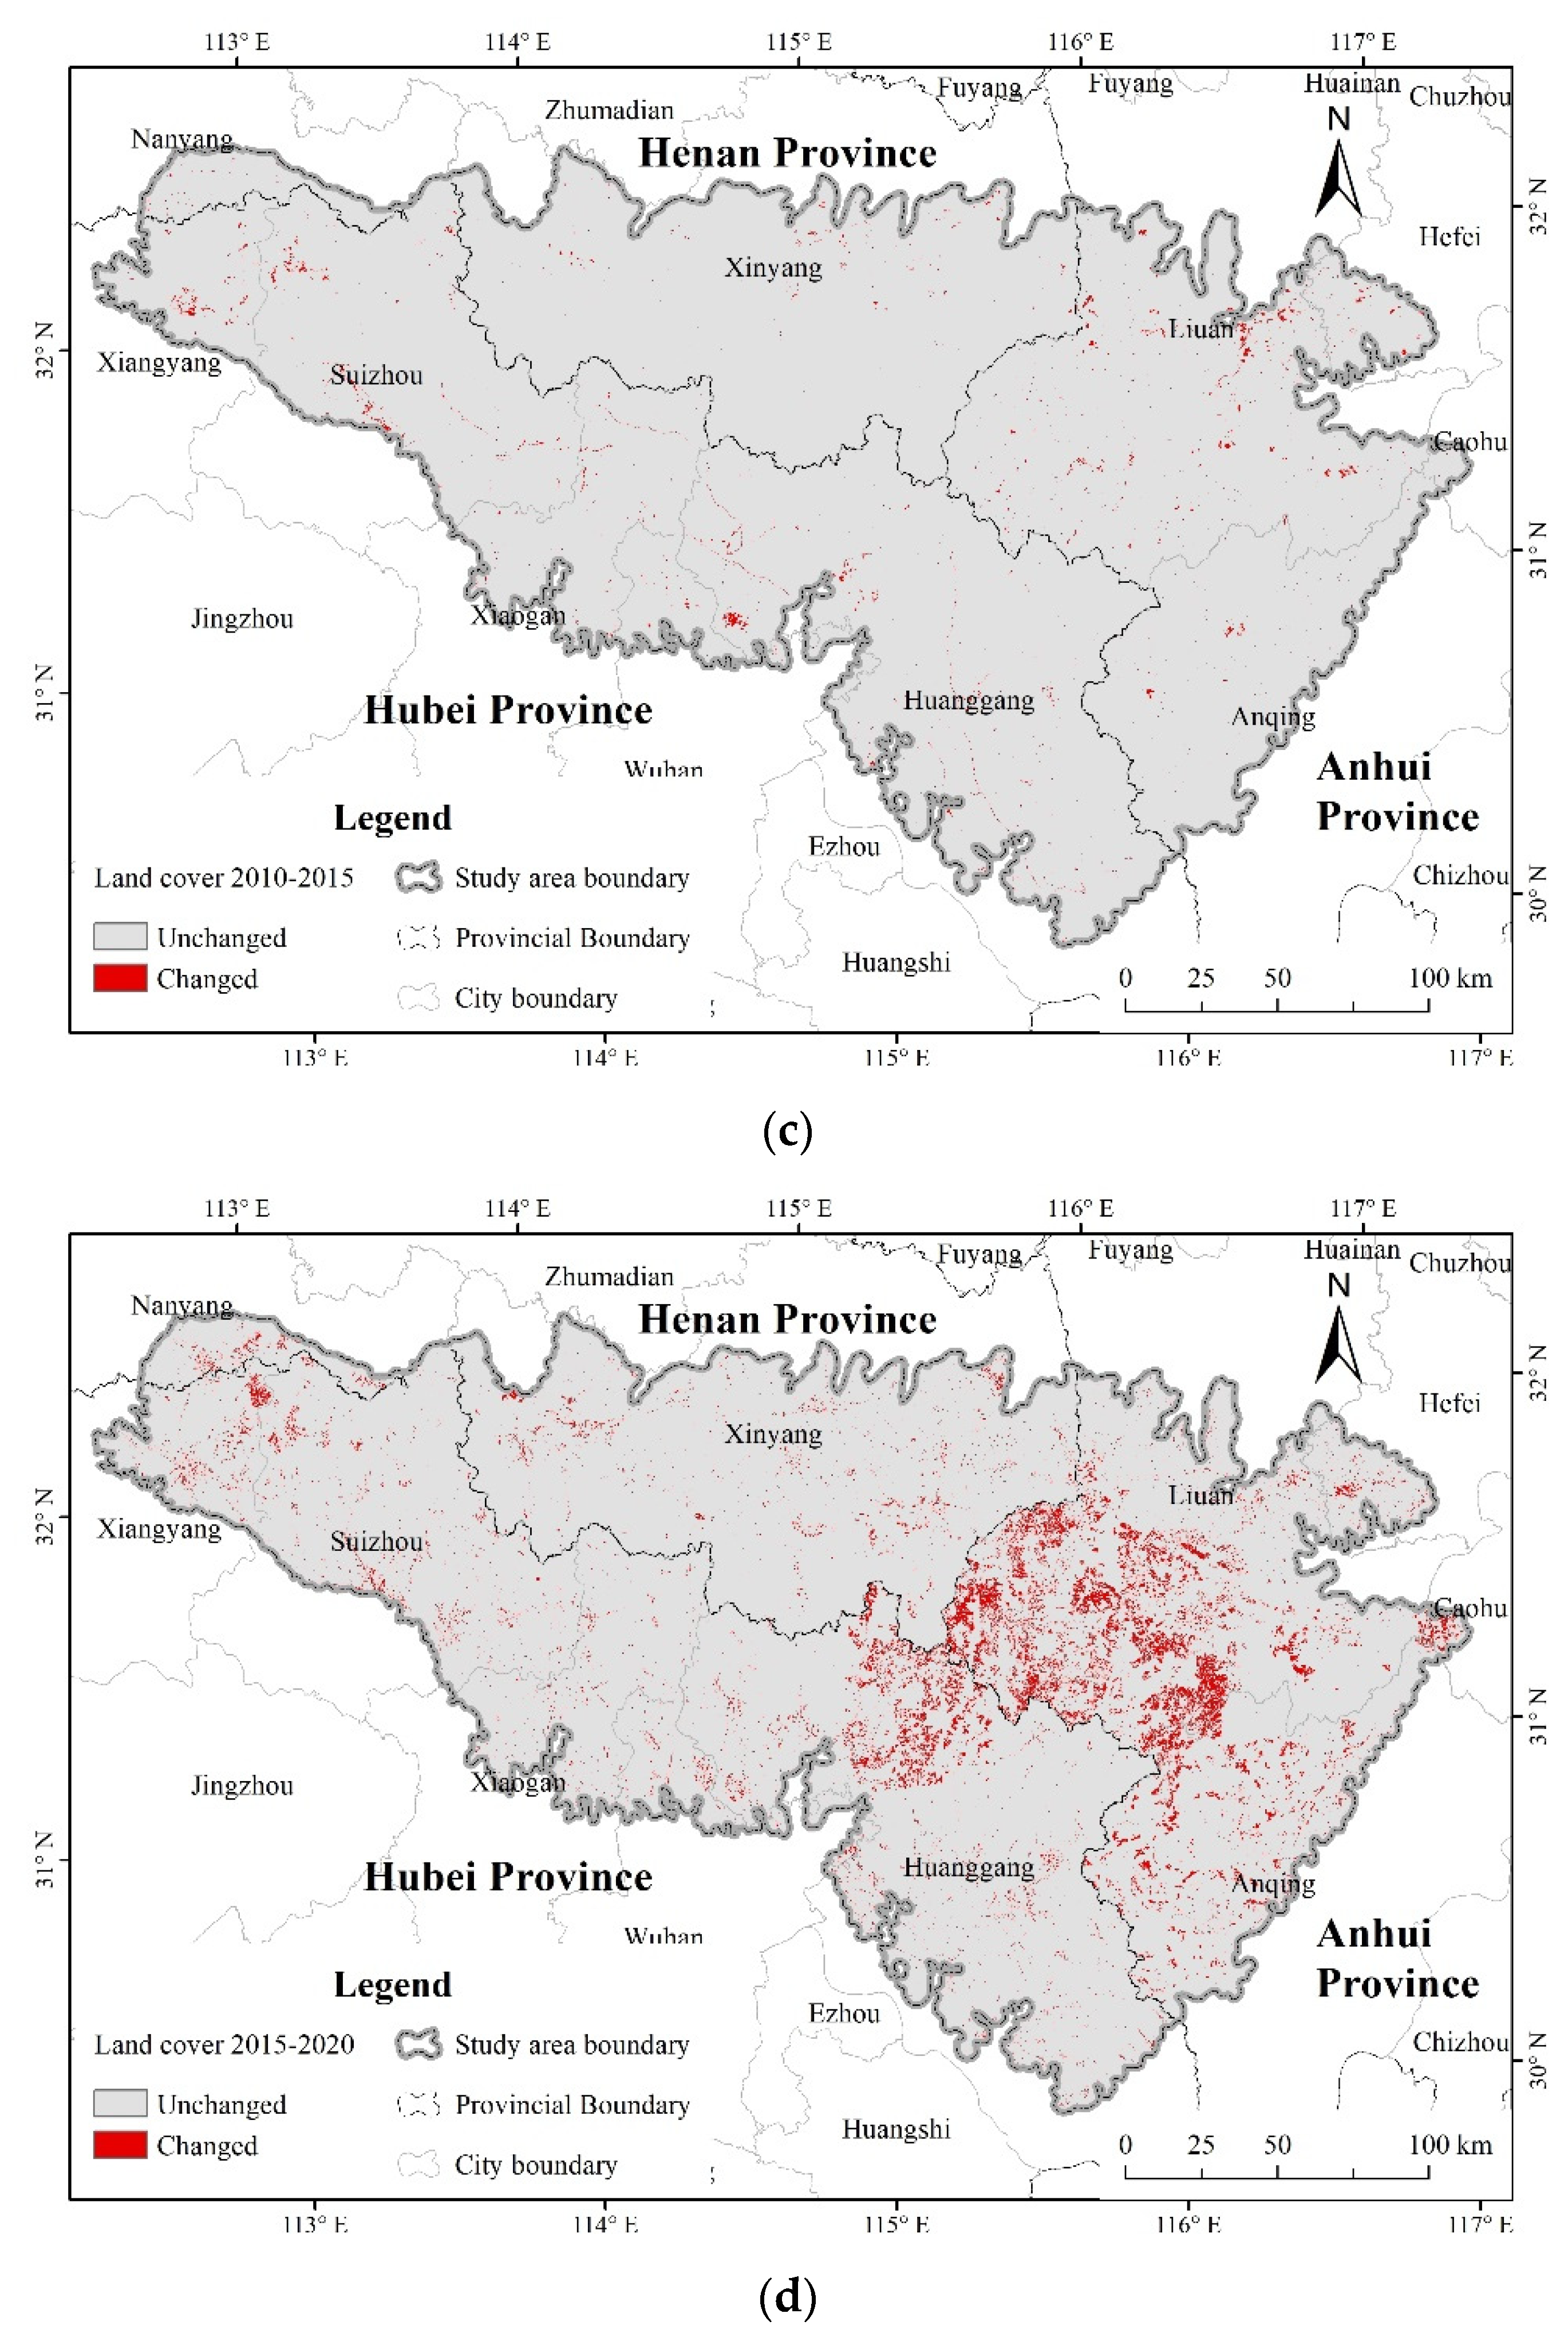
Based on the GIS spatial overlay analysis between ESV and land cover data in 2010 (2015) and 2015 (2020), the spatial change information can be obtained (Figure 5). From these datasets, the region and amplitude of interannual changes in land cover and ESV can be seen.

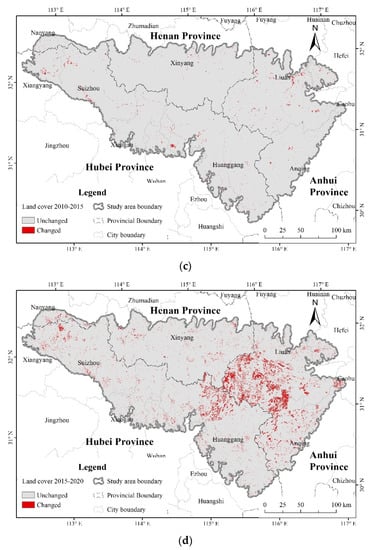
Figure 5.
Interannual variation in ESV and land cover in the study area: dynamic changes in ESV from (a) 2010 to 2015 and (b) 2015 to 2020; dynamic changes in land cover from (c) 2010 to 2015 and (d) 2015 to 2020.
From 2010 to 2015 (Figure 5a), increases in ESV mainly occur in the middle of the study area. This is mainly due to the change in vegetation statuses, such as the increase in biomass, vegetation coverage, and other parameters. The areas with sharp increase and decrease (dark red and dark green) are scattered throughout the study area, and the changes are mainly due to the change in land cover (Figure 5c), such as the decrease of farmland and the increase in built-up land (Table 3).
From 2015 to 2020 (Figure 5b), increases in ESV mainly occur in the central and eastern regions, mainly caused by the increase in forest land area and the decrease in grassland area (Figure 5d, Table 3). The reason for reduced ESV is still the reduction in farmland area and the increase in built-up land area, changes which are scattered throughout the study area. There are also ESV changes caused by the transformation of unused land to farmland, grassland to forest land in the west of the study area (Figure 5d, Table 3).
The response degree of ESV change to land cover change was calculated in the study area according to Formula (5), as shown in Table 4.
Table 4.
Changes in ecosystem service value and its response to land cover change according to ecosystem service function types.
During the entire period from 2010 to 2020, every 1 km2 change in land cover area would lead to a change of CNY 0.8132 million in ESV. ESV2 was the most sensitive, and its RDE is CNY 0.5329 million per square kilometer. From 2010 to 2015, the overall RDE was CNY 1.0094 million per square kilometer, of which ESV3 was the most sensitive, reaching CNY 0.4223 million per square kilometer, followed by ESV2 with CNY 0.3527 million per square kilometer. From 2015 to 2020, the overall RDE was CNY 0.9192 million per square kilometer, of which ESV2 was the most sensitive, reaching CNY 0.5795 million per square kilometer. If land cover changes from a low to high value type, its impact on ESV is positive; otherwise it is negative.
4.3. Relationship between ESV and Socioeconomic Development
Spatial analysis was used to obtain the area proportion of land cover types in each unit. From the statistical yearbooks, population density, GPD per unit area, and per capita disposable income was obtained. Then, correlation analysis was carried out between these parameters and ESV. The results are shown in Table 5.
Table 5.
Correlation coefficients between ecosystem service value and socioeconomic parameters.
It can be seen that all socioeconomic parameters are negatively correlated with ESV, indicating that the increase of human life and production intensity affected the improvement of ESV. Among them, the proportion of built-up land (PB) is the most relevant, indicating that human competition for ecological space with nature will greatly affect ESV. Although GDP per unit area (GP) shows a negative correlation, the correlation is not strong, indicating that the negative impact of GDP growth on ESV is not high. The correlation coefficient of per capita disposable income (PI) is the lowest. This means that although the population is increasing, there is no great contradiction between the improvement of human well-being and ESV with the development of the social economy. A harmonious relationship can form, and the harmonious coexistence between man and nature can be promoted. This can be explained by considering the actual situation, where the per capita disposable income increased from about CNY 4000 in 2010 to about CNY 14,000 in 2020 but the ESV did not decrease.
Among the land cover structure parameters, forest land (PF) and grassland (PG) show positive correlations. Among them, PF has the highest correlation, up to 0.9936, indicating that forest land contributed the most to the total ESV in this region. Farmland (PC), water body (PW), and unused land (PU) are negatively correlated, indicating that these three types tended to be transformed into land with a low-value coefficient, such as farmland into built-up land, in the transformation process of land cover structure from 2010 to 2020. In addition, the correlations of PG, PU, and ESV were very weak because the area of these three land cover types was very small and, thus, they had little impact on the total ESV.
5. Discussion
5.1. Significance of ESV Spatialization
ESV is an important index for measuring regional sustainable development. The research results of its temporal and spatial change and impact mechanisms are the premises of correct decision-making for ecosystem function regulation and optimization. Therefore, the evaluation from only the ESV quantity is not sufficient to support optimization and decision making. Hence, it is necessary to adjust the spatial distribution of ESV. Previous studies have adjusted ESV in space based on small administrative units or vegetation index data [37,42]. However, the use of administrative units for adjustment will lead to discontinuities in spatial changes. The vegetation index is often oversaturated and cannot correspond to the ecosystem service function of vegetation. NPP has a strong correlation with a variety of ecosystem service functions. For example, NPP is the result of the interaction between plant biological characteristics and the external environment, reflecting the function of organic matter production [55,56]; the organic matter of all vegetation has nutrient elements and undergoes exchange with the external environment, indicating the service function of promoting nutrient circulation [57]; the respiration of plants releases oxygen and fixes carbon dioxide, meaning regulation function [58,59]; long-term lush vegetation has greater NPP and stronger soil erosion protection ability and water conservation ability, showing water and soil conservation function [60,61]. Therefore, this study used NPP for spatial adjustment, which has more advantages than other methods.
5.2. Socioeconomic Parameters
It is necessary to strengthen the research on the mechanisms influencing ESV and its combination with various parameters, especially socioeconomic development parameters. The results can not only improve the explanatory aspect of ESV but also allow exploring the response relationship between the change in ESV and human well-being. It is thus more effective to explore the path where there is the coordination of ecological protection and human development. This study found that there is no contradictory relationship of human production and life with ESV, although there is a certain negative correlation, and ESV has improved in the past ten years in the Dabie Mountain area.
The socioeconomic connotations are very broad. The choice of socioeconomic parameters is also very important. By using parameters that truly reflect social and economic development, the interaction mechanism between social and economic development and ESV can be accurately determined and thus effectively assist decision-making. Based on the previous research results from the published literature, this study selected the parameters that reflect production, life, and human well−being. Therefore, the research results of this paper do not include all aspects of the social economy.
5.3. Improvement of Research Methods
The existing methods using the value coefficient to evaluate ESV can be improved in the following ways. (1) The value coefficient should be continuously improved according to the social and economic development and take into account the local characteristics of the study area. (2) The relationship between the value coefficients of land cover types should also be adjusted according to the characteristics of the region, so more detailed local investigations are needed. (3) More parameters that can objectively reflect the actual situation need to be integrated into the model, such as those reflecting vegetation status, terrain, and climate, to more objectively calculate ESV and research its impact mechanism.
6. Conclusions
Ecosystem service is the coupling and interactive link between the natural environment and human well-being. Monetizing the ecosystem services value can help public interpretation, improve public awareness, and promote the protection of the ecological environment. The novelty of this study is reflected in the following three aspects. Firstly, the adjustment method of the ESV spatial distribution based on NPP was proposed, which is more reasonable than the general vegetation index. Secondly, the response index of ESV to land cover change was proposed, which has a clear meaning and can quantitatively express the relationship between ESV and land cover change. Thirdly, several socioeconomic parameters with clear meaning were selected to study the relationship between ESV change and socioeconomic development from the perspective of time and space. The results can provide scientific support for the harmonious development of the social economy and ecosystem. The research conclusions are as follows.
This study calculated the ESV in the Dabie Mountain area based on localizing the value coefficient, which is an important reference. It was found that the total ESV first decreased and then increased, with an overall increase of CNY 3.895 billion from 2010 to 2020. This shows that the ecological environment of this region is generally improving and that there is no overdevelopment. Among the land cover types, the ESV of forest land is the highest and plays a leading role in the studied area. In terms of ecosystem service functions, the proportion of regulation services is the largest.
Because NPP has a strong correlation with ecosystem service functions, the spatial distribution of ESV in this study area can be clearly shown through the spatial adjustment of ESV based on NPP. The response of ESV to land cover change can be adequately explored when further combining land cover data and their temporal and spatial changes. In addition, how the change in land cover affects ESV can be understood through the response degree (RDE) presented in this paper. In the studied area, every 1 km2 change of land cover will lead to an ESV change of about CNY 1 million. This conclusion can provide a reference for the protection of the ecological environment in the Dabie Mountain area.
The relationship between production, life, and ESV and its impact on human well-being is among the issues that most concern mankind. This study selected parameters that can truly reflect human production, life, and well-being, and analyzed their relationship with ESV. The strongest negative correlation was found between built-up land area and ESV, indicating the disadvantage of competing with ecological land for space. In addition, this study also found that there is no obvious correlation between per capita disposable income and ESV, which means that a path of harmonious coexistence can be found between humans and nature toward ensuring the improvement of both human well-being and the ecological environment.
Author Contributions
Conceptualization, X.Z. and J.L.; methodology, X.Z., J.L. and L.C.; validation, Y.Z.; formal analysis, X.Z. and J.L.; writing—original draft preparation, J.L. and X.Z.; writing—review and editing, L.C., Z.Y. and Y.Z.; supervision, X.Z.; funding acquisition, X.Z., J.L. All authors have read and agreed to the published version of the manuscript.
Funding
This research was funded by the National Key Research and Development Program of China (2021YFE0106700); the Key Technologies R & D Program of Henan Province (212102110033); Training plan for young core teachers in Higher Vocational Schools in Henan Province (2020GZGG091); and the Key projects of the Joint Fund of the National Natural Science Foundation of China (U21A2014).
Institutional Review Board Statement
Not applicable.
Informed Consent Statement
Not applicable.
Data Availability Statement
Landsat 8 OLI data are openly available and NPP data can be calculated via the Google Earth Engine. The statistical data are openly available from the website of the Statistics Department of each province. Land cover data can be applied from the national earth system science data-sharing infrastructure, China.
Acknowledgments
We thank providers of the data for this research: land cover data from the national earth system science data-sharing infrastructure, China, and net primary productivity data from Google Earth Engine cloud platform. We are grateful to the anonymous reviewers whose constructive suggestions have improved the quality of this study.
Conflicts of Interest
The authors declare no conflict of interest.
References
- MEA (Millennium Ecosystem Assessment). Ecosystems and Human Wellbeing: A Framework for Assessment; World Resources Institute: Washington, DC, USA, 2003. [Google Scholar]
- Gashaw, T.; Tulu, T.; Argaw, M.; Worqlul, A.W.; Tolessa, T.; Kindu, M. Estimating the impacts of land use/land cover changes on Ecosystem Service Values: The case of the Andassa watershed in the Upper Blue Nile basin of Ethiopia. Ecosyst. Serv. 2018, 31, 219–228. [Google Scholar] [CrossRef]
- Rector, M.E.; Filgueira, R.; Grant, J. Ecosystem services in salmon aquaculture sustainability schemes. Ecosyst. Serv. 2021, 52, 1011379. [Google Scholar] [CrossRef]
- Zheng, H.; Ouyang, Z.; Zhao, T.; Li, Z.; Xu, W. The impact of human activities on ecosystem services. J. Nat. Resour. 2003, 18, 118–126. [Google Scholar]
- Millennium Ecosystem Assessment. Ecosystems and HumanWell-Being: Synthesis; Island Press: Washington, DC, USA, 2005. [Google Scholar]
- Xie, G.; Zhang, C.; Zhang, C.; Xiao, Y.; Lu, C. The value of ecosystem services in China. Resour. Sci. 2015, 37, 1740–1746. [Google Scholar]
- Zhao, Y.; Zhu, W.; Wei, P.; Fang, P.; Zhang, X.; Yan, N.; Liu, W. Classification of Zambian grasslands using random forest feature importance selection during the optimal phenological period. Ecol. Ind. 2022, 135, 108529. [Google Scholar] [CrossRef]
- Liu, G.; Yang, Q. Non-monetary accounting on ecosystem services valuation: Theory and methodology. Chin. J. Environ. Manag. 2018, 10, 10–20. [Google Scholar]
- Comberti, C.; Thornton, T.F.; de Echeverria, V.W.; Patterson, T. Ecosystem services or services to ecosystems? Valuing cultivation and reciprocal relationships between humans and ecosystems. Glob. Environ. Chang. 2015, 34, 247–262. [Google Scholar] [CrossRef] [Green Version]
- Costanza, R.; Kubiszewski, I. The authorship structure of ecosystem services as a transdisciplinary field of scholarship. Ecosyst. Serv. 2012, 1, 16–25. [Google Scholar] [CrossRef] [Green Version]
- Braat, L.; de Groot, R. The ecosystem services agenda: Bridging the worlds of natural science and economics, conservation and development, and public and private policy. Ecosyst. Serv. 2012, 1, 4–15. [Google Scholar] [CrossRef] [Green Version]
- Costanza, R.; de Groot, R.; Sutton, P. Changes in the global value of ecosystem services. Glob. Environ. Chang. 2014, 26, 152–158. [Google Scholar] [CrossRef]
- Liu, S.; Costanza, R.; Troy, A.; D’Aagostino, J.; Mates, W. Valuing New Jersey’s ecosystem services and natural capital: A spatially explicit benefit transfer approach. Environ. Manag. 2010, 45, 1271–1285. [Google Scholar] [CrossRef]
- Frélichová, J.; Vačkář, D.; Pártl, A.; Loučková, B.; Harmáčková, Z.V.; Lorencová, E. Integrated assessment of ecosystem services in the Czech Republic. Ecosyst. Serv. 2014, 8, 110–117. [Google Scholar] [CrossRef]
- Zhang, X.; Qiu, F.; Qin, F. Identification and mapping of winter wheat by integrating temporal change information and Kullback–Leibler divergence. Int. J. Appl. Earth Obs. Geoinf. 2019, 76, 26–39. [Google Scholar] [CrossRef]
- Schägner, J.P.; Brander, L.; Maes, J.; Hartje, V. Mapping ecosystem services’ values: Current practice and future prospects. Ecosyst. Serv. 2013, 4, 33–46. [Google Scholar] [CrossRef] [Green Version]
- Bateman, I.J.; Harwood, A.R.; Mace, G.M.; Watson, R.T.; Abson, D.J.; Andrews, B.; Binner, A.; Crowe, A.; Day, B.H.; Dugdale, S.; et al. Bringing ecosystem services into economic decision-making: Land use in the United Kingdom. Science 2013, 341, 45–50. [Google Scholar] [CrossRef]
- Morshed, S.R.; Fattah, M.A.; Haque, M.N.; Morshed, S.Y. Future ecosystem service value modeling with land cover dynamics by using machine learning based Artificial Neural Network model for Jashore city, Bangladesh. Phys. Chem. Earth 2021, 103021. [Google Scholar] [CrossRef]
- Li, S. Reflections on ecosystem service research. Landsc. Archit. Front. 2019, 7, 82–87. [Google Scholar] [CrossRef]
- Crossman, N.D.; Bryan, B.A. Identifying cost- effective hotspots for restoring natural capital and enhancing landscape multi-functionality. Ecol. Econ. 2009, 68, 654–668. [Google Scholar] [CrossRef]
- Crossman, N.D.; Bryan, B.A.; Summers, D.M. Carbon payments and low-cost conservation. Conserv. Biol. 2011, 25, 835–845. [Google Scholar] [CrossRef]
- De Groot, R.; Brander, L.; van der Ploeg, S.; Costanza, R.; Bernard, F.; Braat, L.; Christie, M.; Crossman, N.; Ghermandi, A.; Hein, L.; et al. Global estimates of the value of ecosystems and their services in monetary units. Ecosyst. Serv. 2012, 1, 50–61. [Google Scholar] [CrossRef]
- Kreuter, U.; Harris, H.; Matlock, M.; Lacey, R. Change in ecosystem service values in the San Antonio area. Texas. Ecol. Econ. 2001, 39, 333–346. [Google Scholar] [CrossRef]
- Li, R.; Dong, M.; Cui, J.; Zhang, L.; Cui, Q.; He, W. Quantification of the impact of land-use changes on ecosystem services: A case study in Pingbian County. China. Environ. Monit. Assess. 2007, 128, 503–510. [Google Scholar] [CrossRef]
- Tolessa, T.; Senbeta, F.; Kidane, M. The impact of land use/land cover change on ecosystem services in the central highlands of Ethiopia. Ecosyst. Serv. 2017, 23, 47–54. [Google Scholar] [CrossRef]
- Wang, Z.; Zhang, B.; Zhang, S.; Li, X.; Liu, D.; Song, K.; Li, J.; Li, F.; Duan, H. Changes of land use and of ecosystem service values in Sanjiang Plain, Northeast China. Environ. Monit. Assess. 2006, 112, 69–91. [Google Scholar] [CrossRef]
- Limburg, K.E.; O’Neill, R.V.; Costanza, R.; Farber, S. Complex systems and valuation. Ecol. Econ. 2002, 41, 409–420. [Google Scholar] [CrossRef]
- Hein, L.; van Koppen, K.; de Groot, R.S.; van Ierland, E.C. Spatial scales, stakeholders and the valuation of ecosystem services. Ecol. Econ. 2006, 57, 209–228. [Google Scholar] [CrossRef]
- Maes, J.; Egoh, B.; Willemen, L.; Liquete, C.; Vihervaara, P.; Schägner, J.P.; Grizzetti, B.; Drakou, E.G.; La Notte, A.; Zulian, G.; et al. Mapping ecosystem services for policy support and decision making in the European Union. Ecosyst. Serv. 2012, 1, 31–39. [Google Scholar] [CrossRef]
- Wang, X.; Dong, X.; Liu, H.; Wei, H.; Fan, W.; Lu, N.; Xu, Z.; Ren, J.; Xing, K. Linking land use change, ecosystem services and human well-being: A casestudy of the Manas River Basin of Xinjiang, China. Ecosyst. Serv. 2017, 27, 113–123. [Google Scholar] [CrossRef]
- Zhang, M.; Yuan, N.; Lin, H.; Liu, Y.; Zhang, H. Quantitative estimation of the factors impacting spatiotemporal variation in NPP in the Dongting Lake wetlands using Landsat time series data for the last two decades. Ecol. Ind. 2022, 135, 108544. [Google Scholar] [CrossRef]
- Deng, X.; Yan, S.; Song, X.; Li, Z.; Mao, J. Spatial targets and payment modes of win–win payments for ecosystem services and poverty reduction. Ecol. Ind. 2022, 136, 108612. [Google Scholar] [CrossRef]
- Nelson, E.; Mendoza, G.; Regetz, J.; Polasky, S.; Tallis, H.; Cameron, R.; Chan, K.M.; Daily, G.C.; Goldstein, J.; Kareiva, P.M.; et al. Modeling multiple ecosystem services, biodiversity conservation, commodity production, and tradeoffs at landscape scales. Front. Ecol. Environ. 2009, 7, 4–11. [Google Scholar] [CrossRef]
- Pagdee, A.; Kawasaki, J. The importance of community perceptions and capacity building in payment for ecosystems services: A case study at Phu Kao, Thailand. Ecosyst. Serv. 2021, 47, 101224. [Google Scholar] [CrossRef]
- Shiferaw, H.; Bewket, W.; Alamirew, T.; Zeleke, G.; Teketay, D.; Bekele, K.; Schaffner, U.; Eckert, S. Implications of land use/land cover dynamics and Prosopis invasion on ecosystem service values in Afar Region, Ethiopia. Sci. Total Environ. 2019, 675, 354–366. [Google Scholar] [CrossRef] [PubMed]
- Li, W.; Yi, P.; Zhang, D.; Zhou, Y. Assessment of coordinated development between social economy and ecological environment: Case study of resource-based cities in Northeastern China. Sustain. Cities Soc. 2020, 59, 102208. [Google Scholar] [CrossRef]
- Huang, M.; Yue, W.; Feng, S.; Cai, J. Analysis of spatial heterogeneity of ecological security based on MCR model and ecological pattern optimization in the Yuexi county of the Dabie Mountain Area. J. Nat. Resour. 2019, 34, 771–784. [Google Scholar] [CrossRef]
- Song, W.; Deng, X.Z. Land use/land cover change and ecosystem service provision in China. Sci. Total Environ. 2017, 576, 705–719. [Google Scholar] [CrossRef]
- Wang, Y.H.; Dai, E.F.; Yin, L.; Ma, L. Land use/land cover change and the effects on ecosystem services in the Hengduan Mountain region, China. Ecosyst. Serv. 2018, 34, 55–67. [Google Scholar] [CrossRef]
- Costanza, R.; d’Arge, R.; de Groot, R.; Farberk, S.; Grasso, M.; Hannon, B.; Limburg, K.; Naeem, S.; O’Neill, R.; Paruelo, J.; et al. The value of the world’s ecosystem services and natural capital. Nature 1997, 387, 253–260. [Google Scholar] [CrossRef]
- Xie, G.; Zhen, L.; Lu, C.; Xiao, Y.; Chen, C. Expert knowledge based valuation method of ecosystem services in China. J. Nat. Resour. 2008, 23, 911–919. [Google Scholar]
- Liu, Z.; Wang, S.; Fang, C. Spatiotemporal evolution and influencing mechanism of ecosystem service value in the Guangdong-Hong Kong-Macao Greater Bay Area. ACTA Geogr. Sin. 2021, 76, 2798–2813. [Google Scholar]
- Tian, S.; Xu, J.; Wang, Y. Human infrastructure development drives decline in suitable habitat for Reeves’s pheasant in the Dabie Mountains in the last 20 years. Glob. Ecol. Conserv. 2020, 22, e00940. [Google Scholar] [CrossRef]
- Available online: https://earthengine.google.com/ (accessed on 20 December 2021).
- Available online: http://www.geodata.cn/ (accessed on 15 December 2021).
- De Groot, R.S.; Wilson, M.A.; Boumans, R.M. A typology for the classification, description and valuation of ecosystem functions, goods and services. Ecol. Econ. 2002, 4, 393–408. [Google Scholar] [CrossRef] [Green Version]
- Styers, D.M.; Chappelka, A.H.; Marzen, L.J.; Somers, G.L. Developing a land-cover classification to select indicators of forest ecosystem health in a rapidly urbanizing landscape. Landsc. Urban Plann. 2010, 94, 158–165. [Google Scholar] [CrossRef]
- Borck, R.; Schrauth, P. Population density and urban air quality. Reg. Sci. Urban Econ. 2021, 86, 103596. [Google Scholar] [CrossRef]
- Sng, O.; Ackerman, J.M. Too many people, women, men? The psychological effects of population density and sex ratio. Curr. Opin. Psychol. 2020, 32, 38–42. [Google Scholar] [CrossRef]
- Pan, W.; Ghoshal, G.; Krumme, C.; Cebrian, M.; Pentland, A. Urban characteristics attributable to density-driven tie formation. Nat. Commun. 2013, 4, 1961. [Google Scholar] [CrossRef] [Green Version]
- Nzabarinda, V.; Bao, A.; Xu, W.; Uwamahoro, S.; Huang, X.; Gao, Z.; Umugwaneza, A.; Kayumba, P.M.; Maniraho, A.P.; Jiang, Z. Impact of cropland development intensity and expansion on natural vegetation in different African countries. Ecol. Inform. 2021, 64, 101359. [Google Scholar] [CrossRef]
- Shi, X.; Zhou, F.; Wang, Z. Research on optimization of ecological service function and planning control of land resources planning based on ecological protection and restoration. Environ. Technol. Innov. 2021, 24, 101904. [Google Scholar] [CrossRef]
- Li, J.; Ouyang, X.; Zhu, X. Land space simulation of urban agglomerations from the perspective of the symbiosis of urban devel-opment and ecological protection: A case study of Changsha-Zhuzhou-Xiangtan urban agglomeration. Ecol. Ind. 2021, 126, 107669. [Google Scholar] [CrossRef]
- Zhang, W. Social capital, income and subjective well-being: Evidence in rural China. Heliyon 2022, 8, e08705. [Google Scholar] [CrossRef]
- Kovalev, A.A.; Kovalev, D.A.; Litti, Y.V.; Katraeva, I.V. Biohydrogen production in the two-stage process of anaerobic bio-conversion of organic matter of liquid organic waste with recirculation of digister effluent. Int. J. Hydrog. Energy 2020, 45, 26831–26839. [Google Scholar] [CrossRef]
- Fang, P.; Yan, N.; Wei, P.; Zhao, Y.; Zhang, X. Aboveground Biomass Mapping of Crops Supported by Improved CASA Model and Sentinel-2 Multispectral Imagery. Remote Sens. 2021, 13, 2755. [Google Scholar] [CrossRef]
- Ghiloufi, W.; Chaieb, M. Environmental factors controlling vegetation attributes, soil nutrients and hydrolases in South Mediterranean arid grasslands. Ecol. Eng. 2021, 161, 106155. [Google Scholar] [CrossRef]
- Zhang, G.; Liu, J.; Li, J.; Li, P.; Wei, P.; Xu, B. Radiocarbon isotope technique as a powerful tool in tracking anthropogenic emissions of carbonaceous air pollutants and greenhouse gases: A review. Fundam. Res. 2021, 1, 206–306. [Google Scholar] [CrossRef]
- Zhang, L.; Zhang, B.; Li, W.; Li, X.; Sun, L.; Jiang, L.; Liu, X. Spatiotemporal changes and drivers of global land vegetation oxygen production between 2001 and 2010. Ecol. Ind. 2018, 90, 426–437. [Google Scholar] [CrossRef]
- Zhang, X.; Wu, B.; Ling, F.; Zeng, Y.; Yan, N.; Yuan, C. Identification of priority areas for controlling soil erosion. Catena 2010, 83, 76–86. [Google Scholar] [CrossRef]
- Xu, J.; Zhang, Y.; Huang, C.; Zeng, L.; Teng, M.; Wang, P.; Xiao, W. Forest restoration shows uneven impacts on soil erosion, net primary productivity and livelihoods of local households. Ecol. Ind. 2022, 134, 108462. [Google Scholar] [CrossRef]

Publisher’s Note: MDPI stays neutral with regard to jurisdictional claims in published maps and institutional affiliations. |
© 2022 by the authors. Licensee MDPI, Basel, Switzerland. This article is an open access article distributed under the terms and conditions of the Creative Commons Attribution (CC BY) license (https://creativecommons.org/licenses/by/4.0/).