Communication

Sentinel-1 Satellite Radar Images: A New Source of Information for Study of River Channel Dynamics on the Lower Vistula River, Poland

by
Klaudia Kryniecka
1,
Artur Magnuszewski
1,* and
Artur Radecki-Pawlik
2
1
Hydrology Department, Faculty of Geography and Regional Studies, University of Warsaw, Krakowskie Przedmieście 30, 00-927 Warsaw, Poland
2
Division of Structural Mechanics and Material Mechanics, Faculty of Civil Engineering, Cracow University of Technology, Warszawska 24, 31-155 Krakow, Poland
*
Author to whom correspondence should be addressed.
Remote Sens. 2022, 14(5), 1056; https://doi.org/10.3390/rs14051056
Submission received: 13 January 2022 / Revised: 17 February 2022 / Accepted: 18 February 2022 / Published: 22 February 2022

Abstract

:
The amount of sediments transported by a river is difficult to estimate, while this parameter could influence channel geometry. It is possible to derive the bedload transport rate per unit width of the river channel by measuring the migration distance of bedform profiles over time and thickness of bedload layer in motion. Other possible methods include instrumental measurements using bedload traps and empirical formulas. It is possible to use remote-sensing techniques to measure the dynamics of bedform movements and geometries. Landsat images and aerial photographs have been used for this. A new source of remote-sensing information is radar satellite images. Sentinel-1 images have a temporal resolution of 2–3 days and spatial resolution of 25 m at middle latitudes, which make them usable on large rivers. The research area is the 814–820 km reach of the Lower Vistula River, where seven alternate sandbars were selected. The bank lines of the sandbars were delineated on Sentinel-1 images sensed during two low-flow periods of 4 August–26 September 2018 and 1 July–31 August 2019, when discharges at low flow were similar. From water stage observations at gauges, water elevations were assigned to every bank line of the alternate sandbars. The following morphometric parameters were calculated: alternate sandbar centers, volumes and longitudinal profile. Average daily movement of the sandbars in the period 4 August 2018–1 July 2019 was calculated as 0.97 m·day−1. A similar alternate sandbar movement velocity was obtained from a study of Sentinel-2 optical satellite images and hydro-acoustic measurements on the Lower Vistula River. Having depth of bedload in motion and alternate sandbar shift velocities, it was possible to calculate the rate of bedload transport according to the Exner approach formula. Rate of bedload transport was estimated as qb = 0.027 kg·s−1·m−1. This study shows a novel use of Sentinel-1 images to study the 3D geometry and movement rate of sandbars.

1. Introduction

Sediment transported by rivers can be divided into suspended load and bedload. The bedload consists of grains that are moving above the bottom of the river by rolling and saltation. Suspended sediment is transported in the water column in turbulent flow. Characteristic for bedload transport are temporal changes resulting from the downstream migration of differently sized bedforms such as ripplemarks, dunes, and sandbars [1].
Alternate sandbars are sediment accumulation forms in the riverbed. They can be described as a sequence of large-scale deposition bumps and scour holes that occupy alternate sides of the channel, showing diagonal fronts [2]. Since their size is similar to river channel cross-section dimensions (depth and width), they are called meso-forms. The term “alternate” refers to their location in a regular pattern close to the left and right banks of the river channel, creating a sinuous thalweg pattern. Their location and movement influence navigation conditions and flood risk during winter at the time of ice run [3,4]. Alternate sandbars are essential elements of the morphology of the Vistula riverbed, but they are also common on other regulated rivers with a large transport of bedload, such as the upper Rhine and Loire [5,6]. Interesting questions for such rivers are how big the transport of sediment is and what the intensity of the transport processes is. These questions are relevant for studies of fluvial processes and for practical issues of river training and inland navigation. To estimate the bedload transport, bedload samplers are used for measurements, and a number of empirical formulas have been developed. It is also possible to estimate bedload transport observing the movement velocity and height of bedforms. This method is called the “dune tracking method” by some authors [7], by analogy for meso-forms, it is the “sandbar tracking method”. The background of this approach is the relationship between river channel form and process, in which we assume that the river channel morphology is both a control and a consequence of fluvial processes. The significance of that relationship is expressed in many studies, such as Brasington et al. [8] or Lane et al. [9].
The first approach to relate velocity of water and deformation of river channel geometry can be found in the classical work of Exner [10]. Exner proposed that the rate of change of the local elevation z of the alluvial bed of a river can be related to spatial variation of the depth-averaged water velocity. Higher velocity causes higher shear stress and higher bedload transport and eventually bed erosion. In a given time interval, bedload transported by the river causes channel bed deformations. Bottom elevation changes are related to sediment transport in the equation of conservation of mass [11]. In a one-dimensional case, this is:
Δ z Δ t + 1 1 η Δ q Δ x = 0
where Δz is bed elevation change (m), x is distance in the horizontal coordinate (m), Δt is time step [s], η is sediment porosity, and Δq is volumetric bedload sediment transport rate (m2·s−1). This equation in the Eulerian framework assumes solid matter flux and mass balance with constant density, in defined space and time lag [12].
Using the relationship expressed by Equation (1), it is possible to calculate bedload transport rate per unit width of the channel by measuring bedform migration length (Δl) in time (Δt) and height of bedload in motion (hb).
Velocity of bedform movement vb (m·s−1) is:
v b = Δ l Δ t
and the sediment transport rate qb (kg·s−1·m−1) can be calculated using the formula from Exner’s approach [10]:
q b = α × v b × h b × ρ b
where α is coefficient of bedform shape, hb is height of bedload in motion (m), vb is velocity of bedform movement (m·s−1), ρb is sediment density (kg·m3). The coefficient of bedform shape is α = 0.5 if the shape is simplified to a triangle. In reality, the section area of the bedform is slightly bigger than a triangle, and the coefficient of bedform shape can be α = 0.6 [13].
Formula (3) can be applied for data obtained from laboratory flumes [14] and for echo-sounding profiles repeated in longitudinal profiles [15,16]. In the 1960s, tests were performed using radioactive isotopes submerged in the bottom of the river to measure the level of radiation attenuation caused by the passage of bedforms above the place of isotope installation [17]. The level of radiation attenuation was related to changes in hb, and its changes were recorded in time Δt to give the velocity of bedform movement.
The method of bedform velocity movement detection by echo-sounding is limited to tracking over intervals of a few days, which can be used to show short-period migration rates of individual dunes. The sandbar tracking method requires much longer observations. However, owing to operational constraints, survey vessels can rarely be used to track sandbars for longer periods, such as months [18].
In Poland, the first field measurements of bedload on the Lower Vistula River were performed in 1924 using a bedload trap designed by Artur Born. Based on those measurements, the bedload transport at Toruń gauge (735 km) was estimated as 28,000 m3·year−1 [19]. The efficiency of the Born bedload trap was only 10%, which means that the real bedload transport was ten times higher.
In the 1960s, there was growing interest in instrumental measurements of bedload. In Poland, a bedload trap called the PIHM was constructed and used for field measurements. The bedload trap had an inlet width of 40 cm and was rather heavy—103 kg. The efficiency coefficient of the PIHM bedload trap was estimated as 41% [13]. Research on bedload trap errors has shown that measurement on the Vistula River requires repetitions in bedload trap installation at verticals to obtain a random uncertainty of 70%. The time required for such a measurement was around 12 h [20]. This practical limitation on the use of the bedload trap restricted the measurements to experimental studies only.
Estimation of the bedload transport intensity for practical applications is often based on empirical formulas. In Polish rivers, the accepted formulas for bedload transport in lowland rivers are those of Goncarov [21], Samov [22], Meyer-Peter and Müller [23]. Skibiński [24] has also prepared his own empirical formula based on results of field measurements using a PIHM bedload trap for major Polish lowland rivers, including the lower reach of the Vistula River.
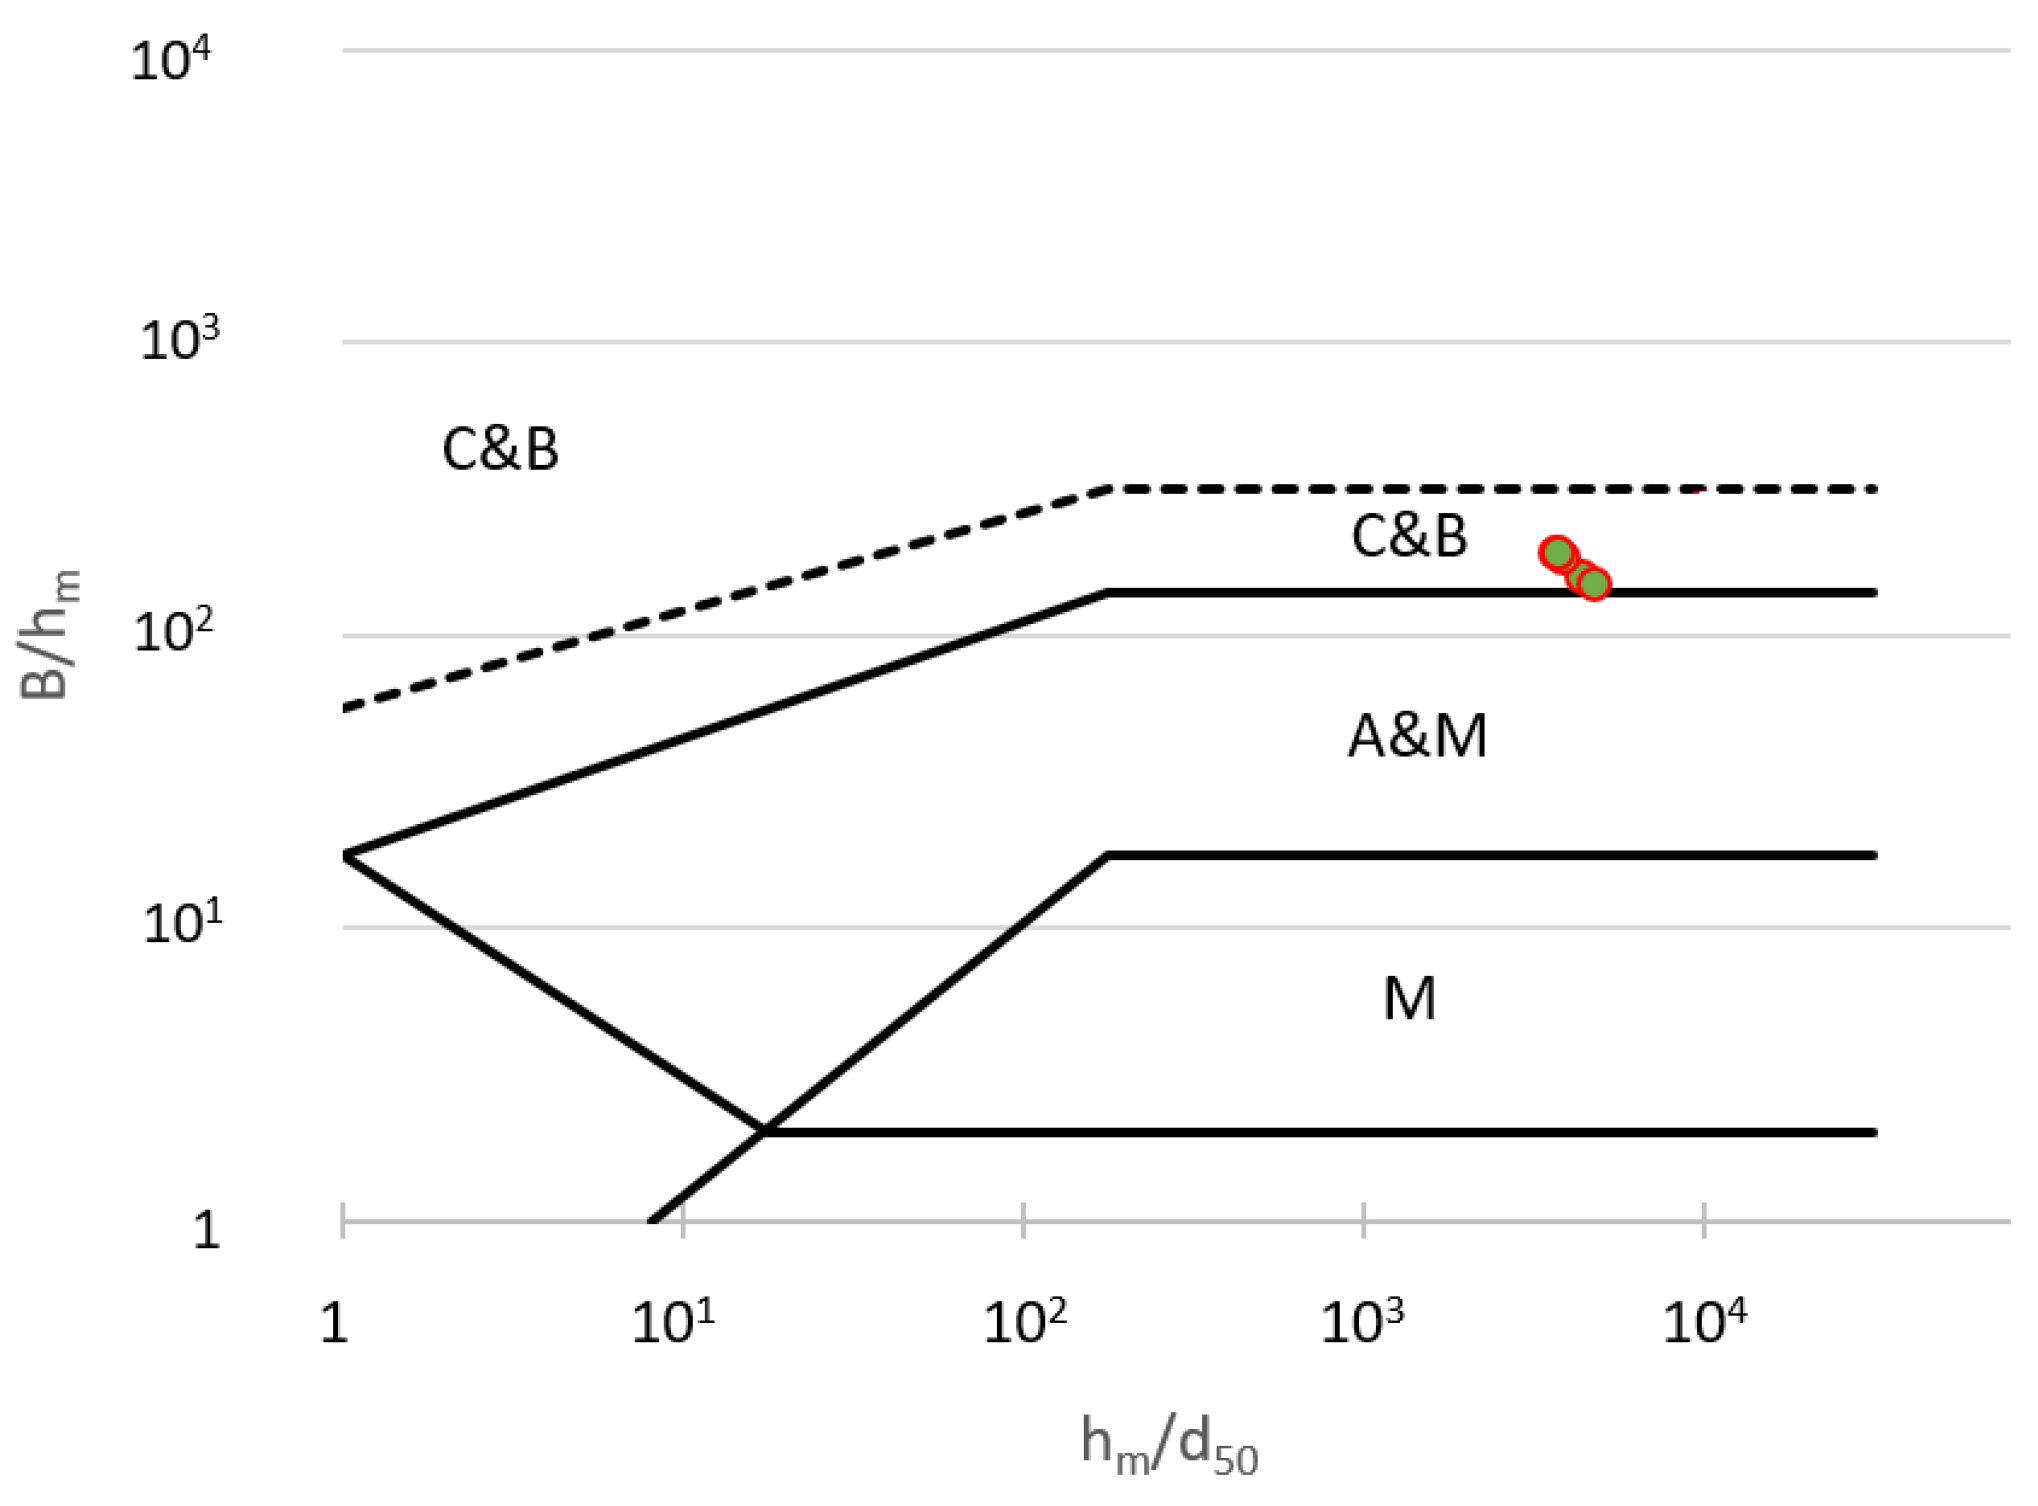
Studies on river channel hydraulics and morphology use dimensionless indices. According to Ahmari and da Silva [25], a river channel’s meso-form type can be classified by the two dimensionless parameters B/hm and hm/d50 (B—channel width (m), hm—average depth (m), d50—representative sediment grain diameter (m)).
Another dimensionless index used in river channel geometry description is bedform steepness. Bedform steepness can be applied to a wide spectrum of forms, from ripplemarks to large dunes. It is calculated as the ratio between bedform height h and bedform length l. Carling et al. [18] used the bedform steepness index to describe the geometry of channel forms on the Rhine River near Mainz. They found a good relationship between the h/l index for large bedforms measured in the field and that calculated from the empirical equation proposed by Ashley [26], Formula (4).
h l = 0.1027 ×   l 0.6149
where h is dune height (m) and l is dune length (m).
In studies of river sediment transport, we assume that the channel sandbars can capture a substantial amount of the sediment transported during floods [7]. Valuable data source for the dynamics study of channel forms on large rivers are remote-sensing optical images, such as from the Landsat satellite missions. Due to the time-resolution limitations of optical satellite images, such studies concentrate on detecting long-term changes. Detection of changes in emerged channel bar area on the Mississippi River by analysis of a sequence of Landsat satellite images was presented by Wang and Xu [27]. Landsat images were also used to observe geometry changes on a large sandbar on the middle Yangtze River [28]. Landsat 4-5-TM, Landsat-8-OLI and Sentinel-2-MSI images were used to study the hydro-morphological evolution of the Po River in Italy [29]
The aim of this paper is to study the dynamics of alternate sandbars and sediment transport rate of the Lower Vistula River using new remote-sensing data obtained from the synthetic aperture radar (SAR) of the Sentinel-1 satellite. Sentinel-1 images have recently been easily available in real time from a domestic receiving center in Poland. The high frequency of image recording makes it a valuable source of information on dynamic channel processes. To check the applicability of our approach, we use classical empirical formulas for bedload transport that have already been tested on the Vistula and that are considered to be reliable for such a river. For our research, we also use hydrological data from gauging stations, as well as hydraulic parameters from discharge measurements.

2. Materials and Methods

2.1. Research Area

The catchment area of the Vistula River is 194·103 km2 and the total length is 1047 km, but for navigation purposes, the beginning of the Vistula River chainage (length measurement) starts at the Upper Vistula River’s confluence with the Przemsza River (0 km) and continues to the artificial cut-off of the Lower Vistula River into the Bay of Gdansk (939 km). The section of the Lower Vistula starts below the Włocławek Reservoir (679 km). Hydrological measurements of the river are performed by the Institute of Meteorology and Water Management (IMGW—Instytut Meteorologii i Gospodarki Wodnej). Long-term hydrological data are available from the following gauges: Toruń (735 km), Chełmno (807 km), Grudziądz (835 km), and Tczew (909 km). Characteristic discharges from the period 1951–90 on the Lower Vistula River at Toruń and Tczew gauges are shown in Table 1.
According to run-off magnitude, the Vistula River is the second largest river in the Baltic Sea basin, with an average discharge at the mouth of the river at the Tczew gauge of MMQ = 1080 m3·s−1 [30]. The hydrological regime of the Lower Vistula River shows two periods of high flows related to spring snow-cover melting time (March–April) and summer floods caused by the high precipitation in June–July. Low flows start at the end of summer and may continue through winter. Habel [31] has calculated the duration of low-flow conditions at the Fordon gauge at 774.9 km and states that, in wet years (discharge equal to and higher than MHQ), water levels drop below mean low water stages for 90 days a year, and that, in dry years (annual mean discharge equal and below MLQ), this occurs on 200 days.
Starting from the end of the 18th century, the Lower Vistula River below 718 km on the territory of Prussia was protected from flooding by a system of dikes. The need to protect the dikes and reduce the risk of winter ice jams brought about a plan for river channel regulation. Works on channel regulation were performed in the years 1856–78 according to the design of Prussian engineer Sewerin. In that period, 599 groins, 91 side arm closings and 2173 km of longitudinal dams were built. In the natural conditions before regulation, the average width of the Lower Vistula River channel on the 719–814 km reach was 785 m [32]. According to the design, the width of the regulated channel on 735–886 km was set to 375 m for mean discharge [33]. At the beginning of the 20th century, it became clear that the regulation works had not improved navigation conditions. The channel of the Lower Vistula River had been excessively straightened and left too wide for average discharge [34].
The sediment of the Lower Vistula River is composed of a 99.6% share of fine sand in the samples [35]. The representative diameter (median value on sieve curve) of bedload grain is d50 = 0.5 mm [36]. In the suspended sediment, the silt fraction dominates, constituting 55–70% of the sample weight, with fine sand making up 20–30% and the remaining fraction being clay. In the riverbed of the Lower Vistula, the diameter of suspended sediments is d50 = 0.02 mm [37].
For the study of alternate sandbar volumes and dynamics, the subsection of the Lower Vistula River at 814–820 km was selected and represents a straight, regulated reach of the channel (Figure 1).
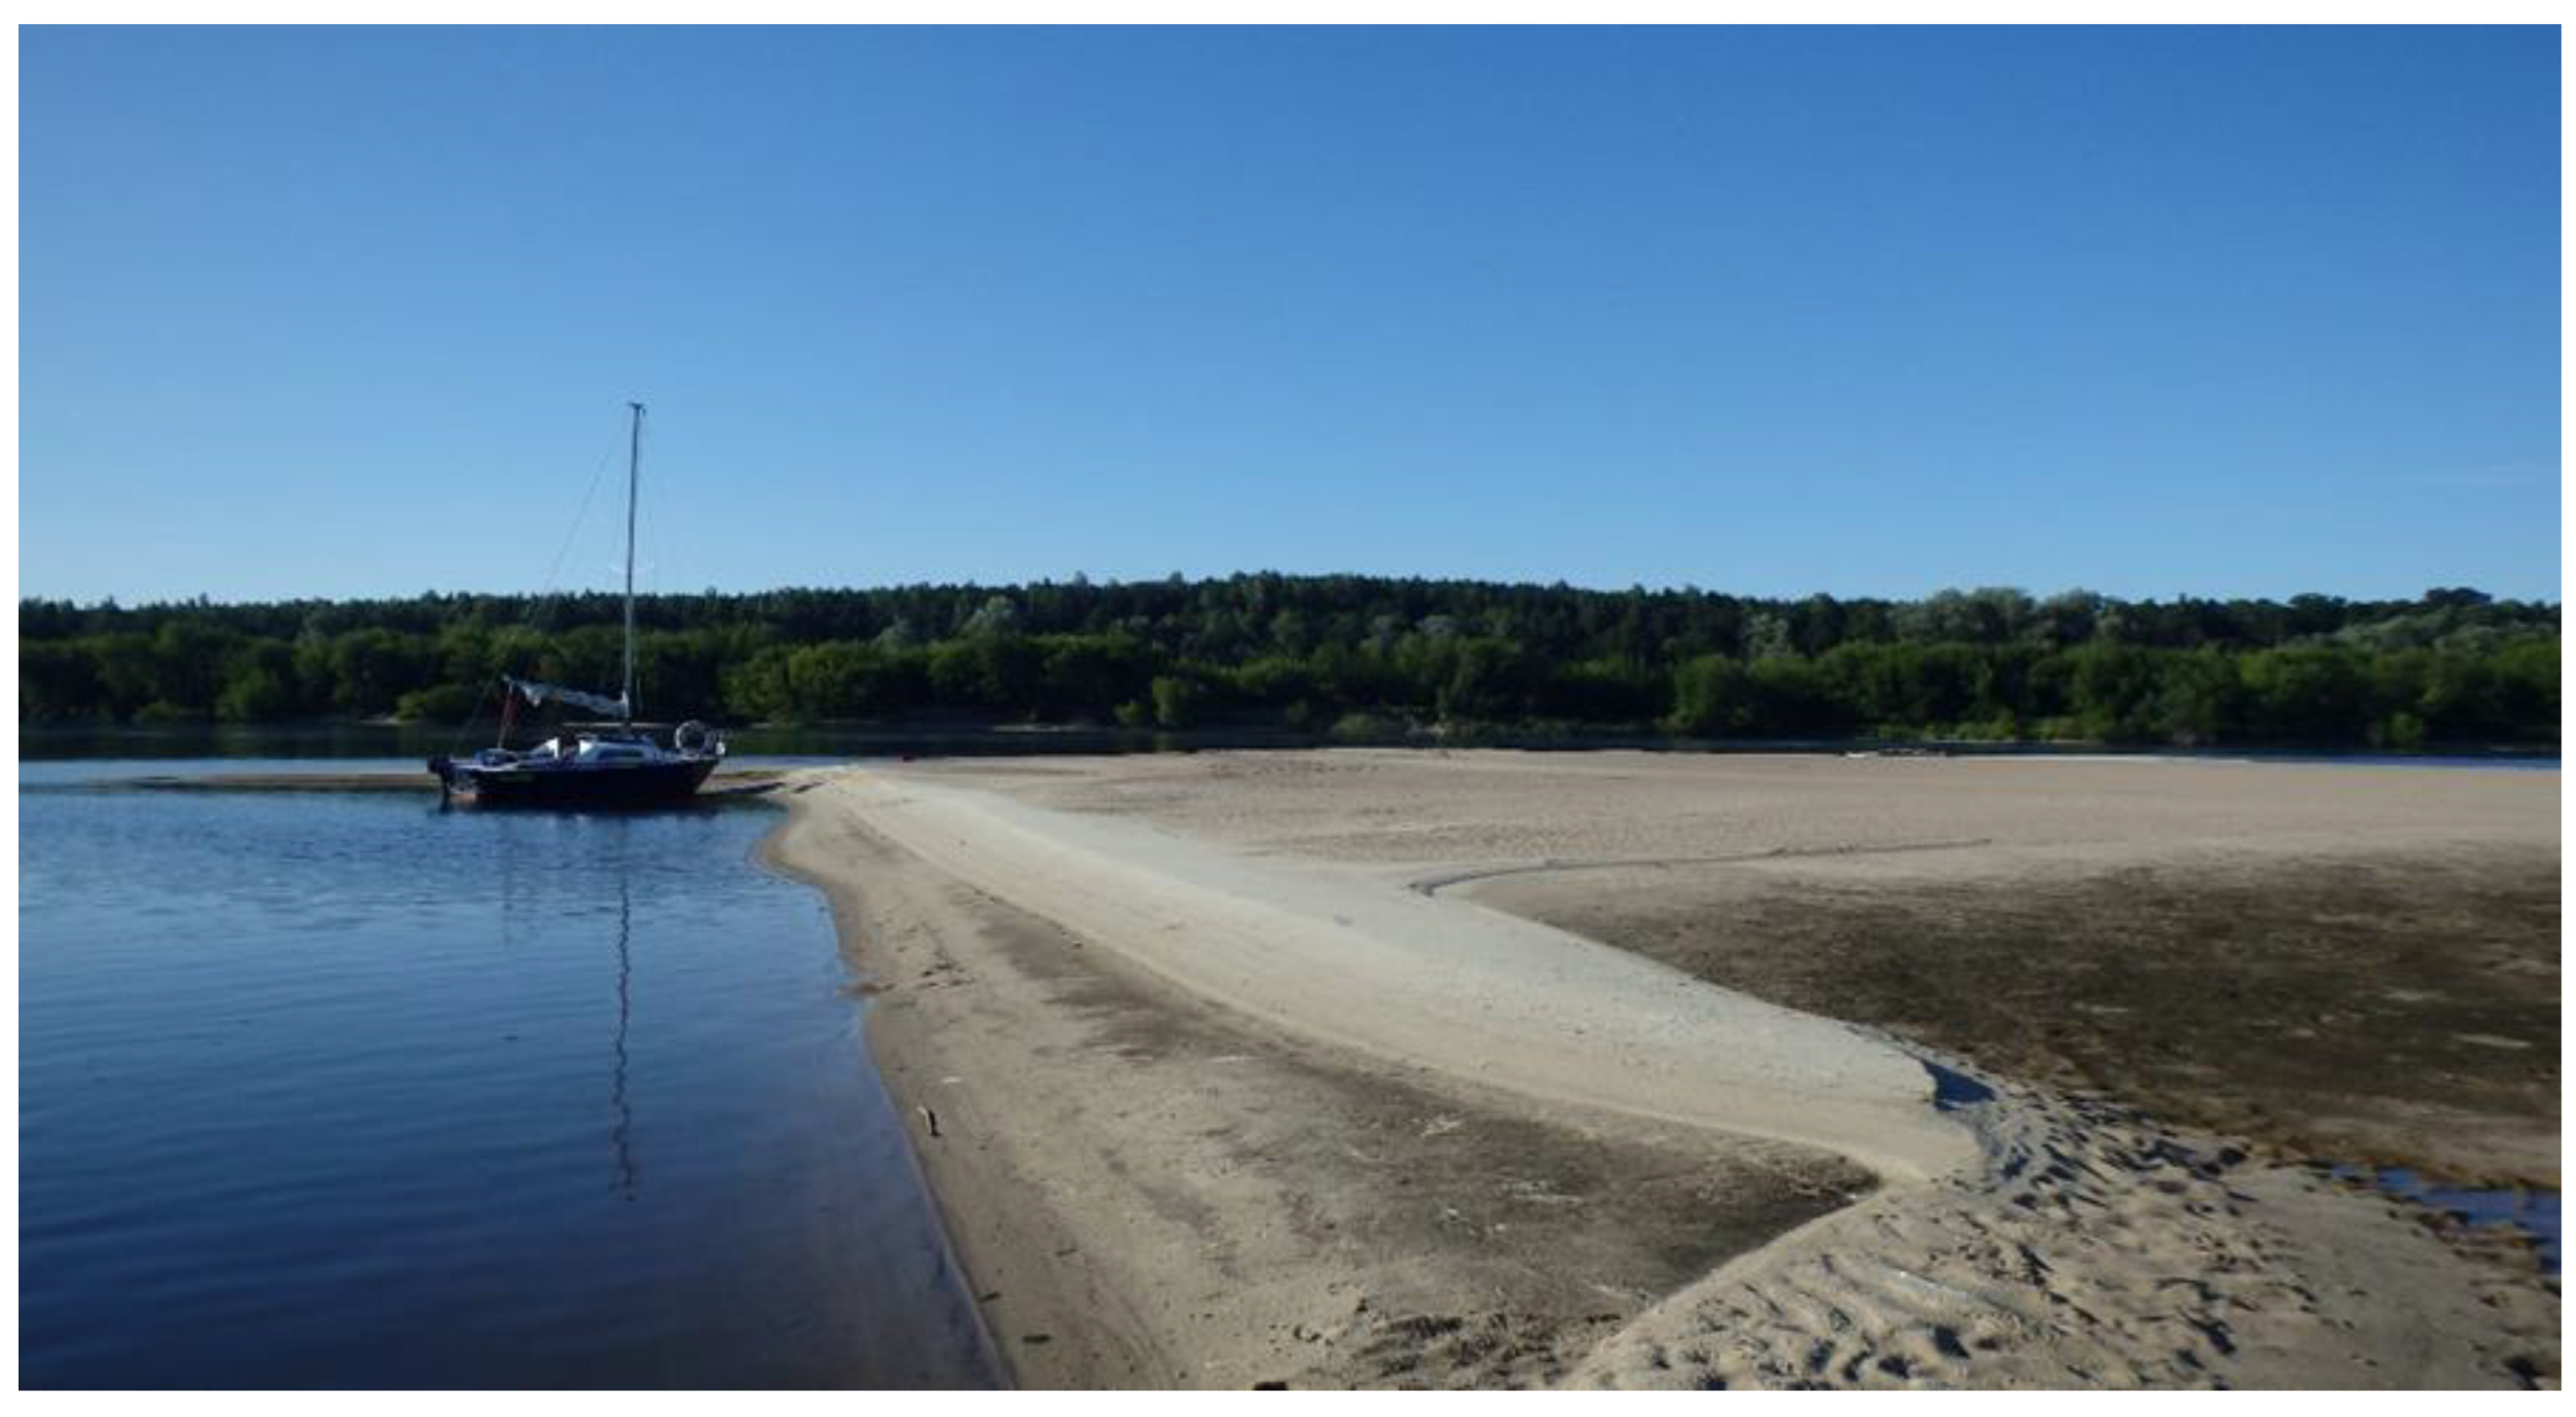
The morphology of alternate sandbars may change multiple times a year, depending on water levels [32]. At low-flow conditions, the edges of alternate bars tend to erode, while even minor floods and inundation of the sandbars tend to alter the sandbar surfaces and move them downstream. The relief of the sandbars exhibits a coexistence of smaller forms on their surfaces, such as dunes and ripplemarks (Figure 2).

2.2. River Channel Properties

Field measurements performed by Habel [35] on the Silno and Toruń river section (721–735 km) show that longitudinal slope does not vary, regardless of discharge, and is equal to the range of I = 0.000165 ÷ 0.000176. A calculation of longitudinal slope between Grudziądz and Chełmno hydrological gauges gives similar results of I = 0.0002
The formula developed by Du Boys [38] can be used to calculate the shear stress force imposed on a unit area of riverbed and controlling the movement of sediments:
τ = ρ × g × h × I
where τ is shear stress in N·m−2, ρ is water density in kg·m−3, g is the Earth’s gravity in m·s−2, h is the depth of the water in m, and I is the hydraulic slope.
Values of the hydraulic parameters describing conditions of the Lower Vistula River have been taken from hydrometrical measurements made at the Grudziądz gauge cross-section by the Institute of Meteorology and Water Management (IMGW). In the research area, at the low flows, the average depth in the cross-section of Grudziądz gauge is in the range of hm = 1.8–2 m. Taking average depth hm = 1.9 m, we obtain a value of shear stress from Formula (5) for Grudziądz τ = 3.7 N·m−2. These can be compared to critical shear stress τcr values that represent the initial movement of bottom sediments. The critical value of shear stress τcr can be calculated with the equation developed by Meyer-Peter and Müller [23]
τ cr = 0.047 ( ρ s ρ ) g × d 50
where τcr is the critical value of shear stress in N·m−2 starting the movement of the bedload material, ρ s is sediment density 2520 kg·m−3, ρ is water density in 1000 kg·m−3, g is the Earth’s gravity 9.81 m·s−2, and d50 = 0.0005 m is the representative bedload grain-size diameter. The critical shear stress value τcr calculated for low-flow conditions is equal to 0.35 N·m−2. The comparison of critical shear stress τcr and shear stress τ at low-flow conditions shows that, in the regulated reach, the Vistula River has an excess of energy for the transport of sediments and can easily move the sediments forming the channel bottom and alternate sandbars, even at low-flow conditions.
The type of river channel geometry is determined by the two dimensionless indices B/hm and hm/d50 and can be shown on the graph of Ahmari and da Silva [25] in Figure 3. The indices indicate that low flows in the Lower Vistula River create hydraulic conditions for the formation of meso-forms located in the transition area between multiple bars and alternate bars.

2.3. Data Sources

Sentinel-1, according to sentinel.esa.int [39], comprises circumpolar twin radar satellites. They are moving on the same orbital plane, which guarantees a revisit time of 2–3 days at middle latitudes. The Sentinel-1 mission operates in the C microwave band, providing two modes of polarization. High resolution (HR), Ground Range Detected Geo-referenced Product (GRD) in the Interferometric Wide Swath Mode (IW) were used to carry out the analysis. This product offers images in VH polarization channel, in which the signal is sent in vertical polarization and returned in horizontal polarization, and VV polarization channel, in which signals are sent and received in vertical polarization. The resolution of the SAR instrument in the GRDH product is 25 m, and the swath width is 400 km.
The advantage of radar images is that they are not dependent on time of day or cloud cover, which is important for observing dynamic processes. Sentinel-1 images were obtained from Alaska Satellite Facility [40] and Sat4Envi [41] data repositories.
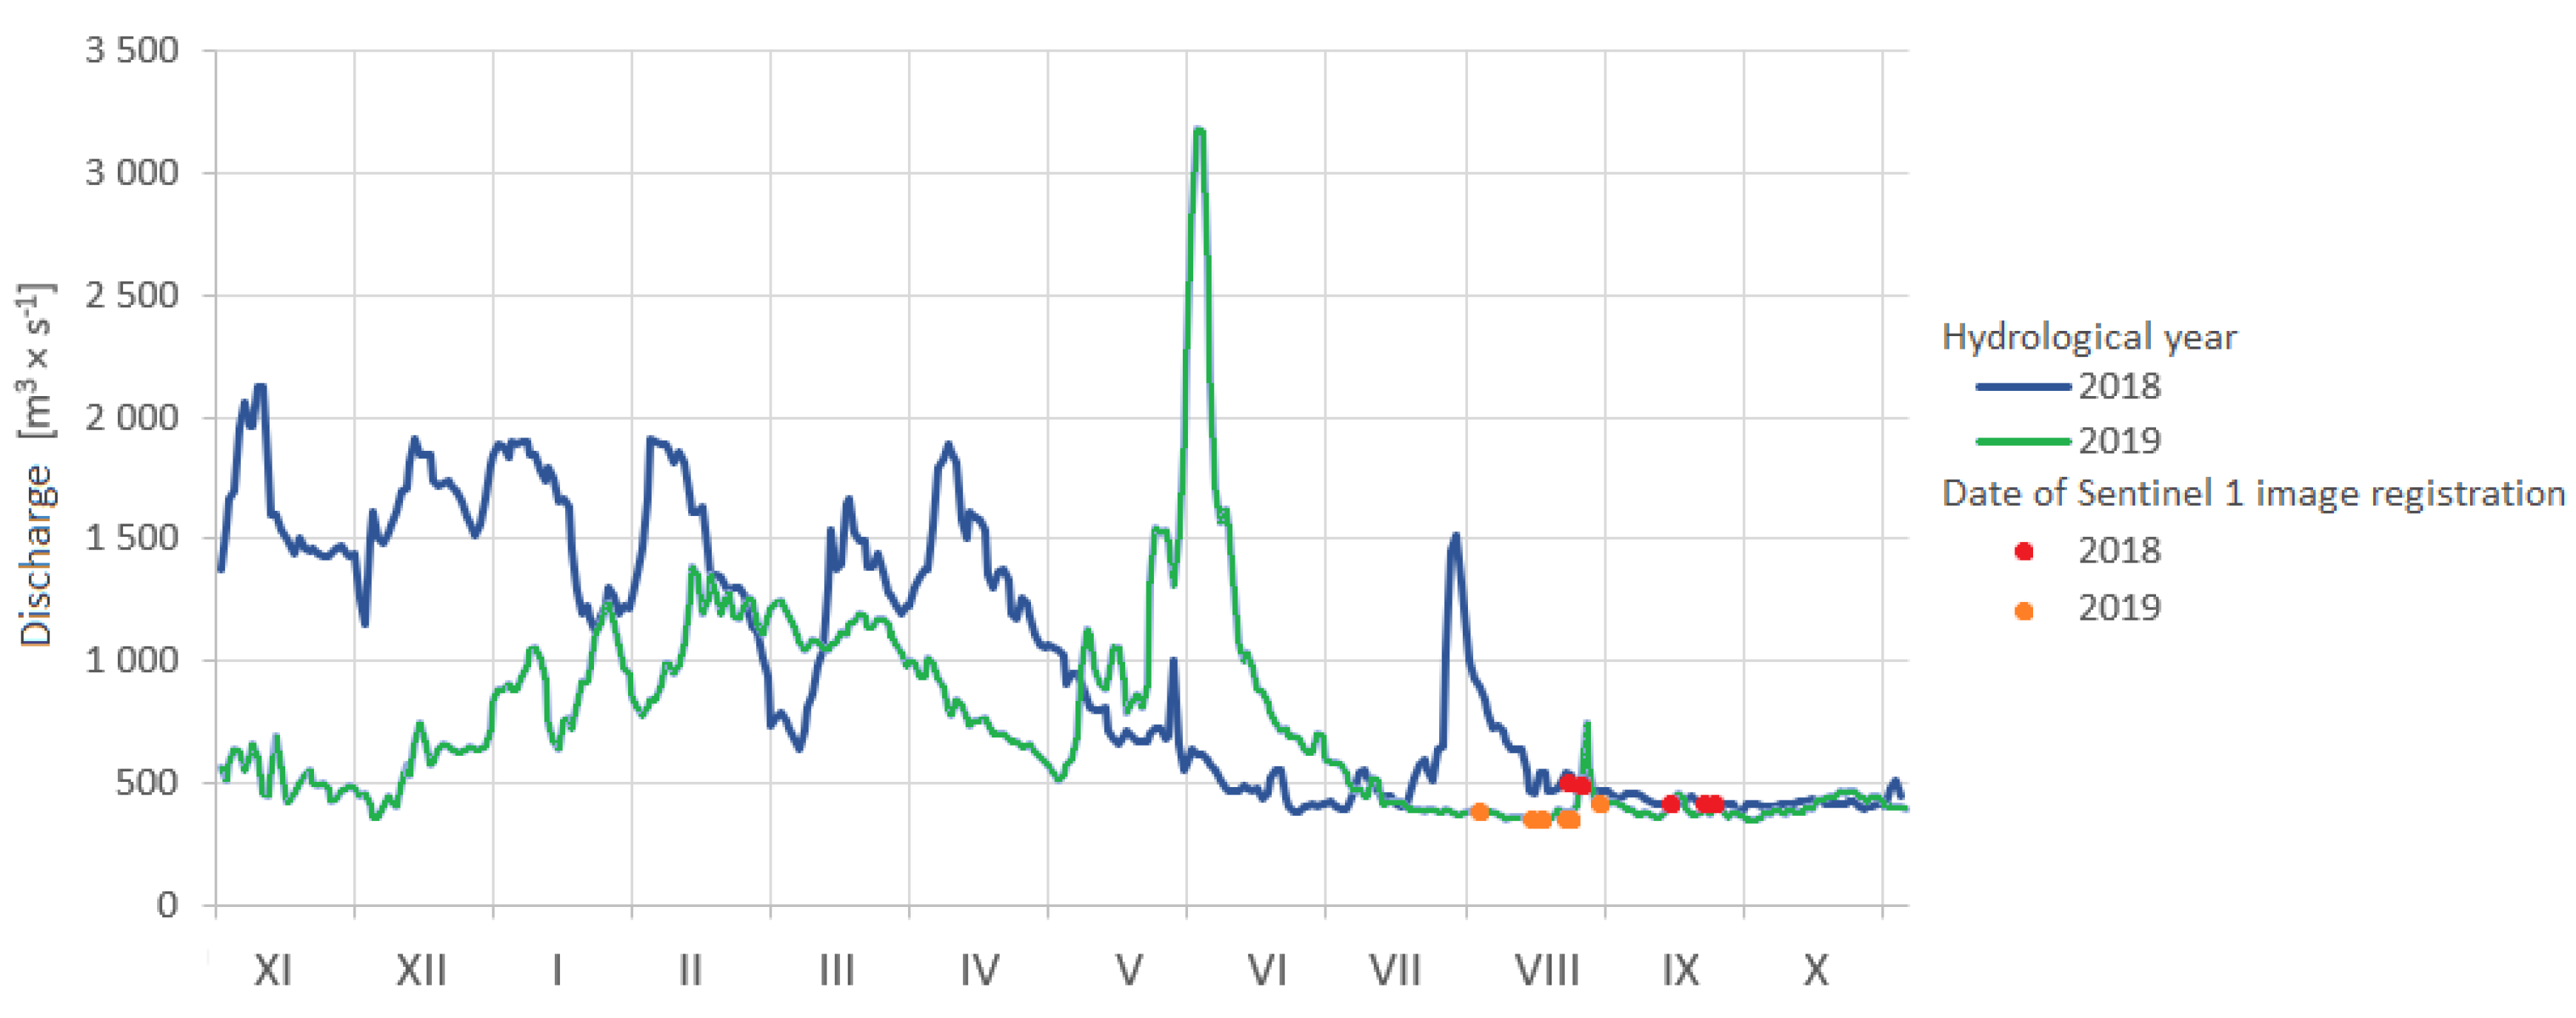
The analysis of the Vistula water level was performed using data from IMGW [42]. Two consecutive hydrological years were selected—2018 and 2019—for the Chełmno gauge (Figure 4).
The criterion for selecting these years was that they should be similar to one another in terms of discharges during periods of low flow. Falling water levels in the recession phase of the hydrographs indicate an increase in area of sandbars. A recession phase of hydrograph with gradually decreasing water stages makes it possible to delineate the sandbars’ boundaries at different water surface elevations. As a result of the hydrological criteria and the availability of Sentinel-1 images, the two time periods of 4 August–26 September 2018 and 1 July–31 August 2019 were selected (Figure 4). In these periods, 14 satellite images were available representing different water stages of the Lower Vistula River at the Chełmno gauge (Table 2).
Comparing the hydrological conditions of the years 2018 and 2019, the annual amplitude between extreme water stages in 2018 was 321 cm, whereas in 2019, the amplitude was higher, at 462 cm. Conversely, average discharge in the 2018 hydrological year was 1010 m3·s−1, while in 2019, it was 744 m3·s−1. The hydrograph for the Lower Vistula River at the Chełmno gauge in 2019 shows one distinctive flood with a peak flow Q = 3180 m3·s−1 on 31 May 2019.
In Sentinel-1, the emitted electromagnetic radiation, when it reaches an object on the Earth’s surface, is partially reflected and partially absorbed by the object. The ratio of the radiation emitted to the returned signal is σ (dB)—backscatter. There is a relationship between pixel brightness and backscatter. A brighter pixel corresponds to better reflection of the radar radiation. The parameters that additionally determine the value of the backscatter are: frequency and polarization of waves, angle of incidence and scattering of radiation, and object properties (shape and dielectric characteristic). Surface scattering is observed for objects with a smooth surface, such as water or ice. Only a small part of the radiation returns to the sensor. Therefore, the pixels corresponding to water are dark. In the case of soil or vegetation, volume scattering is observed: the pulse returns to the antenna many times due to the irregular shape of the object. The brightest pixels represent objects such as buildings or bridges, where double bounce reflection occurs [43].
Image processing operations were conducted in the Sentinel Application Platform SNAP software developed by the European Space Agency [44]. The processing steps performed in the GRDH product began with geometric correction to obtain the proper orientation of the image in UTM coordinates. After geometric correction, two channels were obtained in greyscale of Amplitude_VH and Amplitude_VV. To create a color composition, an additional image was created by turning Amplitude_VV to logarithmic scale. The color composite was created in RGB model using the following sources: Red—Amplitude_VH, Green—Amplitude_VV, and Blue—log10 (Amplitude_VV). To reduce image sizes, subsets were cut from the whole satellite scenes and saved in GeoTiff format.
The next step was to delineate banks of alternate sandbars as polygons by visual interpretation. For this task, Sentinel-1 images subsets in GeoTiff color composite mode were imported to the QGIS program. To obtain the water surface elevation at sandbar location, linear interpolation of the water stage between Grudziądz and Chełmno gauges was used, converted to elevation in meters above sea level. Knowing the area of the alternate sandbars and elevation of the bank line, it was possible to calculate the volume of the form by trapezoidal rule numerical integration.
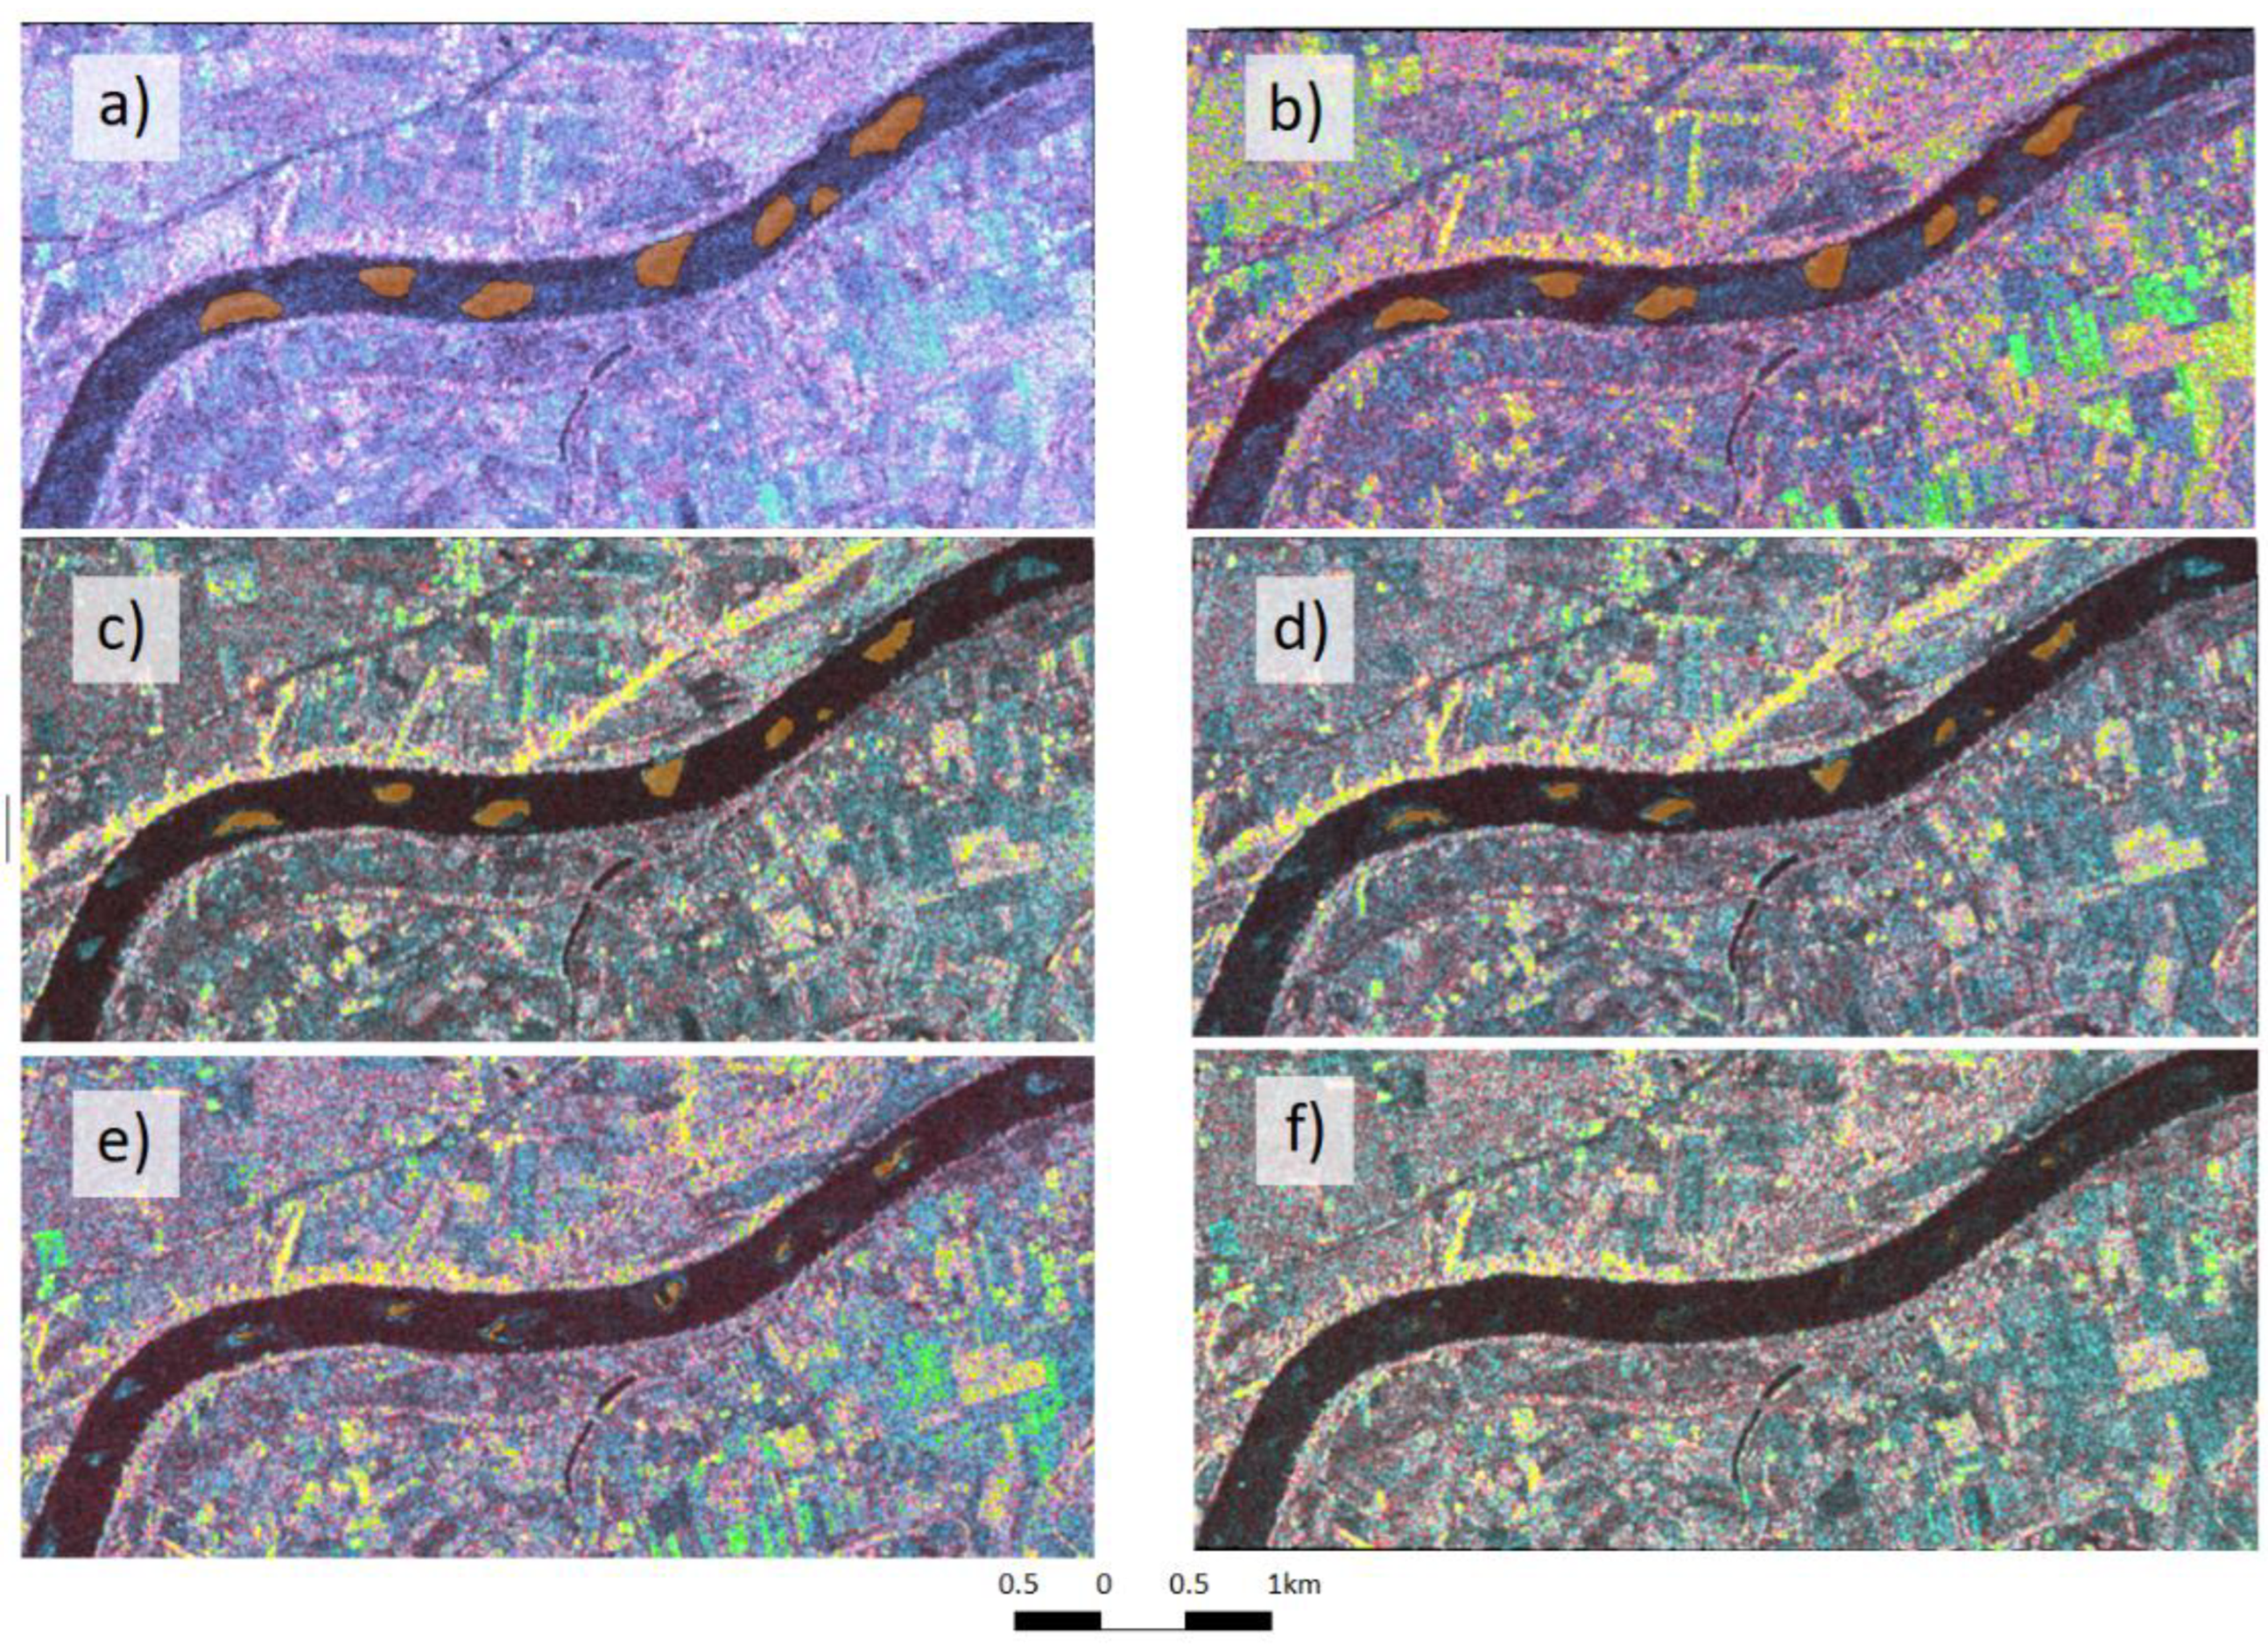
The sequence of Sentinel-1 images from the period 4 August–27 September 2018, with changing area of seven sandbars due to falling water level on the Lower Vistula River, is shown in Figure 5.

3. Results

The Sentinel-1 contour lines of the sandbars at different water stages that were obtained made it possible to estimate the volumes of the sand accumulated in the seven selected sandbars in the years 2018 and 2019 (Figure 6). The decrease in sandbar volumes in 2019 can be explained by sediment erosion associated with the flood of 31 May 2019. The peak discharge of this flood was Q = 3180 m3·s−1, which is in the range of average high flow MHQ.
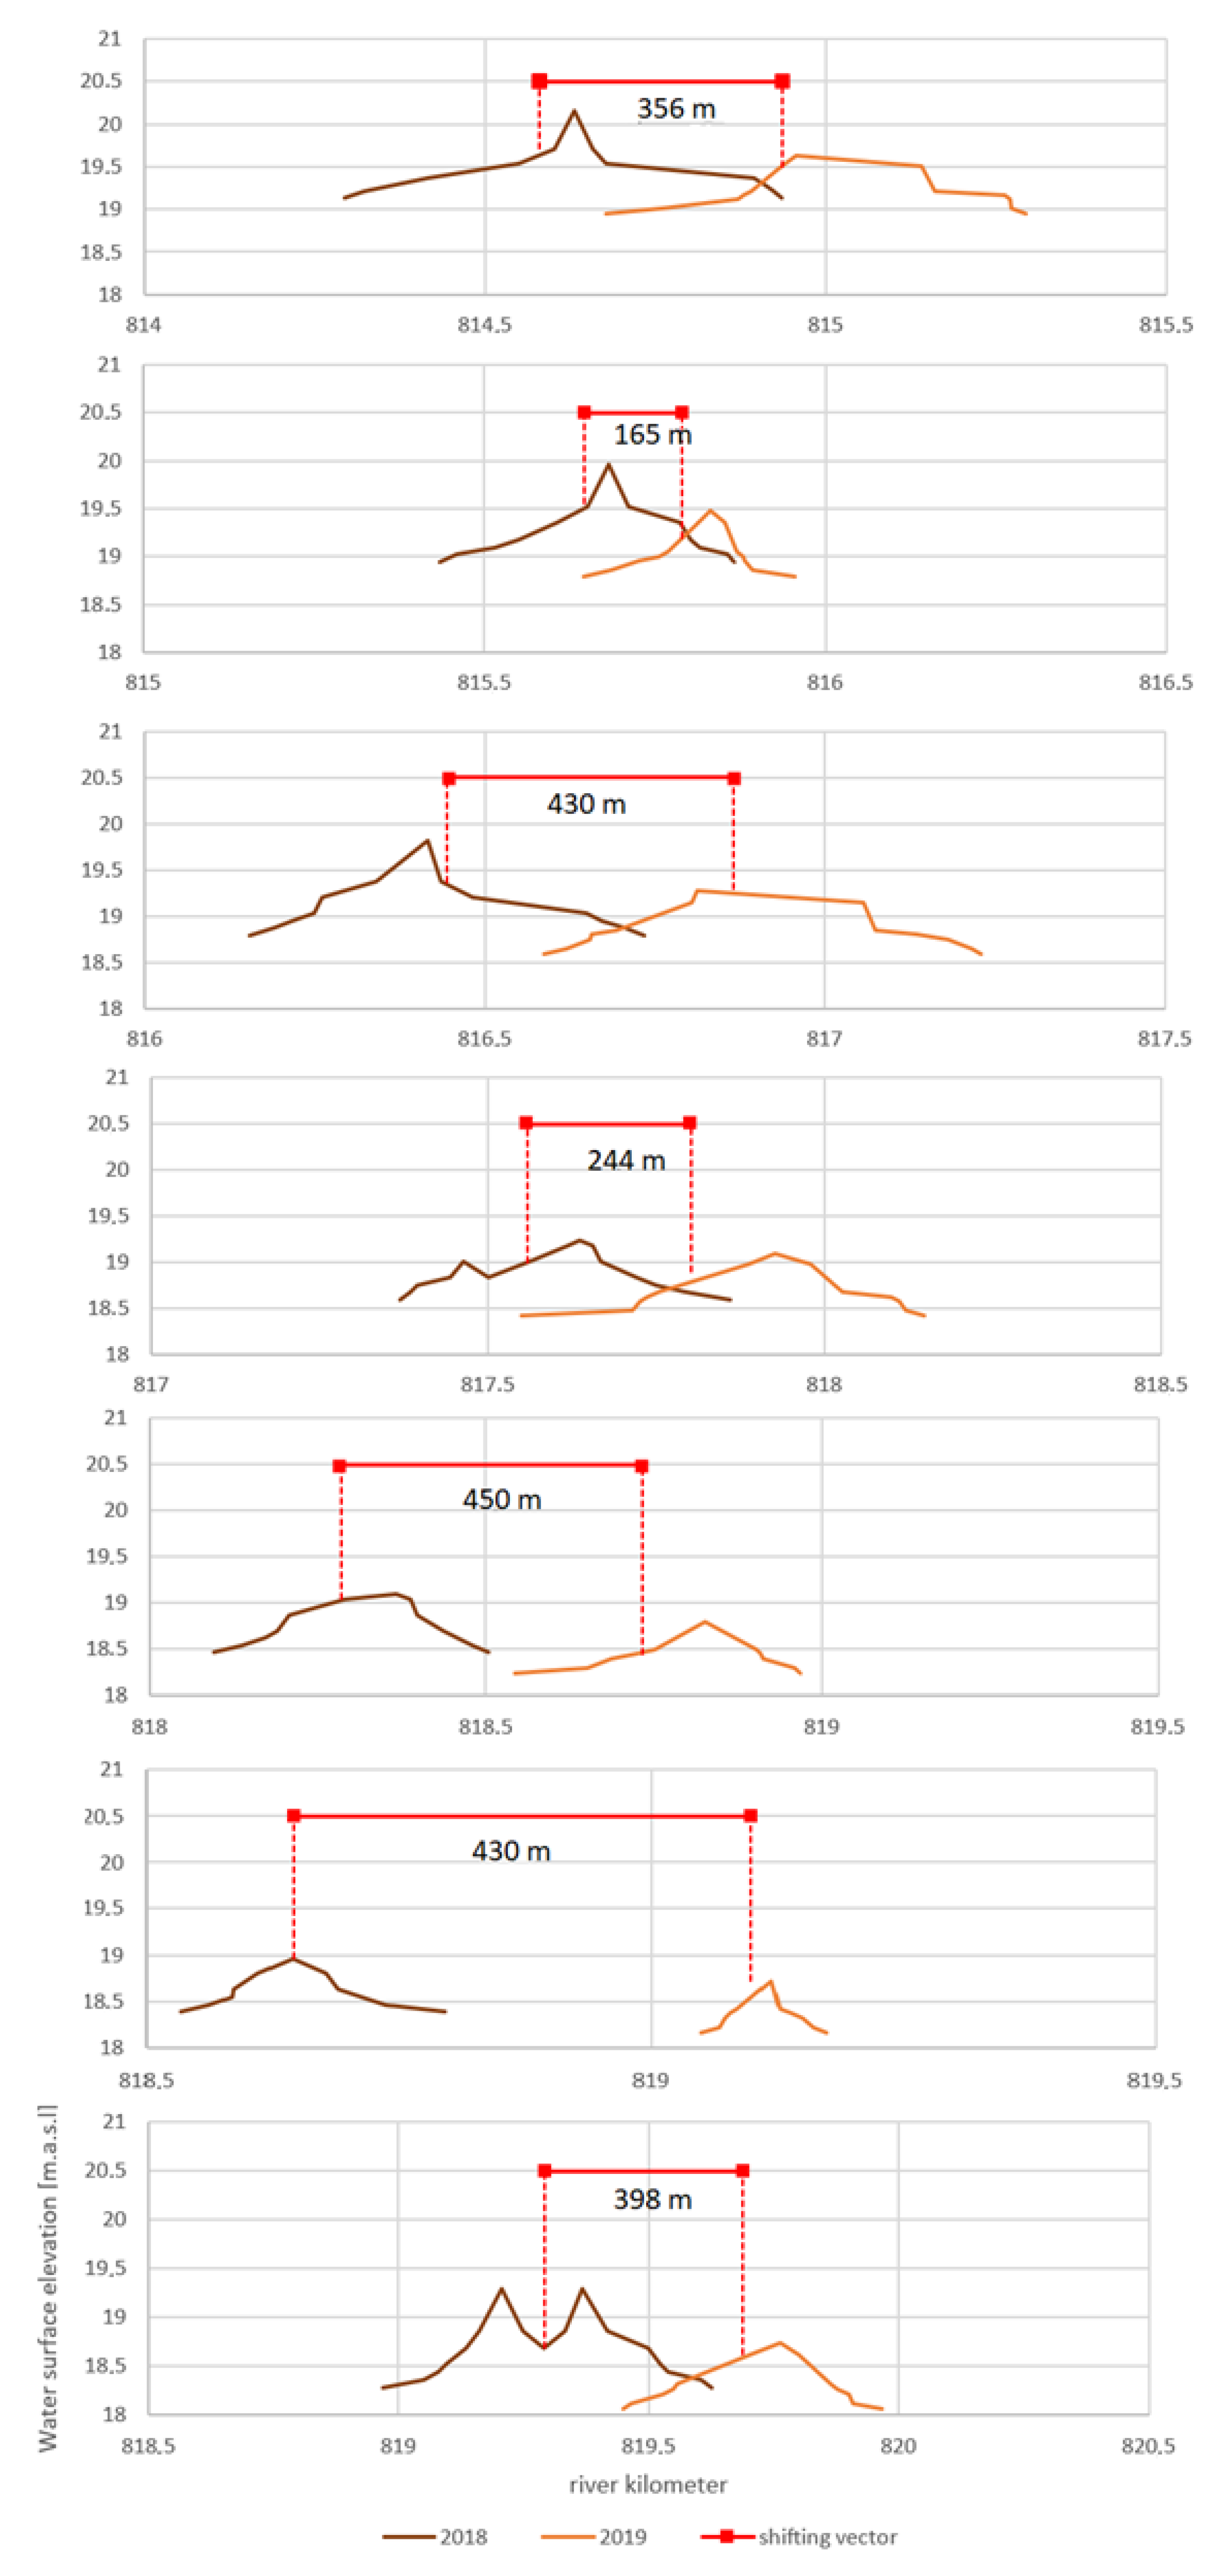
Knowing the sandbar 3D shape, it was possible to calculate the height of the sandbar. The centers of the sandbars were calculated using QGIS and the procedure for finding a centroid from a polygon delineated at the lowest water stage at the Chełmno gauge (26 September 2018, H = 158 cm and 13 August 2019, H = 152 cm). This makes it possible to compare the areas of the alternate sandbars referring to the same longitudinal slope and water surface elevation. The distance between centroids gave the length of sandbar shift (Table 3). Average sandbar shift length in the period 26 September 2018–13 August 2019 was 353 m. This value is similar to the 369 m obtained from the study conducted on the movement of sandbars on three reaches of the Lower Vistula River at kms 852–866, 870–874, and 879–885 using Sentinel-2 multispectral images. The distance of shift depended on hydrological conditions of the Lower Vistula River. For the dry years 2015–16, the average distance of sandbar shift was only 279 m, while for the wet years 2017–18, the distance of shift reached 548 m [45]. In this study, the influence of hydrological conditions is visible in the decrease in the sandbar volume in 2019 due to sediment erosion associated with the flood of 31 May 2019. This flood also influenced the sandbars’ shape and lowered the height of the forms (Figure 7).
With the average length of sandbar shift and time between the measurements, it is possible to calculate the velocity of alternate sandbar movements in the river channel. The average daily movement of the sandbars was calculated as 0.97 m·day−1. Similar results for the Lower Vistula River were obtained by Babiński and Habel [46] and Habel et al. [47]. They estimated velocity of sandbar movement from repeated echo-sounding measurements in the bridge cross-section in the city of Toruń; the rate of the shift of alternate bars was 0.4–2.4 m·day−1 (on average, 1.1–1.2 m·day−1).
These parameters can be used to calculate bedload transport intensity according to the Exner approach Formula (3). The main question is how we should define the depth of the bedload in motion hb. From Sentinel-1 image analysis, we can delineate the sandbar bank elevations at low-flow conditions, but part of the river bottom is still invisible below the water. From a previous study [45], we know that the thalweg pattern on the regulated reach of the Lower Vistula river changes regularly in a time cycle of approximately two years. Using the echo-sounding data from 13 July 2017 and Sentinel-1-derived geometry of the sandbars, a DTM of the river channel was calculated (Figure 8). From the DTM model, elevations of places where the sandbar path crosses the thalweg were obtained. Depths of sediments in motion were calculated as the difference between the thalweg and the top of the sandbar elevations (Table 4).
The calculation using the Exner [10] approach in Formula (3) used the following values: average height of sediment in motion, h = 1.4 m; average velocity of movement of sandbars, 1.1E−05 m·s−1; sediment density, ρ b = 2520 kg·m−3; sandbar shape coefficient, α = 0.6. The resulting bedload transport rate is qb = 0.027 kg·s−1·m−1.
The values of alternate sandbar height and length were used to calculate the bedform steepness index h/l together with the index calculated from empirical Formula (4) (Table 5).

4. Discussion

The proposed method of delineating the bank lines of sandbars on Sentinel-1 images was conducted manually in the Q-GIS program. In the case of multi-spectral images, for detection of land on water, it is possible to use spectral indices that are mathematical expressions with a minimum of two wavelengths of spectral reflectance. The commonly used spectral indices are NDWI, MNDWI, AWEIsh, AWEInsh, and SWM [48]. In the case of Sentinel-1 images, we decided to rely on visual interpretation for delineation of sandbar banks. The possibility of an automatic delineation method using Sentinel-1 data may be the subject of further studies.
In the study of channel process, Sentinel-1 images have the advantage of high temporal resolution. Optical images of Sentinel-2 or Landsat have higher spatial resolution, but their limitation by cloud cover makes them more appropriate for detecting longer-term changes.
The application of Sentinel-1 images for measurements of sandbar geometry and velocity of shift is limited to large rivers by their spatial resolution. “Large river” is not a precise notion, but in this usage can be defined de facto in relation to the spatial resolution of the satellite image: our experience from studies using Sentinel-1 images on lowland rivers in Poland shows that the width of the river channel should be at least 400 m.
The method of delineation of sandbar banks at different water levels requires additional information on the longitudinal profile of the water at the study reach. The longitudinal slope of water level may be obtained from hydrological gauges. The information on the depth of the bedload layer in motion is also of great importance. Sentinel-1 images recorded during low flow do not show the elevations of the channel bottom covered by water at runs between sandbars. This information can be obtained from echo-sounding measurements, which for navigable rivers are often available from water authorities.
Claude et al. [7] compared the bedload transport rate obtained by the hydro-acoustic dune tracking method to the empirical formulas of Van Rijn and Meyer-Peter and Müller. In our study, the sandbar tracking method expressed by the Exner [10] approach in Formula (3) gives a bedload transport rate of qb = 0.027 kg·s−1·m−1. This value can be compared to results of empirical formulas used by Skibiński [24] for conditions of the Lower Vistula River at discharges between average low flow MLQ and average mean flow MMQ (Table 6). Empirical formulas typically obtain rather large differences in bedload transport rates. The method we propose for sandbar tracking measurements using Sentinel-1 data gives bedload transport rates similar to those obtained from Samov’s [22] formula, with qb = 0.023 kg·s−1·m−1. The lowness of the bedload transport rate obtained from the sandbar tracking method can be explained by the fact that the sandbar shift velocity used to compute the bedload transport is underestimated because it does not measure the movement of smaller forms such as ripplemarks and dunes migrating on the surface of sandbars. Such a coexistence of different scale bedforms can be seen in Figure 2.
Our results of sandbar steepness index based on Sentinel-1 measurements on the Lower Vistula River are similar to those obtained from echo-sounding measurements by Carling et al. [18] on the River Rhine and expressed by Ashley’s [24] Formula (4).

5. Conclusions

This study shows that Sentinel-1 radar satellite images can be used for the analysis of channel forms and processes. The Sentinel-1 data offer good time resolution of images and acceptable spatial resolution for studies of large rivers.
The proposed method of alternate sandbar detection and tracking opens a new area for the study of channel meso-forms, which are difficult to measure by conventional hydro-acoustic methods. It can be used to calculate the volume of clastic sediment captured in sandbars and to estimate intensity of bedload transport. Hydro-acoustic measurements can detect the movement of small channel forms such as ripplemarks or dunes, but they have limited usefulness for sandbar tracking due to the time required to measure their movement.
This paper presents a novel use of Sentinel-1 radar satellite images for the study of river channel geomorphology and dynamics. The European Space Agency plans to launch a third satellite in the Sentinel-1 constellation, and this will open a new perspective for studies of fluvial processes. The proposed method for studying alternate sandbar dynamics and geometry can be applied on long reaches of lowland rivers to improve our knowledge of river channel forms in the context of their environmental importance.

Author Contributions

Conceptualization, K.K., A.M., and A.R.-P.; software, K.K.; validation, K.K. and A.M.; writing—original draft preparation, K.K. and A.M.; visualization, K.K.; supervision, A.M. and A.R.-P. All authors have read and agreed to the published version of the manuscript.

Funding

This research received no external funding.

Institutional Review Board Statement

Not applicable.

Informed Consent Statement

Not applicable.

Data Availability Statement

https://www.mdpi.com/ethics The data presented in this study are available on request from the corresponding author. The data are not publicly available due to their use in ongoing Ph.D. thesis preparation.

Conflicts of Interest

The authors declare no conflict of interest.

References

  1. Gomez, B.; Naff, R.L.; Hubbell, D.W. Temporal variations in bedload transport rates associated with the migration of bedforms. Earth Surf. Processes Landf. 1989, 14, 135–156. [Google Scholar] [CrossRef]
  2. Redolfi, M. Free alternate bars in rivers: Key physical mechanisms and simple formation criterion. Water Resour. Res. 2021, 57, e2021WR030617. [Google Scholar] [CrossRef]
  3. Łoś, H.; Pawłowski, B. The use of Sentinel-1 imagery in the analysis of river ice phenomena on the Lower Vistula in the 2015–2016 winter season. In Proceedings of the Signal Processing Symposium (SPSympo), Jachranka, Poland, 12–14 September 2017; pp. 1–5. [Google Scholar]
  4. Majewski, W. The lower vistula and its ice problems. Arch. Hydro Eng. Environ. Mech. 2021, 68, 41–83. [Google Scholar] [CrossRef]
  5. Arnauda, F.; Schmitt, L.; Johnstone, K.; Rollet, A.J.; Piégaya, H. Engineering impacts on the Upper Rhine channel and floodplain over two centuries. Geomorphology 2019, 330, 13–27. [Google Scholar] [CrossRef]
  6. Rodrigues, S.; Mosselman, E.; Claude, N.; Wintenberger, C.L.; Juge, P. Alternate bars in a sandy gravel bed river: Generation, migration and interactions with superimposed dunes. Earth Surf. Processes Landf. 2015, 40, 610–628. [Google Scholar] [CrossRef]
  7. Claude, N.; Rodrigues, S.; Bustillo, V.; Bréhéret, J.G.; Macaire, J.J.; Jugé, P. Estimating bedload transport in a large sand-gravel bed river from direct sampling, dune tracking and empirical formulas. Geomorphology 2012, 179, 40–57. [Google Scholar] [CrossRef]
  8. Brasington, J.; Langham, J.; Rumsby, B. Methodological sensitivity of morphometric estimates of coarse fluvial sediment transport. Geomorphology 2003, 53, 299–316. [Google Scholar] [CrossRef]
  9. Lane, S.N.; Westaway, R.M.; Hicks, D.M. Estimation of erosion and deposition volumes in a large, gravel-bed, braided river using synoptic remote sensing. Earth Surf. Processes Landf. 2003, 28, 249–271. [Google Scholar] [CrossRef]
  10. Coleman, S.E.; Nikora, V.I. Exner equation: A continuum approximation of a discrete granular system. Water Resour. Res. 2009, 45, W09421. [Google Scholar] [CrossRef]
  11. Yalin, N.S.; Da Silva, A.M.F. Fluvial Processes; IAHR Monograph, IAHR: Delft, The Netherlands, 2001. [Google Scholar]
  12. Ballio, F.; Nikora, V.; Coleman, S.E. On the definition of solid discharge in hydro-environment research and applications. J. Hydraul. Res. 2014, 52, 173–184. [Google Scholar] [CrossRef]
  13. Skibiński, J. Rozwój łapaczek rumowiska używanych w Polsce oraz niektóre inne metody pomiarów wleczenia. Gospod. Wodna 1961, 22, 215–220. [Google Scholar]
  14. Karasiew, I.F.; Szumkow, I.G. Gidrometria; Gidrometeoizdat: Leningrad, Russia, 1985. [Google Scholar]
  15. Kostaschuk, R.A.; Ilersich, S.A.; Hickin, E.J. (Eds.) River Geomorphology; John Wiley & Sons: Chichester, UK, 1995. [Google Scholar]
  16. Lisimenka, A.; Kubicki, A. Bedload transport in the Vistula River mouth derived from dune migration rates, southern Baltic Sea. Oceanologia 2019, 61, 384–394. [Google Scholar] [CrossRef]
  17. Piętka, Z. Zastosowanie Izotopów Promieniotwórczych i Trwałych w Hydrologii i Oceanografii; Biuletyn PIHM: Warszawa, Poland, 1960. [Google Scholar]
  18. Carling, P.A.; Gölz, E.; Orr, H.G.; Radecki-Pawlik, A. The morphodynamics of fluvial sand dunes in the River Rhine, near Mainz, Germany. I., Sedimentology and morphology. Sedimentology 2000, 47, 227–252. [Google Scholar] [CrossRef]
  19. Czernik, S. Kilka uwag w sprawie regulacji ujścia Wisły. Gospod. Wodna 1954, 14, 304–309. [Google Scholar]
  20. Skibiński, J. Próba ustalenia najbardziej właściwego sposobu prowadzenia pomiarów wleczenia na Wiśle w profilu Nadwilanówka. Gospod. Wodna 1962, 22, 425–426. [Google Scholar]
  21. Goncarov, V.N. Dinamika Ruslovych Potokov; Gidrometeoizdat: Leningrad, Russia, 1962. [Google Scholar]
  22. Samov, G.I. Recnyje Nanosy; Gidrometeoizdat: Leningrad, Russia, 1959. [Google Scholar]
  23. Meyer-Peter, E.; Müller, R. Eine Formel zur Berechnung des Geschiebetriebs; Mitteilungen aus der Versuchsastalt für Wasserbau und Erdbau; Schweizerische Bauzeitung: Zürich, Switzerland, 1946; p. 16. [Google Scholar]
  24. Skibiński, J. Próba ilościowej oceny intensywności transportu rumowiska wleczonego w rzekach środkowej Polski. In Zeszyty Naukowe SGGW-AR w Warszawie; Rozprawy Naukowe: Warszawa, Poland, 1976. [Google Scholar]
  25. Ahmari, H.; Da Silva, A.M. Regions of bars, meandering and braiding in da Silva and Yalin’s plan. J. Hydraul. Res. 2011, 49, 718–727. [Google Scholar] [CrossRef]
  26. Ashley, G.M. Classification of large-scale subaqueous bedforms: A new look at an old problem. J. Sedim. Petrol. 1990, 60, 160–172. [Google Scholar]
  27. Wang, B.; Xu, Y.J. Sediment trapping by emerged channel bars in the lowermost mississippi river during a major flood. Water 2015, 7, 6079–6096. [Google Scholar] [CrossRef] [Green Version]
  28. Long, J.; Li, H.; Wang, Z.; Wang, B.; Xu, Y. Three decadal morphodynamic evolution of a large channel bar in the middle Yangtze River: Influence of natural and anthropogenic interferences. Catena 2021, 199, 105128. [Google Scholar] [CrossRef]
  29. Cavallo, C.; Nones, M.; Papa, M.N.; Gargiulo, M.; Ruello, G. Monitoring the morphological evolution of a reach of the Italian Po River using multispectral satellite imagery and stage data. Geocarto Int. 2021, 1–23. [Google Scholar] [CrossRef]
  30. Państwowa Inspekcja Ochrony Środowiska. Atlas Posterunków Wodowskazowych dla Potrzeb Państwowego Monitoringu Środowiska; Biblioteka Monitoringu Środowiska: Warszawa, Poland, 1996. [Google Scholar]
  31. Habel, M. Effects of flow regulation and river channelization on sandbar bird nesting availability at the Lower Vistula River. Ecol. Quest. 2018, 29, 43–53. [Google Scholar] [CrossRef]
  32. Babiński, Z. Hydromorphological consequences of regulating the lower Vistula, Poland. Regul. Rivers Res. Manag. 1992, 7, 337–348. [Google Scholar] [CrossRef]
  33. Grochulski., J. (Ed.) Monografia Dróg Wodnych Śródlądowych w Polsce; Wydawnictwo Komunikacji i Łączności: Warszawa, Poland, 1985. [Google Scholar]
  34. Ingarden, R. Rzeki i Kanały Żeglowne w Byłych Trzech Zaborach I Znaczenie ich Gospodarcze Dla Polski; Ministerstwo Robót Publicznych: Warszawa, Poland, 1921. [Google Scholar]
  35. Habel, M. Morfodynamika Dna Doliny Dolnej Wisły Poniżej Zbiornika Włocławskiego. Ph.D. Thesis, IGiPZ PAN Warszawa, Warszawa, Poland, 2011. [Google Scholar]
  36. Polska Państwowa Służba Hydrograficzna. Materiał Wleczony i Unoszony w Korycie Wisły: Sprawozdanie z Prac Państwowej służby Hydrograficznej Przeprowadzonych w Latach 1923–1939; Prace Państwowego Instytutu Hydrologiczno-Meteorologicznego; Wydawnictwa Komunikacyjne: Warszawa, Poland, 1954; p. 33. [Google Scholar]
  37. Brański, J.; Kondzielski, A. Uziarnienie rumowiska unoszonego wzdłuż biegu Wisły. Gospod. Wodna 1986, 6, 140–143. [Google Scholar]
  38. Du Boys, P. Etudes du régime du Rhône et de l’action exercée par les eaux sur un lit à fond de graviers indéfiniment affouillable. Ann. Ponts Chaussées 1879, 5, 141–195. [Google Scholar]
  39. Sentinel Technical Guides. Available online: sentinel.esa.int/web/sentinel/sentinel-technical-guides (accessed on 16 April 2021).
  40. The Alaska Satellite Facility. Available online: asf.alaska.edu (accessed on 16 April 2021).
  41. Sat4Envi. Available online: https://dane.sat4envi.imgw (accessed on 20 September 2021).
  42. Dane Publiczne IMGW-PIB. Available online: danepubliczne.imgw.pl (accessed on 16 April 2021).
  43. Magnuszewski, A. Application of satellite sentinel-1 radar images for description of ice phenomena on dębe reservoir. Acta Sci. Pol. Form. Circumiectus 2018, 4, 121–130. [Google Scholar] [CrossRef]
  44. Science Toolbox Exploitation Platform. Available online: https://step.esa.int/main/download/snap-download/ (accessed on 7 September 2020).
  45. Kryniecka, K.; Magnuszewski, A. Application of satellite sentinel-2 images to study alternate sandbars movement at Lower Vistula River (Poland). Remote Sens. 2021, 13, 1505. [Google Scholar] [CrossRef]
  46. Babiński, Z.; Habel, M. Value of bedload movement in alluvial rivers using analysis of sandbar migration. In MARID 2016, Proceedings of the Fifth International Conference on Marine and River Dune Dynamics, Caernarfon, UK, 4–6 April 2016; Van Landeghem, K.J.J., Garlan, T., Baas, J.H., Eds.; Bangor University and SHOM: Bangor, UK, 2016. [Google Scholar]
  47. Habel, M.; Babiński, Z.; Szatten, D.; Chalov, S.; Rozlah, Z.; Maerker, M. Clastic sediment transport renewal below Włocławek Reservoir. In Geography in the Face of ModernWorld Challenges; Chaberek-Karwacka, G., Malinowska, M., Eds.; University of Gdańsk: Gdańsk, Poland, 2016; pp. 93–114. [Google Scholar]
  48. Kryniecka, K.; Magnuszewski, A. Use of Sentinel-2 images for the detection of sandbars along the lower Vistula. Form. Circumiectus 2020, 19, 23–33. [Google Scholar] [CrossRef]
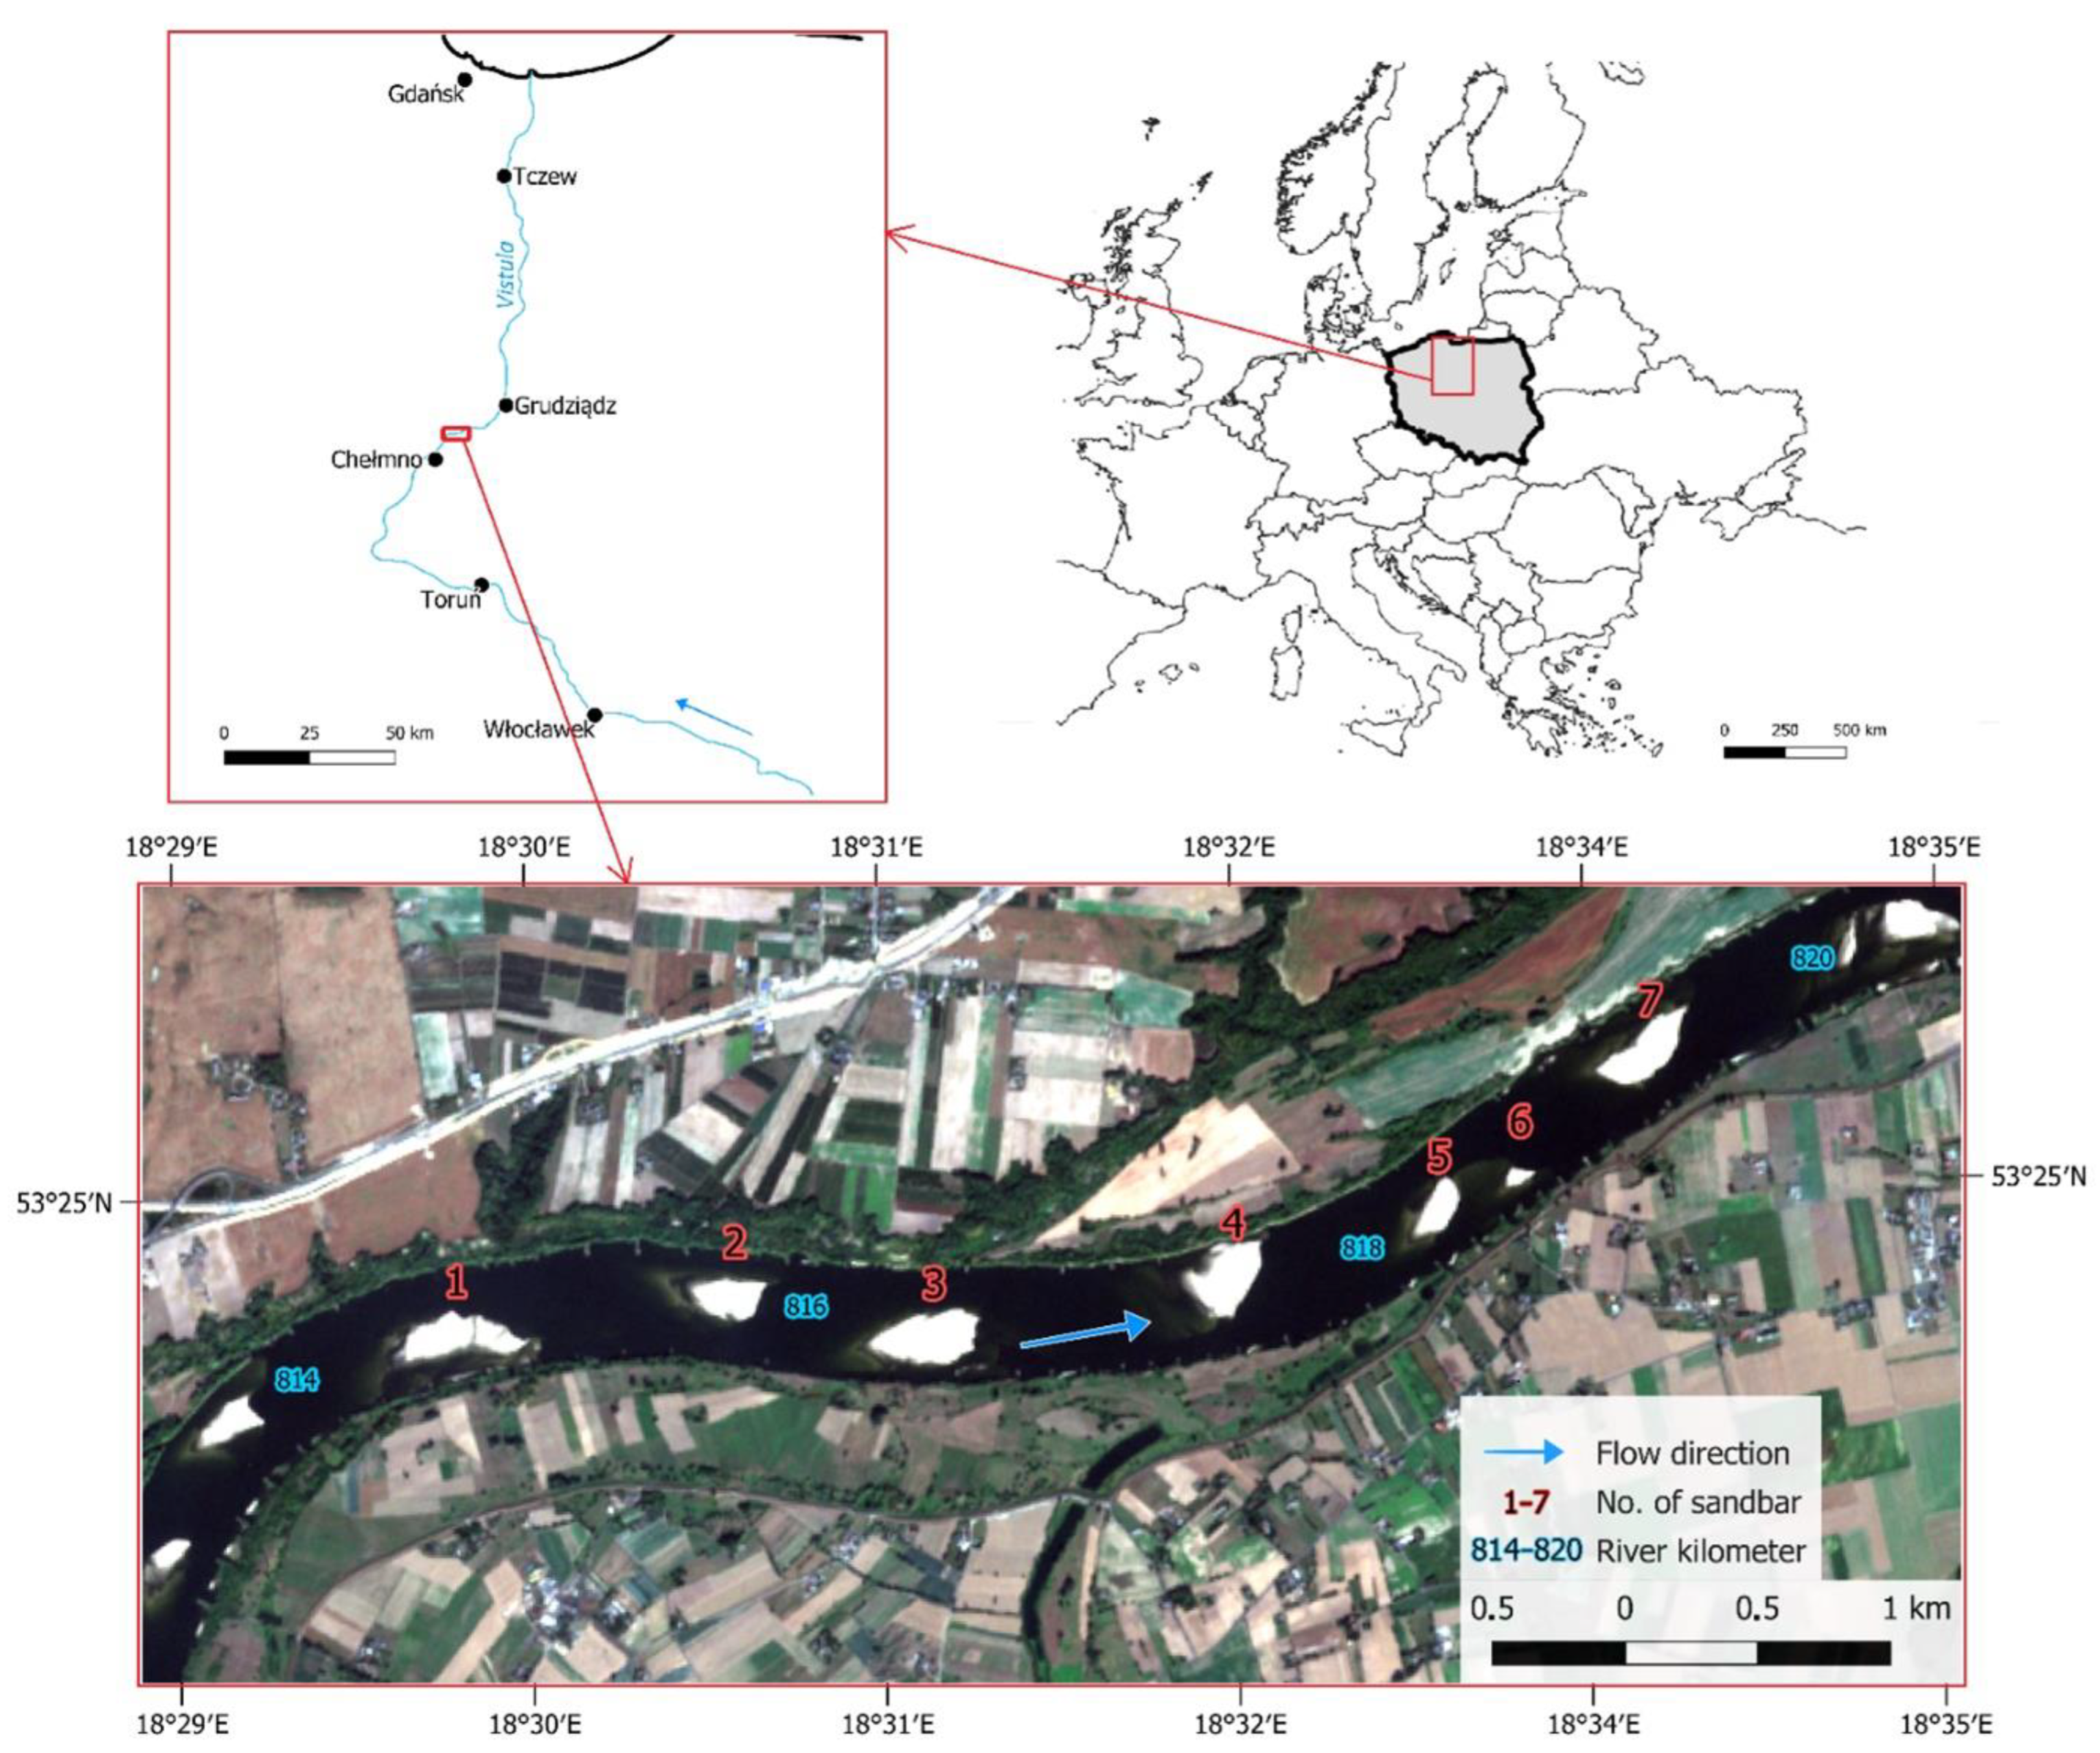
Figure 1. Location of research area on Lower Vistula River with alternate sandbars (814–820 km).
Remotesensing 14 01056 g001
Figure 2. Downstream (lee-side) of an alternate sandbar covered by ripplemarks and dunes; Lower Vistula River 767.1 km (8 July 2017).
Remotesensing 14 01056 g002
Figure 3. Hydraulic indices (B/hm; hm/d50) of the Lower Vistula River channel at the Grudziądz gauge shown on the graph of Ahmari and da Silva [25]: C&B—multiple bars and braiding rivers, A&M—alternate bars and meandering rivers, M—meandering rivers.
Remotesensing 14 01056 g003
Figure 4. Lower Vistula River hydrographs in hydrological years 2018 and 2019 at Chełmno gauge and Sentinel-1 sensing time.
Remotesensing 14 01056 g004
Figure 5. Sentinel-1 images with delineated sandbars at different water stages of Chełmno gauge: (a) date of image registration: 26 September 2018, Chełmno gauge water level H = 158 cm; (b) 27 September 2018, H = 166 cm; (c) 17 September 2018, H = 174 cm; (d) 5 September 2018, H = 182 cm; (e) 22 August 2018, H = 199 cm; (f) 21 August 2018, H = 216 cm.
Remotesensing 14 01056 g005
Figure 6. Volume (m3) of alternate sandbars on the Lower Vistula River reach from 4 August–27 September 2018 and 1 July–31 August 2019.
Remotesensing 14 01056 g006
Figure 7. Longitudinal profiles of alternate sandbars No. 1–7 and distance of shift between 2018 and 2019.
Remotesensing 14 01056 g007
Figure 8. DTM of Lower Vistula River channel showing path of sandbars’ movement between 2018 and 2019.
Remotesensing 14 01056 g008
Table 1. Characteristic discharges of Lower Vistula River at Toruń and Tczew gauges, 1951–90 [30].
Lower Vistula River Characteristic DischargesDischarge at Toruń Gauge
Q (m3·s−1)
Discharge at Tczew Gauge
Q (m3·s−1)
Average low flow—MLQ359419
Average mean flow—MMQ9921080
Average high flow—MHQ37403840
Table 2. Lower Vistula River stage and discharge values at Chełmno gauge on Sentinel-1 image sensing days.
Sentinel-1 Image Sensing DateRiver Stage
H (cm)
Water Level (m a.s.l.)Discharge
Q (m3·s−1)
2018
4 August 201826021.56729
21 August 201821621.12535
22 August 201819920.95467
5 September 201818220.78446
17 September 201817420.70422
26 September 201815820.54376
27 September 201816620.62398
2019
1 July 201922021.16571
1 August 201916820.64390
13 August 201915220.48350
16 August 201915820.54363
22 August 201920821.04542
25 August 201917820.74417
31 August 201917320.69403
Table 3. Height, length, and distance of shift of sandbars in the Lower Vistula River study area.
Sandbar No.Sandbar Height (m)Sandbar Length (m)Sandbar Shift in the Period
201820192018201926 September 2018–31 August 2019
11.020.68641617356
21.020.68433310165
31.340.68580642430
40.640.68491599244
50.640.58408424450
60.580.58262124430
71.020.68658518398
average0.890.65496462353
Table 4. Depth of sediment in motion at the sandbar movement.
Sandbar No.Elevation of the Channel
Thalweg Runs (m a.s.l.)
Elevation of the Sandbar Top in 2019 (m a.s.l.)Height of Sediment in Motion hb (m)
117.5419.632.09
218.3019.471.17
318.6019.270.67
418.1719.090.92
517.3718.821.45
616.7018.752.05
717.3018.741.44
average1.40
Table 5. Sandbar steepness index calculated from measurement data and Formula (4)—years 2018 and 2019.
Sandbar No.Bedform Steepness Index from Sentinel-1 Measurements
h/l
Bedform Steepness Index from Formula (4)
h/l = 0.1027 l −0.6149
2018201920182019
10.00160.00110.00190.0020
20.00240.00220.00250.0030
30.00230.00110.00210.0019
40.00130.00110.00230.0020
50.00160.00140.00250.0025
60.00220.00470.00330.0053
70.00150.00130.00190.0022
average0.00180.00180.00240.0027
Table 6. Comparison of bedload transport rate on the study reach calculated by various methods.
Method of Calculationqb (kg·s−1·m−1)
Formula (3)0.027
Skibinski [17]0.083
Samov [15]0.023
Gonacarov [14] 0.039
Meyer-Peter and Müller [16]0.068
Publisher’s Note: MDPI stays neutral with regard to jurisdictional claims in published maps and institutional affiliations.