Article

The Influence of Underlying Land Cover on the Accuracy of MODIS C6.1 Aerosol Products—A Case Study over the Yangtze River Delta Region of China

1
Key Laboratory of Ecosystem Network Observation and Modeling, Institute of Geographic Sciences and Natural Resources Research, Chinese Academy of Sciences, Beijing 100101, China
2
College of Resources and Environment, University of Chinese Academy of Sciences, Beijing 100049, China
3
Hangzhou Meteorological Bureau, Hangzhou 310051, China
4
Institute of Remote Sensing and Earth Sciences, Hangzhou Normal University, Hangzhou 311121, China
5
Division of Geodetic Science, School of Earth Sciences, The Ohio State University, Columbus, OH 43210, USA
6
Zhejiang Provincial Key Laboratory of Urban Wetlands and Regional Change, Hangzhou 311121, China
*
Author to whom correspondence should be addressed.
Remote Sens. 2022, 14(4), 938; https://doi.org/10.3390/rs14040938
Submission received: 16 December 2021 / Revised: 10 February 2022 / Accepted: 12 February 2022 / Published: 15 February 2022
(This article belongs to the Special Issue Uncertainty Management in Satellite Remote Sensing)

Abstract

:
Due to the significant spatial variation of the performance of Moderate Resolution Imaging Spectrometer (MODIS) aerosol optical depth (AOD) retrievals, validation is very important for applications of MODIS AOD products at regional scales. This study presents a comparative analysis of Collection 6.1 MODIS AOD retrievals and ground measurements from five local sites and one Aerosol Robotic Network (AERONET) site in the Yangtze River Delta (YRD) region, which significantly complements the previous validation that utilized limited AERONET measurements. Generally, MODIS AOD retrievals showed a reasonable agreement with collocated ground measurements (R2 > 0.7), with 66% of Dark Target (DT) 10 km retrievals, 56% of Deep Blue (DB) 10 km retrievals, and 69% of DT 3 km retrievals falling within the expected error (EE = ±(0.05 + 0.2 × AOD)). Nevertheless, it was found that the DT AOD retrievals tended to be overestimated over urbanized and lakeside sites, while the DB AOD retrievals tended to be underestimated over all ground sites except for lakeside sites. Such patterns appeared to be linked with the systematic biases of the single-scattering albedo estimation in the AOD retrieval algorithms. Another significant finding of this study is that the uncertainties of the MODIS AOD retrievals were highly correlated with the land cover proportions of urbanized features and water (LCP_UW) in the surrounding region, especially for the DT products. An empirical correction method based on these correlations could substantially reduce the uncertainties of DT AOD products over high LCP_UW areas. The results not only highlight the significant impacts of both urban and water areas on the MODIS AOD retrieval algorithms but also create new possibilities to correct such impacts once the universal correlations between LCP_UW and the uncertainty measures are established.

1. Introduction

Atmospheric aerosols, which are defined as fine solid or liquid particles suspended in the atmosphere, play an important role in the Earth-atmosphere system through scattering and absorbing solar radiation (known as the aerosol direct effect) and modifying the microphysical properties and lifetimes of clouds (known as the aerosol indirect effect) [1]. Aerosol is also closely connected to many significant issues, including climate change, air quality, and public health [2,3,4]. However, owing to the wide spatial and temporal variability, complicated physical and chemical compositions, and short life cycle, atmospheric aerosol continues to be a large source of uncertainty in the climate system [5]. Although satellite remote sensing is capable of capturing the spatiotemporal states of atmospheric aerosols at large scales, satellite-derived aerosol products demonstrate considerable uncertainties, limiting their applications.
A key aerosol optical parameter that can be estimated from satellite observations is aerosol optical depth (AOD, τ). AOD is an essential product for many satellite instruments, such as Moderate Resolution Imaging Spectrometer (MODIS) [6,7], Visible Infrared Imaging Radiometer Suite (VIIRS) [8], Multi-angle Imaging Spectro-Radiometer (MISR) [9], and Advanced Very High Resolution Radiometer (AVHRR) [10]. Satellite-derived AOD data have been widely applied for the atmospheric correction of satellite images [11,12,13], evaluation of air quality at global/regional scales [14,15,16,17,18], and estimation of fine particulate matter (PM2.5) concentrations [19,20]. Particularly, MODIS-derived AOD is one of the most frequently used products in the field of atmospheric research due to its long-term global coverage, relatively high spatiotemporal resolution, and continuous improvement. However, as the uncertainties in the AOD inversion algorithm are attributable to the oversimplified assumptions of aerosol optical properties and surface reflectance, the MODIS AOD product has been demonstrated to have different biases over different regions when compared to the collocated ground-based measurements [21,22,23,24]. Therefore, it is absolutely indispensable to check the accuracy of MODIS AOD data before application studies.
In recent years, numerous studies have focused on the validation of MODIS AOD products using different collections and algorithms at global/regional scales using ground-based measurements from aerosol observation networks such as the Aerosol Robotic Network (AERONET) and China Aerosol Remote Sensing Network (CARSNET) [21,25,26,27,28]. The recently released Collection 6.1 (C6.1) MODIS AOD product (up to 2021) was derived from two independent algorithms called Dark Target (DT) and Deep Blue (DB). Three types of datasets are included, including DT AOD at 10 km resolution (denoted as DT10), DB AOD at 10 km resolution (denoted as DB10), and DT AOD at 3 km resolution (denoted as DT3) [7]. Globally, the expected errors (EEs) of DT10, DB10, and DT3 were reported to be within ±(0.05 + 0.15τ), ±(0.03 + 0.20τ), and ±(0.05 + 0.20τ), respectively [7,29,30,31]. Apart from DT and DB AOD, a new type of MODIS AOD product, named as Multiangle Implementation of Atmospheric Correction (MAIAC) AOD, was also widely used for its high spatial resolution (up to 1 km) in recent years [32,33]. The MAIAC algorithm determines the surface reflectance based on the spectral similarity of the bidirectional reflectance distribution function (BRDF) shape between the bands in 0.47 and 2.13 μm wavelengths [34]. Global and regional validation results indicated that MAIAC AOD tended to have higher accuracy than DT AOD over bright surfaces and lower accuracy than DT AOD over vegetated surfaces, which is similar to the performance of DB AOD [26,35,36,37].
One primary source of the uncertainties in satellite AOD retrievals is the process used to estimate the surface reflectance [38]. A sensitivity analysis demonstrated that an error of 0.01 in surface reflectance could introduce an error of ~0.1 in the retrieved AOD [39]. The MODIS DT and DB algorithms utilize different strategies to determine the surface reflectance over different surface types (mainly including dark vegetated surfaces and bright urbanized/desert surfaces), while the underlying assumptions are the correlations between visible and shortwave infrared (SWIR) bands. Unfortunately, such relationships may show large discrepancies over different regions due to the landscape changes, leading to varied uncertainties of the MODIS AOD products across different regions. For example, global validations suggested that 69% of DT10 and 66% of DT3 products fall within the EEs, and these values decreased to 63% and 55%, respectively, in Asia [23]. Many other validation attempts at large spatial scales have also reported the potential dependences of MODIS AOD retrieval errors on land cover [22,25,26,40]. Indeed, the spatial inconsistencies of MODIS AOD products could lead to uncertainties in many related applications. For example, when exploring the spatiotemporal distributions of aerosol conditions, the differing patterns among different regions may either originate from the land-cover-associated AOD errors or the real spatial variability [41,42,43].
It is technically challenging to understand the impacts of land cover on the accuracy of satellite-derived AOD because the uncertainties of the final AOD retrievals may not only be attributed to the land surface changes but also depend on the selection of aerosol type [40]. The MODIS DT/DB AOD algorithms simplify the aerosol conditions into five types (continental, weak absorption fine, moderate absorption fine, strong absorption fine, and dust coarse), where the uncertainties may also change between different assumed aerosol types [44]. An added difficulty is related to the fact that aerosol properties (scattering, particle size distributions, etc.) could also demonstrate remarkable differences even when the simplified aerosol type is the same [45], prohibiting quantitative estimates of the correlations between AOD uncertainties and land surface features.
As one of the most important economic centers in China, the Yangtze River Delta (YRD) has suffered from deteriorated air pollution issues and the rapid growth of urbanization and industrialization in recent years [46]. Investigating the performance of satellite-derived aerosol products over the YRD is conducive to understanding the spatiotemporal status of the air quality in the region. However, although several AERONET sites have been established in the YRD region over the past years, most of the sites provide only a small amount of quality-assured observations for a few days, prohibiting their uses in comprehensive validation efforts. To overcome this limitation, five ground sites over the Zhejiang Province region have been constructed by the local meteorological administrations to routinely monitor the air quality. Continuous aerosol measurements from these sites could not only provide air quality data for the surrounding areas but also support the assessments of MODIS AOD products in this region. Moreover, the spatial heterogeneity of the aerosol conditions could be considered limited between different sites, as they are located within a relatively small area. Therefore, the changes in the uncertainty levels of MODIS AOD retrievals among these ground sites appear to be linked to only the land cover dynamics, given the similar aerosol properties within a relatively small area.
Motivated by the lack of effective validations of MODIS AOD products in the YRD and the limited knowledge of the land-cover-associated AOD errors, the current study is designed to (1) evaluate the performance of Terra/Aqua MODIS DB10, DT3, and DT10 over the YRD region; (2) determine the correlations between the uncertainty measures of MODIS AOD and the percentages of urban and water areas in the surrounding region; and (3) discuss other potential factors that may impact the accuracy levels of MODIS AOD products.

2. Datasets and Methods

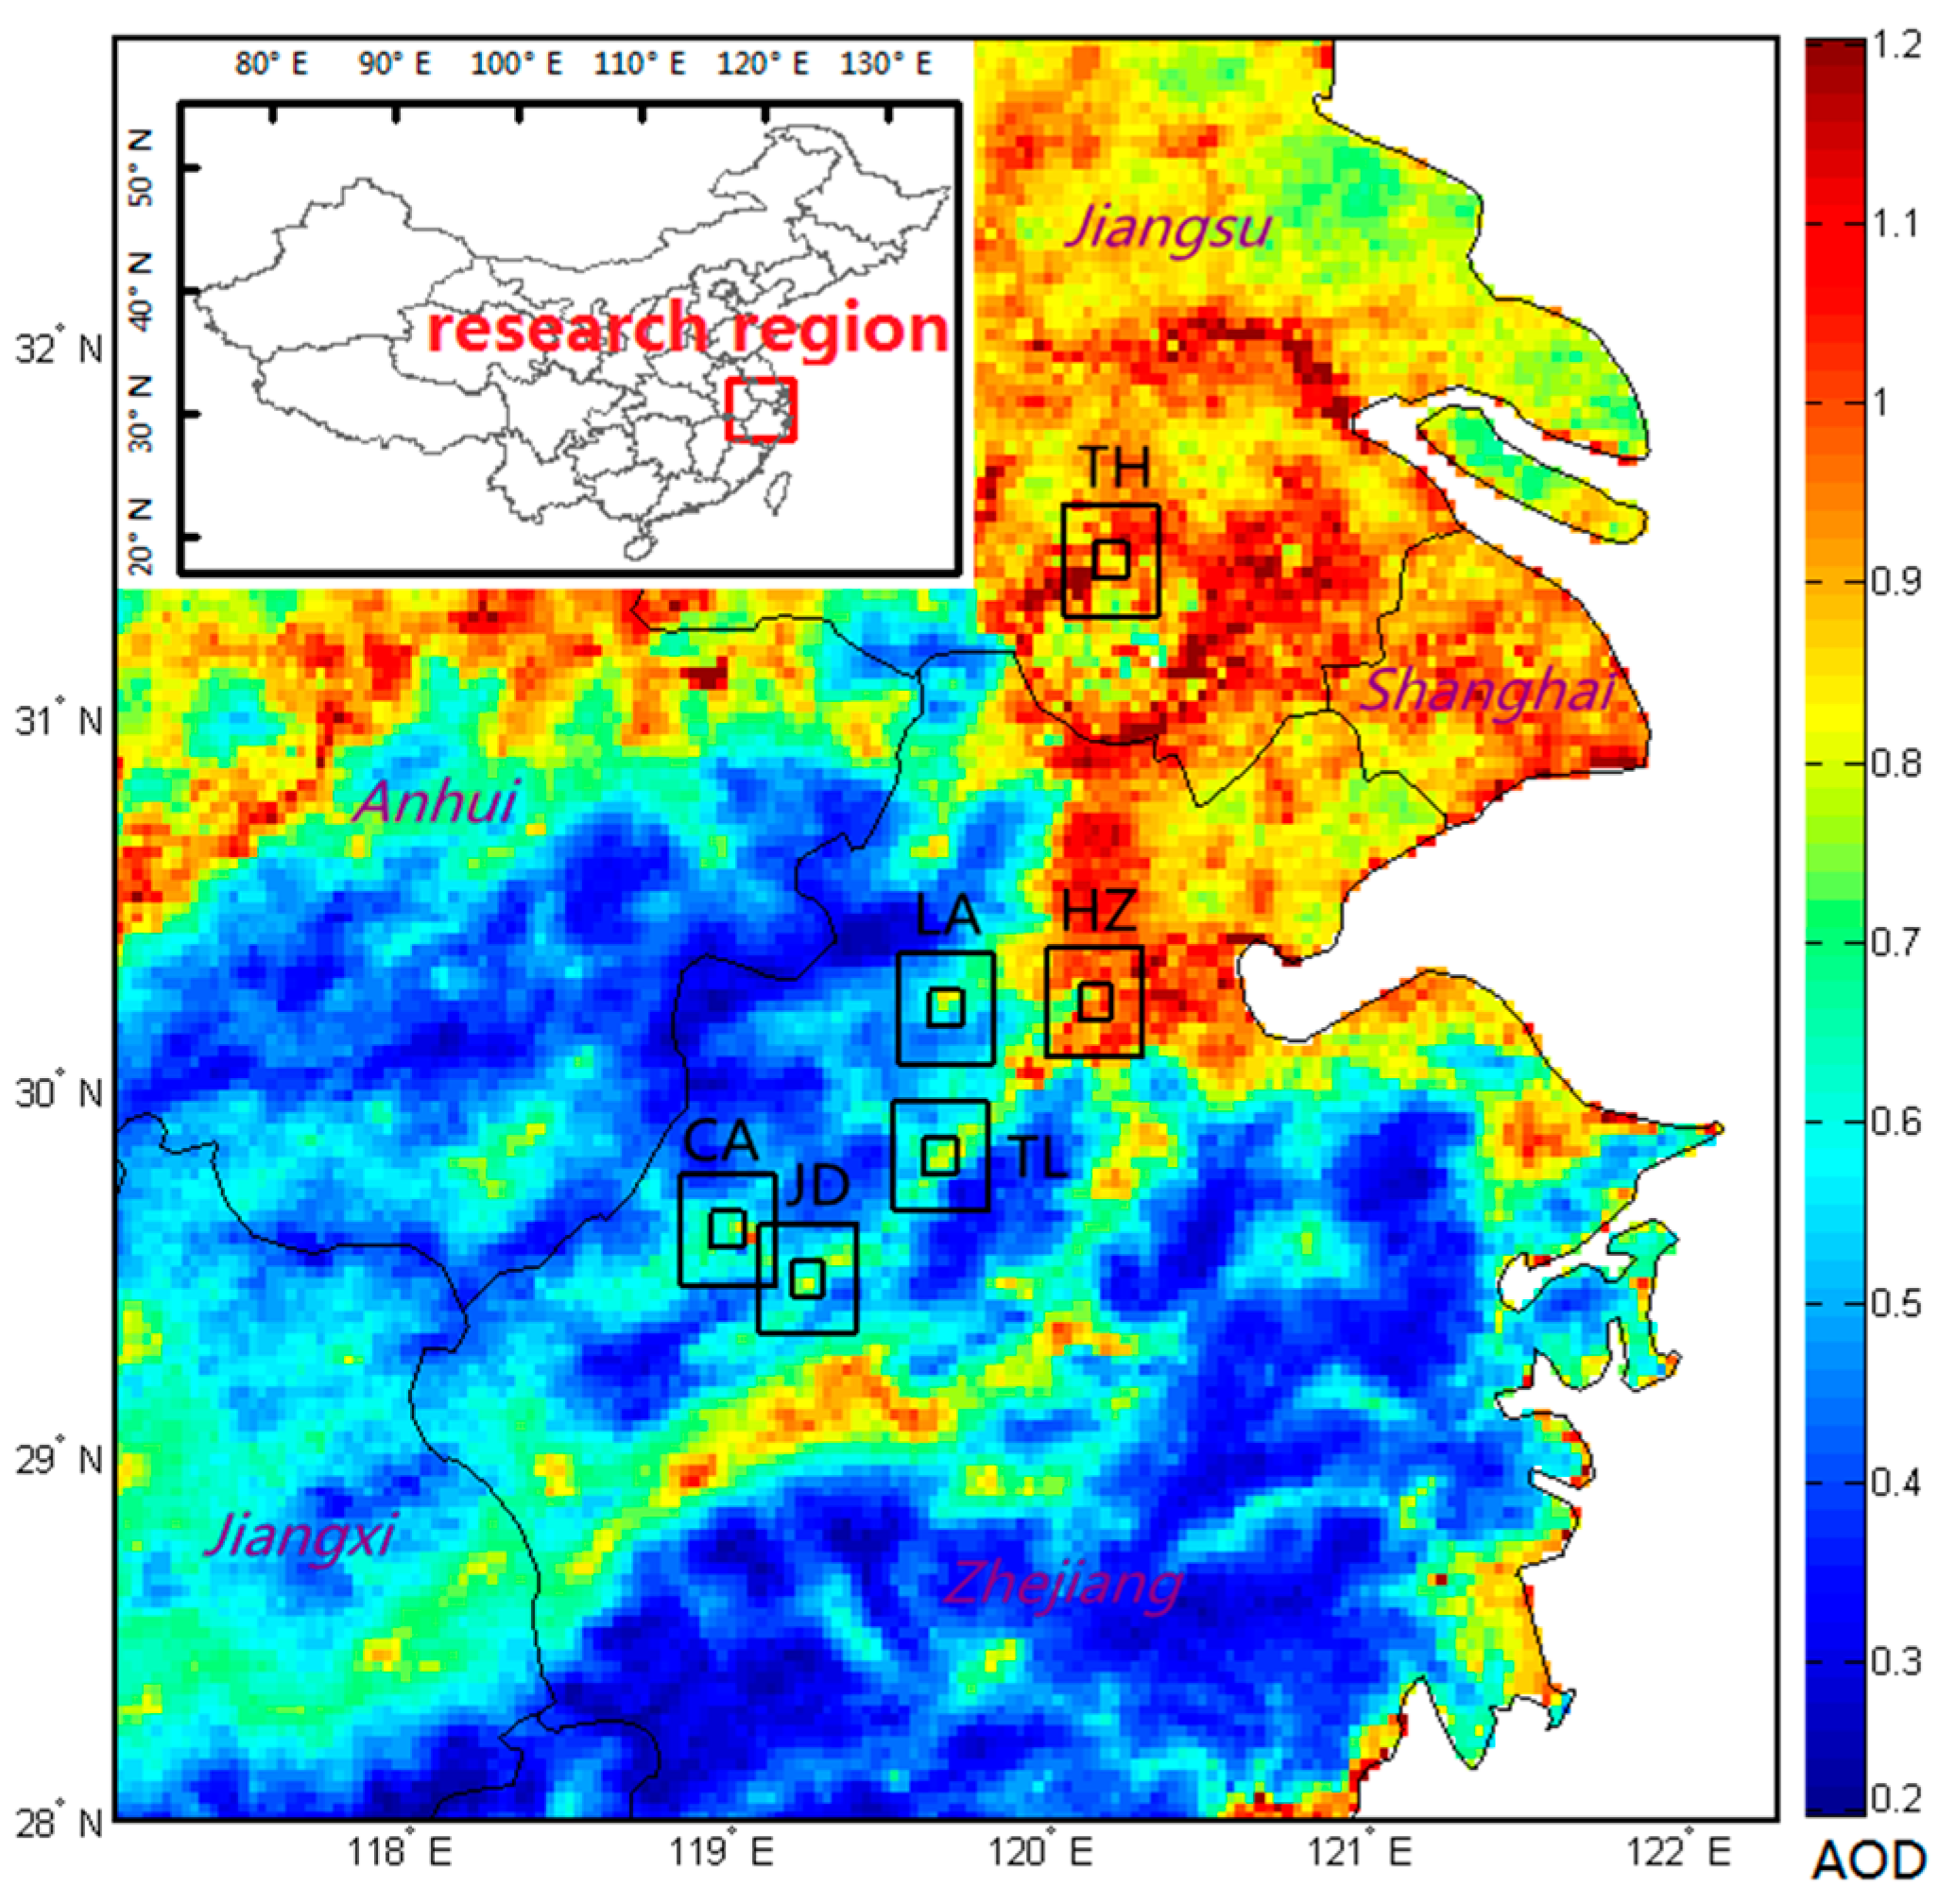
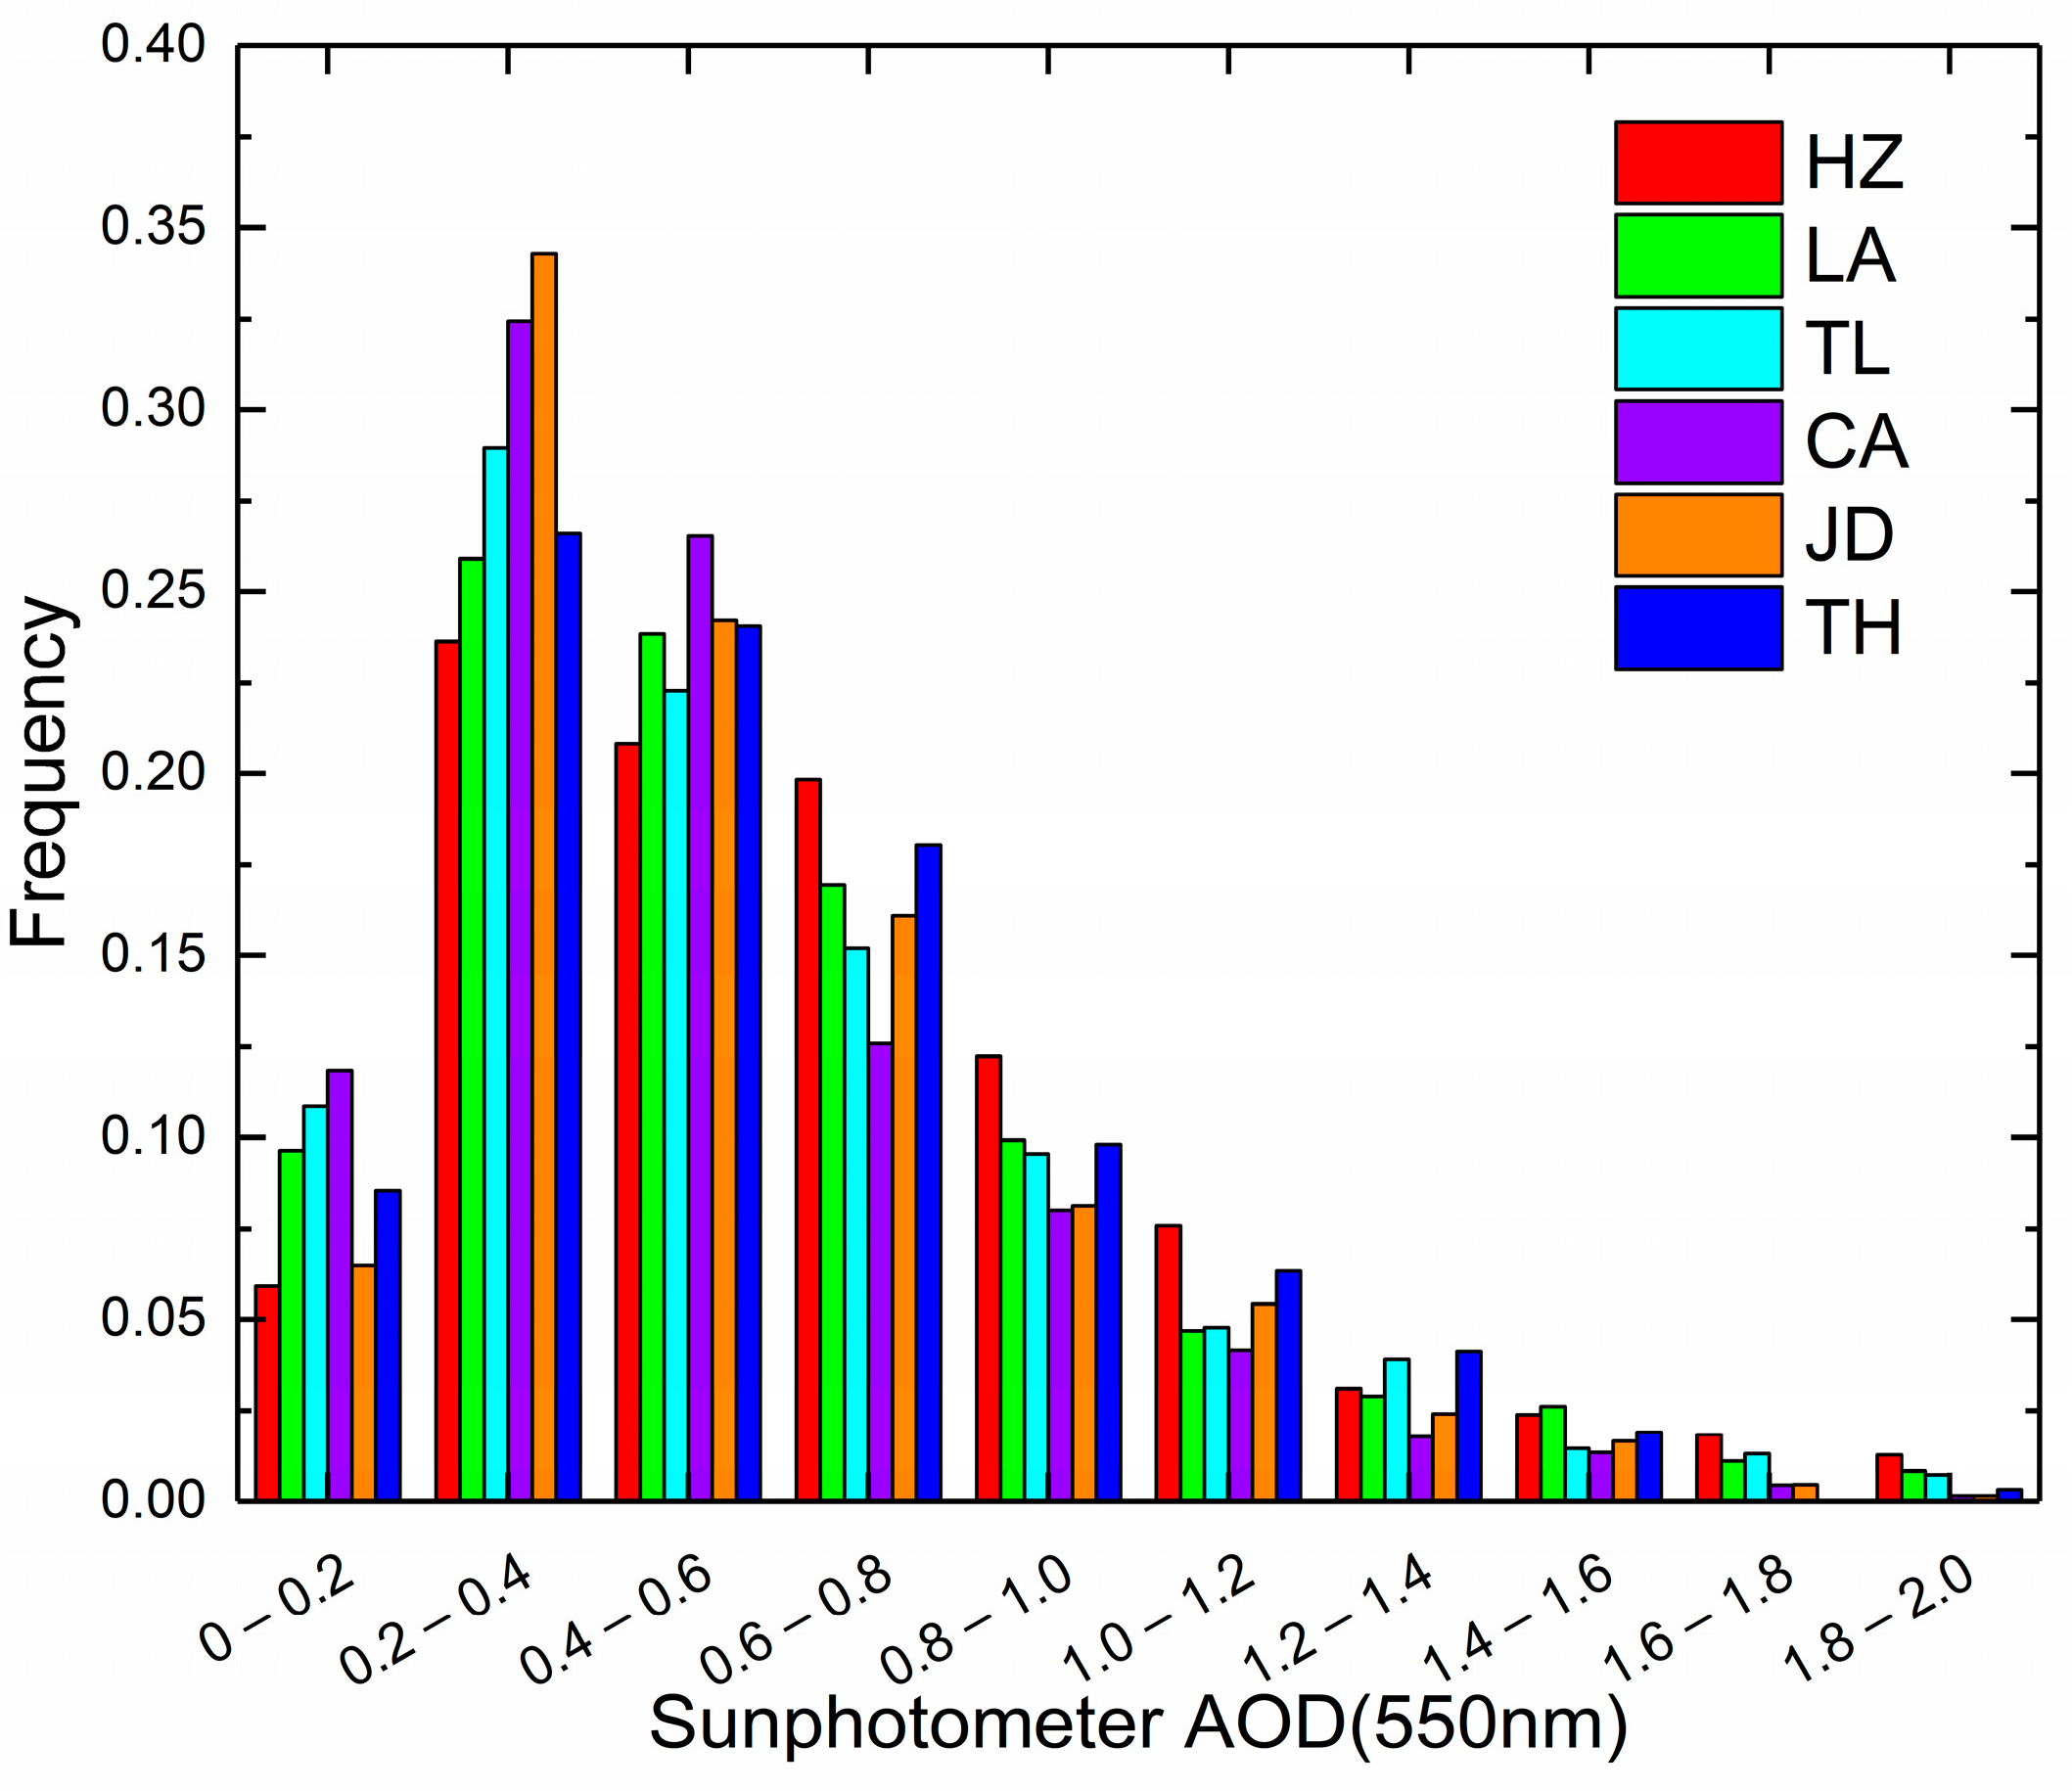
2.1. In Situ AOD Data from Six Ground Sites

In situ measurements collected from six ground sites were used to validate MODIS AOD products in this study. These sites are mainly located in the core regions of the YRD (see locations in Figure 1), and the sites are named Hangzhou (HZ), Linan (LA), Tonglu (TL), Chunan (CA), Jiande (JD), and Taihu (TH). A Cimel-318 (CE-318) sun photometer was mounted at each location to measure the aerosol optical properties. Typically, the total uncertainty of AOD derived from CE-318 measurements is within ±0.01 for wavelengths longer than 440 nm [47]. Five of the six sites (i.e., HZ, LA, TL, CA, and JD) located in Zhejiang Province were maintained by the local meteorological administrations, and the measurements were obtained from 2013 to 2016. Level 1.0 AOD data (without cloud screening) over the five sites were calculated by ASTPwin software (Cimel Ltd. Co., Paris, France). Level 1.5 AOD data (cloud-screened and quality-controlled) were derived following the methodology discussed in detail by Smirnov et al. (2000) [48]. The number of days with valid AOD measurements in the five local sites ranged from 665 to 726 (Shown in Table 1). An AERONET site (TH) located in the neighboring Jiangsu Province was also included in the study. To guarantee the data quality, we chose the Version 3 database from the AERONET website and used the level 2.0 (quality-assured) inversion data in the validation. The number of days with valid AOD measurements during 2013–2016 in TH site was 316, just nearly a half in comparison with the other five sites. All ground sites presented a similar AOD frequency distribution (shown in Figure 2), and the average AOD over the six sites ranged from 0.51 to 0.67 (Table 1). Detailed statistical information on the datasets of the six sites is listed in Table 1.
The land cover maps over the six ground sites during 2010 were obtained from the GlobeLand30 product (http://www.globallandcover.com, accessed on 21 October 2020), which has a spatial resolution of 30 m and an overall reported accuracy above 80% [49]. Five land cover types surround the ground sites: artificial surface (or urbanized area), forest, grassland, water, and cultivated land. Specifically, the land cover of four of the stations (LA, TL, CA, and JD) is dominated by vegetated areas, accounting for 50% of both the 9 km × 9 km and 30 km × 30 km boxes. In contrast, the HZ site is located in an urbanized area, and the TH site is close to water, and artificial surface features and water account for the most coverage in the selected windows centered over these stations. Indeed, the land cover proportions of urbanized features and water (LCP_UW) represent 10~80% of the total coverage within the windows, and such a large dynamic range makes it possible to analyze the impacts of LCP_UW on the accuracy of MODIS AOD retrievals.

2.2. MODIS AOD Data

MODIS AOD products that were concurrent with the in situ measurements were downloaded from the Atmosphere Archive & Distribution System (LAADS) Distributed Active Archive Center (DAAC) (https://ladsweb.modaps.eosdis.nasa.gov/search/, accessed on 10 June 2021). Three types of MODIS AOD products (at 0.55 μm) are available for MODIS instruments aboard both Terra and Aqua, including DT10 and DB10 products (MOD04_2L/MYD04_2L) and DT3 products (MOD04_3K/MYD04_3K). The MODIS DT algorithm takes advantage of the linear relationship of the spectral reflectance at the 0.47, 0.66, and 2.12 μm bands to retrieve the AOD over most vegetated and dark soiled surfaces [50]. Data with two resolutions (3 and 10 km) are provided by the DT algorithm. The DT3 AOD product differs from the 10 km product in only the size of the window during the generation processes. Validations with data collected from the global AERONET sites showed that the uncertainties of the 3 and 10 km DT AOD products are within ±(0.05 + 0.20τ) and ±(0.05 + 0.15τ) [7,30], respectively. Meanwhile, due to the adoption of a hybrid approach, the C6.1 MODIS DB algorithm could retrieve AOD over entire land surfaces including urbanized and vegetated regions [6]. The uncertainty of the DB AOD product is estimated to be within ±(0.03 + 0.20τ) [29]. Indeed, we selected only the C6.1 MODIS AOD products with the highest quality (quality assurance flag = 3) for validation in this study.

2.3. Selection of the Match-Ups between Satellite and Ground Measurements

Allowing for that both spatial and temporal matching strategy would have a significant influence on the accuracy assessment of satellite-derived AOD products, we adopted rigorous match-up criteria to minimize the impact of sampling mode on the accuracy assessment results. (1) Spatially, sampling windows of 3 × 3 pixels centered on the ground site were first extracted from the MODIS AOD product, and the windows with less than 2 pixels of valid AOD retrievals were excluded. A heterogeneity test was also applied to assure that no significant aerosol gradient occurred within each box, and we selected only the windows with associated standard deviations of less than 0.01. Then, the mean values of the sampling windows were calculated and used to compare with the ground-measured AOD. (2) Temporally, the difference in observation time between satellite and ground data was limited within ±30 min, assuming that the changes in aerosol conditions should be negligible within such a short period.
The CE-318 AOD retrievals do not provide data at 0.55 μm, prohibiting their direct comparison with MODIS AOD products. Fortunately, as the aerosol Ångström exponent follows the power law [44], AOD can be interpolated to 0.55 μm using the Ångström exponent α, which is defined as:
α = ln ( τ 0.44 / τ 0.67 ) / ln ( 0.44 / 0.67 )
Then, AOD at 0.55 μm ( τ 0.55 ) is calculated as [23]:
τ 0.55 = τ 0.50 ( 0.55 / 0.50 ) α
where τ 0.44 , τ 0.50 , and τ 0.67 are the CE-318-derived AOD values at 0.44, 0.50, and 0.67 μm, respectively.

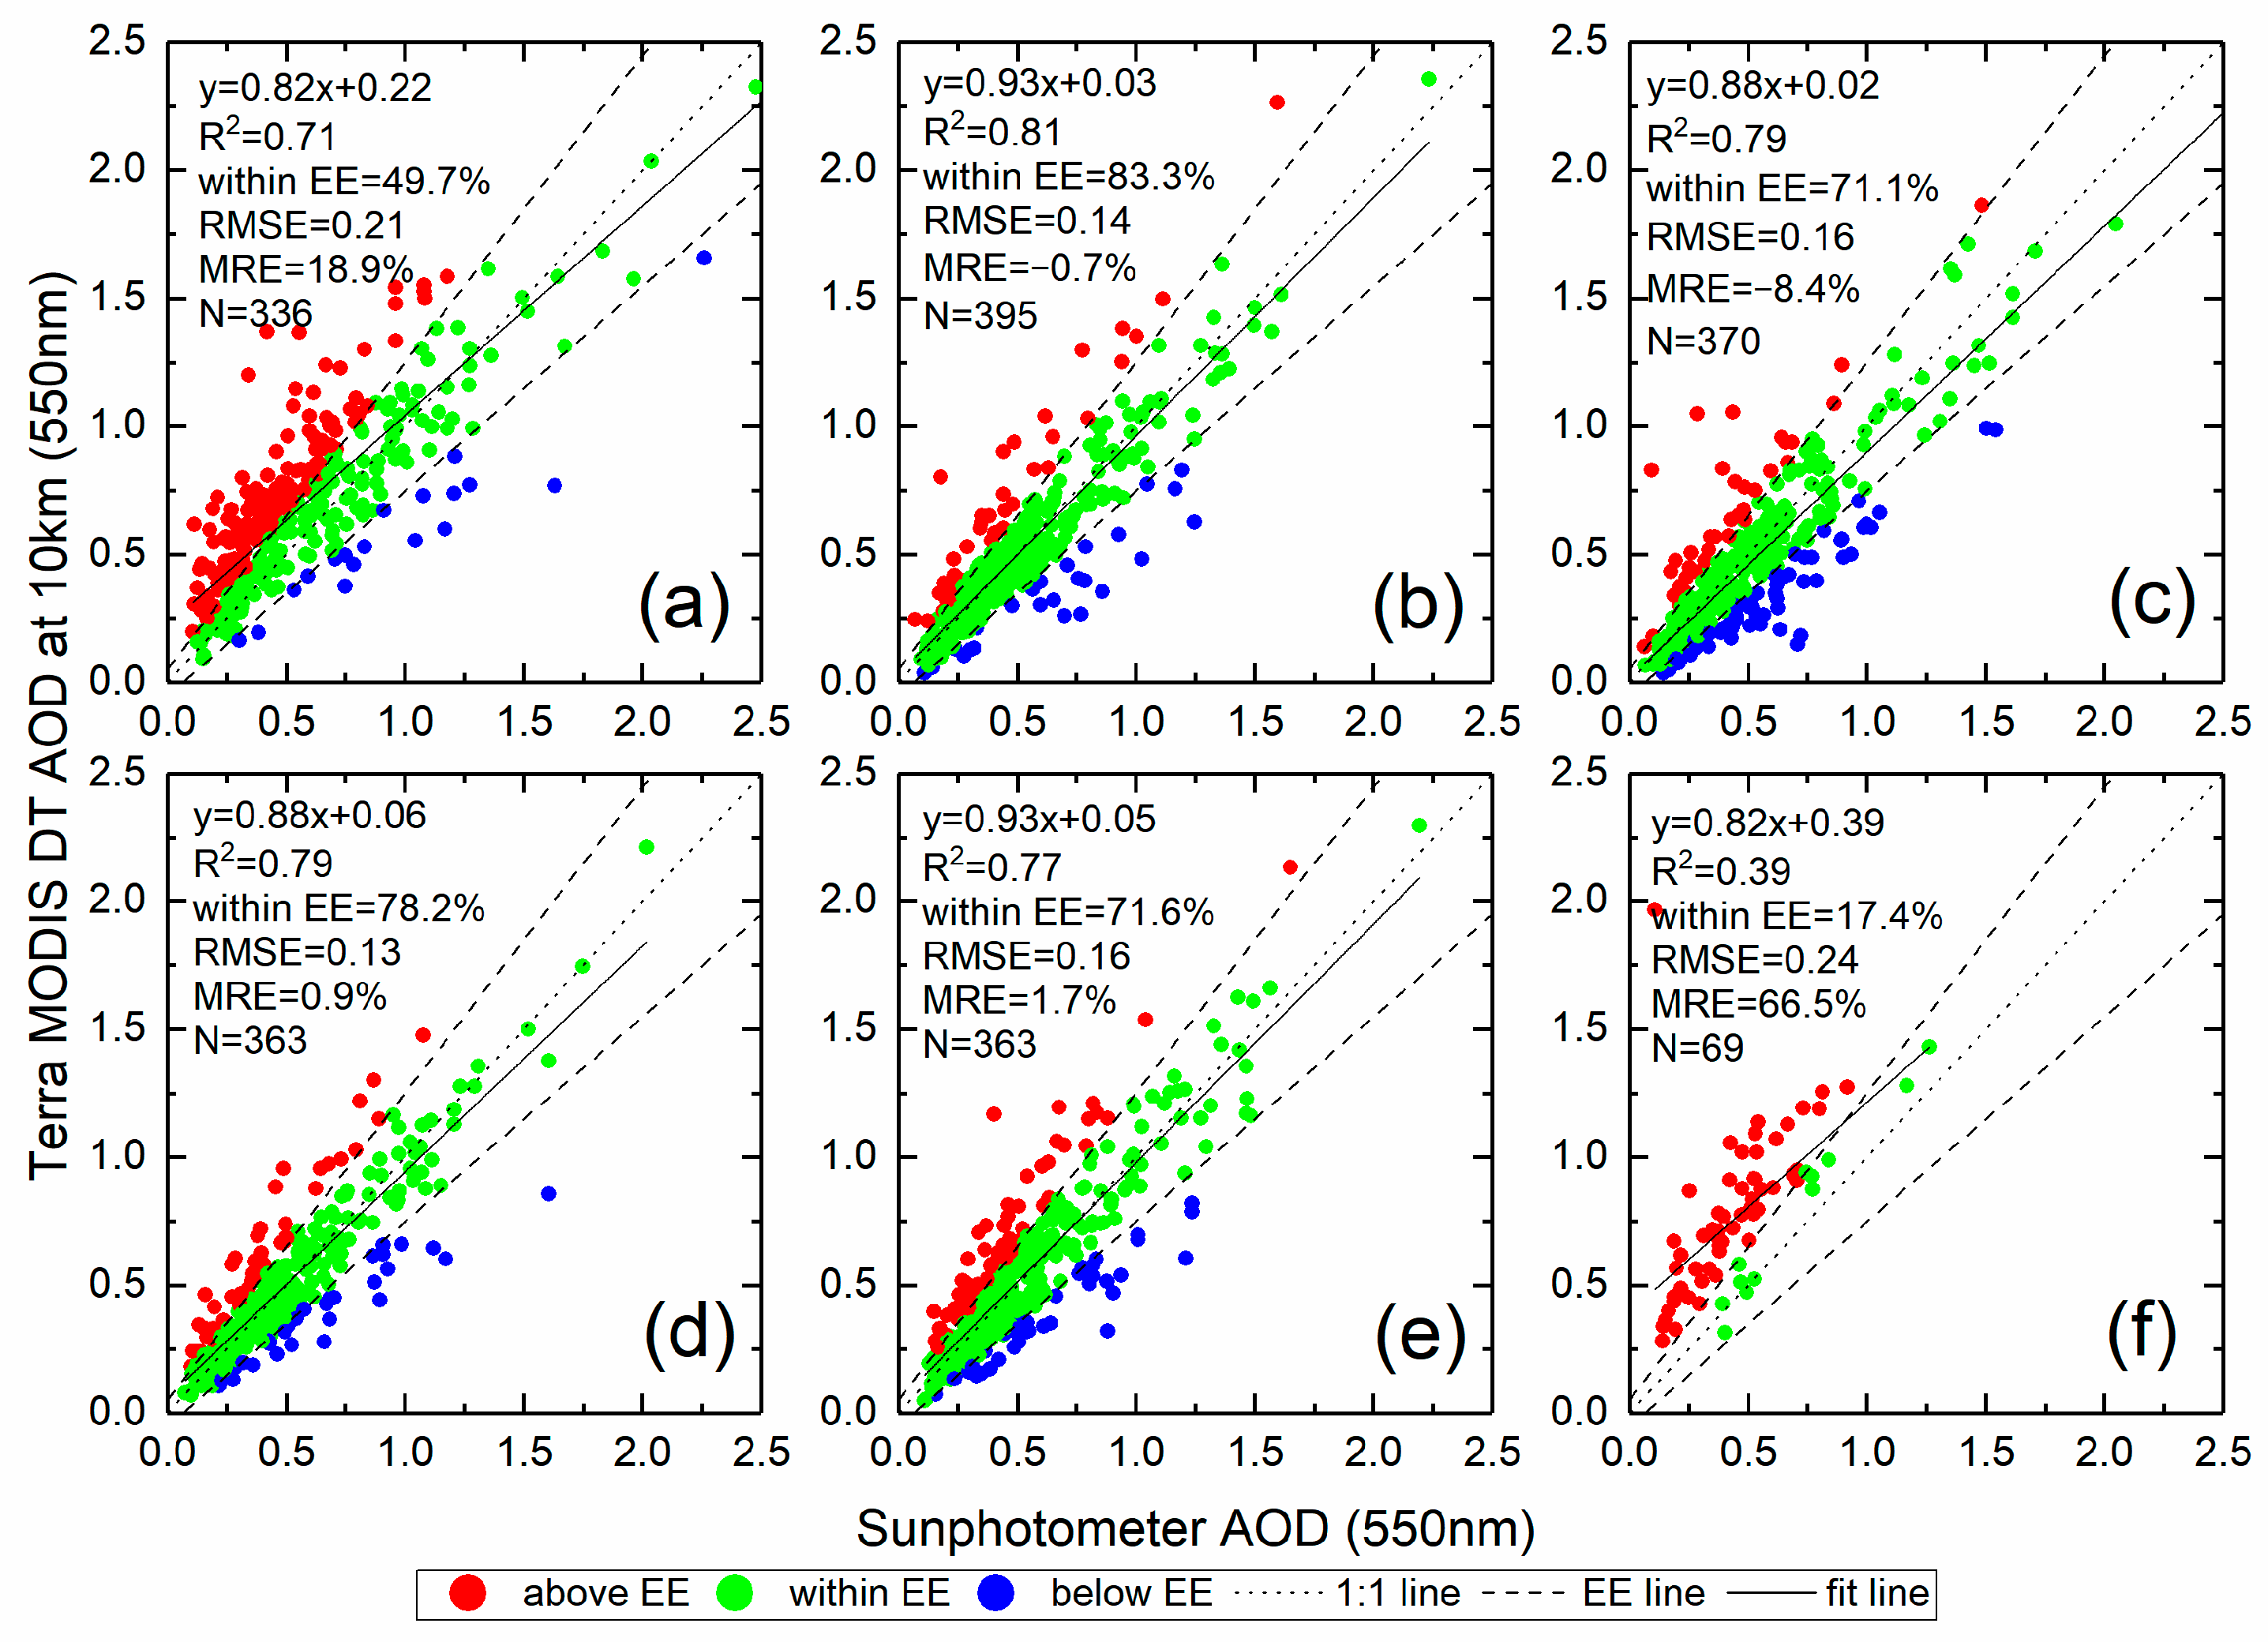
2.4. Accuracy Measures

The accuracy measures used to evaluate the MODIS AOD retrievals include the square of the correlation coefficient (R2), root mean square error (RMSE), mean relative error (MRE), and expected error (EE). They are defined as follows:
R 2 = ( i = 1 n ( A O D M A O D M ¯ ) ( A O D G A O D G ¯ ) i = 1 n ( A O D M A O D M ¯ ) 2 i = 1 n ( A O D G A O D G ¯ ) 2 ) 2
RMSE = ( 1 n i = 1 n ( A O D M A O D G ) 2 )
MRE ( % ) = 100 n × A O D ¯ G i = 1 n ( A O D M A O D G )
EE = ± ( 0.05 + 0.2 × AOD )
where A O D M and A O D G represent the collocated MODIS and ground-derived AOD retrievals and A O D M ¯ and A O D G ¯ represent the means of the MODIS and in situ AOD retrievals, respectively. The EE defined in this study is the target accuracy of the MODIS 3 km AOD product [30], which is the least restrictive among the three MODIS AOD products. The percentages of MODIS AOD retrievals that fall above, within, and below the EE envelope are calculated by Equations (7)–(9).
A O D M > AOD + | EE |
AOD | E E | A O D M AOD + | EE |
A O D M < AOD | EE |

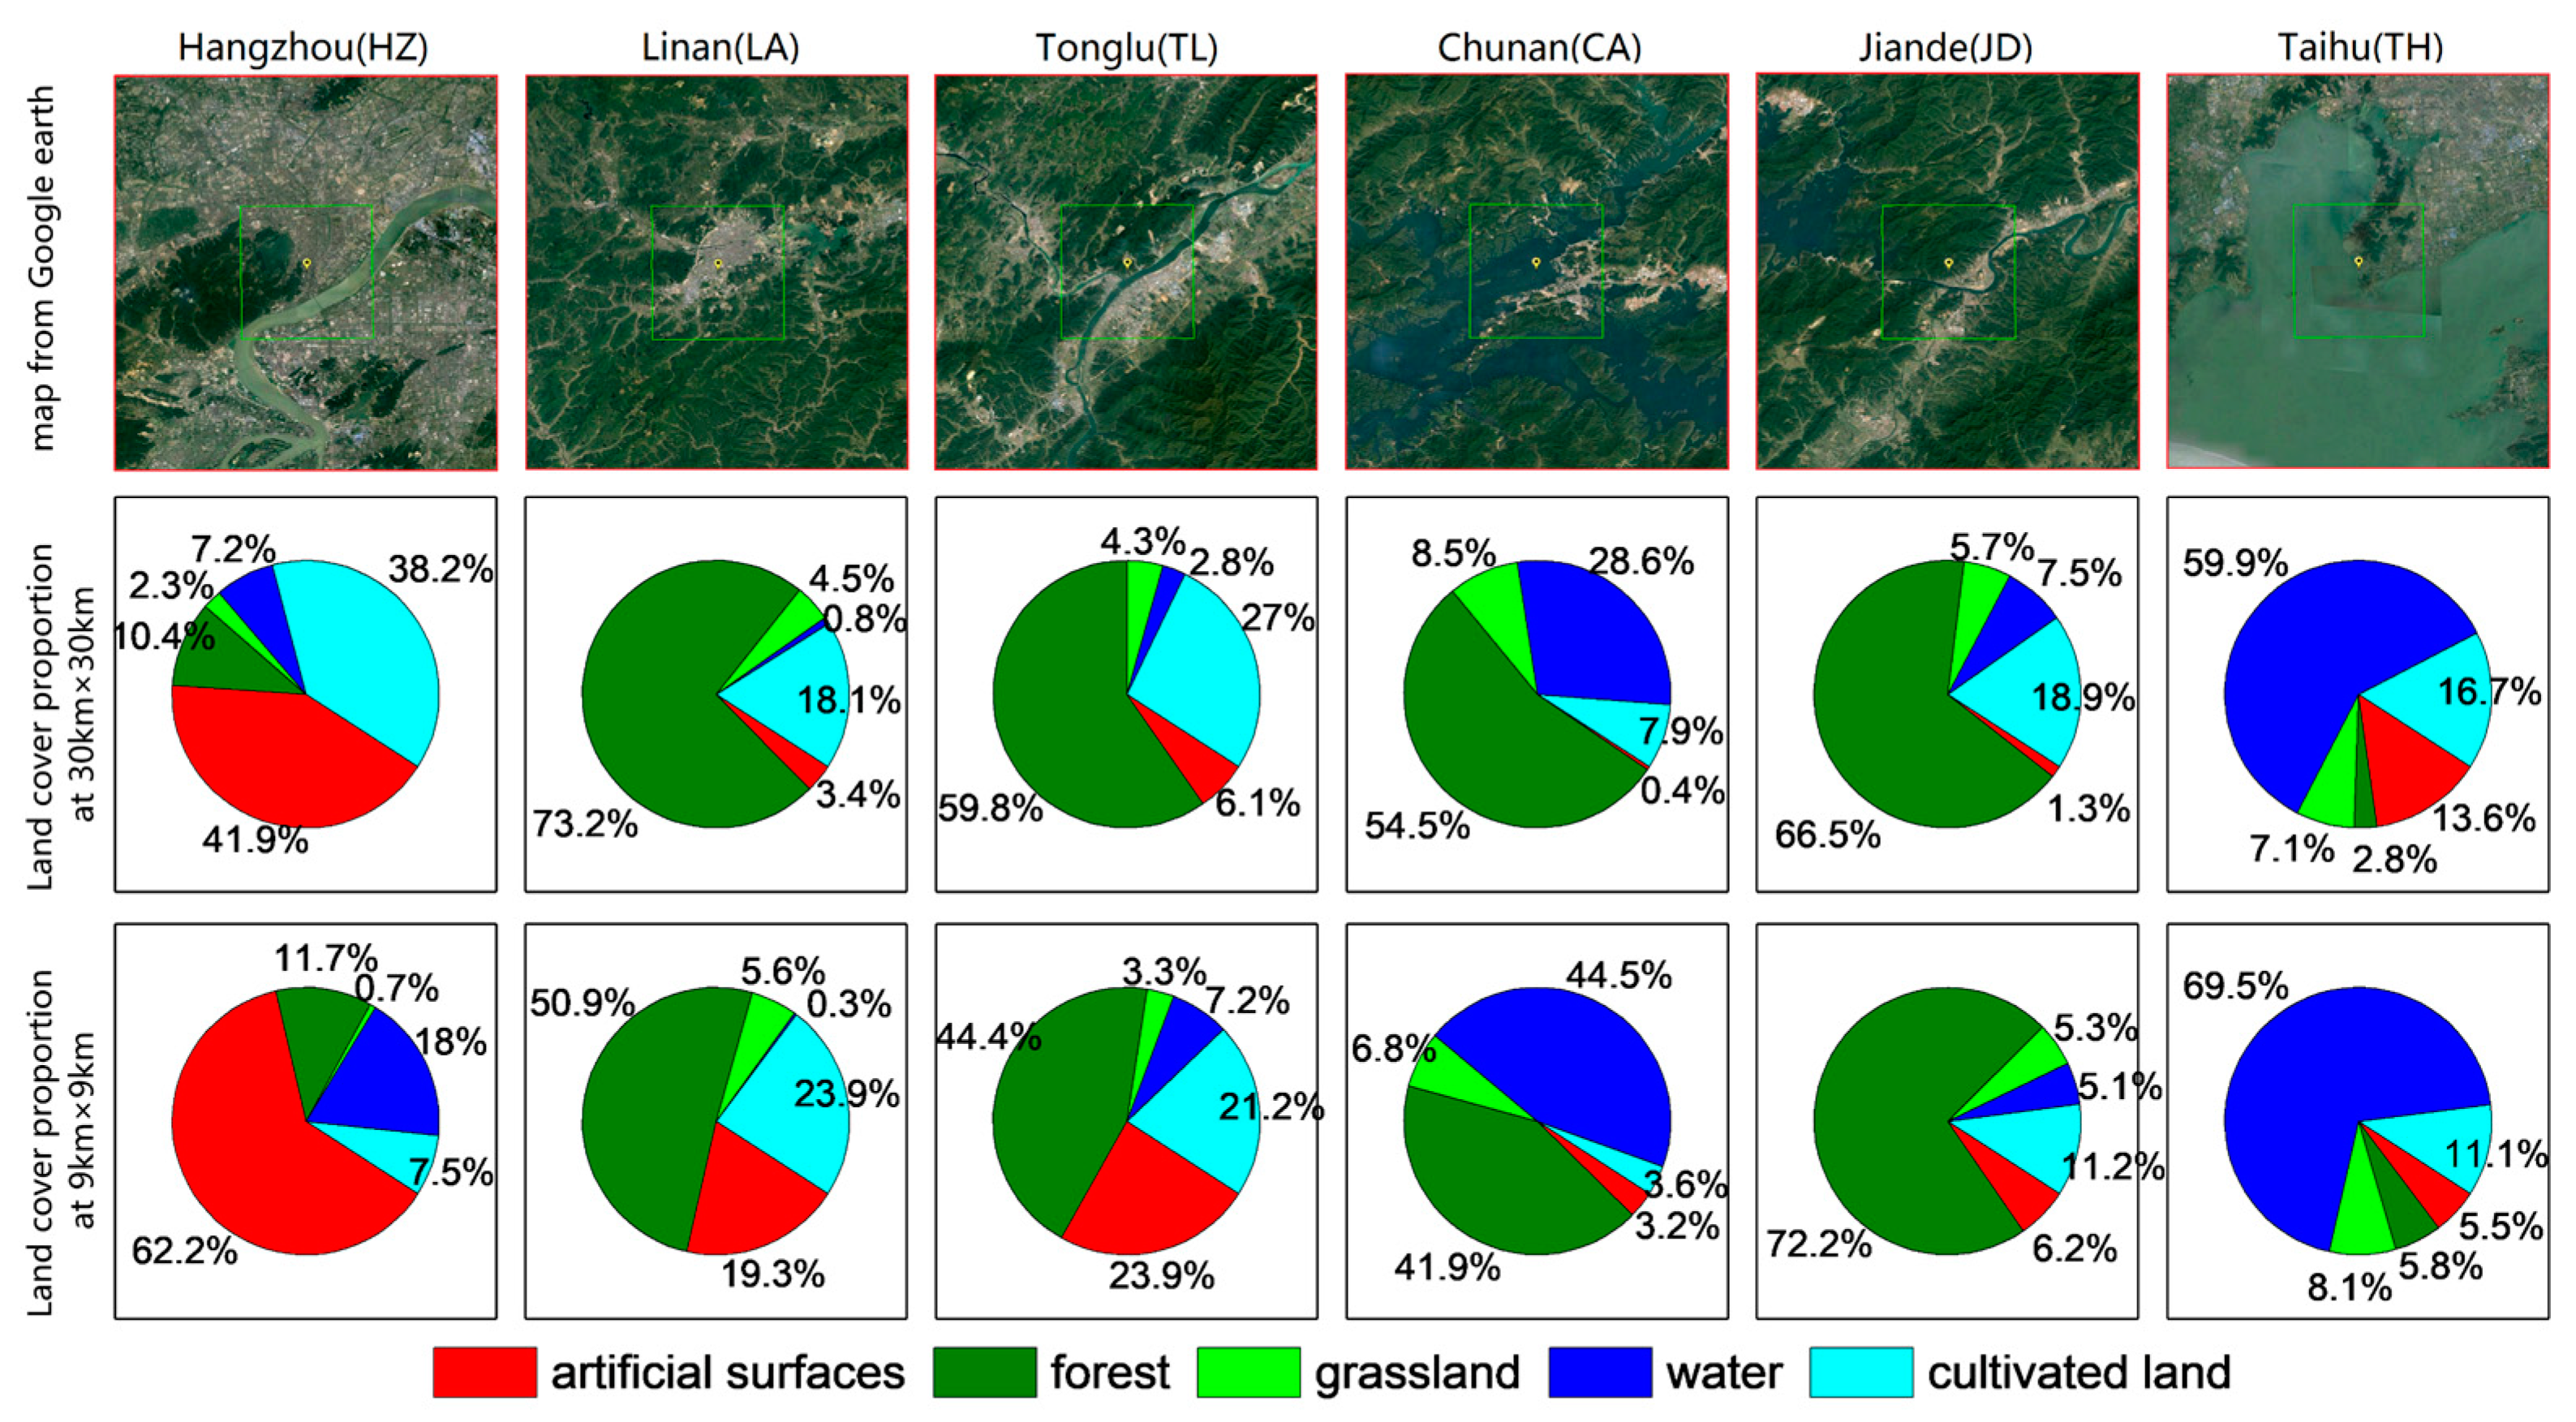
2.5. Correlations between MODIS AOD Accuracies and Land Cover Proportions

For each ground site, we calculated the coverage percentages for different cover types within two different boxes (i.e., 9 km × 9 km and 30 km × 30 km) centered over the site (Figure 3). The sizes of the two selected boxes correspond to 3 × 3-pixel windows in 3 and 10 km MODIS AOD products. To quantitatively estimate how the surface features could impact the performance of the MODIS AOD algorithms, we analyzed the relationships between the percentage of urban and water areas within a region and the accuracy measures of the MODIS AOD retrievals (in terms of R2, within EE, and MRE) over the sampling windows centered over the ground sites. The proportion of urban cover has been applied in some DT-style inversion algorithms as a correction factor to improve the accuracy of MODIS AOD retrievals over urban areas [38,51]. However, the presence of water could also serve as an important factor to interrupt the assumed correlations between visible and SWIR bands, increasing the bias of MODIS AOD retrievals [24]. Therefore, the coverage percentages of both water and urban areas were considered in this study.

3. Results and Discussion

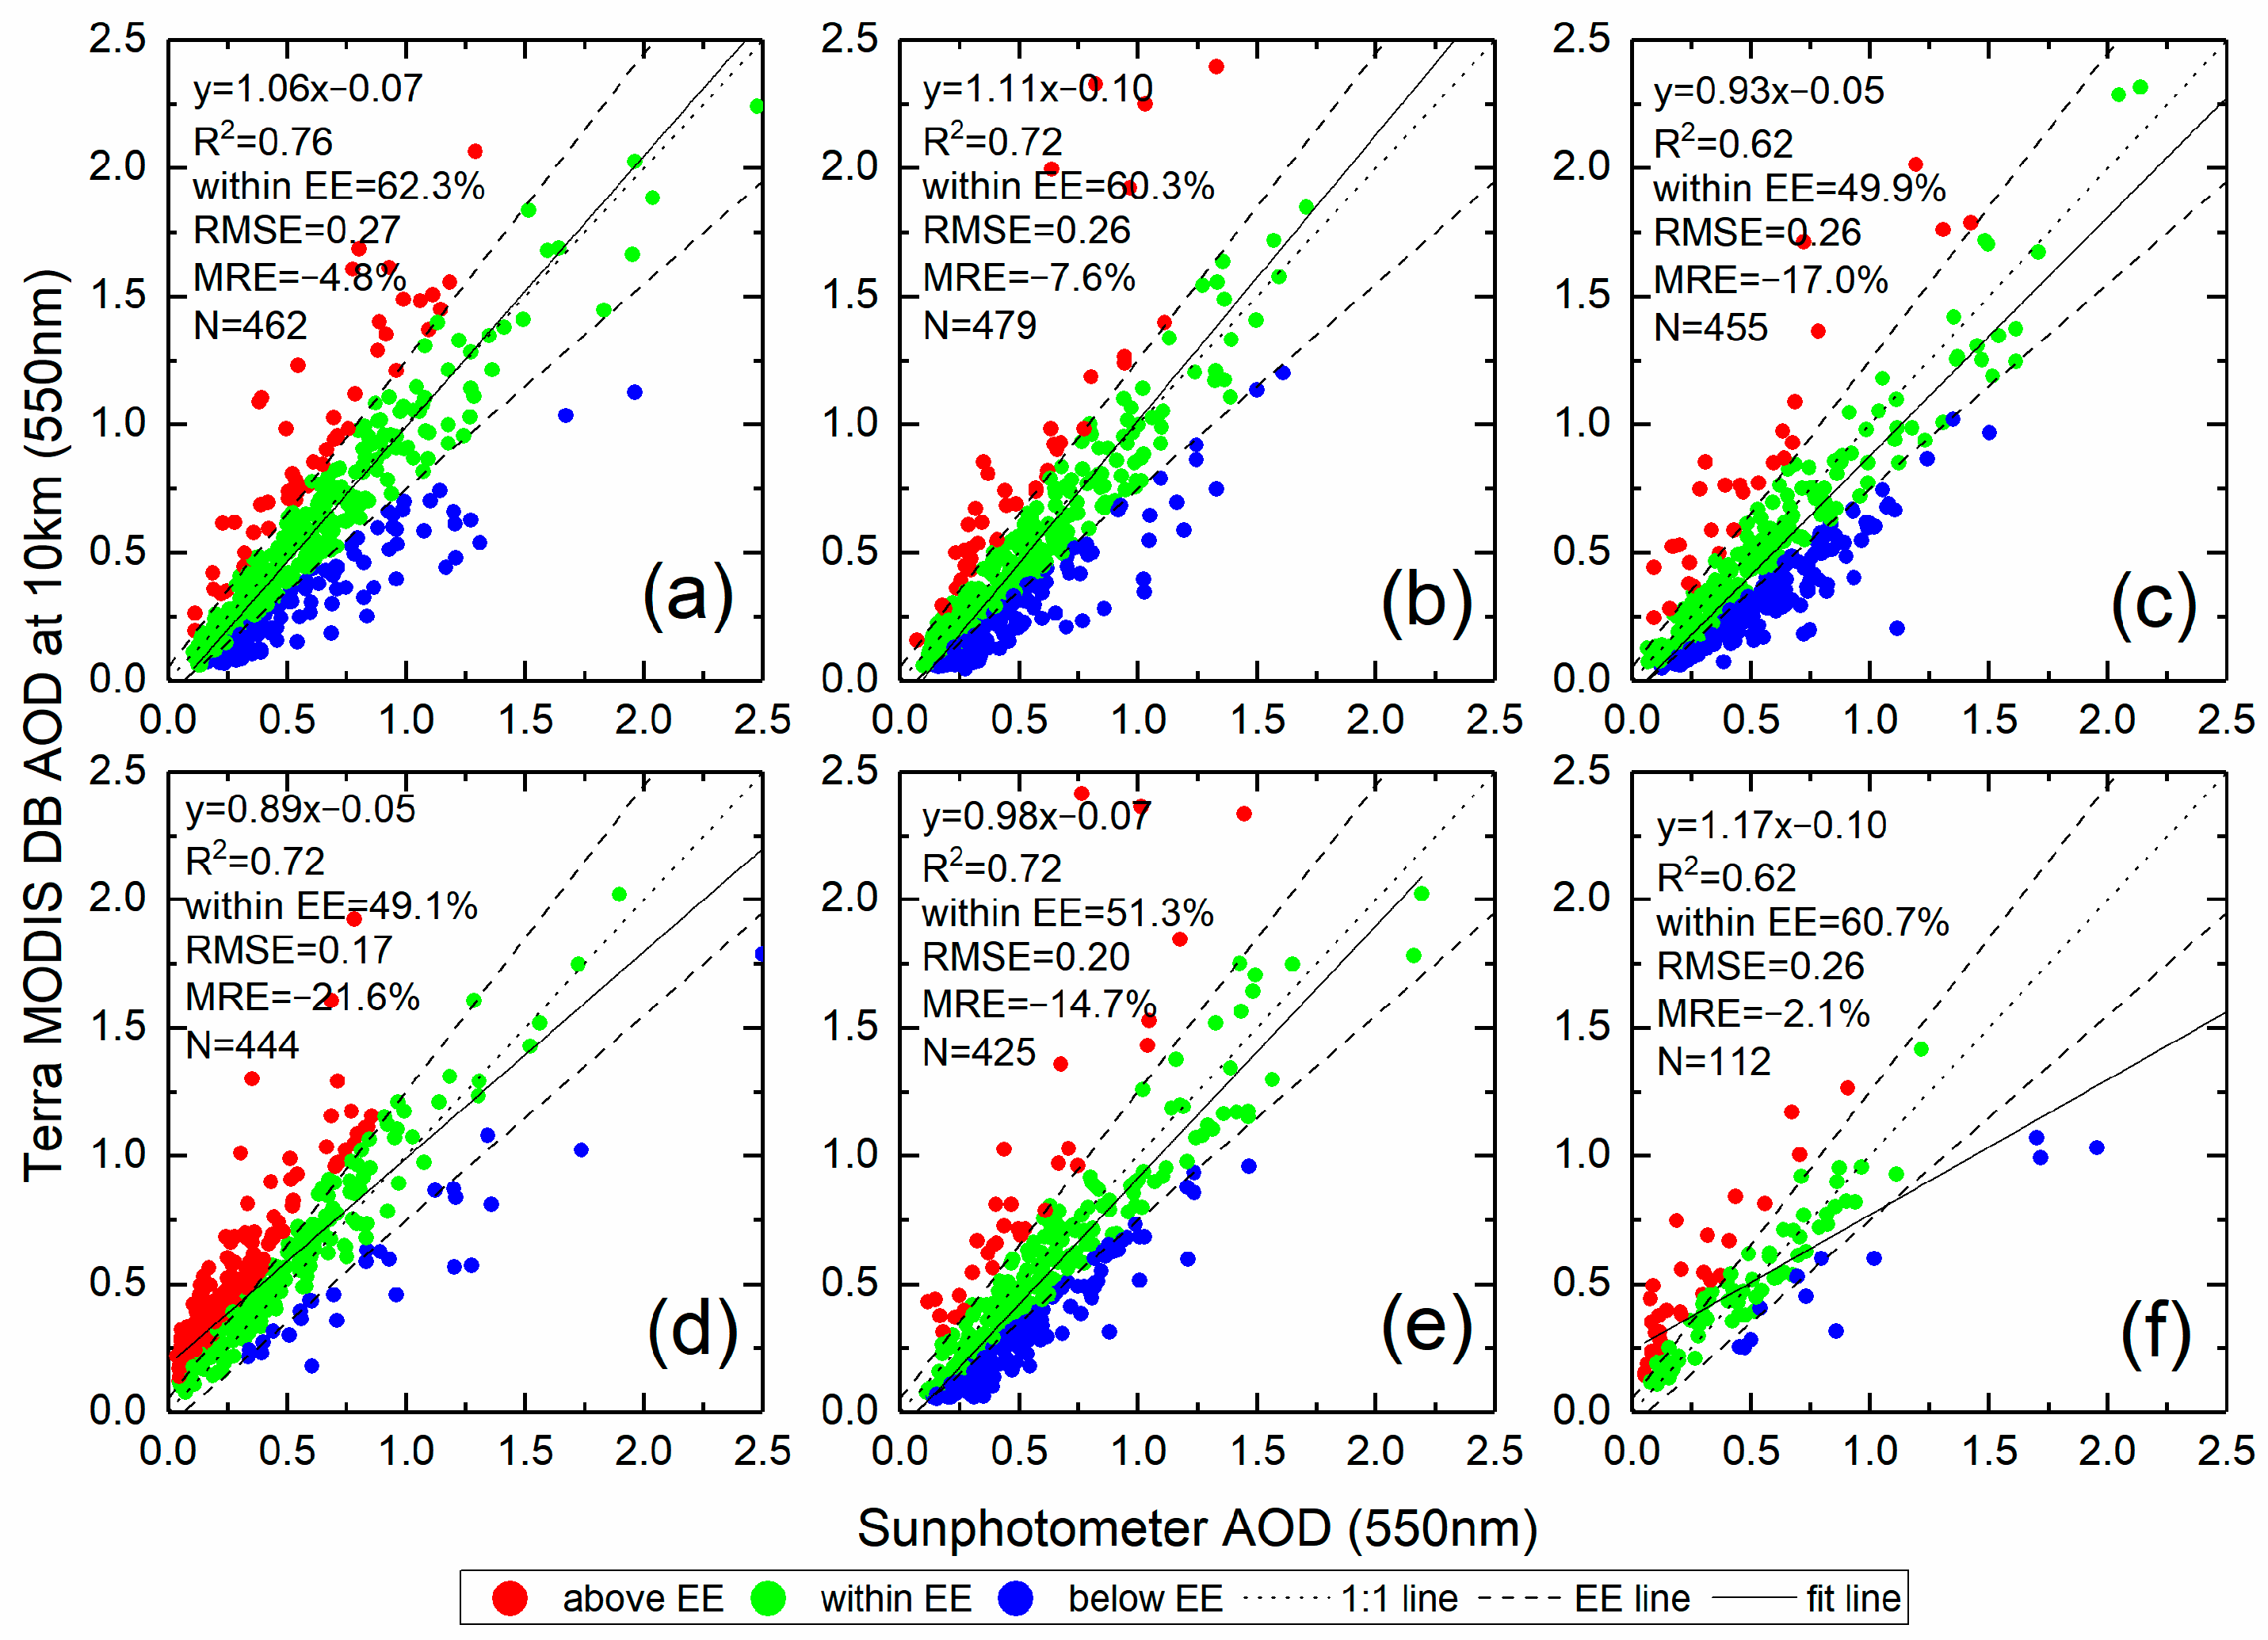
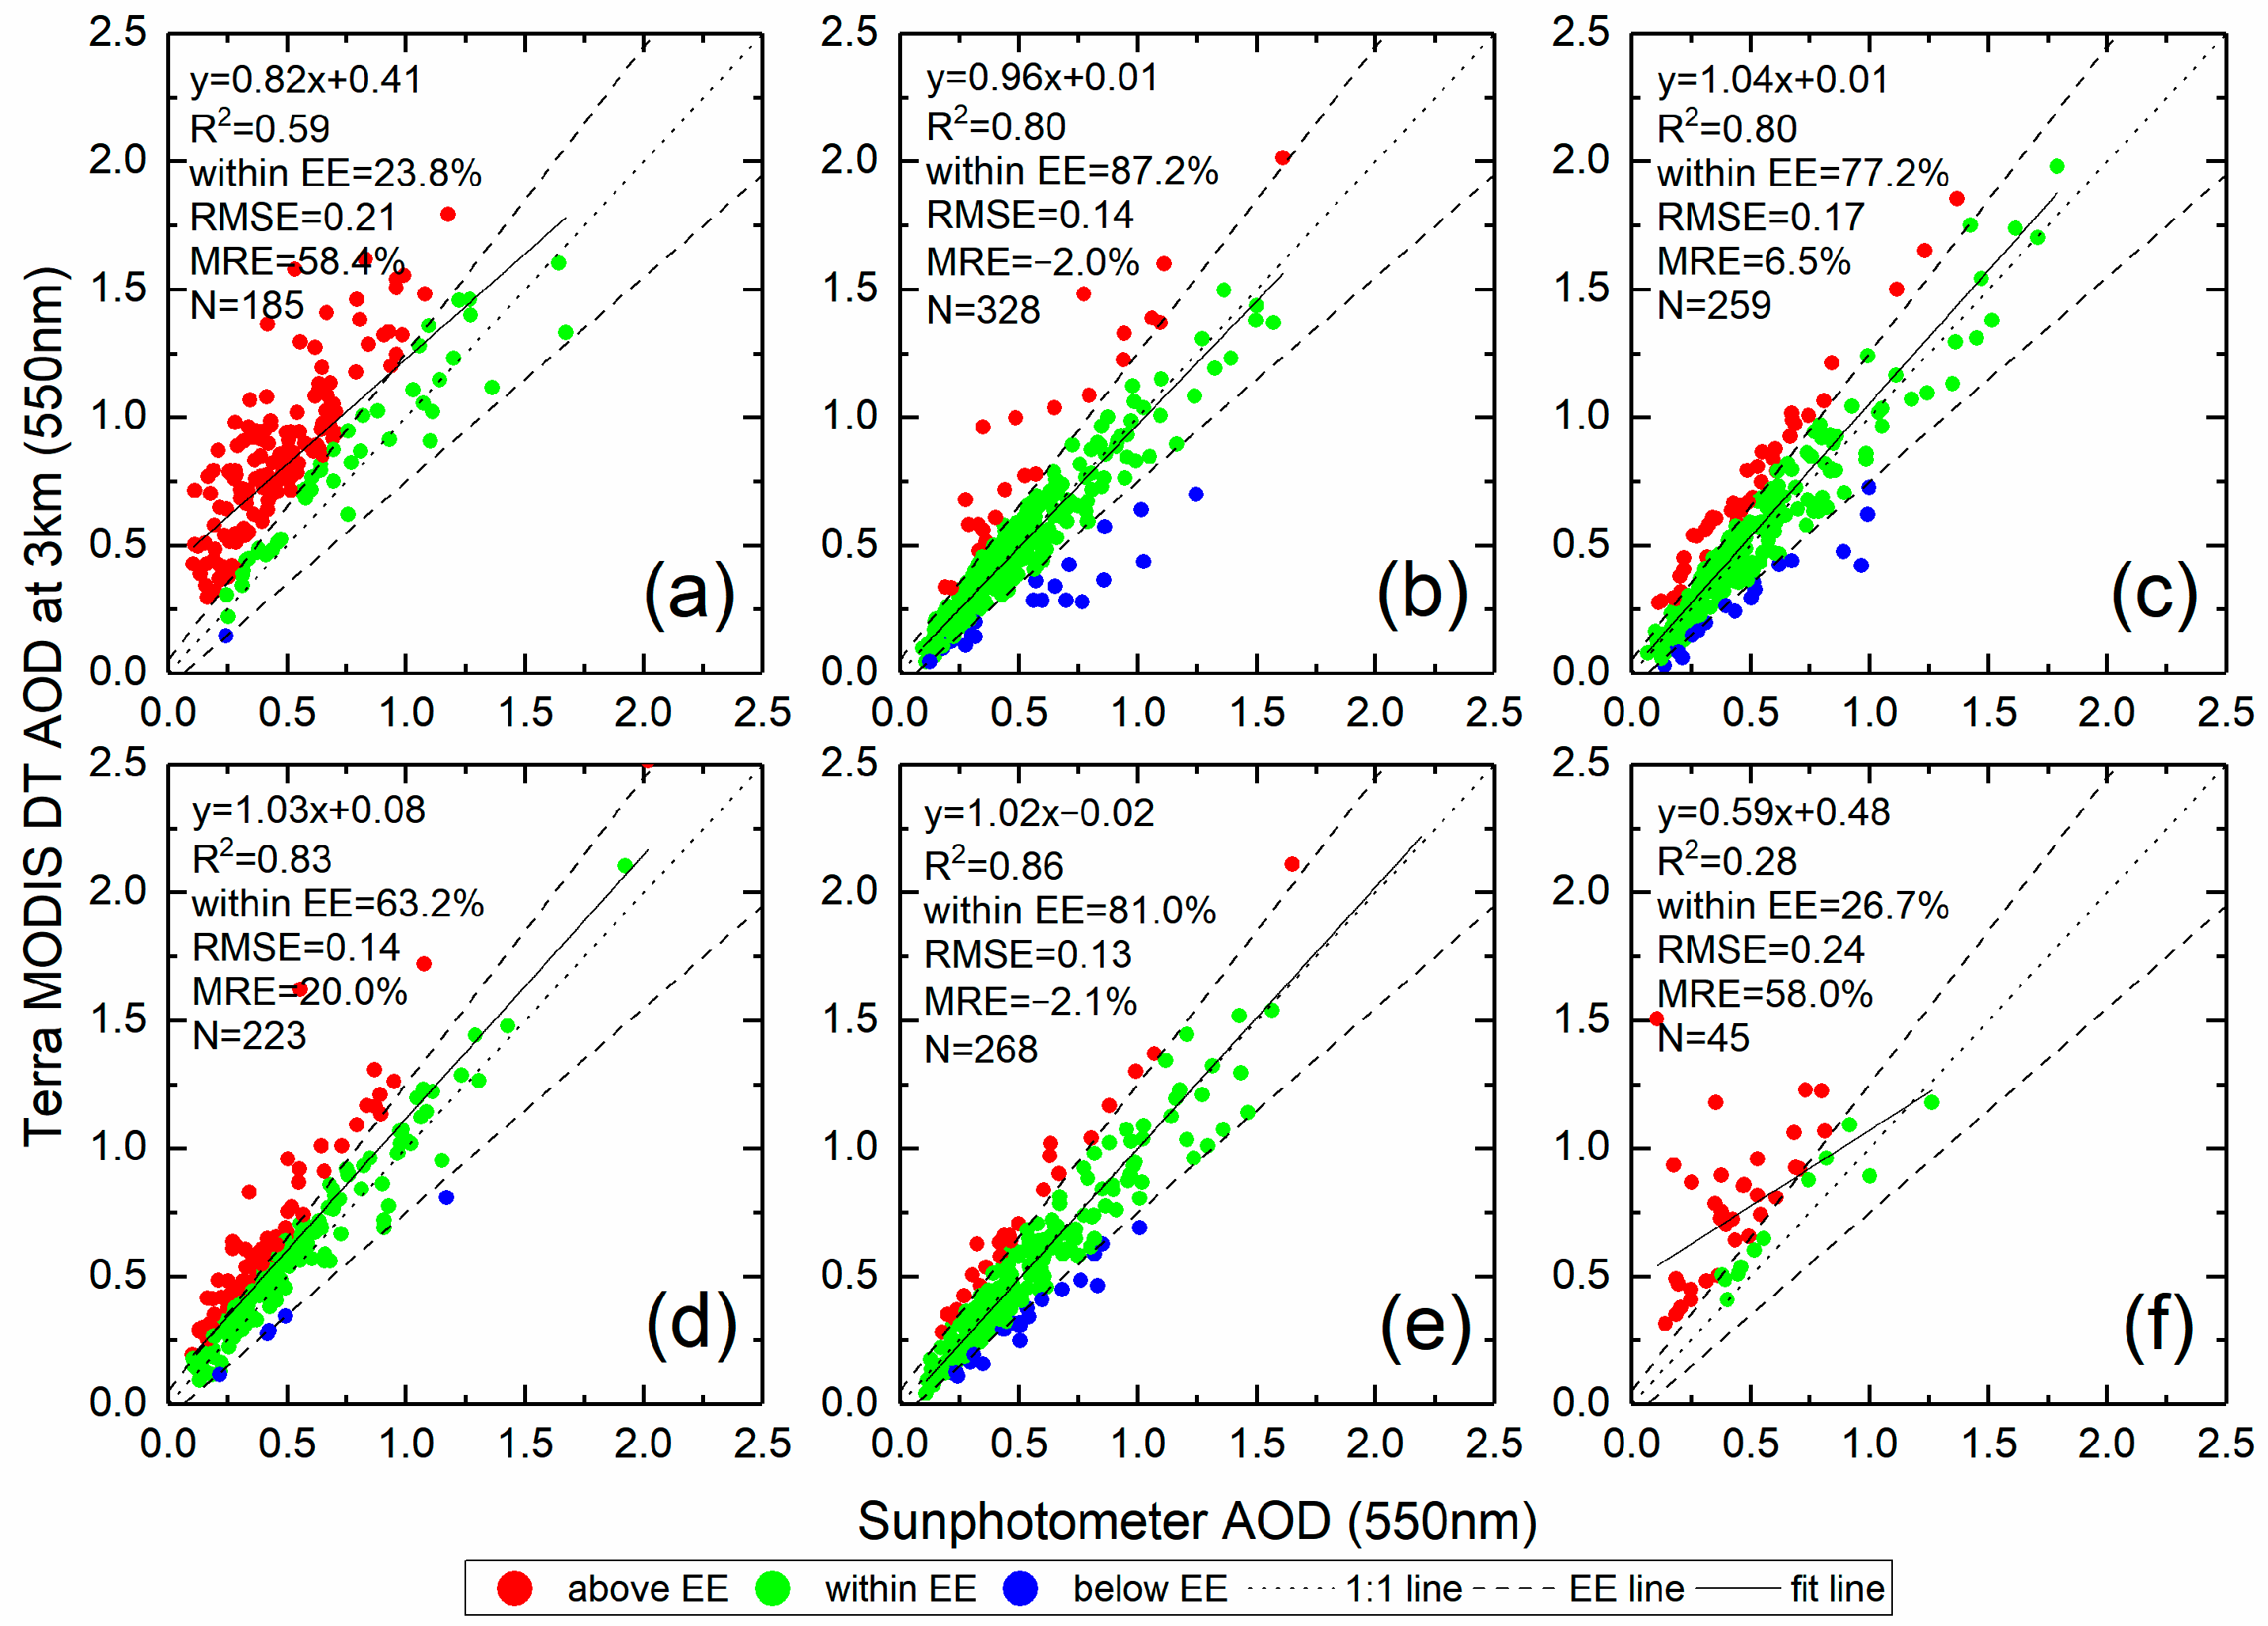
3.1. Overall Accuracy of MODIS C6.1 AOD Product

The comparisons between three types of MODIS Terra AOD retrievals and concurrent ground site measurements are illustrated in Figure 4, Figure 5 and Figure 6. The performances of the satellite-derived AOD products varied significantly among the different ground sites and algorithms. Generally, when the land cover was dominated by vegetation, pronounced agreements could be found between the satellite and in situ data. Numerically, the correlation coefficients (R2) for the four vegetated sites were 0.77~0.81, 0.8~0.86, and 0.62~0.72 for the DT10, DT3, and DB10 products, respectively. Moreover, the fractions of the AOD retrievals that fell within the EE were 71~83%, 63~87%, and 49~60% for the DT10, DT3, and DB10 products, respectively. Slightly lower accuracies were found for urbanized and lakeside sites (HZ and TH). The R2 values for these two sites were 0.39~0.71 for DT10, 0.28~0.59 for DT3, and 0.62~0.76 for DB10, and the fractions of the AOD retrievals within the EE were 17~50% for DT10, 24~27% for DT3, and 61~62% for DB10. On the other hand, while the DT algorithm (including 3 and 10 km products) outperformed the DB algorithm over the vegetated region, the opposite was found to be true for urbanized and lakeside sites. Such comparisons were also conducted for the MODIS Aqua AOD products (Figures S1–S3), where the patterns appeared to be very similar to those of the MODIS Terra products.

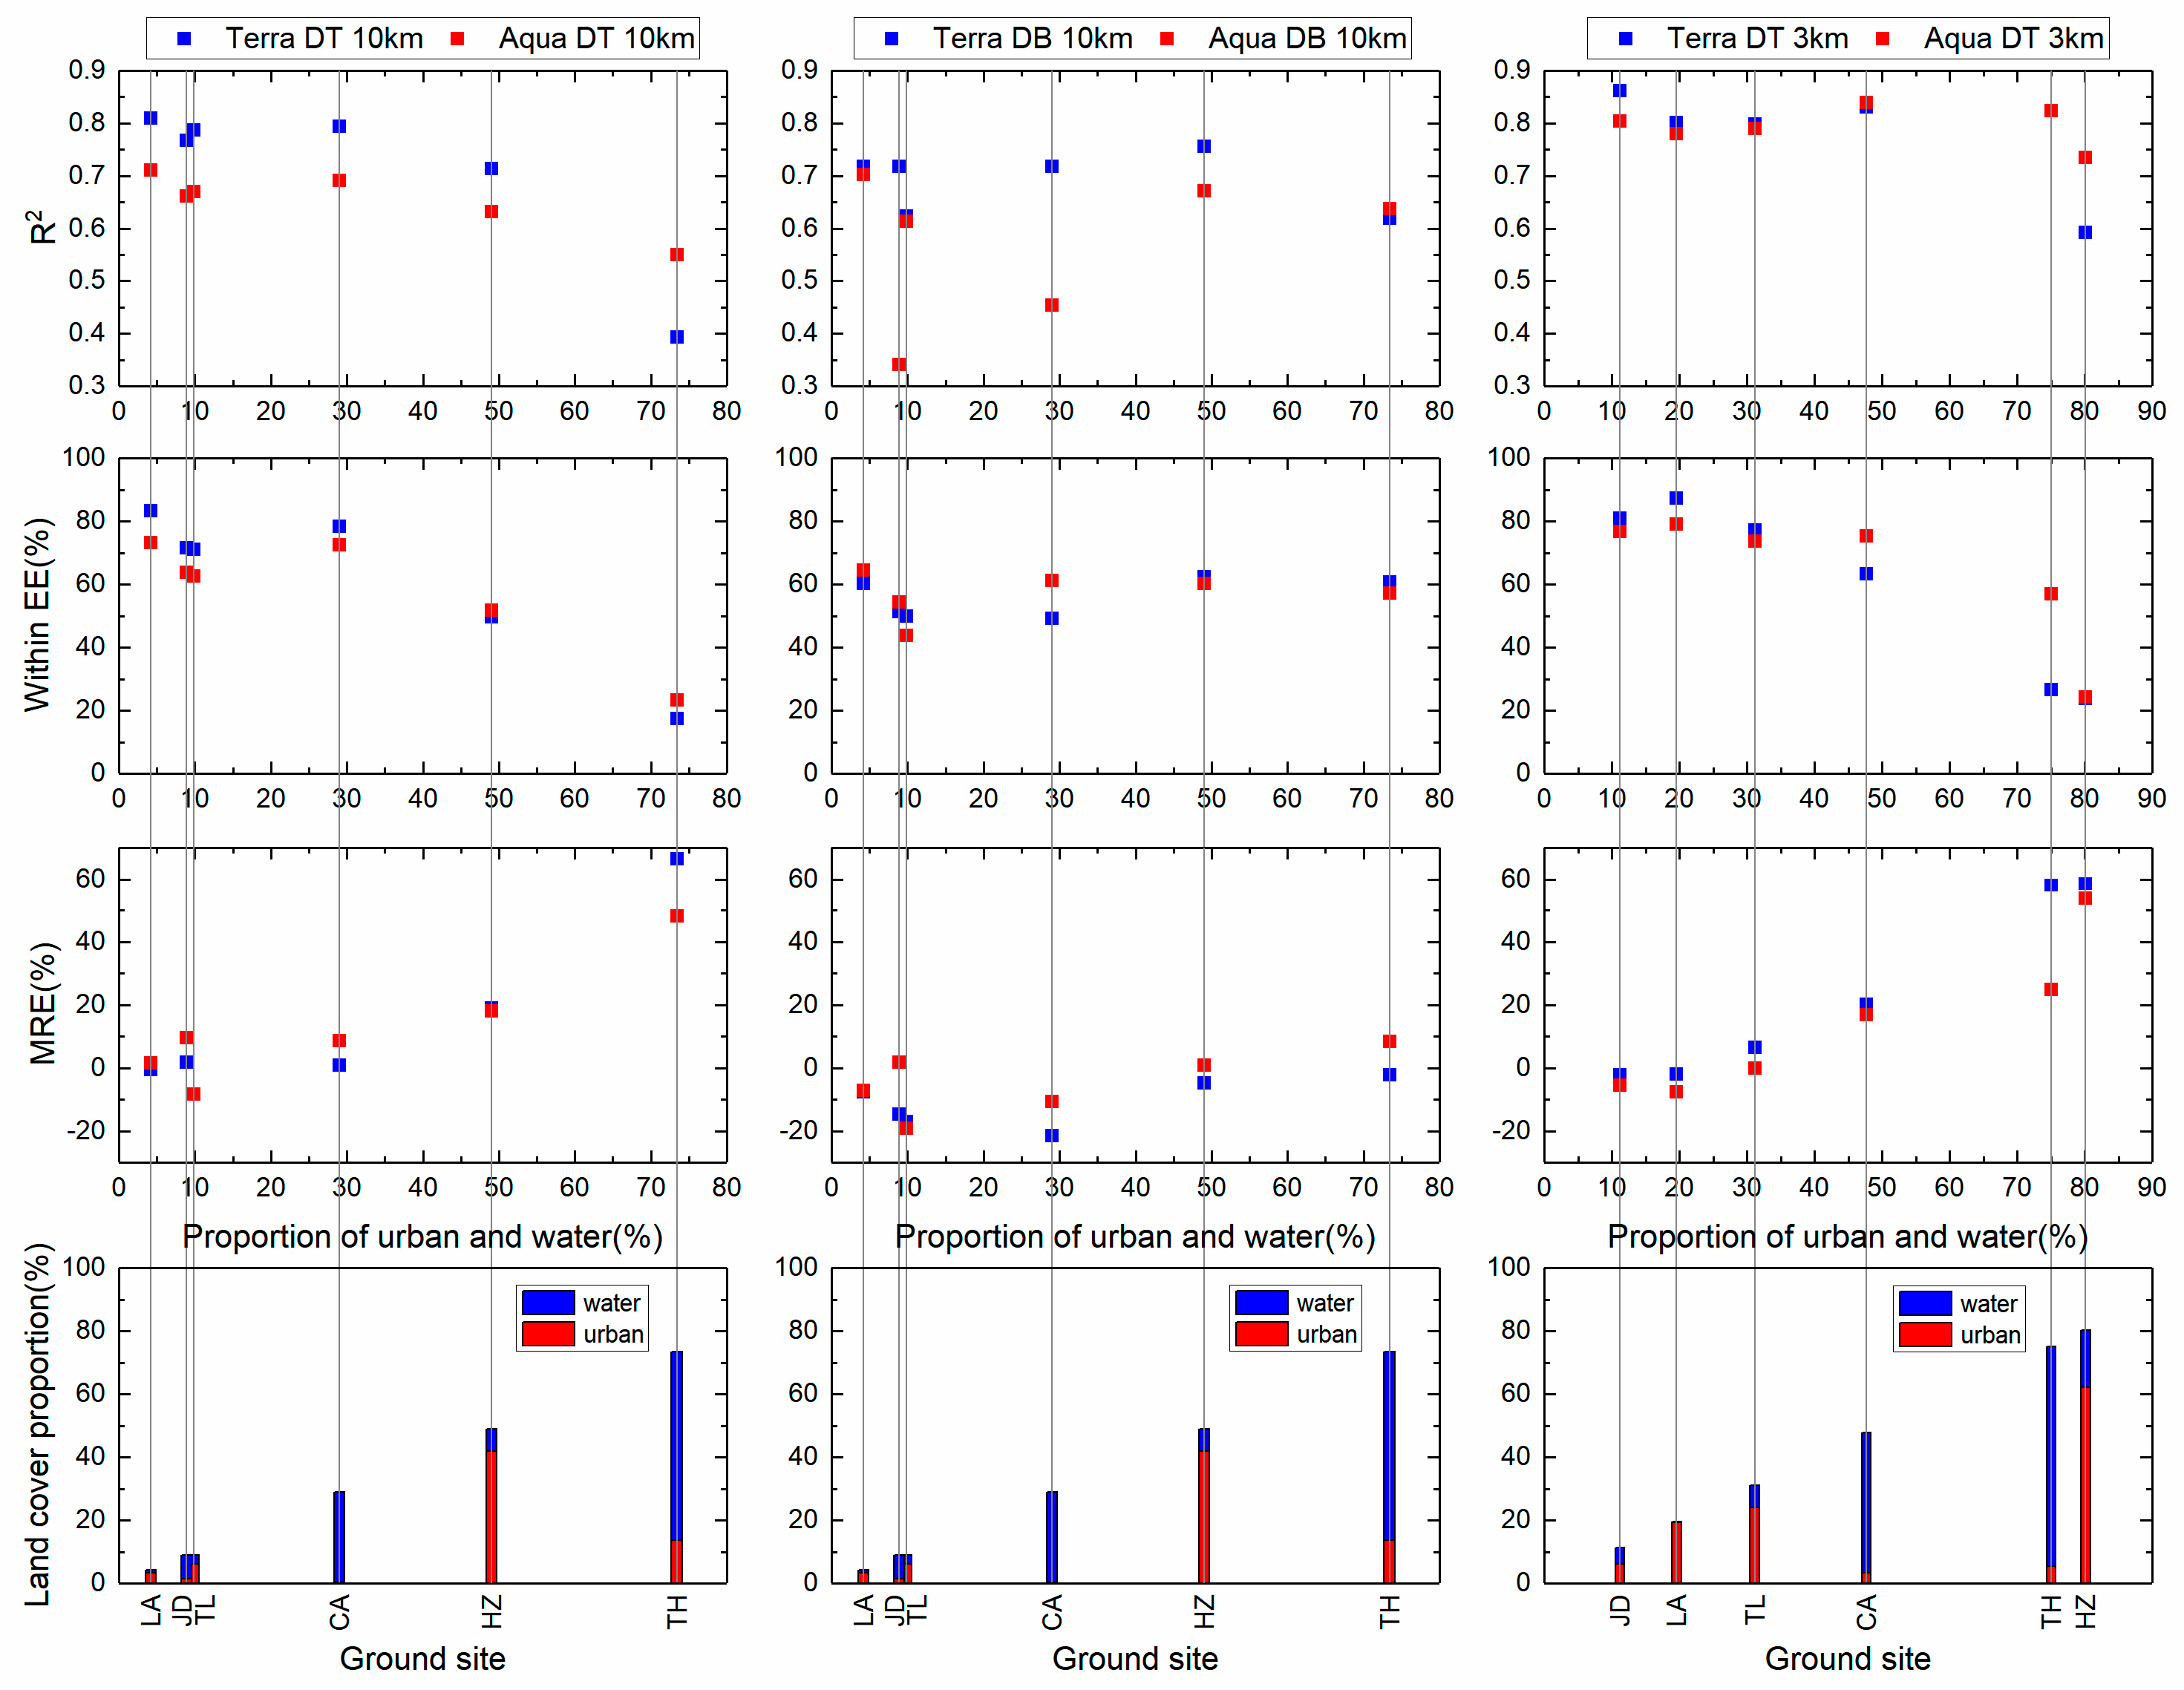
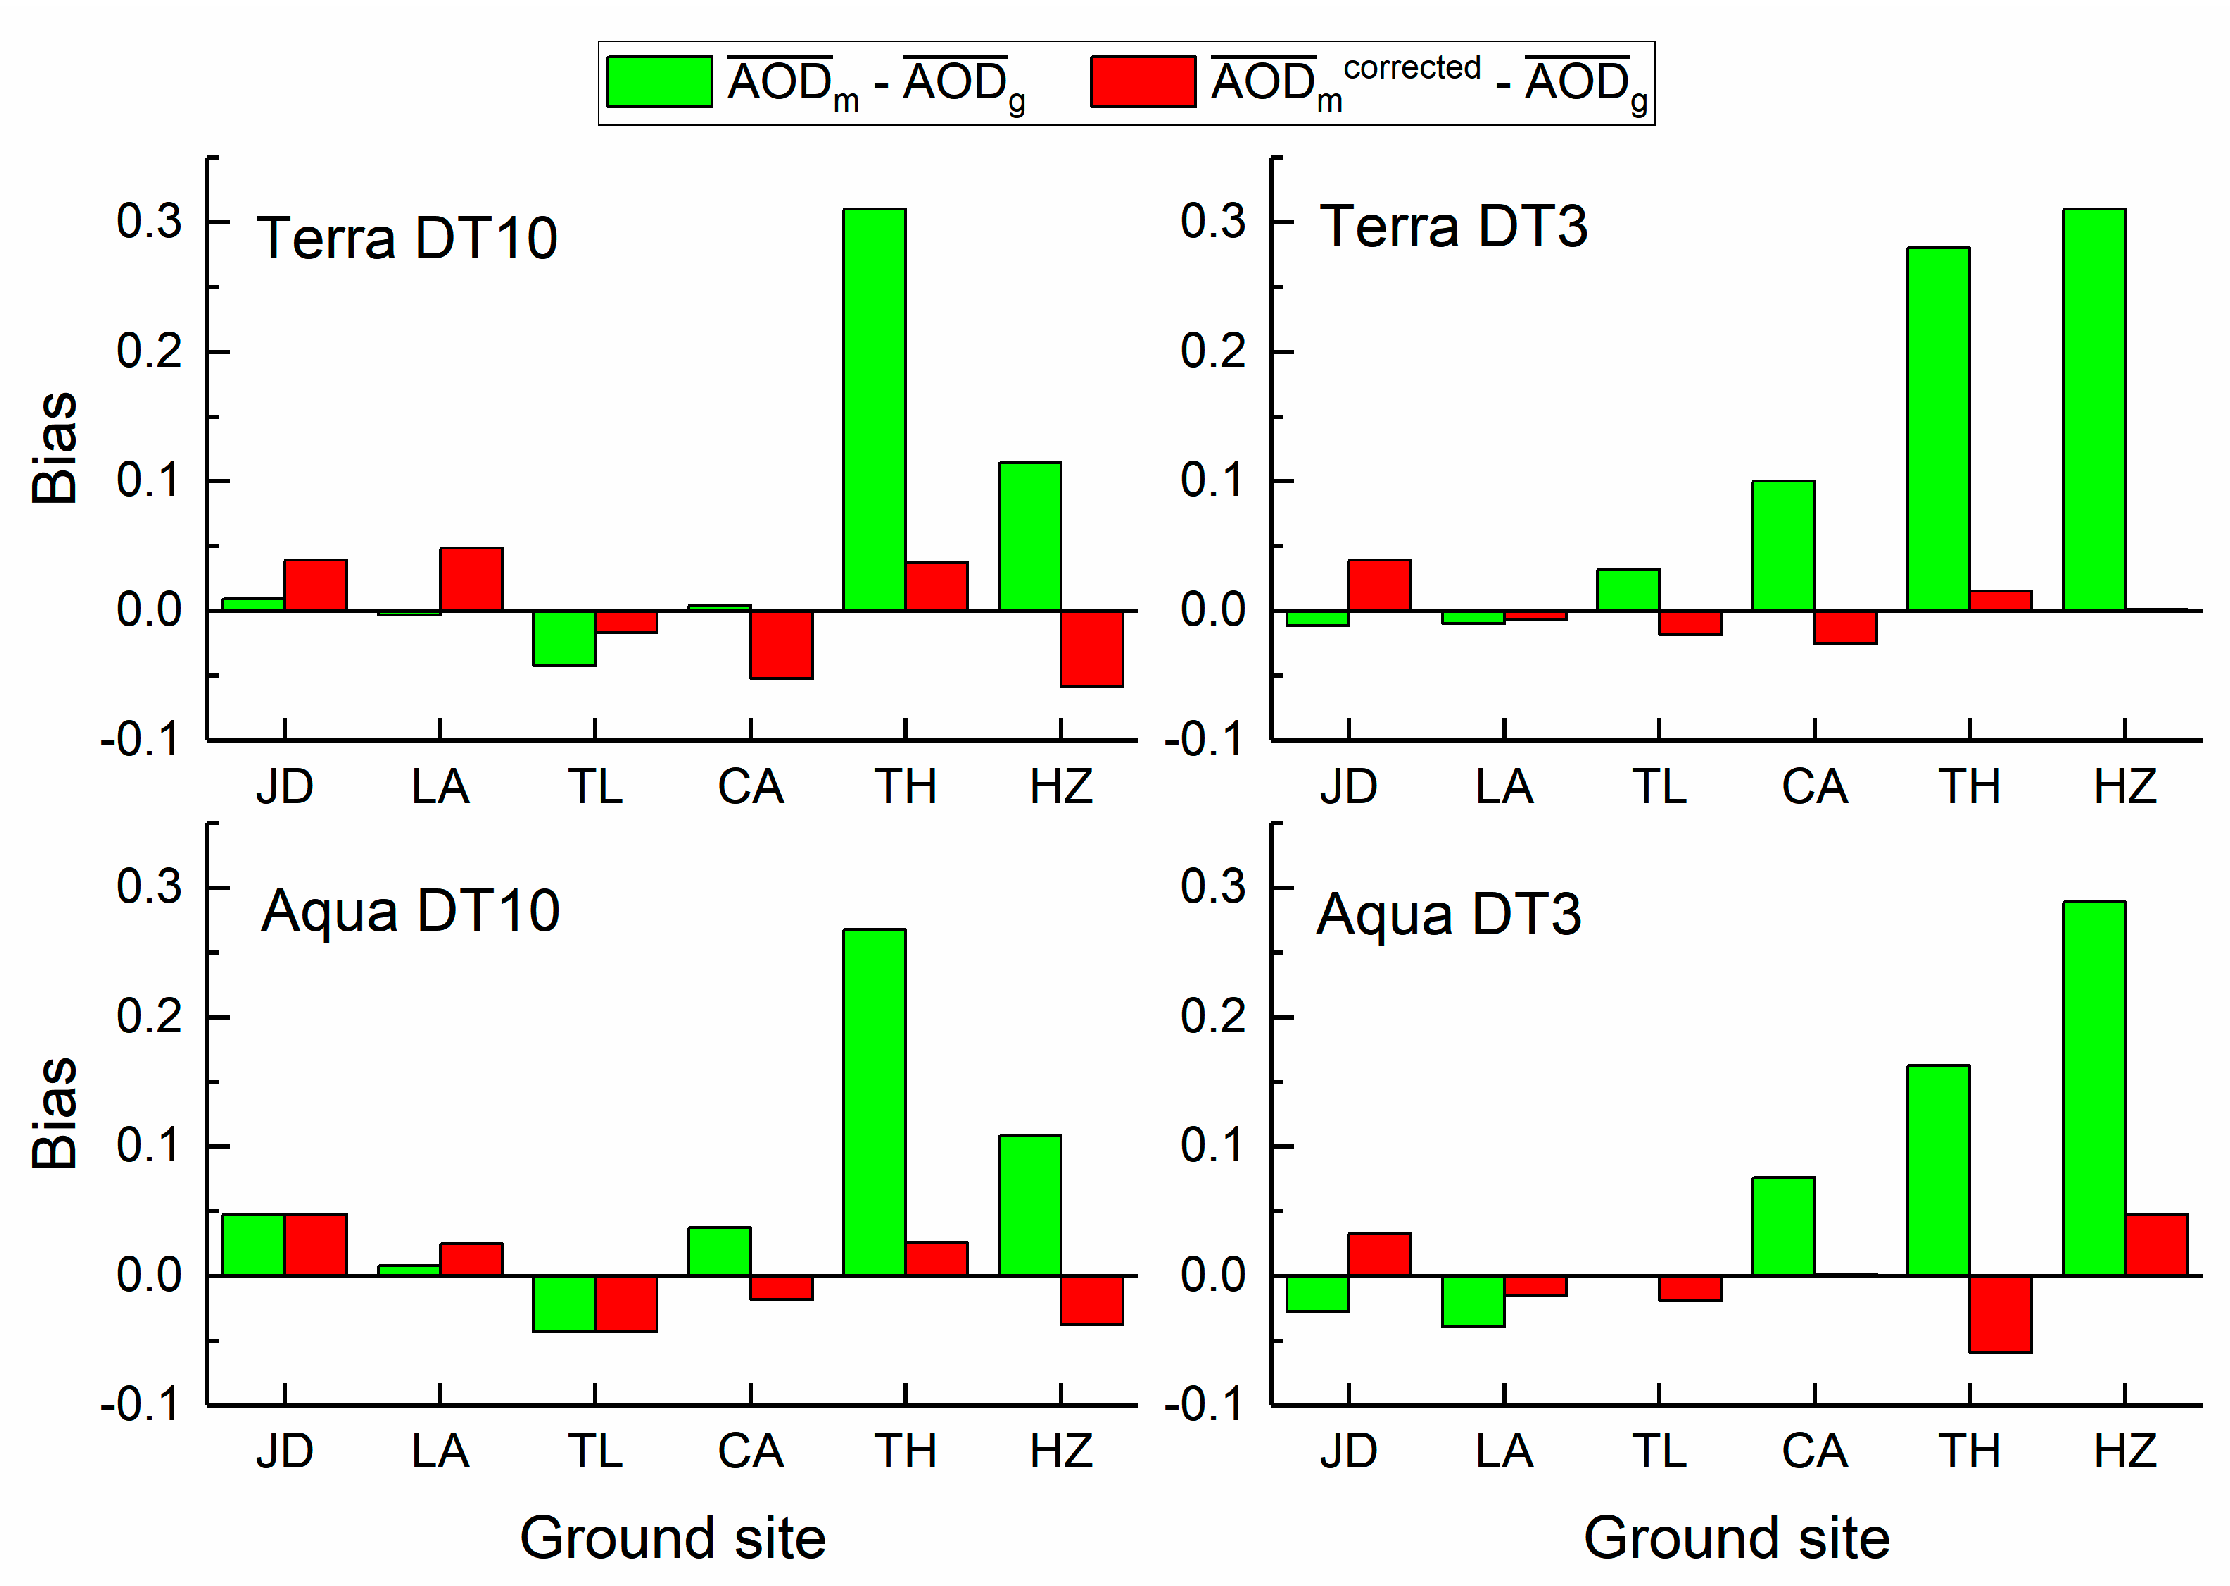
3.2. Correlations between Accuracy Levels and the Proportions of Water and Urban Areas

The accuracy measures (including R2, MRE, and percentage of data that fell within the EE (PWEE)) of the different MODIS AOD products are plotted against LCP_UW in Figure 7, and the corresponding correlations are listed in Table 2. Significant relationships between LCP_UW and R2 were only found in all DT10 AOD retrievals, indicating that the impact of LCP_UW on the correlations between MODIS AOD retrievals and ground measurements is limited. In contrast, the MRE of the Terra and Aqua DT AOD retrievals presents statistically significant relationships (i.e., R2 > 0.8, p < 0.05) with LCP_UW for both the 3 and 10 km resolution products. Pronounced correlations were also revealed between LCP_UW and PWEE, especially for products from MODIS Terra, where the R2 values reached 0.85 and 0.95 for the 10 and 3 km resolution data, respectively. None of the accuracy measures of the MODIS DB10 products were correlated with LCP_UW. The same correlation analysis was also conducted for land cover proportion of water (LCP_W) and land cover proportion of urbanized features (LCP_U) (see Tables S1 and S2). Apparently, the accuracy levels of the MODIS AOD products were less correlated with LCP_W/LCP_U than they were with LCP_UW, further highlighting the impacts of both water and urban coverage on the accuracy of the AOD retrieval algorithms.
The strong correlations between LCP_UW and MRE found in the DT AOD retrievals also make it possible to predict the MRE and thus correct the potential uncertainties of DT AOD based on the underlying land cover information. The corrections can be conducted as:
A O D m c o r r e c t e d = A O D m / ( 1 + M R E p r e d i c t )
where A O D m and A O D m c o r r e c t e d are the MODIS AOD and corrected MODIS AOD; M R E p r e d i c t is derived from the regression coefficients listed in the Table 3. The regression coefficients were calculated by linear regression between MRE and LCP_UW with a least square method.
A comparison of the bias of DT AOD retrievals before and after the correction over all the ground sites is shown in Figure 8. It is obvious that the bias of AOD products has been substantially reduced through the correction with Equation (10). Especially for the lakeside and urbanized sites (TH and HZ), the overestimations have been decreased from the range of 0.1~0.3 to the range of −0.05 to 0.05 when the correction method was applied. The biases of DT AOD retrievals over vegetated sites (LA, TL, CA and JD) are not changed obviously before and after correction. This is principally because original DT AOD retrievals tend to have relatively small bias over vegetated areas and the performance of the correction scheme is limited.
To further demonstrate the availability of the proposed correction method, we compared the validation results of DT AOD retrievals at TH site before and after correction during year 2012 (shown in Figure 9). The performance of DT AOD retrievals was significantly improved when the correction method was applied. For instance, the MREs have been decreased from the range of 27~39% to the range of −14 to −6%, the RMSEs for DT10 AOD have been decreased from 0.19~0.20 to 0.13~0.14, and the PWEEs have been increased from 29~43% to 67~73%. The comparison results demonstrate the effectiveness of the LCP_UW-based MRE prediction model in improving the accuracy levels of DT AOD retrievals over high LCP_UW areas.

3.3. Comparison of the Current Accuracy Levels with Previous Studies and Products

Considerable overestimations were found in the urbanized YRD site for the DT AOD retrievals, which is similar to the results of previous validations [22,51,52]. A total of 44.9% of the DT10 AOD retrievals estimated using MODIS Terra and 42.5% estimated using Aqua were above the EE, while these fractions were less than 20% for vegetated sites. The overestimation was significant for the DT3 AOD product at the HZ site, with 75.7% (Terra) and 75.8% (Aqua) of the AOD estimates falling above the EE. These results also agreed well with the results of pioneer studies, which recognized urban cover as a key factor that impacts the assumed relationships between the spectral reflectance of visible and SWIR bands, leading to reduced accuracies of MODIS DT AOD retrievals [38]. The same reason could also explain the lower uncertainties of the 10 km DT data than those of the 3 km data, where the coverage of artificial surface within the 3 × 3 pixel region is lower in the former (41.9%) than that in the latter (62.2%).
Former studies demonstrated that the PWEE values (EE: ±(0.05 + 20%)) of MODIS Collection 6 (C6) DT10 AOD products were 63% and 69% when validated using Asian and global AERONET datasets [7,23], respectively. As EE was generally determined under the normal distribution assumption when the EE envelope contained about 68% (approximately one standard deviation) of the match-ups [53], the C6 DT10 AOD’s uncertainty could be indicated by the EE defined in the paper. The PWEE values of C6.1 DT10 AOD were generally greater than 70% in the vegetated sites of YRD and less than 52% in the urbanized and lakeside sites of YRD, indicating that the uncertainties were overestimated in vegetated regions and underestimated in urbanized and lakeside regions under the current EE definition. In addition, the MODIS AOD C6.1 data used in the current study demonstrated noticeable improvements in the YRD when compared with the previous version of Collection 5 (C5) products. Specifically, validation by He et al. (2010) showed that the slopes of the linear fits between C5 DT AOD and concurrent AERONET measurements in this region ranged between 0.5 and 0.74, and C5 DT algorithm tended to overestimate the AOD in low aerosol loadings and underestimate the AOD in high aerosol loading conditions. Our results showed that the slopes of the C6.1 DT retrievals increased to ~0.9 for the 10 km product and ~1.0 for the 3 km AOD product, indicating that the systematic bias was effectively removed through the release of the new product.
As for the performance of the MODIS DB AOD products, when compared with large-scale validations, the PWEE values of the current regional study were generally ~56% for the observed sites, while global validations demonstrated higher PWEE values (EE: ±(0.05 + 20%)) of >72% [29]. This indicates that the uncertainties of DB AOD are overestimated globally and underestimated over the YRD region under the current EE definition. The PWEE of the DB products remained relatively stable given the rapid changes in land cover types among the six sites. Although the DB products showed slightly worse performance over vegetated sites than the DT products, the overestimation of the DB AOD product was significantly reduced over urbanized and lakeside sites, which is primarily due to the hybrid approach adopted in the DB algorithm [6,29]. The better retrievals by the DT algorithm over vegetated areas are likely linked with the use of more stable and effective spectral reflectance relationships between visible and SWIR bands than those utilized in the DB algorithm [6,7,30]. Similar to the validations with AERONET observations in China [22], India [44], and Africa [54], the DB algorithm tends to underestimate AOD over the YRD region. These problematic retrievals could either result from the overestimation of surface reflectance or the improper selection of aerosol models [40].
Another significant difference between the DT and DB AOD products is the number of match-ups. The total number of match-ups between the DT AOD retrievals and in situ measurements (DT10: n_Terra = 1896, n_Aqua = 1847; DT3: n_Terra = 1303, n_Aqua = 1165) was significantly lower than that for the DB retrievals (n_Terra = 2340, n_Aqua = 2324). Such remarkable improvements in data coverage tend to be associated with the updated C6.1 DB algorithm resulting in a rapid increase in the number of valid retrievals under certain interrupted conditions, such as minimal haze or thin clouds [6].

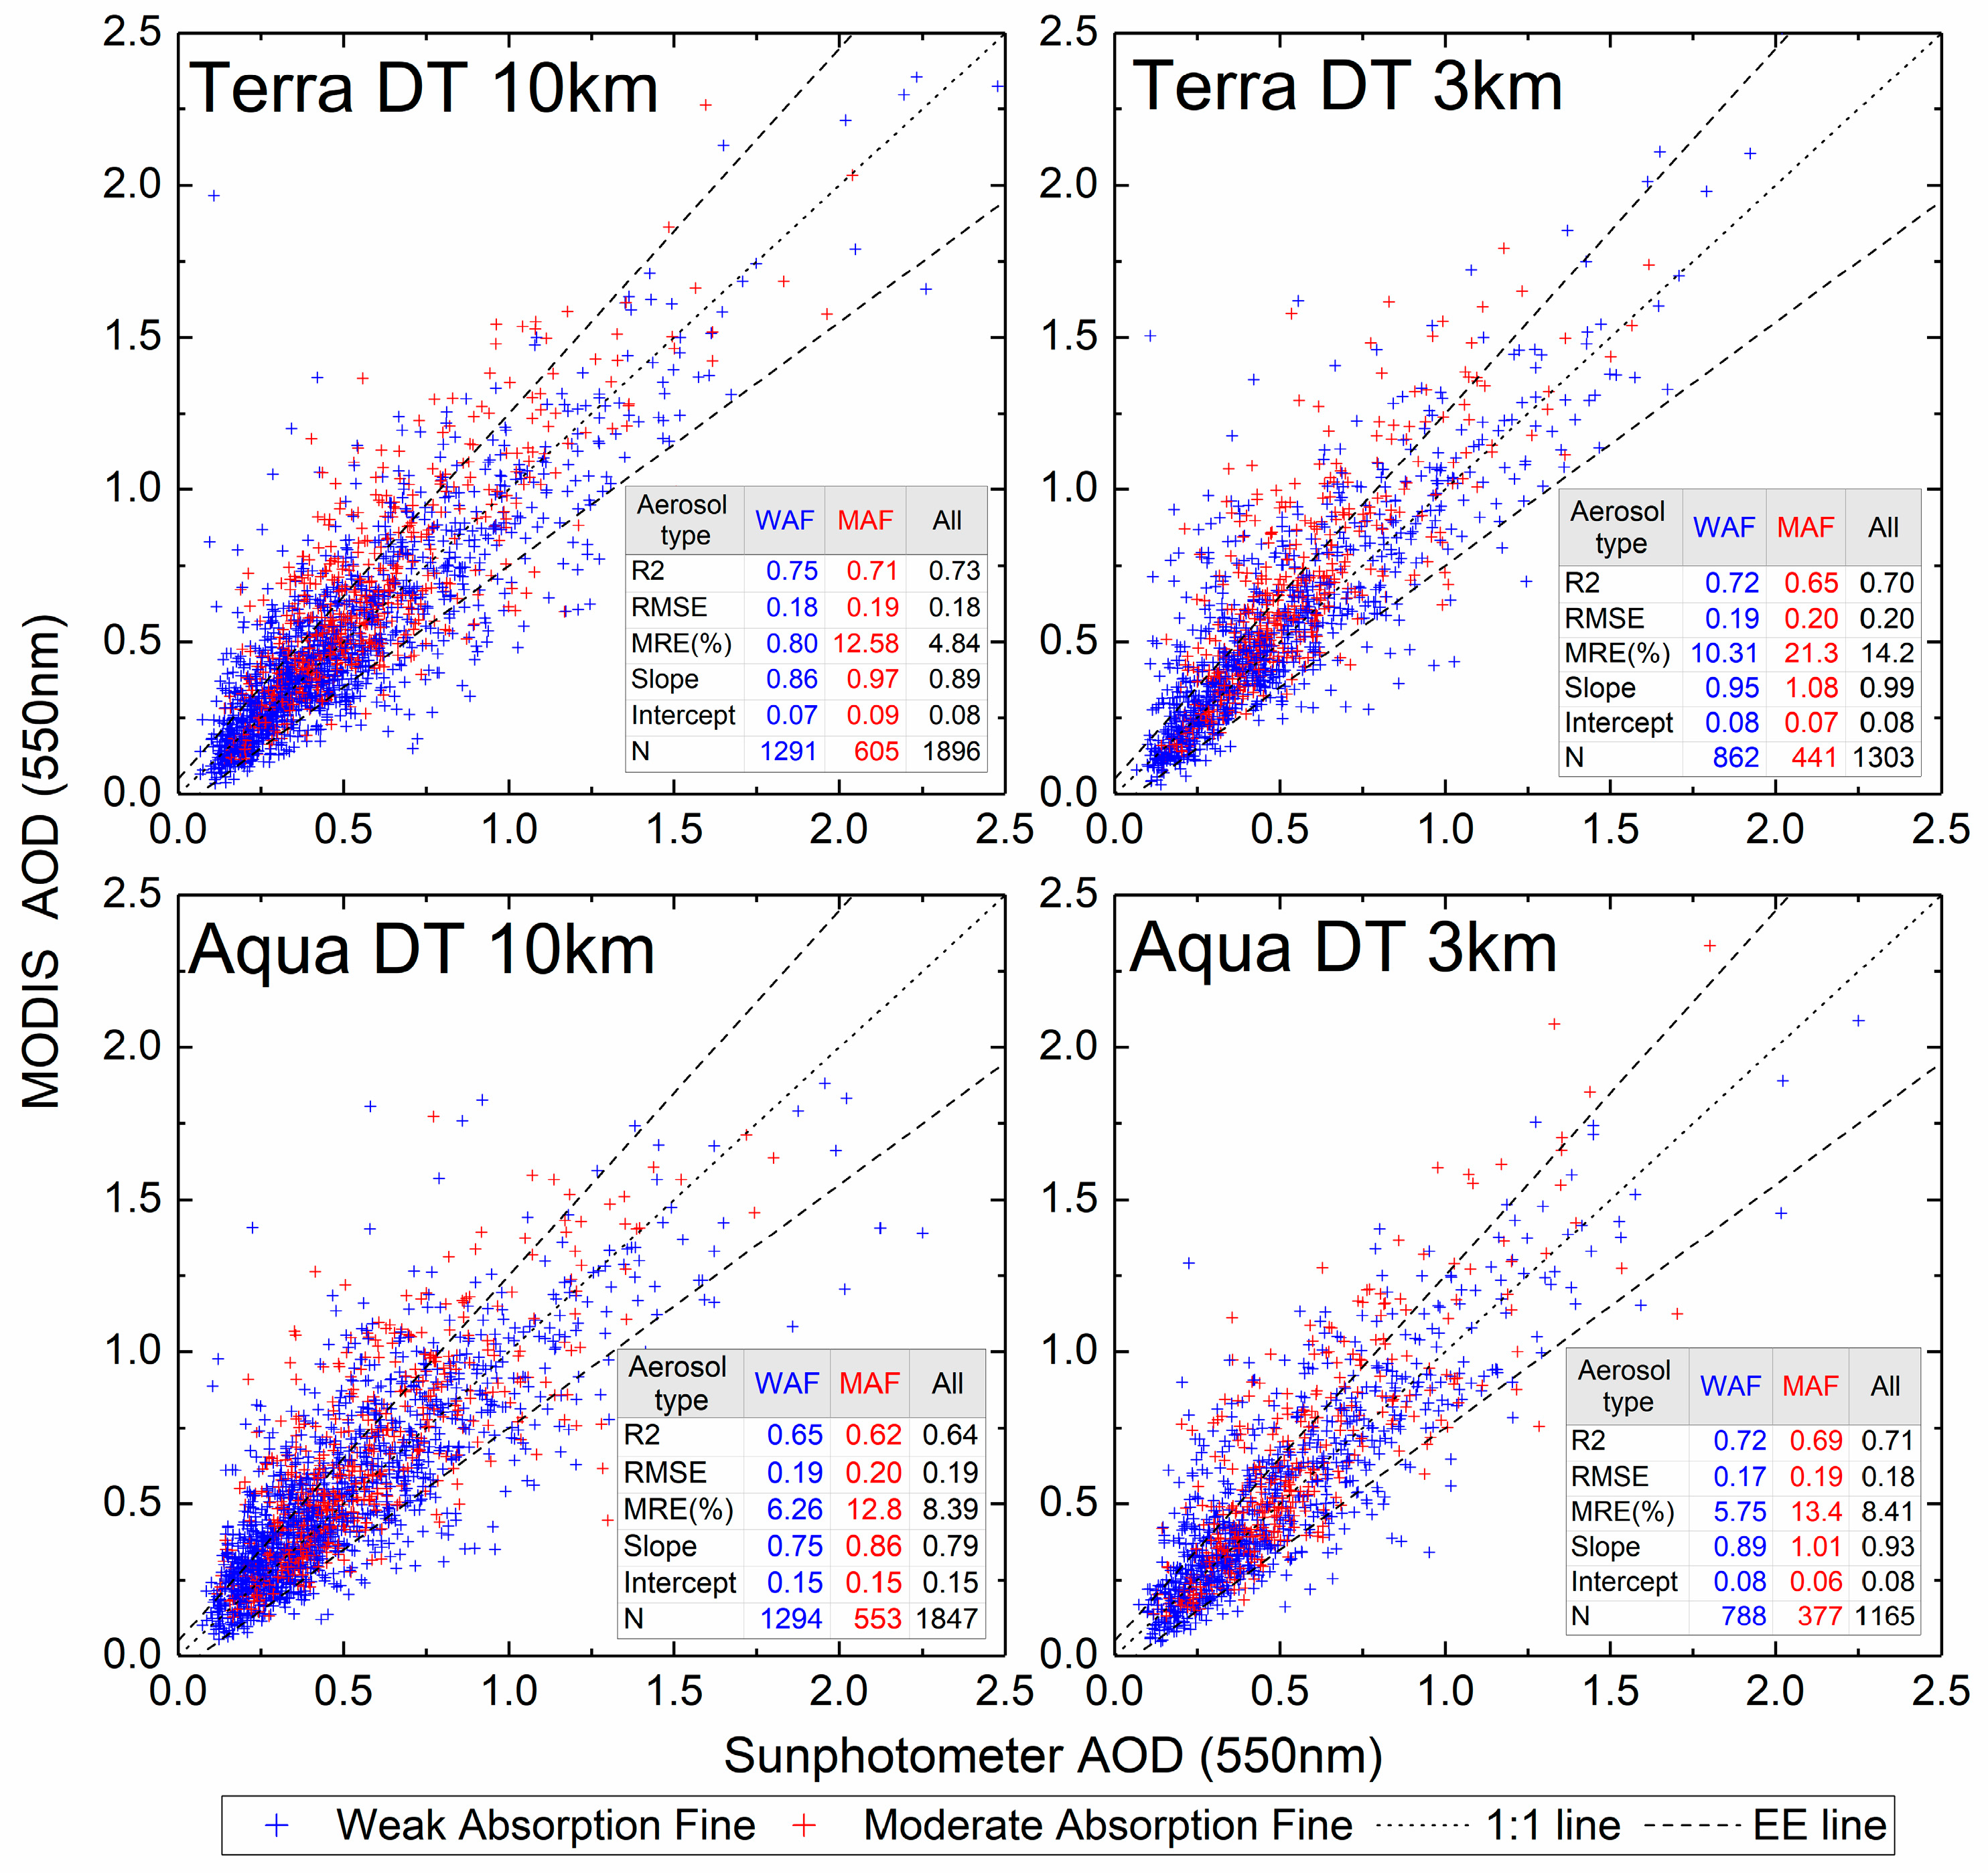
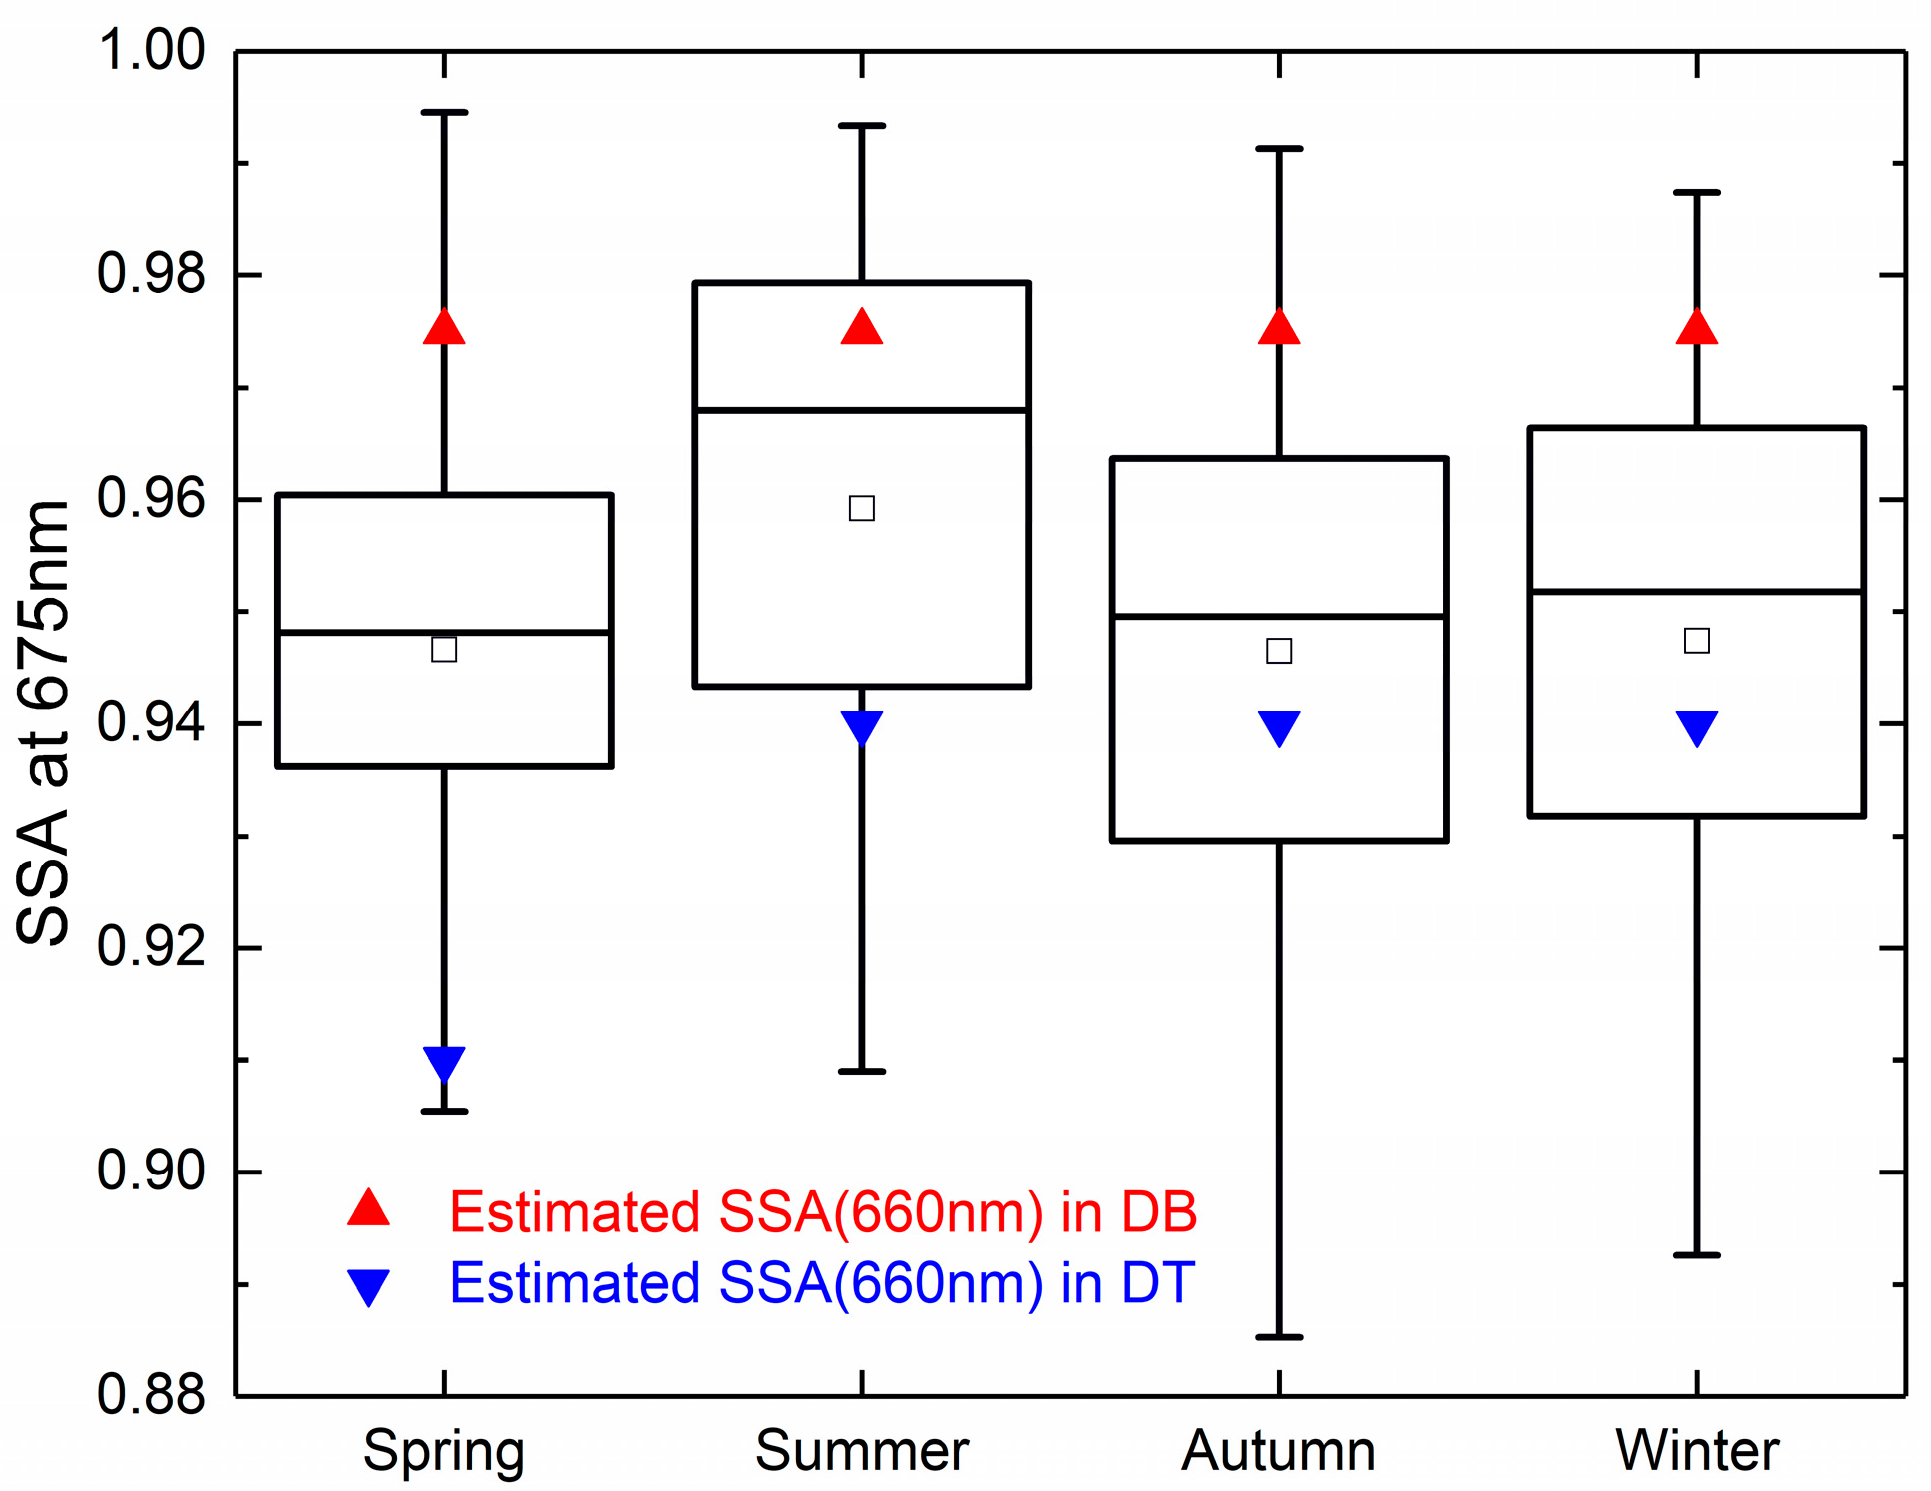
3.4. Impacts of Aerosol Types

To determine if the aerosol conditions were identical between the six ground sites, we compared the aerosol types over the ground sites for the DT3, DT10, and DB10 AOD products. Indeed, for any given time, the assumed aerosol types of the six ground sites were identical, indicating that the impact of aerosol type on the accuracy of MODIS AOD retrievals should be spatially uniform, minimizing the impacts of the changes in aerosol type on the relationships shown in Figure 7 and Table 2. Indeed, the aerosol type in the DB10 product remained stable (i.e., nonabsorbing urban/industrial model) for all ground sites throughout the study period. In contrast, seasonality of the aerosol type occurred for each site in the DT3 and DT10 products, with the moderate absorption fine (MAF) model dominating in the spring (March to May) and the weak absorption fine (WAF) model dominating in other seasons. To examine whether these seasonal changes in aerosol conditions could impact the relationships between the LCP_UW and the uncertainty levels of AOD products, we plotted the 10 km/3 km DT AOD against the sun photometer measurements under different aerosol types (Figure 10). However, the points from the two aerosol models (i.e., WAF and MAF) exhibited certain degrees of differences in statistical accuracy measures (i.e., R2, RMSE, slope) and could not be distinguished from each other, regardless of the AOD algorithm and resolution, suggesting that the seasonal changes in the aerosol model have limited impacts on the correlations between LCP_UW and the MODIS DT AOD uncertainties.
To further investigate the impact of aerosol type on the accuracies of the MODIS AOD retrievals, we compared the magnitudes of single-scattering albedo (SSA) between MODIS observations and AERONET measurements. SSA is a ratio between scattering and total extinction, ranging from 0 (purely absorbing aerosols) to 1 (purely scattering aerosols). Figure 11 shows the climatological seasonal SSA (675 nm) values derived from AERONET measurements at the TH site from 2005 to 2016. With mean SSA values of ~0.96 in the summer and ~0.95 in other seasons, the study region appeared to be dominated by nonabsorbing or weakly absorbing aerosols. Obviously, the SSA tends to be underestimated in the DT algorithm (especially in spring) and overestimated in the DB algorithm (see Figure 11), leading to the overestimation of DT AOD and underestimation of DB AOD [40]. Such comparison could also partially explain the systematic overestimation or underestimation of MODIS AOD retrievals, as shown in Figure 4, Figure 5 and Figure 6.

4. Conclusions

In the present study, we provide a comprehensive comparison between the C6.1 MODIS AOD retrievals and ground-based measurements from six neighboring sites (HZ, LA, TL, CA, JD, and TH) in the YRD region from 2013 to 2016. Overall, the accuracies of the MODIS DT10, DT3, and DB10 products in the study region were comparable to those of the global validation results [29,30]. A significant difference was found in the performance of MODIS AOD retrievals over ground sites with different land cover types. While the AOD products derived from the DT algorithm (both 3 and 10 km resolutions) agreed well with the ground measurements over vegetated sites (LA, TL, CA, and JD), overestimations were found over urbanized and lakeside sites (HZ and TH). In contrast, underestimations occurred with the DB AOD algorithm for all ground sites, and this method demonstrated similar performances in both vegetated and urbanized sites. The overestimation and underestimation patterns of the DT and DB algorithms were due to the systematic errors of the SSA calculation during the AOD retrieval process.
The most striking finding of this study is that the LCP_UW within a region appeared to be correlated with the uncertainty measures of the MODIS AOD products. For example, the MRE of the Terra DT10 and DT3 products demonstrated statistically significant relationships (i.e., R2 > 0.8, p < 0.05) with LCP_UW. These correlations would not have been found without two factors: (1) the relatively small distances between different ground sites, minimizing the impacts of changes in aerosol properties on the correlations, and (2) the significant differences in the land cover types surrounding the selected sites, with the LCP_UW ranging between 10 and 80%, making it possible to establish relationships between the accuracy measures.
This study demonstrated that the accuracies of satellite AOD estimates are not only associated with the coverage of urban areas but also modulated by the presence of water. Furthermore, we also showed that the performance of DT AOD retrievals over lakeside and urbanized areas could be significantly improved based on the relationship between MRE and LCP_UW. Future efforts are required to establish robust correlations between LCP_UW and uncertainty measures of AOD products at both regional and continental scales to correct the potential impacts from both urban and water areas.

Supplementary Materials

The following supporting information can be downloaded at: https://www.mdpi.com/article/10.3390/rs14040938/s1, Figure S1: Comparison of Aqua MODIS DT 10 km AOD with collocated ground measurements over the six ground sites: (a) HZ, (b) LA, (c) TL, (d) CA, (e) JD, and (f) TH; Figure S2: Same as Figure S1 but for Aqua MODIS DB 10 km AOD; Figure S3: Same as Figure S1 but for Aqua MODIS DT 3 km AOD; Table S1: Linear regression parameters between land cover proportion of urban and precision indicators of MODIS AOD retrievals; Table S2: Linear regression parameters between land cover proportion of water and precision indicators of MODIS AOD retrievals.

Author Contributions

Conceptualization, methodology, and writing—original draft, K.S.; investigation, Y.G.; resources, B.Q.; resources, Z.Y. All authors have read and agreed to the published version of the manuscript.

Funding

This research was funded by the National Nature Science Foundation of China (No. 42141015); Key Laboratory of Marine Ecological Conservation and Restoration, Ministry of Natural Resources/Fujian Provincial Key Laboratory of Marine Ecological Conservation and Restoration (No. EPR2021005); Agriculture and Social Development Research Project of Hangzhou (20201203B155); Key Project of Science and Technology Plan of Zhejiang Meteorological Bureau (2021ZD13); and Zhejiang Provincial Basic Public Welfare Research Project (LGF22D050004).

Institutional Review Board Statement

Not applicable.

Informed Consent Statement

Not applicable.

Data Availability Statement

MODIS AOD and in situ AOD data (TH site) used in the research can be publicly accessed from LAADS DAAC (https://ladsweb.modaps.eosdis.nasa.gov/search/, accessed on 10 June 2021) and AERONET (https://aeronet.gsfc.nasa.gov/, accessed on 21 October 2020). In situ AOD data from the other five sites are accessible from the corresponding author upon request.

Acknowledgments

The authors gratefully acknowledge the AERONET (PI: Ronghua Ma) and Hangzhou Meteorological Bureau (PI: Bing Qi) for the establishment and maintenance of the Taihu site and the other local ground sites used in this investigation.

Conflicts of Interest

The authors declare no conflict of interest.

References

  1. Haywood, J.; Boucher, O. Estimates of the direct and indirect radiative forcing due to tropospheric aerosols: A review. Rev. Geophys. 2000, 38, 513–543. [Google Scholar] [CrossRef]
  2. Kaufman, Y.J.; Tanré, D.; Boucher, O. A satellite view of aerosols in the climate system. Nature 2002, 419, 215–223. [Google Scholar] [CrossRef] [PubMed]
  3. Gupta, P.; Christopher, S.A.; Wang, J.; Gehrig, R.; Lee, Y.; Kumar, N. Satellite remote sensing of particulate matter and air quality assessment over global cities. Atmos. Environ. 2006, 40, 5880–5892. [Google Scholar] [CrossRef]
  4. West, J.J.; Cohen, A.; Dentener, F.; Brunekreef, B.; Zhu, T.; Armstrong, B.; Bell, M.L.; Brauer, M.; Carmichael, G.; Costa, D.L.; et al. What We Breathe Impacts Our Health: Improving Understanding of the Link between Air Pollution and Health. Environ. Sci. Technol. 2016, 50, 4895–4904. [Google Scholar] [CrossRef] [PubMed]
  5. IPCC. Climate Change 2013—The Physical Science Basis: Working Group I Contribution to the Fifth Assessment Report of the Intergovernmental Panel on Climate Change; Cambridge University Press: Cambridge, UK, 2014. [Google Scholar]
  6. Hsu, N.C.; Jeong, M.J.; Bettenhausen, C.; Sayer, A.M.; Hansell, R.A.; Seftor, C.S.; Huang, J.; Tsay, S.C. Enhanced Deep Blue aerosol retrieval algorithm: The second generation. J. Geophys. Res. 2013, 118, 9296–9315. [Google Scholar] [CrossRef]
  7. Levy, R.C.; Mattoo, S.; Munchak, L.A.; Remer, L.A.; Sayer, A.M.; Patadia, F.; Hsu, N.C. The Collection 6 MODIS aerosol products over land and ocean. Atmos. Meas. Tech. 2013, 6, 2989–3034. [Google Scholar] [CrossRef] [Green Version]
  8. Jackson, J.M.; Liu, H.; Laszlo, I.; Kondragunta, S.; Remer, L.A.; Huang, J.; Huang, H. Suomi-NPP VIIRS aerosol algorithms and data products. J. Geophys. Res. 2013, 118, 12673–12689. [Google Scholar] [CrossRef]
  9. Kahn, R.A.; Gaitley, B.J.; Garay, M.J.; Diner, D.J.; Eck, T.F.; Smirnov, A.; Holben, B.N. Multiangle Imaging SpectroRadiometer global aerosol product assessment by comparison with the Aerosol Robotic Network. J. Geophys. Res. 2010, 115, D23209. [Google Scholar] [CrossRef]
  10. Hsu, N.C.; Lee, J.; Sayer, A.M.; Carletta, N.; Chen, S.H.; Tucker, C.J.; Holben, B.N.; Tsay, S.C. Retrieving near-global aerosol loading over land and ocean from AVHRR. J. Geophys. Res. Atmos. 2017, 122, 9968–9989. [Google Scholar] [CrossRef] [Green Version]
  11. Liang, S.; Fallah Adl, H.; Kalluri, S.; JáJá, J.; Kaufman, Y.J.; Townshend, J.R.G. An operational atmospheric correction algorithm for Landsat Thematic Mapper imagery over the land. J. Geophys. Res. Atmos. 1997, 102, 17173–17186. [Google Scholar] [CrossRef]
  12. Santer, R.; Carrere, V.; Dubuisson, P.; Roger, J.C. Atmospheric correction over land for MERIS. Int. J. Remote Sens. 1999, 20, 1819–1840. [Google Scholar] [CrossRef]
  13. Holben, B.N.; Vermote, E.F.; Kaufman, Y.J.; Tanre, D.; Kalb, V.L. Aerosol retrieval over land from AVHRR data-application for atmospheric correction. IEEE Trans. Geosci. Remote Sens. 1992, 30, 212–222. [Google Scholar] [CrossRef]
  14. Sun, K.; Chen, X. Spatio-temporal distribution of localized aerosol loading in China: A satellite view. Atmos. Environ. 2017, 163, 35–43. [Google Scholar] [CrossRef]
  15. Remer, L.A.; Kleidman, R.; Levy, R.C.; Kaufman, Y.J.; Tanre, D.; Mattoo, S.; Martins, J.V.; Ichoku, C.; Koren, I.; Yu, H. Global aerosol climatology from the MODIS satellite sensors. J. Geophys. Res. 2008, 113, D14S07. [Google Scholar] [CrossRef] [Green Version]
  16. Kang, N.; Kumar, K.R.; Hu, K.; Yu, X.; Yin, Y. Long-term (2002–2014) evolution and trend in Collection 5.1 Level-2 aerosol products derived from the MODIS and MISR sensors over the Chinese Yangtze River Delta. Atmos. Res. 2016, 181, 29–43. [Google Scholar] [CrossRef]
  17. Sun, K.; Chen, X.; Zhu, Z.; Zhang, T. High Resolution Aerosol Optical Depth Retrieval Using Gaofen-1 WFV Camera Data. Remote Sens. 2017, 9, 89. [Google Scholar] [CrossRef] [Green Version]
  18. Sun, K.; Chen, X.; Wang, J.; Zhang, T.; Zhu, Z. Investigation of air quality over the largest city in central China using high resolution satellite derived aerosol optical depth data. Atmos. Pollut. Res. 2018, 9, 584–593. [Google Scholar] [CrossRef] [Green Version]
  19. Hu, X.; Belle, J.H.; Meng, X.; Wildani, A.; Waller, L.A.; Strickland, M.J.; Liu, Y. Estimating PM2.5 Concentrations in the Conterminous United States Using the Random Forest Approach. Environ. Sci. Technol. 2017, 51, 6936. [Google Scholar] [CrossRef]
  20. Van Donkelaar, A.; Martin, R.V.; Park, R.J. Estimating ground-level PM2.5 using aerosol optical depth determined from satellite remote sensing. J. Geophys. Res. 2006, 111, D21201. [Google Scholar] [CrossRef]
  21. Chu, D.A.; Kaufman, Y.J.; Ichoku, C.; Remer, L.A.; Tanre, D.; Holben, B.N. Validation of MODIS aerosol optical depth retrieval over land. Geophys. Res. Lett. 2002, 29, MOD2-1–MOD2-4. [Google Scholar] [CrossRef] [Green Version]
  22. Tao, M.; Chen, L.; Wang, Z.; Tao, J.; Che, H.; Wang, X.; Wang, Y. Comparison and evaluation of the MODIS Collection 6 aerosol data in China. J. Geophys. Res. 2015, 120, 6992–7005. [Google Scholar] [CrossRef]
  23. Nichol, J.; Bilal, M. Validation of MODIS 3 km Resolution Aerosol Optical Depth Retrievals Over Asia. Remote Sens. 2016, 8, 328. [Google Scholar] [CrossRef] [Green Version]
  24. He, Q.; Li, C.; Tang, X.; Li, H.; Geng, F.; Wu, Y. Validation of MODIS derived aerosol optical depth over the Yangtze River Delta in China. Remote Sens. Environ. 2010, 114, 1649–1661. [Google Scholar] [CrossRef]
  25. Xie, Y.; Zhang, Y.; Xiong, X.; Qu, J.J.; Che, H. Validation of MODIS aerosol optical depth product over China using CARSNET measurements. Atmos. Environ. 2011, 45, 5970–5978. [Google Scholar] [CrossRef]
  26. Martins, V.S.; Lyapustin, A.; de Carvalho, L.A.S.; Barbosa, C.C.F.; Novo, E.M.L.M. Validation of high-resolution MAIAC aerosol product over South America. J. Geophys. Res. Atmos. 2017, 122, 7537–7559. [Google Scholar] [CrossRef]
  27. Bilal, M.; Nazeer, M.; Qiu, Z.; Ding, X.; Wei, J. Global Validation of MODIS C6 and C6.1 Merged Aerosol Products over Diverse Vegetated Surfaces. Remote Sens. 2018, 10, 475. [Google Scholar] [CrossRef] [Green Version]
  28. Zhang, J.; Xin, J.; Zhang, W.; Wang, S.; Wang, L.; Xie, W.; Xiao, G.; Pan, H.; Kong, L. Validation of MODIS C6 AOD products retrieved by the Dark Target method in the Beijing–Tianjin–Hebei urban agglomeration, China. Adv. Atmos. Sci. 2017, 34, 993–1002. [Google Scholar] [CrossRef]
  29. Sayer, A.M.; Hsu, N.C.; Bettenhausen, C.; Jeong, M.J. Validation and uncertainty estimates for MODIS Collection 6 “Deep Blue” aerosol data. J. Geophys. Res. 2013, 118, 7864–7872. [Google Scholar] [CrossRef] [Green Version]
  30. Remer, L.A.; Mattoo, S.; Levy, R.C.; Munchak, L.A. MODIS 3 km aerosol product: Algorithm and global perspective. Atmos. Meas. Tech. 2013, 6, 1829–1844. [Google Scholar] [CrossRef] [Green Version]
  31. Gupta, P.; Remer, L.A.; Levy, R.C.; Mattoo, S. Validation of MODIS 3 km land aerosol optical depth from NASA’s EOS Terra and Aqua missions. Atmos. Meas. Tech. 2018, 11, 3145–3159. [Google Scholar] [CrossRef] [Green Version]
  32. Goldberg, D.L.; Gupta, P.; Wang, K.; Jena, C.; Zhang, Y.; Lu, Z.; Streets, D.G. Using gap-filled MAIAC AOD and WRF-Chem to estimate daily PM2.5 concentrations at 1 km resolution in the Eastern United States. Atmos. Environ. 2019, 199, 443–452. [Google Scholar] [CrossRef]
  33. Xiao, Q.; Wang, Y.; Chang, H.H.; Meng, X.; Geng, G.; Lyapustin, A.; Liu, Y. Full-coverage high-resolution daily PM2.5 estimation using MAIAC AOD in the Yangtze River Delta of China. Remote Sens. Environ. 2017, 199, 437–446. [Google Scholar] [CrossRef]
  34. Lyapustin, A.; Wang, Y.; Korkin, S.; Huang, D. MODIS Collection 6 MAIAC algorithm. Atmos. Meas. Tech. 2018, 11, 5741–5765. [Google Scholar] [CrossRef] [Green Version]
  35. Tao, M.; Wang, J.; Li, R.; Wang, L.; Wang, L.; Wang, Z.; Tao, J.; Che, H.; Chen, L. Performance of MODIS high-resolution MAIAC aerosol algorithm in China: Characterization and limitation. Atmos. Environ. 2019, 213, 159–169. [Google Scholar] [CrossRef]
  36. Chen, X.; Ding, J.; Liu, J.; Wang, J.; Ge, X.; Wang, R.; Zuo, H. Validation and comparison of high-resolution MAIAC aerosol products over Central Asia. Atmos. Environ. 2021, 251, 118273. [Google Scholar] [CrossRef]
  37. Qin, W.; Fang, H.; Wang, L.; Wei, J.; Zhang, M.; Su, X.; Bilal, M.; Liang, X. MODIS high-resolution MAIAC aerosol product: Global validation and analysis. Atmos. Environ. 2021, 264, 118684. [Google Scholar] [CrossRef]
  38. Gupta, P.; Levy, R.C.; Mattoo, S.; Remer, L.A.; Munchak, L.A. A surface reflectance scheme for retrieving aerosol optical depth over urban surfaces in MODIS Dark Target retrieval algorithm. Atmos. Meas. Tech. 2016, 9, 3293–3308. [Google Scholar] [CrossRef] [Green Version]
  39. Kaufman, Y.J.; Sendra, C. Algorithm for automatic atmospheric corrections to visible and near-IR satellite imagery. Int. J. Remote Sens. 1988, 9, 1357–1381. [Google Scholar] [CrossRef]
  40. Sayer, A.M.; Munchak, L.; Hsu, N.C.; Levy, R.C.; Bettenhausen, C.; Jeong, M. MODIS Collection 6 aerosol products: Comparison between Aqua’s e-Deep Blue, Dark Target, and “merged” data sets, and usage recommendations. J. Geophys. Res. 2014, 119, 13965–13989. [Google Scholar] [CrossRef]
  41. Guo, J.-P.; Zhang, X.-Y.; Wu, Y.-R.; Zhaxi, Y.; Che, H.-Z.; La, B.; Wang, W.; Li, X.-W. Spatio-temporal variation trends of satellite-based aerosol optical depth in China during 1980–2008. Atmos. Environ. 2011, 45, 6802–6811. [Google Scholar] [CrossRef]
  42. Mehta, M.; Singh, R.; Singh, A.; Singh, N.; Anshumali. Recent global aerosol optical depth variations and trends—A comparative study using MODIS and MISR level 3 datasets. Remote Sens. Environ. 2016, 181, 137–150. [Google Scholar] [CrossRef]
  43. Gupta, P.; Khan, M.; Silva, A.D.; Patadia, F. MODIS aerosol optical depth observations over urban areas in Pakistan: Quantity and quality of the data for air quality monitoring. Atmos. Pollut. Res. 2013, 4, 43–52. [Google Scholar] [CrossRef] [Green Version]
  44. Mhawish, A.; Banerjee, T.; Broday, D.M.; Misra, A.; Tripathi, S.N. Evaluation of MODIS Collection 6 aerosol retrieval algorithms over Indo-Gangetic Plain: Implications of aerosols types and mass loading. Remote Sens. Environ. 2017, 201, 297–313. [Google Scholar] [CrossRef]
  45. Tao, M.; Wang, Z.; Tao, J.; Chen, L.; Wang, J.; Hou, C.; Wang, L.; Xu, X.; Zhu, H. How Do Aerosol Properties Affect the Temporal Variation of MODIS AOD Bias in Eastern China. Remote Sens. 2017, 9, 800. [Google Scholar] [CrossRef] [Green Version]
  46. Li, L.; Chen, C.H.; Fu, J.S.; Huang, C.; Streets, D.G.; Huang, H.Y.; Zhang, G.F.; Wang, Y.; Jang, C.; Wang, H.L. Air quality and emissions in the Yangtze River Delta, China. Atmos. Chem. Phys. 2010, 11, 1621–1639. [Google Scholar] [CrossRef] [Green Version]
  47. Holben, B.N.; Eck, T.F.; Slutsker, I.; Tanre, D.; Buis, J.P.; Setzer, A.; Vermote, E.F.; Reagan, J.A.; Kaufman, Y.J.; Nakajima, T. AERONET-a federated instrument network and data archive for aerosol Characterization. Remote Sens. Environ. 1998, 66, 1–16. [Google Scholar] [CrossRef]
  48. Smirnov, A.; Holben, B.N.; Eck, T.F.; Dubovik, O.; Slutsker, I. Cloud-Screening and Quality Control Algorithms for the AERONET Database. Remote Sens. Environ. 2000, 73, 337–349. [Google Scholar] [CrossRef]
  49. Chen, J.; Chen, J.; Liao, A.; Cao, X.; Chen, L.; Chen, X.; He, C.; Han, G.; Peng, S.; Lu, M. Global land cover mapping at 30 m resolution: A POK-based operational approach. ISPRS J. Photogramm. Remote Sens. 2015, 103, 7–27. [Google Scholar] [CrossRef] [Green Version]
  50. Levy, R.; Remer, L.A.; Mattoo, S.; Vermote, E.F.; Kaufman, Y.J. Second-generation operational algorithm: Retrieval of aerosol properties over land from inversion of Moderate Resolution Imaging Spectroradiometer spectral reflectance. J. Geophys. Res. 2007, 112, D13211. [Google Scholar] [CrossRef] [Green Version]
  51. Oo, M.M.; Jerg, M.; Hernandez, E.; Picon, A.; Gross, B.M.; Moshary, F.; Ahmed, S.A. Improved MODIS aerosol retrieval using modified VIS/SWIR surface albedo ratio over urban scenes. Geosci. Remote Sens. IEEE Trans. 2010, 48, 983–1000. [Google Scholar] [CrossRef]
  52. Munchak, L.A.; Levy, R.C.; Mattoo, S.; Remer, L.A.; Holben, B.N.; Schafer, J.S.; Hostetler, C.A.; Ferrare, R.A. MODIS 3 km aerosol product: Applications over land in an urban/suburban region. Atmos. Meas. Tech. 2013, 6, 1747–1759. [Google Scholar] [CrossRef] [Green Version]
  53. Popp, T.; De Leeuw, G.; Bingen, C.; Brühl, C.; Capelle, V.; Chedin, A.; Clarisse, L.; Dubovik, O.; Grainger, R.; Griesfeller, J.; et al. Development, Production and Evaluation of Aerosol Climate Data Records from European Satellite Observations (Aerosol_cci). Remote Sens. 2016, 8, 421. [Google Scholar] [CrossRef] [Green Version]
  54. Boiyo, R.; Kumar, K.R.; Zhao, T. Statistical intercomparison and validation of multisensory aerosol optical depth retrievals over three AERONET sites in Kenya, East Africa. Atmos. Res. 2017, 197, 277–288. [Google Scholar] [CrossRef]
Figure 1. Geolocation of the six ground observation sites. The background map is the annual mean AOD from MOD04_3K data during 2014. The six ground observation sites are Hangzhou (HZ), Linan (LA), Tonglu (TL), Chunan (CA), Jiande (JD), and Taihu (TH), and they are all marked using two black boxes at sizes of 9 km × 9 km and 30 km × 30 km centered over the ground site, corresponding to sampling windows of 3 × 3 pixels for MODIS AOD products at spatial resolutions of 3 and 10 km.
Remotesensing 14 00938 g001
Figure 2. AOD frequency distribution derived from ground measurements over six ground observation sites.
Remotesensing 14 00938 g002
Figure 3. Land cover information during 2010 for the six ground observation sites. The pie charts on the second and third row of the graph correspond to the land cover proportions of the regions marked with red and green boxes in the Google Earth maps on the first row.
Remotesensing 14 00938 g003
Figure 4. Comparison of Terra MODIS DT10 with collocated ground measurements over the six ground sites: (a) HZ, (b) LA, (c) TL, (d) CA, (e) JD, and (f) TH. The fitting lines were calculated by linear regression with least square method.
Remotesensing 14 00938 g004
Figure 5. Same as Figure 4 but for Terra MODIS DB10. Subplots (af) represent validation results over the six ground sites: (a) HZ, (b) LA, (c) TL, (d) CA, (e) JD, and (f) TH.
Remotesensing 14 00938 g005
Figure 6. Same as Figure 4 but for Terra MODIS DT3. Subplots (af) represent validation results over the six ground sites: (a) HZ, (b) LA, (c) TL, (d) CA, (e) JD, and (f) TH.
Remotesensing 14 00938 g006
Figure 7. The change in the accuracy of MODIS AOD retrievals indicated by R2, within EE (%), and MRE (%) with the change in the land cover proportions of urbanized features and water over all ground sites.
Remotesensing 14 00938 g007
Figure 8. Comparison of the mean bias between DT AOD retrievals and ground measurements before ( A O D m ¯ A O D g ¯ ) and after correction ( A O D m c o r r e c t e d ¯ A O D g ¯ ).   A O D g ¯ , A O D m ¯ , and A O D m c o r r e c t e d ¯ are the mean ground-measured AOD, mean MODIS AOD, and corrected mean MODIS AOD, respectively.
Remotesensing 14 00938 g008
Figure 9. Comparison of MODIS DT10 and DT3 with collocated ground measurements at TH site before correction and after correction during 2012. The abbreviations BC and AC in the figure represent before correction and after correction, respectively.
Remotesensing 14 00938 g009
Figure 10. Comparison of MODIS DT10 and DT3 AOD with collocated ground measurements under different aerosol conditions. WAF and MAF represent weak absorption fine and moderate absorption fine aerosol types, respectively.
Remotesensing 14 00938 g010
Figure 11. Boxplot of seasonal single-scattering albedo (SSA) derived from AERONET measurements at the TH site. The SSA values estimated by the DT and DB algorithms are also marked in the graph. Spring (March, April, and May); summer (June, July, and August); autumn (September, October, and November); winter (December, January, and February).
Remotesensing 14 00938 g011
Table 1. Summarized information for the ground observation sites.
SiteLat/LonInstrumentPeriodNumber of Days with Available AOD Average AOD at 550 nm (Mean ± Std)
HZ30°14′ N/120°10′ ECE-3182013~20167110.67 ± 0.14
LA30°13′ N/119°42′ ECE-3182013~20167260.61 ± 0.11
TL29°49′ N/119°41′ ECE-3182013~20166910.59 ± 0.12
CA29°37′ N/119°01′ ECE-3182013~20166750.51 ± 0.09
JD29°29′ N/119°16′ ECE-3182013~20166650.56 ± 0.10
TH31°25′ N/120°13′ EAERONET2013~20163160.58 ± 0.17
Note: the average AOD for each site was calculated from ground measurements.
Table 2. Correlations between the land cover proportions of urban areas and water and the accuracy measures of MODIS AOD retrievals.
Regression ParametersDT10DT3DB10
TerraAquaTerraAquaTerraAqua
LCP_UW vs. R2Slope−0.005 *−0.002 *−0.006000.001
R20.76 *0.78 *0.630.030.050.08
LCP_UW vs. PWEE (%)Slope−0.82 *−0.59 *−0.95 *−0.62 *0.120.06
R20.85 *0.77 *0.95 *0.69 *0.280.04
LCP_UW vs. MRE (%)Slope0.92 *0.64 *0.97 *0.76 *0.170.24
R20.84 *0.84 *0.97 *0.87 *0.360.44
LCP_UW represents land cover proportions of urbanized features and water; the slopes and R2 values marked with * indicate a significant linear regression relationship (significance level p < 0.05); slopes with p < 0.05 and R2 values larger than 0.5 are shown in bold.
Table 3. MRE prediction model parameters for DT10 and DT3 AOD retrievals.
MODIS AOD ProductRegression CoefficientR2RMSESignificance Level
Terra DT10MREpredict = 0.92 × LCP_UW − 13.370.8412.3p = 0.01
Aqua DT10MREpredict = 0.64 × LCP_UW − 5.70.848.8p = 0.01
Terra DT3MREpredict = 0.97 × LCP_UW − 19.760.975.7p = 0.0004
Aqua DT3MREpredict = 0.76 × LCP_UW − 19.870.879.6p = 0.007
Publisher’s Note: MDPI stays neutral with regard to jurisdictional claims in published maps and institutional affiliations.

