Abstract
Typhoons are known for causing heavy precipitation, very strong winds, and storm surges. With climate change, the occurrence, strength, and duration of typhoons are changing. Daily, weekly, and monthly precipitation from in situ stations from the NOAA Global Historical Climatological Network (GHCN) were compared in the Western North Pacific from 2000 to 2018 against two widely used datasets: NASA’s TRMM TMPA and PERSIANN-CDR. Additionally, precipitation levels during twenty-five typhoons were compared using precipitation estimates. There have been reductions in the average number of typhoons per year from 1959 to present and by month during the months of August, September, and October. Satellite-derived precipitation estimates from PERSIANN and TRMM TMPA explained approximately 50% of the variation in weekly cumulative precipitation and approximately 72% of the variation in monthly cumulative precipitation during the study period (March 2000–December 2018) when using all available stations. When analysis was completed using only stations close to the best track for the entire duration of a typhoon, 62% of the variation was explained, which is comparable to the weekly and monthly cumulative comparisons. However, most of the stations available and with sufficient data were not located in the tracks of the typhoons. It is of utmost importance to better understand typhoon events by utilizing precipitation data from satellite remote sensing in the Western North Pacific.
1. Introduction
Precipitation is one of the most widely studied phenomena worldwide because of the role it plays in the productivity of aquatic and terrestrial environments [1]), food production and security [2], and the climate [3]. The desire to understand the variability of precipitation across time and space dates back to the fourth century in India [4]. Since that time, there have been studies to measure and predict precipitation across the globe using rain gauges [5], modeling [6], and remote sensors [7,8,9] The technological advancements in the observation of precipitation have evolved from simple bucket-like rain gauges to sophisticated satellite sensors [10]. Rainfall data are collected in the most rural and rugged terrains without in situ rain gauges due to the development of remote sensing and predictive precipitation using state-of-the-art models, with most of these data accessible via the Internet. Furthermore, with the development of satellite remote sensors and precipitation models, there now exist numerous estimates (described later) of precipitation [9,11]. These estimates vary in availability, accessibility, and accuracy. While some precipitation estimates have been shown to be more accurate over land, others are more accurate over water [12]. Some are more accurate at daily time scales while others are more accurate at monthly time scales [13]. As a result, the appropriateness of these estimates for the accurate representation of precipitation over a specified area and duration is called into question. For satellite remote sensing precipitation estimates, accuracy generally implies being comparable and equivalent to measurements from in situ rain gauges [11,13,14] based on an accumulation period and spatial spacing of the gauges. However, there is a known discrepancy between in situ measurements and remotely sensed precipitation estimates [11], as a rain gauge is a point measure of rainfall and satellite sensors averaged over a certain region in space. In addition, comparing remotely sensed satellite estimates to in situ measurements in areas that do not currently have any or very few in situ rain gauges presents a challenge. Measurements of precipitation by rain gauges can vary spatially and temporally due to the type of measurement, drop size, and intensity [15]. Furthermore, during extreme weather events such as tropical cyclones, in situ rain gauges can be affected by high wind [16] and storm surges [17], which impact the accuracy. Additionally, precipitation estimates from satellite products have known limitations, including underestimation in mountainous or complex terrain [18]; the differing cloud types (depending on the type of methods used, i.e., IR vs. VIS/IR), which influence the brightness temperature; precipitation from convective versus non-convective systems; and infrequent sampling [19].
Our approach to better understand typhoons and the precipitation associated with them was to first investigate how the number of typhoons has changed over time and then to estimate the precipitation during several of these typhoon events. Daily precipitation estimates were compared during typhoon events in the Western North Pacific from 2000 to 2018 using NASA’s Tropical Rainfall Measuring Mission (TRMM TMPA), Multi-Satellite Precipitation Analysis (TMPA), and Precipitation Estimation from Remotely Sensed Information using Artificial Neural Networks–Climate Data Records (PERSIANN-CDR). There have been many studies conducted to investigate these specific precipitation products, and some studies have used similar products to study specific typhoons. For example, in a 2014 study [20], daily precipitation estimates from PERSIANN Cloud Classification System (CCS) were mapped to track the precipitation for the 2014 Typhoon Haiyan. Both Lanfont et~al., 2004 [21] and Feng and Shu 2018 [22] utilized TRMM TMPA precipitation to better understand precipitation patterns for tropical cyclones. Lonfat et~al., 2004 used TRMM TMPA precipitation estimates for precipitation patterns for 260 tropical cyclones worldwide. They used satellite precipitation to improve quantitative precipitation forecasts (QPF), as estimating absolute precipitation is very difficult. Additionally, Guzman and Jiang [23] used both TRMM TMPA and NASA’s Global Precipitation Measurement (GPM) to understand how precipitation during TCs have changed from 1998 to 2016. They were able to show that precipitation during TCs have increased across all the TC-prone basins, especially within the Western North Pacific (NWP), using only precipitation from satellite estimates.
However, there have been only a few studies conducted comparing different satellite remote sensing precipitation products across several typhoon events. Typhoons are known for causing heavy precipitation, very strong winds, and storm surges. These lead to flooding, heavy run-off, and landslides, which often result in water contamination, heavy sedimentation, and collapse of buildings and other man-made structures. With climate change, the occurrence, strength, and duration of typhoons is changing, and it is generally acknowledged that typhoons are becoming stronger [24,25].
Our approach is focusing on the NWP to investigate precipitation across several typhoon events using the PERSIANN-CDR, TRMM TMPA, and I -situ gauges. There are several reasons that we chose to use these products for this study:
PERSIANN-CDR:
- Long data records—Provides daily precipitation data from 1983 to the present;
- Large spatial coverage—Quasi-global (60°S–60°N; 180°W–180°E) spatial coverage and 0.25° × 0.25° spatial resolution;
- Proven use in variety of environments—Used for estimating precipitation around the world in varied topographical areas, complex terrains, and over oceans;
- Tested across years—Widely used (more than 2000 publications) and easily accessible to the public;
- Verification and validation—It has been corrected using an in situ gauge network.
TRMM TMPA:
- 10+ year record—Provides daily precipitation data from 1998 to 2019;
- Large spatial coverage—Quasi-global (50°S to 50°N; 180°W to 180°E) spatial coverage and 0.25° × 0.25° spatial resolution;
- Proven use in a variety of environments and for tropical cyclones—Used for estimating precipitation around the world in varied topographical areas, complex terrain, and over oceans;
- Tested across years—Widely used (more than 160 publications since 2007) and easily accessible to the public;
- Verification and validation—It has been corrected using an in situ gauge network at the monthly scale.
There were two main objectives of this study: (1) to determine whether typhoon occurrence in the NWP has changed over time; (2) to determine which precipitation product, namely PERSIANN, TRMM TMPA, or in situ gage data, should be used to estimate precipitation during typhoons in the NWP. Since in situ rain gage data are generally accepted as accurate, the satellite-based precipitation products were compared to these data. To determine which precipitation product should be used, we conducted a comparison of remotely sensed precipitation with in situ precipitation results to provide a general understanding of how well the satellite products estimated in situ rainfall for gauges located within the best track areas. The results allowed us to understand how well satellite products estimate in situ precipitation in general across the entire study period (2000–2018). By completing this analysis, we can better understand how well satellite precipitation observations really compares during “normal” conditions and extreme (typhoon) conditions.
2. Methods
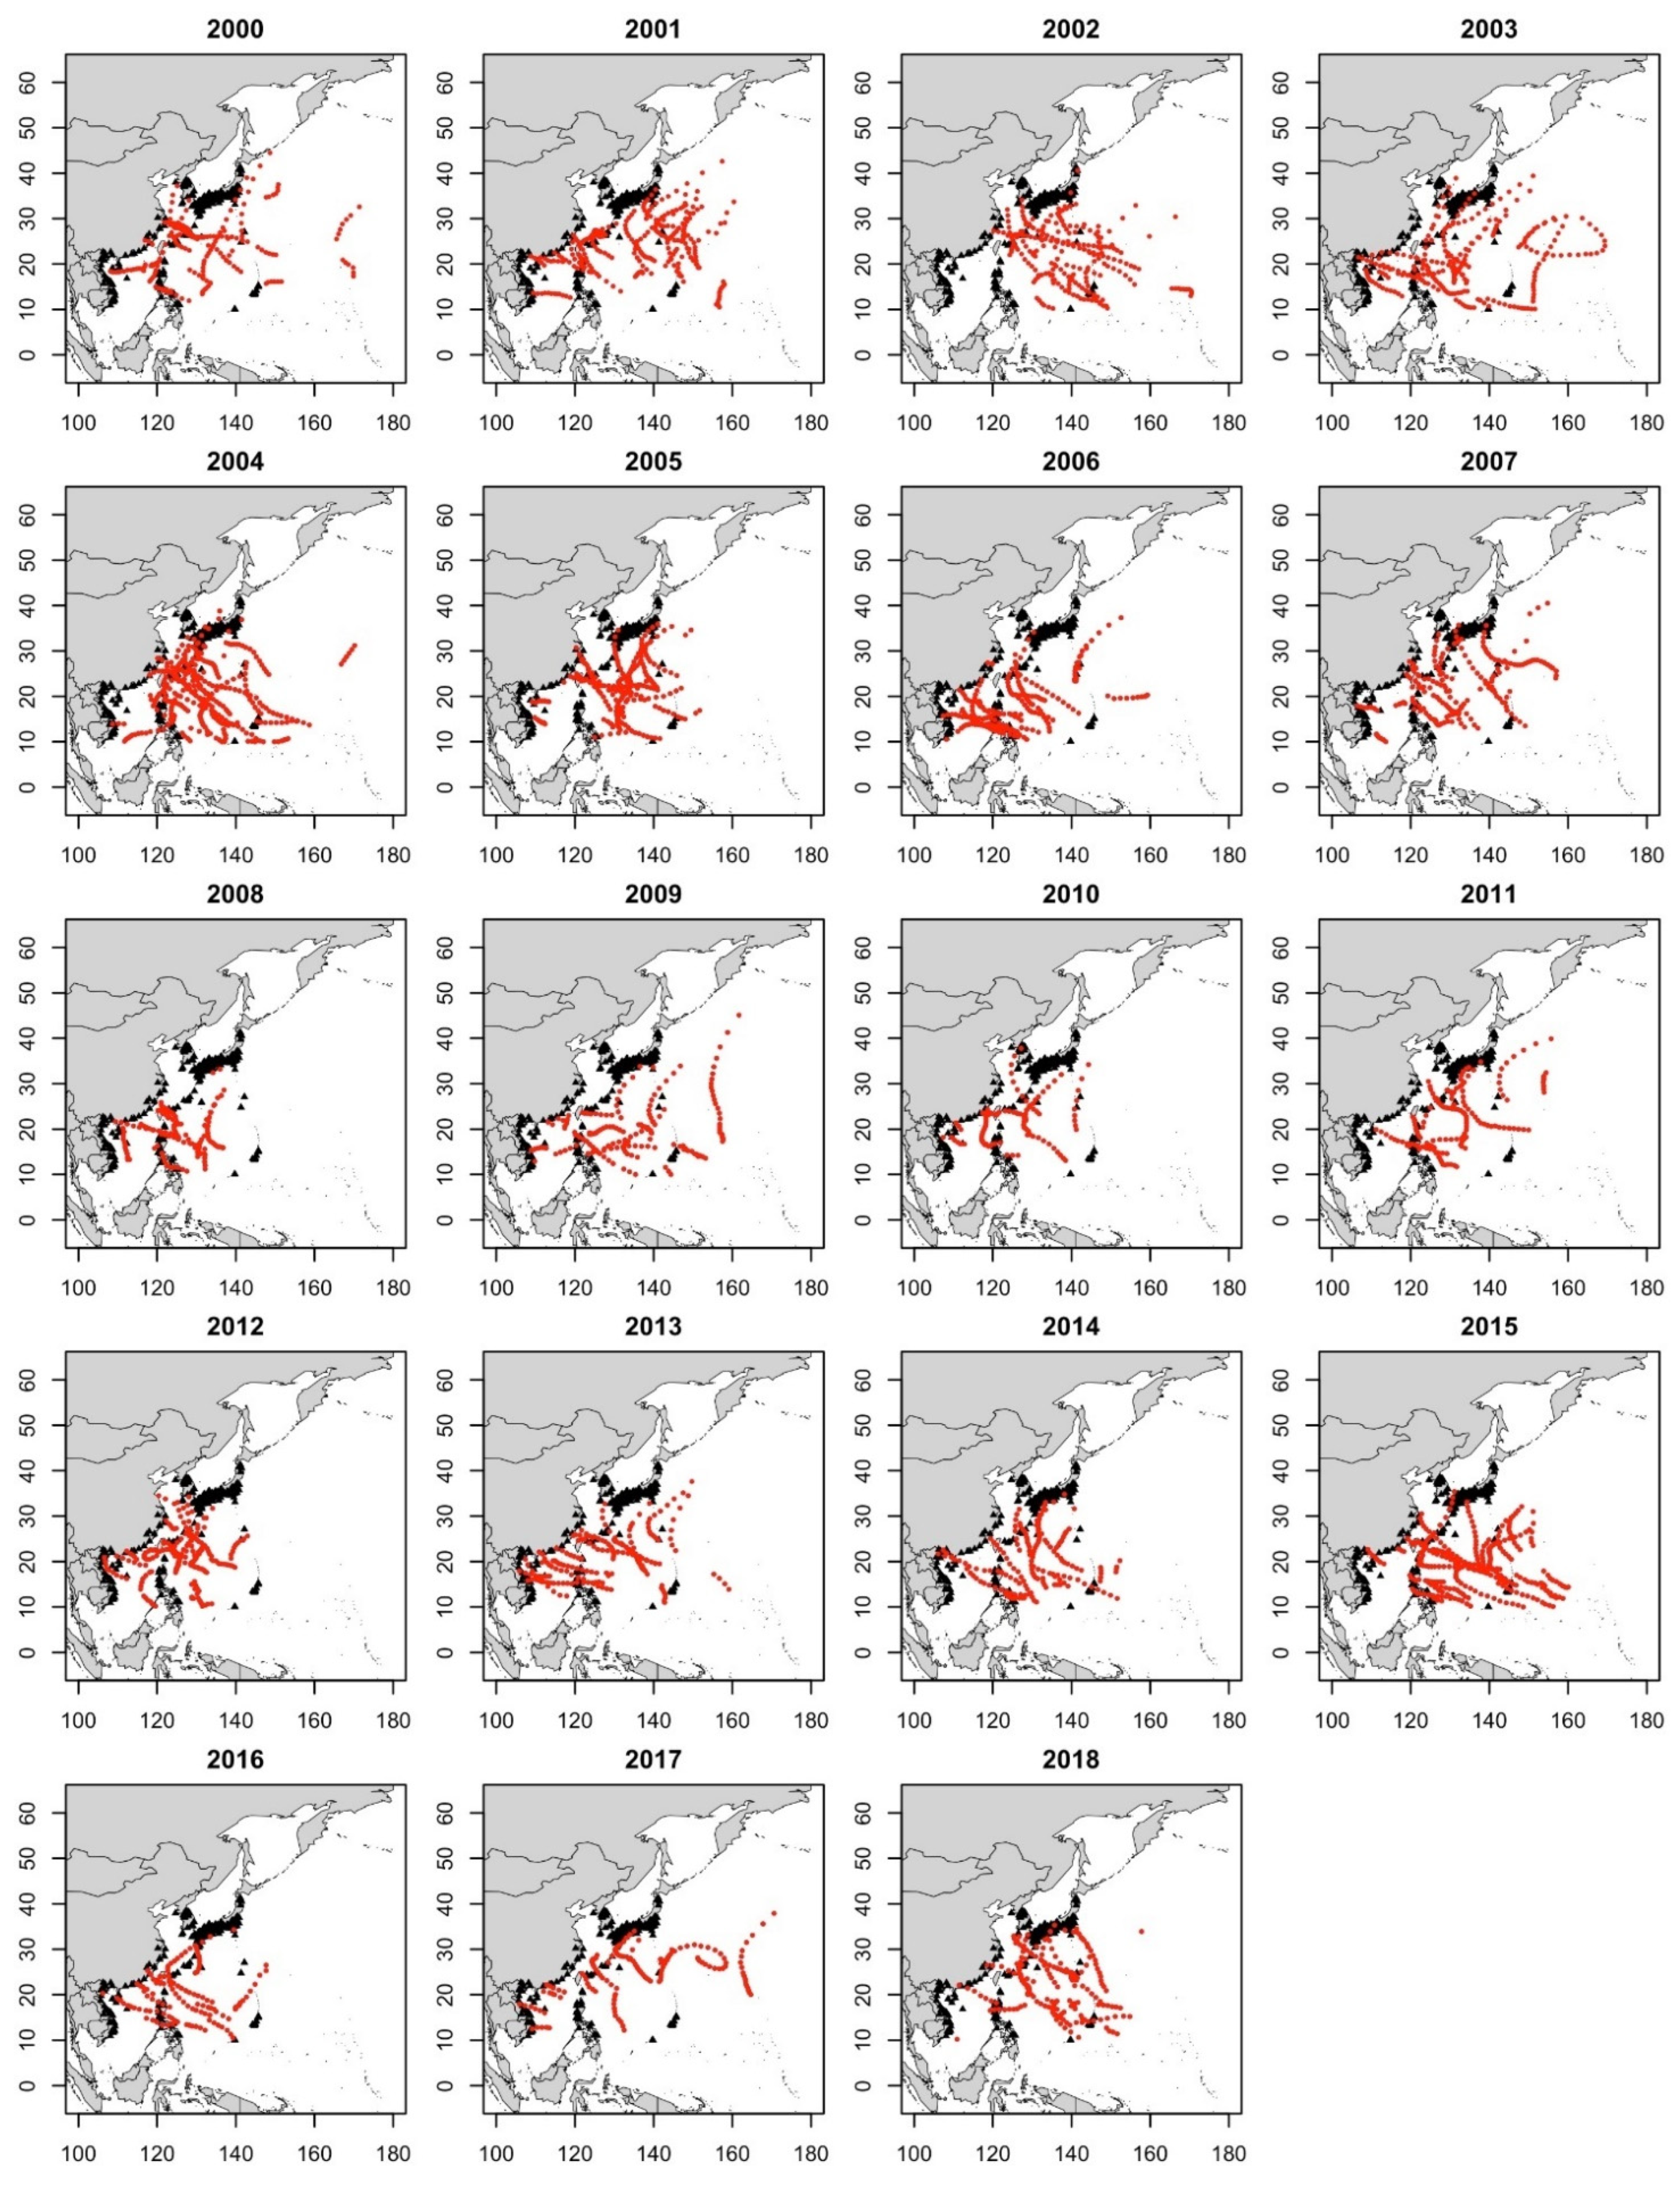
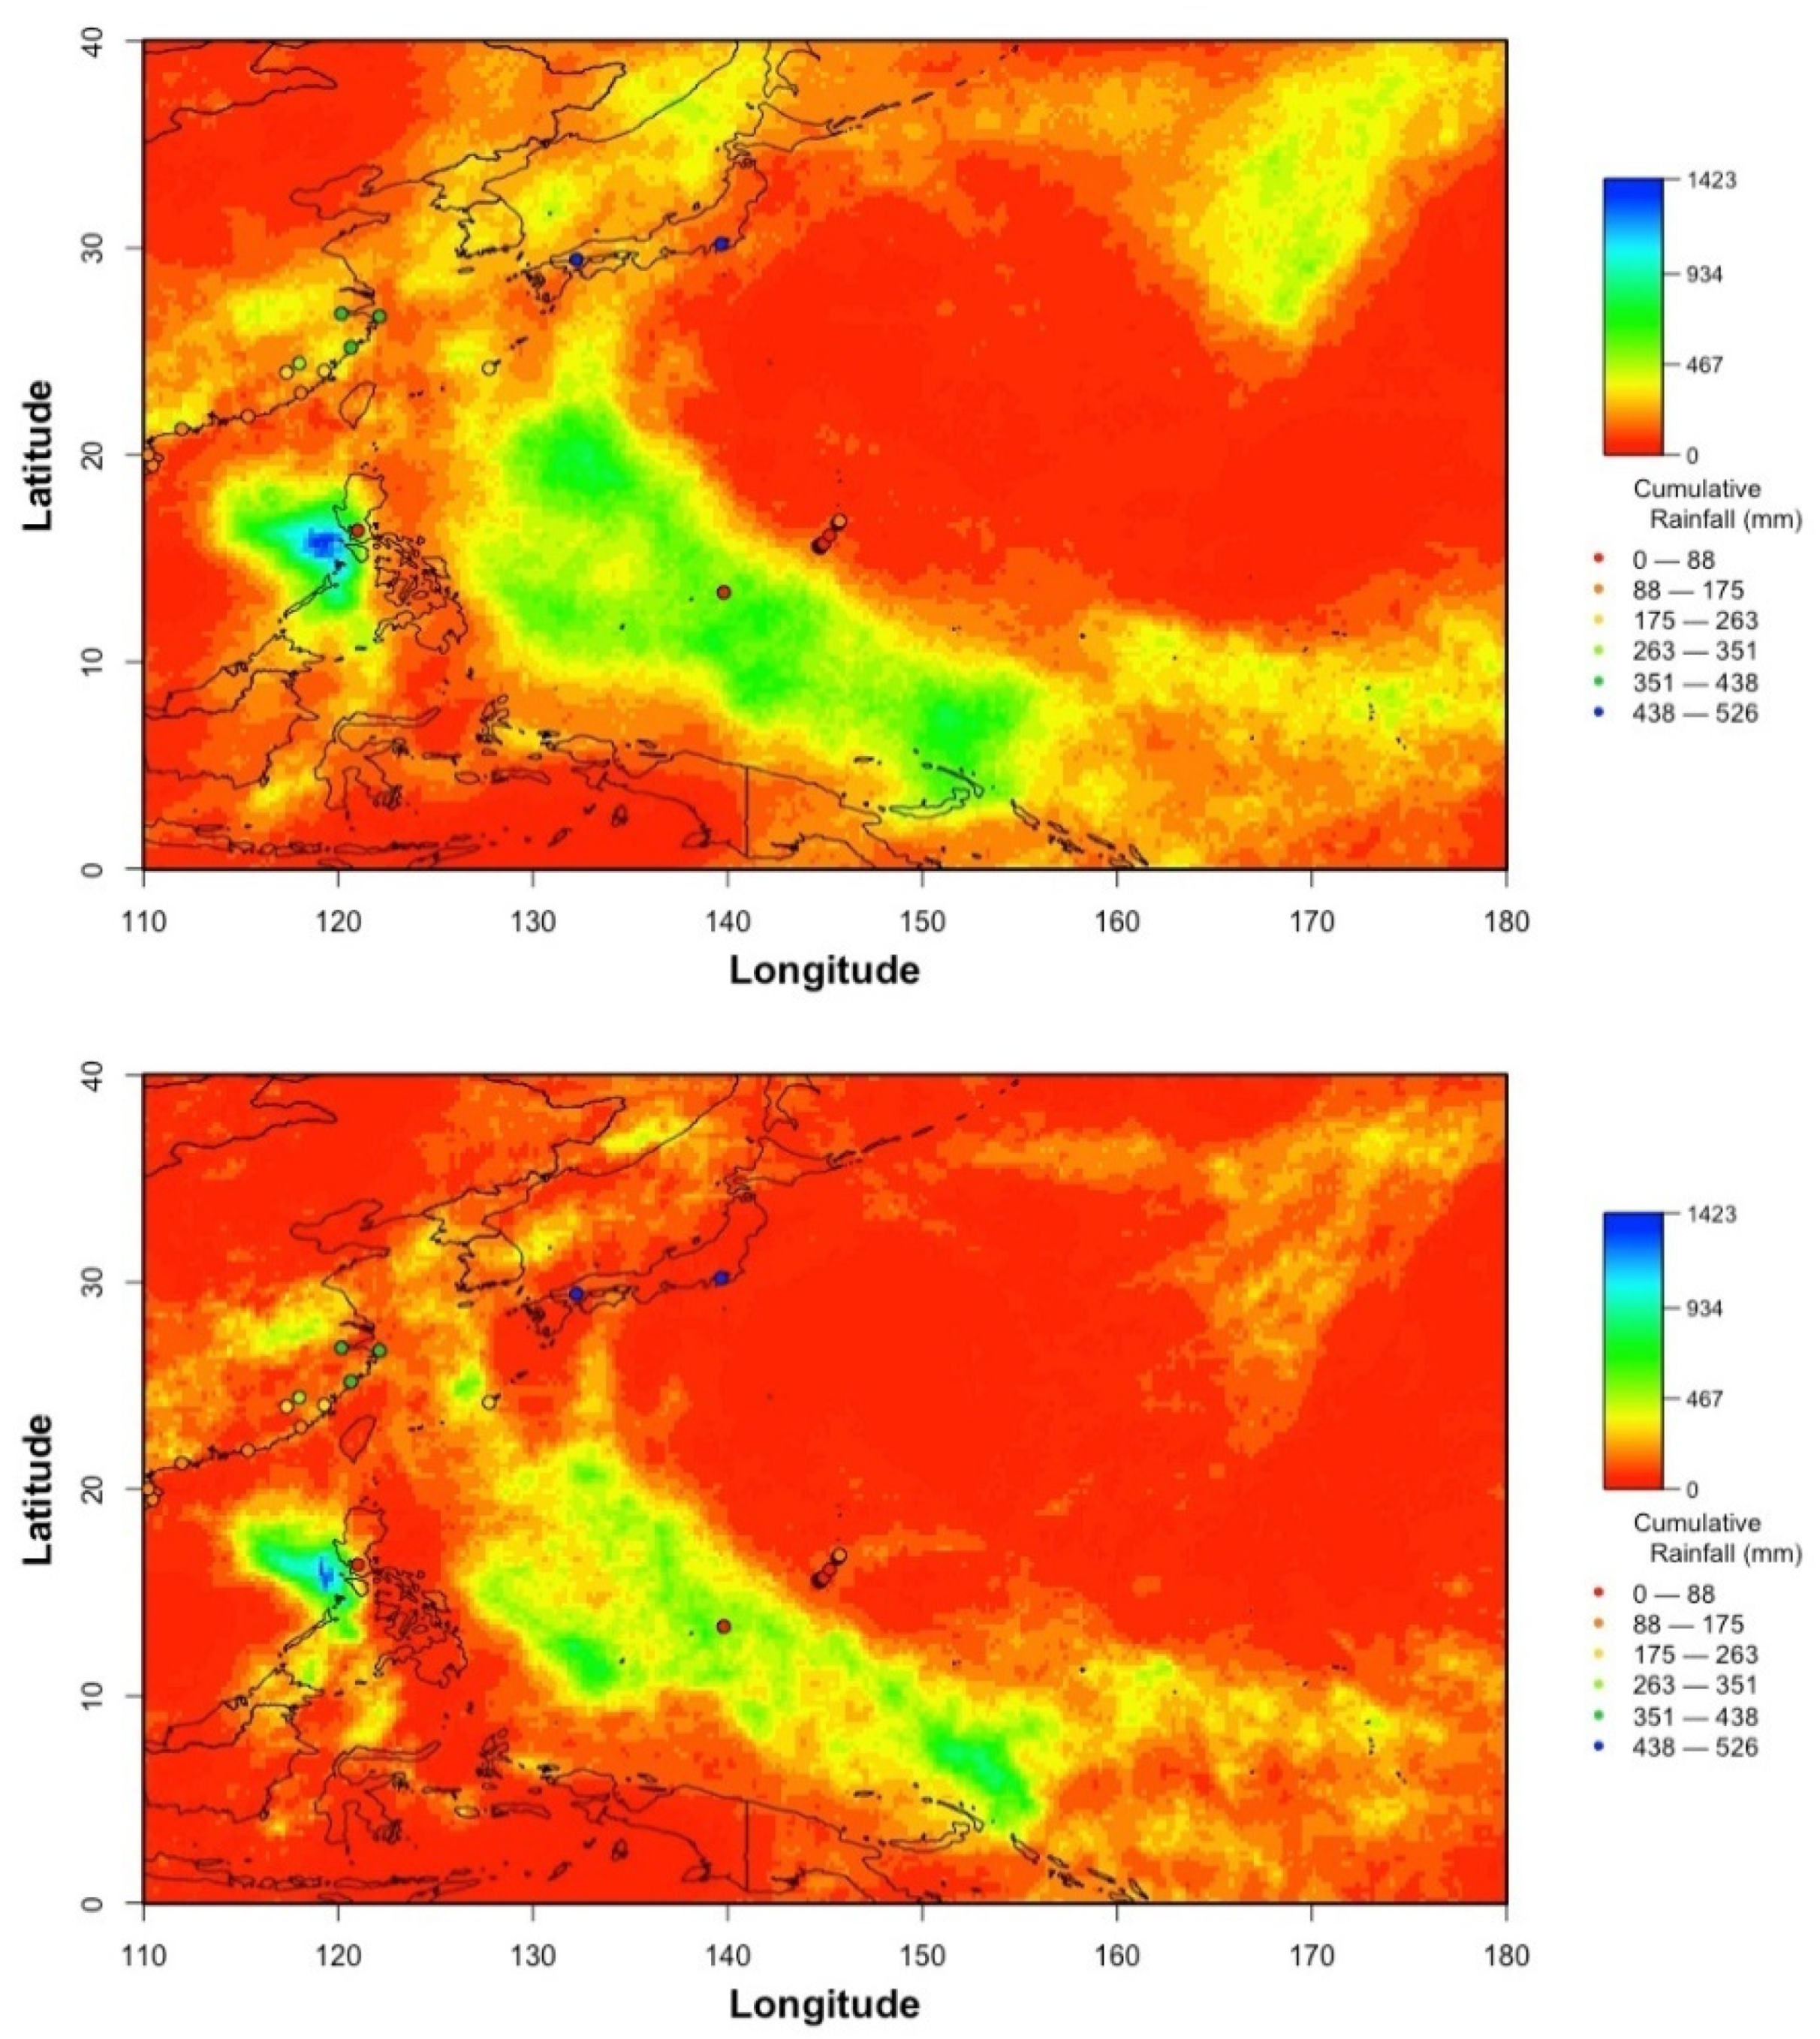
The distribution of Western North Pacific Tropical Cyclones published in the 2018 Annual Tropical Cyclone Report [26] was used to display the average number of typhoons (defined by maximum sustained winds greater than 64 knots) by month and year from 1959 to 2018. The best track data from the Naval Oceanography Portal [27] from 2000 through 2018 were also utilized. Only the best track data for the Western North Pacific for storms that developed into typhoons were used (Figure 1). The area of interest (AOI) for our study extended from 10°S 100°E to 50°N 180°E, encompassing the primary location of typhoon development in the Western North Pacific Ocean. This large area was the focus due to the complexity and variation in typhoon development and tracking [21,28,29,30]. Twenty-five typhoons occurring in the region from 2000 through 2018 were studied (Table 1). These typhoons varied in duration, time of occurrence, and area affected. Example cumulative rainfall results from TRMM TMPA maps for a subset of typhoons with best track and gauge locations are shown in Figure 2.
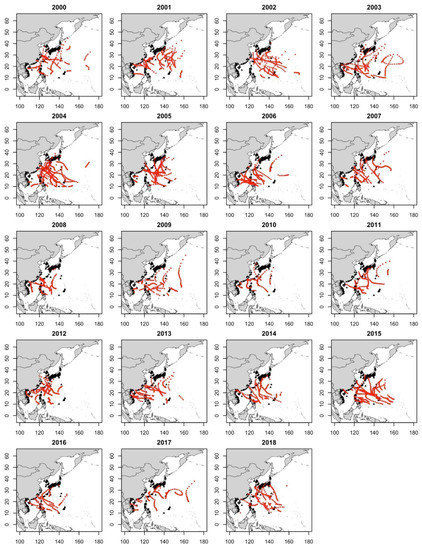
Figure 1.
Maps showing best track for typhoons for each year from 2000 to 2018. Center locations for the typhoons (red circles) and stations (black triangles).

Table 1.
Information about the twenty-five typhoons, including the duration, locations affected, and Oceanic Niño Index (ONI) value for each typhoon.
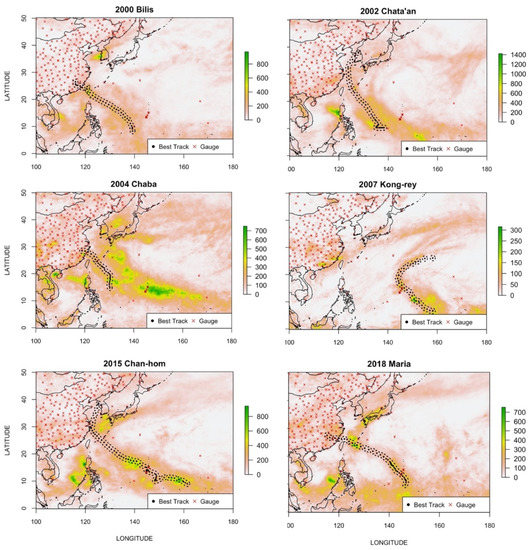
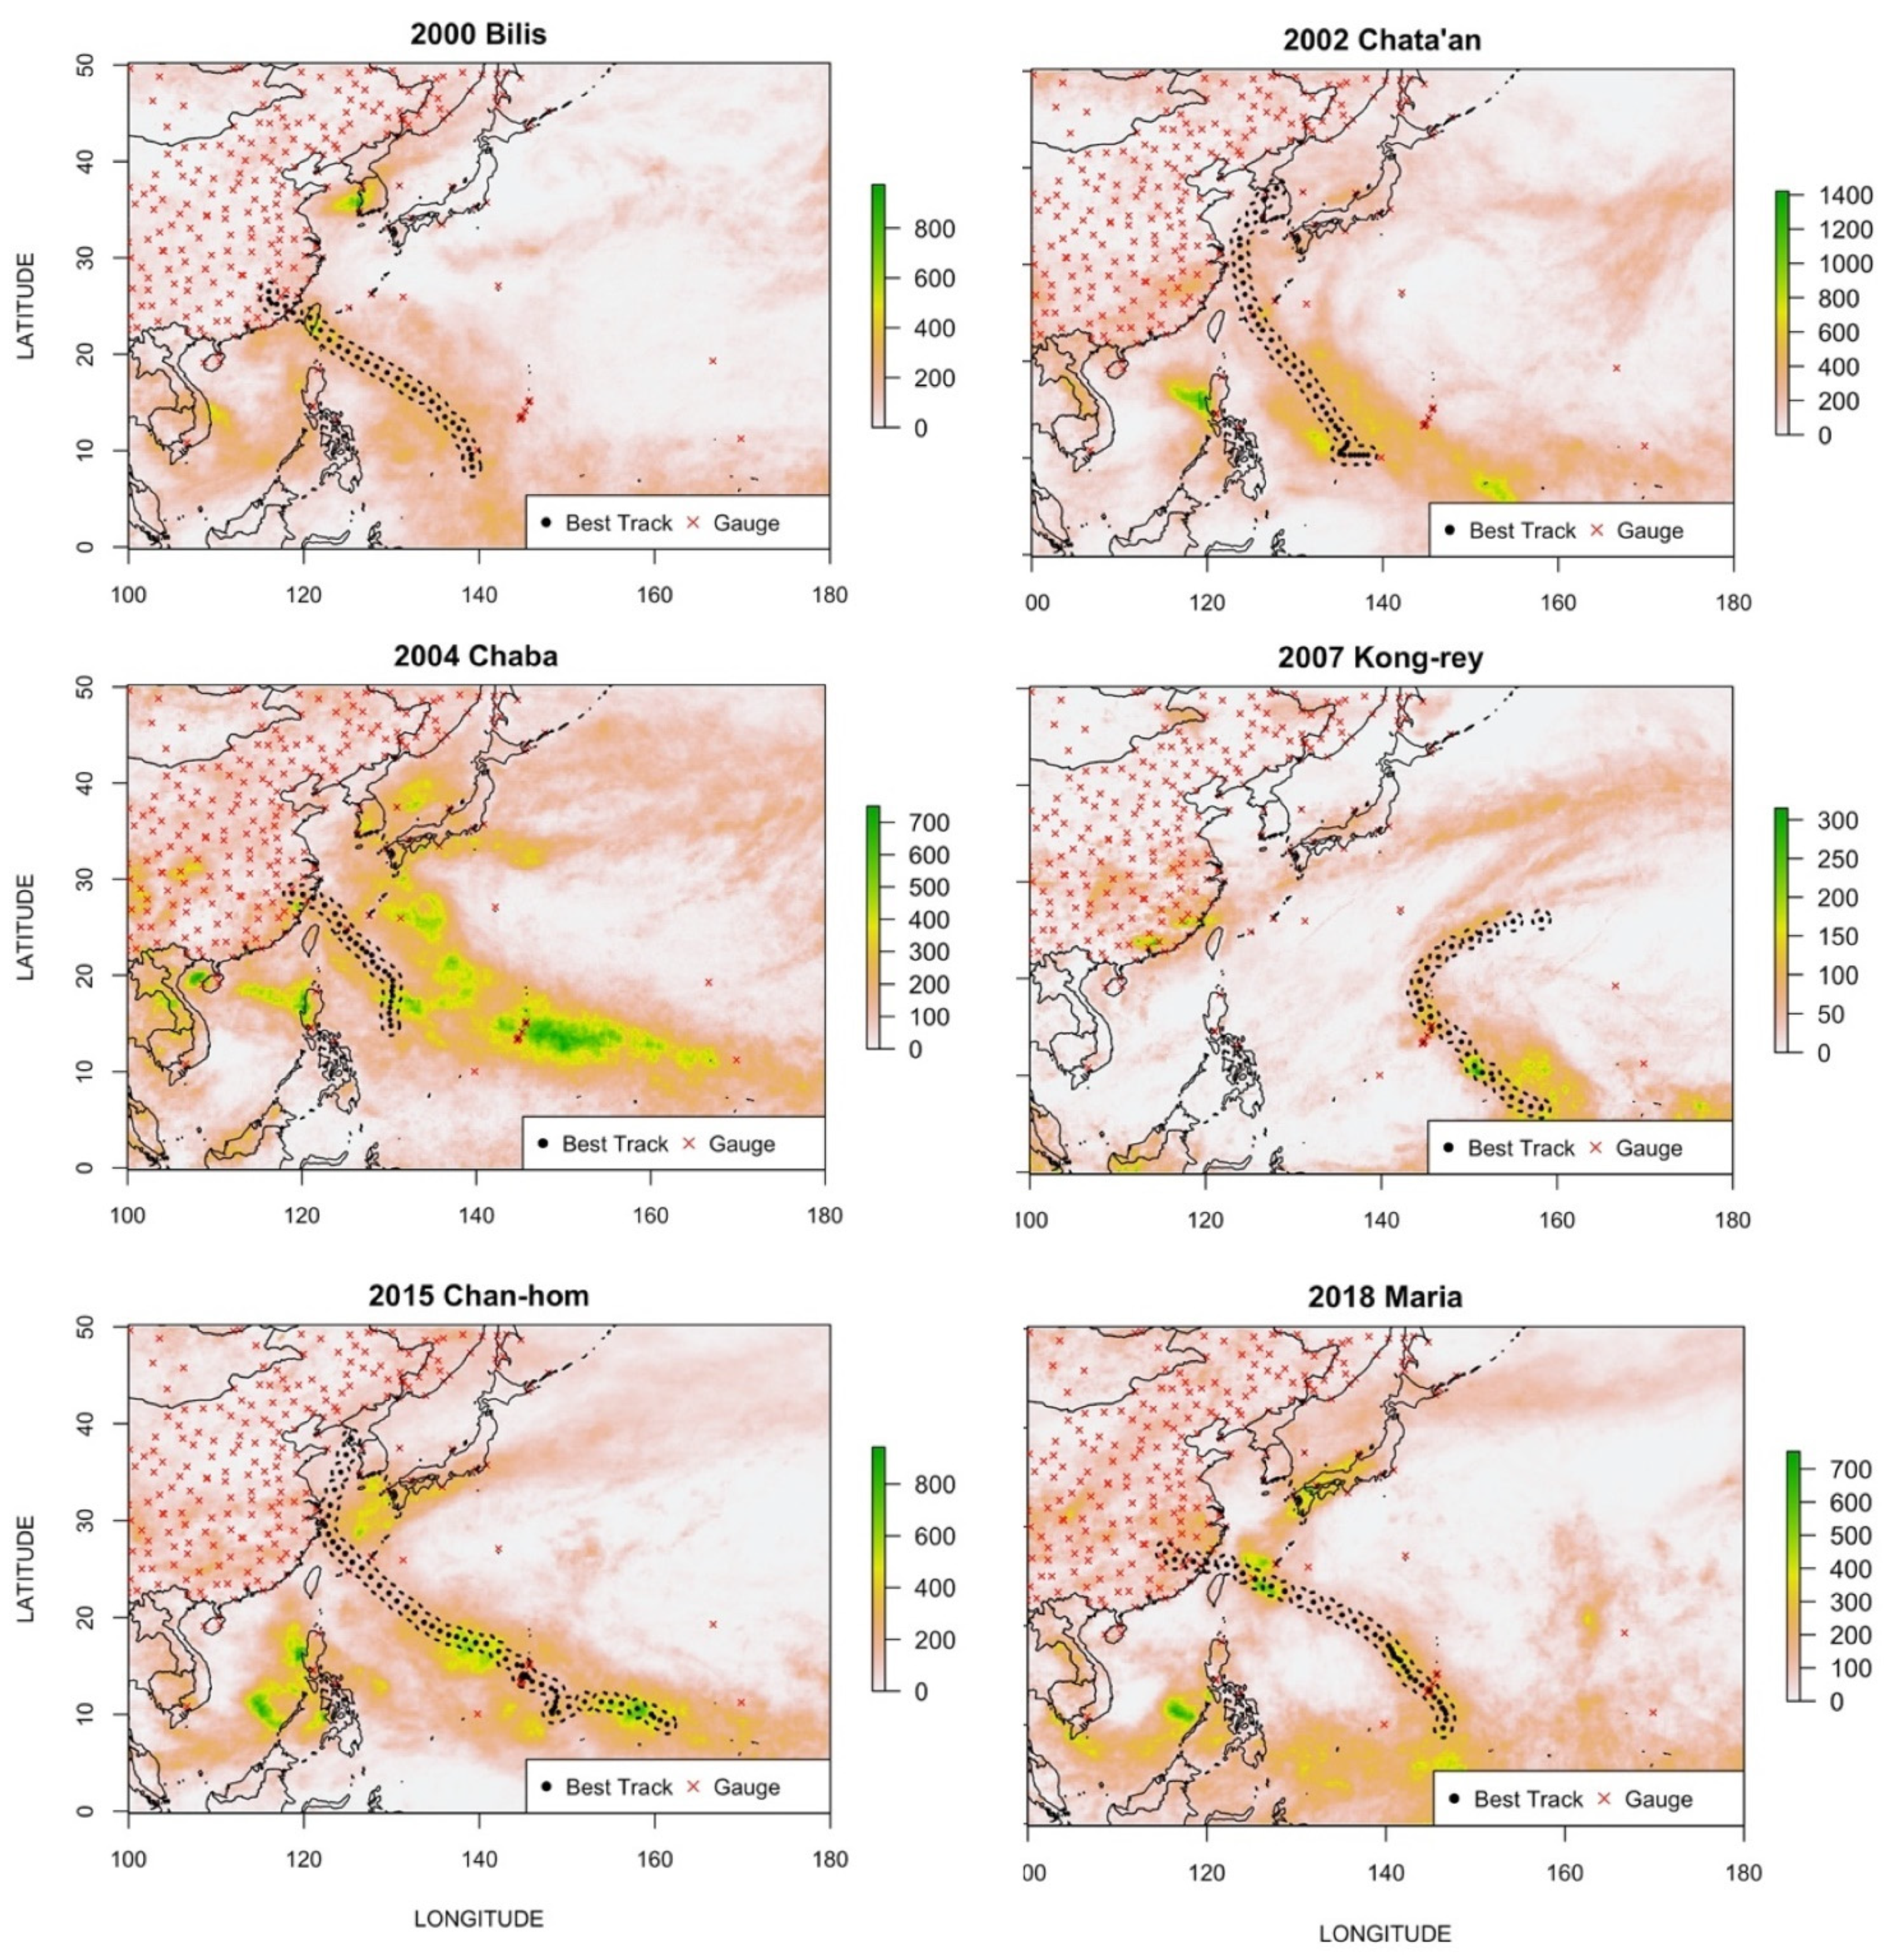
Figure 2.
Cumulative precipitation maps of six of the storms analyzed showing best track locations and all gauges in the map.
Daily precipitation data from the NOAA Global Historical Climatological Network (GHCN) [31] were used to provide in situ observations for comparison against satellite remote sensing estimates. Both the TRMM TMPA Near Real-Time 3B42 daily precipitation product [32] and the PERSIANN-CDR daily precipitation product [14,33] were used, as both products have been widely used for finer-scale analyses over both terrestrial and marine environments [34,35,36]. Additionally, both products have long temporal records (TRMM TMPA: 2000–present; PERSIANN CDR: 1983–present), high spatial resolution (0.25° × 0.25°), and have been used to estimate precipitation over the tropics with convective systems [9]. TRMM TMPA is a precipitation product that combines precipitation estimates from microwave, radar, and IR data to produce a high temporal (3-hourly and daily) and spatial (0.25° × 0.25°) resolution dataset that is available across the globe (50°S–50°N) and is corrected with gauge climatology from the Global Precipitation Climatology Project (GPCP) [37].
PERSIANN uses an algorithm based on infrared GridSat-B1 satellite data and is adjusted using the GPCP to produce daily, high spatial resolution (0.25° × 0.25°) precipitation estimates that extend across the globe (60°S–60°N) [14].
The total or cumulative precipitation for each typhoon was calculated using the daily precipitation estimates starting with the beginning of the typhoon development through to the end of the typhoon. For example, the 2000 Typhoon Bilis had a start date of 18 August 2000 and an end date of 27 August 2000. Daily precipitation values within that date range were added together to determine the total or cumulative precipitation for the 2000 Typhoon Bilis.
Widely accepted error metrics were used—namely the correlation coefficient (CC), r-squared (r2), and root mean square error (RMSE)—to evaluate the comparison between in situ precipitation from gauges, TRMM TMPA, and PERSIANN. Cumulative precipitation results at the daily, weekly, and monthly time scales were compared. Each gauge location corresponded to one pixel for TRMM TMPA and one for PERSIANN. Comparisons at each time scale occurred using data from 1 March 2000 through to 31 December 2018. Comparisons between in situ gauges, TRMM TMPA, and PERSIANN precipitation were conducted for each typhoon.
In Section 3.1, only data from the distribution of Western North Pacific Tropical Cyclones published in the 2018 Annual Tropical Cyclone Report [26] are shown. The number of typhoons defined by maximum sustained winds greater than 64 knots was averaged by month and year to show the interannual and intra-annual variations from 1959 through 2018.
In Section 3.2, we compare gauge precipitation to satellite remote sensing data across the entire study period from 2000 through 2018. We used the gauge locations to determine which pixel from TRMM TMPA and PERSIAN would be used for the comparison. Then, we compared cumulative precipitation at the daily, weekly, and monthly time scales. For these comparisons, we utilized correlation coefficient, r-squared, and root mean square error methods to measure the accuracy of the estimates. These statistics are the most commonly used to compare the accuracy of satellite remote sensing data to gauge data. This portion of the analyses was meant to show how accurate the satellite remote sensing products are during normal conditions via the daily, weekly, and monthly time scales from 2000 through 2018.
In Section 3.3, we use the correlation coefficient, r-squared, and root mean square error results to compare the accuracy of the satellite estimates to gauge estimates during typhoons. The analysis was conducted to determine how well the satellite precipitation products estimated in situ rain gauges. A total of 41 stations (Table 2) were selected using the following criteria: (1) stations located within 1° of the best track data (Figure 1); (2) stations that were missing minimal data for the time interval measured (i.e., only stations that had at least 25 days of data to calculate cumulative monthly rainfall); (3) stations that did not have any quality flags. These criteria drastically reduced the number of stations that were able to be used for the analysis.
Table 2.
Station descriptions for the forty-one in situ rain gauges located within 1° of the best track locations with 329 or more days of data available (2000–2018).
Finally, in Section 3.4, we focus on specific typhoons for the analysis to determine whether the satellite remote sensing precipitation is more accurate when gauges are located closer to the track of the typhoon. As with the previous sections mentioned, we used correlation coefficient, r-squared, and root mean square error results to determine the accuracy.
3. Results
3.1. Rates of Occurrence of Typhoons Changed over Time from 1959 to Present Day
The average number of occurrences of typhoon events (64 knots) per month during the portion of the typhoon season (July through October) from 2000 to 2018 has decreased compared to the average number of typhoons from 1959 through 1999 (Figure 3). The average numbers of typhoon events in the months of August, September, and October during 1959–1999 were 3.49, 3.39, and 3.15, respectively. The average numbers of typhoons for the same months during the 2000–2018 time period were 3.32, 2.84, and 2.68, respectively. By examining Figure 3 more closely, it can be seen that the curve for the average number of typhoon events for 2000–2018 for the months of August–December clearly falls below those for 1959–1999 and 1959–2018. The gap between the two sets of curves increases from about 0.2 in August to 0.6 in September to 0.7 in October and decreases to 0.2 and 0.1 in November and December, respectively. The biggest gap is in the month of October and the smallest gap is in August in the August–October typhoon season.
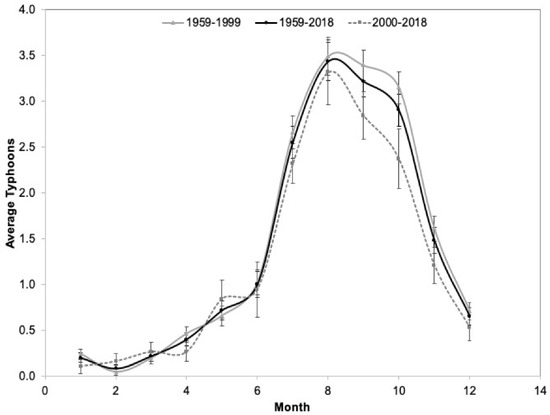
Figure 3.
Average number of typhoons (64 knots) by month for three different periods of time (1959–1999, 1959–2018, and 2000–2018), showing that the numbers of typhoons by month have decreased. Standard error bars are shown for the average number of typhoons for the 1959–2018 line.
The total number of typhoons (64 knots) occurring each year has fluctuated from 1959 to 2018 with oscillating patterns (Figure 4). While the average number of typhoons during this period is 16.9, there are certain decades when the number of typhoons is well above the average and well below the average. The average numbers of typhoons during the 1959–1968, 1969–1978, 1979–1988, 1989–1998, 1999–2008, and 2009–2017 time periods were 20.6, 15.2, 16.0, 19.3 was 16.2, and 13.8, respectively. The average number of typhoons is well above the average for 1959–1969, with a peak of 26 in 1964, and well below the average for 2005–2014, with a minimum in 2011 of 7.
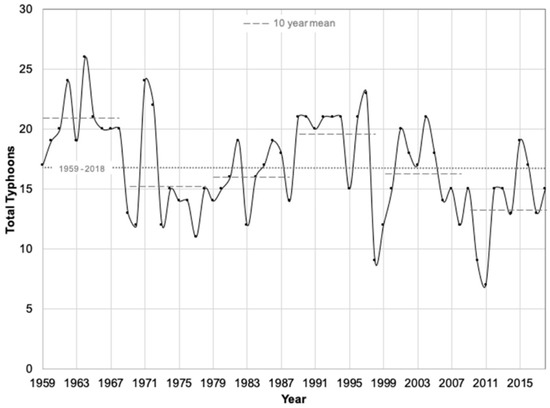
Figure 4.
Total number of typhoons from 1959 through 2018. The average for 1959–2018 was 16.85 typhoons, which is shown along with 10-year average lines.
3.2. Comparison of Precipitation Results between In Situ Gauges and Satellite Remote Sensing Estimates in the Western North Pacific
Daily precipitation data from 1 March 2000 to through 31 December 2018 were used to determine how precipitation results compare between in situ rain gauge and satellite remote sensing estimates. The daily data were used to calculate weekly and monthly precipitation values for each station and the corresponding pixels from TRMM TMPA and PERISANN. The correlation coefficient, r-squared, and root mean square error results are shown in Table 3. The was a weak relationship between in situ rainfall and TRMM TMPA or PERSIANN at the daily time scale, with only 17% of the variation explained by the satellite estimates and RMSE of 13 mm (Table 3). However, 57% and 48% of the variation in weekly rainfall was explained by TRMM TMPA and PERSIANN, respectively, and RMSEs varied from 36 mm to 39 mm. Furthermore, 68% and 64% of the variation in monthly in situ rainfall was explained by TRMM TMPA and PERSIANN, respectively, with RMSEs ranging from 78 mm to 90 mm. The correlation coefficients were 0.754 and 0.691 for weekly cumulative precipitation and 0.825 and 0.803 for monthly cumulative precipitation for TRMM TMPA and PERSIANN, respectively (Table 3). Scatterplots of cumulative weekly and monthly rainfall are shown in Figure 5 to provide more visual information about the statistics presented above. When examining these scatterplots, one can see that the majority of the values are zero or very close to zero, with few values over 500 mm. In fact, 75% of the weekly gauge rainfall values were equal to or less than 47.5 mm and 75% of the monthly gauge rainfall values were equal to or less than 216.4 mm. Additionally, rainfall measurements from gauges on average were higher than the estimates from PERSIANN or TRMM TMPA.
Table 3.
Correlation coefficient (CC), r-squared (r2), and root mean square error (RMSE) results for daily, weekly, and monthly data.
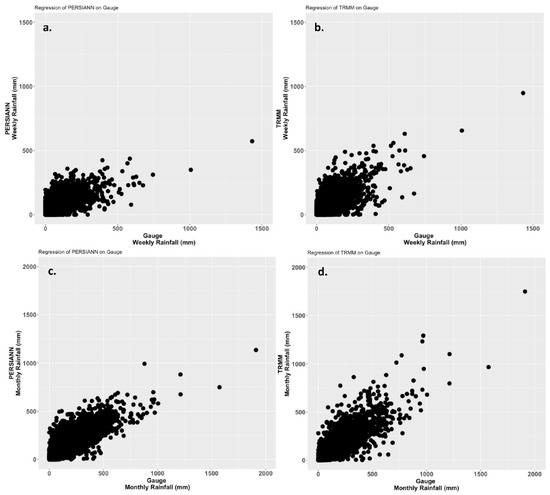
Figure 5.
Scatterplots of cumulative weekly (a,b) rainfall and cumulative monthly (c,d) rainfall between in situ rain gauges and satellite estimates for PERSIANN (a,c) and TRMM TMPA (b,d).
For example, an in situ gauge measured almost 1500 mm, while the TRMM TMPA pixel estimated 1000 mm (see Figure 5b). However, TRMM TMPA did estimate closer to the in situ rainfall than PERSIANN, as indicated on the scatterplots.
The root mean square error was also calculated for each in situ rain gauge for daily cumulative (Figure 6), weekly cumulative (Figure 7), and monthly cumulative precipitation (Figure 8). Root mean square error values varied across stations, at 0–25 mm for daily rainfall, 0–99 mm for weekly rainfall, and 0–187 mm for monthly rainfall. The RMSE is a unit-based measure that shows how well the satellite precipitation results estimate the in situ observations. The RMSE values for daily cumulative precipitation for PERSIANN varied from 5.42 mm to 25.80 mm and for TRMM TMPA varied from 5.42 mm to 22.90 mm across the entire AOI. One might think that the individual stations would have similar RMSE values; however, this is not always the case, as can be seen in Figure 6a–c. For example, in Figure 6a, 2 stations in Japan have RMSE values < 10.50 mm for PERSIANN and RMSE values > 20 mm for TRMM TMPA. This can also be seen in the RMSE values for the weekly cumulative precipitation results shown in Figure 6b and monthly cumulative precipitation results shown in Figure 6c. Two of the stations in the Philippines have RMSE values < 37 mm for PERSIANN and RMSE values > 41 mm (Figure 6b). Several stations (stations in Japan, the islands of Japan, and in the Philippines) in Figure 6c show larger differences in RMSE values between PERSIANN and TRMM TMPA. It appears that these variations in RMSE are due to differences in location, elevation, and the amount of rainfall the stations receive (Table 2). Together, these figures help show how similar and different the estimates from satellites can be depending on the location and time scale. At the daily time scale, there is only a range of about 20 mm in the RMSE values, while there is a range of 187 mm in the RMSE values at the monthly time scale. When the precipitation amounts from the stations are considered (yearly cumulative range of 1072–4702 mm from Table 2), this can help one to understand the RMSE values. The lowest yearly cumulative precipitation is 1072 mm, which is approximately 89 mm/month and 3 mm/day. The highest yearly cumulative precipitation is 4702 mm, which is approximately 392 mm/month and 13 mm/day.
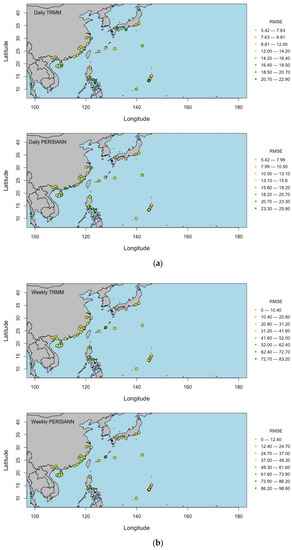
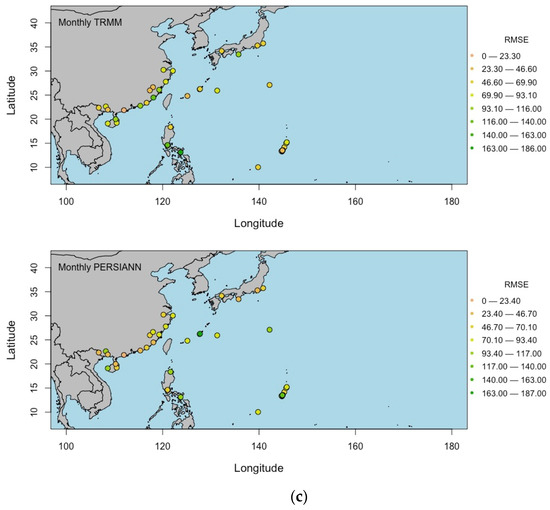
Figure 6.
(a) Root mean square error (RMSE) values for daily rainfall for TRMM (top) and PERSIANN (bottom) for each station. (b) Root mean square error (RMSE) values for weekly rainfall for TRMM (top) and PERSIANN (bottom) for each station. (c) Root mean square error (RMSE) values for monthly rainfall for TRMM (top) and PERSIANN (bottom) for each station.

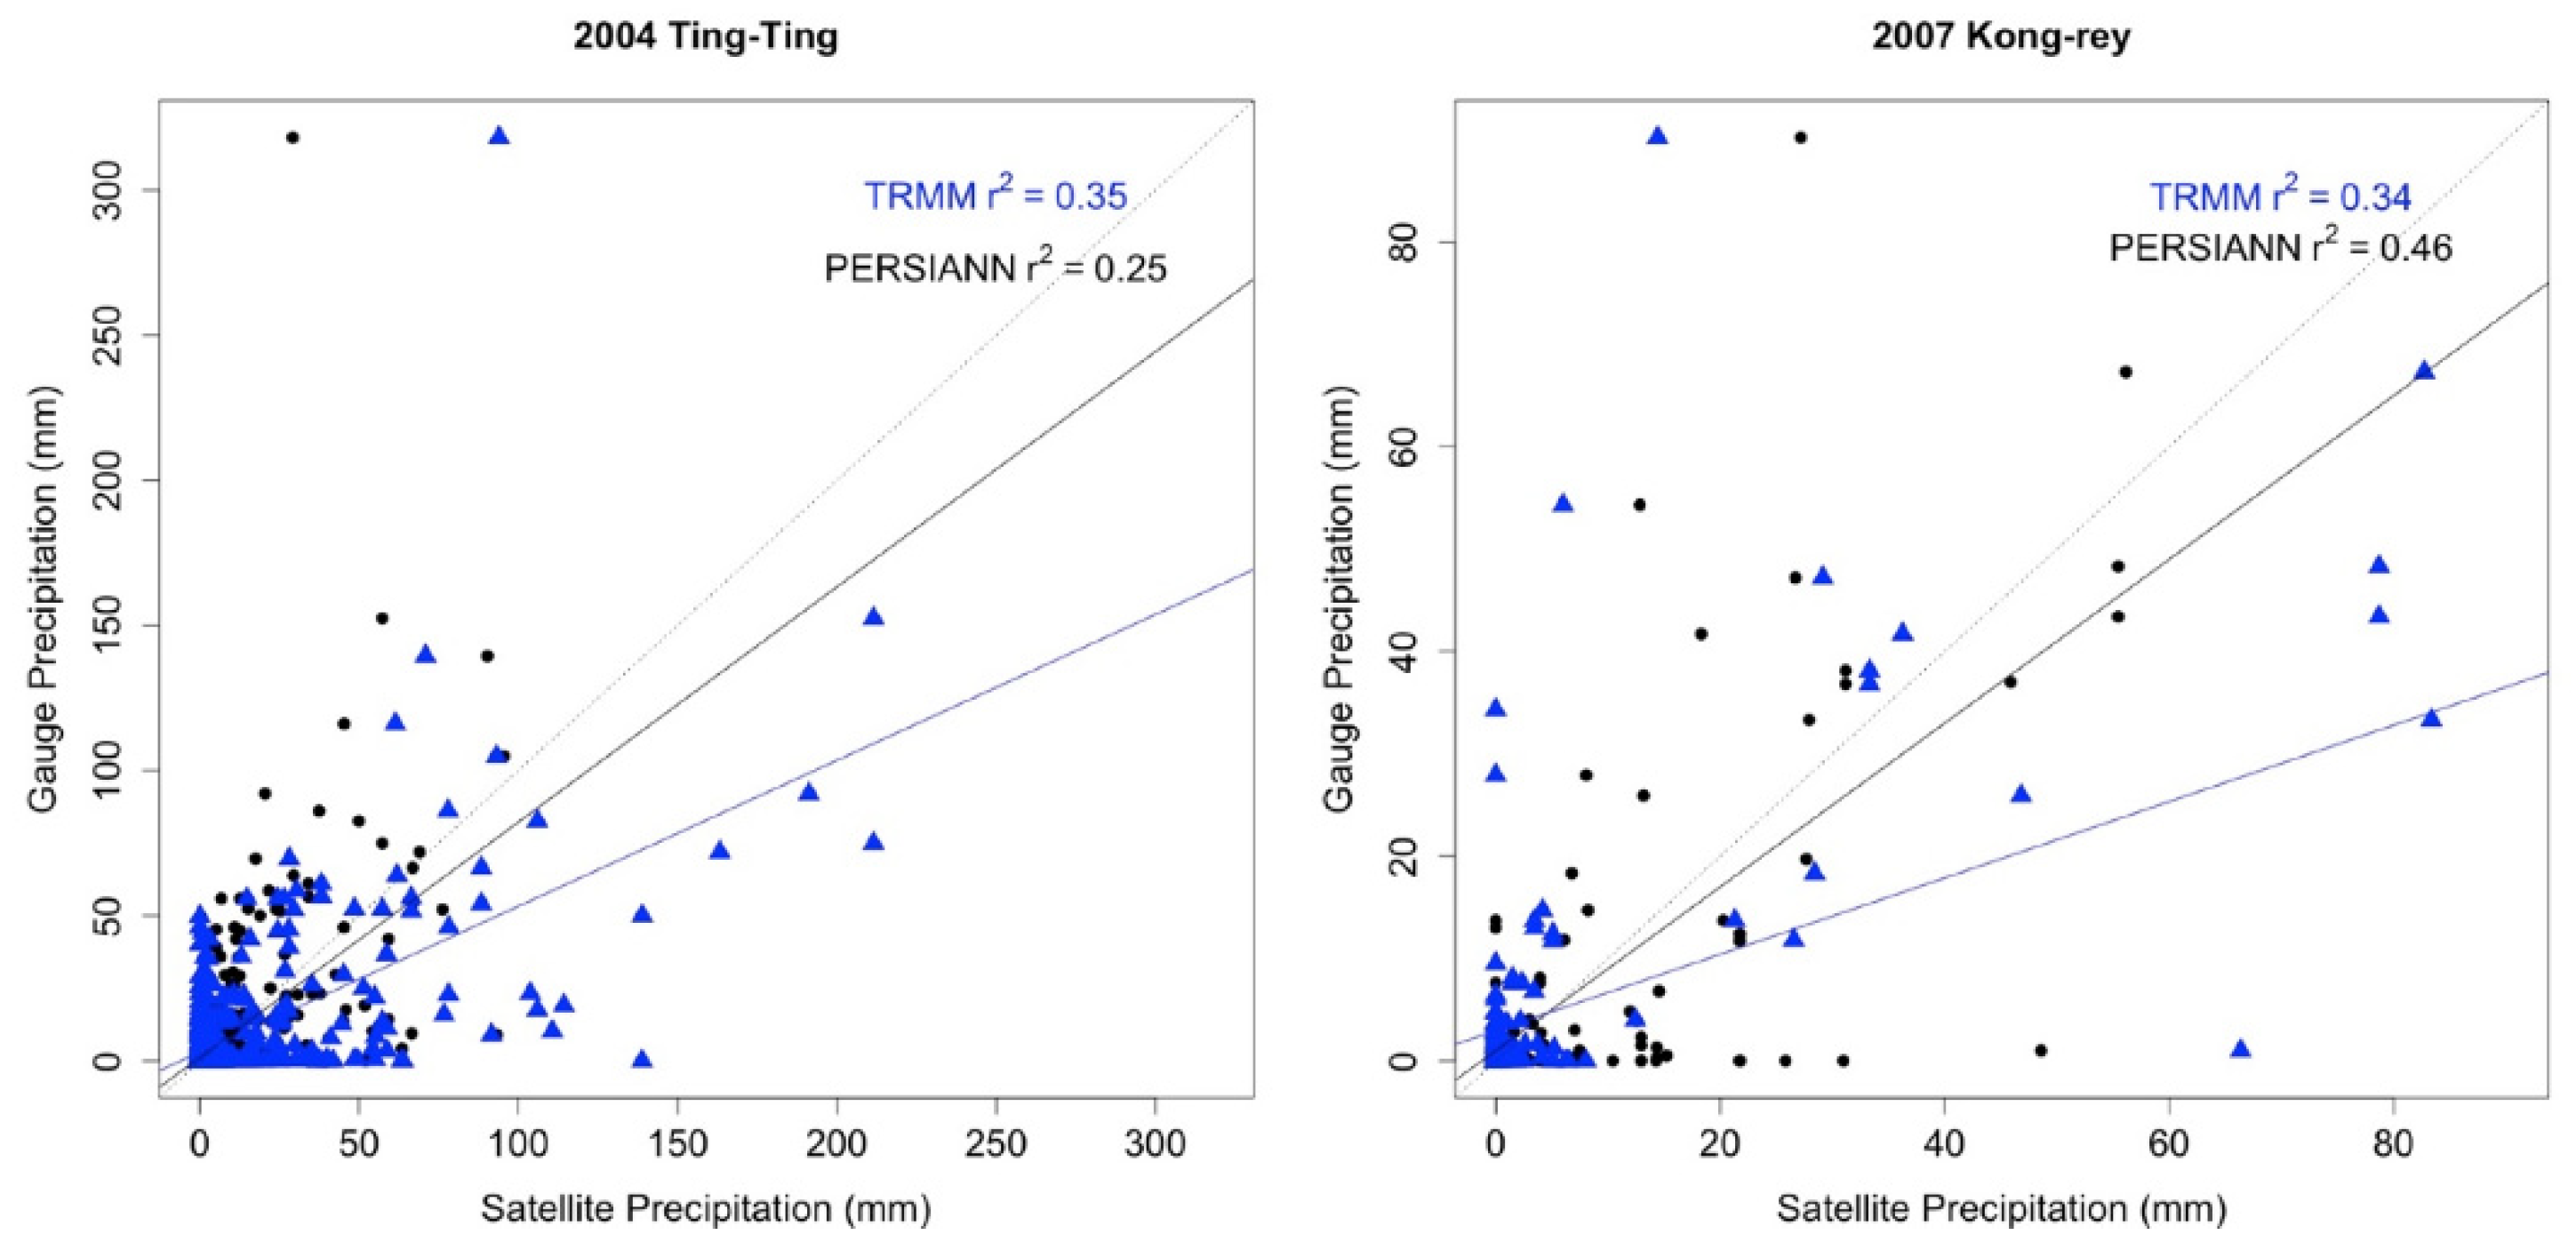
Figure 7.
Scatterplots of satellite precipitation and in situ gauge precipitation during the 2004 Typhoon Ting (left) and 2007 Typhoon Kong-rey (right). Linear regression lines are shown along with r-squared values for TRMM TMPA and PERSIANN.
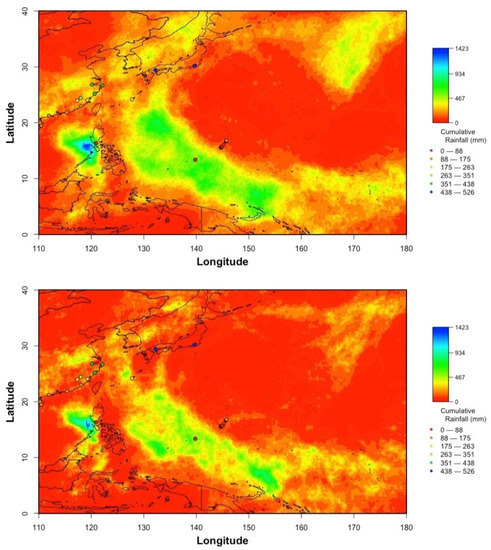
Figure 8.
Cumulative precipitation values from PERSIANN, TRMM TMPA, and in situ gauges for the 2002 Typhoon Chataan.
3.3. Comparison of Precipitation Results between In Situ Gauges and Satellite Remote Sensing Estimates during Typhoons
This portion of the analysis was completed to determine how well daily precipitation estimates from satellites compared to in situ gauges during typhoons.
Comparisons of daily precipitation from in situ rain gauges and satellite remote sensing estimates were completed for all twenty-five typhoons. There was a lot of variation in how well the satellite precipitation data estimated in situ rainfall because of the duration of the typhoons, timing of the typhoons, and available measurements from in situ gauges. All available in situ gauges were used during each typhoon, regardless of the location. This means that many of the rainfall measurements from the in situ gauges equaled zero because they were either collected far away from the typhoon track or because they were collected on days before or after the typhoon passed the area. For example, during the 2000 Typhoon Bilis, 34 in situ gauges were able to be used for comparison with TRMM TMPA and PERSIANN results, while only 9 in situ gauges were used for the 2017 Typhoon Lan (Table 4). This resulted in r-squared values of 0.2 and 0.3 for PERSIANN and TRMM TMPA, respectively, for Typhoon Bilis (Table 4). Across all twenty-five typhoons, the r-squared values ranged from 0.00 to 0.46, with the most variation explained during the 2004 Typhoon Ting-Ting and 2007 Typhoon Kong-rey (Table 4). While 35% of the variation was explained by TRMM TMPA during the 2004 Typhon Ting-Ting, only 25% was explained by PERSIANN (Figure 7; Table 4). Conversely, during the 2007 Typhoon Kong-rey, PERSIANN explained 46% of the variation, while TRMM TMPA only explained 34% (Figure 7; Table 4). Many of the observations equaled zero during both typhoons because of when and where the observations were collected, as previously mentioned. Both PERSIANN and TRMM TMPA underestimated daily precipitation during the typhoons, as indicated by the linear regression lines falling below the 1:1 line on the scatterplots (Figure 7). Overall, PERSIANN estimates were closer to the in situ gauge precipitation during the 2004 Typhoon Ting-Ting and the 2007 Typhoon Kong-rey, as can be seen by the linear regression lines on each scatterplot (Figure 7). Interestingly, there were many precipitation estimates from PERSIANN and TRMM TMPA that were much higher when the in situ gauge values equaled zero.
Table 4.
R-square values, degree of freedom, and number of stations for each typhoon for TRMM TMPA and PERSIANN.
3.4. Comparison of Precipitation Results between In Situ Gauges and Satellite Remote Sensing Estimates during a Specific Typhoon
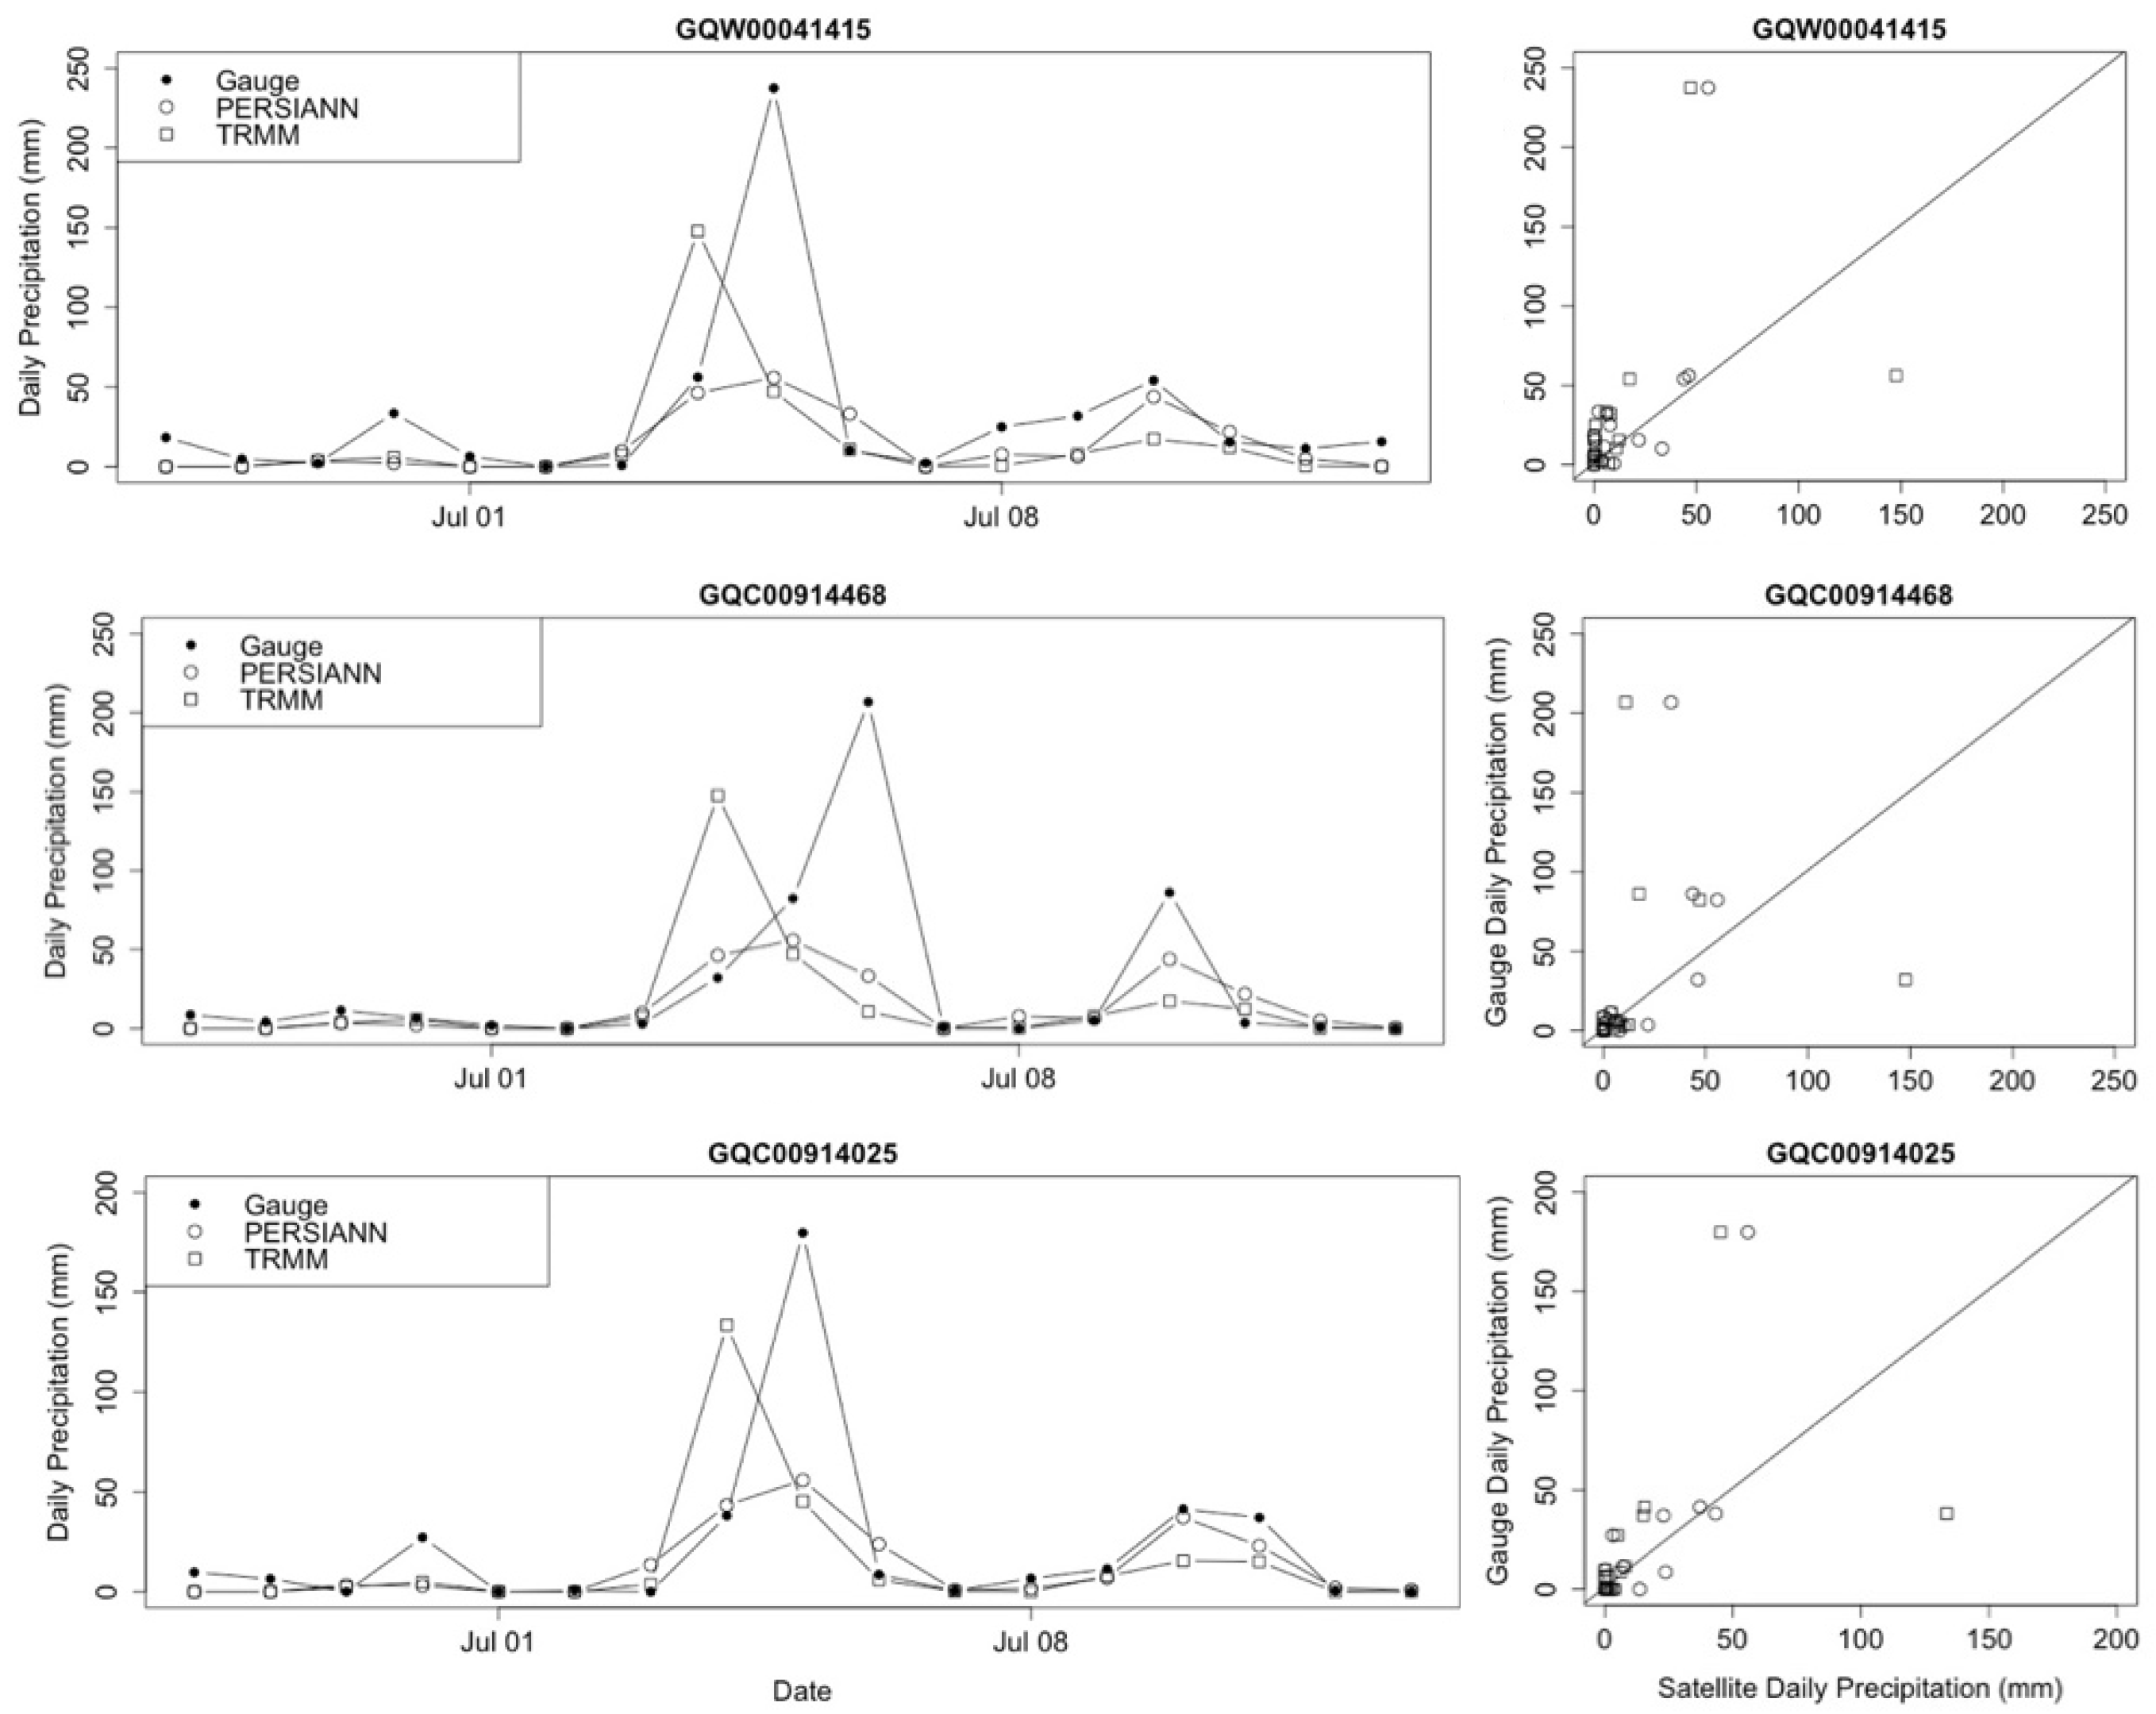
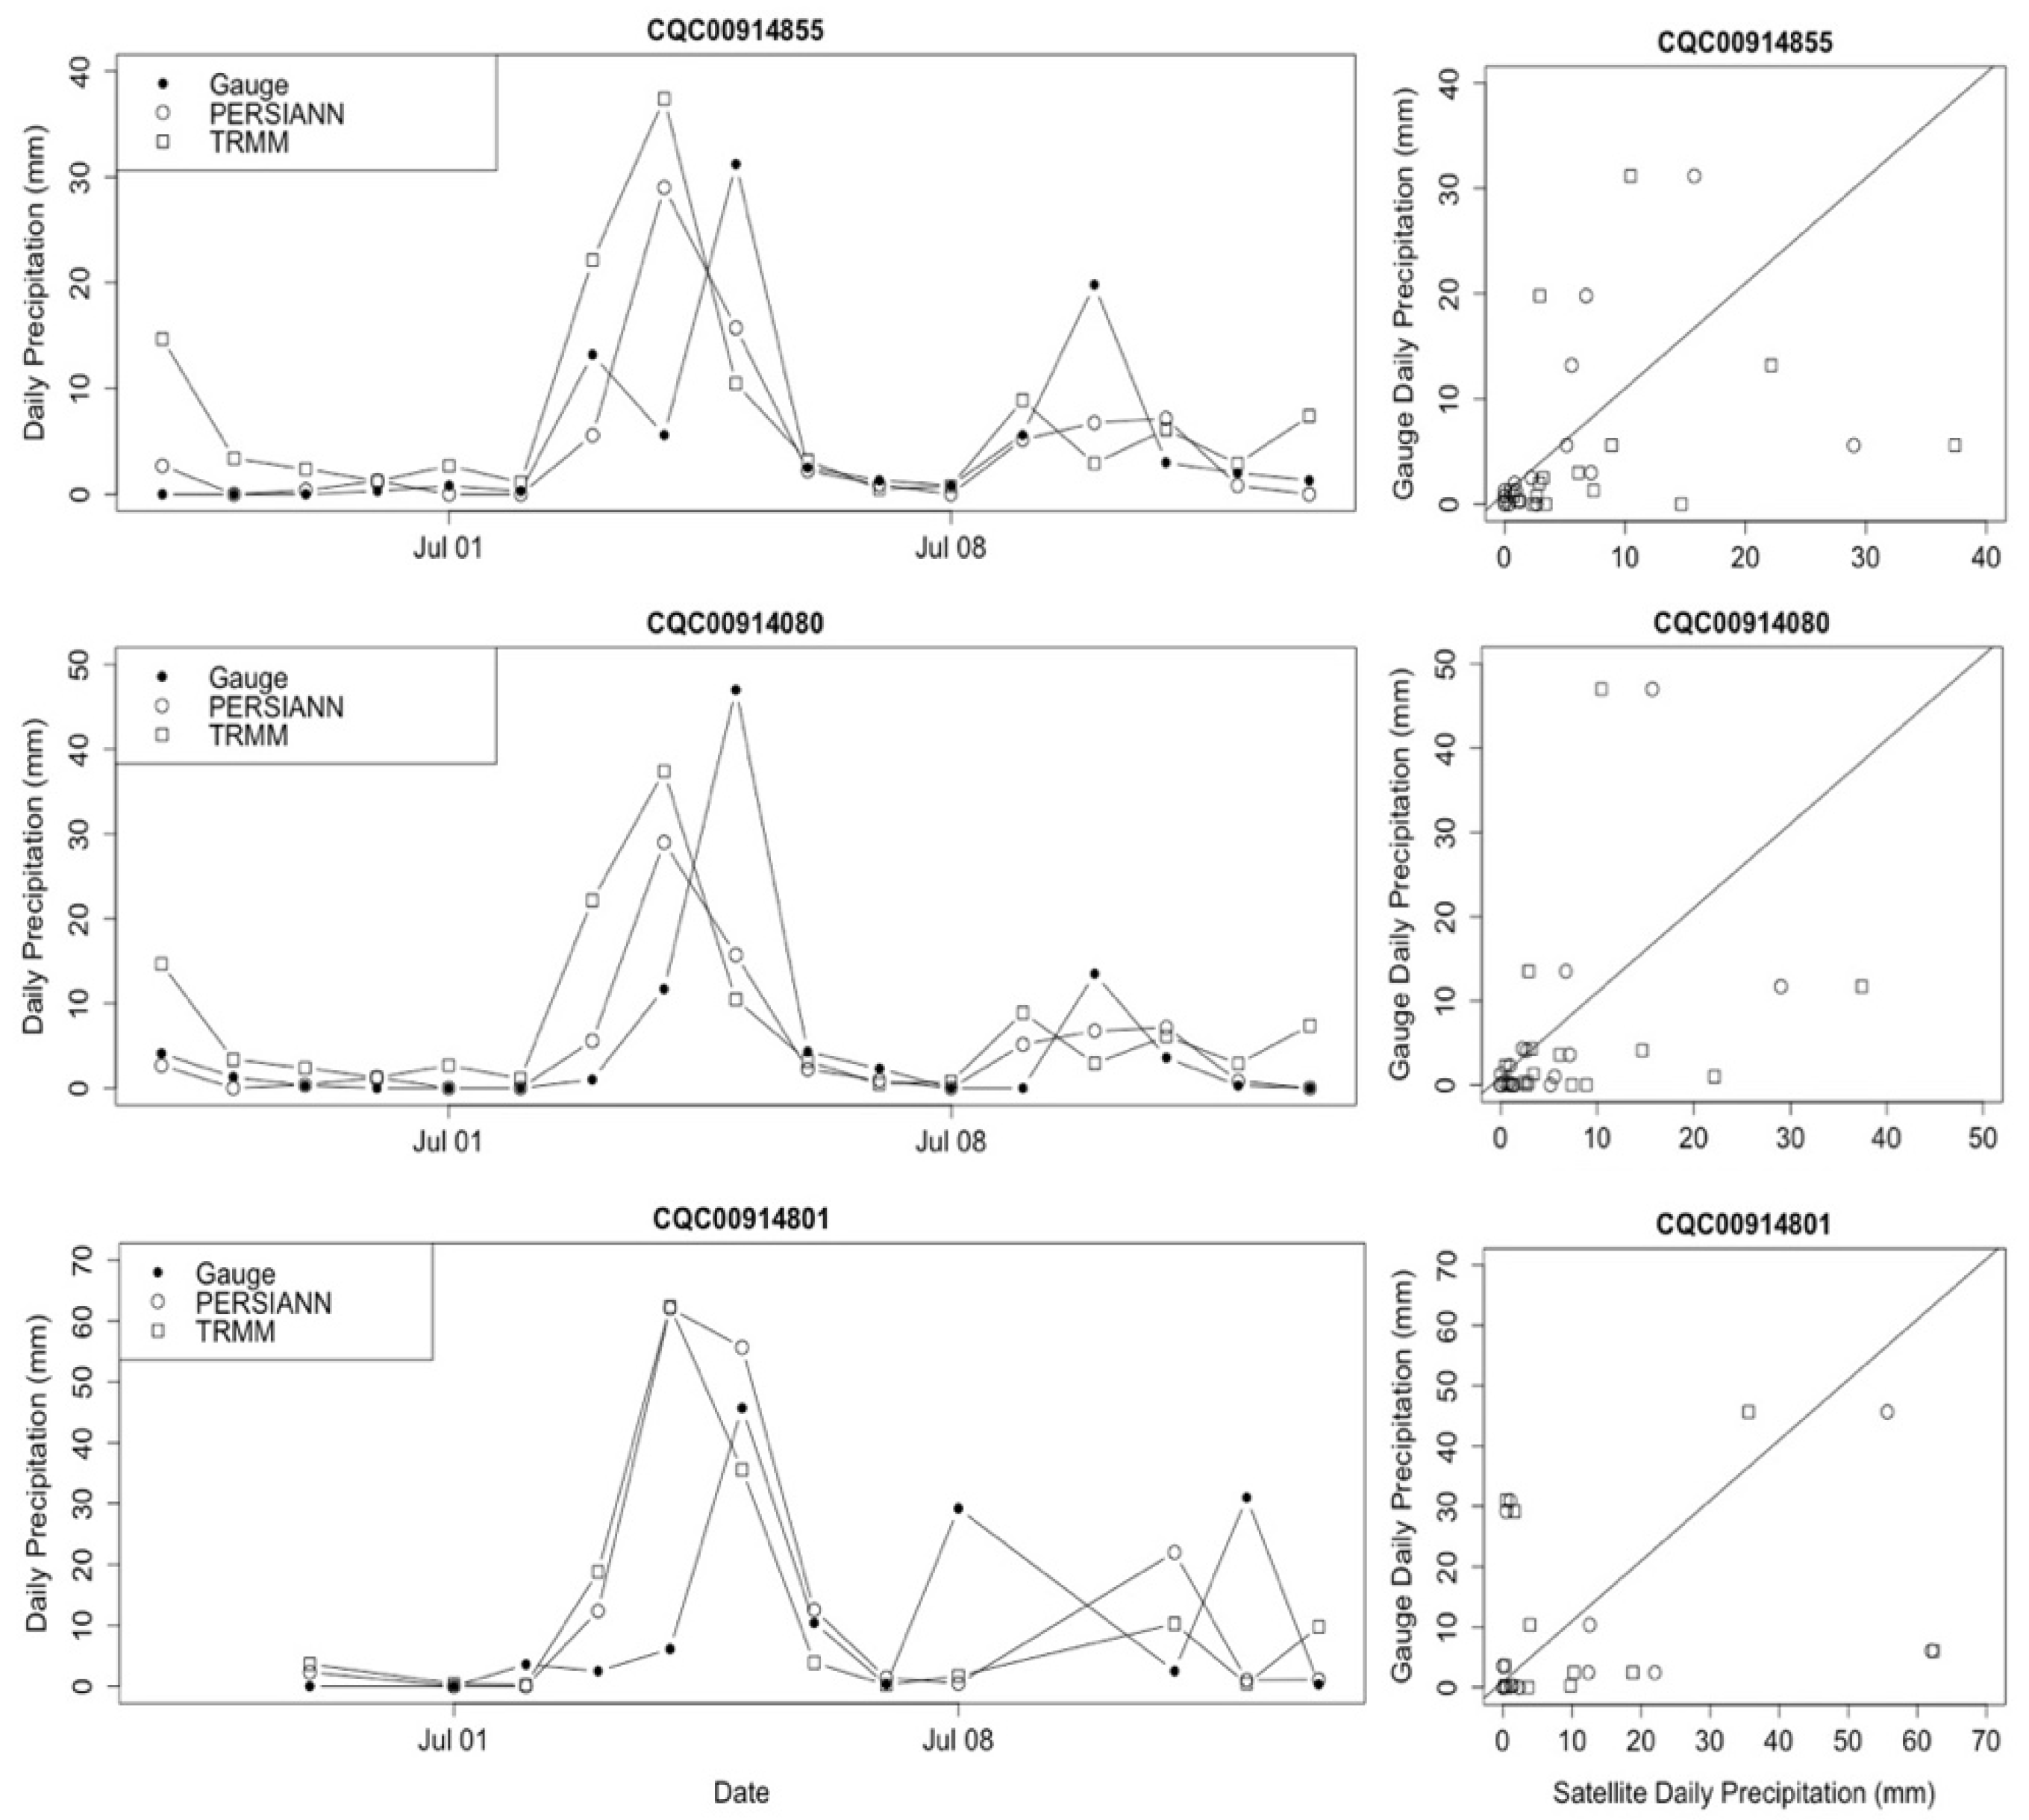
When the analysis was performed using specific in situ rain gauges close to the typhoon track, more variation was explained, but only at specific stations. The cumulative rainfall from TRMM TMPA, PERSIANN, and the in situ rain gauges for the 2002 Typhoon Chataan are shown in Figure 8 and Figure 9. As can be seen in the figures, there was spatial variation between the PERSIANN and TRMM TMPA estimates, with PERSIANN estimating higher precipitation values in many areas within the AOI (Figure 8). Furthermore, the cumulative in situ precipitation did not reach the same amount of precipitation from the satellites, although this was due to the locations of the stations. The highest cumulative precipitation value from the satellite estimates occurred (spatially) outside of the best track of the 2002 Typhoon Chataan (see Figure 2), to the west of the Philippines. The highest cumulative precipitation value from the in situ gauges occurred in Japan (Figure 8). To gain a better understanding of precipitation within the track of the 2002 Typhoon Chataan, analysis was conducted using a subset of stations (Figure 9c,d). The differences in precipitation estimates are more obvious in Figure 9, where a smaller spatial extent is shown. The extent shown in Figure 9 shows a dramatic change in precipitation from the southwest to the northeast direction. There are very clear differences and similarities in precipitation between PERSIANN and TRMM TMPA. The similarities include the “boundary” of the 2002 Typhoon Chataan path in the northeast extent of the map (Figure 9a,b) and the high cumulative precipitation in the southwest extent of the maps (Figure 9c,d). Some of the differences between PERSIANN and TRMM TMPA are highlighted within the best track portions of the maps, where there is an almost circular pattern for the PERSIANN estimates versus a more heterogeneous linear pattern for the TRMM TMPA estimates. Unfortunately, there are not many stations located within the area, but those that are fall across the “boundary”. Since the cumulative precipitation results shown in Figure 8 and Figure 9 do not show how the precipitation values varied across the duration of the typhoon, time series plots with inset scatterplots are provided to provide a precipitation comparison (Figure 10 and Figure 11). The time series and scatterplots provided are for all of the stations within the extent of Figure 9c,d for which more than 50% of the data were available during the typhoon. Stations CQC00914855 (15.12°N, 145.72°E), CQC00914080 (15.21°N, 145.75°E), and CQC00914801 (14.17°N, 145.24°E) are all stations that are located north of the boundary of the 2002 Typhoon Chataan, as seen in Figure 9. The elevation and annual precipitation vary in Figure 7. Scatterplots of satellite precipitation and in situ gauge precipitation during the 2004 Typhoon Ting-Ting (left) show value ranges across the stations from 66 m to 252 m and 1802 mm/year to 2385 mm/year (Table 2). Due to the track of the typhoon, the daily precipitation was lower at these stations than the stations located further south (compare Figure 10 and Figure 11). Stations GQW00041415 (13.48°N, 144.80°E), GQC00914468 (13.45°N, 144.80°E), and GQC00914025 (13.58°N, 144.93°E) are all located on the island of Guam, which is within the track of the typhoon. Elevation ranged from 18 m to 190 m and annual precipitation ranged from 2469 mm/year to 2554 mm/year at these stations (Table 4). Since these stations were located within the typhoon track, there were much higher daily cumulative precipitation measurements and estimates (Figure 11). There was greater variation in rainfall from 3 July through 6 July, when the typhoon crossed over Guam. Interestingly, TRMM TMPA estimated higher precipitation on 4 July 2002, while the in situ gauges measured higher precipitation on 5 July (GQQ00041415 and GQC00914025 in Figure 11) and 6 July 2002 (GQC00914468 on Figure 11). The most variation explained by the satellite estimates was from PERSIANN (r2 = 0.615, p-value < 0.05) at station GQC00914025 (Figure 11). TRMM TMPA only explained at most 12% of the variation in in situ rainfall values from the same station, but the result was not significant (Table 5).
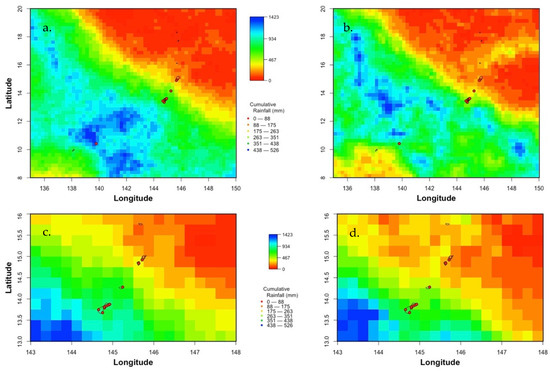
Figure 9.
Cumulative rainfall values from PERSIANN (a,c) and TRMM (b,d) at two different spatial scales during the 2002 Typhoon Chataan.
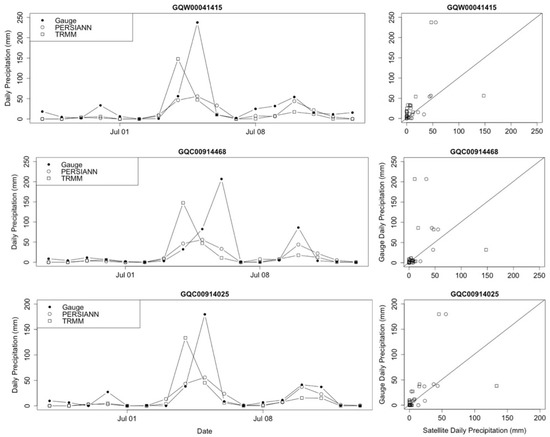
Figure 10.
Time series and scatterplots of daily cumulative precipitation for in situ gauges (GQW00041415, GQC00914468, GQC00914025), PERSIANN, and TRMM TMPA during the 2002 Typhoon Chataan.

Figure 11.
Time series and scatterplots of daily cumulative precipitation for in situ gauges (CQC00914855, CQC00914080, CQC00914801), PERSIANN, and TRMM TMPA during the 2002 Typhoon Chataan.
Table 5.
R-squared values for daily cumulative rainfall estimates during the 2002 Typhoon Chataan for PERSIANN and TRMM TMPA.
4. Discussion
Developing a better understanding of precipitation variation during typhoons is of the utmost importance in understanding the effects that these typhoons have on communities and the global climate [38]. However, determining which precipitation estimates are more accurate and should be used in specific instances (i.e., terrestrial vs. aquatic, mountainous vs. flat terrain) is no easy task. In this paper, comparisons were made between two well-known and commonly used precipitation datasets to understand precipitation variation from 2000 to 2018 and during twenty-five typhoons in the Western North Pacific. This was achieved by comparing precipitation results from in situ rain gauges with rainfall results from satellites.
Satellite-derived precipitation estimates from PERSIANN and TRMM TMPA explained approximately 20% of the variation (RMSE ~ 14 mm) in daily precipitation, 50% of the variation (RMSE ~ 40 mm) in weekly cumulative precipitation, and approximately 72% of the variation (RMSE ~ 85 mm) in monthly cumulative precipitation during the study period (March 2000–December 2018) when using stations located within the best track area. The correlation coefficients were 0.41 and 0.43 for daily precipitation, 0.754 and 0.691 for weekly cumulative precipitation, and 0.825 and 0.803 for monthly cumulative precipitation for TRMM TMPA and PERSIANN, respectively. These results are comparable to other similar comparisons of PERSIANN and TRMM TMPA to in situ rainfall estimates [39]. Ayugi et~al., 2019 [39] obtained RMSE values ranging from 44 mm to 110 mm for PERSIANN and TRMM TMPA. The root mean square error values for PERSIANN and TRMM TMPA at daily, weekly, and monthly time scales varied across stations, with the highest values being more than 150 mm at the monthly time scale. These results are comparable with other research studies comparing PERSIANN and TRMM TMPA to in situ rainfall estimates [39].
Due to the lack of spatial coverage and temporal coverage of in situ rainfall measurements close to the typhoon best track data, at most 35% (TRMM TMPA) or 46% (PERSIANN) of the variation in in situ rainfall was explained by satellite estimates. However, being able to explain 35% of the variation using TRMM TMPA or PERSIANN during a typhoon was a higher rate than at the daily time scale for values from all available stations. When the analysis was completed using only stations close to the best track for the entire duration of a typhoon, 62% of the variation was explained, which was comparable to the weekly and monthly cumulative comparisons. While 62% of the variation does not seem high, it is much higher than expected given the estimates were made during the 2002 Typhoon Chataan. While being able to use in situ gauges to accurately estimate precipitation during typhoons is ideal, this is very unlikely in the Western North Pacific due to the locations of the stations. We focused attention on the 2002 Typhoon Chataan to highlight the potential accuracy of satellite precipitation estimates had stations are located within a typhoon track. However, most of the stations available that with enough data were not located in the tracks of the typhoons. This means that it is of the utmost importance to better understand the typhoon events by utilizing precipitation values from satellite remote sensing data in the Western North Pacific.
Our results show that there have been reductions in the average number of typhoons per year from 1959 to the present day and per month during the months of August, September, and October, which in some ways contradicts some studies. Specifically, we see a contradiction with the study by Stowasser et~al., 2007 [40]. In their study, they modelled tropical cyclones under warmer conditions. They utilized the same best track data that we used with the starting year of 1970 (versus 1959 for our study) and found more tropical storms from 1971 to 2003 than from 1991 to 2000. However, it is important to recognize that we only utilized typhoon data and not all tropical cyclones. Additionally, we only utilized best track data and no modelled data, and the study period was different. According to previous research, these changes were likely due to multi-decadal oscillations in sea surface temperature (SST) [41] and sea level pressure [42] in the region. Chan [41] showed that during years with higher SST, there was a higher frequency of intense typhoons because of more convection. While the intensity of a typhoon is not always indicative of the amount of precipitation associated with the typhoon, often warm temperatures result in higher precipitation from typhoons in the Western North Pacific [43]. Further investigation is needed to determine whether having less typhoons in the Western North Pacific means less precipitation or more precipitation. However, past research suggest that precipitation is becoming more extreme and persisting longer. Research conducted by Tu and Chou (2013) [44] and Chu et al. (2014) [45] looked at changes in precipitation over Taiwan and showed that the frequency of rainfall events follows a decreasing trend for non-typhoon events versus an increasing trend for typhoon events.
Based on our research, we obtained promising results using satellite remote sensing products to estimate precipitation during typhoons. Our results showed good agreement between satellite precipitation and in situ gauge precipitation when there were gauges located within the best tracks of the typhoons. In fact, during specific typhoons with gauge data from locations within the best track, the results were better than for the overall comparison of daily precipitation estimates across the entire study period of 2000–2018. However, there were more times that a typhoon passed over an area with no gauges available to make a comparison. As such, it is very important to recognize that comparing satellite estimates to in situ gauges is not always possible to determine the accuracy of satellite remote sensing products. As stated in the introduction, generally for satellite remote sensing precipitation estimates to be considered accurate and precise, they need to be comparable and equivalent to in situ rain gauges. This is the approach we used to determine which product estimated precipitation more accurately. However, in these types of situations where accurate representations of precipitation are needed in areas where no in situ rain gauges are located, satellite remote sensing products need to carry more weight and be trusted. To build this trust, more comparisons are needed of remotely sensed precipitation estimates during normal and extreme events to determine how precipitation is changing. Two recent studies that we would like to highlight in this regard are those Guzman and Jiang [23] and Yang et al. [46]. Guzman and Jiang (2021) very recently published a paper in Nature Communications showing a global increase in the tropical cyclone rain rate from 1998 to 2016 using only NASA TRMM TMPA data. They concluded that the positive trend in precipitation over time was due to increases in sea surface temperature and total precipitable water. They were able to look at precipitation during tropical cyclones in all active ocean basins across the study period. They found that the greatest changes in precipitation occurred in the Western North Pacific. Furthermore, they found that the inner-core rainfall rate decreased while there was increased rainfall in the rainband region. Additionally, in a recent study by Yang et al. (2021), the authors found that the storm intensity greatly influenced where the precipitation fell and the amount of precipitation using satellite remote sensing products. Yang et al. used a new approach involving the characteristics of tropical cyclones to understand precipitation. Precipitation data from the TRMM satellite sensor have been extensively used in the past over land surfaces to quantify extremes [47] and have been compared to data from rain gauges in India [48], the United States [49], and Vietnam [13].
We need to continue to build upon this knowledge repository of precipitation during extreme events by using multiple remotely sensed products and in situ gauges (when available) across spatial and temporal scales.
Author Contributions
Conceptualization, J.R.P.S., methodology, J.R.P.S., A.J., V.L. and K.L., software, J.R.P.S. and A.J.; formal analysis, J.R.P.S.; investigation, J.R.P.S., A.J. and K.L.; resources, J.R.P.S.; data curation, J.R.P.S., A.J., and K.L.; writing—original draft preparation, J.R.P.S.; writing—review and editing, J.R.P.S., V.L., A.J.; visualization, J.R.P.S.; funding acquisition, J.R.P.S. and A.J. All authors have read and agreed to the published version of the manuscript.
Funding
This research received no external funding.
Institutional Review Board Statement
Not applicable.
Informed Consent Statement
Not applicable.
Acknowledgments
We would like to acknowledge Berry College and the Berry College School of Mathematical and Natural Sciences for providing funding through the Richards Science Scholars grant to support this project.
Conflicts of Interest
The authors declare no conflict of interest.
References
- Galloway, J.N.; Cowling, E.B. The effects of precipitation on aquatic and terrestrial ecosystems: A proposed precipitation chemistry network. J. Air Pollut. Control Assoc. 1987, 28, 229–235. [Google Scholar] [CrossRef] [Green Version]
- Lobell, D.B.; Schlenker, W.; Costa-Roberts, J. Climate trends and global crop production since 1980. Science 2011, 333, 616–620. [Google Scholar] [CrossRef] [PubMed] [Green Version]
- Alexander, L.V.; Zhang, X.; Peterson, T.C.; Caesar, J.; Gleason, B.; Klein Tank, A.M.G.; Haylock, M.; Collins, D.; Trewin, B.; Rahimzadeh, F.; et al. Global observed changes in daily climate extremes of temperature and precipitation. J. Geophys. Res. Atmos. 2006, 111, D05109. [Google Scholar] [CrossRef] [Green Version]
- Strangeways, I. A history of rain gauges. Weather 2010, 65, 311. [Google Scholar] [CrossRef]
- Karl, T.R.; Knight, R.W.; Plummer, N. Trends in high-frequency climate variability in the twentieth century. Nature 1995, 377, 217–220. [Google Scholar] [CrossRef]
- Xie, P.; Arkin, P.A. Global precipitaiton: A 17-year monthly analysis based on gauge observations satellite estimates and numerical model outputs. Bull. Am. Meterol. Soc. 1997, 78, 2539–2558. [Google Scholar] [CrossRef]
- Hou, A.Y.; Kakar, R.K.; Neeck, S.; Azarbarzin, A.A.; Kummerow, C.D.; Kojima, M.; Oki, R.; Nakamura, K.; Iguchi, T. The global precipitation measurement mission. Bull. Am. Meterol. Soc. 2014, 95, 701–722. [Google Scholar] [CrossRef]
- Kummerow, C.; Barnes, W.; Kozu, T.; Shiue, J.; Simpson, J. The tropcial rainfall measuring mission (TRMM TMPA) sensor package. J. Atmos. Ocean. Technol. 1998, 15, 809–817. [Google Scholar] [CrossRef]
- Sorooshian, S.K.; Aghakouchak, A.; Arkin, P.; Eylander, J.; Foufoula-Georgiou, E.; Harmon, R.; Hendrickx, J.M.; Imam, B.; Kuligowski, R.; Skahill, B.; et al. Advancing the remote sensing of precipitation. Bull. Am. Meteorol. Soc. 2011, 92, 1271–1272. [Google Scholar] [CrossRef]
- Sorooshian, S.; Hsu, K.; Braithwaite, D.; Ashouri, H. NOAA Climate Data Record (CDR) of Precipitation Estimation from Remotely Sensed Information Using Artificial Neural Networks (PERSIANN-CDR), Version 1, Revision 1; NOAA National Centers for Environmental Information: Boulder, CO, USA, 2014. Available online: https://www.ncei.noaa.gov/metadata/geoportal/rest/metadata/item/gov.noaa.ncdc:C00854/html# (accessed on 22 September 2020).
- Ebert, E.E.; Janowiak, J.E.; Kidd, C. Comparison of near-real-time precipitaiton estimates from satellite observations and numerical models. Bull. Am. Meteorol. Soc. 2007, 88, 47–64. [Google Scholar] [CrossRef] [Green Version]
- Chen, M.; Xie, P.; Janowiak, J.E.; Arkin, P. Global land precipitation: A 50-yr monthly analysis based on gauge observations. J. Hydrometeorol. 2002, 3, 249–266. [Google Scholar] [CrossRef]
- Le, H.M.; Sutton, J.R.; Bui, D.D.; Bolten, J.D.; Lakshmi, V. Comparison and bias correction of TMPA precipitaiton products over the lower part of Red-Thai Binh River Basin of Vietnam. Remote Sens. 2018, 10, 1582. [Google Scholar] [CrossRef] [Green Version]
- Ashouri, H.; Hsu, K.; Sorooshian, S.; Braithwaite, D.K.; Knapp, K.R.; Cecil, L.D.; Nelson, B.R.; Prat, O.P. PERSIANN-CDR: Daily precipitation climate data record for mulisatellite observations for hydrological and climate studies. Bull. Am. Meteorol. Soc. 2015, 96, 69–83. [Google Scholar] [CrossRef] [Green Version]
- Michaelides, S.; Levizzani, V.; Anagnostou, E.; Bauer, P.; Kasparis, T.; Lane, J.E. Precipitation: Measurement, remote sensing, climatology and modeling. Atmos. Res. 2009, 94, 512–533. [Google Scholar] [CrossRef]
- Pollock, M.D.; O’Donnell, G.; Quinn, P.; Dutton, M.; Black, A.; Wilkinson, M.E.; Colli, M.; Stagnaro, M.; Lanza, L.G.; Lewis, E.; et al. Quantifying and mitigating wind—Induced undercatch in rainfall measurements. Water Resour. Res. 2018, 54, 3863–3875. [Google Scholar] [CrossRef]
- Wu, W.; McInnes, K.; O’Grady, J.; Hoeke, R.; Leonard, M.; Westra, S. Mapping dependence between extreme rainfall and storm surge. J. Geophys. Res. Oceans 2018, 123, 2461–2474. [Google Scholar] [CrossRef]
- Bartsotas, N.S.; Anagnostou, E.N.; Nikolopoulos, E.L.; Kallos, G. Investigating satellite precipitation uncertainity over complex terrain. J. Geophys. Res. Atmos. 2018, 123, 5346–5359. [Google Scholar] [CrossRef]
- Petty, G.W.; Krajewski, W.F. Satellite estimation of precipitaiton over land. Hydrol. Sci. 1996, 4, 433–451. [Google Scholar] [CrossRef]
- Nguyen, P.; Sellars, S.; Thorstensen, A.; Tao, Y.; Ashouri, H.; Braithwaite, D.; Hsu, K.; Sorooshian, S. Satellites track precipitation of super typhoon Haiyan. Eos 2014, 95, 133–135. [Google Scholar] [CrossRef]
- Lonfat, M.; Marks, F.D.; Chen, S.S. Precipitation distribution in tropical cyclones using the tropical rainfall measuring mission (TRMM TMPA) microwave imager: A global prespective. Mon. Weather Rev. 2004, 132, 1645–1660. [Google Scholar] [CrossRef]
- Feng, X.; Shu, S. How do weak tropical cyclones produce heavy rainfall when making landfall over China. J. Geophys. Res. Atmos. 2018, 123, 830–848. [Google Scholar] [CrossRef]
- Guzman, O.; Jiang, H. Global increase in tropical cyclone rain rate. Nat. Commun. 2021, 12, 5344. [Google Scholar] [CrossRef] [PubMed]
- Holden, W.; Marshall, S.J. Chapter 24—Climate change and typhoons in the Philippines: Extreme weather events in the Anthropocene. In Integrating Disaster Science and Management; Elsevier: Cambridge, MA, USA, 2018; pp. 407–421. [Google Scholar]
- Kang, N.Y.; Elsner, J.B. Climate mechanism for strong typhoons in a warmer world. J. Clim. 2016, 29, 1051–1057. [Google Scholar] [CrossRef] [Green Version]
- Bushnell, J.M.; Cherrett, R.C.; Falvey, R.J. Annual Tropical Cyclone Report. 2018. Available online: http://www.metoc.navy.mil/jtwc/products/atcr/2018atcr.pdf (accessed on 7 June 2021).
- Chu, J.H.; Levine, A.; Daida, S.; Schiber, D.; Fukada, E.; Sampson, C.R. Western North Pacific Ocean Best Track Data. Available online: https://www.metoc.navy.mil/jtwc/jtwc.html?western-pacific (accessed on 4 February 2020).
- Frank, W.M. The structure and energetics of the tropical cyclone. Part I: Storm structure. Mon. Weather Rev. 1977, 105, 1119–1135. [Google Scholar] [CrossRef]
- Holland, G.J. The maximum potential intensity of tropical cyclones. J. Atmos. Sci. 1997, 54, 2519–2541. [Google Scholar] [CrossRef]
- Miller, B.I. Rainfall rates in Florida hurricanes. Mon. Weather Rev. 1958, 86, 258–264. [Google Scholar] [CrossRef]
- Lawrimore, J.H.; Menne, M.J.; Gleason, B.E.; Williams, B.E.; Wuertz, C.N.; Vose, R.S.; Rennie, J. Global historical climatology network—Monthly (GHCN-M), Version 3. J. Geophys. Res. Atmos. 2011, 116, D19121. [Google Scholar] [CrossRef]
- Goddard Earth Sciences Data and Information Services Center. TRMM TMPA Near Real-Time Precipitation L3 1 Day 0.25 Degree X 0.25 Degree V7; Goddard Earth Sciences Data and Information Services Center (GES DISC): Greenbelt, MD, USA, 2016.
- Sorooshian, S.; Hsu, K.-L.; Gao, X.; Gupta, H.V.; Imam, B.; Braithwaite, D. Evaluation of PERSIANN system satellite–based estimates of tropical rainfall. Bull. Am. Meteorol. Soc. 2000, 81, 2035–2046. [Google Scholar] [CrossRef] [Green Version]
- Janowiak, J.E.; Kousky, V.E.; Joyce, R.J. Diurnal cycle of precipitation determined from the CMORPH high spatial and temporal resolution global precipitation analysis. J. Geophys. Res. 2005, 110, 2005. [Google Scholar]
- Su, F.; Hong, Y.; Lettenmaier, D.P. Evaluation of TRMM multisatellite precipitation analysis (TMPA) and its utility in hydrologic prediction in the La Plata Basin. J. Hydrometeorol. 2008, 9, 622–640. [Google Scholar] [CrossRef] [Green Version]
- Koo, M.S.; Hong, S.Y.; Kim, J. An evaluation of the tropical rainfall measuring mission (TRMM TMPA) multi-satellite precipitation analysis (TMPA) data over South Korea. Asia Pac. J. Atmos. Sci. 2009, 45, 256–282. [Google Scholar]
- Huffman, G.J.; Bolvin, D.T.; Nelkin, E.J.; Wolff, B.D.; Adler, R.F.; Gu, G.; Hong, Y.; Bowman, K.P.; Stocker, E.F. The TRMM TMPA multisatellite precipitation analysis (TMPA): Quasi-global, multiyear, combined-sensor precipitation estimates at fine scales. J. Hydrometerol. 2007, 8, 38–55. [Google Scholar] [CrossRef]
- Jiang, H.; Zipser, E.J. Contribution of tropical cyclones to the global precipitation from eight seasons of TRMM TMPA data: Regional, seasonal, and interannual variations. J. Clim. 2010, 23, 1526–1543. [Google Scholar] [CrossRef]
- Ayugi, B.; Tan, G.; Ullah, W.; Boiyo, R.; Ongoma, V. Inter-comparison of remotely sensed precipitation datasets over Kenya during 1998–2016. Atmos. Res. 2019, 225, 96–109. [Google Scholar] [CrossRef]
- Stowasser, M.; Wang, Y.; Hamilton, K. Tropical cyclone changes int the Western North Pacific in a global warming scenario. J. Clim. 2007, 20, 2378–2396. [Google Scholar] [CrossRef] [Green Version]
- Chan, J.C. Decadal variations of intense typhoon the western North Pacific. Proc. R. Soc. 2008, 464, 249–272. [Google Scholar] [CrossRef]
- Latif, M.; Barnett, T.P. Causes of decadal climate variability over the North Pacific and North America. Science 1994, 266, 634–637. [Google Scholar] [CrossRef] [Green Version]
- Rodgers, E.B.; Adler, R.F.; Pierce, H.F. Contribution of tropical cyclones to the North Pacific climatological rainfall as observed from satellites. J. Appl. Meteorol. 2000, 39, 1658–1678. [Google Scholar] [CrossRef] [Green Version]
- Tu, J.-Y.; Chou, C. Changes in precipitation frequency and intensity in the vicinity of Taiwan: Typhoon versus non-typhoon events. Environ. Res. Lett. 2013, 8, 14023. [Google Scholar] [CrossRef]
- Chu, P.-S.; Chen, D.-J.; Lin, P.-L. Trends in precipitation extremes during the typhoon season in Taiwan over the last 60 years. Atmos. Sci. Lett. 2013, 15, 37–43. [Google Scholar] [CrossRef]
- Yang, S.; Lao, V.; Bankert, R.; Whitcomb, T.R.; Cossuth, J. Improved climatology of tropical cyclone precipitation from satellite passive microwave measurements. J. Clim. 2021, 34, 4521–4537. [Google Scholar] [CrossRef]
- Libertino, A.; Sharma, A.; Lakshmi, V.; Claps, P. A global assessment of the timing of extreme rainfall from TRMM and GPM for improving hydrologic design. Environ. Res. Lett. 2016, 11, 54003. [Google Scholar] [CrossRef]
- Hashemi, H.; Nordin, M.; Lakshmi, V.; Huffman, G.; Knight, R. Bias correction of long-term satellite monthly precipitation product (TRMM 3B43) over the conterminous United States. J. Hydrometeorol. 2017, 18, 2491–2509. [Google Scholar] [CrossRef]
- Mondal, A.; Lakshmi, V.; Hashemi, H. Intercomparison of trend analysis of multi-satellite monthly precipitation products and gage measurements for river basins of India. J. Hydrol. 2018, 565, 779–790. [Google Scholar] [CrossRef]


Publisher’s Note: MDPI stays neutral with regard to jurisdictional claims in published maps and institutional affiliations. |
© 2022 by the authors. Licensee MDPI, Basel, Switzerland. This article is an open access article distributed under the terms and conditions of the Creative Commons Attribution (CC BY) license (https://creativecommons.org/licenses/by/4.0/).