
Validation of CrIS Radiometric Performance through Its Comparison to ABI


Abstract
:1. Introduction
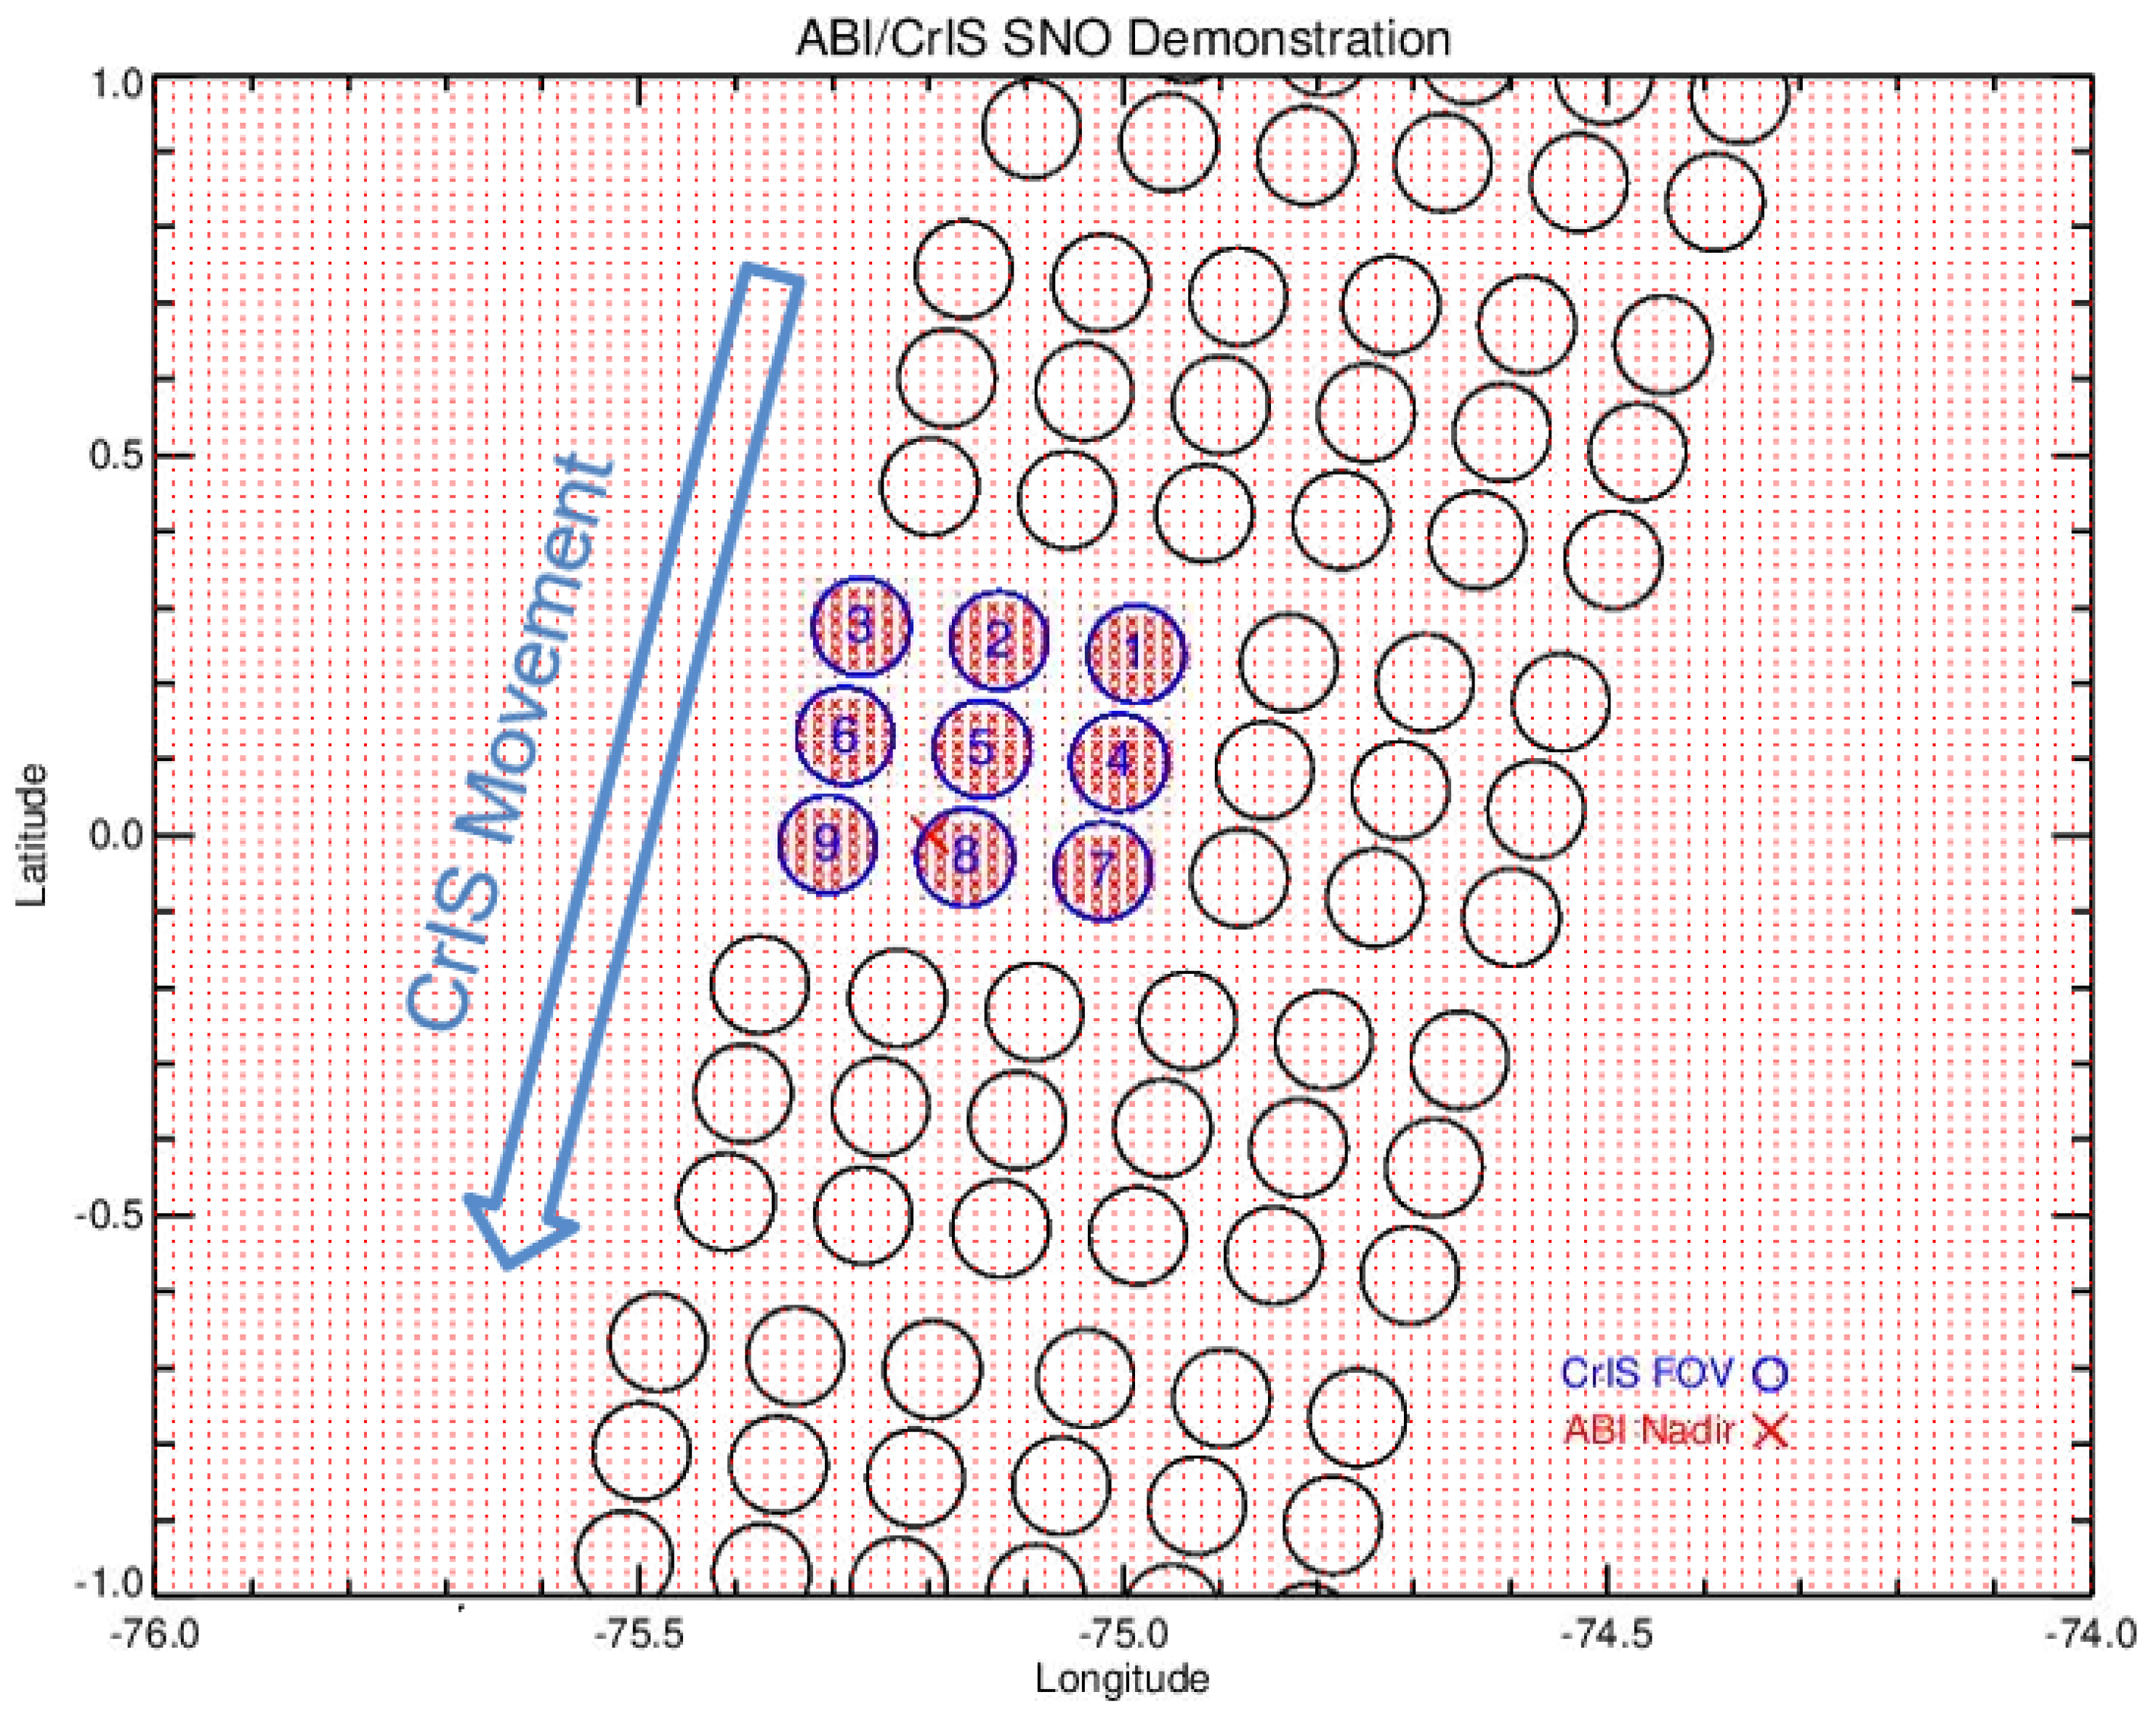
2. Methodology
3. Results
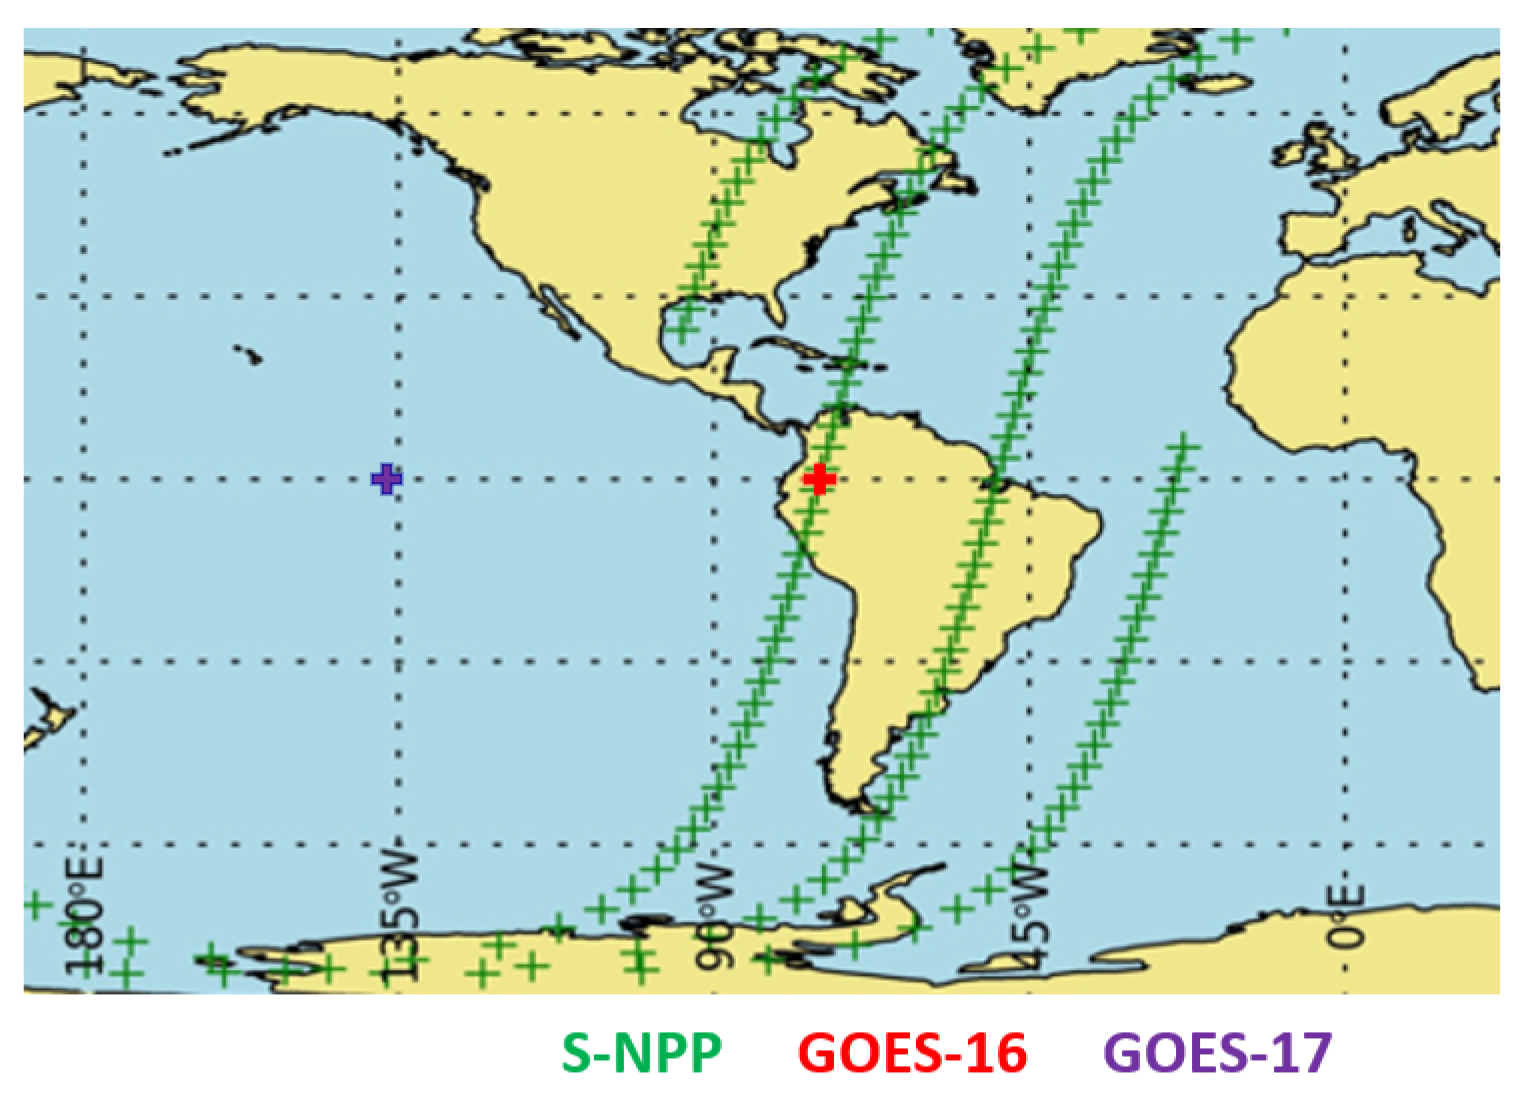
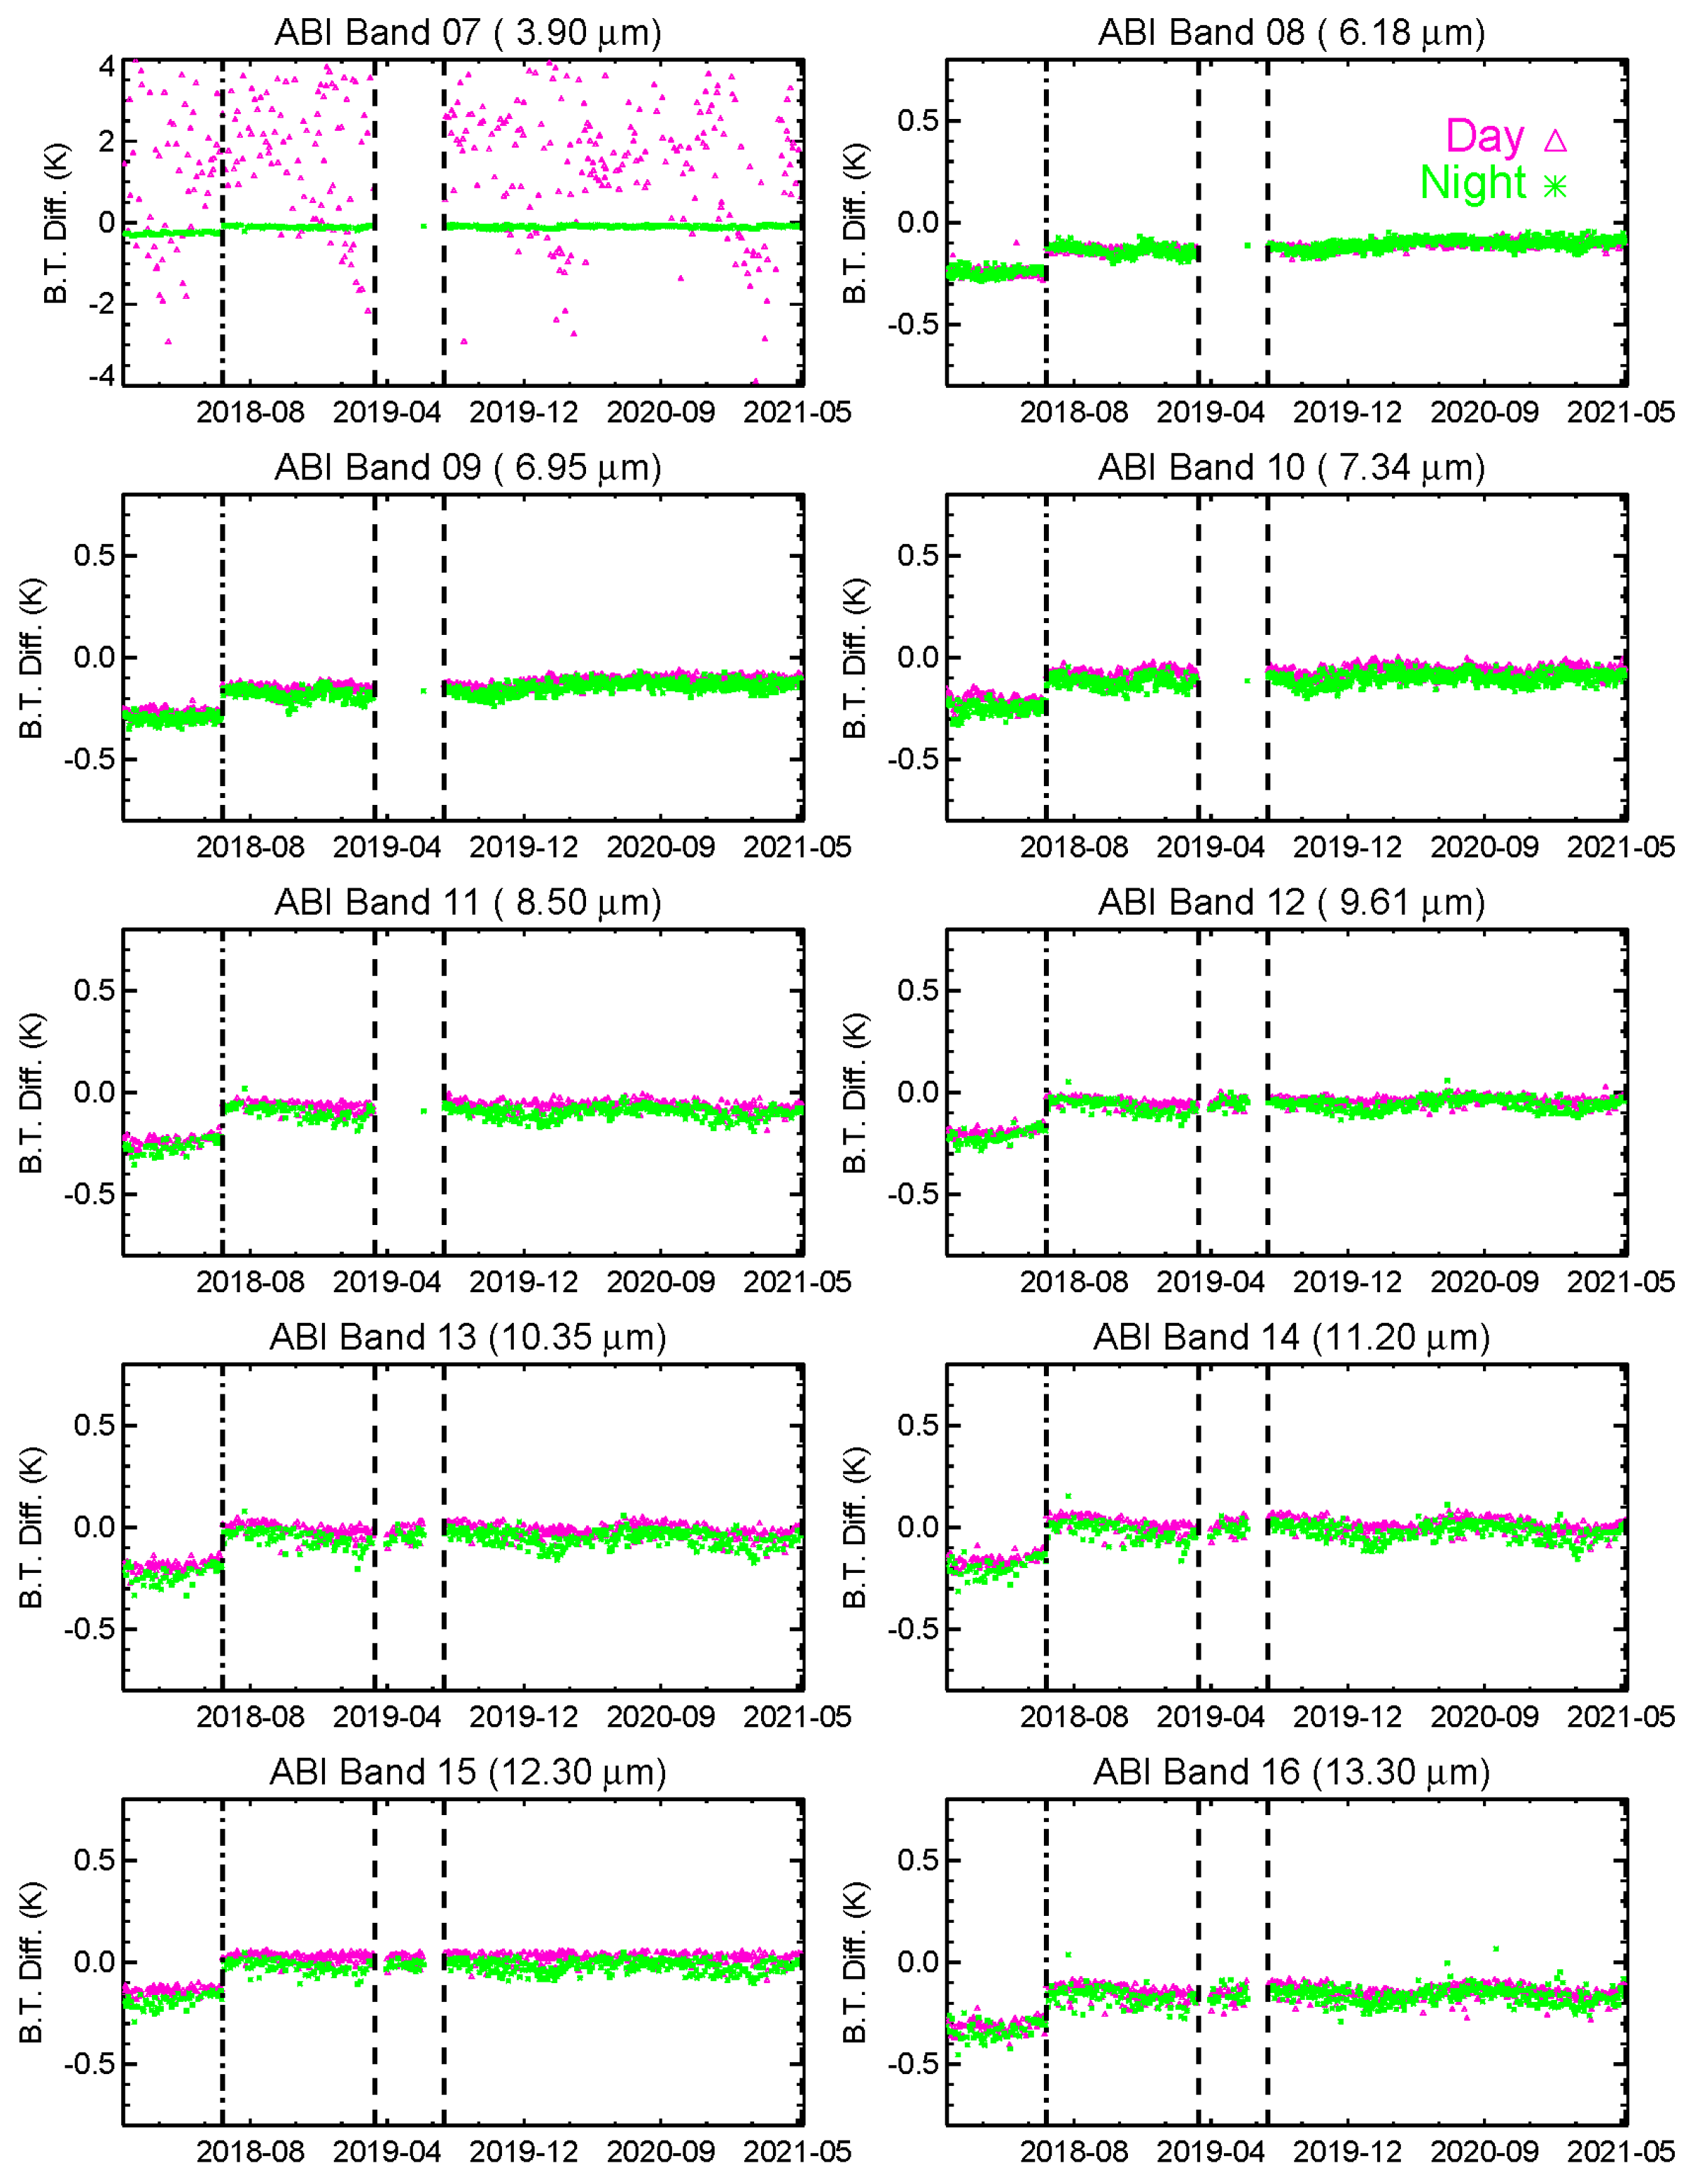
3.1. CrIS vs. GOES-16 ABI
3.2. CrIS vs. GOES-17 ABI
3.3. S-NPP CrIS vs. NOAA-20 CrIS through Double Difference
3.4. Uncertainty
4. Applications in Assessing CrIS Anomalies
4.1. SDR Quality during S-NPP LWIR Failure
4.2. Impact of Lunar Intrusion
5. Conclusions
Author Contributions
Funding
Institutional Review Board Statement
Informed Consent Statement
Data Availability Statement
Acknowledgments
Conflicts of Interest
References
- Heidinger, A.K.; Cao, C.; Sullivan, J.T. Using Moderate Resolution Imaging Spectrometer (MODIS) to calibrate advanced very high resolution radiometer reflectance channels. J. Geophys. Res. Atmos. 2002, 107. [Google Scholar] [CrossRef] [Green Version]
- Han, Y.; Revercomb, H.; Cromp, M.; Gu, D.; Johnson, D.; Mooney, D.; Scott, D.; Strow, L.; Bingham, G.; Borg, L.; et al. Suomi NPP CrIS measurements, sensor data record algorithm, calibration and validation activities, and record data quality. J. Geophys. Res. Atmos. 2013, 118, 12734–12748. [Google Scholar] [CrossRef]
- Han, Y.; Chen, Y. Calibration algorithm for cross-track infrared sounder full spectral resolution measurements. IEEE Trans. Geosci. Remote Sens. 2018, 56, 1008–1016. [Google Scholar] [CrossRef]
- Strow, L.L.; Motteler, H.; Tobin, D.; Revercomb, H.; Hannon, S.; Buijs, H.; Predina, J.; Suwinski, L.; Glumb, R. Spectral calibration and validation of the Cross-track Infrared Sounder on the Suomi-NPP satellite. J. Geophys. Res. Atmos. 2013, 118, 12486–12496. [Google Scholar] [CrossRef]
- Eresmaa, R.; Letertre-Danczak, J.; Lupu, C.; Bormann, N.; McNally, A.P. The assimilation of Cross-track Infrared Sounder radiances at ECMWF. Q. J. R. Meteorol. Soc. 2017, 143, 3177–3188. [Google Scholar] [CrossRef]
- Dahoui, M.; Isaksen, L.; Radnot, G. Assessing the impact of observations using observation-minus-forecast residuals. ECMWF Newsl. 2017, 152, 27–31. [Google Scholar]
- Goldberg, M.; Ohring, G.; Butler, J.; Cao, C.; Datla, R.; Doelling, D.; Gartner, V.; Hewison, T. The global space-based inter-calibration system. Bull. Am. Meteorol. Soc. 2011, 92, 467–475. [Google Scholar] [CrossRef]
- Chen, Y.; Tremblay, D.; Wang, L.; Iturbide-Sanchez, F. Improved Lunar Intrusion Detection Algorithm for the CrIS Sensor Data Record. IEEE Trans. Geosci. Remote Sens. 2019, 58, 1134–1145. [Google Scholar] [CrossRef]
- Iturbide-Sanchez, F.; Wang, Z.; Zhang, K.; Tremblay, D.; Lynch, E.; Beierle, P.; Chen, Y. Toward high-quality and long-term stability S-NPP and NOAA-20 cross-track infrared sounder sensor data record products. In Proceedings of the 2021 IEEE International Geoscience & Remote Sensing Symposium, Online, 14 October 2021. [Google Scholar]
- Schmit, T.J.; Gunshor, M.M.; Menzel, W.P.; Gurka, J.J.; Li, J.; Bachmeier, A.S. Introducing the Next-generation Advanced Baseline Imager on GOES-R. Bull. Am. Meteorol. Soc. 2005, 86, 1079–1096. [Google Scholar] [CrossRef]
- Kalluri, S.; Alcala, C.; Carr, J.; Griffith, P.; Lebair, W.; Lindsey, D.; Race, R.; Wu, X.; Zierk, S. From Photons to Pixels: Processing Data from the Advanced Baseline Imager. Remote Sens. 2018, 10, 177. [Google Scholar] [CrossRef] [Green Version]
- Schmit, T.J.; Lindstrom, S.S.; Gerth, J.J.; Gunshor, M.M. Applications of the 16 Spectral Bands on the Advanced Baseline Imager (ABI). J. Oper. Meteorol. 2018, 6, 33–46. [Google Scholar] [CrossRef]
- Xiong, X.; Wu, A.; Wenny, B.N.; Madhavan, S.; Wang, Z.; Li, Y.; Chen, N.; Barnes, W.L.; Salomonson, V.V. Terra and Aqua MODIS Thermal Emissive Bands On-Orbit Calibration and Performance. IEEE Trans. Geosci. Remote Sens. 2015, 53, 5709–5721. [Google Scholar] [CrossRef]
- Cao, C.; Xiong, J.; Blonski, S.; Liu, Q.; Uprety, S.; Shao, X.; Bai, Y.; Weng, F. Suomi NPP VIIRS sensor data record verification, validation, and long-term performance monitoring. J. Geophys. Res. Atmos. 2013, 118, 11664–11678. [Google Scholar] [CrossRef]
- Xiong, X.; Butler, J.; Chiang, K.; Efremova, B.; Fulbright, J.; Lei, N.; McIntire, J.; Oudrari, H.; Sun, J.; Wang, Z.; et al. VIIRS on-orbit calibration methodology and performance. J. Geophys. Res. Atmos. 2013, 119, 5065–5078. [Google Scholar] [CrossRef]
- Wang, Z.; Iturbide-Sanchez, F.; Chen, Y.; Lynch, E.; Beierle, P. Assessment of Radiometric Calibration Consistency between CrIS and ABI IR Bands through Intercomparison. In Proceedings of the 101th AMS Annual Meeting, Online, 14 January 2021. [Google Scholar]
- Jin, X.; Yan, B.; Sun, N.; Iturbide-Sanchez, F. Improving SNPP and NOAA-20 CrIS LTM Intersensor Radiometric Bias Assessment by Using Interpolating ABI Measurements as Transfer. In Proceedings of the 101th AMS Annual Meeting, Online, 14 January 2021. [Google Scholar]
- Wang, L.; Sun, N.; Yan, B. NOAA ICVS/GSICS Recent Updates for GEO-LEO IR Inter- Calibration. In Proceedings of the GSICS Annual Meeting, Online, 8 April 2021. [Google Scholar]
- NOAA GOES-R CWG. Available online: https://www.star.nesdis.noaa.gov/GOESCal/index.php (accessed on 4 January 2022).
- Hewison, T.J.; Wu, X.; Yu, F.; Tahara, Y.; Hu, X.; Kim, D.; Koenig, M. GSICS Inter-Calibration of Infrared Channels of Geostationary Imagers Using Metop/IASI. IEEE Trans. Geosci. Remote Sens. 2013, 51, 1160–1170. [Google Scholar] [CrossRef]
- NOAA CLASS. Available online: https://www.class.noaa.gov/ (accessed on 4 January 2022).
- GOES-R Series Product Definition and Users’ Guide. 2018. Available online: https://www.goes-r.gov/resources/docs.html (accessed on 4 January 2022).
- Xu, H.; Chen, Y.; Wang, L. Cross-Track Infrared Sounder Spectral Gap Filling Toward Improving Intercalibration Uncertainties. IEEE Trans. Geosci. Remote Sens. 2018, 57, 509–519. [Google Scholar] [CrossRef]
- Yu, F.; Wu, X.; Yoo, H.; Qian, H.; Shao, X.; Wang, Z.; Iacovazzi, R. Radiometric calibration accuracy and stability of GOES-16 ABI Infrared radiance. J. Appl. Remote Sens. 2021, 15, 048504. [Google Scholar] [CrossRef]
- Iturbide-Sanchez, F.; Strow, L.; Tobin, D.; Strow, L.; Wang, L.; Mooney, D.L.; Johnson, D. Recalibration and Assessment of the SNPP CrIS Instrument: A Successful History of Restoration After Midwave Infrared Band Anomaly. IEEE Trans. Geosci. Remote Sens. 2022, 60, 1–21. [Google Scholar] [CrossRef]
- Naarden, J.V.; Lindsey, D. Saving GOES-17. 2019. Available online: https://aerospaceamerica.aiaa.org/departments/saving-goes-17 (accessed on 4 January 2022).
- Wang, Z.; Wu, X.; Yu, F.; Fulbright, J.P.; Kline, E.; Yoo, H.; Schmit, T.J.; Gunshor, M.M.; Coakley, M.; Black, M.; et al. On-orbit calibration and characterization of GOES-17 ABI IR bands under dynamic thermal condition. J. Appl. Remote Sens. 2020, 14, 034527. [Google Scholar] [CrossRef]


| Band | Wavelength (m) | Resolution (km) | Typical Applications |
|---|---|---|---|
| 1 | 0.47 | 1 | Aerosols |
| 2 | 0.64 | 0.5 | Clouds |
| 3 | 0.86 | 1 | Vegetation |
| 4 | 1.38 | 2 | Cirrus |
| 5 | 1.6 | 1 | Snow/ice discrimination, cloud phase |
| 6 | 2.2 | 2 | Cloud particle size, snow, cloud phase |
| 7 | 3.9 | 2 | Fog, stratus, fire, winds |
| 8 | 6.2 | 2 | High-level water vapor, rainfall, winds |
| 9 | 6.9 | 2 | Mid-level water vapor, rainfall, winds |
| 10 | 7.3 | 2 | Low-level water vapor, winds |
| 11 | 8.4 | 2 | Cloud-top phase, dust, rainfall |
| 12 | 9.6 | 2 | Total column ozone, turbulence |
| 13 | 10.3 | 2 | Clouds, surface |
| 14 | 11.2 | 2 | Clouds, sea surface temperatures |
| 15 | 12.3 | 2 | Clouds, sea surface temperatures |
| 16 | 13.3 | 2 | Cloud-top pressure |
| Step | Description | Input | Output |
|---|---|---|---|
| 1 | Download selected CrIS/ABI radiance files | NOAA SCDR/CLASS | subset of radiance files containing collocated scenes |
| 2 | Collocate ABI pixels and CrIS FOVs for comparison | CrIS/ABI geolocation | CrIS spectrum (S) and ABI radiance (L) at the collocated scenes |
| 3 | Pre-process S | coefficients of gap-filling, Hamming apodization | gap-filled, apodized S |
| 4 | Emulate L from S | ABI SRF | emulated ABI radiance (L) |
| 5 | Spatially aggregate L at CrIS FOV | L | aggregated ABI radiance at CrIS FOV (L) |
| 6 | Differentiate L and L | - | CrIS/ABI radiance bias |
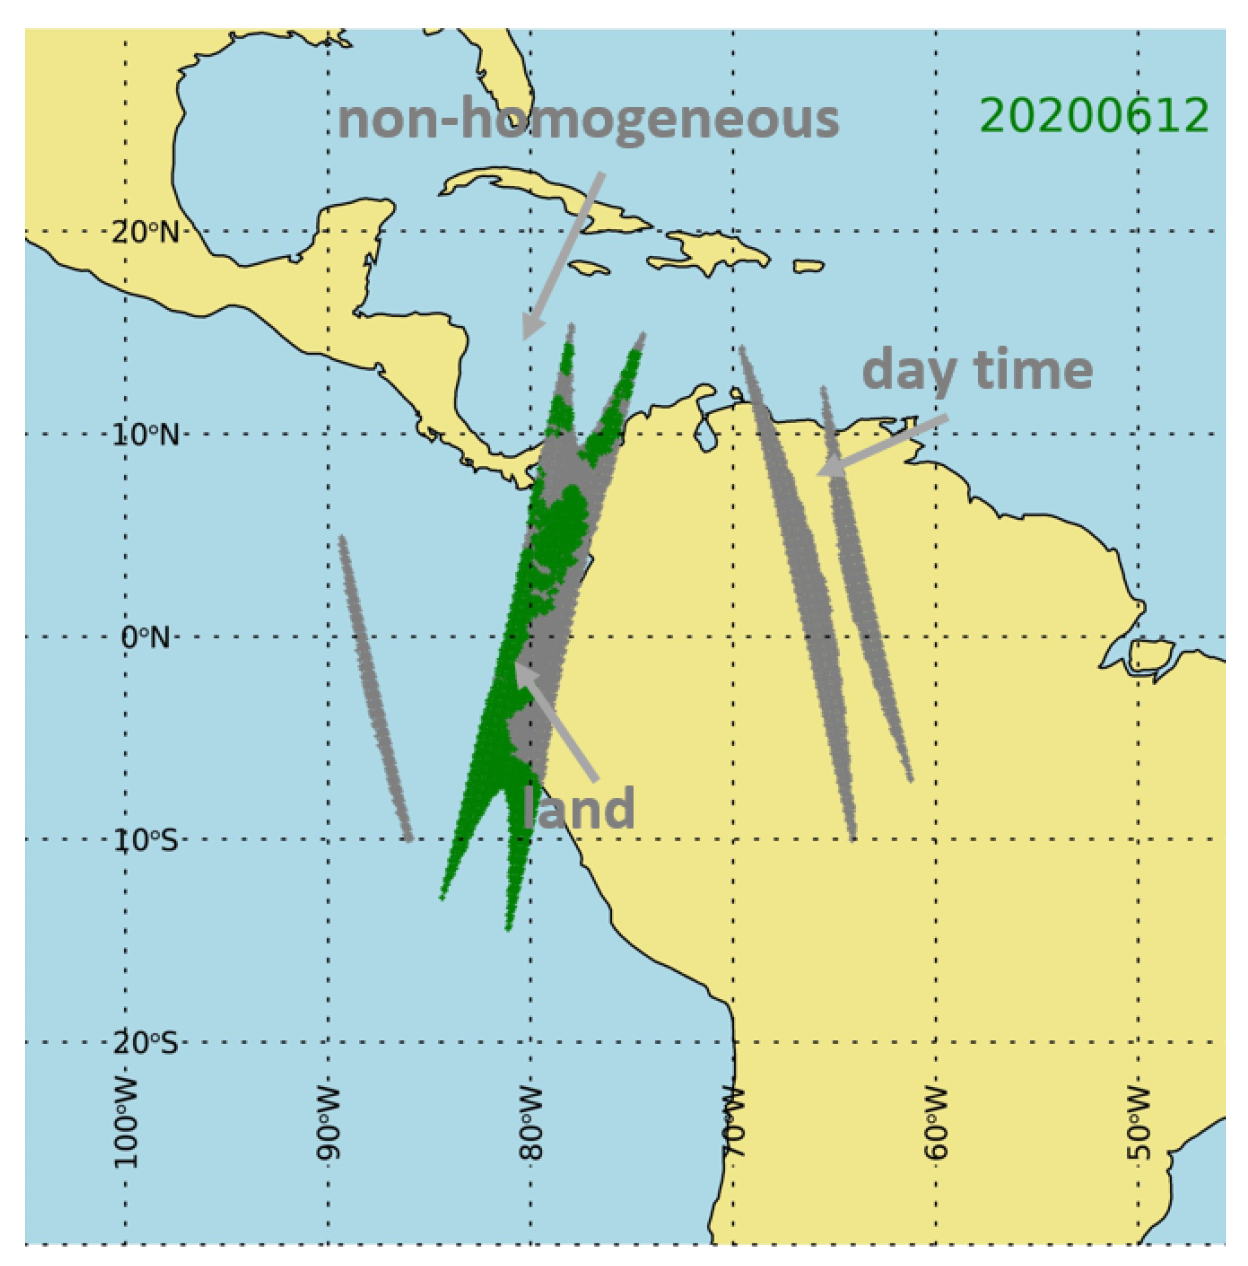
| 7 | Filter out “bad” scenes | global surface-type map | final products of intercomparison |
| Criteria | Thresholds |
|---|---|
| Range of CrIS scan angle (in CrIS FOR number) | 12–19 |
| Scene homogeneity (K) | 0.5 |
| Observation time Diff. (s) | 240 |
| Scene type | Ocean |
| Local zenith angle (LZA) Diff. cos(1)−cos(2) | 0.001 |
| Minimum number of pixels per day | 200 |
| ABI Band | ABI-CrIS Bias (Mean, K) | ABI-CrIS Bias (Stddev, K) |
|---|---|---|
| 7 | −0.10 | 0.08 |
| 8 | −0.10 | 0.09 |
| 9 | −0.13 | 0.08 |
| 10 | −0.10 | 0.08 |
| 11 | -0.10 | 0.09 |
| 12 | −0.05 | 0.10 |
| 13 | −0.06 | 0.10 |
| 14 | −0.02 | 0.11 |
| 15 | −0.02 | 0.10 |
| 16 | -0.16 | 0.12 |
Publisher’s Note: MDPI stays neutral with regard to jurisdictional claims in published maps and institutional affiliations. |
© 2022 by the authors. Licensee MDPI, Basel, Switzerland. This article is an open access article distributed under the terms and conditions of the Creative Commons Attribution (CC BY) license (https://creativecommons.org/licenses/by/4.0/).
Share and Cite
Wang, Z.; Iturbide-Sanchez, F.; Beierle, P.; Zhang, K.; Tremblay, D. Validation of CrIS Radiometric Performance through Its Comparison to ABI. Remote Sens. 2022, 14, 876. https://doi.org/10.3390/rs14040876
Wang Z, Iturbide-Sanchez F, Beierle P, Zhang K, Tremblay D. Validation of CrIS Radiometric Performance through Its Comparison to ABI. Remote Sensing. 2022; 14(4):876. https://doi.org/10.3390/rs14040876
Chicago/Turabian StyleWang, Zhipeng, Flavio Iturbide-Sanchez, Peter Beierle, Kun Zhang, and Denis Tremblay. 2022. "Validation of CrIS Radiometric Performance through Its Comparison to ABI" Remote Sensing 14, no. 4: 876. https://doi.org/10.3390/rs14040876
APA StyleWang, Z., Iturbide-Sanchez, F., Beierle, P., Zhang, K., & Tremblay, D. (2022). Validation of CrIS Radiometric Performance through Its Comparison to ABI. Remote Sensing, 14(4), 876. https://doi.org/10.3390/rs14040876