Abstract
Surface albedo exerts substantial control over the energy available for glacier melting. For Urumqi Glacier No.1 in the Tien Shan Mountains, China, represented as a “summer accumulation” glacier, the variations in albedo driven by surface processes are complex and still poorly understood. In this study, we examined the interannual trends in ablation-period albedo from 2000 to 2021 using MOD10A1 products, evaluated the variation in bare-ice albedo retrieved from 13 end-of-summer Landsat images obtained between 2002 and 2019, and investigated the seasonal variation and diurnal cycle of surface albedo collected near the equilibrium line of the glacier by an AWS from September 2018 to August 2021. During the period of 2000–2021, the average ablation-period albedo presented a slight but not statistically significant downward trend, with a total decrease of 1.87%. Specifically, the decrease in glacier albedo was quicker in July than that in August, and there was a slight increase in May and June. The blackening phenomenon was shown on the east branch glacier, but not on the west branch glacier. For seasonal variability, a bimodal pattern was demonstrated, different from the unimodal seasonal variation in other midlatitude glaciers. The albedo peaks occurred in December and April or May. Under clear sky conditions, the diurnal cycle presented three patterns: a symmetric pattern, an asymmetric pattern, and a progressive decreasing pattern. Air temperature and solid precipitation are the main drivers of variations in glacier albedo, but in different periods of the ablation season, two climate variables affect albedo to varying degrees. The effect of surface albedo reduction enhanced glacier melting by about 20% over the past 20 years. The short-term increase in albedo caused by summer snowfall can considerably reduce glacier melting by as much as 80% in June.
1. Introduction
In arid and semi-arid regions, glaciers and their meltwater play an important role in the regulation of river runoff, and constitute the material and cultural basis for the sustainable development of populations, resources, ecology, the environment, and the socio-economy [1,2,3]. The current accelerated glacier retreat poses far-reaching challenges to water resources and nature conservation in arid and semi-arid regions. To gain insight into the role of glaciers in the hydrological processes of arid watersheds, we need to investigate the processes of glacier melting.
Glacier surface mass balance is the most direct and accurate parameter to determine the contribution of glaciers to regional water resources. Surface mass balance is determined by the snowfall and the melt energy provided by the surface energy balance. The shortwave radiation provides the primary melting energy source on midlatitude glaciers, and the value is as high as 80% or more [4,5,6,7]. The net shortwave radiation is controlled by the surface albedo, defined as the ratio of the reflected flux density to the incident flux density in the spectral range of 0.3 to 2.8 μm [8]. Therefore, surface albedo is a key factor to determine the energy balance at the glacier surface and its influence on the glacier mass balance and regional water resources. The decrease in surface albedo is considered one of the most crucial drivers for the accelerated recession of mountain glaciers [9]. The variability in glacier albedo is therefore important in accurate modelling of glacier melt, and will help to improve the understanding of glacier melting and runoff processes.
Enormous spatiotemporal variations in glacier surface albedo are observed, ranging from 0.9 for fresh snow or dry snow in the early stages of metamorphism, to about 0.5 for aged snow or firn, and 0.1 for impurity-rich ice that is covered in debris [10]. Moreover, variations in glacier surface albedo occur on multiple timescales. For example, multi-annual albedo variations can result from the changes in climatic conditions and the concentration of impurities in snow and ice [11,12,13]. Seasonal albedo evolution can occur as a result of the transition between snow and glacier ice at the glacier surface [14,15]. Daily or diurnal albedo variability can be caused by fresh snowfall or changes in cloud cover and solar zenith angle [16,17]. For glaciers distributed in arid and semi-arid regions, most accumulation and ablation happen synchronously in summer, and the variations in glacier albedo driven by these surface processes have considerable prominence. However, their characteristics of variations in surface albedo remain unclear.
In particular, for the phenomenon of a recent decrease in glacier-wide or ice albedo, or glacier darkening, the scale and rates of this darkening are still an open issue, and glacier darkening has been reported in several mountain ranges around the world. For example, in the Alps, Oerlemans et al. [11] reported that the accumulation of impurities caused a reduction in surface albedo of ~0.17 during the period 1996–2006, at the terminus of Vadret da Morteratsch, Switzerland. Fugazza et al. [18] declared new evidence of glacier darkening from Landsat observations in the Ortles-Cevedale group, Central Italian Alps, with an average of −0.003 yr−1. However, measurements of bare-ice albedo derived from Landsat imagery show no significant reduction on either a local or glacier-wide scale for 39 large glaciers in the western and southern Swiss Alps, where the negative trend in albedo was only clearly present over limited regions near glacier termini or along the lower margins of the glaciers [19]. Similarly, there was no evidence of “glacier darkening” during the period from 2002 to 2017 at the Haig Glacier in the Canadian Rocky Mountains [15].
Regarding the reasons for glacier darkening, two mechanisms have been primarily held responsible: higher temperatures and increased light-absorbing impurities [18]. The first results in an enhanced melt, a reduction in snow cover areas and exposure of bare ice, the acceleration of snow metamorphism, and the increase in liquid water content in the snow, promoting further glacier albedo positive feedback. Impurities directly reduce the glacier albedo. Observational data show that the Tien Shan Mountains, located in arid and semi-arid regions of Central Asia, experienced significant warming in 1960–2016, and between 2000 and 2016, the annual mean air temperature was its highest [20]. Moreover, glaciers in arid and semi-arid regions are generally surrounded by unconsolidated bare ground and even deserts, which provide abundant material sources of mineral dust deposition on glaciers [21,22]. Nevertheless, the occurrence as well as the scale and rates of glacier darkening are still indistinct in these areas.
To study the variations in glacier albedo under arid and semi-arid environments, Urumqi Glacier No.1 (abbreviated UG1) was selected for our long-term research, which is best observed for this region. In situ observations of surface albedo are presented for the period from 1 September 2018 to 31 August 2021 for a location near the equilibrium line of the glacier (elevation: 4050 m). We investigated the diurnal and seasonal cycle of surface albedo using these field measurements, examined the interannual trends in ablation-period albedo in 2000–2021 using MOD10A1 products, and evaluated the variation in bare-ice albedo retrieved from 13 end-of-summer Landsat images obtained between 2002 and 2019. Subsequently, we analyzed the processes governing different timescale variations in surface albedo, including surface conditions (surface hoar formations, melt/freeze cycles), air temperature, and solid precipitation. Then, we quantified the potential biases incurred by extrapolating instantaneous albedos (satellite measurements) to daily mean value, and evaluated the possible impact of albedo variation on glacier melting. Finally, our objectives are to (i) identify the characteristic of different timescale variations in surface albedo for the glaciers under arid and semi-arid environments and (ii) assess the potential effect of glacier albedo variation on glacier ablation.
2. Study Site
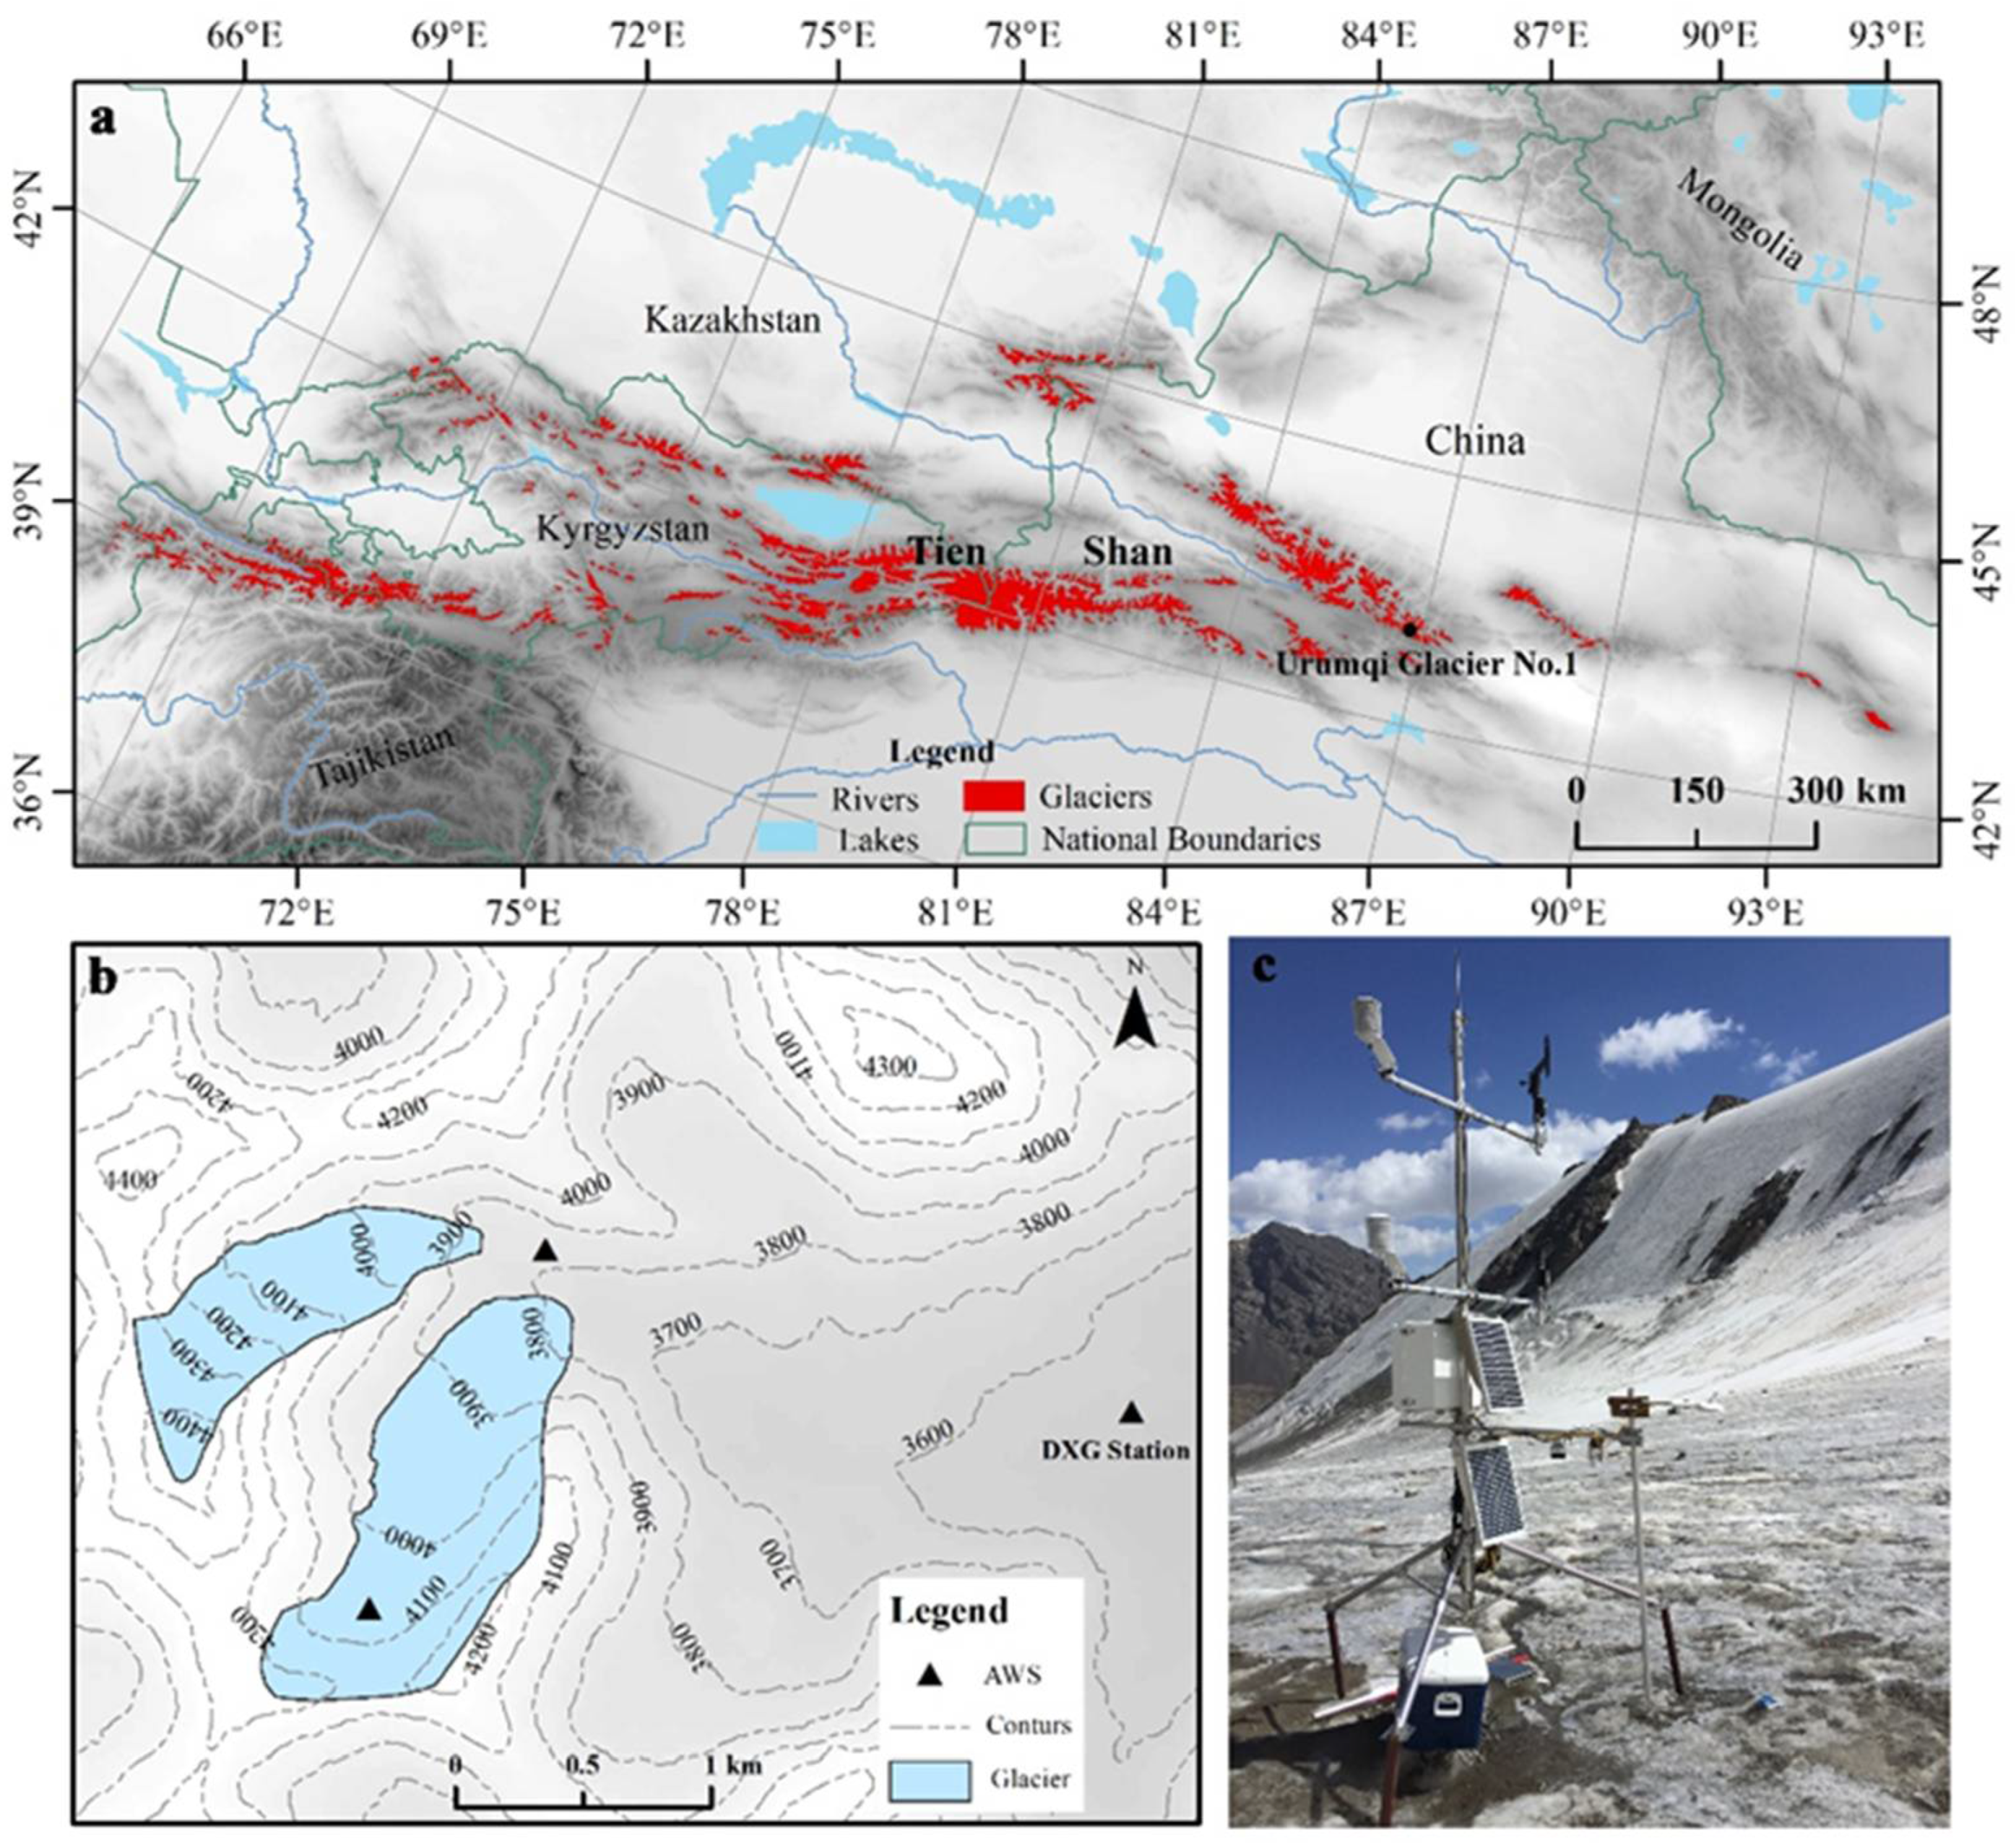
Urumqi Glacier No.1, situated in the middle of the Tien Shan Mountains, China (Figure 1a), is a valley glacier with a SW/NE orientation (Figure 1b). It is composed of two tributary glaciers, known as the east and west branches. According to the latest survey in August 2012, the east branch has a total area of 1.029 km2, and its highest and lowest points are 4225 and 3752 m a.s.l., respectively. The west branch has a total area of 0.589 km2, with highest and lowest points at 4445 and 3848 m a.s.l., respectively.
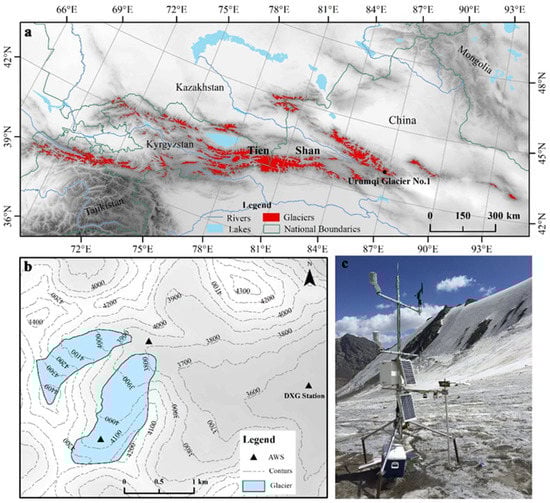
Figure 1.
Geographical location of Urumqi Glacier No.1 in Tien Shan, China, (a) and the positions of the three automatic weather stations (b). The picture of an on-glacier AWS taken on 15 August 2019 represents the bare ice surface during the ablation period (c).
To obtain up-to-date glacier outlines, a Landsat-8 image acquired on 13 August 2019 was selected. The glacier outlines were manually delineated and used for all subsequent analyses. As the outlines from 2019 are consistently used over time, they are constant, excluding grid pixels from the analysis that become ice-free towards the end of the study period, specifically pixels along the margins of a glacier.
The glacier is located in a region with a continental climate, which is cold and dry in winter, and warm and humid in summer. The primary feature of the atmospheric circulation is the mid-latitude westerly wind, although the area is also affected by the Siberian anticyclonic circulation and by cyclonic disturbances associated with the westerly wind flow [23]. The mean annual air temperature is around −5.0 °C, and the annual precipitation is around 460 mm, as recorded at the closest meteorological station (Daxigou Meteorological Station) at 3549 m.a.s.l. during the period 1959–2020 (Figure 1b). Over 78% of the annual total precipitation at higher elevations falls in solid form (snow, hail, sleet) between May and August [24].
Urumqi Glacier No.1 has been in constant recession since 1959, and especially over the past 30 years, when the glacier has shrunk more rapidly [9]. Field measurements on Urumqui Glacier No.1 over the past 60 years indicate a mean annual surface mass balance of −345 mm w.e., and an equilibrium line altitude (ELA) of 4050 m a.s.l. Both accumulation and ablation take place during the warmer season (May–August). As a result, the glacier is classified as being of the “summer accumulation” type.
3. Data and Methods
3.1. Broadband Albedo Derived from Satellite Data
3.1.1. MOD10A1 Products
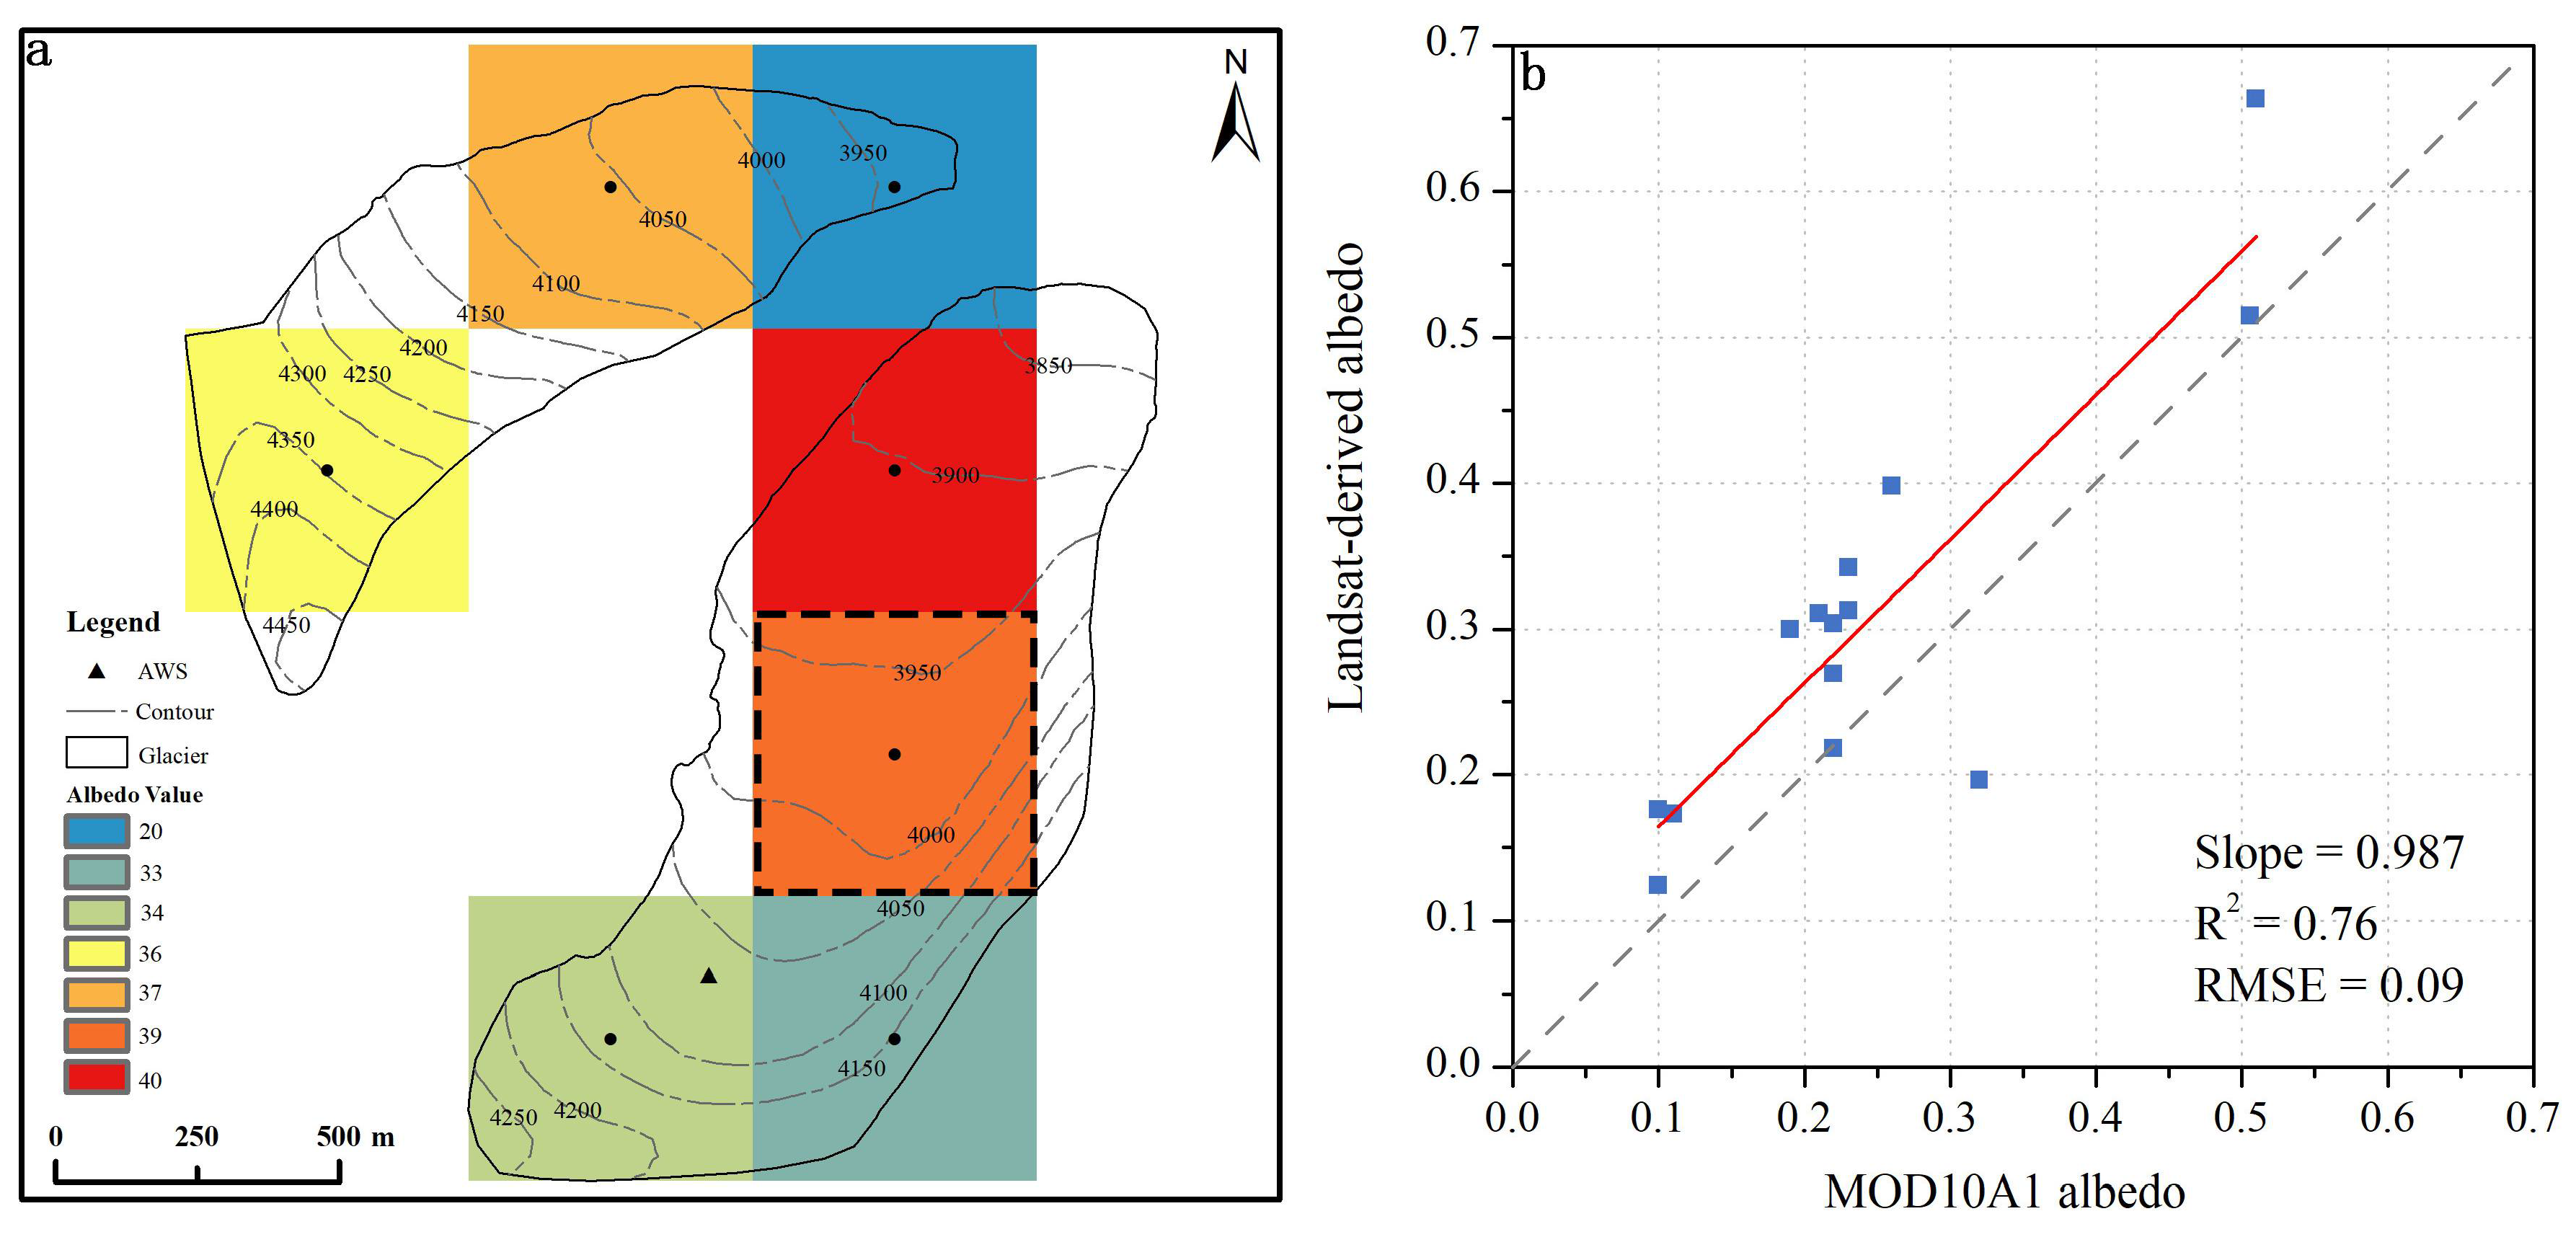
MOD10A1 products, which contain daily estimates of snow cover, as well as blue-sky albedo and a quality assessment of cloud-free conditions at 500 m spatial resolution, were used to evaluate the interannual variation in albedo during the ablation period (May–August). The derived blue-sky albedo, which corresponds to the broadband albedo for the actual direct and diffuse illumination [25], has been corrected for atmospheric effects and adjusted for snow and ice anisotropic scattering effects using the DIScrete Ordinates Radiative Transfer (DISORT) model over non-forested surface [26]. The DISORT approach, provided by Stamnes et al. [27], can be applied from the UV to the radar region of the electromagnetic spectrum, and the physical processes include thermal emission, scattering, absorption, and bidirectional reflection and emission at the lower boundary [27]. The optical properties needed for the DISORT model include snowpack optical thickness, single scattering albedo, and an asymmetry parameter or a description of the scattering phase function, which can be calculated with Mie theory using the refractive indices for ice and assuming an optically equivalent grain size [25]. In the snow albedo algorithm for MODIS, look-up tables of anisotropic reflectance factor values for all potential combinations of solar and sensor zenith angles and relative azimuths between the sensor and the sun are created using DISORT, and the anisotropic correction is implemented by taking into account local slope and aspect [25]. The satellite equipped with MODIS sensor crosses the equator at approximately 10:30 LT. The tile h24v04 covers the Urumqi Glacier No.1. The scope of this research was limited to the ablation period of Urumqi Glacier No.1, when the solar zenith angle ranges from 54° to 65°, and below the product’s stated accuracy of 75°, so no additional filtering was performed to remove data with high solar zenith angles [28,29]. In the current study, considering the biases induced by mixed pixels at the edge of and outside the glacier, only the pixels entirely within the glacier boundary were selected (Figure 2a). Furthermore, only images in which the albedo of selected pixels ranged from 0 to 100 were considered. Finally, 997 images were obtained from the National Aeronautics and Space Administration (NASA) during the ablation period of 2000–2021, ranging from 37 to 59 per year.

Figure 2.
(a) Example of a blue-sky albedo map retrieved by MODIS over Urumqi Glacier No.1 on 31 August 2021. The bold dashed line delimits the pixel used in this study. (b) The scatter plots of MOD10A1 albedo against the values retrieved from Landsat imagery.
Temporal aggregation was used with the MOD10A1 data to obtain the interannual trend in albedo. As described by Gunnarsson et al. [30], “the temporal aggregation range was set as the number of days backwards and forwards at each center date (t = 0) to merge to a single stack for further processing”. Here, we selected a temporal aggregation range of 5 d backward and forward (t = ±5 d); in total, 11 d can contribute data to each center date albedo.
3.1.2. Landsat Data
Landsat satellite imagery were chosen in this study to investigate variations in bare-ice albedo over multiple years (2002–2019). We used Landsat-5 Thematic Mapper (TM), Landsat-7 Enhanced TM Plus (ETM+), and Landsat-8 Operational Land Imager (OLI) imagery to obtain broadband shortwave albedo with spatial resolutions of 30 m. Detailed information about these snapshots can be obtained in the product guides provided by the USGS (https://earthexplorer.usgs.gov/ accessed on 20 September 2021). Imagery from late summer was preferentially selected to provide maximum information about the extent of the low albedo bare-ice zone. Unfortunately, in several years (2004, 2007, 2008, 2009, and 2017), expected images were not available because the glacier was completely obscured by temporary late summer snowfalls or by cloud cover. Overall, 13 images were used to investigate the interannual variability of bare-ice albedo (Table 1).

Table 1.
Overview of Landsat imagery used in this study. Bold values denote the images used to investigate the inter-annual variability of bare-ice albedo, and asterisks denote the images used to verify the retrieving albedo from satellites.
In addition, our broadband shortwave albedo approach required a digital elevation model. A 30 m resolution ASTER GDEM V2 (downloaded from http://earthexplorer.usgs.gov/ accessed on 20 September 2021) was used, which was acquired around the year 2000. The vertical and horizontal accuracies were 17 m and 26.5 m, respectively, in the study area at a 95% confidence level [31].
The broadband albedo was retrieved from Landsat imagery using the methodology first proposed by Klok et al. [32], including geolocation, radiometric calibration, atmospheric correction, topographic correction, anisotropic correction, and narrow to broadband conversion. The process of deriving surface albedo and its parameter selection are detailed in Yue et al. [33] for Urumqi Glacier No.1 and are only covered here in brief.
First, the registration between ASTER DEM and Landsat imagery was processed by manually selecting the same control point. Then, radiometric calibration and atmospheric correction were performed using Envi 5.3 software. The parameters for radiometric calibration can be obtained from the metadata file downloaded from the United States Geological Society (USGS) or obtained from the International Scientific Data Service Platform (CSDB). FLAASH atmospheric correction was applied to correct images of TOA radiance into maps of ground surface reflectance. Concerning topographic correction, an improved topographic correction approach based on the C-factor correction was selected. The anisotropic factor (f) is calculated for ice following Greuell and De Ruyter de Wildt [34] and for snow following Reijmer et al. [35] to convert the directional reflectance to spectral albedo. Finally, shortwave broadband albedo is retrieved using a narrowband to broadband conversion by Knap et al. [36], which was developed based on a large empirical data set and the band configurations of Landsat sensors.
This retrieval process has been repeatedly employed for several mountain glaciers, such as Morteratschgletscher, Switzerland [32]; Forni Glacier, Italy [37]; and Haut Glacier, Switzerland [38]. Because it takes into account all the essential processes that substantially affect the relationship between the reflectance properties of the glacier surface and the satellite signal, satisfactory agreement between the albedo measured in the field and the albedo retrieved from Landsat imagery was reported in these studies. These results suggest that the retrieval methodology generally produces accurate estimates of surface albedo.
The bare-ice area was recognized by visual interpretation, and we averaged albedo values of all available pixels over the entire bare-ice area for each year and branch glacier of Urumqi Glacier No.1. The spatial distribution of the surface albedo of Urumqi Glacier No.1 is shown in Supplementary Figure S1 over the whole study period.
3.2. Field Measurements
Meteorological measurements have been carried out on Urumqi Glacier No.1 since 1 September 2018 using an automatic weather station (AWS). The AWS is set up at 4050 m a.s.l., close to the glacier’s equilibrium line altitude (ELA) (Figure 1b). The measurements include but not are limited to air temperature, incoming and reflected shortwave radiation in the wavelength range of 0.3–2.8 μm, precipitation, glacier surface temperature, and snow height. The sensors to measure temperature and shortwave radiation were mounted horizontally on a 1.2 m long arm and held at approximately 1.5 m above the surface (Figure 1c). Precipitation was measured by the Geonor T200B precipitation gauge, equipped near the AWS. The detailed sensor information and technical specifications of AWS are shown in Table 2. Data were stored at 1-h intervals, calculated from the average of 10-s measurements by the Campbell Scientific CR6 datalogger.
Table 2.
Information and parameters of on-glacier AWS sensors and precipitation gauges used in this study.
Because the radiation sensor has poor cosine response quality at solar zenith angles larger than 80°, data were excluded when the solar zenith angle exceeded 80° and the incoming shortwave radiation flux was <20 W m–2 according to the technical data of CNR4 radiation sensors. Daily albedo values were calculated as a ratio of the total daily reflected shortwave radiation to the total daily incident shortwave radiation [14].
To investigate the diurnal cycles in the surface albedo under clear sky conditions, clear-sky days were identified by dividing the measured incoming shortwave radiation by the potential direct shortwave radiation at the top of atmosphere that can be approximated from solar geometric relationships [39,40].
Additional meteorological data are included in this study from the Daxigou meteorological station (DXG) (Figure 1b)—which is the only complete, long-term station for meteorological observations in the region—to explore the relationship between glacier albedo and the variability associated with climate variables. We utilized air temperature and solid precipitation totals from 2000 to 2020. In this study, solid precipitation was identified according to Kang and Ohmura [41] on Urumqi Glacier No.1. When air temperature is lower than 2.8 °C, the form of precipitation is classified as solid. In addition, to test the sensitivity of the variations in glacier albedo to the threshold used to define solid precipitation, the threshold temperature of 1 °C was also used to determine the amount of solid precipitation [42]. It should be noted that air temperature and solid precipitation were extrapolated from the Daxigou meteorological station (3539 m a.s.l.) to the mean glacier elevation (4000 m a.s.l.) based on the altitudinal lapse rate. For precipitation, the vertical gradient was 22 mm 100 m−1 in non-glaciated areas and 10% 100 m−1 on the glacier surface [43]. For air temperature, the lapse rate was –0.0065 °C m−1 [43].
3.3. Uncertainties in the Data
Uncertainty in the albedo field measurements mainly stems from reflected radiation from surrounding valley walls, potential covering of upward-looking sensors, and the measurements affected by underlying terrain slope and sensor tilts. The glacier AWS is located near the glacier centerline, more than 300 m from the valley walls, with minimal impact from reflected radiation. Considering that the upward-looking radiation sensor may be covered by the snowfall, as well as the deposition of hoarfrost and dew, the CNR4 radiation sensors are ventilated with slightly preheated air to minimize covering problems and zero offsets during cloudless and windless conditions. In addition, the manual quality control measures identify obvious environmental corruption such as times when the sensor was covered by fresh snow, in which case, incoming shortwave radiation reached an extremely low value, and hourly albedo values > 0.9 were recorded. If hourly albedo values are higher 0.9, they were set to 0.9, a typical value for fresh snow [10].
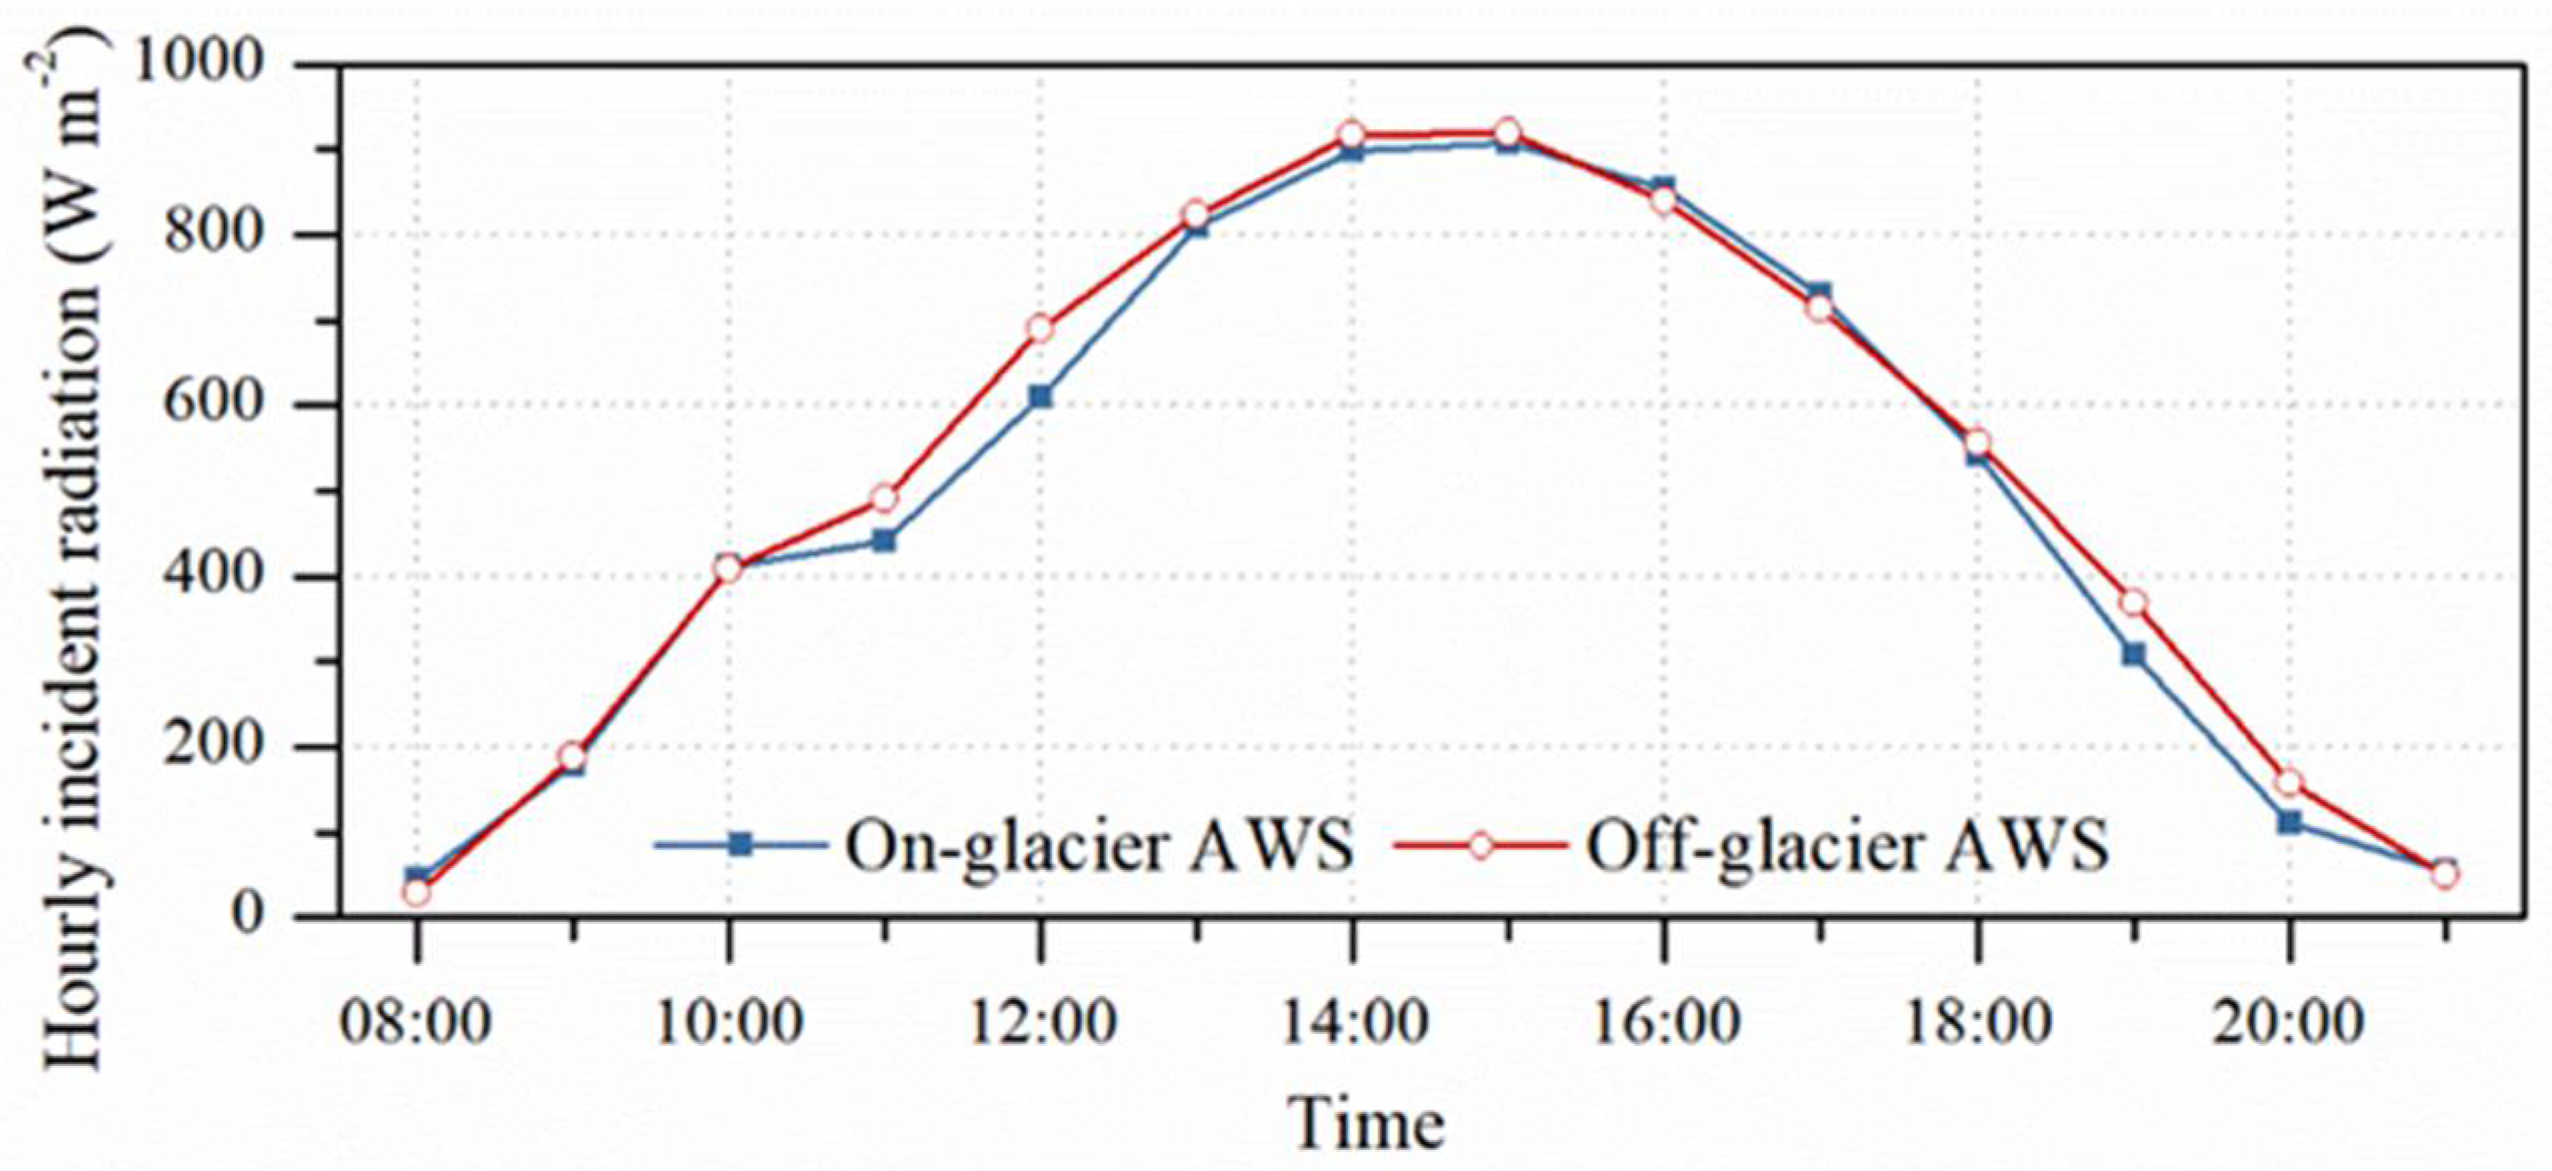
The effect of surface slope is very limited because the surface slope is about 2° at the AWS site. The sensor tilting can be caused by the glacier surface movement, differential ablation, or accumulation. Considering that the radiation senser was horizontally installed within ±0.2° near the glacier’s ELA, the mass balance at the AWS site during the measurement period was close to 0 m w.e., and the trigonal mast was drilled into a depth of about 2 m below the glacier surface (Figure 1c), the sensor tilting resulted from surface melting can be negligible. Moreover, the AWS was visited and maintained every week during the ablation season (May–August), and once a month from September to the following April to ensure the normal operation of the AWS and the horizontality of the sensors. In addition, a second AWS was set up in the east branch glacier forefield in 2011 and remains operational (Figure 1b). The off-glacier AWS was equipped with Kipp and Zonen CNR1 four-component radiometers, with a spectral range of 0.35–2.50 µm for the shortwave radiation. Because the off-glacier AWS is horizontally placed on a platform of reinforced concrete on the terminus moraines, the incoming shortwave radiation value measured by the sensors can therefore be regarded as realistic. Comparing the mean diurnal cycles of incoming shortwave radiation under clear sky conditions reveals that the observed diurnal trend at the on-glacier AWS is similar to the off-glacier AWS (Figure 3), which gives us further confidence that the sensor maintained horizontality over the study period.
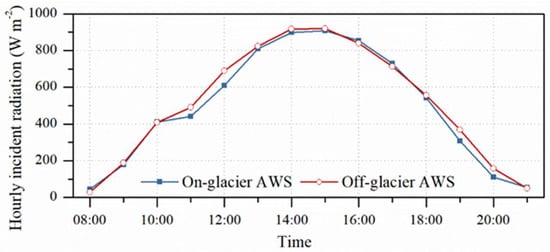
Figure 3.
The comparison of mean diurnal incident radiation on clear-sky day from September 2018 to August 2021 between on-glacier and off-glacier AWS.
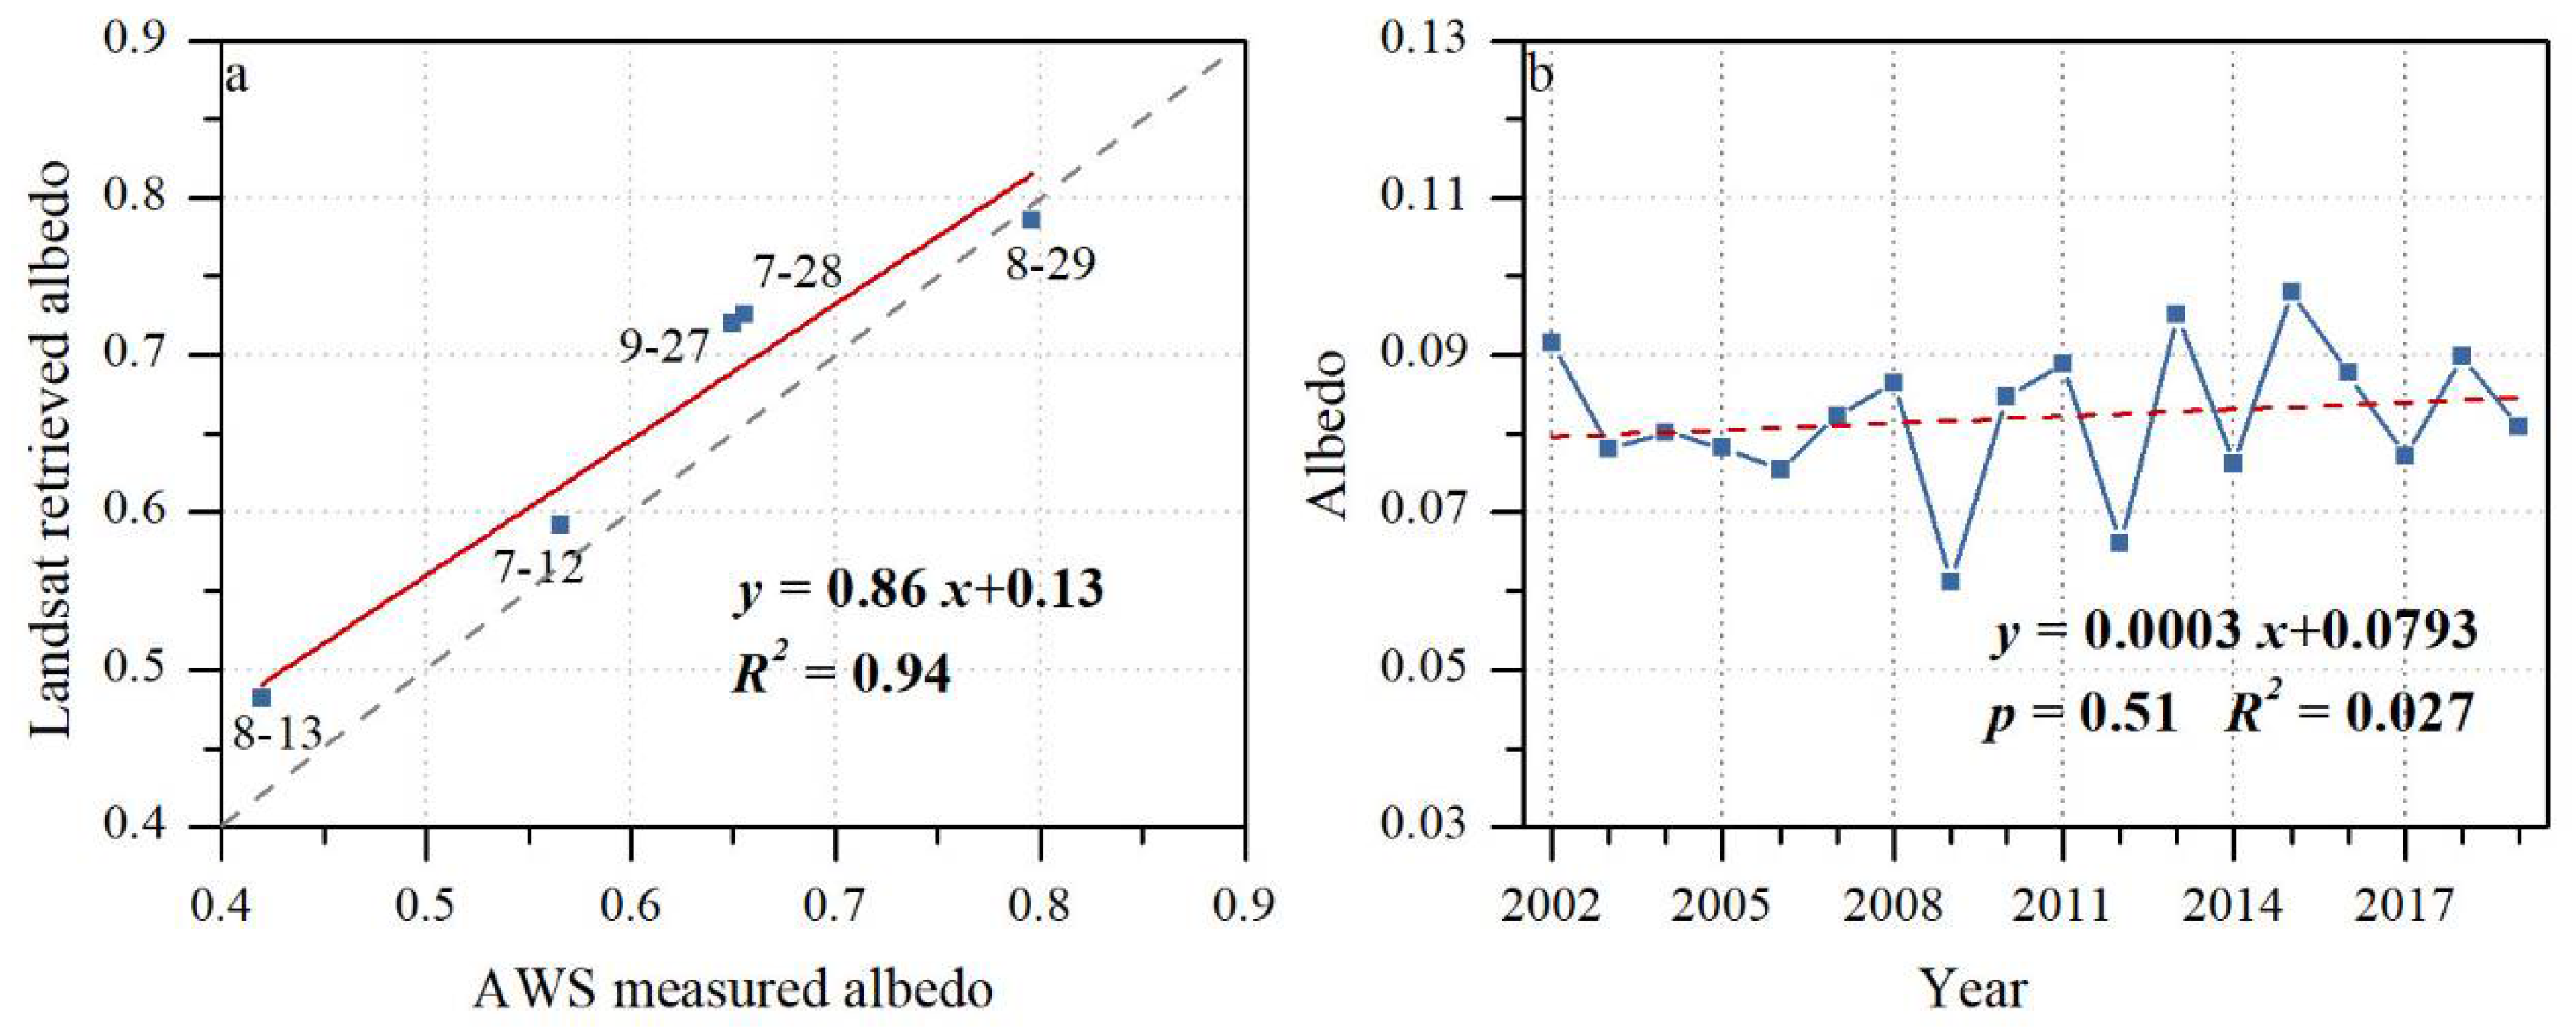
Regarding the Landsat-derived albedo values, we compared the albedo during the period of satellite overpass (±1 h) with the Landsat-retrieved albedo values at the pixel where the on-glacier AWS is installed. The result indicates that the difference in value between the derived and measured albedo ranges from −0.01 to 0.07, with RMSE = 0.054 and R2 = 0.94 (Figure 4a). These differences are in line with many previous studies [12,32,37,38] in which the Landsat-derived broadband albedo was validated with the same methodology using the AWS observations. Here, it should be kept in mind that the retrieval error is only estimated for Landsat OLI. The error associated with the Landsat ETM+ and TM retrieval over the Urumqi Glacier No.1 is uncertain due to the lack of in situ data at the same time. However, Wang et al. [12] quantified the relative error between field measurements and the Landsat ETM+ and TM retrieval broadband albedo to range from −0.11 to 0.07 (RMSE = 0:048 and R2 = 0.93) over five glaciers in western China. These results imply that despite the different imagery for validation, the same level of result accuracy was essentially ensured.

Figure 4.
(a) Scatter plots of albedo values measured by the on-glacier AWS at 5:00 UTC against the values retrieved from Landsat at the pixel where the on-glacier AWS is located. (b) Variations in snow-free albedo at the off-glacier AWS site over time between 2002 and 2019.
The deviation between them is mainly caused by the sub-pixel variability in albedo, evident from the point-scale AWS data, only averaged from the 30 m pixel resolution of Landsat. However, as we are interested in the relative changes of albedo, the absolute values of albedo are less important than the robustness of the trends. Thus, to assess the reliability and robustness of our trends in ice albedo derived from images from different Landsat sensors, we selected the snow-free off-glacier AWS site (Figure 1b), where albedo is assumed to be stable over time. We estimated the variability and trend of albedo using the same methodology employed for glaciers. Although a slight fluctuation exists in the surface albedo values, no significant trend was found from 2002 to 2019 (Figure 4b). The annual mean and standard deviation of albedo are 0.082 and 0.009, respectively, ranging from 0.061 to 0.098. These suggest that the trend in bare-ice albedo between 2002 and 2019 is robust and reliable.
In addition, missing data in some of the Landsat ETM+ data, generated due to the SLC failure after May 2003, also occur in our albedo retrievals (14 August 2005 and 1 August 2006 in Supplementary Figure S1). For the area of SLC failure, the albedo values are usually very small, lower than 0.005; thus, this area is removed. Compared with the image in 2016, the percentage of area with missing data was less than 3% for the bare-ice area, which is a negligible impact.
The direct comparison of ground observations by AWS with MOD10A1 albedo products of up to 500 m is not suitable over the spatial heterogeneous glacier surface during the ablation period. In this study, we adopted the method recommended by Liang et al. [44]—we upscaled and aggregated the Landsat-derived albedo imagery into a resolution of 500 m to validate the accuracy of the MOD10A1 albedo products. The comparison results for the shortwave broadband albedo of the corresponding pixel at the time of the satellite overpass exhibits an overall satisfactory visual and statistical agreement (Figure 2b). The difference between the two albedo products ranges from −0.15 to 0.002, with an RMSE of 0.09 and an R2 of 0.76. The comparison result in this study is in fact similar to previous results on the glaciers of western China [12], where the MOD10A1 was evaluated with RMSE values ranging from 0.064 to 0.112.
4. Results
4.1. Interannual Variability of Glacier Albedo from MOD10A1 Products
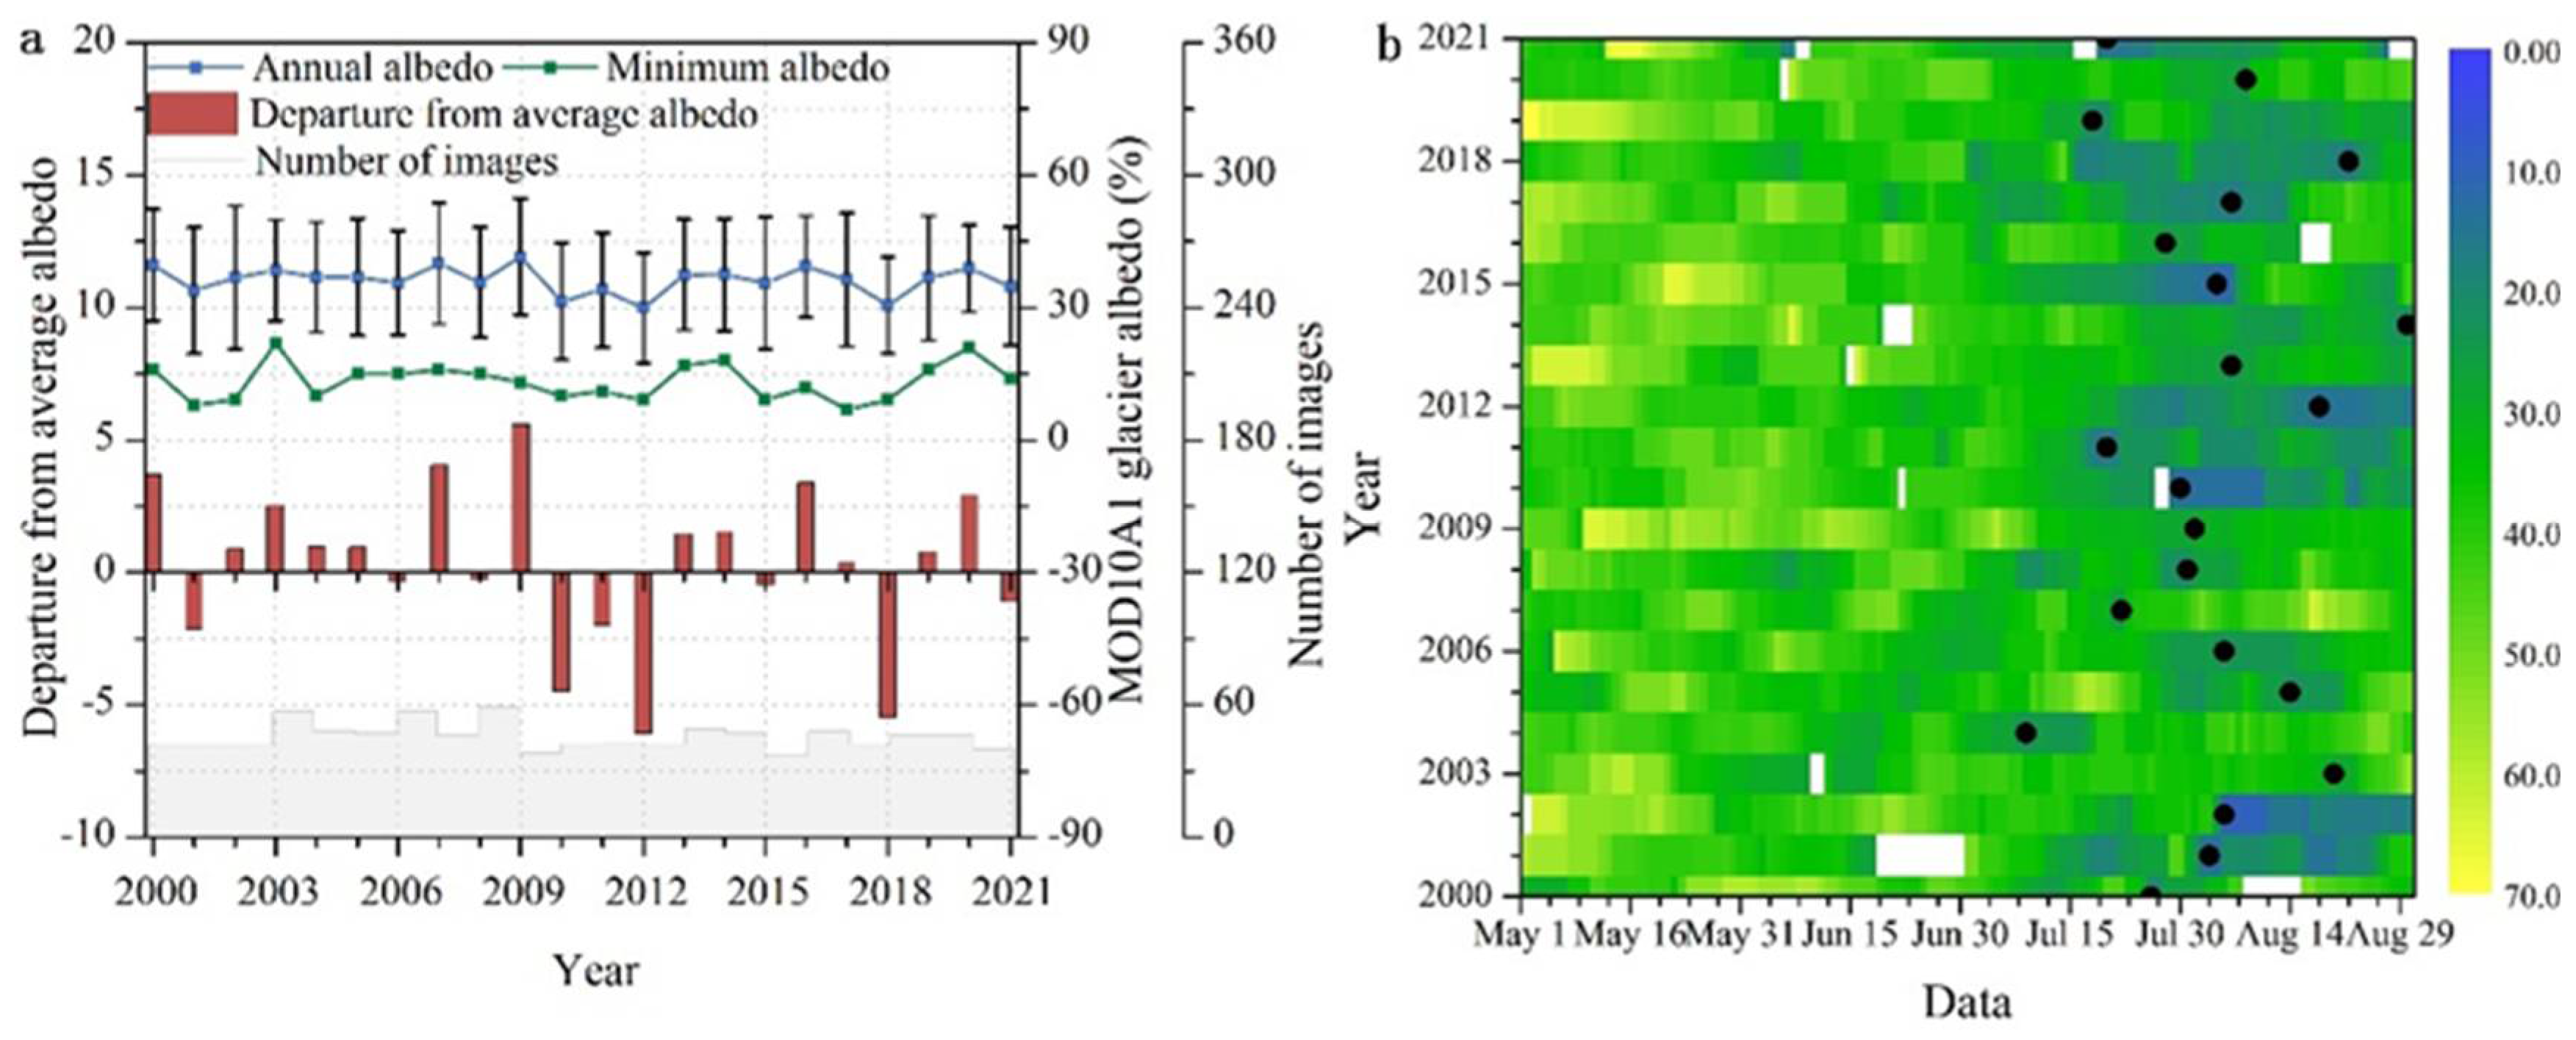
The average ablation-period albedo in 2000–2021 is 36%, and ranges from 30% in 2012 to 41.6% in 2009. The yearly departure from the mean albedo (called anomaly) was calculated to characterize the variability in albedo. The results indicate that before 2009, there were mostly positive anomalies, and the magnitude of a negative anomaly was weak, but after 2009, the number of years in which negative anomalies occurred greatly increased, and the magnitude of negative anomaly was enhanced (Figure 5a).
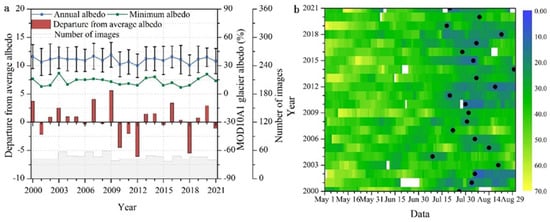
Figure 5.
(a) The average albedo, minimum albedo, departures from average albedo, and number of images for Urumqi Glacier No.1 during the ablation season between 2000 and 2021. (b) Daily albedo of Urumqi Glacier No.1 during the ablation season from 2000 to 2021. The black dots show the timing of minimum albedo.
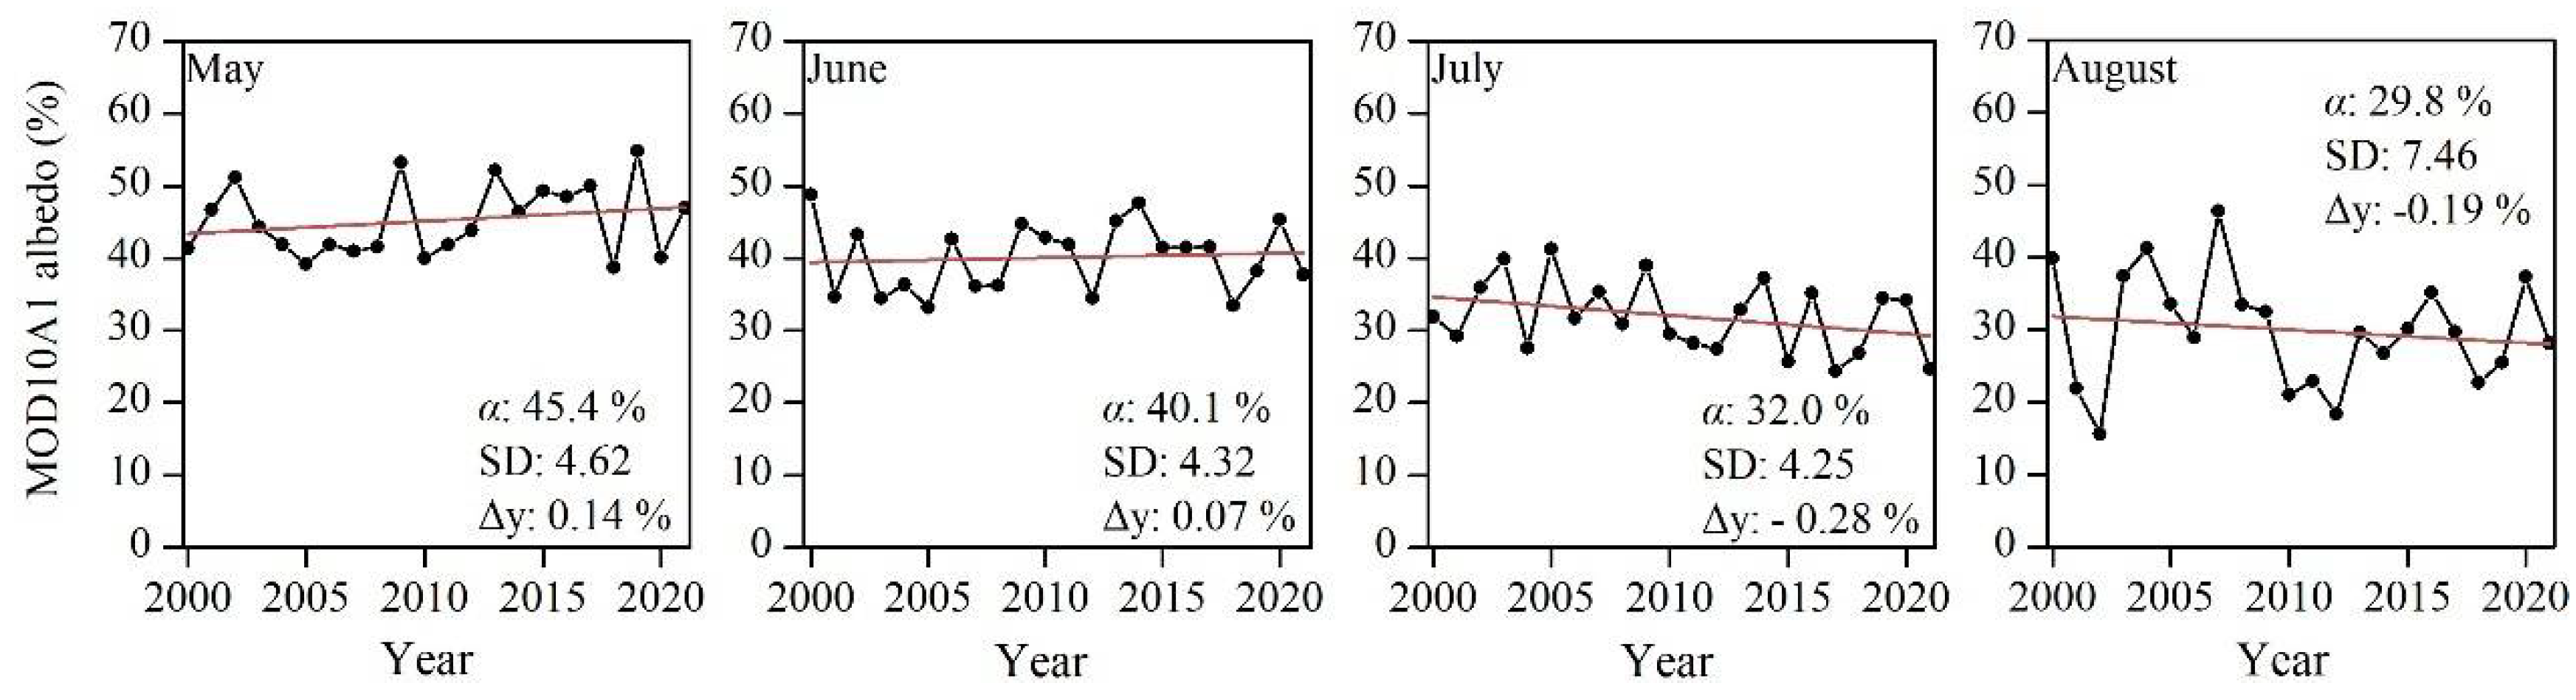
Overall, a slight decreasing trend for mean ablation-period albedo was shown from 2000 to 2021, with a total decrease of 1.87% or an annual mean decrease of approximately 0.085%. Furthermore, the glacier surface albedos in 2000–2021 showed distinct variations in different months, as shown in Figure 6. The average linear slopes for May and June were positive, suggesting increasing albedo values in early summer. In July and August, a negative trend was shown, implying that more incoming shortwave energy is absorbed at the surface during these months with lower albedo. It is, however, noted that these trends were not statistically significant at the 95% confidence level (the whole ablation period, p = 0.4; May, p = 0.36; June, p = 0.67; July, p = 0.07; August, p = 0.47).
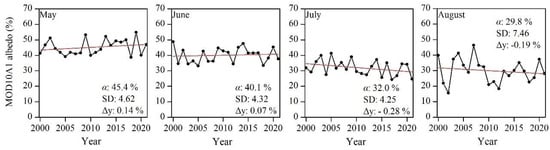
Figure 6.
Linear trends of average monthly mean albedo for Urumqi Glacier No.1 in 2000–2021. The mean (α), standard deviation (SD), and trend (Δy) are shown.
Between 2000 and 2021, the magnitude of the minimum albedo ranges from 7% (in 2012) to 22% (in 2009). Figure 5a shows that despite a moderate interannual variation (σ = 5.3%), there is no significant overall temporal trend for the minimum albedo. The minimum albedo typically occurs between mid-July and late August, but can occur in early July or as late as the end of August. A notable interannual variability (σ = 12.3 d) is shown with a slight positive trend, implying a longer ablation duration; this trend loses significance over the whole study period.
4.2. Multi-Year Variability of the Bare-Ice Albedo Retrieved from Landsat Imagery
The melting rate on a glacier is largely determined by the bare-ice albedo. Thus, we investigated the multi-year variations in bare-ice albedo retrieved from the end-of-summer Landsat imagery. We averaged the bare-ice albedo over each branch of Urumqi glacier No.1 for individual years from 2002 to 2019. The results displayed that the values were rather low, ranging from 0.12 (2012) to 0.18 (2014) on the east branch glacier, and from 0.12 (2012) to 0.21 (2005) on the west branch glacier. The average bare-ice albedo over 2002–2019 was lower on the east branch than on the west branch (0.15 vs. 0.17). For the entire Urumqi Glacier No.1, we obtained a mean bare-ice albedo of 0.16 from 2002 to 2019, ranging from 0.07 to 0.29 for all valid pixels on the two branch glaciers, which is suggested by Cuffey and Paterson [10] to be typical of impurity-rich ice. Moreover, the values for bare-ice albedos on Urumqi Glacier No.1 are much lower than those on the other mid-latitude glaciers, such as in the western and southern Swiss Alps (mean: 0.22) [19], the Haig Glacier in the Canadian Rocky Mountains (mean: 0.21) [15], and the glaciers in the central Chilean Andes (mean: 0.20) [45]. Such a low bare-ice albedo is likely attributed to a high concentration of impurities on the ice surface, such as cryoconite granules formed by microbial activity. According to the studies by Yue et al. [22], the amount of total (organic plus inorganic) surface dust on the ice surface of the Urumqi Glacier No.1 is markedly greater than on glaciers in other parts of the world. For example, the amount of mineral dust on the Urumqi Glacier No.1 was approximately 15 times higher than the mean of that on the Patagonian, Alaskan, and Canadian Arctic glaciers (297 vs. 20.3 g m−2), while the amount of organic matter was approximately 45 times higher (30 vs. 0.67 g m−2) [21].
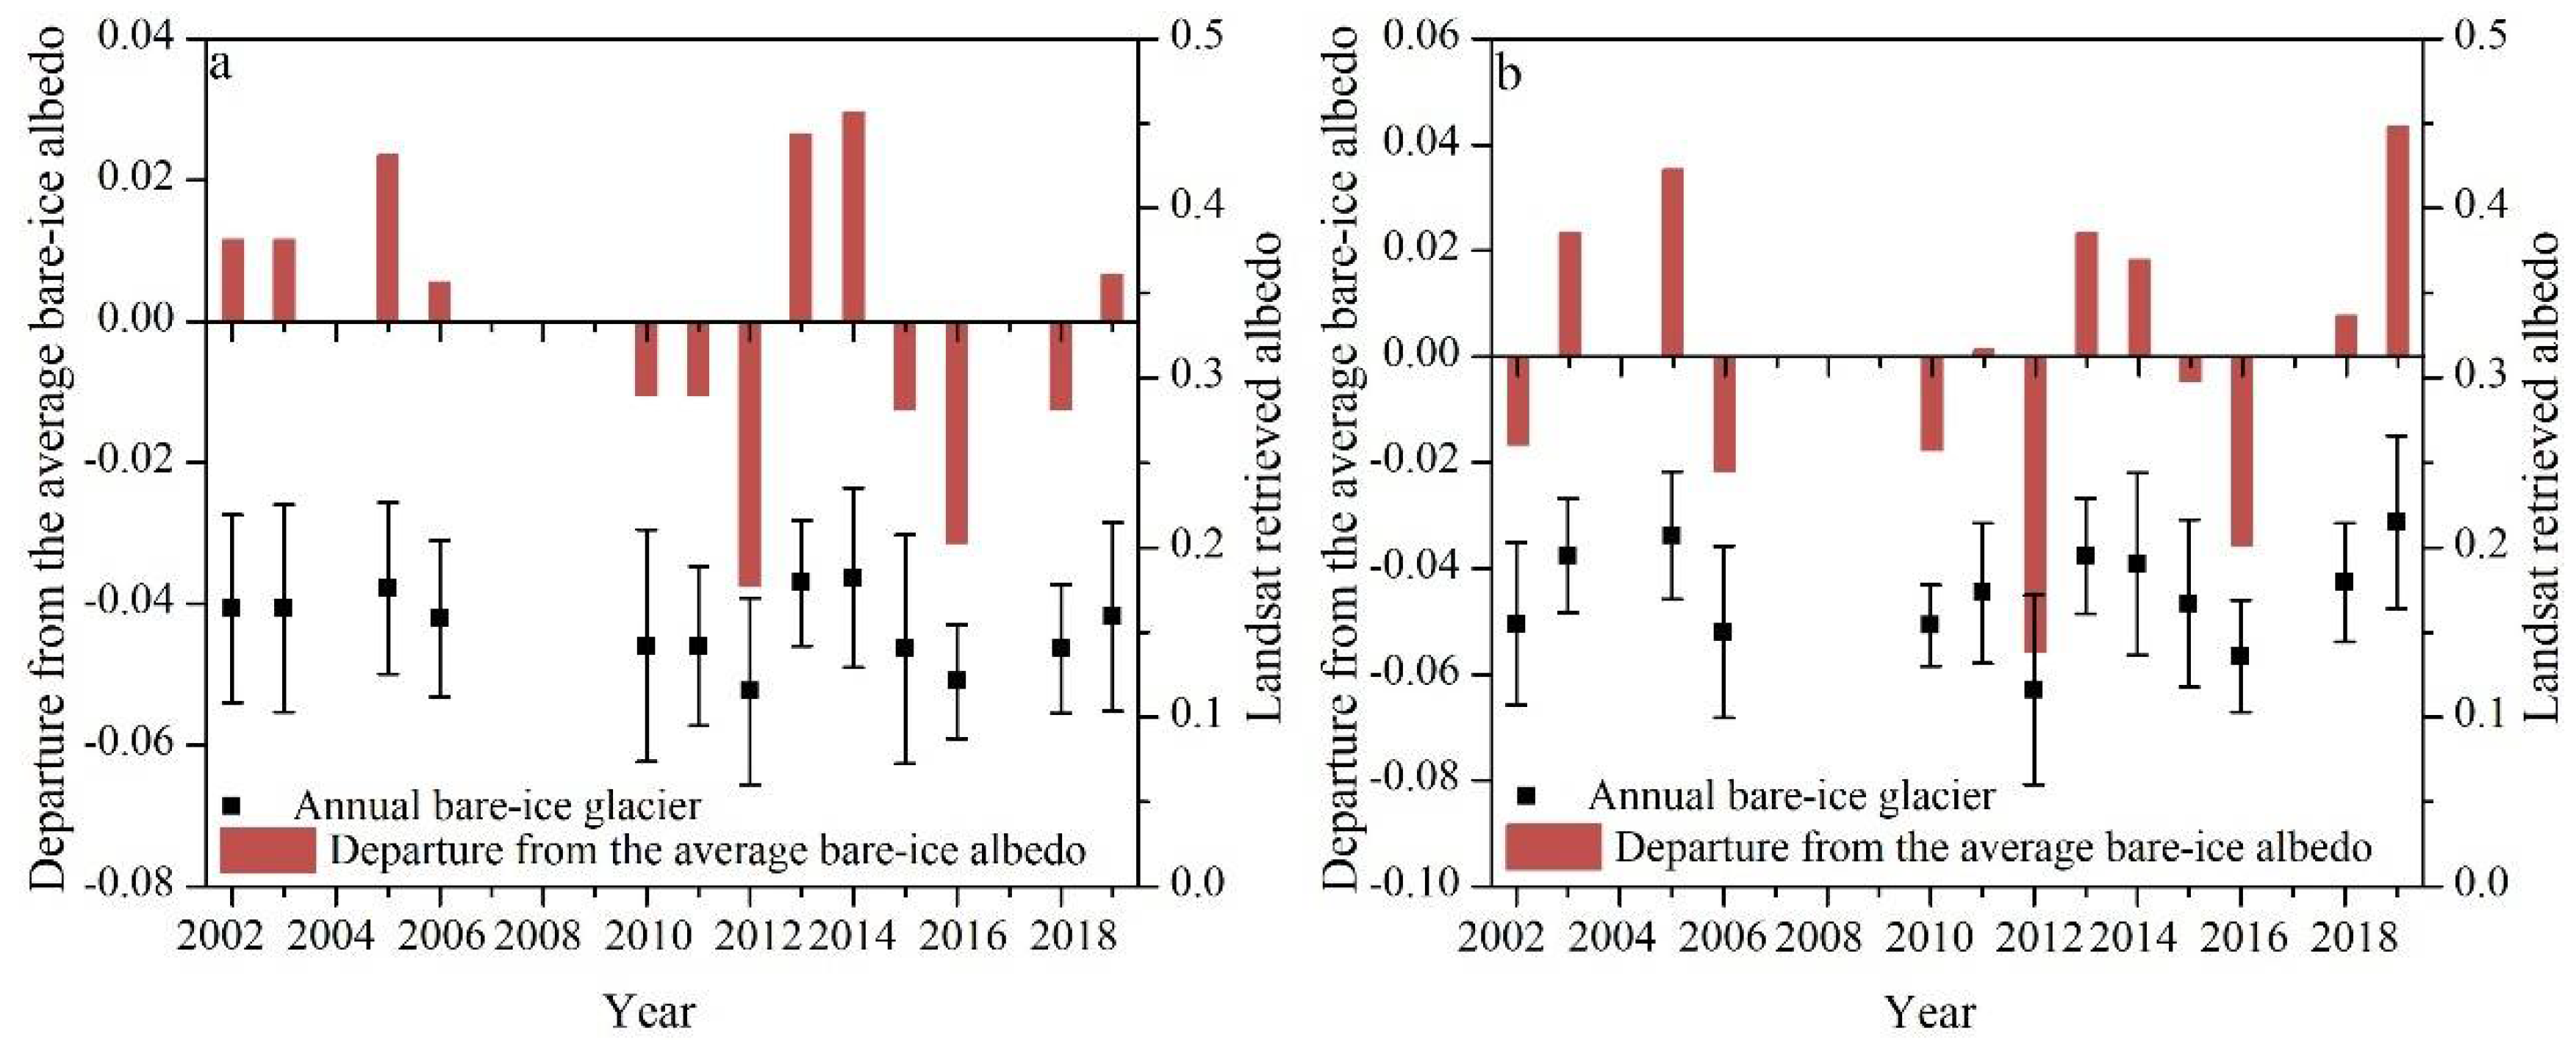
Between 2002 and 2019, a slight but not statistically significant negative variation in bare-ice albedo was shown on the east branch glacier (Figure 7a). Nevertheless, the departures from the average bare-ice albedo show that before 2009, annual values were typically higher than average, i.e., positive departures, while the negative departures frequently appeared after 2009. This implies that the decrease in bare-ice albedo of the east branch glacier has been ongoing since 2002, and that the glacier surface is darkening. However, for the western branch glacier, although there was interannual variability in the bare-ice albedo in 2002–2019 (Figure 7b), with a standard deviation of 0.03, no significant temporal trends in average bare-ice albedo were found.

Figure 7.
Changes in end-of-summer bare-ice albedo for the east branch glacier (a) and the west branch glacier (b) of Urumqi Glacier No.1 over the 2002–2019 period. The error bars show the standard deviation of the albedo values.
4.3. Seasonal Variations in Average Albedo Measured by AWS near the ELA
At the AWS site between 1 September 2018 and 31 August 2021, the average daily surface albedos were 0.68, ranging from 0.08 to 0.98. Despite a large range in daily albedo, about 80% of values were higher than 0.60, which can be taken as the baseline value of surface albedo.
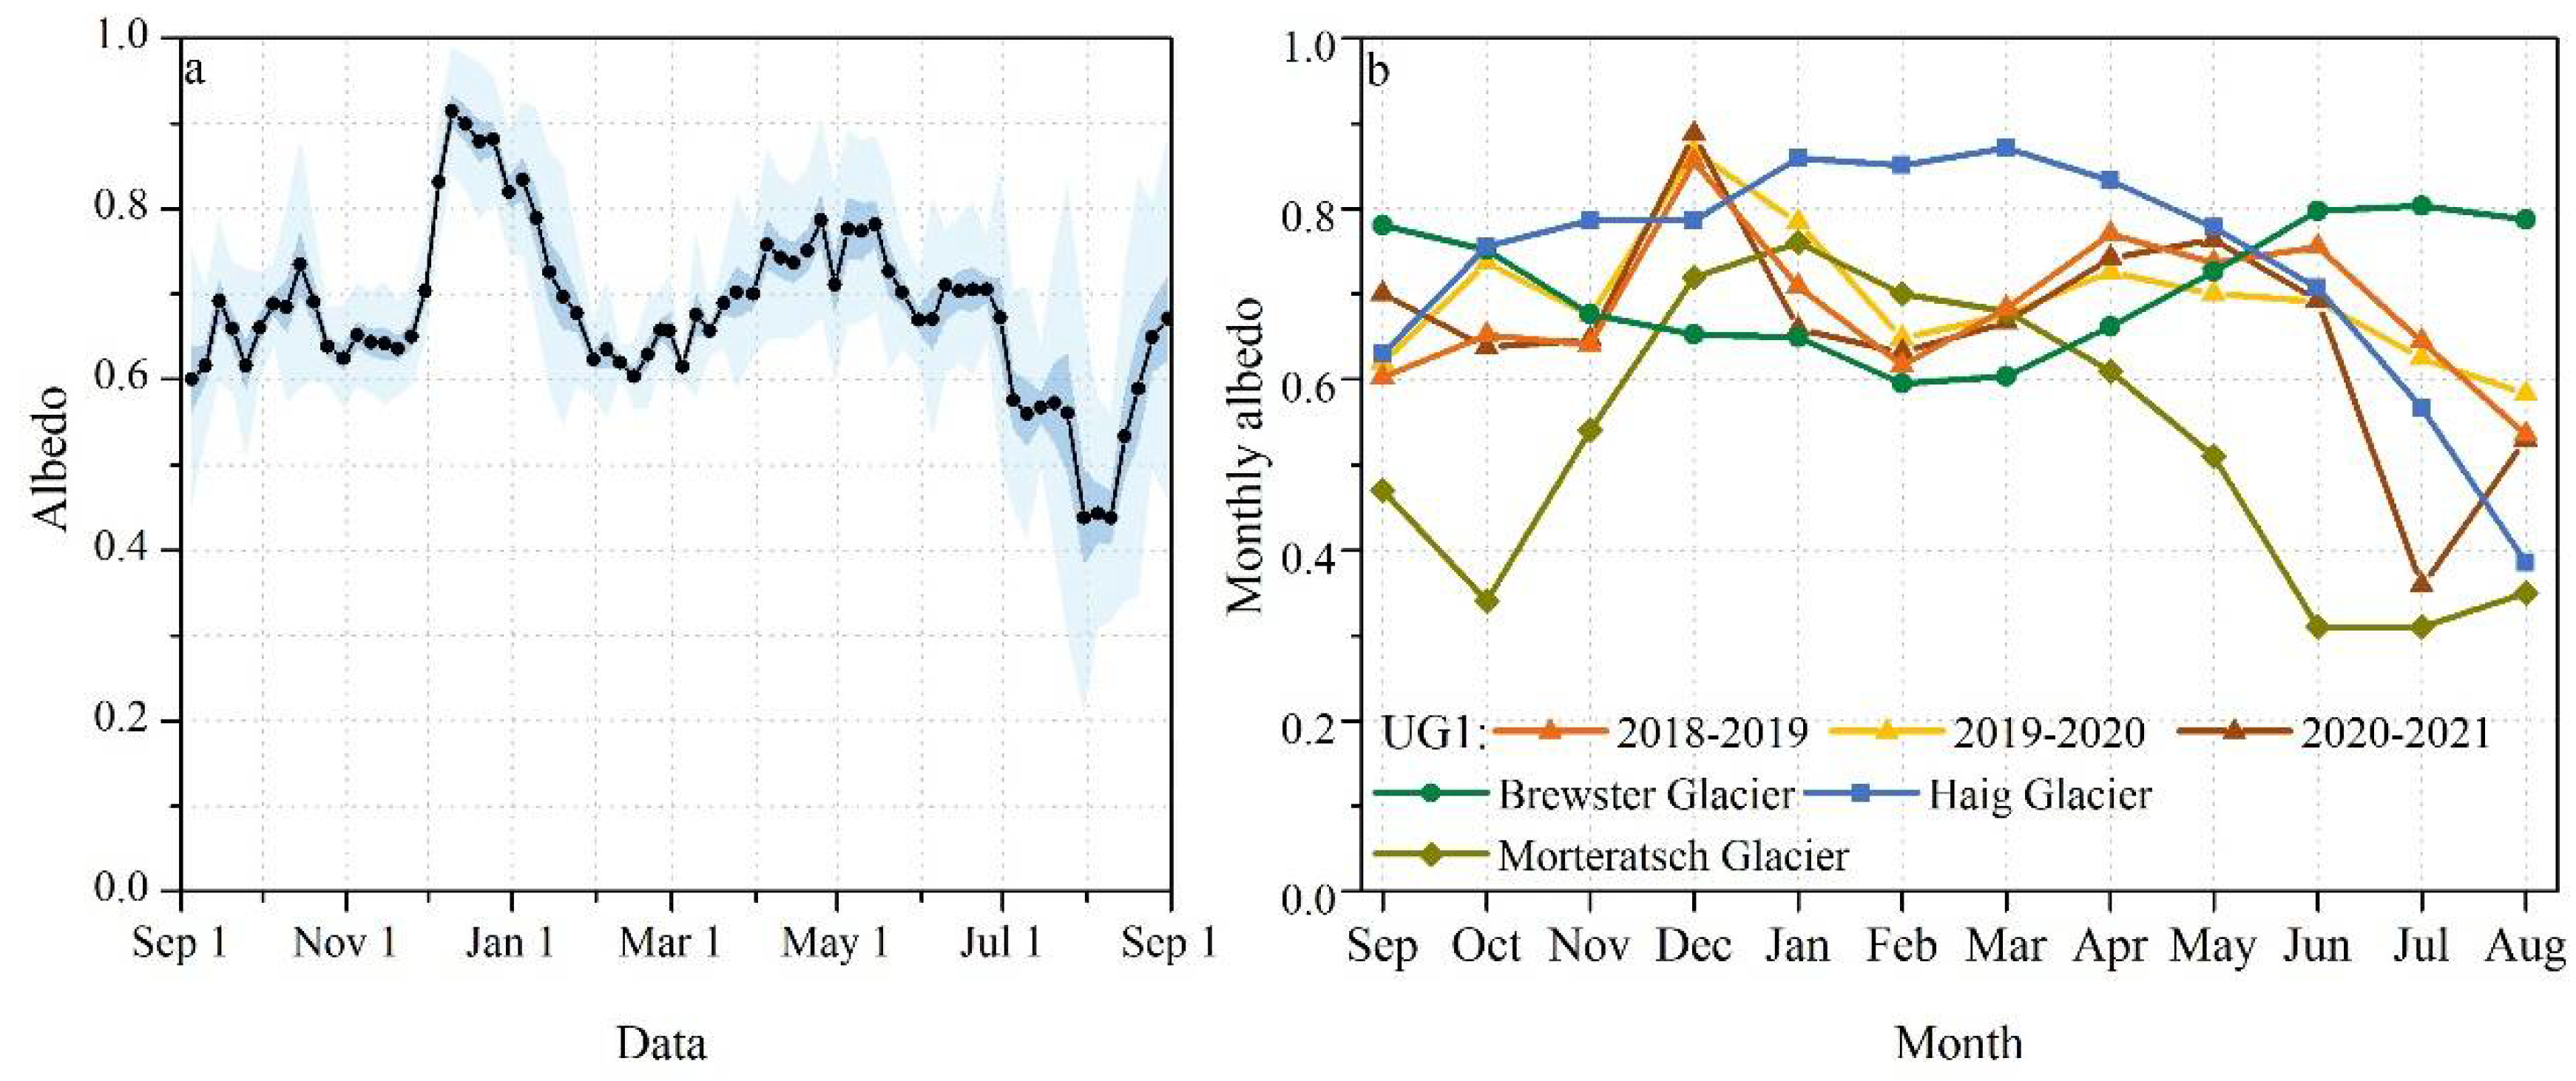
Glacier albedo at the AWS site exhibited a pronounced seasonal evolution (Figure 8a). In September and October, most values ranged from 0.6 to 0.75, with a weak upward trend. Surface albedo rose sharply from November to December until it reached a peak value of 0.9, and then exhibited a dramatic decline, finally reaching the baseline value of 0.6 in early February. Albedo rose again from mid-February through March and April until it reached a secondary peak of 0.8 in late April. Subsequently, the progressive decline in glacier surface albedo was dominant, and this trend continued through the entire summer. However, although the albedo continued to decline between May and June, the value remained above 0.6 until returning again to its baseline value in the first week of July. In July, glacier albedo showed an accelerated decline, and stabilized at the minimum typically between the end of July and early August. Since late August and the beginning of September, the albedo increased again with the first snowfall and new snow accumulation.

Figure 8.
(a) The seasonal variation in surface albedo for Urumqi Glacier No.1 between September 2018 and August 2021 presented as mean 5-day values, and the darker and lighter shaded areas indicate the standard error and standard deviation, respectively, of the set of observations used to compute the mean. (b) Comparison of seasonal variation in surface albedo between the Urumqi Glacier No.1, Morteratsch Glacier, Brewster Glacier, and Haig Glacier. Details of these glaciers are shown in Supplementary Table S1.
Although the direct comparison with other mountain glaciers is very difficult because of the differences in study periods and measurement locations of albedo, it can still reveal overall characteristics and variability of surface albedo. Thus, we compared the seasonal changes in surface albedo in different mountain glaciers for one complete mass balance year: Morteratsch Glacier, Brewster Glacier, Haig Glacier, and Urumqi Glacier No.1 (Figure 8b). The comparison revealed different patterns of seasonal variation in surface albedo. For Urumqi Glacier No.1, a bimodal seasonal evolution was evident, with the highest albedo in December (α = 0.85, 0.87, and 0.89, in 2019, 2020, and 2021, respectively) and the second highest in April (α = 0.77 and 0.73 in 2019 and 2020, respectively) or May (α = 0.76 in 2021). However, in other mountain glaciers, a unimodal evolution was clearly presented, reaching a maximum of 0.76 in January at the Morteratsch Glacier [14], 0.87 in March at the Haig Glacier [15], and 0.80 in July (correspond to the austral winter) at the Brewster Glacier [46]. We attribute the unusual seasonal evolution of the surface albedo for Urumqi Glacier No.1 to its climatic conditions, which we discuss in detail in Section 5.1.
During the ablation period, the average surface albedo measured by AWS was 0.37 in 2019, 0.39 in 2020, and 0.35 in 2021, significantly lower than the values derived from MOD10A1 in the same years (α = 0.67, 0.66, and 0.57, respectively). The difference is mainly due to the AWS being located near the glacier’s equilibrium line, while the MOD10A1 records the surface albedo in the middle and upper ablation zone of the glacier. However, for both albedos recorded by the AWS and MOD10A1 products, the minimum albedo typically occurred between mid-July and late August, which contradicts the initial expectation that glacier albedo would continue to decline through the entire ablation period and finally reach its minimum at the end of August. This indicates that when the maximum bare-ice area and the corresponding highest snow line altitude were studied from remote sensing imagery, the acquisition time of remote sensing imagery is not strictly limited to the end of the ablation period.
4.4. The Diurnal Cycles in the Surface Albedo Measured by AWS near the ELA
The diurnal cycles in the surface albedo were also remarkable. Under clear sky conditions, the diurnal changing pattern of snow albedo had an asymmetric “U” shape (Figure 9a). The albedo value was slightly higher in the morning than in the afternoon. However, over an ice surface, the progressive decline in surface albedo dominated during the daytime (Figure 9d). In contrast, under cloudy or overcast skies, the strong diurnal variability in the albedo disappears, and albedo is a nearly constant value (Figure 9b,c).
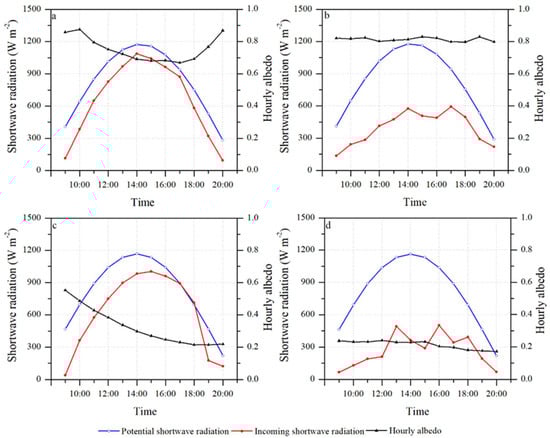
Figure 9.
Diurnal cycles of clear-sky (a) and cloudy snow albedo (b); clear-sky (d) and cloudy ice albedo (c) at the glacier AWS site on the Urumqi Glacier No.1, using 28 April (a), 29 April (b), 15 August (c), and 16 August 2019 (d) as examples.
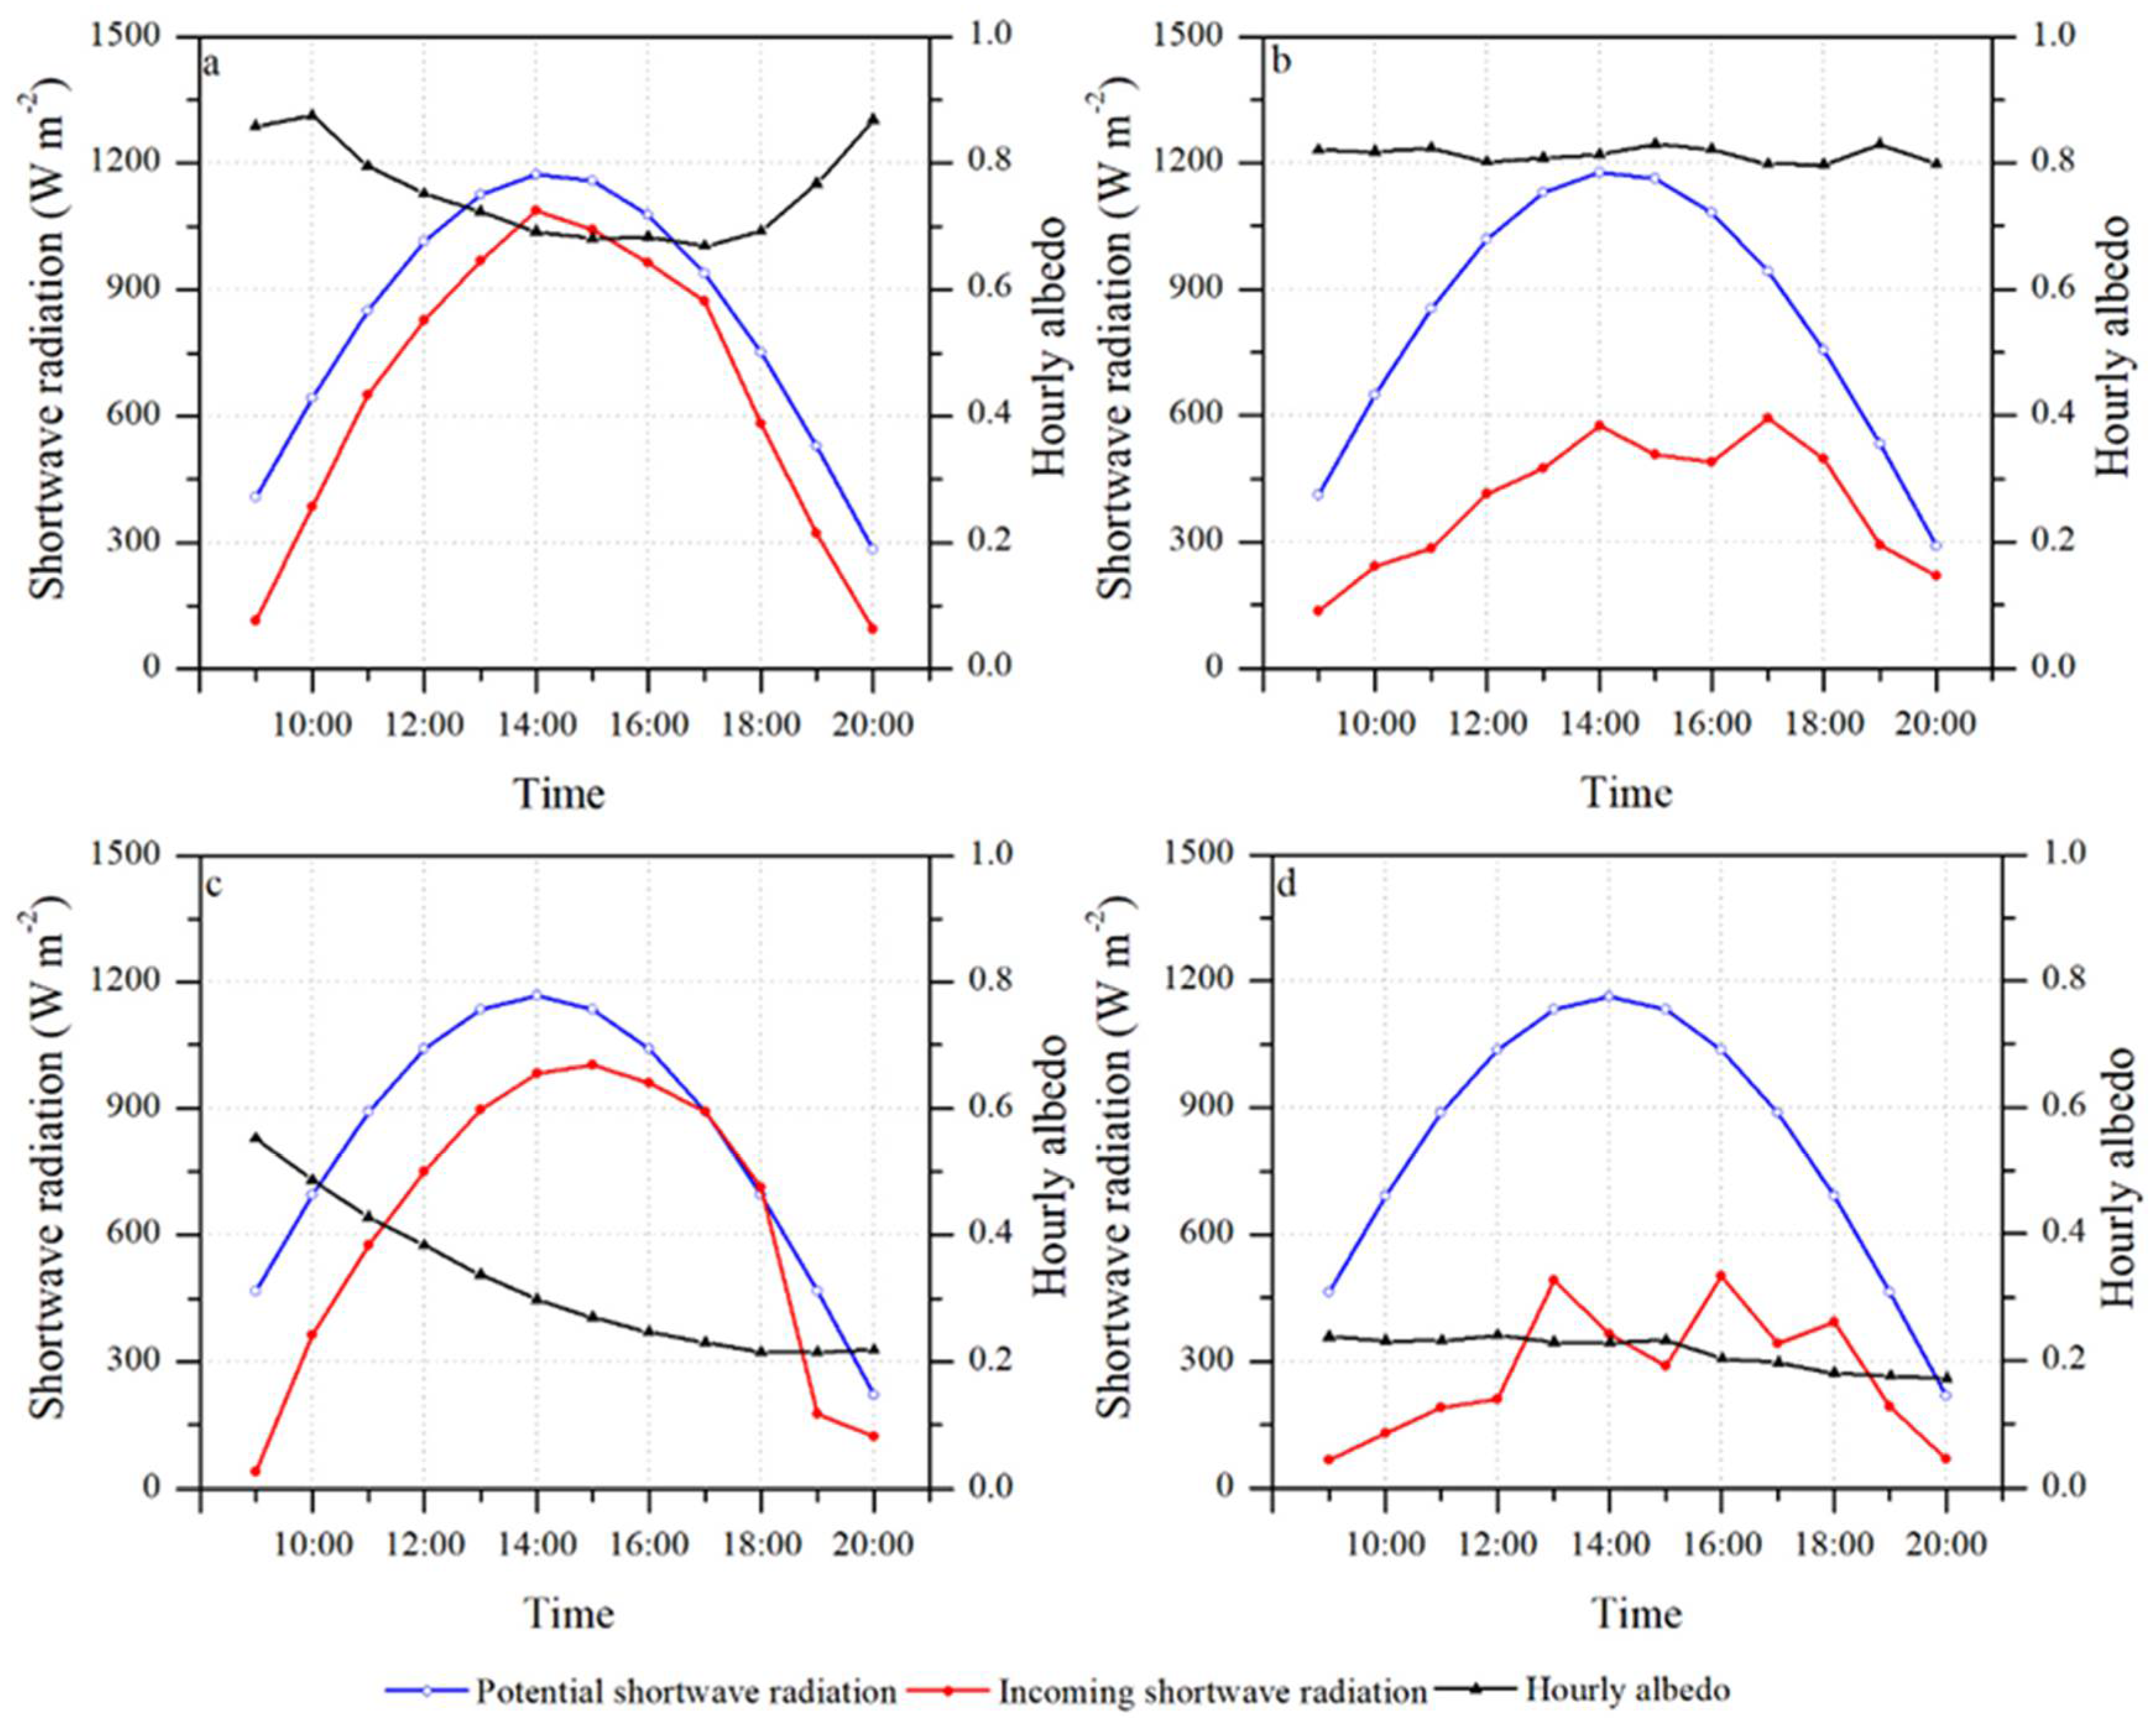
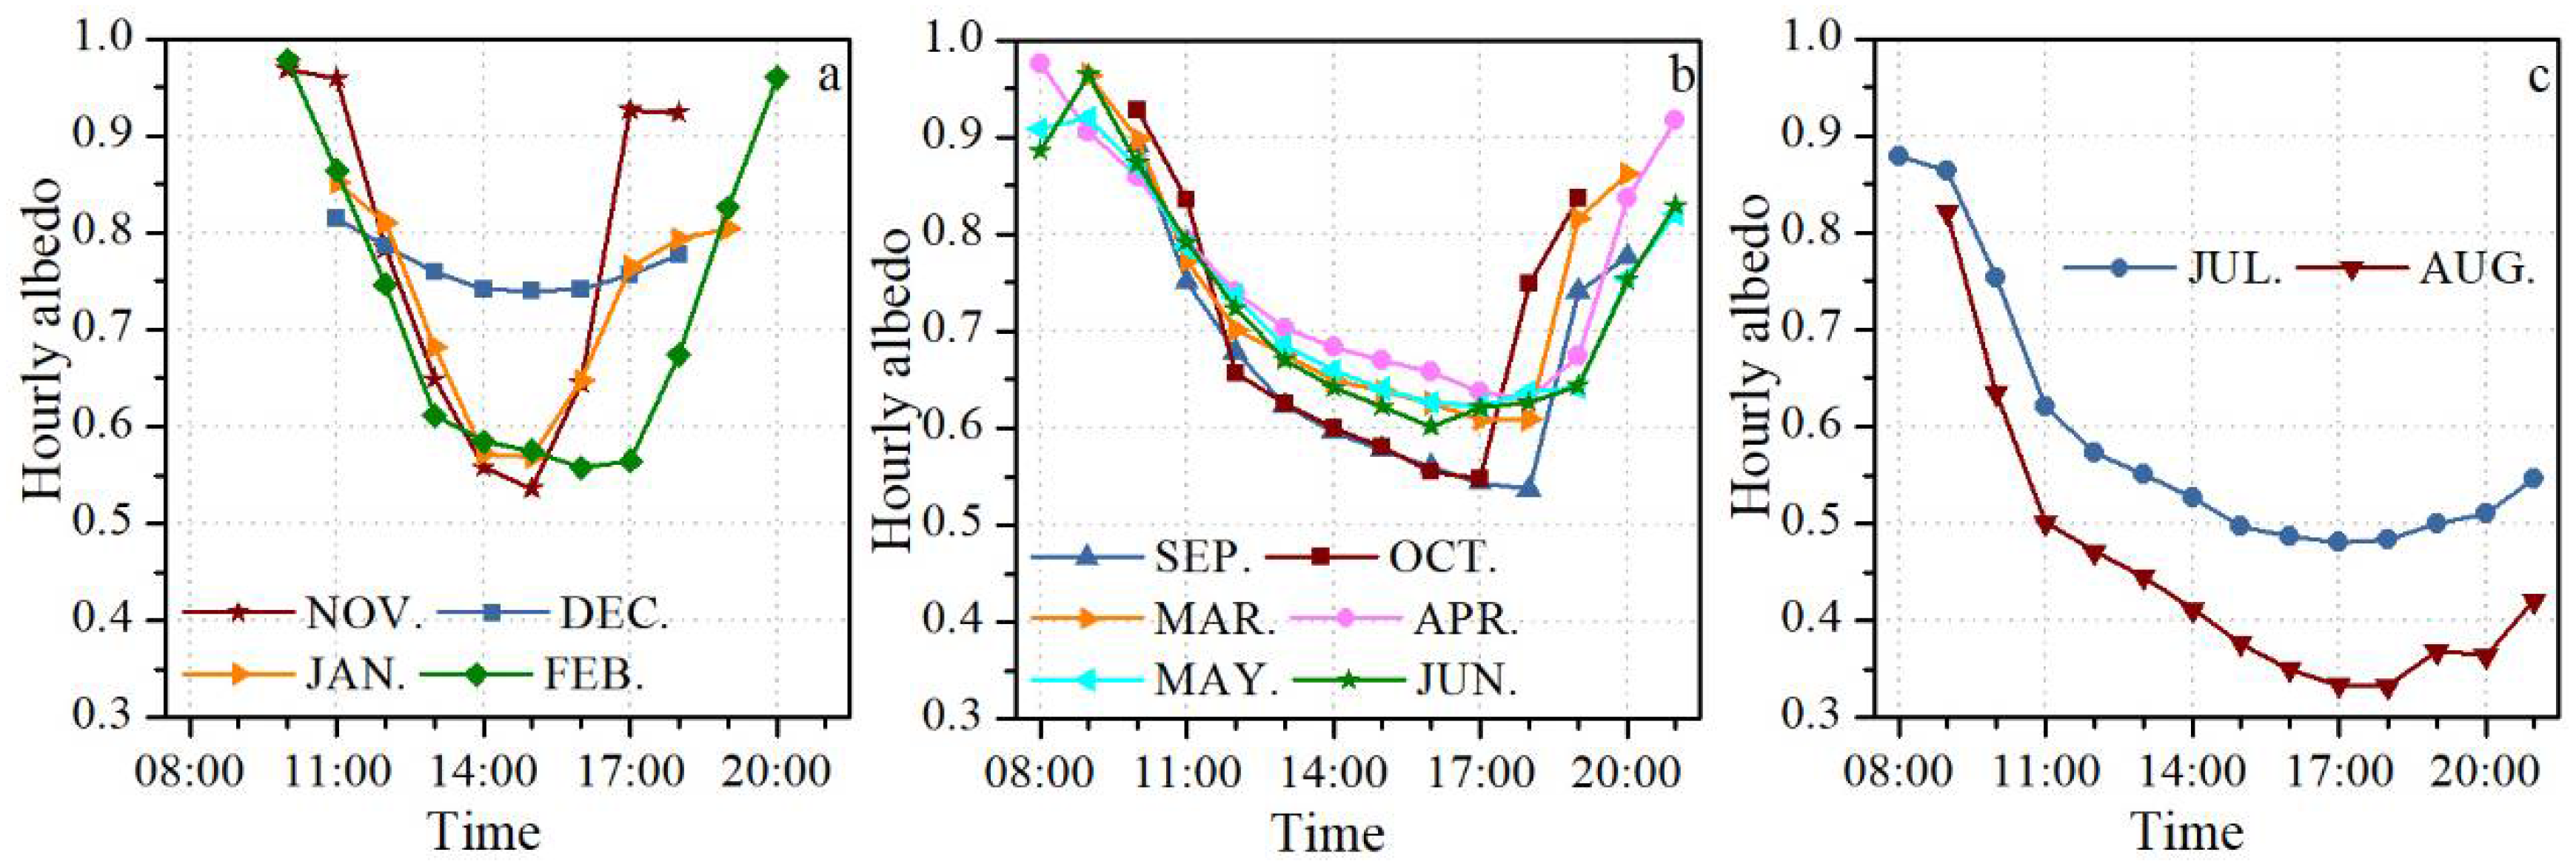
To highlight the differences between the diurnal albedo cycles under clear sky conditions, the mean diurnal cycles for each month are shown in Figure 10. All days with a daily mean transmissivity greater than 0.7 are defined as clear-sky days. Although the strong diurnal cycles are still visible, the different patterns of month-to-month variation in the diurnal albedo cycle are noteworthy. The mean diurnal cycles observed at the glacier AWS site can be classified into three major types. Type A (Figure 10a) shows a near-symmetric diurnal cycle on clear-sky days, minimum at noon and maximum in both morning and afternoon. It includes November, December, January, and February. Type B (Figure 10b) has a remarkable asymmetric diurnal cycle, with much higher albedo values near 09:00 and reaching the minimum between 17:00 and 18:00. This type includes March, April, May, June, September, and October. Type C (Figure 10c) generally shows a progressive decline in surface albedo with larger values in the morning and smaller values in the afternoon. This type generally occurs in July and August.
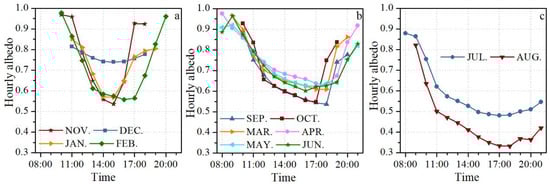
Figure 10.
Mean diurnal cycles of clear-sky albedo for each month at the glacier AWS site on the Urumqi Glacier No.1 during the period of 1 September 2018 to 31 August 2021. The subgraph (a) indicated the diurnal cycles of clear-sky albedo in November, December, January and February. The subgraph (b) indicated the diurnal cycles of clear-sky albedo in March, April, May, June, September, and October. The subgraph (c) indicated the diurnal cycles of clear-sky albedo in July and August.
5. Discussions
5.1. Influence of Air Temperature and Precipitation on Glacier Albedo
The variations in glacier albedo are associated with the deposition, metamorphism, and melt of snow, as well as with the exposure of bare ice. During the intense ablation period, when melting of the seasonal snow exposes bare ice, this is apparent as a decrease in the surface albedo, while a sharp rise in albedo indicates summer snowfalls. However, these processes are further controlled by air temperature and precipitation.
Table 3 summarizes the bivariate relationships between climate variables and average albedo of Urumqi Glacier No.1 on different time scales. Here, a year refers to a mass-balance year (September to next August), the ablation period is typically from May to August, and the accumulation period is typically from September to the following April. The air temperature (°C) and solid precipitation totals (mm) from meteorological records of the DXG weather station investigate the interannual relationship, and the meteorological data recorded by AWS are used to analyze seasonal and daily relationships.
Table 3.
The correlation coefficients between air temperature, solid precipitation, and the average albedo for different time scales on Urumqi Glacier No.1; * represents significance at the 0.95 level, ** represents significance at the 0.99 level. The ablation period is typically from May to August, and the accumulation period is typically from September to the following April.
On the daily time scale, the relationships between two climate variables and average albedo have significant correlations. It is, however, noted that the correlation coefficients are low, suggesting that other factors must be active, such as cloud cover and solar zenith angle.
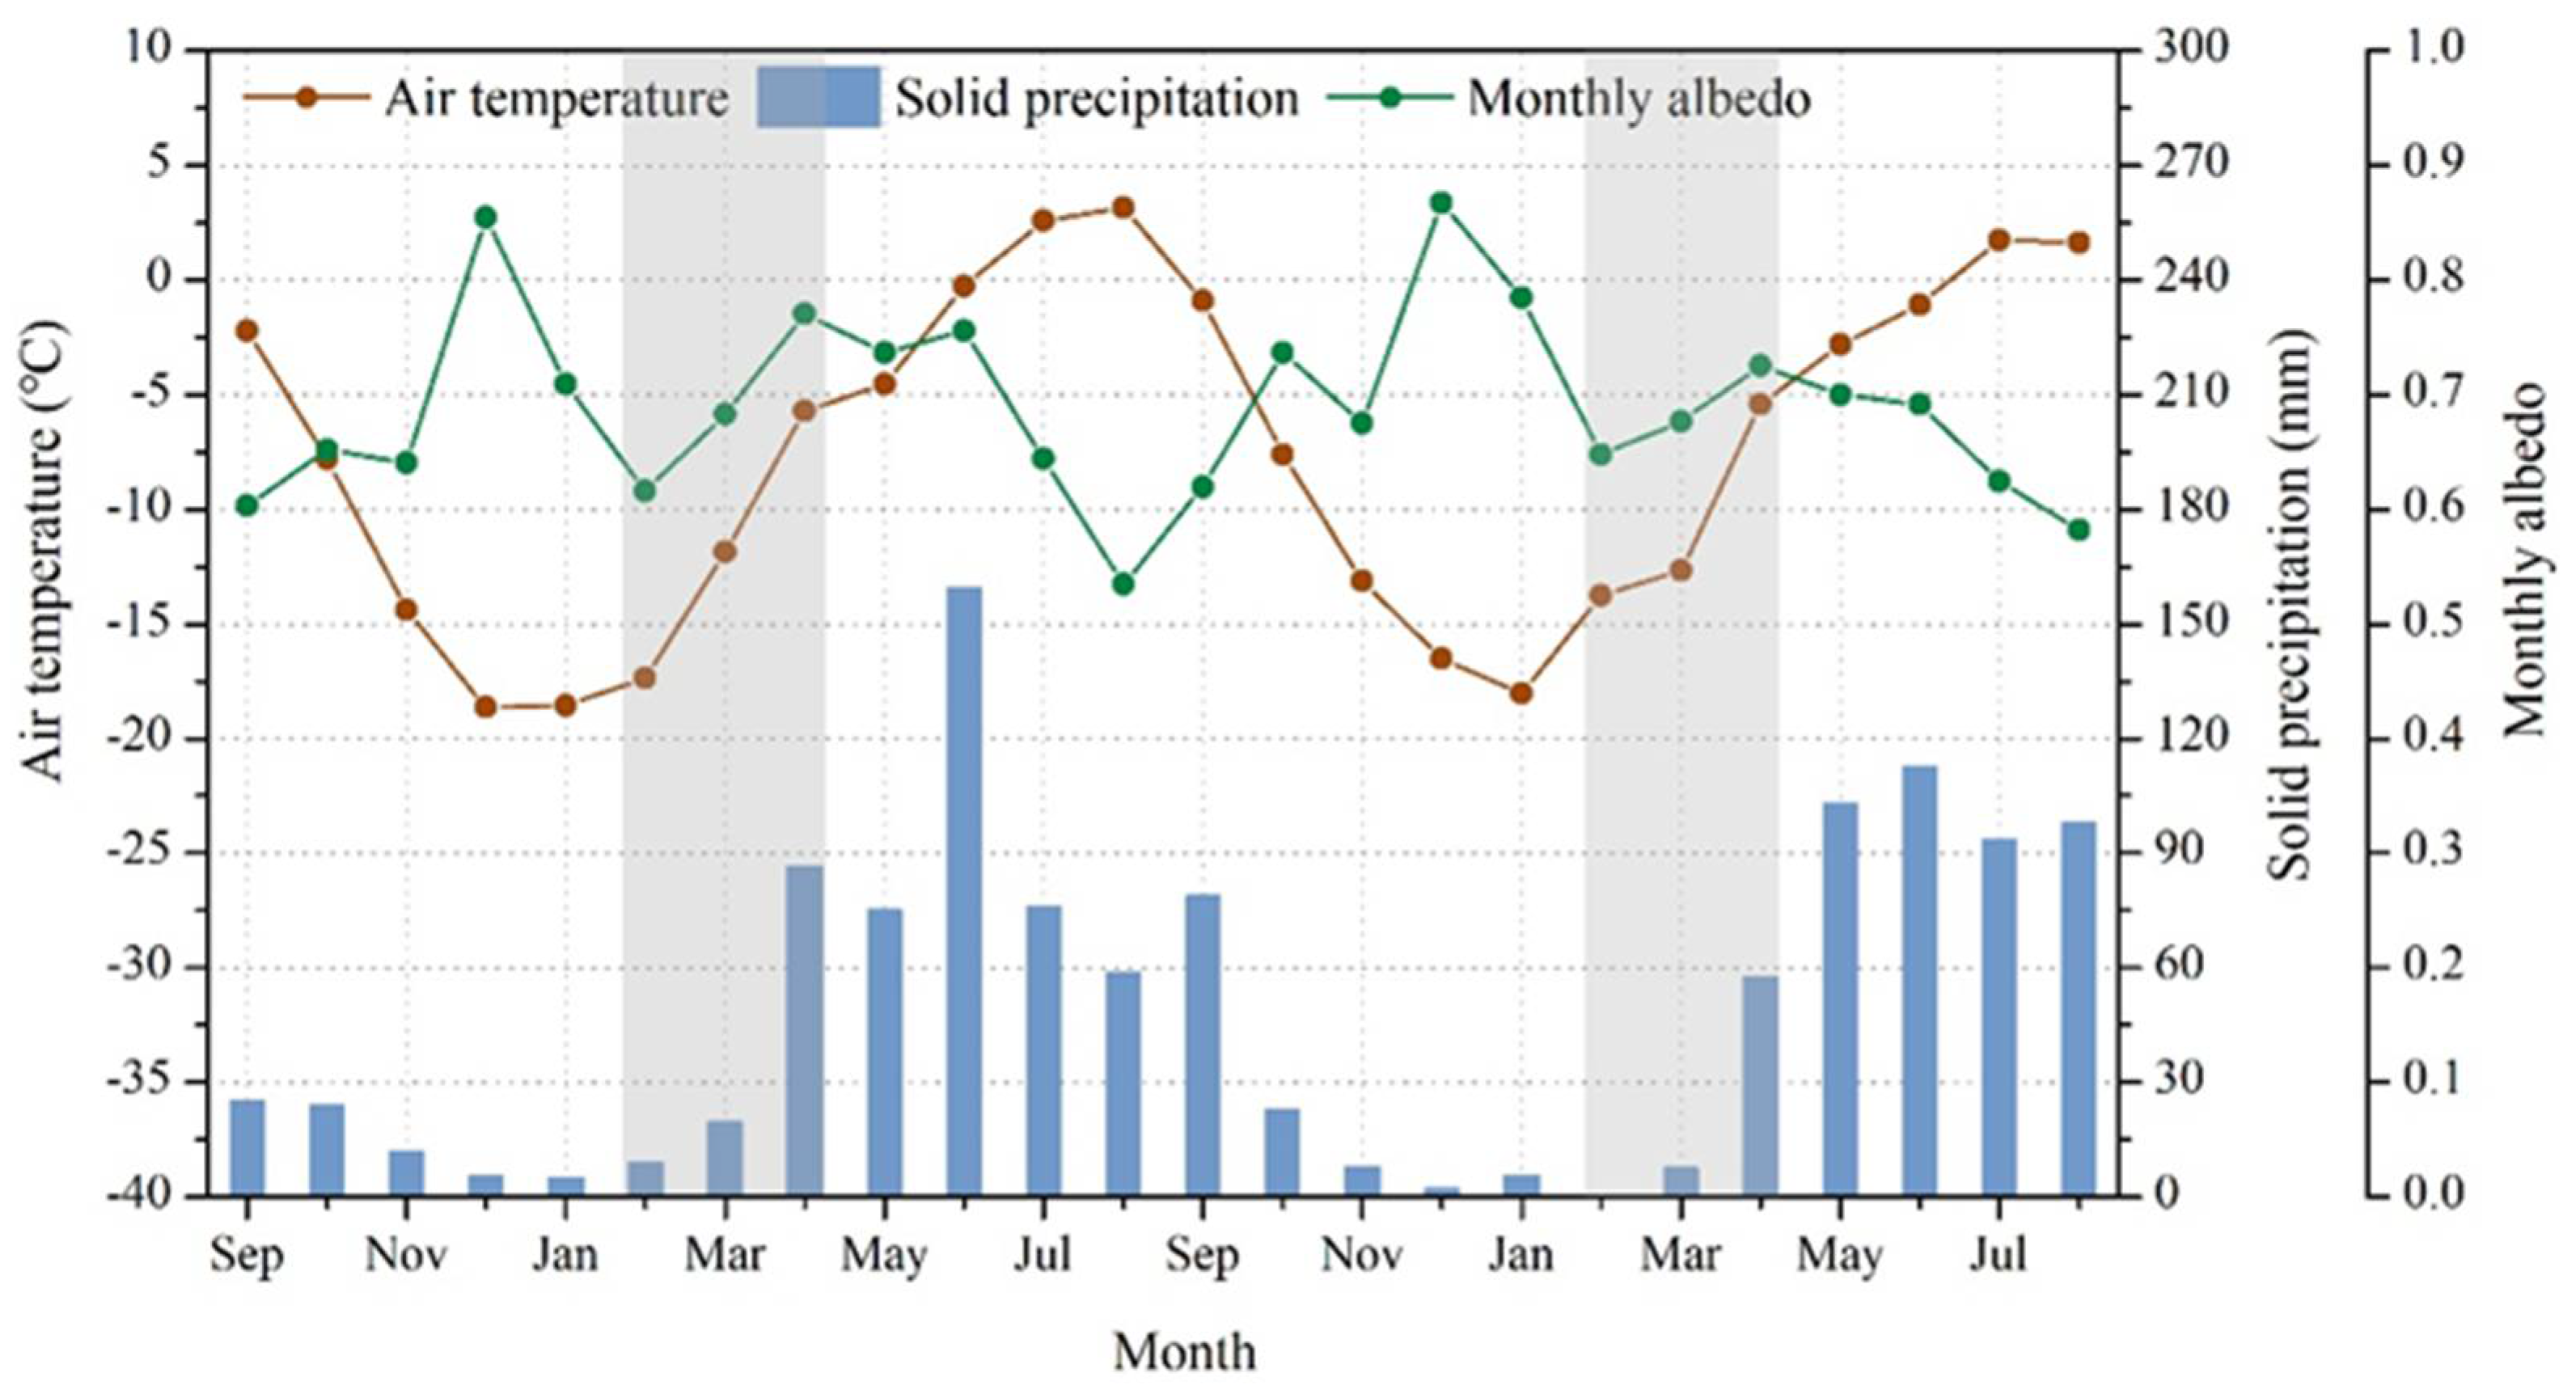
On the seasonal time scale, there is a rather strongly negative correlation between the seasonal cycle of albedo and air temperature. This relationship is also evidenced by the fact that both variables change in completely opposite ways in most cases (Figure 11). Regarding solid precipitation, although the positive correlation is not statistically significant considering a risk of error of 5%, a clear and similar increasing trend was seen from February to April in 2019 and 2020. These relationships between climate variables and albedo indicate that the air temperature may be the main driver of the seasonal variations in albedo, while solid precipitation can break the trend of albedo with air temperature. In the winter, although there is very little snowfall, it all remains on the glacier, and the snow metamorphism proceeds slowly because of the extremely low air temperature. The combination of air temperature and solid precipitation causes the highest albedo in December, which is similar to other mountain glaciers. However, in the spring, air temperature rises rapidly, and the significant increase in surface albedo is markedly different from that of other glaciers, which is probably the result of an increase in solid precipitation. For example, solid precipitation increased from 9.1 mm in February to 91.5 mm in April in 2019, and from 0 mm in February to 57.3 mm in April in 2020. In addition, it should be kept in mind that the influence of solar zenith angle on the seasonal variation of albedo should not be ignored.

Figure 11.
Changes in mean monthly albedo, air temperature, and solid precipitation at the glacier AWS site on the Urumqi Glacier No.1 from September 2018 to August 2020.
On an interannual time scale, the variation in mean albedo during the ablation period is mainly attributed to the air temperature of the corresponding period, and the sum of solid precipitation. Over the period of 2000–2021, both average ablation-period air temperature and the sum of solid precipitation explained about 60% of the variations in ablation-period albedo, assuming a liner relationship between the two climate variables and average albedo. Furthermore, for individual months, the extent of the influence of climate variables on the albedo is different. In May, the observed upward trend in albedo is the result of an increase in solid precipitation during the accumulation period, with a correlation coefficient of 0.6 (p = 0.007). From 2000 to 2021, solid precipitation during the accumulation period presented a significant increasing trend of 2.5 mm yr−1 (p = 0.03) (Supplementary Figure S2). The interannual change in albedo in May is more correlated with the solid precipitation in the accumulation period rather than that in the current month, suggesting the effect of snow thickness on surface albedo. According to the previous studies, the albedo of snow overlying a surface with a high impurity content is highly sensitive to snow depth, and the albedo values increase as the snow depth increases within the critical snow depth range [47]. In May, snow depth is much more controlled by accumulated snowfall during the accumulation period than that the fresh snowfall in the current month. However, in July, the remarkable negative trend in albedo is related to the air temperature, with the correlation coefficient of 0.56 (p = 0.01), considering a distinct positive variation in air temperature at a rate of about 0.08 °C yr−1 (p = 0.06) (Supplementary Figure S2). In August, the highest correlation coefficient is computed between albedo and two climate variables at a significant level above 99%, implying that albedo is most sensitive to changes in air temperature and solid precipitation during this month. Over the 2000–2021 period, 80% of the variation in average albedo in August can be attributed to the changes in air temperature and solid precipitation. However, air temperature appeared to be the primary variable responsible for the decrease in albedo, as air temperature exhibited an increasing trend during this period, while solid precipitation remained relatively unchanged (Supplementary Figure S2). Similarly, in June, the slight upward trend in albedo is also the result of a combination of air temperature and solid precipitation, but to a lesser extent than in August.
If 1 °C is used to define solid precipitation, although there was a slight change in the coefficient between solid precipitation and average albedo on different time scales, the positive correlation and its significance level are comparatively stable. This indicates that the relationship between solid precipitation and glacier albedo is robust and not sensitive to the static threshold used to define solid precipitation.
5.2. Possible Causes of Diurnal Cycle of Surface Albedo
The three types of diurnal cycle of surface albedo correspond to different dominant factors that affect glacier albedo, including solar zenith angle, surface hoar formations, melt/freeze cycles, and snow metamorphism.
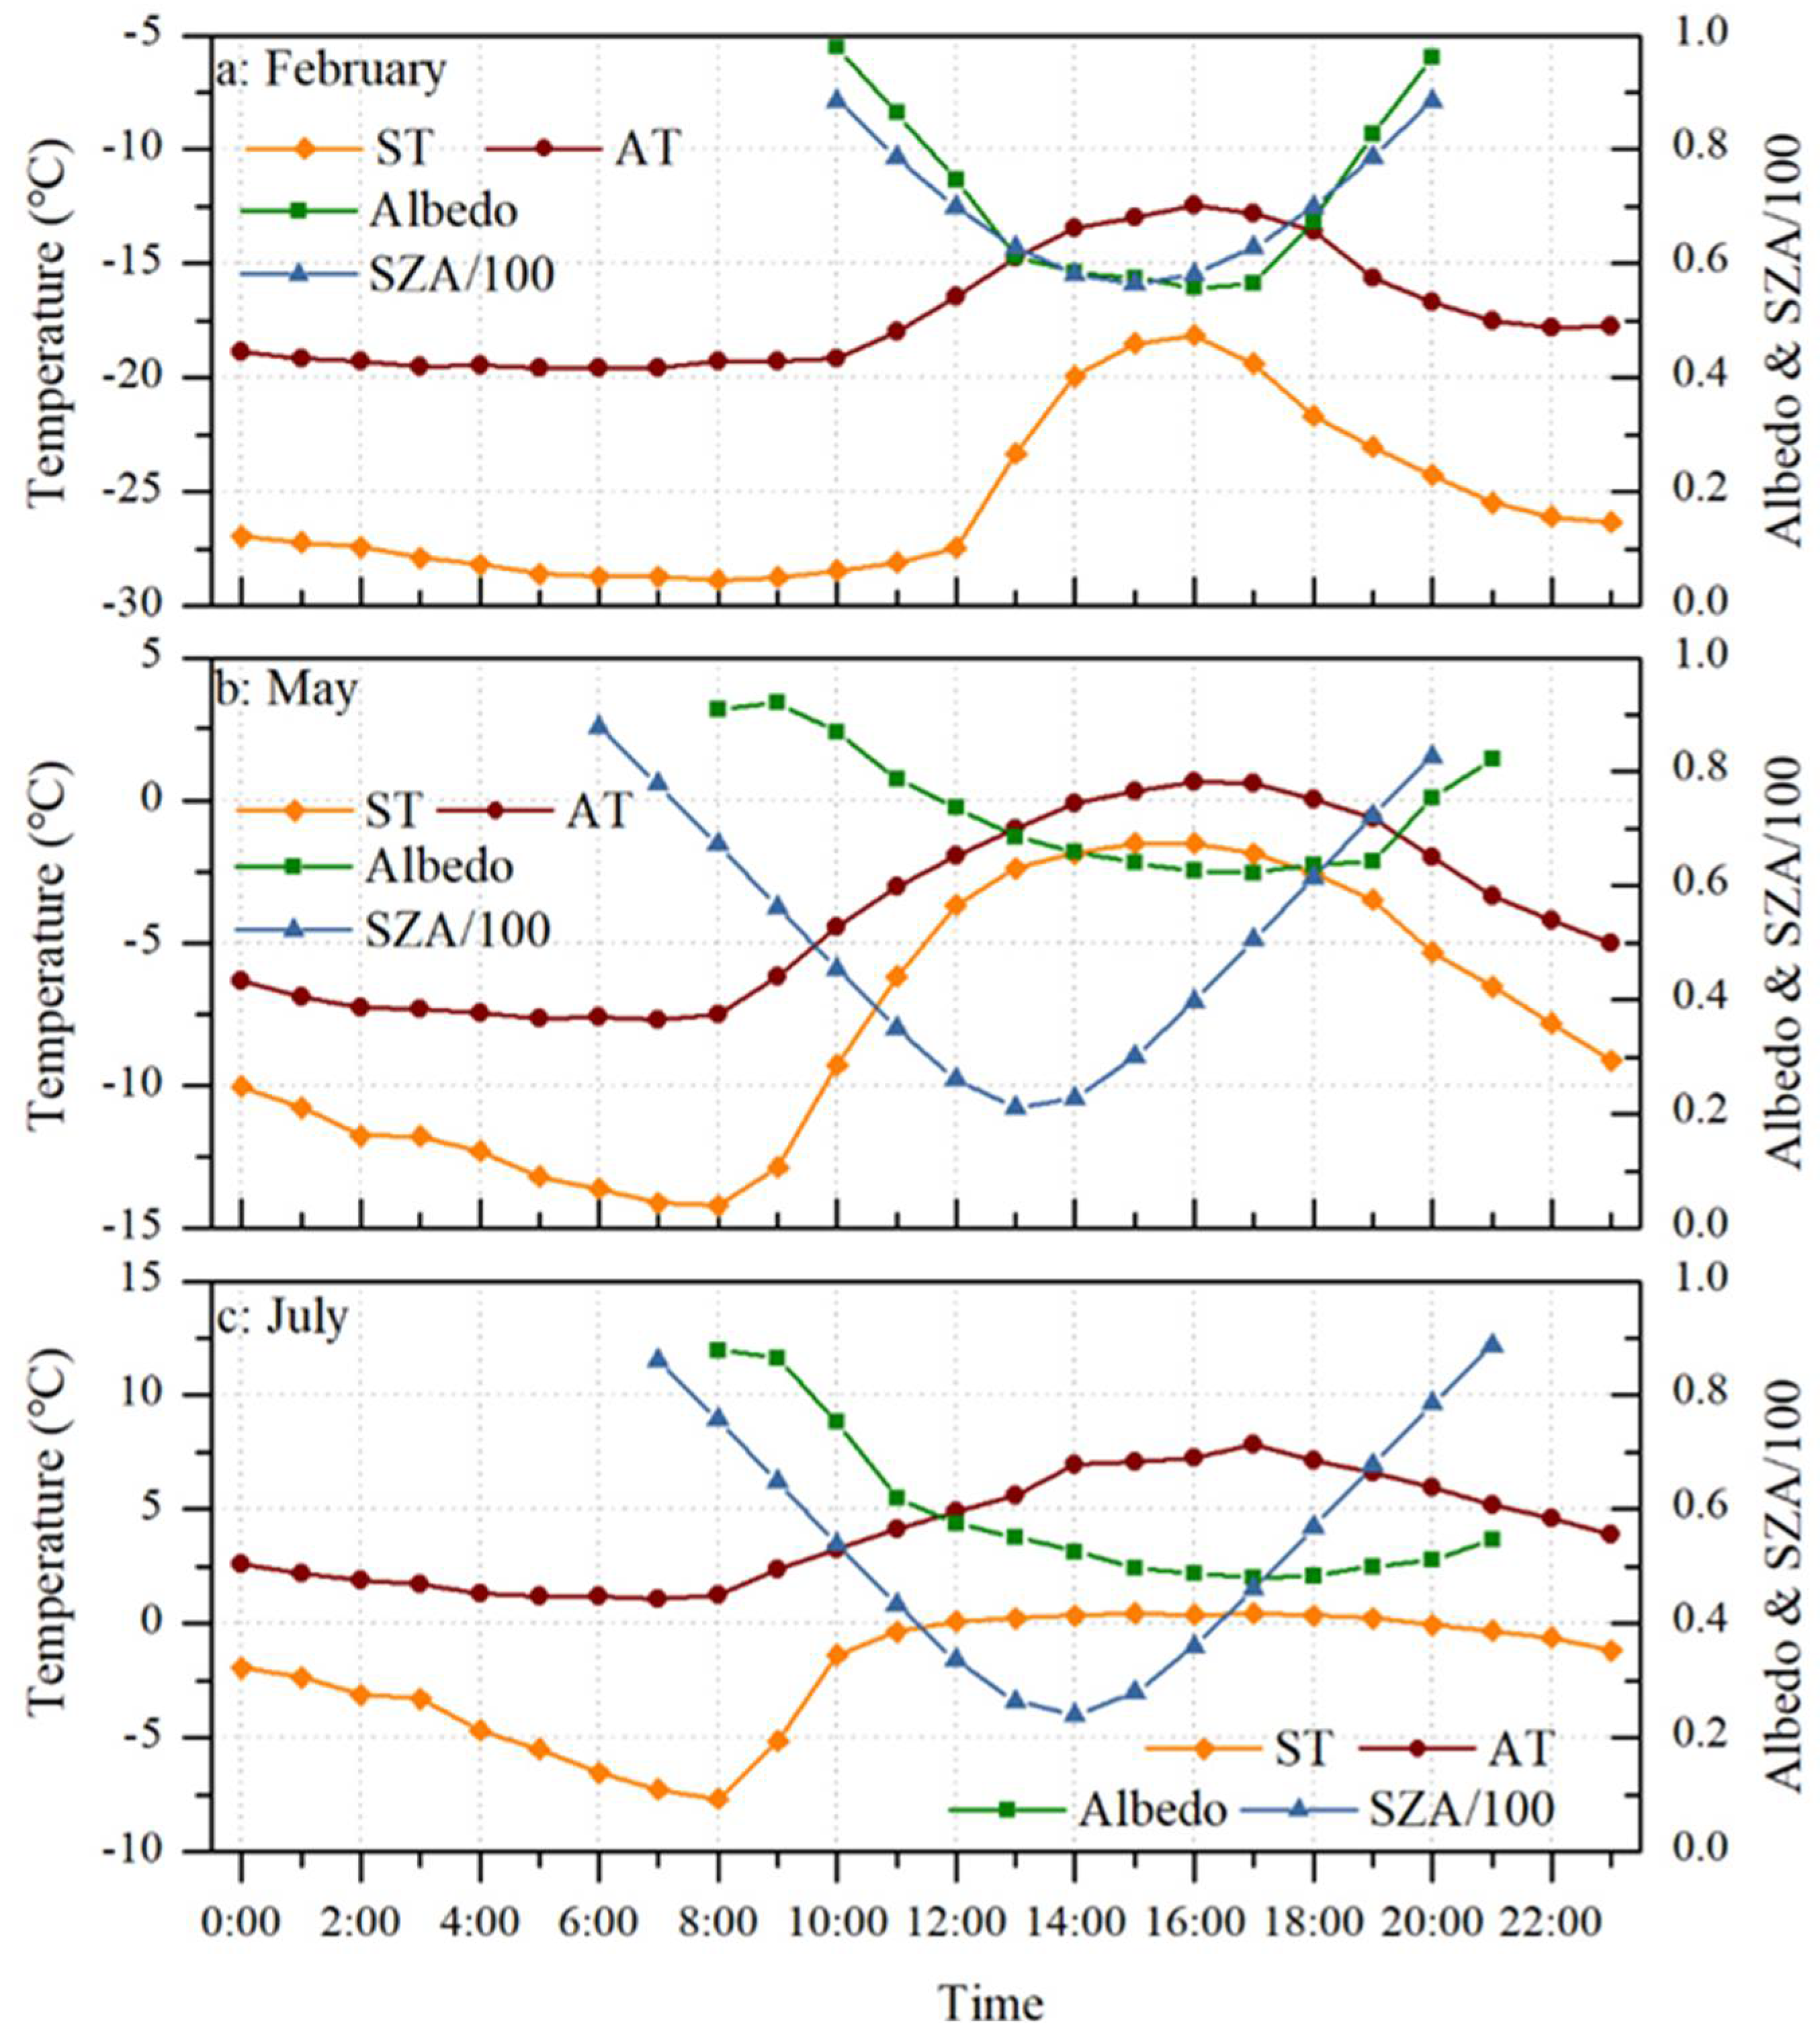
For the type A cycle, take February as an example. Snow albedo has the same diurnal symmetry as solar zenith angle, and consistent extremum time (Figure 12a). Given the extremely low air temperature and surface temperature, such a near-symmetric clear-sky diurnal cycle is mainly influenced by the diurnal variation of the solar zenith angle. The relationship between glacier albedo and solar zenith angle has been simulated using coupled snow–ice–atmosphere radiative transfer models, which indicate that the effect is greatest at a high solar zenith angle, and that albedo varies little when the solar zenith angle is <55° [47]. Here, the relationship between hourly snow albedo and solar zenith angle within the range of 55° to 80° was further verified by the field measured data. To minimize the impact of variations in cloud cover, the analysis of the effects of solar zenith angle was limited to clear-sky days (transmissivity > 0.7) during the period from November 2018 to February 2019. During this period, the glacier surface was covered by snow. Over snow surfaces, there was a significant positive correlation between albedo and solar zenith angle. The correlation coefficient was 0.86 (significant at the 99% confidence level). Assuming a linear relationship between them, increases in snow albedo of up to 0.5 can occur in response to changes in the solar zenith angle of between 55° and 80°.

Figure 12.
The mean diurnal cycle of surface albedo, air temperature (AT), surface temperature (ST), and solar zenith angle for clear sky at the glacier AWS site in February (a), May (b), and July (c) 2019.
For the type B cycle, the symmetric diurnal cycles of solar zenith angle alone cannot explain the asymmetric diurnal variations of snow albedo. Other factors must be more active, such as snow metamorphism and surface hoar formations. In May, mean diurnal surface temperature varies from −14 °C to −2 °C, grain size-related snow metamorphism occurs, and “the rate of metamorphism increases exponentially as the increase of temperature, reducing the specific surface area and thus glacier albedo [17]”. The lower albedo in the afternoon is likely related to the grain size-related snow metamorphism.
However, considering the irreversible processes of snow grain size increase in snow metamorphism, grain size-related snow metamorphism cannot explain the asymmetric snow albedo diurnal cycles. Indeed, the asymmetry of the diurnal cycle of snow albedo, coincident with the diurnal variations of air temperature (Figure 12b), is presumably associated with the surface hoar formations. The air temperature is close to zero in the daytime and drops below −8 °C in the early morning in clear skies—“surface hoar crystals form at ‘night’ and early morning, and then sublimate because of warming in the daytime [17]”. This cycle happens every day and could partially explain the diurnal asymmetry of snow albedo variation. Meanwhile, the larger SZA in the morning and afternoon also contributes to a higher albedo.
However, for the type C cycle (Figure 12c), which occurs in July and August, the air temperature is continuous above 0 °C. The rapid snow metamorphism still exists, and even snow begins to melt and disappear and glacier ice is exposed, while surface hoar formation is impossible. The progressive decline of surface albedo, especially the higher albedo values in the morning, require other factors to explain; the melt/freeze cycle is the most likely factor. The surface temperature reaches its melting point in the daytime and drops to −8 °C in the early morning under clear skies. The diurnal variation in surface temperature indicates that the meltwater from the daytime ablation refreezes when the surface temperature drops below the freezing point, brightening the surface and increasing the albedo in the morning. The progressive decline in surface albedo results from the surface melting, and even the accumulation of impurities.
5.3. Absorbed Shortwave Radiation Difference
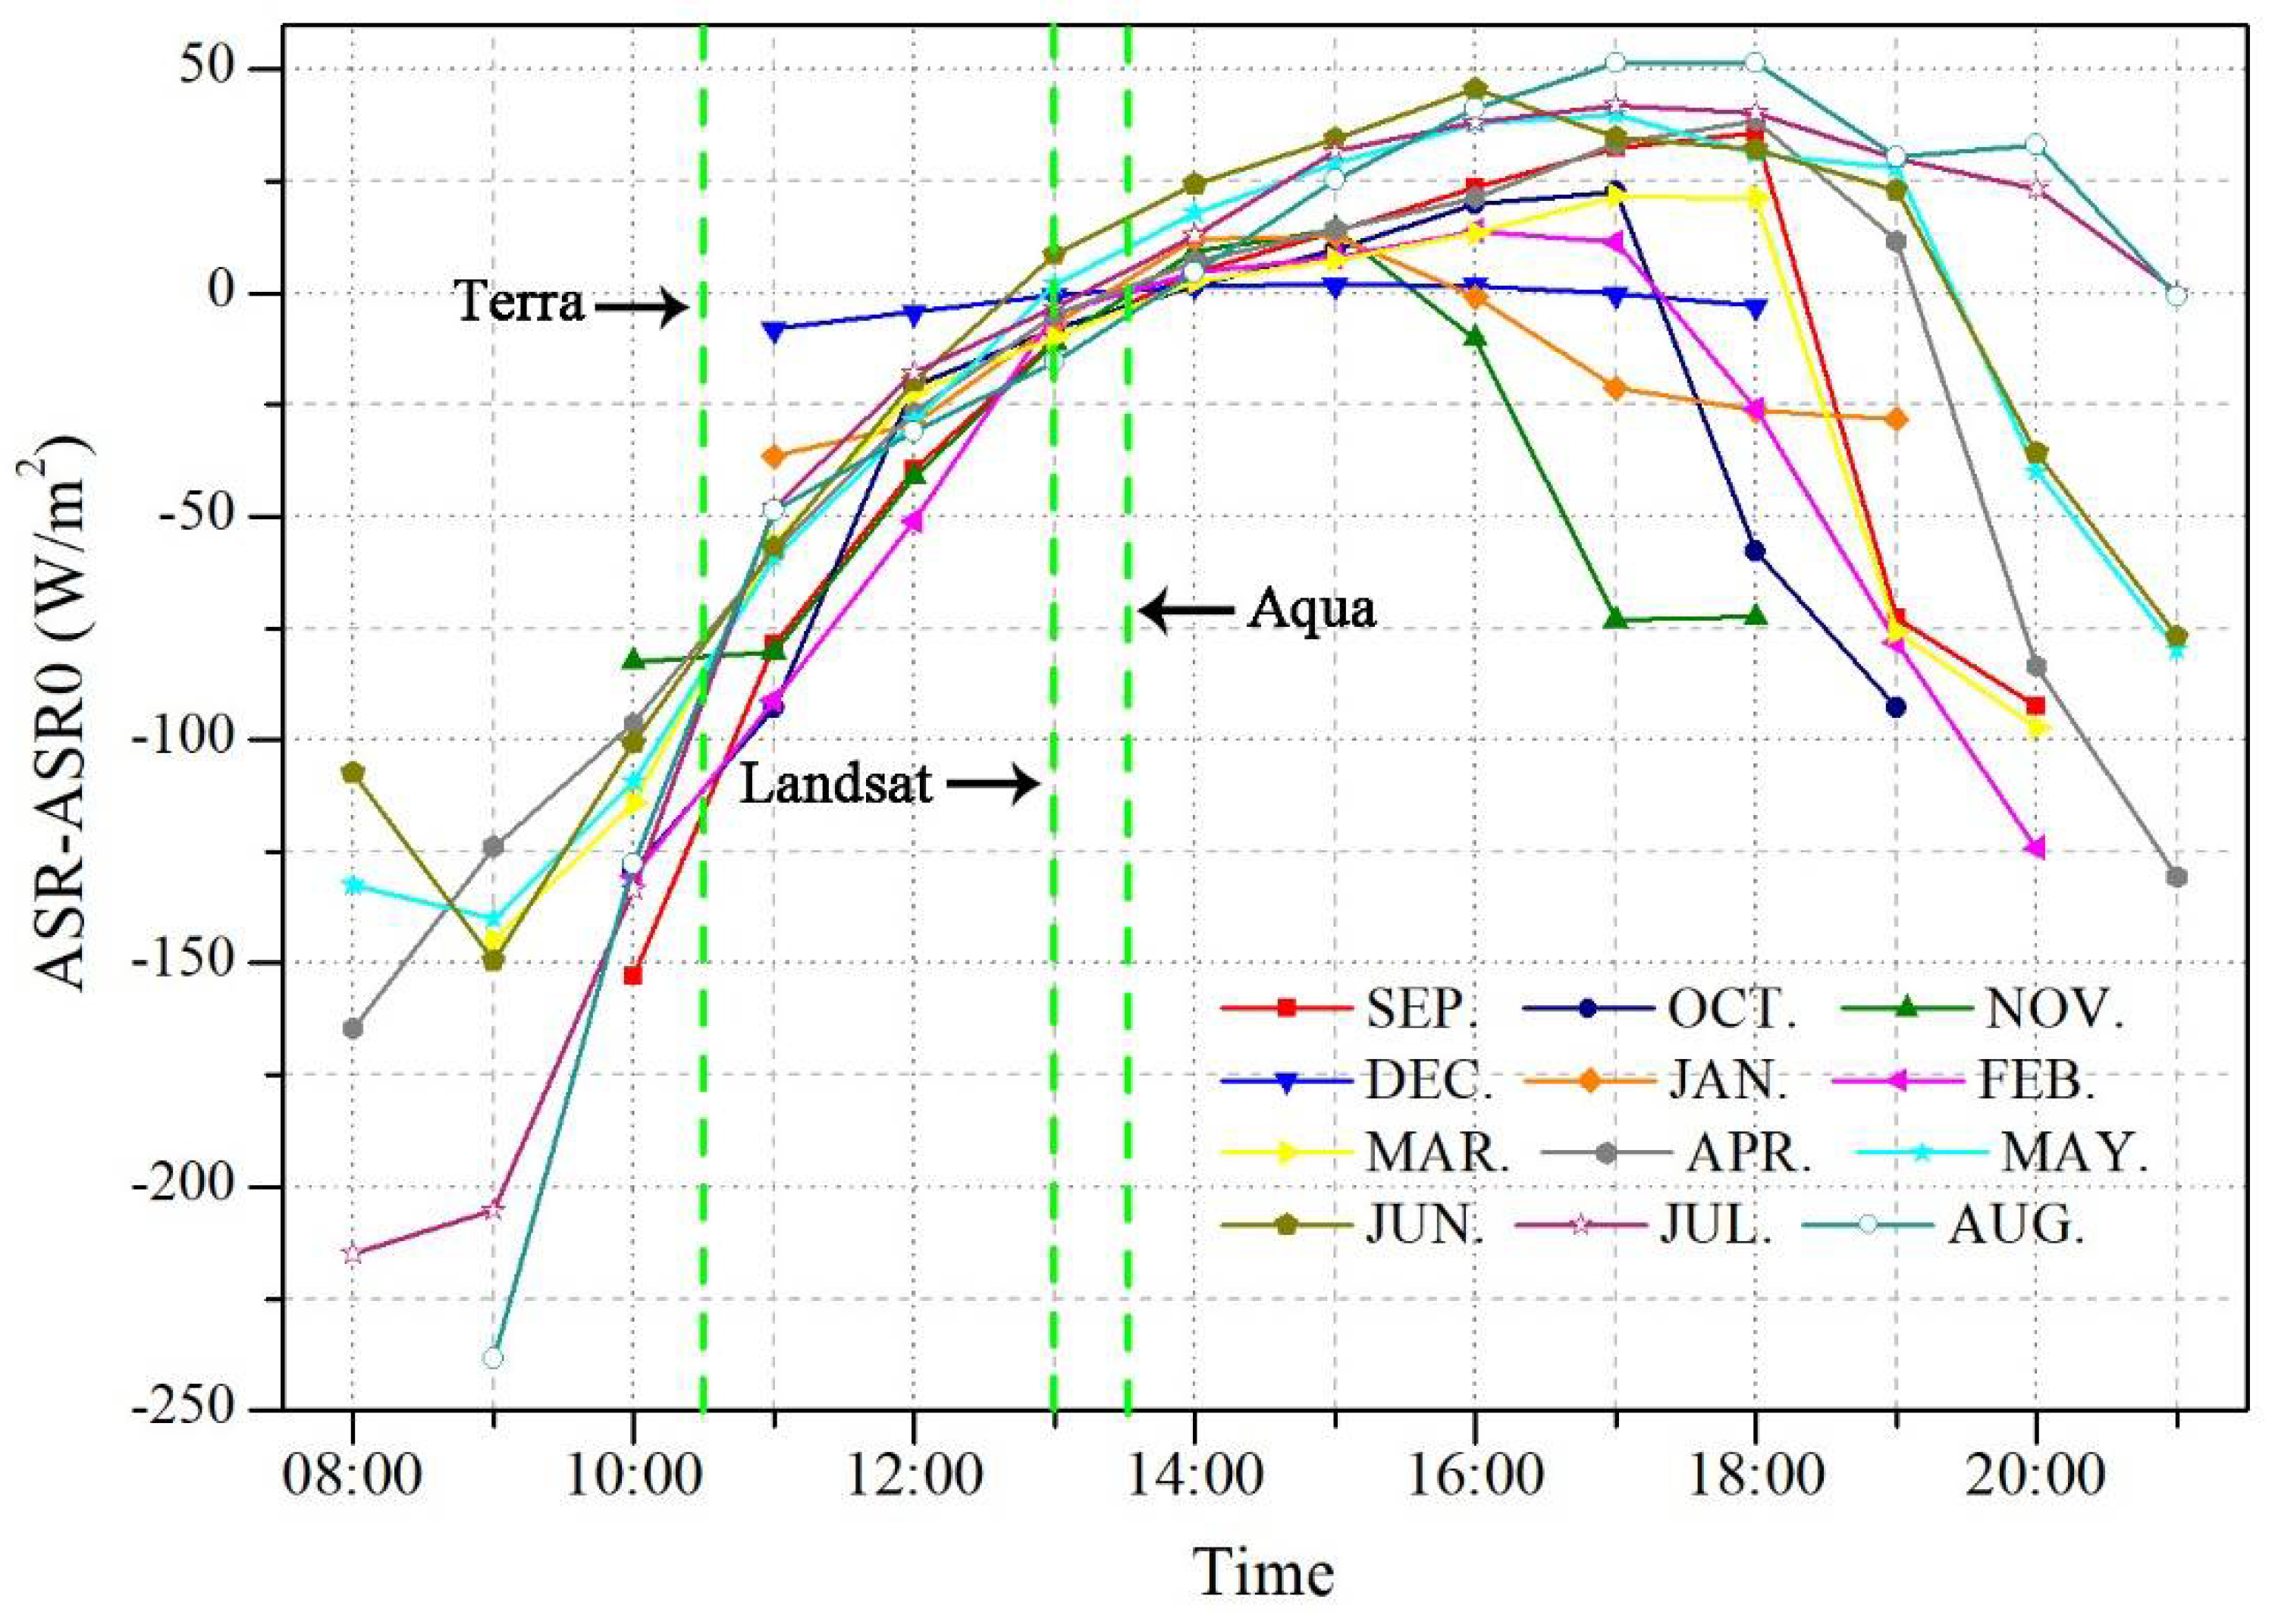
The diurnal variations presented at the glacier AWS site imply that momentary measurements of surface albedo at certain times of a day (satellite measurements) will, if extrapolated to daily or longer timescale averages, result in systematic biases in the surface energy budget. To quantify the potential biases incurred by extrapolating instantaneous albedos to daily mean albedos, we used the method of Wang and Zender [17] to “compare the difference between the absorbed solar radiation (ASR0) from the 24 h mean downwelling shortwave and upwelling shortwave, and the ASR derived from the 24 h mean downwelling shortwave and the instantaneous albedo within each hour, which is assumed to represent the satellite-derived daily (or 24 h mean) albedo. Thus, the absorbed shortwave radiation difference (ASR-ASR0) is assumed to represent the daily mean difference between satellite measurements and in situ measurements.” The results are presented in Figure 13.

Figure 13.
The mean daily difference in absorbed solar radiation (ASR) on clear-sky days for each month at the glacier AWS site on the Urumqi Glacier No.1 during the period of 1 September 2018 to 31 August 2021. The vertical green dashed lines indicate the pass time of the Landsat, Terra, and Aqua satellites.
On clear days, daily ASR differences vary from −238.5 W/m2 (09:00 in August) to 51.4 W/m2 (18:00 in August). Taking the overpass times of satellites Landsat (13:00), Aqua (13:30), and Terra (10:30) as examples, the mean ASR differences are −5.38 W/m2 at 13:00, 1.61 W/m2 at 13:30, and 80.58 W/m2 at 10:30, respectively. In generally, more than 50 W/m2 of the ASR difference happens before 11:00 and after 18:00, and the minimum is at 13:00, ranging from −15.5 W/m2 to 8.7 W/m2. In December, the oscillation in the ASR difference is at its minimum, and reaches its maximum in August.
As a consequence, even though satellite sensors could correctly derive surface albedo, only when the overpass times of satellites is around 13:00, the satellite-measured glacier albedo can be viewed as daily mean clear-sky albedo. For the rest of the day, the satellite-measured glacier albedo may generate systematic errors in the surface energy budget if it is used to represent the daily mean albedo. The magnitude of errors is dependent on the albedo value and the amount of the downwelling solar radiation. Especially in July and August, when more than 80% of the melt occurs, the error in the surface energy budget is up to more than 200 W/m2.
5.4. Potential Impact of Albedo Variation on Glacier Melting
Glacier melting has been shown to be very sensitive to variations in albedo, and was accelerated by albedo reduction in previous studies. In this study, we estimate the potential impact of albedo variation on glacier melting.
As shown in Section 4.1, in July, the glacier albedo revealed a rapid decreasing trend with a rate of 0.28% yr−1, implying a total reduction in albedo by 5.88% from 2000 to 2020. Assuming that the incident solar radiation remains constant during this period, the albedo reduction can increase the average absorbed energy by 15.26 W m−2, equivalent to a 2.45 m w.e. increase in melting over the period of 2000–2020. The cumulative mass balance of the eastern branch of Urumqi Glacier No.1 was 14.505 m w.e. from 2000 to 2020. Hence, the enhanced glacier melt (because of albedo reduction in July) contributed to approximately 16.9% of the total glacier mass loss. Throughout the ablation season (May to August), the total albedo reduced by about 1.8% from 2000 to 2020, which can produce an increase in glacier melt of 2.9 m w.e., about 20% of the cumulative mass loss.
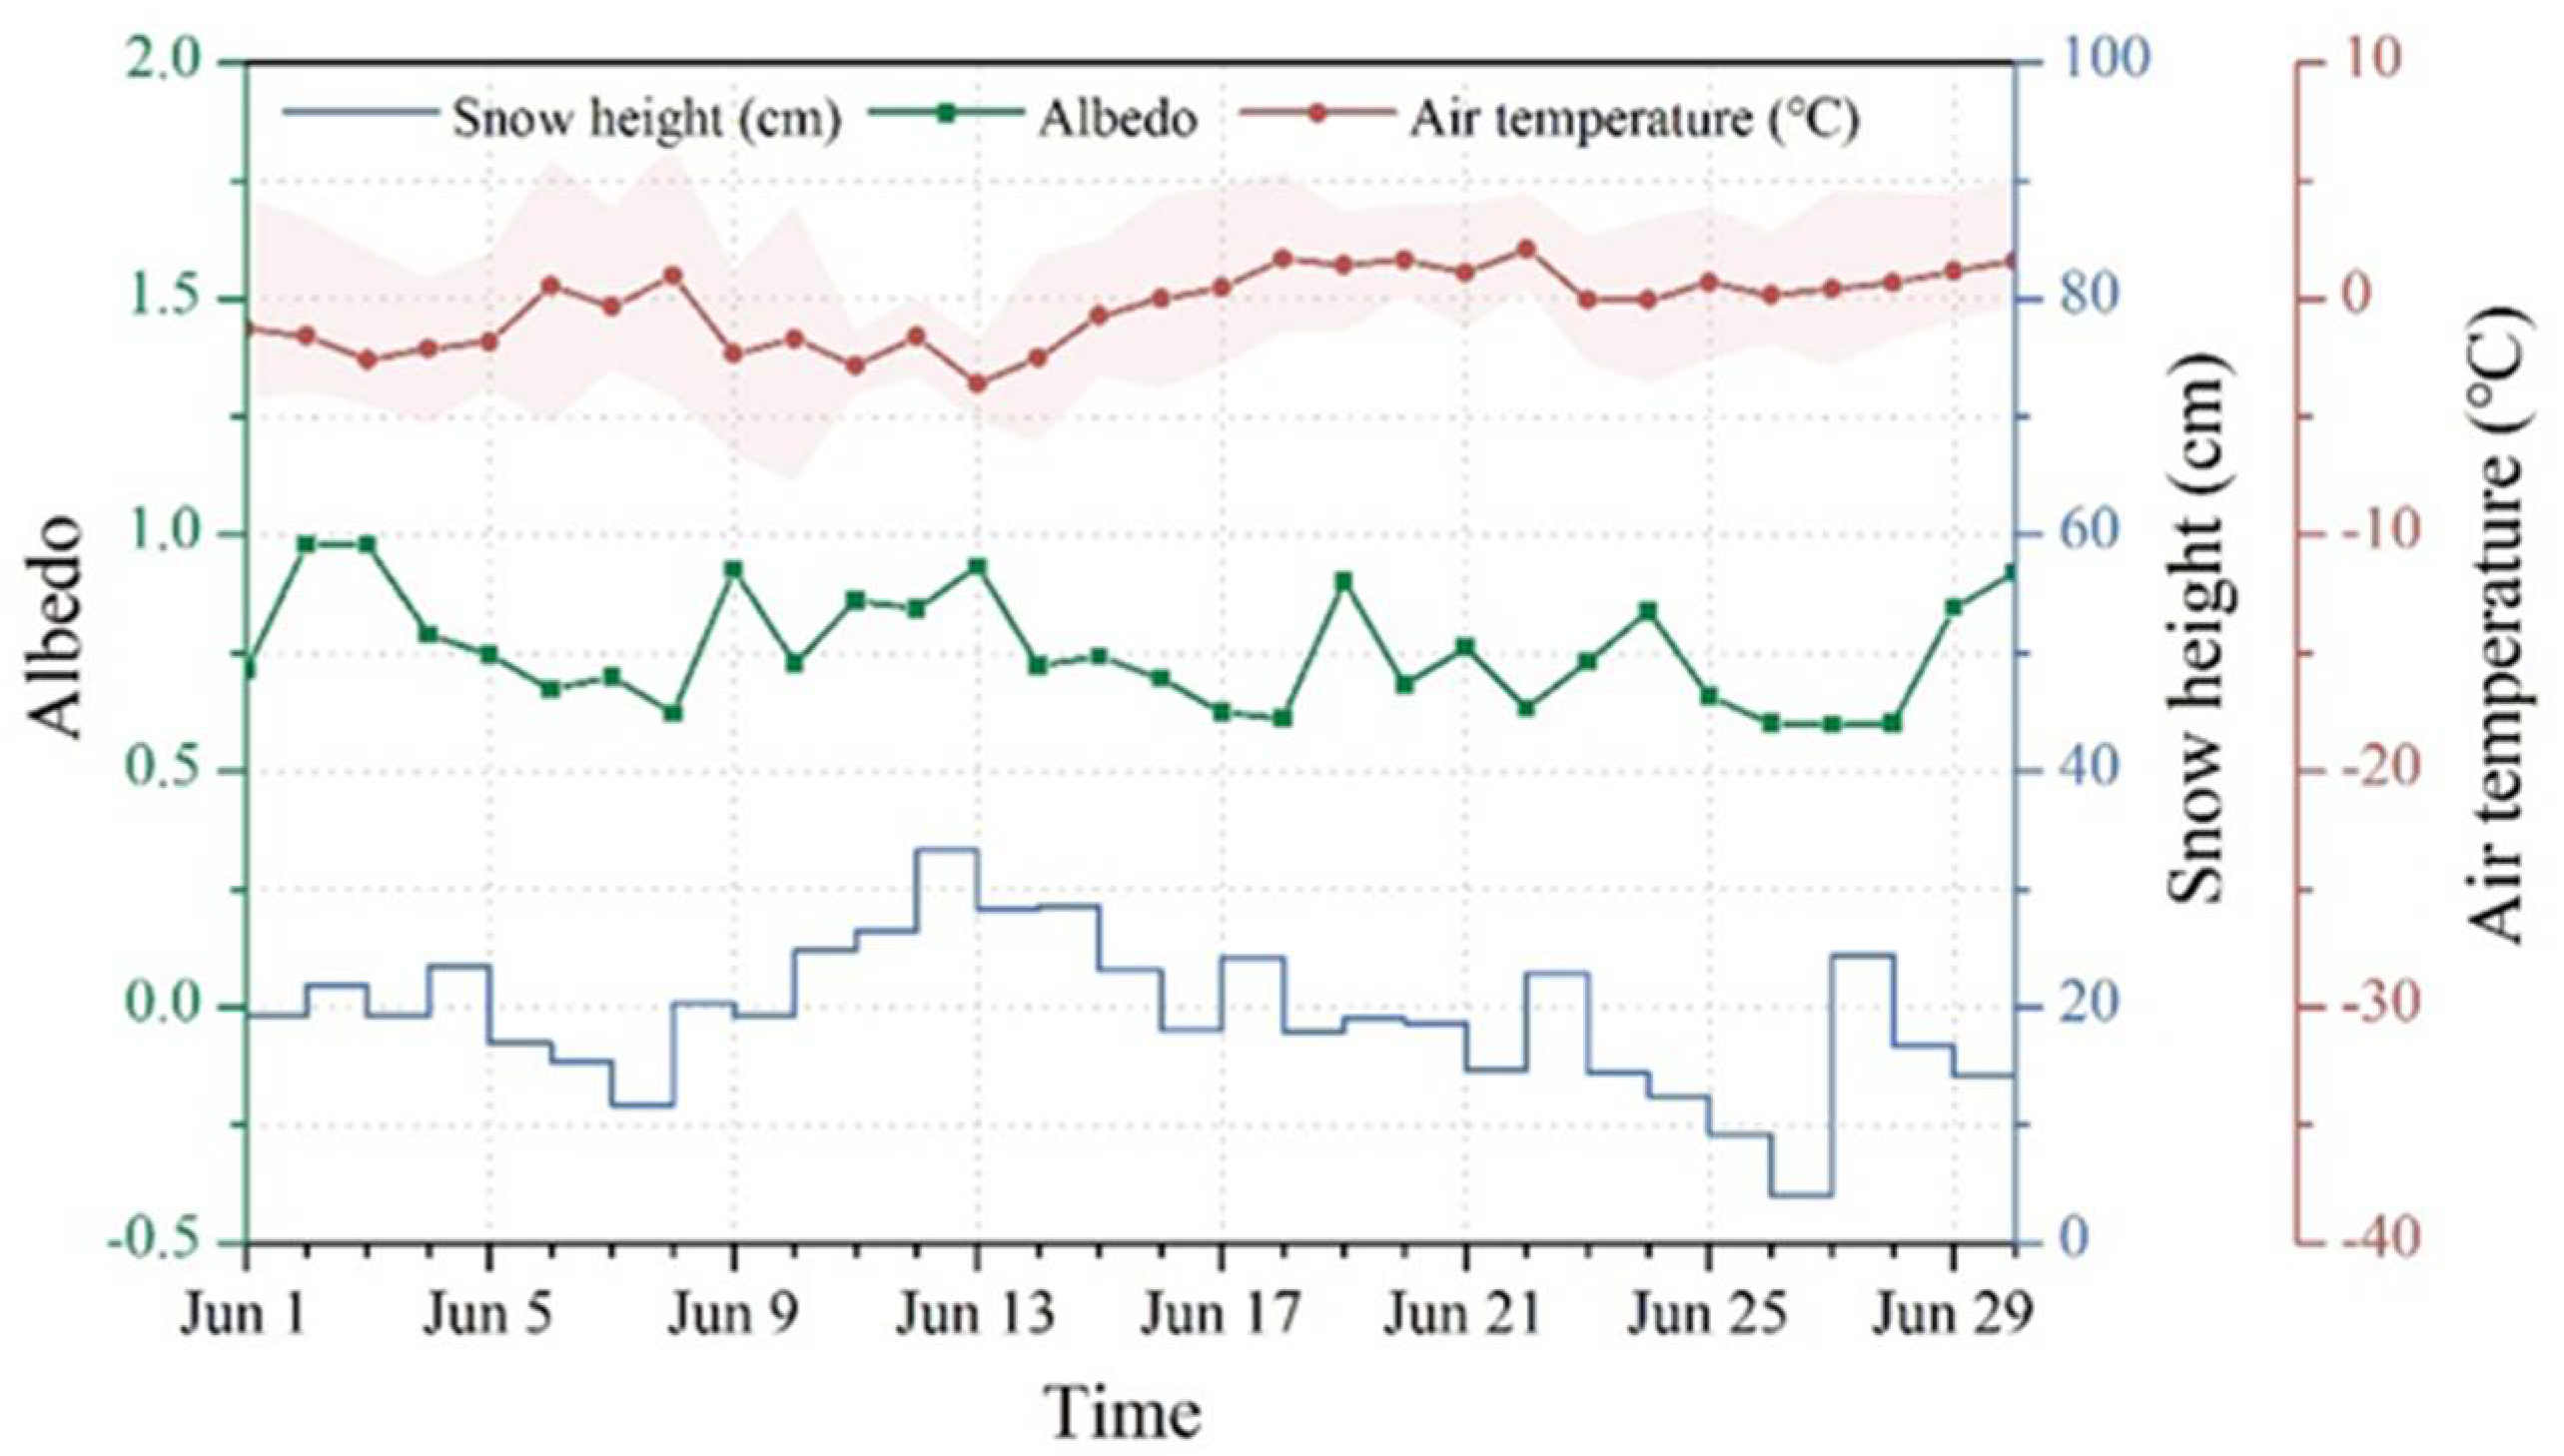
In addition, intermittent summer snow events temporarily increase the glacier albedo, which further impact the glacier melting. Figure 14 presents an overview of the average daily values of air temperature, glacier surface height, and albedo at the glacier AWS site in June 2019. There were three snowfall events from 8 to 28 June. The glacier surface height rose roughly 21 cm during first snow event (8 to 13 June), and 6 cm (17 to 18 June) and 8 cm (22 to 23 June) during the last two events. These snowfall events induced an immediate increase in albedo from 0.6 to 0.93, followed by a decay back to albedo typical of aged snow over the course of a few days. Finally, an average albedo of 0.74 was observed over this 20-day period (8–28 June). If 0.6 was taken as the typical albedo value of the glacier surface in June, the three snowfall events resulted in an average increase of 0.14 in surface albedo, corresponding a reduced average absorbed energy of 35 W m−2, equivalent to a 181 mm w.e. decrease in melting over this 20-day period. Total surface ablation at the AWS site was actually about 7.76 cm, equivalent to about 42.7 mm w.e. Therefore, summer snowfall events not only directly increase the glacial accumulation, but also reduce the glacier melting through increased albedo, and the extent of this decrease was even as high as 80% in June.
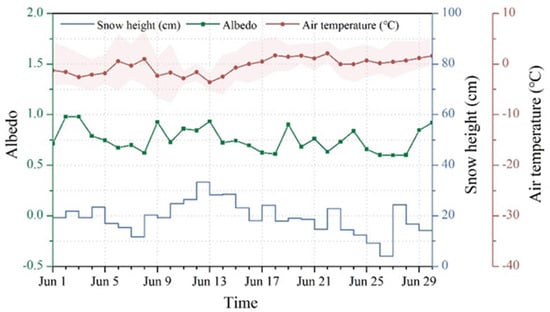
Figure 14.
Daily mean values of surface albedo, air temperature, and snow height at the glacier AWS site in June 2019. The light red shadows around the mean air temperature indicate the highest and lowest air temperatures.
6. Conclusions
Surface albedo has a key influence on the absorption of shortwave radiation at the glacier surface, and thus on the mass balance of the glacier. However, for Urumqi Glacier No.1, where most accumulation and ablation occur at the same time during the warmer season, the variations in surface albedo are complex and still poorly understood.
During the period from 2000 to 2021, the average ablation-period albedo from MOD10A1 products presented a slight but not statistically significant downward trend, with a total decrease of 1.87%. Specifically, the decrease in glacier albedo was quicker in July than in August (5.88% vs. 4.13%), while there was a slight increase in May and June. For the ice albedo, retrieved from the end-of-summer Landsat imagery, an average of 0.16 was obtained between 2002 and 2019, with a range from 0.12 to 0.21. The blackening phenomenon was shown on the east branch glacier, while the process of glacier blackening was not observed on the west branch glacier. As expected, air and solid precipitation are the main drivers of interannual variations in glacier albedo. It is, however, noted that in different periods of the ablation season, two climate variables affect glacier albedo to varying degrees. In July, the remarkable negative trend in albedo is related to the air temperature, and in May, the slight upward trend in albedo is the result of an increase in solid precipitation during the accumulation period (September to the following April).
Regarding the seasonal variability, a bimodal pattern was identified. This differs significantly from what is observed on other midlatitude glaciers. A first albedo peak occurred in December, and was mainly associated with decreasing air temperatures. A second albedo peak occurred in April or May, before the onset of the ablation season, and is linked to the increase in solid precipitation associated with the summer monsoon. The air temperature during this period was still relatively low.
On clear days, the strong diurnal cycles of albedo measured by AWS were visible. Moreover, the month-to-month variation patterns were noticeably different, which can be classified into three major types: symmetric pattern, asymmetric pattern, and progressive decreasing pattern. For the symmetric pattern, the diurnal cycle is mainly forced by the diurnal variation of solar zenith angle. For the asymmetric pattern, the diurnal cycle is the result of the combined influence of surface hoar formations, snow metamorphism, and solar zenith angle. The progressive decline in diurnal albedo is associated with snow melt and the melt/freeze cycle. However, under cloudy or overcast skies, the remarkable diurnal variability in glacier albedo disappears, and the value is nearly constant.
The estimation of the potential impact of albedo variation on glacier melting indicates that the effect of surface albedo reduction enhanced glacier melting by about 20% during the past 20 years. The short-term increase in albedo caused by summer snowfall can considerably reduce glacier melting, and the extent of its decrease was as high as 80% in June. In addition, the strong diurnal variation in glacier albedo indicates that satellite-measured glacier albedo will generate systematic errors in the surface energy budget if it is used to represent daily mean albedo, and the closer the satellite overpass times are to noon, the smaller the error is.
In the current study, we analyzed multi-temporal variations in glacier albedo and their influencing factors using a high-quality in situ data set collected with an AWS and remote sensing data. To obtain as much data on daily albedo during the ablation period since 2000 as possible, the MOD10A1 snow albedo product was selected; however, due to its low spatial resolution, there is only one pure pixel on the glacier. This implies that the spatial representativeness of our results is limited, especially for the west branch glacier. For analyzing long-term variations in mountain glacier albedo, a future line of research could employ other algorithms, such as the MODImLab toolbox [48,49], and the spatial and temporal adaptive reflectance fusion model (STARFM) [50] to capture more spatial detail while ensuring temporal resolution. In addition, it should be kept in mind that the bimodal pattern of the seasonal variability was presented at the AWS site. The seasonal variation in albedo needs further identification over the whole glacier. On clear days, the difference in month-to-month diurnal cycles is significant and robust. Nevertheless, the reasons associated with the diverse diurnal cycles must be further quantified to apply them to the hourly albedo parameterization scheme.
Supplementary Materials
The following supporting information can be downloaded at: https://www.mdpi.com/article/10.3390/rs14040808/s1, Figure S1. Spatiotemporal distribution of the surface albedo of Urumqi Glacier No. 1 from 2002 to 2019. The diagonal area is visually identified as the extent of bare area; Figure S2. The trends in solid precipitation and air temperature in different time scales during the period of 2000–2020; Table S1. Overview of all compared glaciers.
Author Contributions
X.Y.: conceptualization, data collection and analysis, methodology, and writing—original draft; Z.L.: conceptualization, data collection, and resources; H.L.: conceptualization, data analysis, and methodology; F.W.: data collection and resources; S.J.: data collection. All authors have read and agreed to the published version of the manuscript.
Funding
This work was supported by the National Natural Science Foundation of China (42001066); the Open-End Foundation for National Cryosphere Desert Data Center (20D05); the Foundation for Excellent Youth Scholars of NIEER, CAS (FEYS2019003); the Key Research Program of Frontier Sciences of Chinese Academy of Sciences (QYZDB-SSW-SYS024); the State Key Laboratory of Cryosphere Science Founding (SKLCS-ZZ-2021); and the Second Tibetan Plateau Scientific Expedition and Research (2019QZKK0201).
Data Availability Statement
The data that support the findings of this study are available upon request by email to the author (yuexiaoying@lzb.ac.cn).
Acknowledgments
We thank the members of Tien Shan Glaciological Station for supporting the in-field measurements. We also thank the USGS (US Geological Survey) for the Landsat imagery data and NASA for the MODIS data.
Conflicts of Interest
The authors declare no conflict of interest.
References
- Qin, D.; Zhou, B.; Xiao, C. Progress in studies of cryospheric changes and their impacts on climate of China. Acta Meteorol. Sin. 2014, 72, 869–879. (In Chinese) [Google Scholar] [CrossRef]
- Gagné, K.; Rasmussen, M.B.; Orlove, B. Glaciers and society: Attributions, perceptions, and valuations. Wiley Interdiscip. Rev. Clim. Chang. 2014, 5, 793–808. [Google Scholar] [CrossRef]
- Li, Z.; Li, K.; Wang, L. Study on recent glacier changes and their impact on water resources in Xinjiang, North Western China. Quat. Sci. 2010, 30, 96–106. [Google Scholar]
- Che, Y.; Zhang, M.; Li, Z.; Wei, Y.; Nan, Z.; Li, H.; Wang, S.; Su, B. Energy balance model of mass balance and its sensitivity to meteorological variability on Urumqi River Glacier No.1 in the Chinese Tien Shan. Sci. Rep. 2019, 9, 13958. [Google Scholar] [CrossRef] [Green Version]
- Sun, W.; Qin, X.; Wang, Y.; Chen, J.; Du, W.; Zhang, T.; Huai, B. The response of surface mass and energy balance of a continental glacier to climate variability, western Qilian Mountains, China. Clim. Dyn. 2018, 50, 3557–3570. [Google Scholar] [CrossRef]
- Jiang, X.; Wang, N.; He, J.; Wu, X.; Song, G. A distributed surface energy and mass balance model and its application to a mountain glacier in China. Chin. Sci. Bull. 2010, 55, 2079–2087. [Google Scholar] [CrossRef]
- Zhu, M.; Yao, T.; Yang, W.; Maussion, F.; Huintjes, E.; Li, S. Energy- and mass-balance comparison between Zhadang and Parlung No. 4 glaciers on the Tibetan Plateau. J. Glaciol. 2015, 61, 595–607. [Google Scholar] [CrossRef] [Green Version]
- Brock, B.W.; Willis, I.C.; Sharp, M.J. Measurement and parameterization of albedo variations at Haut Glacier d’Arolla, Switzerland. J. Glaciol. 2000, 46, 675–688. [Google Scholar] [CrossRef] [Green Version]
- Li, Z.; Li, H.; Chen, Y. Mechanisms and Simulation of Accelerated Shrinkage of Continental Glaciers a Case Study of Urumqi Glacier No. 1 in Eastern Tianshan, Central Asia. J. Earth Sci. 2011, 22, 423–430. [Google Scholar] [CrossRef]
- Cuffey, K.M.; Paterson, W.S.B. The Physics of Glaciers, 4th ed.; Butterworth-Heinemann: Oxford, UK, 2010; pp. 145–146. [Google Scholar]
- Oerlemans, J.; Giesen, R.H.; Van den Broeke, M.R. Retreating alpine glaciers increased melt rates due to accumulation of dust (Vadret da Morteratsch, Switzerland). J. Glaciol. 2009, 55, 729–736. [Google Scholar] [CrossRef] [Green Version]
- Wang, J.; Ye, B.; Cui, Y.; He, X.; Yang, G. Spatial and temporal variations of albedo on nine glaciers in western China from 2000 to 2011. Hydrol. Processes 2014, 28, 3454–3465. [Google Scholar] [CrossRef]
- Seo, M.; Kim, H.C.; Huh, M.; Yeom, J.M.; Lee, C.S.; Lee, K.S.; Choi, S.; Han, K.S. Long-Term variability of surface albedo and its correlation with climatic variables over Antarctica. Remote Sens. 2016, 8, 981. [Google Scholar] [CrossRef] [Green Version]
- Oerlemans, J.; Knap, W.H. A 1 year record of global radiation and albedo in the ablation zone of Morteratschgletscher, Switzerland. J. Glaciol. 1998, 44, 231–238. [Google Scholar] [CrossRef] [Green Version]
- Marshall, S.J.; Miller, K. Seasonal and interannual variability of melt-season albedo at Haig Glacier, Canadian Rocky Mountains. Cryosphere 2020, 14, 3249–3267. [Google Scholar] [CrossRef]
- Jonsell, U.; Hock, R.; Holmgren, B. Spatial and temporal variations in albedo on Storglaciaren, Sweden. J. Glaciol. 2003, 49, 59–68. [Google Scholar] [CrossRef] [Green Version]
- Wang, X.; Zender, C.S. Arctic and Antarctic diurnal and seasonal variations of snow albedo from multiyear Baseline Surface Radiation Network measurements. J. Geophys. Res. 2011, 116, F0Shaw08. [Google Scholar] [CrossRef] [Green Version]
- Fugazza, D.; Senese, A.; Azzoni, R.S.; Maugeri, M.; Maragno, D.; Diolaiuti, G.A. New evidence of glacier darkening in the Ortles-Cevedale group from Landsat observations. Glob. Planet. Chang. 2019, 178, 35–45. [Google Scholar] [CrossRef]
- Naegeli, K.; Huss, M.; Hoelzle, M. Change detection of bare-ice albedo in the Swiss Alps. Cryosphere 2019, 13, 397–412. [Google Scholar] [CrossRef] [Green Version]
- Xu, M.; Kang, S.; Wu, H.; Yuan, X. Detection of spatio-temporal variability of air temperature and precipitation based on long-term meteorological station observations over Tianshan Mountains, Central Asia. Atmos. Res. 2018, 203, 141–163. [Google Scholar] [CrossRef]
- Takeuchi, N.; Li, Z. Characteristics of Surface Dust on Ürümqi Glacier No. 1 in the Tien Shan Mountains, China. Arct. Antarct. Alp. Res. 2008, 40, 744–750. [Google Scholar]
- Yue, X.; Li, Z.; Zhao, J.; Fan, J.; Takeuchi, N.; Wang, L. Variations in albedo and relationship with surface dust at Urumqi Glacier No.1 in Tien Shan, China. Front. Earth Sci. 2020, 8, 110. [Google Scholar] [CrossRef]
- Farinotti, D.; Longuevergne, L.; Moholdt, G.; Duethmann, D.; Mölg, T.; Bolch, T.; Vorogushyn, S.; Güntner, A. Substantial glacier mass loss in the Tian Shan over the past 50 years. Nat. Geosci. 2015, 8, 716–722. [Google Scholar] [CrossRef]
- Yang, D.; Kang, E.; Felix, B. Characteristics of precipitation in the source area of the Urumqi River Basin. J. Glaciol. Geocryol. 1992, 14, 258–266. [Google Scholar]
- Klein, A.G.; Stroeve, J. Development and validation of a snow albedo algorithm for the MODIS Instrument. Ann. Glaciol. 2002, 34, 45–52. [Google Scholar] [CrossRef] [Green Version]
- Hall, D.K.; Riggs, G.A. MODIS/Terra Snow Cover Daily L3 Global 500 m SIN Grid, [2000–2021], Version 61; NASA National Snow and Ice Data Center Distributed Active Archive Center: Boulder, CO, USA, 2021. [Google Scholar]
- Stamnes, K.; Tsay, S.C.; Wiscombe, W.; Jayaweere, K. Numerically stable algorithm for discrete-ordinate-method radiative transfer in multiple scattering and emitting layered media. Appl. Opt. 1988, 27, 2502–2509. [Google Scholar] [CrossRef]
- Wang, Z.; Schaaf, C.B.; Chopping, M.J.; Strahler, A.H.; Wang, J.; Román, M.O.; Rocha, A.V.; Woodcock, C.E.; Shuai, Y. Evaluation of Moderate-resolution Imaging Spectroradiometer (MODIS) snow albedo product (MCD43A) over tundra. Remote Sens. Environ. 2012, 117, 264–280. [Google Scholar] [CrossRef]
- Mortimer, C.A.; Martin, S. Spatiotemporal variability of Canadian High Arctic glacier surface albedo from MODIS data. Cryosphere 2018, 12, 701–720. [Google Scholar] [CrossRef] [Green Version]
- Gunnarsson, A.; Gardarsson, S.M.; Pálsson, F.; Jóhannesson, T.; Sveinsson, Ó.G.B. Annual and inter-annual variability and trends of albedo of Icelandic glaciers. Cryosphere 2021, 15, 547–570. [Google Scholar] [CrossRef]
- Tachikawa, T.; Kaku, M.; Iwasaki, A.; Gesch, D.; Oimoen, M.; Zhang, Z.; Danielson, J.; Krieger, T.; Curtis, B.; Haase, J.; et al. ASTER Global Digital Elevation Model Version 2—Summary of Validation Results; NASA Land Processes; NASA Distributed Ac-tive Archive Center/Joint Japan–US ASTER Science Team: Washington, DC, USA, 2011. [Google Scholar]
- Klok, E.J.; Greull, W.; Oerlemans, J. Temporal and spatial variation of the surface albedo of Morteratschgletscher, Switzerland, as derived from 12 Landsat images. J. Glaciol. 2003, 49, 491–502. [Google Scholar] [CrossRef] [Green Version]
- Yue, X.; Zhao, J.; Li, Z.; Zhang, M.; Fan, J.; Wang, L.; Wang, P. Spatial and temporal variations of the surface albedo and other factors influencing Urumqi Glacier No. 1 in Tien Shan, China. J. Glaciol. 2017, 63, 899–911. [Google Scholar] [CrossRef] [Green Version]
- Greuell, W.; De Ruyter de Wildt, M. Anisotropic reflection of melting glacier ice: Measurements and parameterizations. Remote Sens. Environ. 1999, 70, 265–277. [Google Scholar] [CrossRef]
- Reijmer, C.H.; Bintanja, R.; Greuell, W. Surface albedo measurements over snow blue ice in thematic mapper bands 2 and 4 Dronning Maud Land, Antarctica. J. Geophys. Res. 2001, 106, 9661–9672. [Google Scholar] [CrossRef] [Green Version]
- Knap, W.H.; Reijmer, C.H.; Oerlemans, J. Narrowband to broadband conversion of Landsat TM glacier albedos. Int. J. Remote Sens. 1999, 20, 2091–2110. [Google Scholar] [CrossRef]
- Fugazza, D.; Senese, A.; Azzoni, R.S.; Maugeri, M.; Diolaiuti, G.A. Spatial distribution of surface albedo at the Forni Glacier (Stelvio National Park, Central Italian Alpa). Cold Reg. Sci. Technol. 2016, 125, 128–137. [Google Scholar] [CrossRef]
- Knap, W.H.; Brock, B.W.; Oerlemans, J.; Willis, I.C. Comparison of Landsat TM-derived and ground-based albedos of Haut Glacier d’Arolla, Switzerland. Int. J. Remote Sens. 1999, 20, 3293–3310. [Google Scholar] [CrossRef]
- Abermann, J.; Kinnard, C.; Macdonell, S. Albedo variations and impact of cloud on glaciers in the Chilean semi-arid Andes. J. Glaciol. 2014, 60, 183–191. [Google Scholar] [CrossRef] [Green Version]
- Brock, B.W. An analysis of short-term albedo variations at Haut Glacier d’Arolla, Switzerland. Geogr. Ann. 2004, 86, 53–65. [Google Scholar] [CrossRef]
- Kang, E.; Atsumu, O. Study on energy-water-mass balance and the hydrological flow model in a glacierized catchment of Tianshan mountain. Chin. Sci. Bull. 1993, 38, 925–929. [Google Scholar]
- Wang, P.; Li, Z.; Schneider, C.; Li, H.; Hamm, A.; Jing, S.; Xu, C.; Li, H.; Yue, X.; Yang, M. A test study of an energy and mass balance model ap-plication to a site on Urumqi Glacier No. 1, Chinese Tian Shan. Water 2020, 12, 2865. [Google Scholar] [CrossRef]
- WGMS 2021. Global Glacier Change Bulletin No. 4 (2018–2019); Zemp, M., Nussbaumer, S.U., GärtnerRoer, I., Bannwart, J., Paul, F., Hoelzle, M., Eds.; World Glacier Monitoring Service; ISC(WDS)/IUGG(IACS)/UNEP/UNESCO/WMO: Zurich, Switzerland, 2021; p. 278. [Google Scholar] [CrossRef]
- Liang, S.; Fang, H.; Chen, M.; Shuey, C.J.; Walthall, C.; Daughtry, C.; Morisette, J.; Schaaf, C.; Strahler, A. Validating MODIS land surface reflectance and albedo products: Methods and preliminary results. Remote Sens. Environ. 2002, 83, 149–162. [Google Scholar] [CrossRef]
- Shaw, T.E.; Ulloa, G.; Farías-Barahona, D.; Fernandez, R.; Lattus, J.M.; McPhee, J. Glacier albedo reduction and drought effects in the extratropical Andes, 1986–2020. J. Glaciol. 2020, 12, 2865. [Google Scholar] [CrossRef]
- Sirguey, P.; Still, H.; Cullen, N.J.; Dumont, M.; Arnaud, Y.; Conway, J.P. Reconstructing the mass balance of Brewster Glacier, New Zealand, using MODIS-derived glacier-wide albedo. Cryosphere 2016, 10, 2465–2484. [Google Scholar] [CrossRef] [Green Version]
- Gardner, A.S.; Sharp, M.J. A review of snow and ice albedo and the development of a new physically based broadband albedo parameterization. J. Geophys. Res. Earth Surf. 2010, 15, F01009. [Google Scholar] [CrossRef]
- Dumont, M.; Gardelle, J.; Sirguey, P.; Guillot, A.; Six, D.; Rabatel, A.; Arnaud, Y. Linking glacier annual mass balance and glacier albedo retrieved from MODIS data. Cryosphere 2012, 6, 1527–1539. [Google Scholar] [CrossRef] [Green Version]
- Sirguey, P.; Mathieu, R.; Arnaud, Y. Subpixel monitoring of the seasonal snow cover with MODIS at 250 m spatial resolution in the Southern Alps of New Zealand: Methodology and accuracy assessment. Remote Sens. Environ. 2009, 113, 160–181. [Google Scholar] [CrossRef]
- Hilker, T.; Wulder, M.A.; Coops, N.C.; Seitz, N.; White, J.C.; Gao, F.; Masek, J.G.; Stenhouse, G. Generation of dense time series synthetic Landsat data through data blending with MODIS using a spatial and temporal adaptive reflectance fusion model. Remote Sens. Environ. 2009, 113, 1988–1999. [Google Scholar] [CrossRef]
Publisher’s Note: MDPI stays neutral with regard to jurisdictional claims in published maps and institutional affiliations. |
© 2022 by the authors. Licensee MDPI, Basel, Switzerland. This article is an open access article distributed under the terms and conditions of the Creative Commons Attribution (CC BY) license (https://creativecommons.org/licenses/by/4.0/).