Article

An Integrated Platform for Ground-Motion Mapping, Local to Regional Scale; Examples from SE Europe

1
National Institute for Research and Development on Marine Geology and Geo-Ecology—GeoEcoMar, 024053 Bucharest, Romania
2
Terrasigna SRL, 020581 Bucharest, Romania
3
Department of Earth Sciences, Utrecht University, 3584CB Utrecht, The Netherlands
4
Institute of Earth Physics and Space Science (ELKH EPSS), 9400 Sopron, Hungary
5
Institute of Geodynamics, Romanian Science Academy, 030167 Bucharest, Romania
6
Military Technical Academy “Ferdinand I”, 050141 Bucharest, Romania
*
Author to whom correspondence should be addressed.
Remote Sens. 2022, 14(4), 1046; https://doi.org/10.3390/rs14041046
Submission received: 19 January 2022 / Revised: 11 February 2022 / Accepted: 15 February 2022 / Published: 21 February 2022

Abstract

:
Ground and infrastructure stability are important for our technologically based civilization. Infrastructure projects take into consideration the risk posed by ground displacement (e.g., seismicity, geological conditions and geomorphology). To address this risk, earth scientists and civil engineers employ a range of measurement technologies, such as optical/laser leveling, GNSS and, lately, SAR interferometry. Currently there is a rich source of measurement information provided in various formats that covers most of the industrialized world. Integration of this information becomes an issue that will only increase in importance in the future. This work describes a practical approach to address and validate integrated stability measurements through the development of a platform that could be easily used by a variety of groups, from geoscientists to civil engineers and also private citizens with no training in this field. The platform enables quick cross-validation between different data sources, easy detection of critical areas at all scales (from large-scale individual buildings to small-scale tectonics) and can be linked to end-users from various monitoring fields and countries for automated notifications. This work is closing the gap between the specialized monitoring work and the general public, delivering the full value of technology for societal benefits in a free and open manner. The platform is calibrated and validated by an application of SAR interferometry data to specific situations in the general area of the Romanian Carpathians and their foreland. The results demonstrate an interplay between anthropogenically induced changes and high-amplitude active tectono–sedimentary processes creating rapid regional and local topographic variations.

Graphical Abstract

1. Introduction

Ground and infrastructure stability are important for our technologically based civilization. Infrastructure projects take into consideration the risk posed by ground displacement (e.g., seismicity, geological conditions and geomorphology). To address this risk, earth scientists and civil engineers employ a range of measurement technologies, such as optical/laser levelling, GNSS and, lately, SAR interferometry.
GNSS is a mature technology that was proven beyond doubt to be able to measure 3D topographic changes with millimeter accuracy [1]. GNSS data sets covering the whole world are processed for free and publicly available from recognized groups, such as Nevada Geodetical Laboratory [2], where data from around 19,000 GNSS stations are processed every day.
SAR-based persistent scatterers interferometry (PSInSAR) is a newer technique, certified to measure displacements in the radar line of sight (SAR LOS) with accuracies similar to GNSS [3]. The certification process was led by the European Space Agency as part of the Terrafirma [4,5] program designed to validate the PSInSAR techniques and to select a number of service providers, among them, Terrasigna.
Data sources for PSInSAR are satellite SAR imagery from X and C band spaceborne sensors (e.g., TerraSAR-X, Sentinel-1, etc.)
Sentinel-1 data, although not of the highest possible spatial resolution, was proven to be of sufficient quality to measure displacements at millimeter scale [3] in the satellite line of sight (LOS) direction. The Sentinel-1 SAR mission, with worldwide periodic coverage and its open data policy, enables wide-scale monitoring, leading to a thriving archive of ground-motion products, many of them freely available. Similar SAR missions, such as L/S band NASA NISAR [6], to be launched in 2023, will follow the ESA Sentinel-1 data acquisition strategy and will complement the existing C-band Sentinel-1 observations in natural areas, potentially doubling the volume of the current datasets.
Existing services, such as EPOS (the European Plate Observing System), were upgraded to include SAR LOS products [7]. New services are providing processing on demand (ESA Geohazards TEP [8]) or Europe-wide ground-motion products (such as Copernicus GMS [9]).
It is a challenge to integrate motion data from different sensors. In [10], GNSS data was integrated with PSInSAR data by projecting the 3D GNSS data into the SAR LOS; although this exercise was important for validating the equivalency of the two measurement techniques, there will never be enough GNSS ground stations able to project the 3D measurements from GNSS into the contrastingly higher density data of regional PSInSAR network.
Furthermore, since GNSS stations are expensive to install and maintain, PSInSAR can assist with the detection and spatial delimitation of homogeneous critical areas (affected by the same displacement process), which in turn will help with the decision of installing the GNSS stations in the apex (or other key areas) of the observed dynamics.
This work describes a practical approach to address and validate integrated stability measurements through the development of a platform that could be easily used by a variety of groups, from geoscientists to civil engineers and also private citizens with no training in this field. The proposed platform is designed to fill the gap between existing data sources and value-added information extracted from displacement measurements. This is demonstrated through the presentation of local- and regional-scale analysis of deformation phenomena in Romania and its neighbors.
The availability of redundant surface motion products (PSInSAR and GNSS) over the same area facilitates an easier cross-validation of the measurements by cross-comparing these products. The comparison takes into account the differences between datasets, such as direction of measurements and use of different reference areas for each dataset. Existing studies can be used to further validate measurements in areas that were previously characterized with sufficient details.
The current work revolves around monitoring wide areas of around 250,000 square kilometers in Europe (Figure 1a,b), spanning multiple countries and geological structures with complex and intricate dynamics (Figure 1c). The challenge consists of detection, extraction and small- to large-scale characterization of critical areas and their eventual inter-connection; these areas are often affected by multiple sources of instability that hopefully can be individually distinguished using the multi-scale information (from individual homes to tectonic units). Integrated and cross-validated data displayed in a format that makes possible quick spatial and temporal inspection (see Figure 2) facilitates detection of new critical areas with confidence due to the same techniques having been proven through cross-validation in previously known areas of interest. Additional layers of information are produced to enhance specific motion characteristics in order to facilitate detection and characterization. The temporal displacement patterns are analyzed for information such as: seasonal displacements (periodical dilation/contraction of infrastructure, earth tides), tectonically induced vertical or horizontal motions over large areas, specific seismic-aseismic local activation of faults or accelerated displacement (predictor of a disaster event).
Figure 1. The area of analysis: (a) Romania and parts of the neighboring countries; (b) PSInSAR coverage of the studied area; (c) tectonic map of Romania (modified from [11]).
Remotesensing 14 01046 g001aRemotesensing 14 01046 g001b
Data interpretation requires input from various end-user groups (e.g., geomorphologists, geologists, geophysicists and civil engineers); thus, the platform is designed to be easily accessed and self-sufficient in terms of data inspection and extraction.
Regional tectonic displacements are generally difficult to detect and monitor; state-of-the-art monitoring technology consists of GNSS measurements from a sparse network of stations and heavy spatial interpolation, which may result in significantly contrasting interpretations when movements are in the order of a few mm/year [12]. With this technology it is difficult to determine whether the measured motion is tectonic or local (e.g, due to local ground instability or poor antenna stability) unless measurements show a direct regional consistency at the scale of specific tectonic units. One way to overcome measurement errors is high spatial redundancy; with PSInSAR, millions of measurement points could be available for a single tectonic unit, and any quality issues with a single or a few points would be easily visible. The high density of measurements makes possible the actual delimitation of a tectonic unit by the differential motion at its margins. The effectiveness of this type of analysis is already proven in large, tectonically active induced motions, such as the San Andreas Fault of the western USA or the North Anatolian Fault of Turkey [13]. Furthermore, the high-density data allow the defining of anthropogenically induced topographic changes driven by the exploitation of the subsurface, such as in gas or geothermal reservoirs.
In our study we calibrate and validate the SAR interferometry platform and its correlation with GNSS data with several specific situations in the general region of Romania and neighboring countries, areas in central and eastern Europe centered on the Carpathian Mountains. This region is characterized by an active tectonic regime localized in the SE Carpathians inducing regional vertical and horizontal movements up to 7–8 mm/year [12,14] and associated with large, intermediate-mantle to crustal seismic events and crustal faulting, as detected and characterized by deep geophysical studies [15,16,17]. Other, less well-understood, shallow crustal movements may be driven by salt diapirism in the Transylvania basin or rapid depositional changes driven by sedimentation in the Danube Delta and associated coastal evolution [18,19,20,21]. Local anthropogenic effects induced by gas and water exploitation, rapid re-sedimentation due to coastal protection work or subsidence-induced desiccation of wetlands in the Danube Delta may also have significant effects [22].
Figure 2. PSTool, an online and free-access analysis tool for ground displacement monitoring [23].
Remotesensing 14 01046 g002

2. Materials

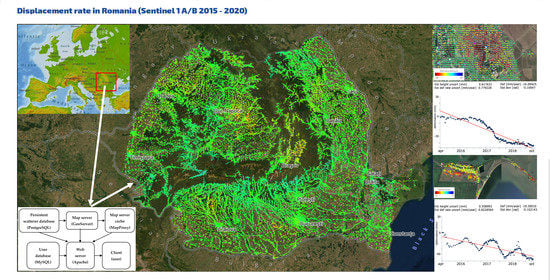
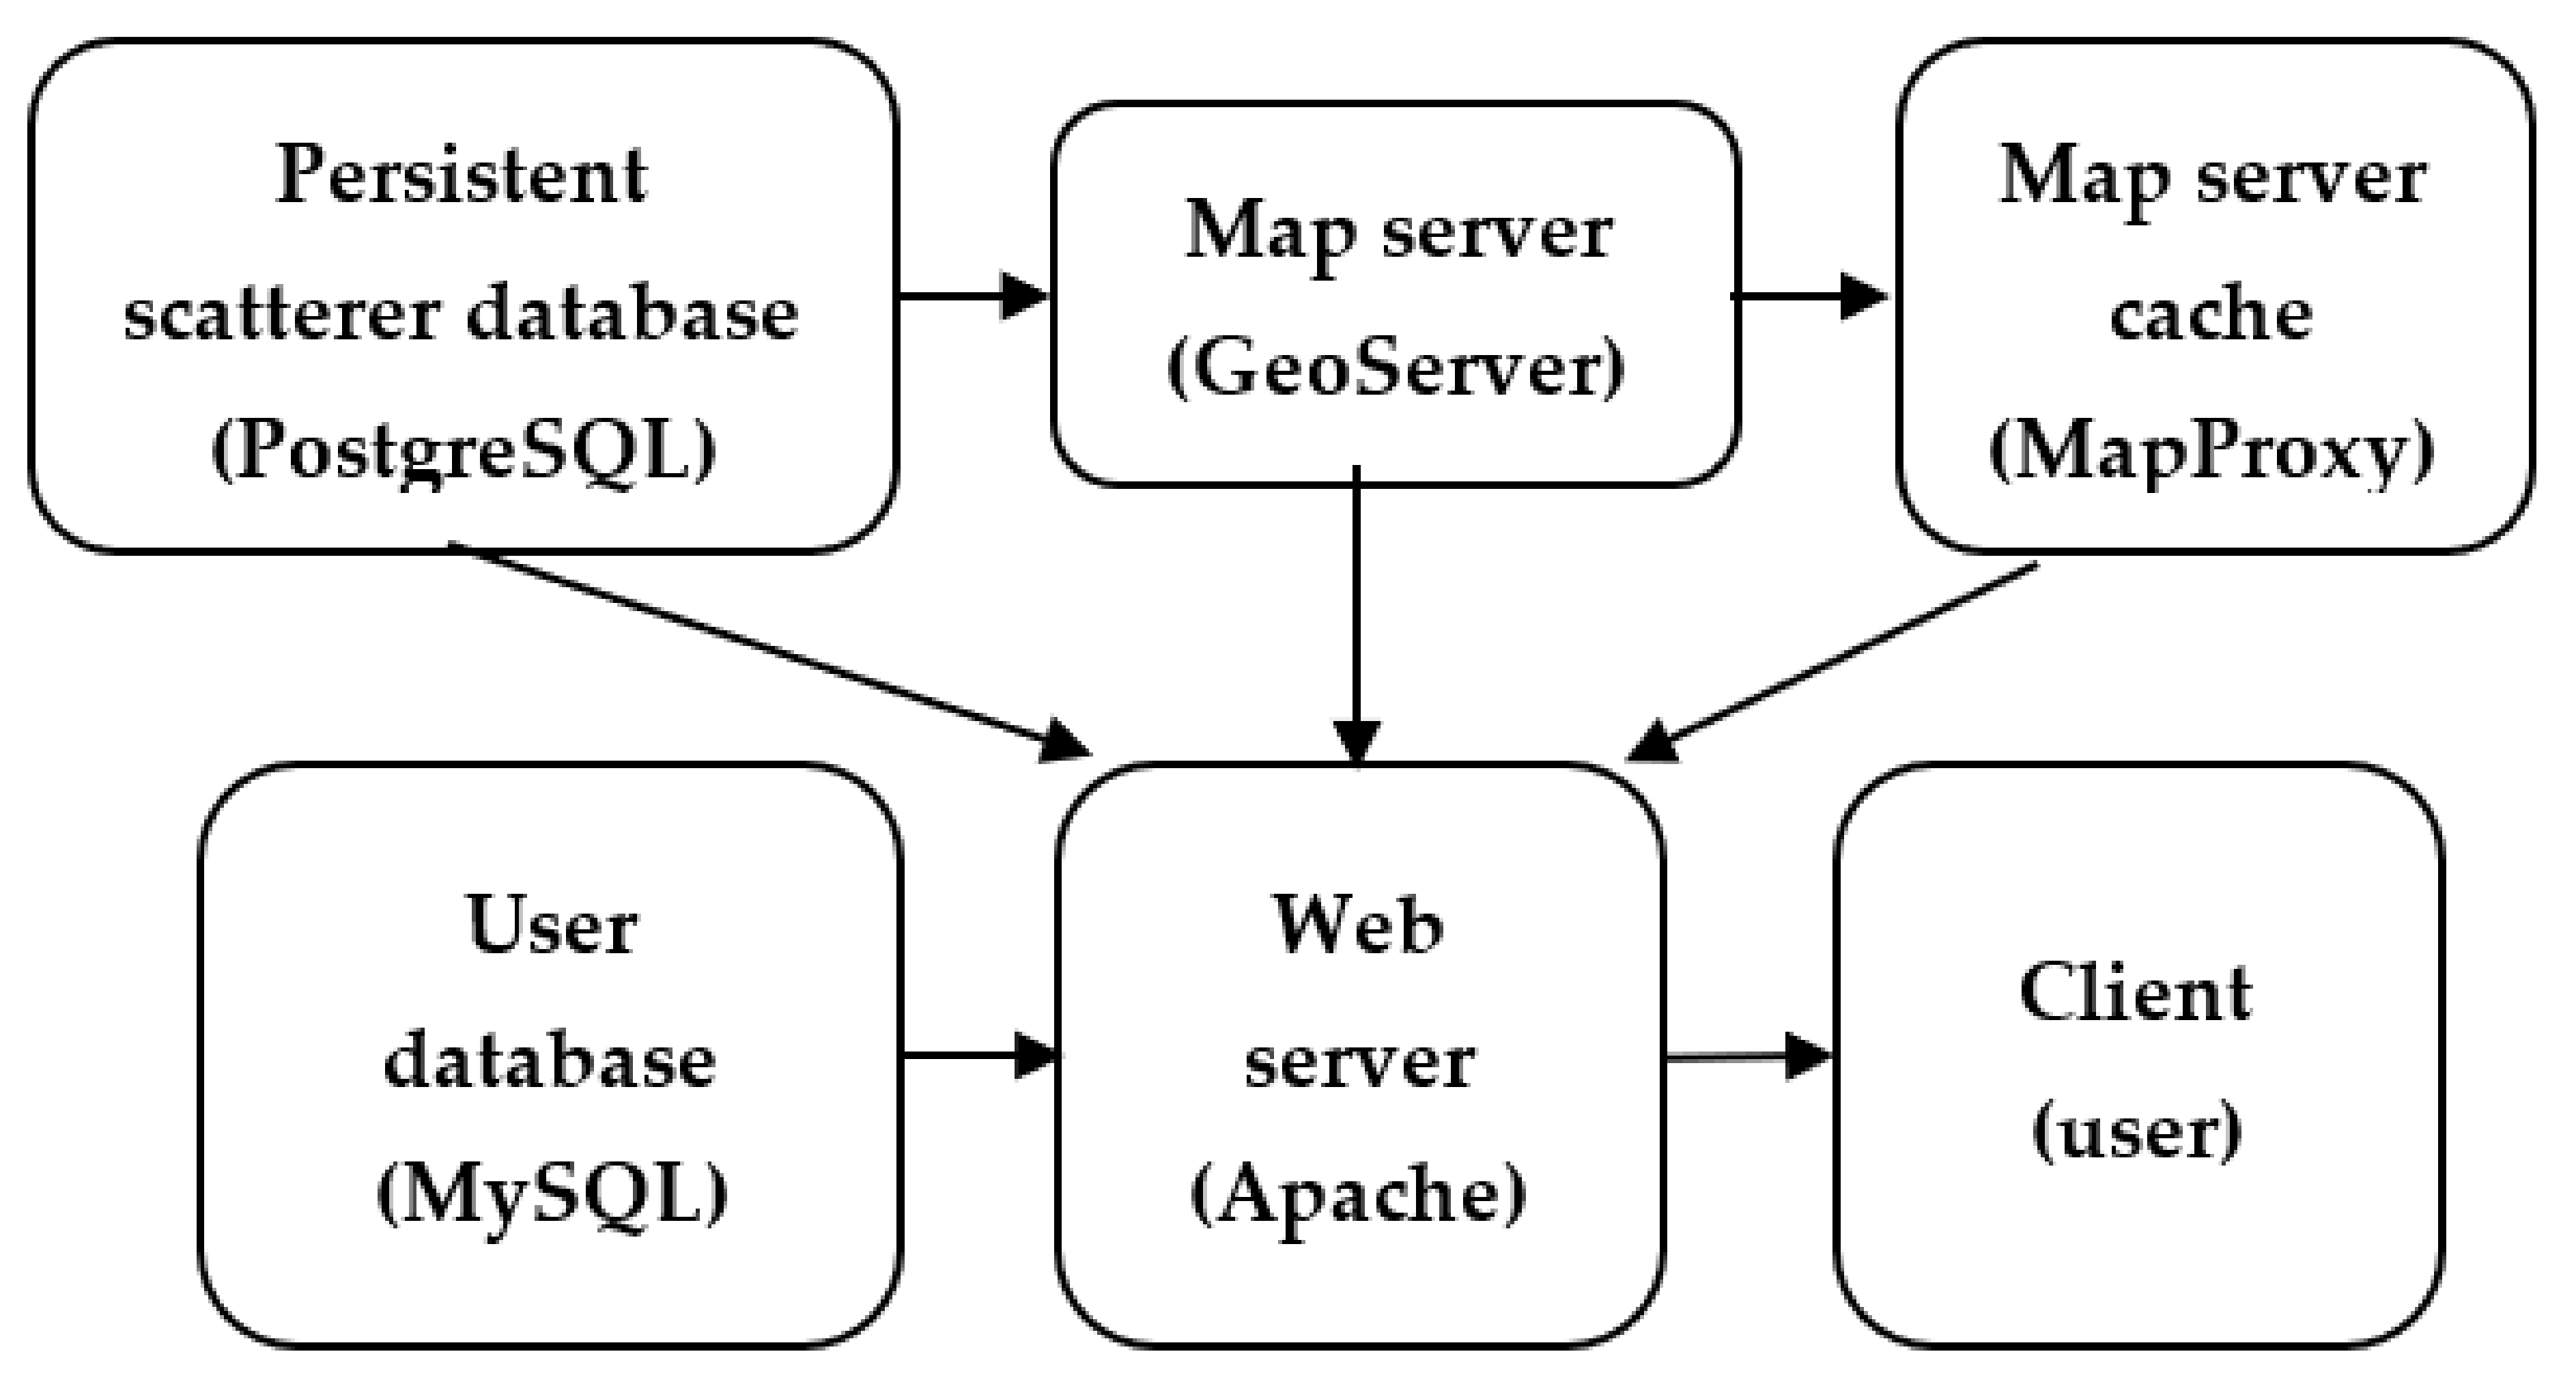
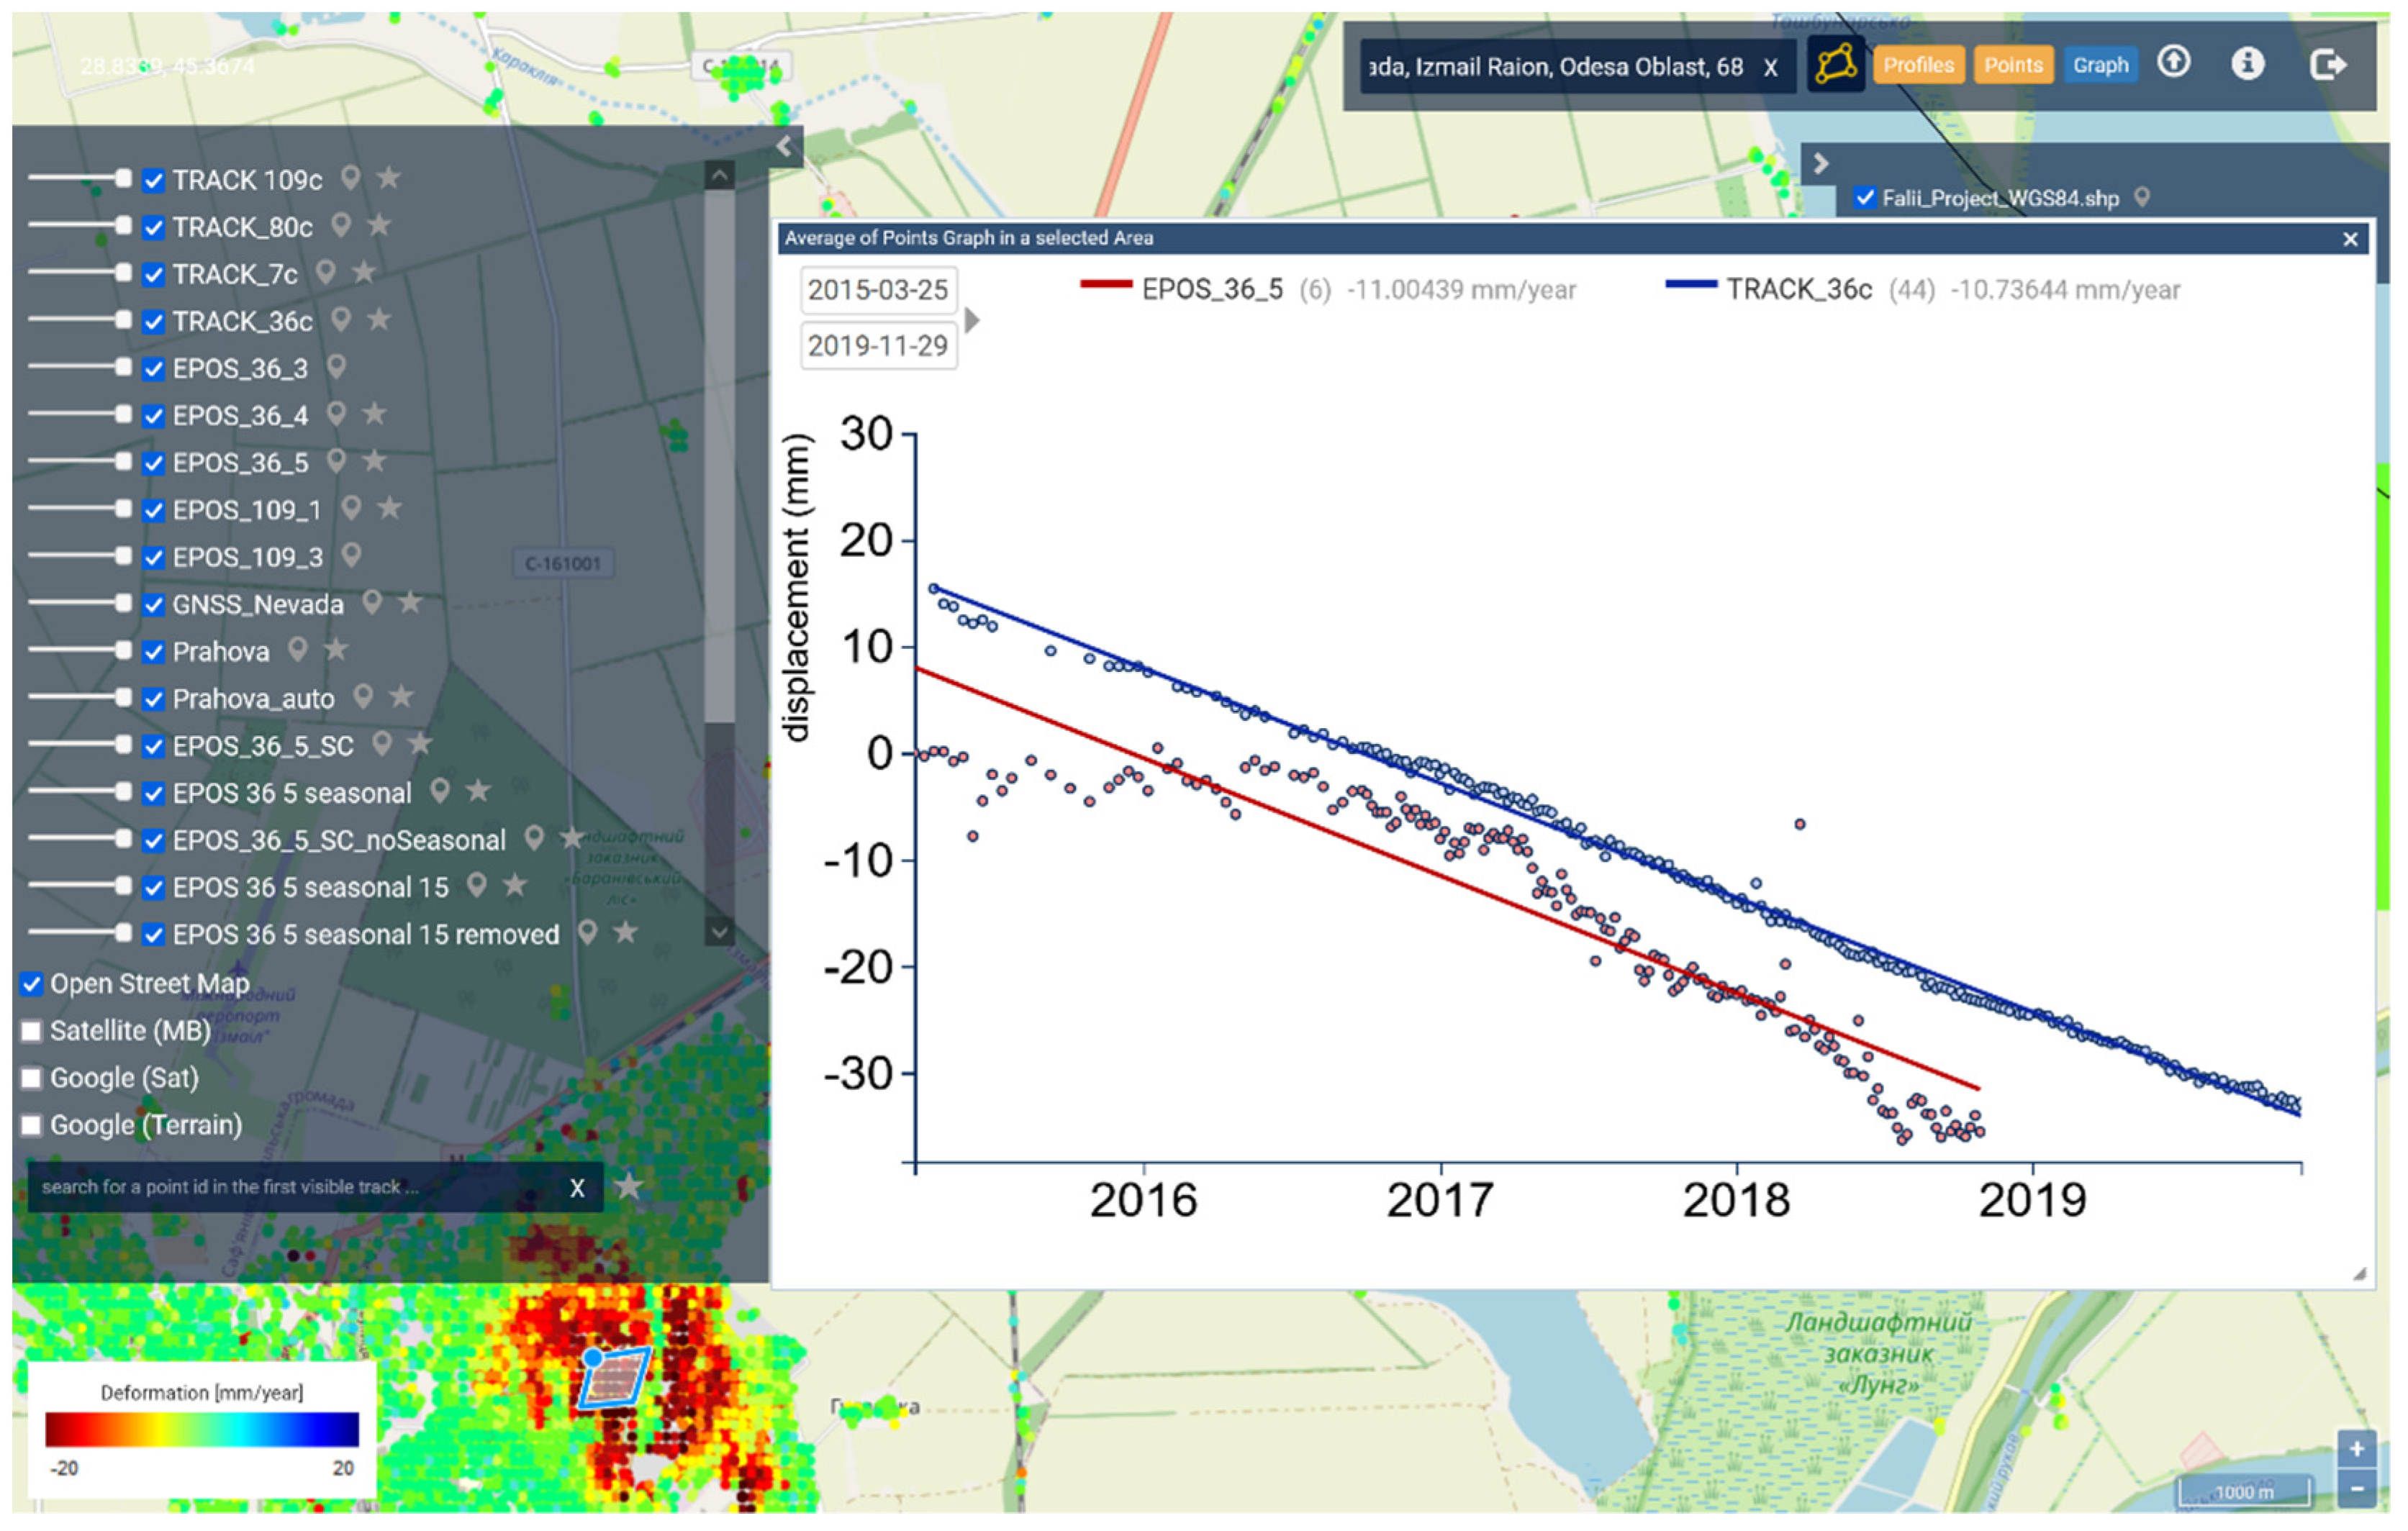
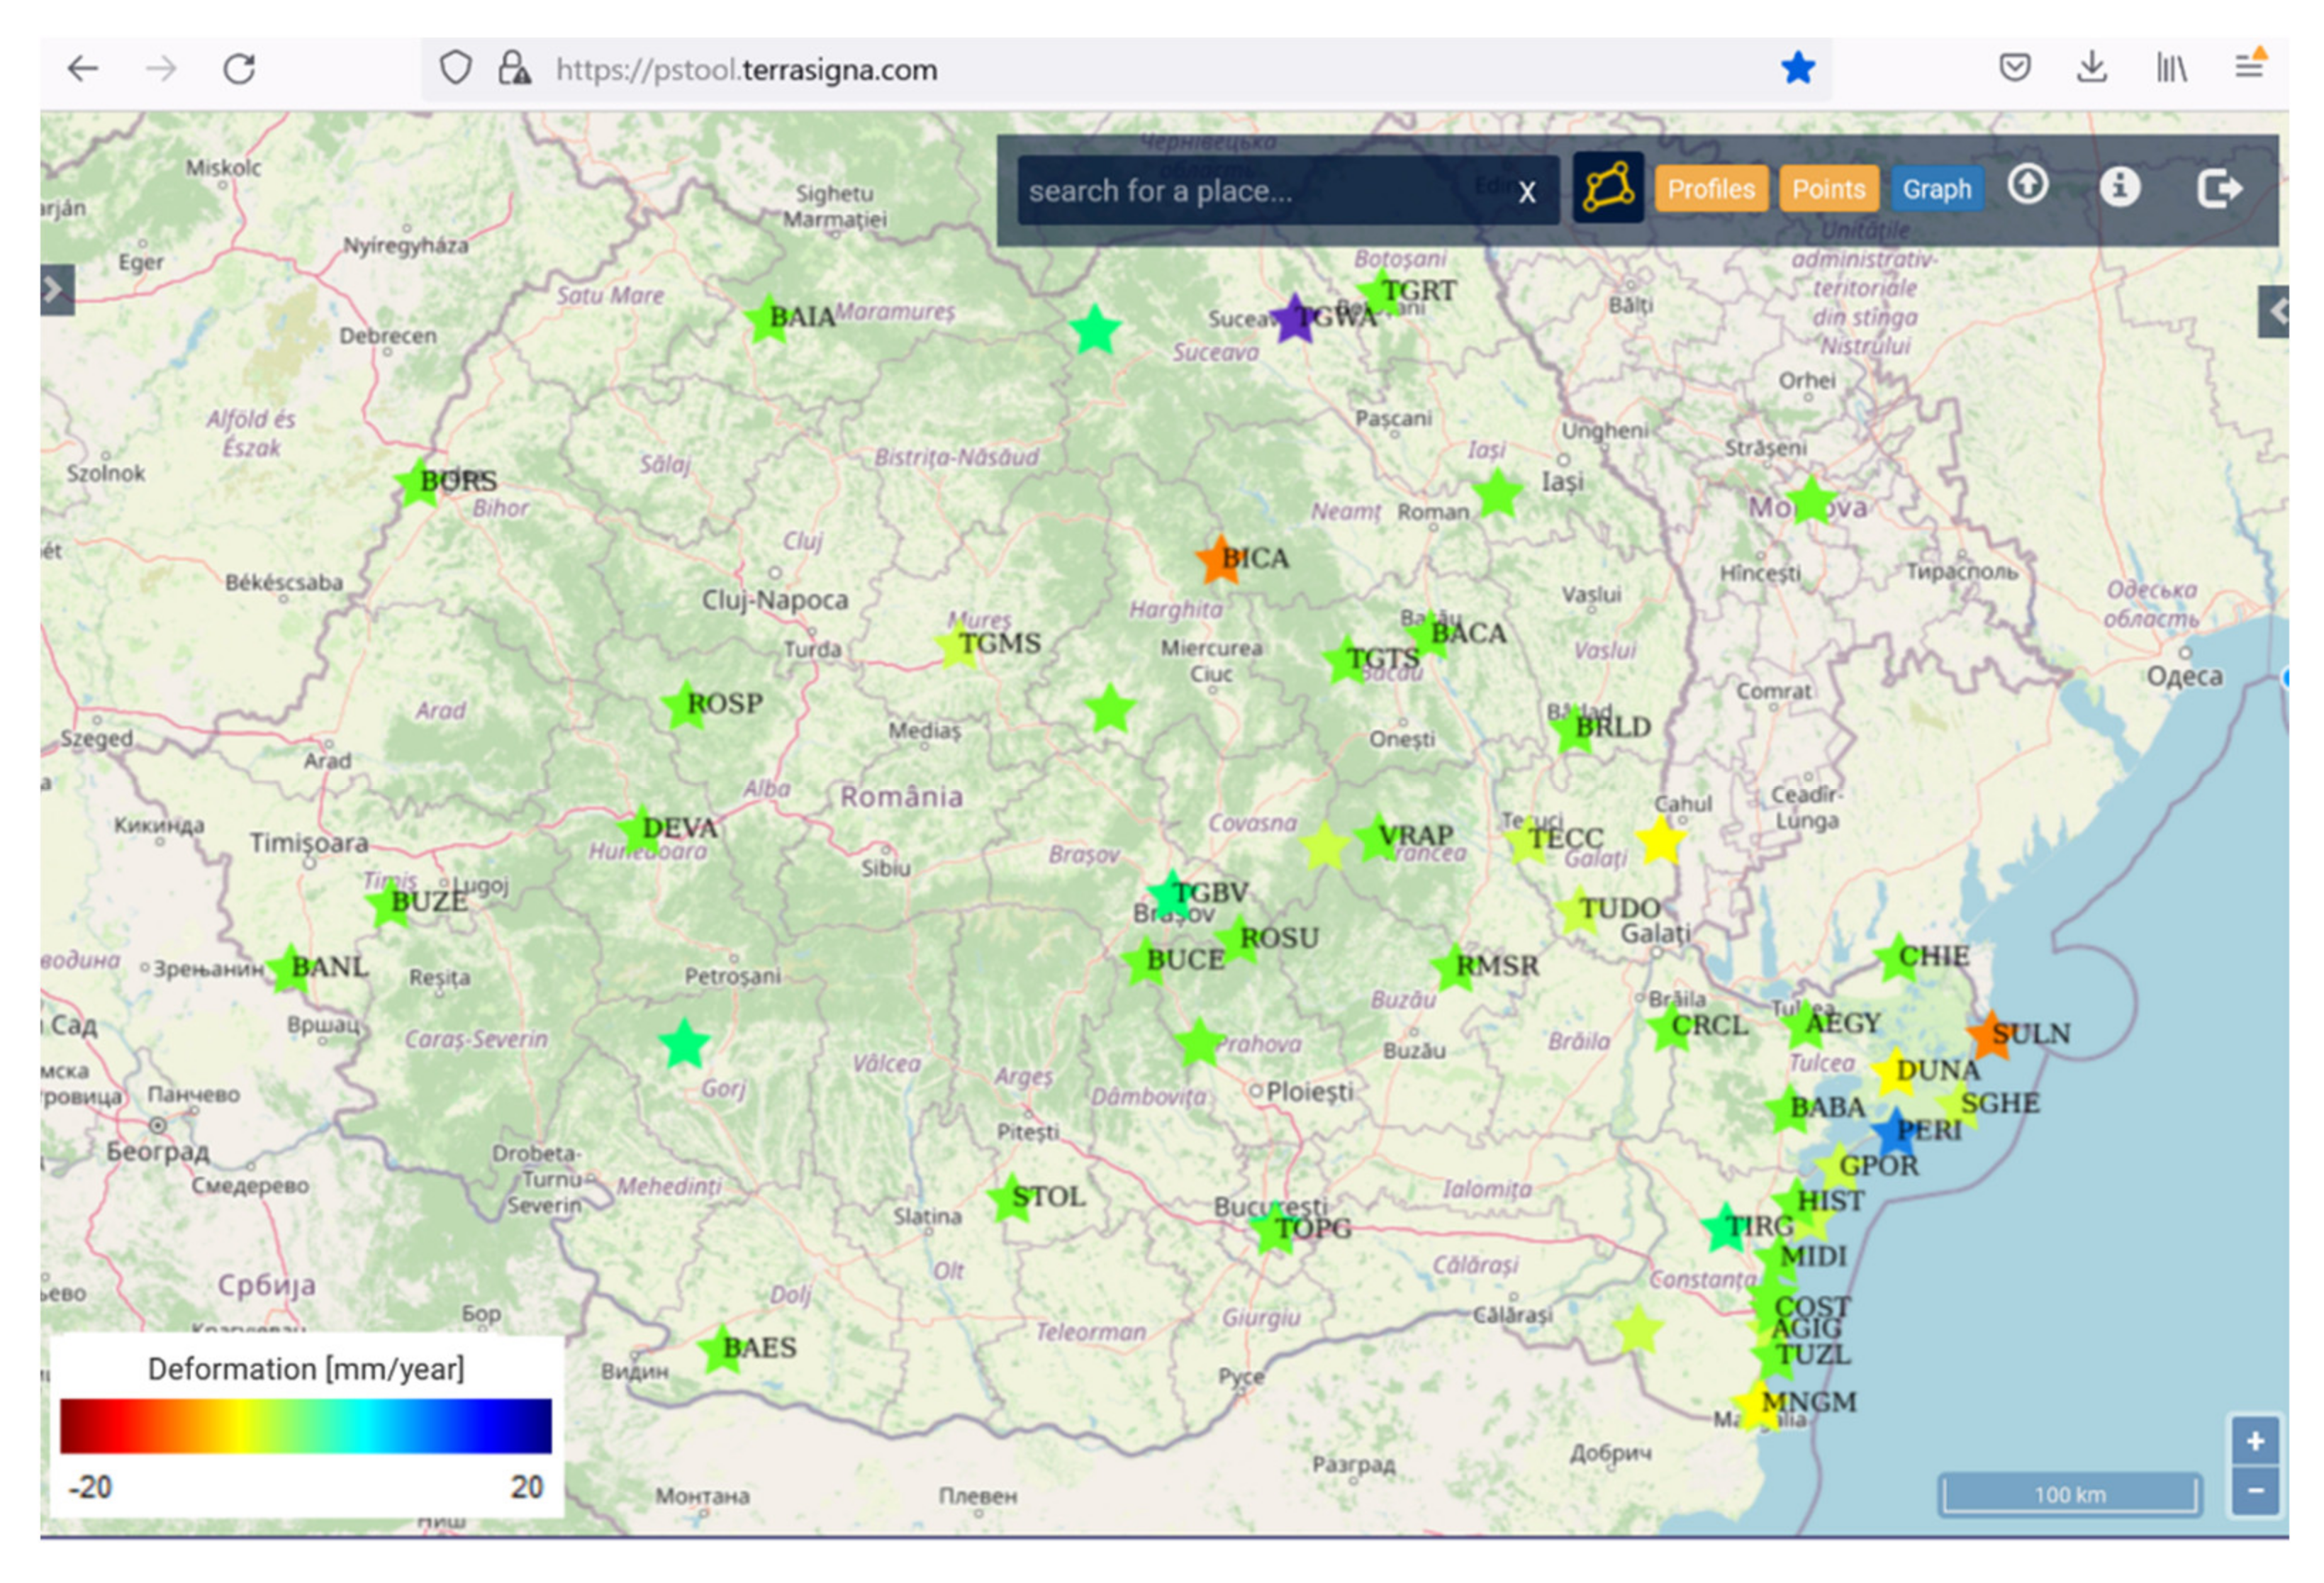
2.1. Online Data Integration Platform
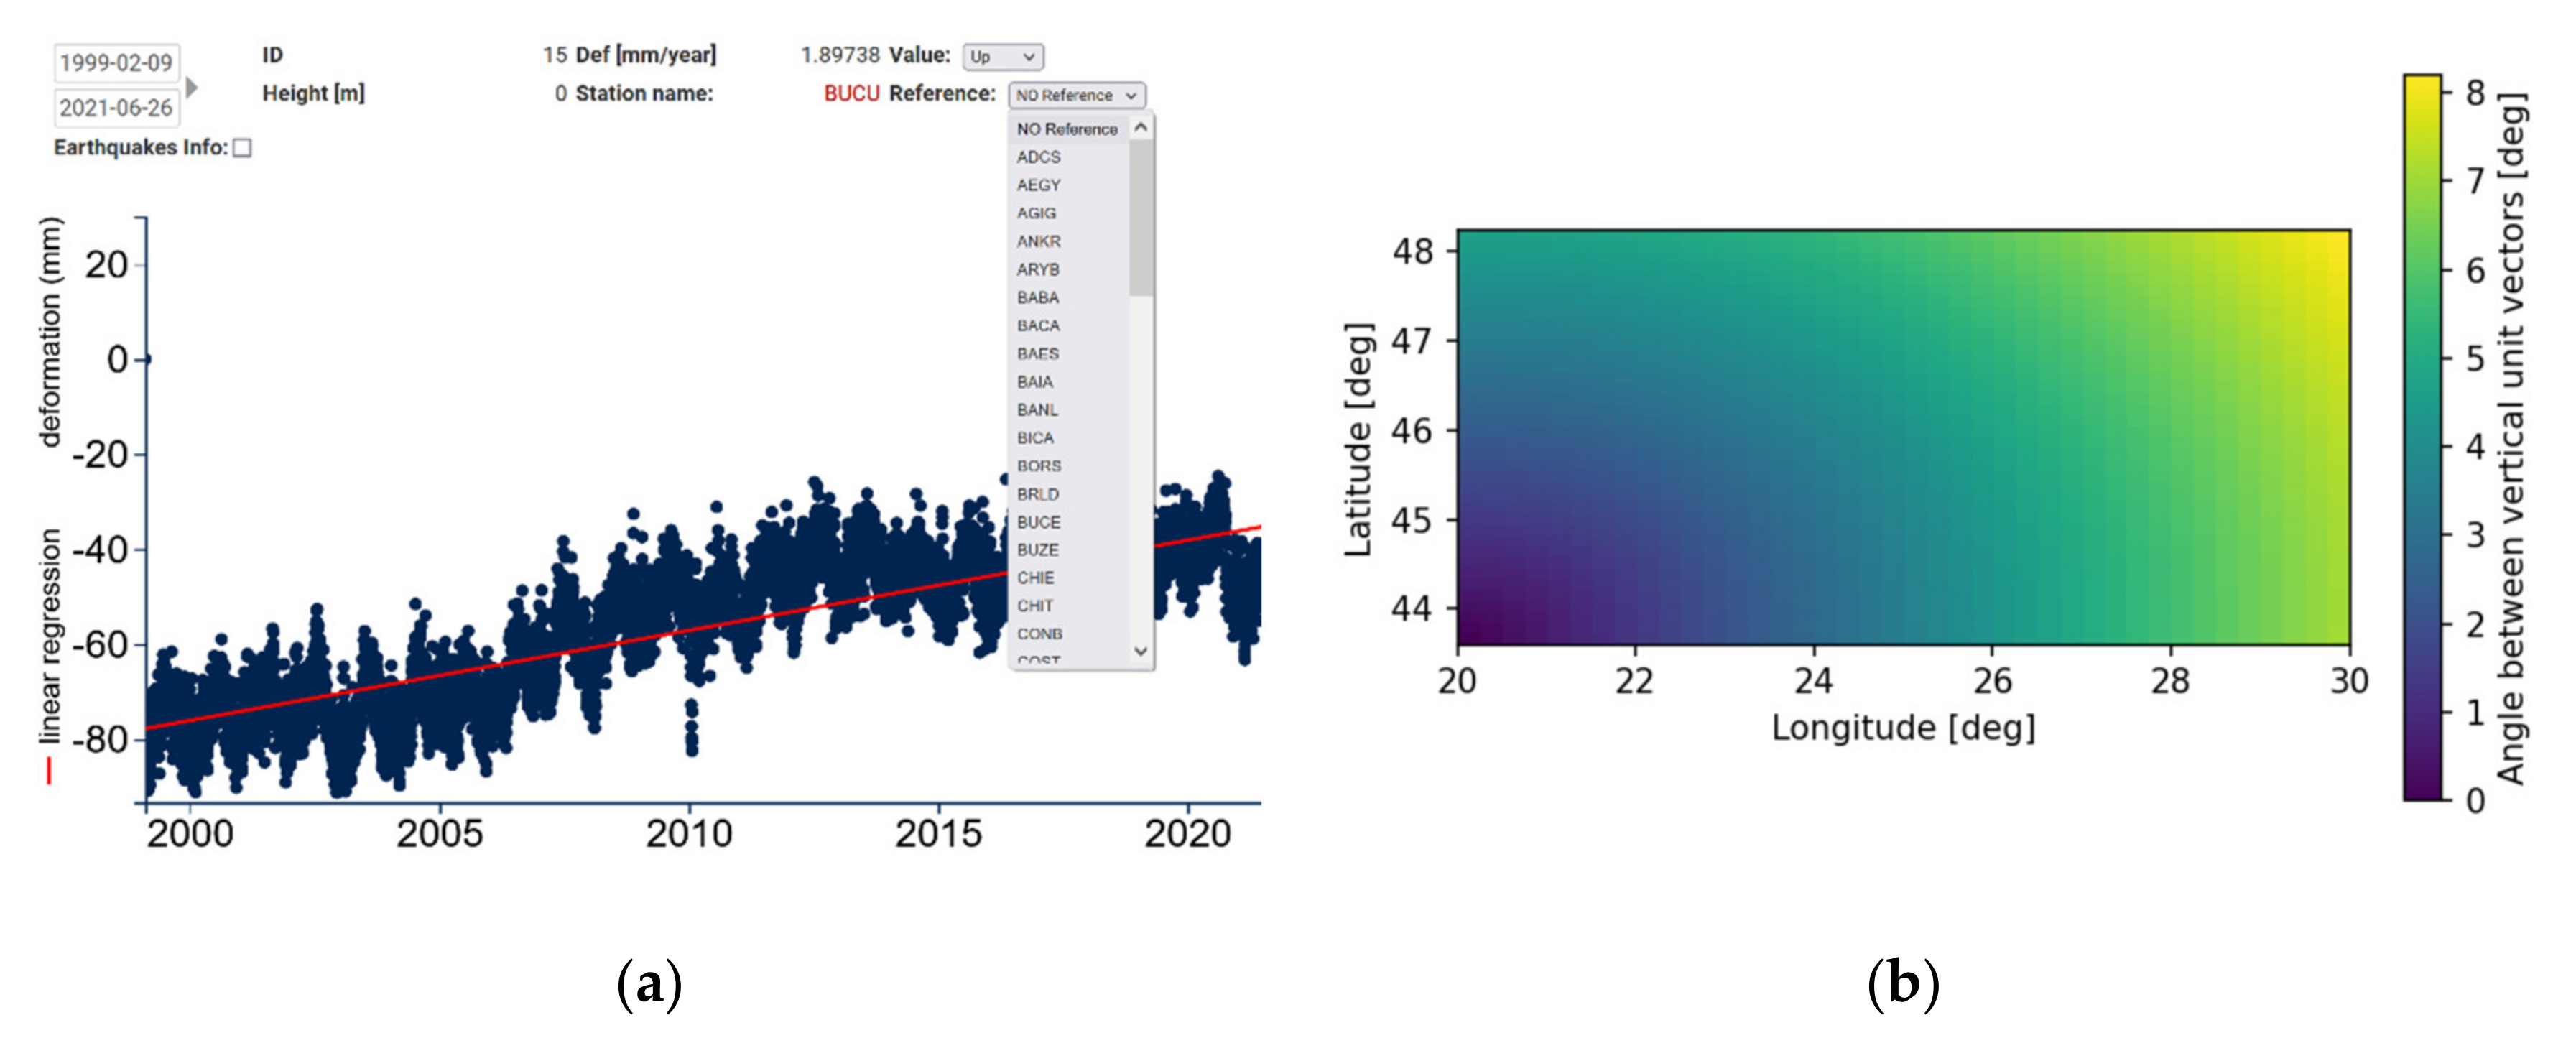
The Synthetic Aperture Radar Persistent Scatterers Online Software Tool (PSTool, [23]) was developed by Terrasigna with the purpose of exploiting the large volume of ground-displacement data made available with the advent of the ESA Sentinel-1 mission and of the expected similar volume of data to be contributed by the future NASA NISAR [6] and ESA ROSE-L [24] missions.
PSTool is intended to be used by end-users with no knowledge of SAR technology, thus it continuously evolves towards the applications while keeping the platform simple and intuitive.
The PSTool platform can be used to inspect temporal characteristics of the ground motion, select areas of interest and extract temporal averages of displacement rates, export temporal profiles to standard formats for integration in the user’s own platforms and upload user-specific layers on top of the displacement information.
One example of the kind of analysis that can be performed with PSTool is illustrated in Figure 2; the user can select an area using an irregular polygon that can be drawn around areas of any shape (in the figure, the cursor in the shape of a blue circle points to the area where the polygon was drawn, and a blow-up image of the polygon is illustrated on the top-right by the arrow), and in the selected area the average LOS displacement time-series will be calculated for all the included PS points. If data from multiple InSAR processing results are available, the averaged time-series and fitted linear trend will be displayed per dataset. In the temporal profiles displayed in Figure 2, for the two measurement layers covering the area of interest, the number of temporal profiles that were averaged is displayed beside every layer name (6 profiles for layer EPOS_36_5 and 31 profiles for layer Track_36c) together with each of the annual displacement rates.
The left column in Figure 2 illustrates the stack of PSInSAR layers available for analysis; each of these layers was obtained from different processing algorithms and using various data sources (X, C and L-band).
For a better interpretation of the results, the user can load custom shapefiles that will be displayed below the PSInSAR results for target identification (in Figure 2 top-right, “Falii_Project_WGS84.shp” represents such a layer).
Moreover, PSInSAR displacement rates or displacement rates plus temporal profiles can be exported in Google Earth or text formats for areas defined by the user.
The architecture of the PSTool application is depicted in Figure 3. The very large number of points in the deformation maps makes it impossible to show them in vector format at each possible zoom level through a web application. Hence, the application uses a map server (GeoServer [25]) and a tile-caching application (Map Proxy [26]) that serve jpeg tiles to the client through a webserver (Apache [27]). The PSTool interface uses OpenLayers [28] for displaying geographical data. The persistent scatterers (geographical coordinates) along with complementary data (deformation profile data, deformation velocity, height, etc.) are stored in a PostgresSQL [29] database with the GIS extension of PostGIS [30]. Data is uploaded in the PostgreSQL database using dedicated scripts for different types of data.
The web server uses a MySQL [31] database for storing user rights to accessing maps, user actions, temporary passwords and codes, graphical user interface configurations and other data.
The deformation maps from the PostgreSQL database are periodically synchronized with the MySQL database to ensure proper user-rights management. An administrator web interface is available for managing user rights and point-color maps.
Though a tile caching server is used, the map server is always on, as point data for some high zoom levels will be extracted directly from GeoServer.
All servers (Apache, PostgreSQL, etc.) can run on independent machines to maximize performance, but currently these components are implemented in Docker containers running on the same machine.
The platform also provides programs for deformation-profile post-processing, such as seasonal motion detection/removal and sudden-change detection. At the moment, these are available on demand, only for experts, for off-line processing.
Seasonal motion is detected using harmonic analysis—the deformation profile is resampled to a uniform step, followed by frequency analysis and stop-band filtering the seasonal spectral component (if required). For sudden-change detection, the deformation profile is analyzed using a sliding window of eight measurements. At each step, the local linear deformation trend is computed, the next measurement is predicted and the difference between the predicted and the measured value is computed. If it exceeds an empirically chosen threshold, the profile is classified as exhibiting sudden changes [32].

2.2. GNSS Data

As part of a collaboration with the National Institute for Research and Development on Marine Geology and Geo-ecology (GeoEcoMar) and the National Institute for Research and Development of Earth Physics (NIEP), Romania, GNSS data was incorporated in the PSTool platform.
The raw GNSS data was obtained from the GeoPontica permanent GNSS station network—part of the EUXINUS research infrastructure managed by GeoEcoMar and the permanent GNSS station network of NIEP [33], covering the Romanian and Bulgarian Black Sea coast.
The processed GNSS data used in this study was imported from Nevada Geodetical Laboratory (NGL) [2]. Their analyses use data from over 19,000 GNSS locations around the world to estimate the rates, patterns, budgets and sources of the vertical movement of the land surface that is driven by various processes in the Earth, such as plate tectonics, glacial isostatic adjustment, the earthquake cycle, changes in aquifers and hydrological loads. The GNSS data are expressed in ENU local coordinates (east, north, up) to be able to integrate with the PSInSAR results, which are expressed in local SAR LOS (azimuth and incidence angle [34]). Figure 4 illustrates the locations of the NGL-processed GNSS stations available in Romania; any of them can be used as a relative reference to the other GNSS stations.
The GNSS stations measure motion in 3D coordinates, and each coordinate can be selected for visualization in PSTool. The data can also be viewed in on-the-fly differential mode (Figure 5a), with the possibility of any of the stations to be used as a reference.
Romania is located between 20–30° E and 43–48° N. The maximum deviation between the vertical (up) axes across an area equivalent to Romania is around 8 degrees (Figure 5b); as an example, if the GNSS reference is chosen in SW Romania (bottom-left corner in Figure 5b) with vertical USW, and the measuring station is chosen in the NE corner of Romania with vertical USE, the direction match between the two local N directions is 0.99 (UNW = USE × cos (8°), projection of one direction to the another); thus the differential-displacement-rate error is only 1%.
Thus, subtracting reference motion from GNSS station motion along each ENU axis is a valid operation as long as the orientation of the ENU coordinates coincide, which is a true assumption for an area the size and location of Romania [35,36].

2.3. SAR Data

The total monitored area in this work spans around 250,000 square km, and it was mosaicked from four Sentinel-1 tracks, merging up to four frames for each track. The coverage includes Romania and part of its neighboring countries (Figure 1b), spanning multiple geotectonic units (Figure 1c) [11,37].
The Copernicus DEM [38] at 30 m resolution was used in order to create a first approximation of the height model.
Around 4000 SAR scenes acquired between 2014–2020 were processed. The InSAR algorithm, described in [39], preserved all the displacement information in order to maximize the chances of detecting slow crustal movements (mm/year). This was performed by extracting the linear deformation information before any kind of spatial or temporal filtering was applied, with the purpose of improving phase statistics. The drawback of the algorithm consists in the challenge of extracting the displacement information from an atmospheric phase that is two orders of magnitude above the displacement information; this requires a careful phase unwrapping check of every residual interferogram, individual correction and displacement model updates.
Ground-motion data produced with the SBAS algorithm [40], provided via the EPOS program (under open license [41]), was used to both complement and cross-validate Terrasigna’s PSInSAR product. This algorithm uses multiple-reference, small-baseline interferograms (with negligible topographic phase) in order to maximize temporal coherence and minimize phase. Assuming ground motion does not occur on the short time intervals used to produce interferograms, the main phase component that remains is represented by the atmospheric phase. A spatial filter can thus be applied to reduce the variability of the atmospheric phase, which acts like noise. The ground motion information is then extracted after atmospheric filtering, but the major risk of this approach is the inadequate separation of atmospheric effects from small-scale displacements, leading to the possible filtering of the ground motion on wide areas (e.g., regional motion of tectonic units).
The available (sparse) GNSS stations can be used to validate the 3D motion of homogeneous areas (characterized by similar surface variation dynamics) that are part of a SAR LOS direction of a PSInSAR (dense) network. In [34], the projection formula from GNSS (ENU coordinates) to SAR LOS was derived. With this formula, wherever a GNSS station is available the amplitude and direction of motion vectors from neighboring PSInSAR LOS measurements can be validated (example in Table 1).
Conversely, the PSInSAR data could be used to characterize the stability of the area where a GNSS station is installed; GNSS represents a single measurement point, thus it is complicated to figure out if the dynamics measured in that point are local or regional. PSInSAR, with a dense measurement network, can map the dynamics around the GNSS station at various scales, providing insight on what motion the GNSS station actually records.

3. Methods

In order to extract value-added information, a more automatic post-processing is required. The implemented post-processing approaches have two main scopes: classification based on the dominant motion trend and separation of different causes of ground motion.

3.1. Classification Based on the Dominant Motion Trend

Every persistent target is analyzed in time and classified based on the dominant motion (e.g., linear subsidence, sudden changes/fractures in displacement rates or seasonal displacement). The output of this step is represented by separate maps of motion, from which specific motion patterns could become spatially distinct and correlated with areas or structures on the ground. In this way, seasonal displacement could be separated from linear displacements. Moreover, settlement or increased subsidence/uplift events can be detected.
As an example of detecting an area with a variable subsidence rate, Figure 6a illustrates the displacement map of Izmail (Ukraine) and Figure 6c a sample of a relatively linear temporal displacement profile from that area. Figure 6b illustrates an area on the ground affected by a changing subsidence rate, whereas Figure 6d illustrates a corresponding sample of a temporal profile affected by a variable displacement rate (increased subsidence between September 2016–July 2017).
An example of detecting areas affected by seasonal motion is illustrated in Figure 7. The seasonal motion is detected by harmonic analysis of each temporal profile and identifying repetitive patterns with a period of approximately one year. Figure 7a illustrates the whole set of the PSInSAR targets available for monitoring the Sulina, Romania area. By selecting the subset of the PSInSAR targets affected by seasonal motion, the map in Figure 7b was obtained. An example of a temporal profile extracted from this set is illustrated in Figure 7c.
If seasonal motion is not of interest, it can be removed from the temporal profile; in this way, other motion components, such as subsidence patterns, will be more visible. Figure 7d illustrates a temporal profile from which the seasonal motion was removed.

3.2. Separation of Different Types/Causes of Ground Motion

On a small-scale map, local and wide-area (including tectonic) motion will always be mixed, making them difficult to distinguish from each other. Thus, criteria of separation of different motion types need to be defined and applied before any interpretation of the results is attempted. In order to distinguish between motion types of different scales, it is important to understand how the analyzed datasets were produced and what they represent. In this way, motion related to surficial processes (e.g., shallow subsidence or ground humidity variation) could be separated from deep, dynamic processes (tectonic). Two criteria are discussed below.
Criterion A: SAR operating frequency used to acquire the data
The depth of the ground penetration of microwaves is proportional with the wavelength [42]. L-band data (JAXA ALOS and future NASA NISAR) tend to remain interferometrically coherent on natural areas; C-band data (ESA ERS/ASAR/Sentinel-1 and CSA Radarsat) remains coherent on infrastructure and some bare-earth areas; X-band data (DLR TerraSAR-X and ASI Cosmo Skymed) tend to remain coherent mostly on infrastructure.
As a result of these differences, it is important to know which targets represent infrastructure and which targets represent natural areas, since the mechanism of their measured motion could vary. The motion of infrastructure anchored on stable bedrock could be related to local geology or to tectonics. The measured displacement of a natural ground surface could be related to deep motion or to surficial motion, such as solifluction (within a few centimeters depth), or could be related even to ground humidity variation, since the characteristic depth from which electromagnetic waves are backscattered depends also on the humidity level of the soil [42].
Criterion B: Processing algorithms used
Algorithms using amplitude dispersion and/or spectral phase diversity [39] to detect the candidate measurement points target infrastructure, whereas algorithms employing coherence and spatial multi-looking [40] target both infrastructure and natural areas as long as they remain coherent in time. Figure 8 illustrates the difference in dynamics between infrastructure and natural areas.
Figure 8a illustrates the results of PSInSAR analysis where only targets that are persistent for a long period (multiple years) are detected. Figure 8b illustrates the results of lower resolution processing with resolution cells including both infrastructure and natural areas (such as illustrated within the blue circle).
Figure 8c,d illustrates the difference in displacement patterns between infrastructure and natural targets in the same area.
Using these criteria, the motion affecting natural areas should be separated from motion affecting infrastructure, since the source of motions could be very different and mixing them could be confusing when interpretation is attempted. Thus, it is important to know what processing algorithms were employed in order to understand what is measured on the ground.

4. Results

The results can be separated into three categories:

4.1. Local Scale Results

Local scale results are represented by clearly localized subsidence/uplift areas that can be delimited directly from the PSInSAR maps. In this case, atmospheric effects are negligible and the accuracy of measurements relative to neighboring areas is high. A number of examples are illustrated below, some of them validated and some others representing new information requiring a more detailed analysis by future studies. Due to the large extent of the monitored areas, automatic detection and mapping of critical areas was employed; results were synthesized in a national atlas of ground stability [43].

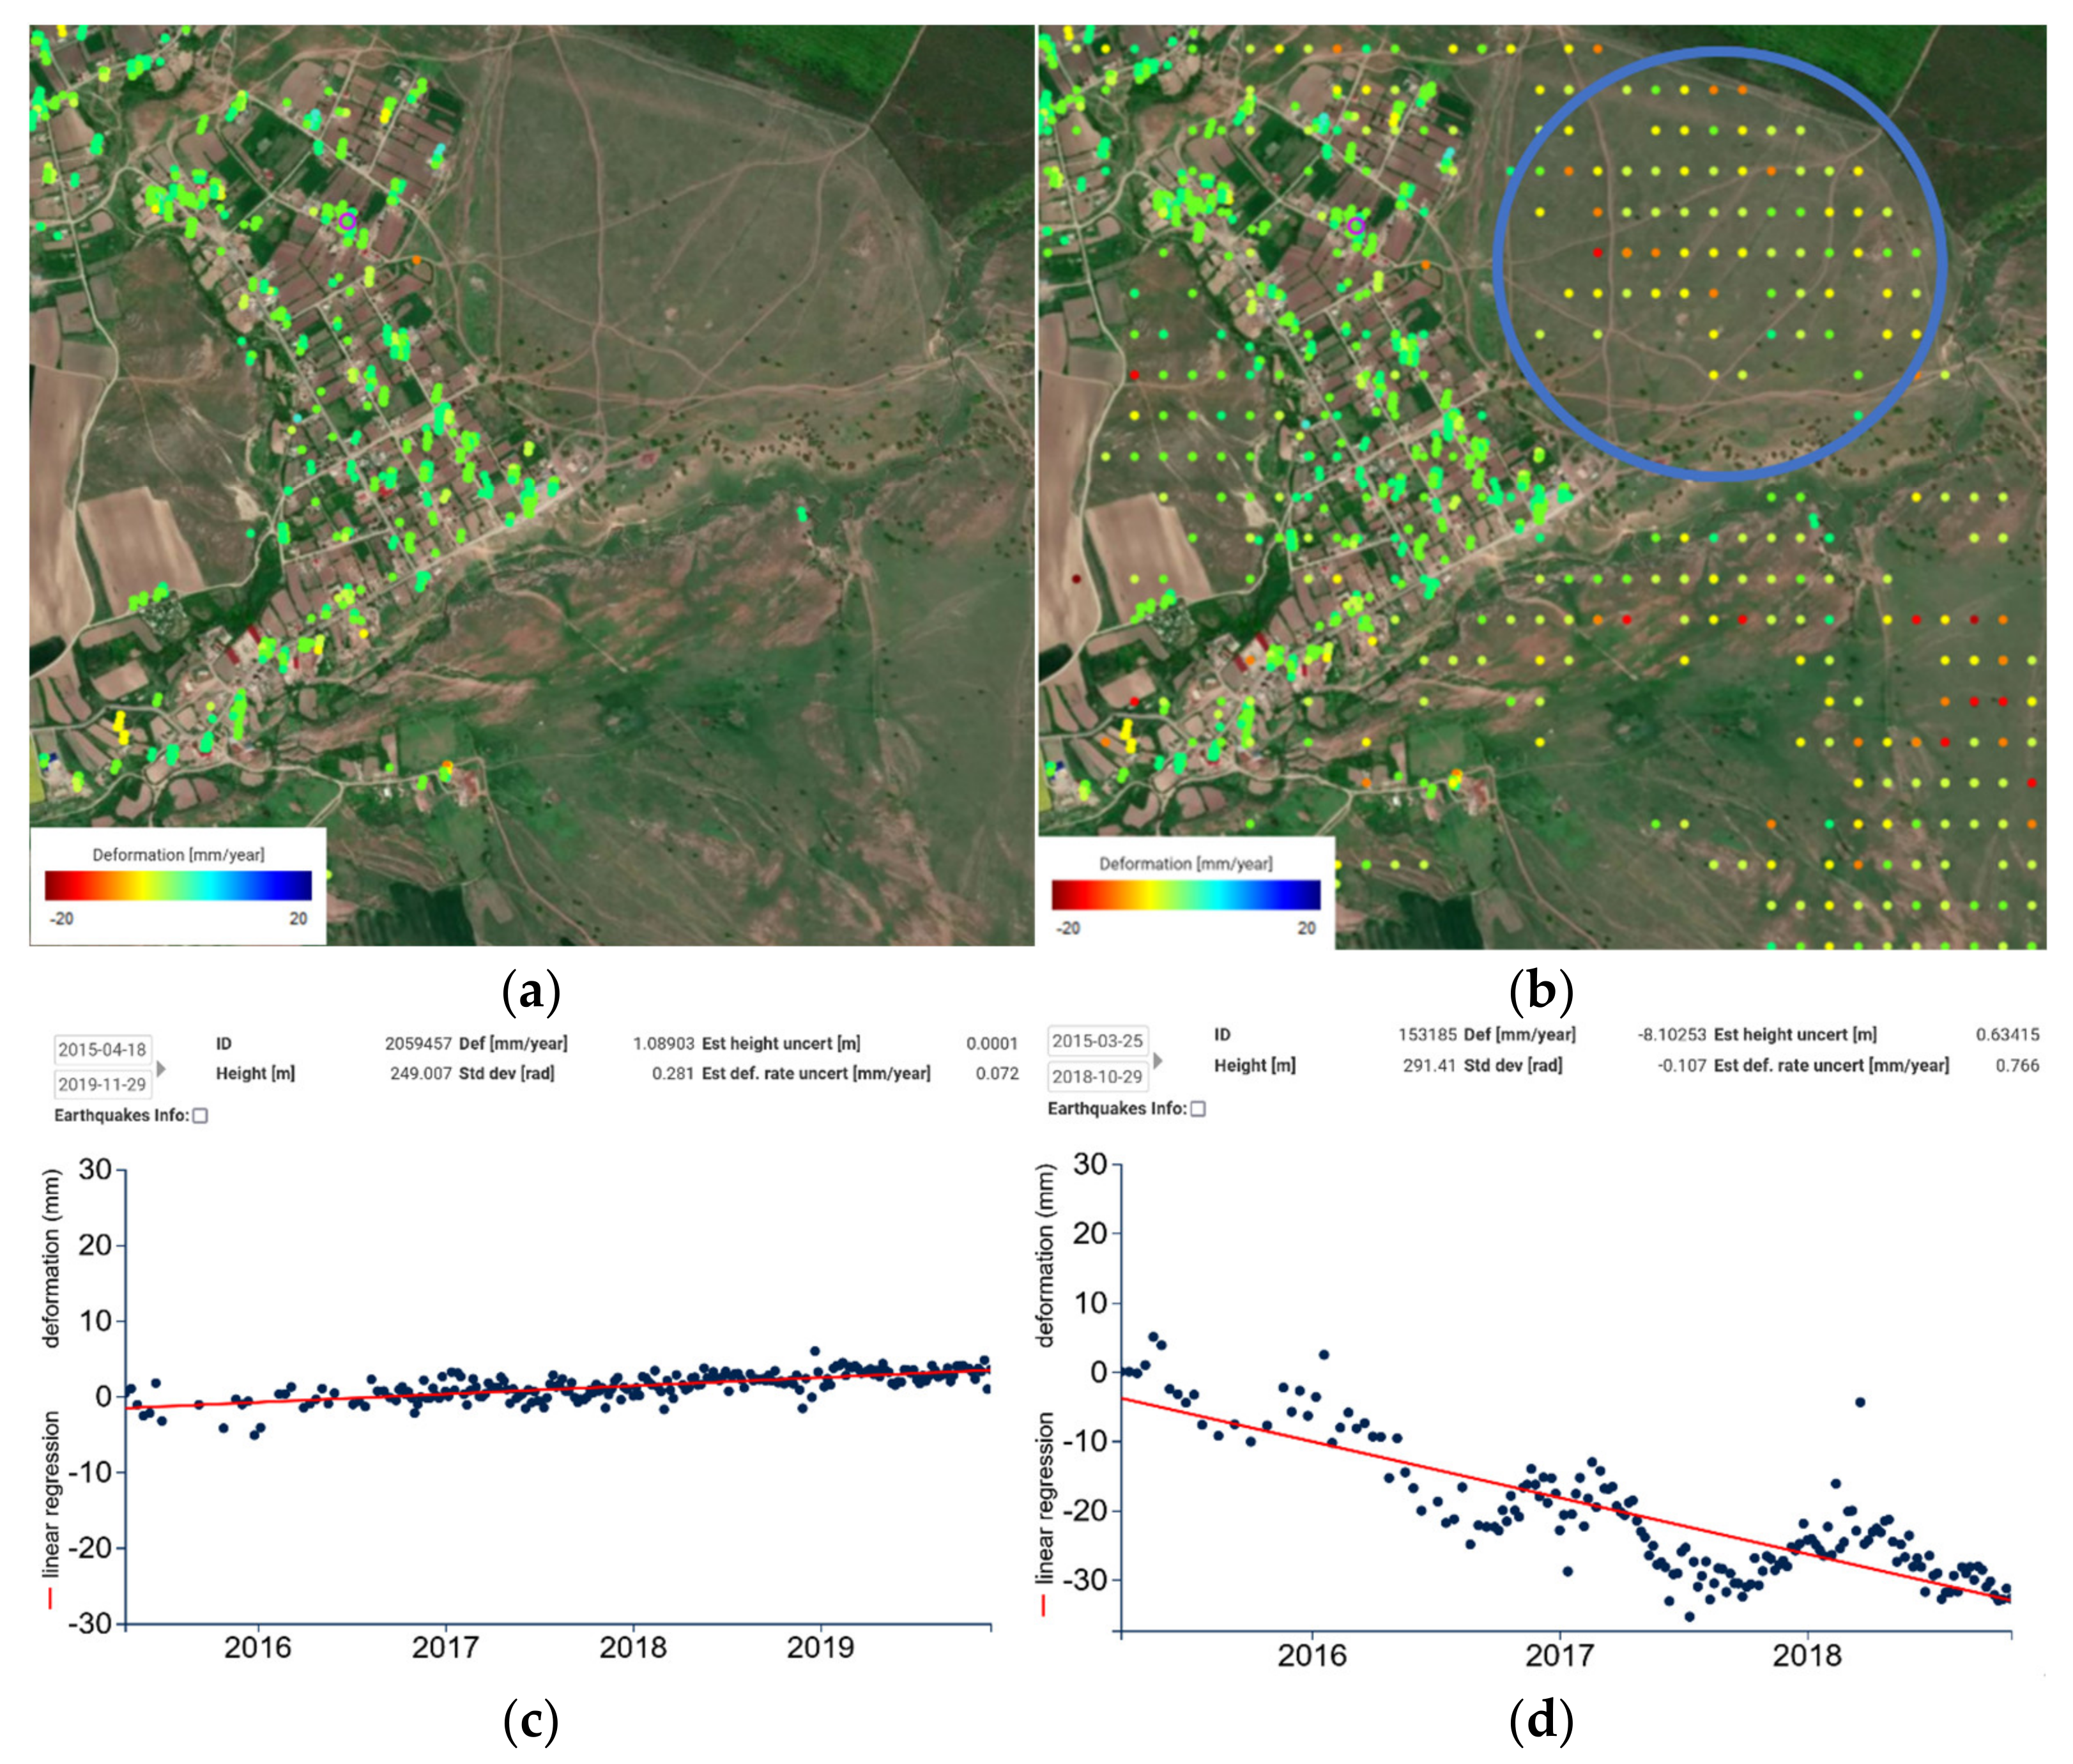
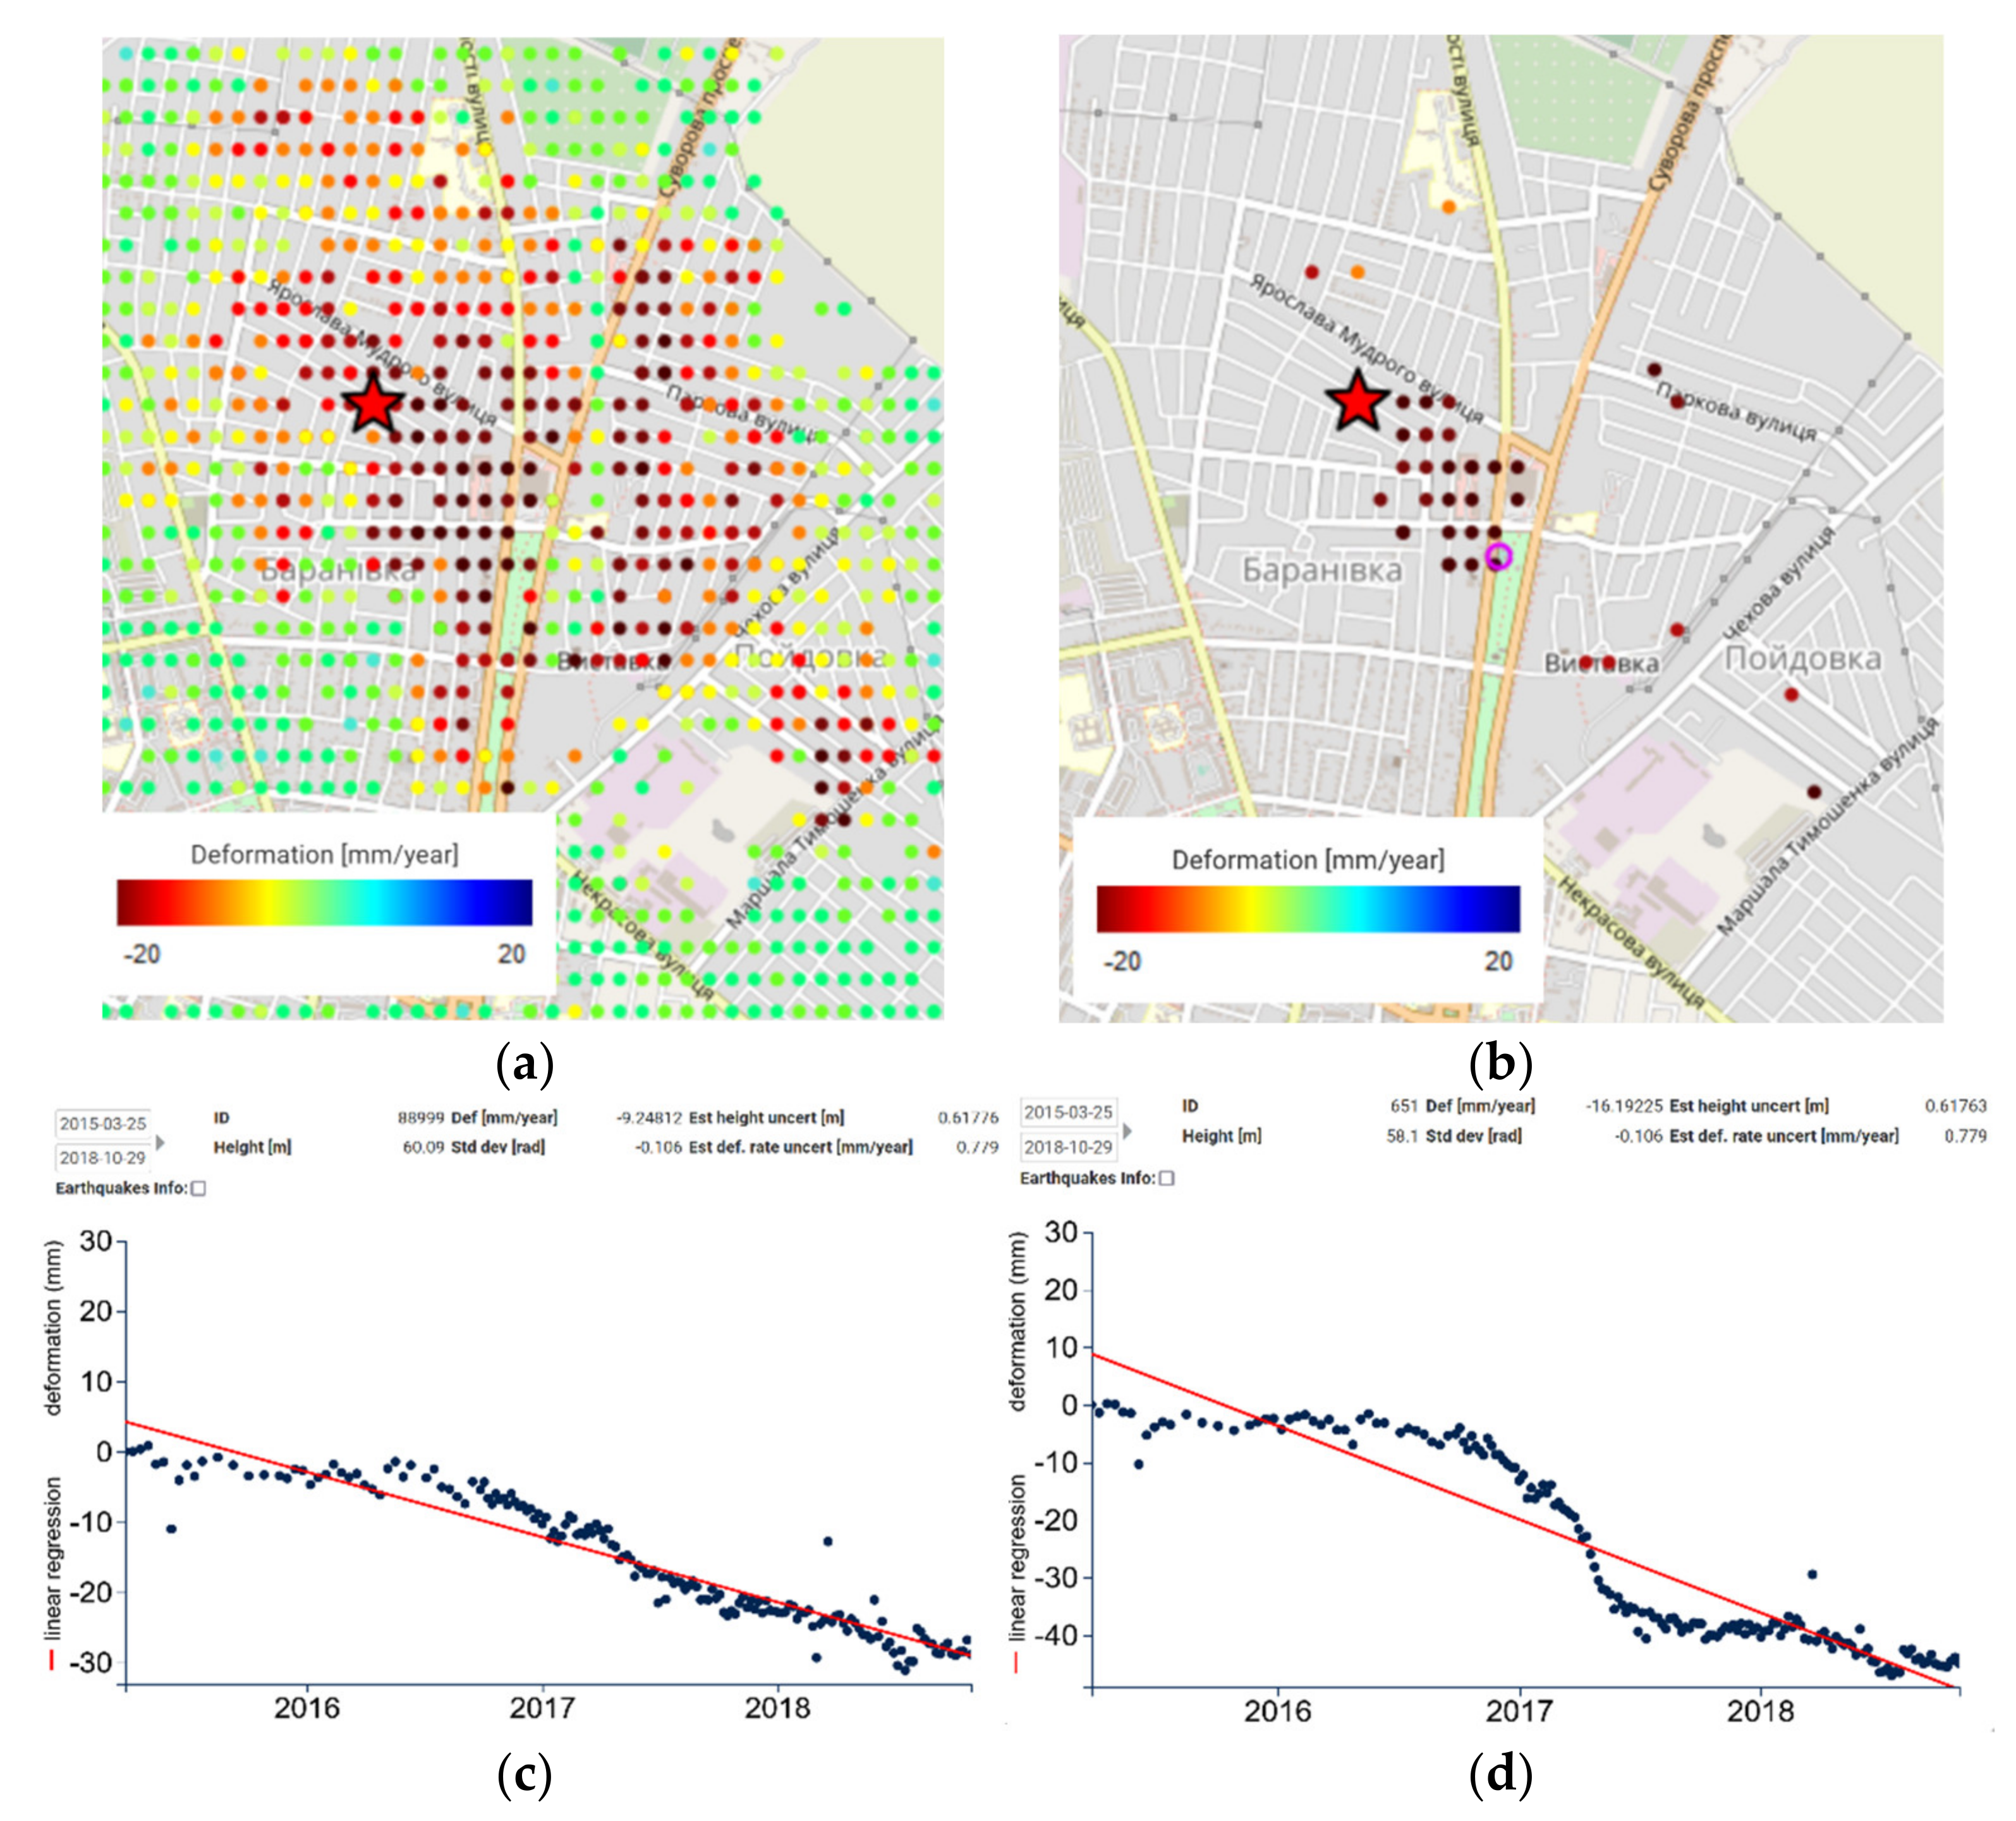
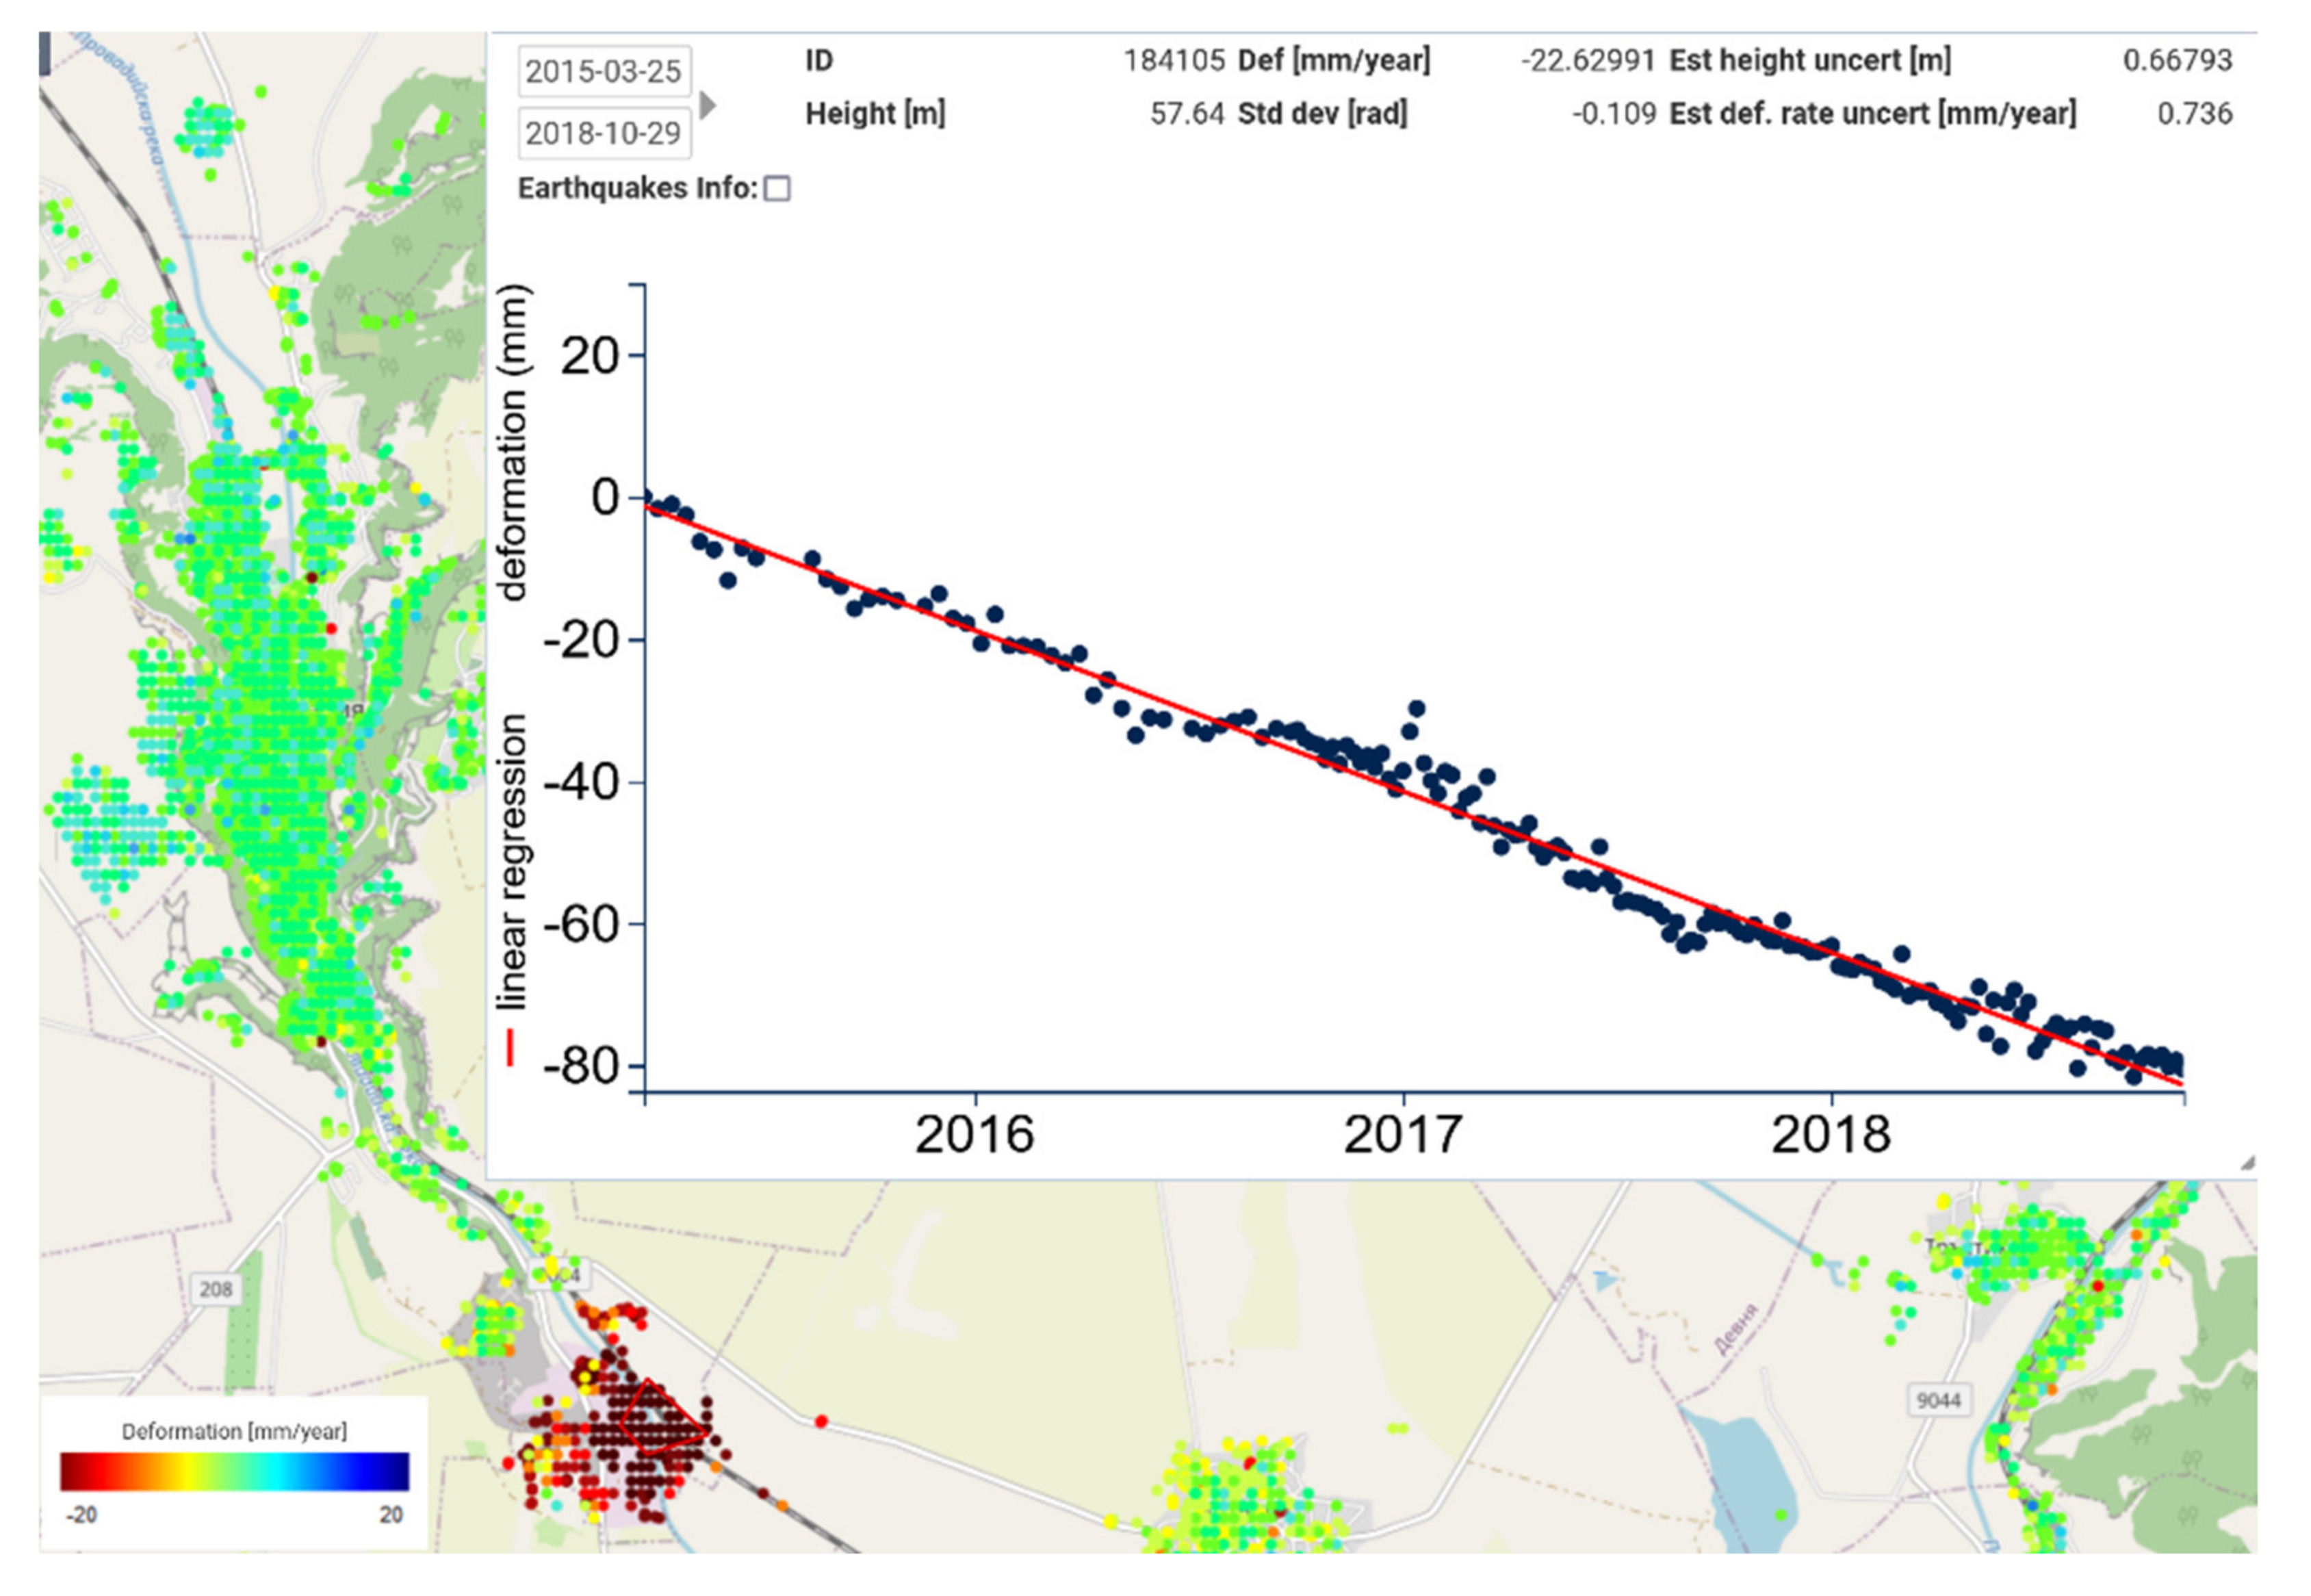
4.1.1. Salt Exploitations

Provadia area (NE Bulgaria)
Located ca. 50 km west of Varna city and the Black Sea coast, the Mirovo salt diapir in the Provadia area has been exploited since the Late Neolithic, Middle and Late Chalcolithic eras, being the oldest salt production center in Europe (5500–4200 BC) and favoring the development of the first prehistoric urban center in Europe (4700–4200 BC) [44]. Industrial exploitation started in the 1950s and is performed using a borehole system injecting fresh water and extracting salt solution [45]. Since the late 1970s, salt exploitation in the Provadia area has been associated with increased seismic activity and large surface subsidence [45].
Long-term geodetic (leveling and GPS) monitoring emphasized relatively high velocities of vertical subsidence of −30–−45 mm/year [45,46,47].
PSInSAR measurement results for the area indicated by the polygon as illustrated in Figure 9 reveal an average subsidence of −22.6 mm/year for the 2015–2020 timespan in the SAR LOS direction.
Solotvyno (Ukraine)
Similar local land-surface subsidence with a maximum line-of-sight deformation rate of 5 cm/yr associated with sinkhole development in a salt exploitation area was also detected by InSAR methodology at Solotvyno in Ukraine, close to the Romanian border, as reported by Szűcs et al., 2021 [48].
The subsidence effect is also visible from PSTool, serving as cross-validation with the previous study. Figure 10 illustrates with red the subsidence area; a temporal displacement profile selected from the maximum subsidence area indicates a subsidence rate of around 15mm/year.
The zero-displacement point in the profile represents the time of the reference scene.
Some PSInSAR methods output temporal profiles that intersect the displacement axis (zero-displacement point) at the time of the reference SAR acquisition. This kind of representation is useful because it provides information about the reference date. A different approach (that is also used for GNSS data representation) is to shift the profile in order for the displacement to start from zero; this approach makes sense especially for PSInSAR algorithms that use multiple temporal references. Since multiple datasets can be used in parallel and each one likely starting at a different time, calibrating each dataset to start from zero at the start time does not improve the analysis.

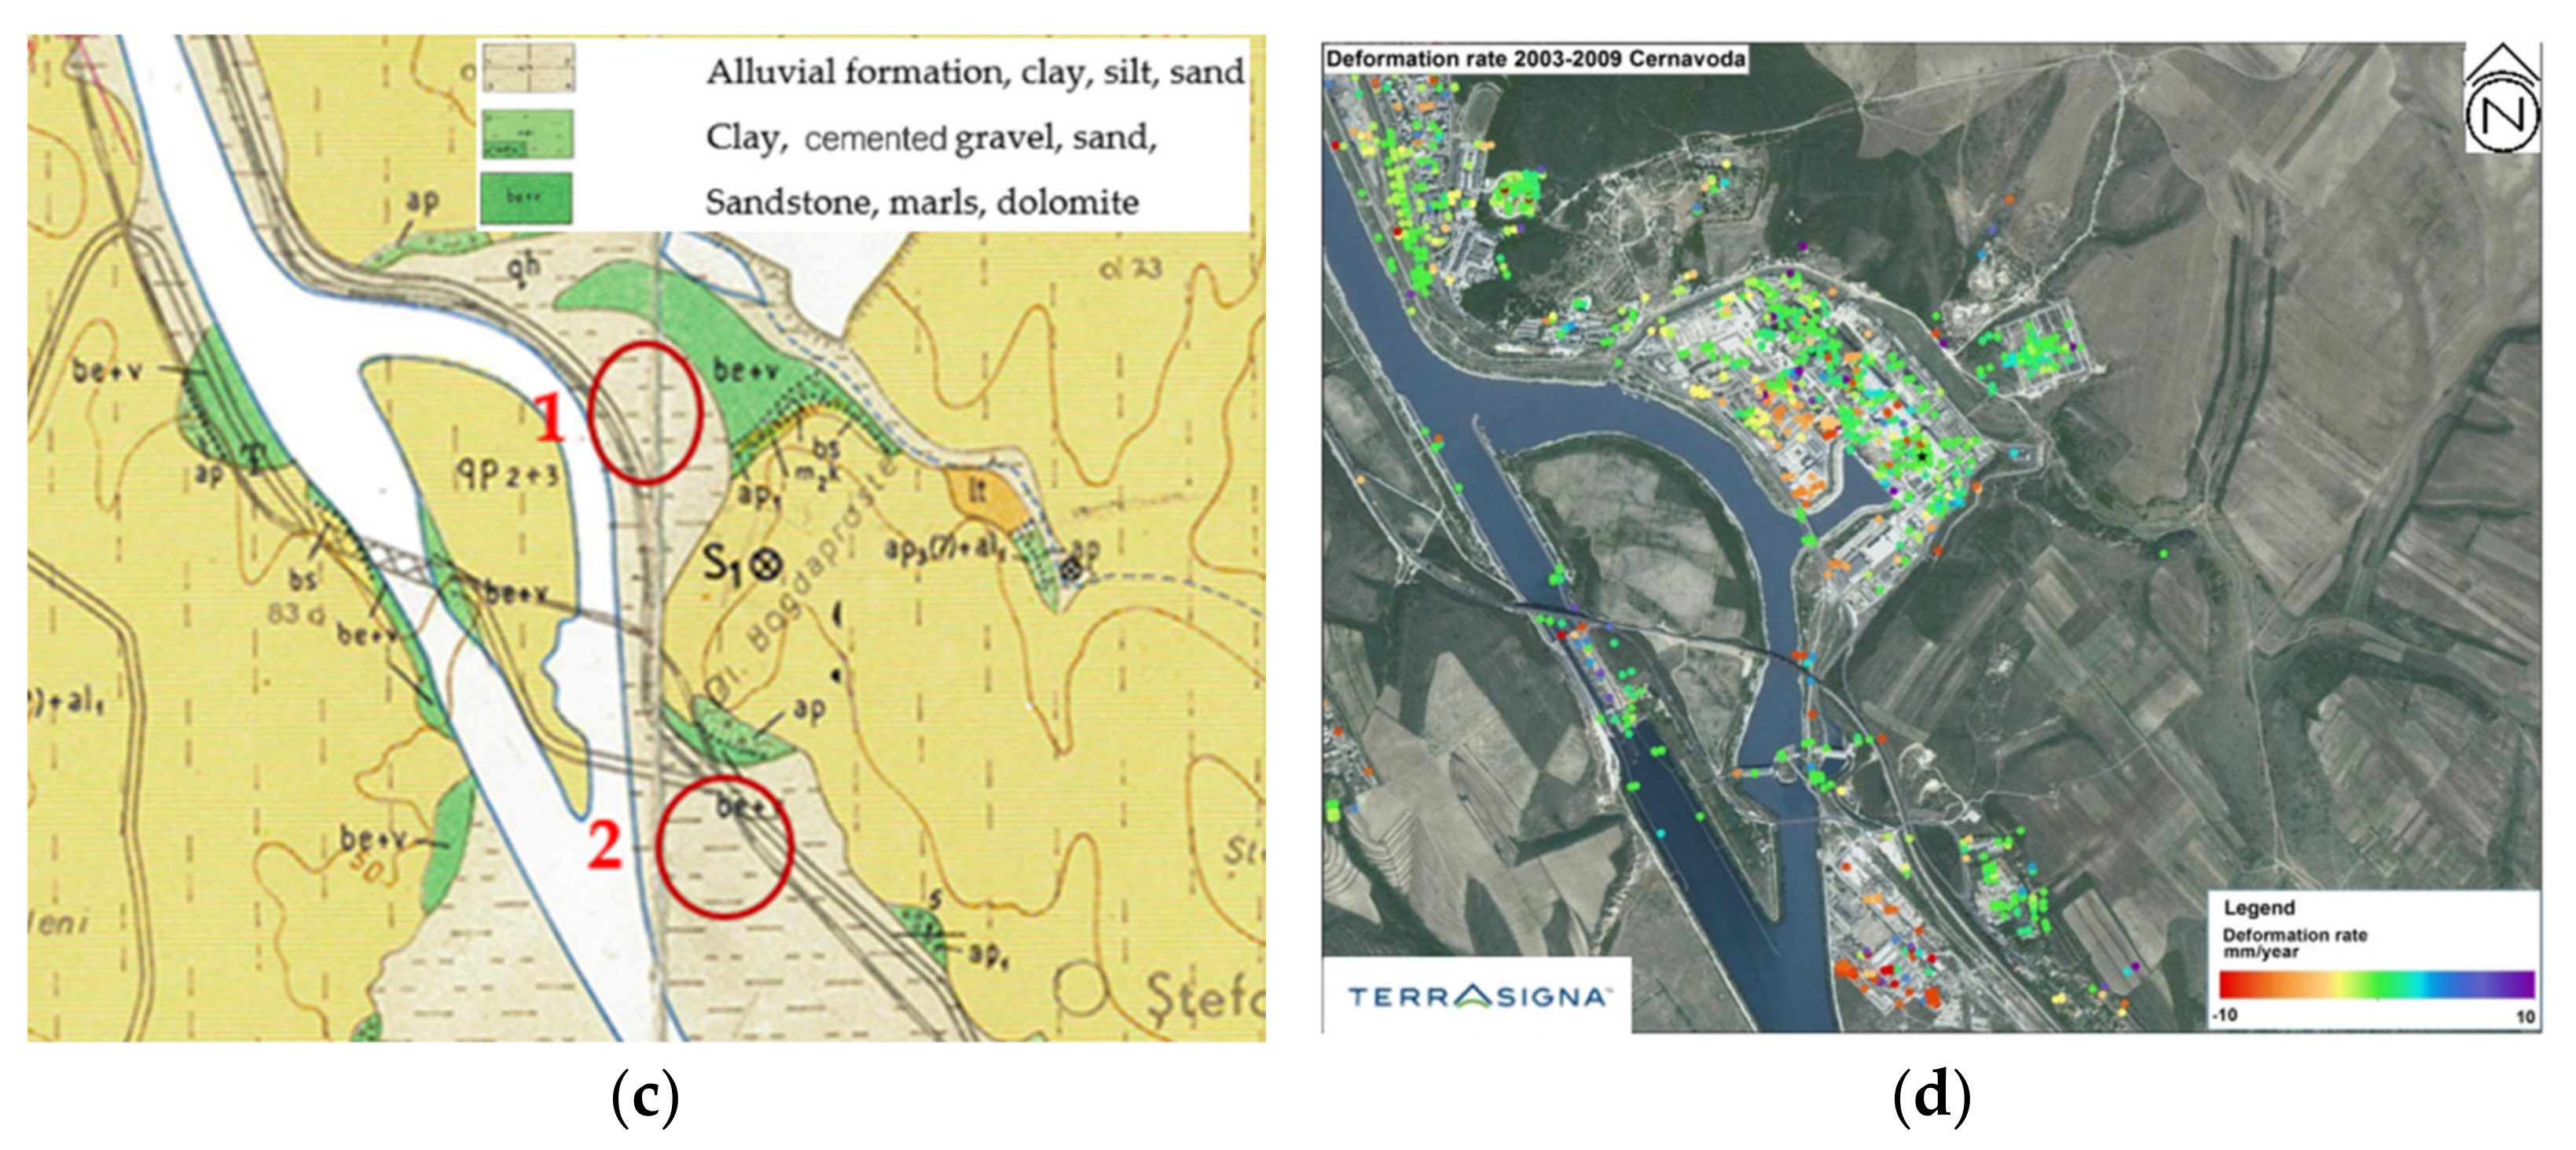
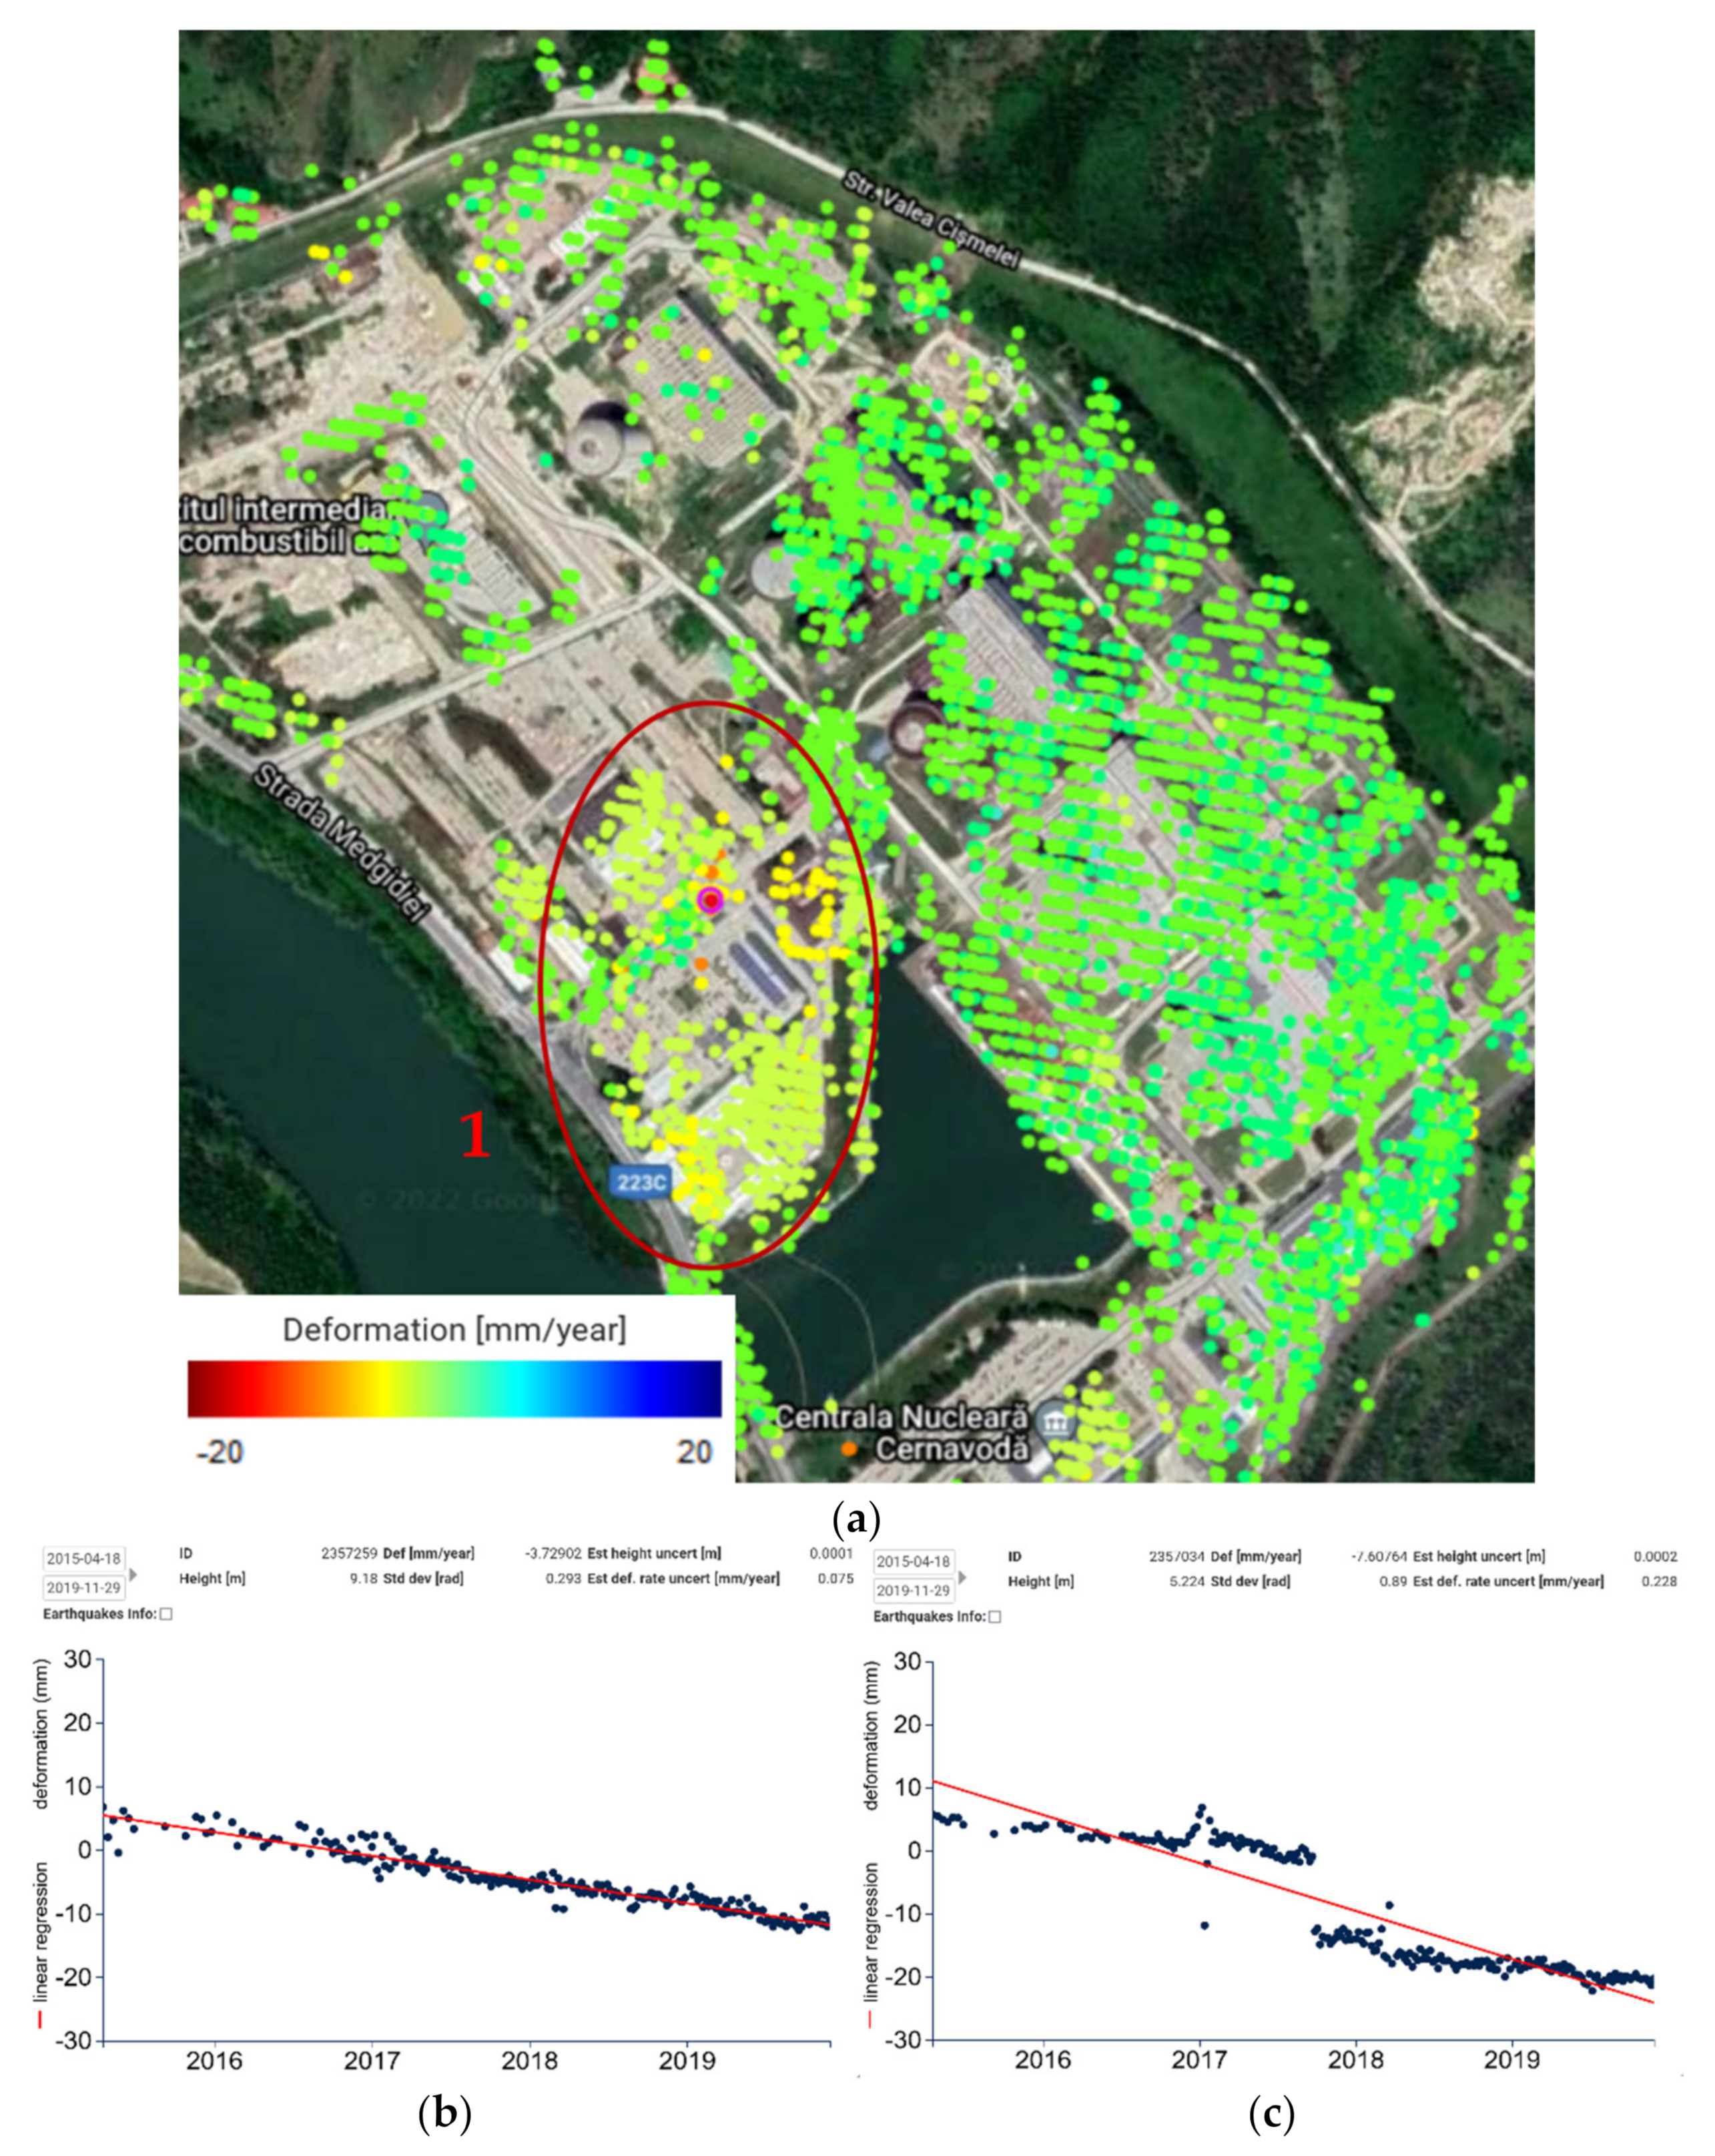
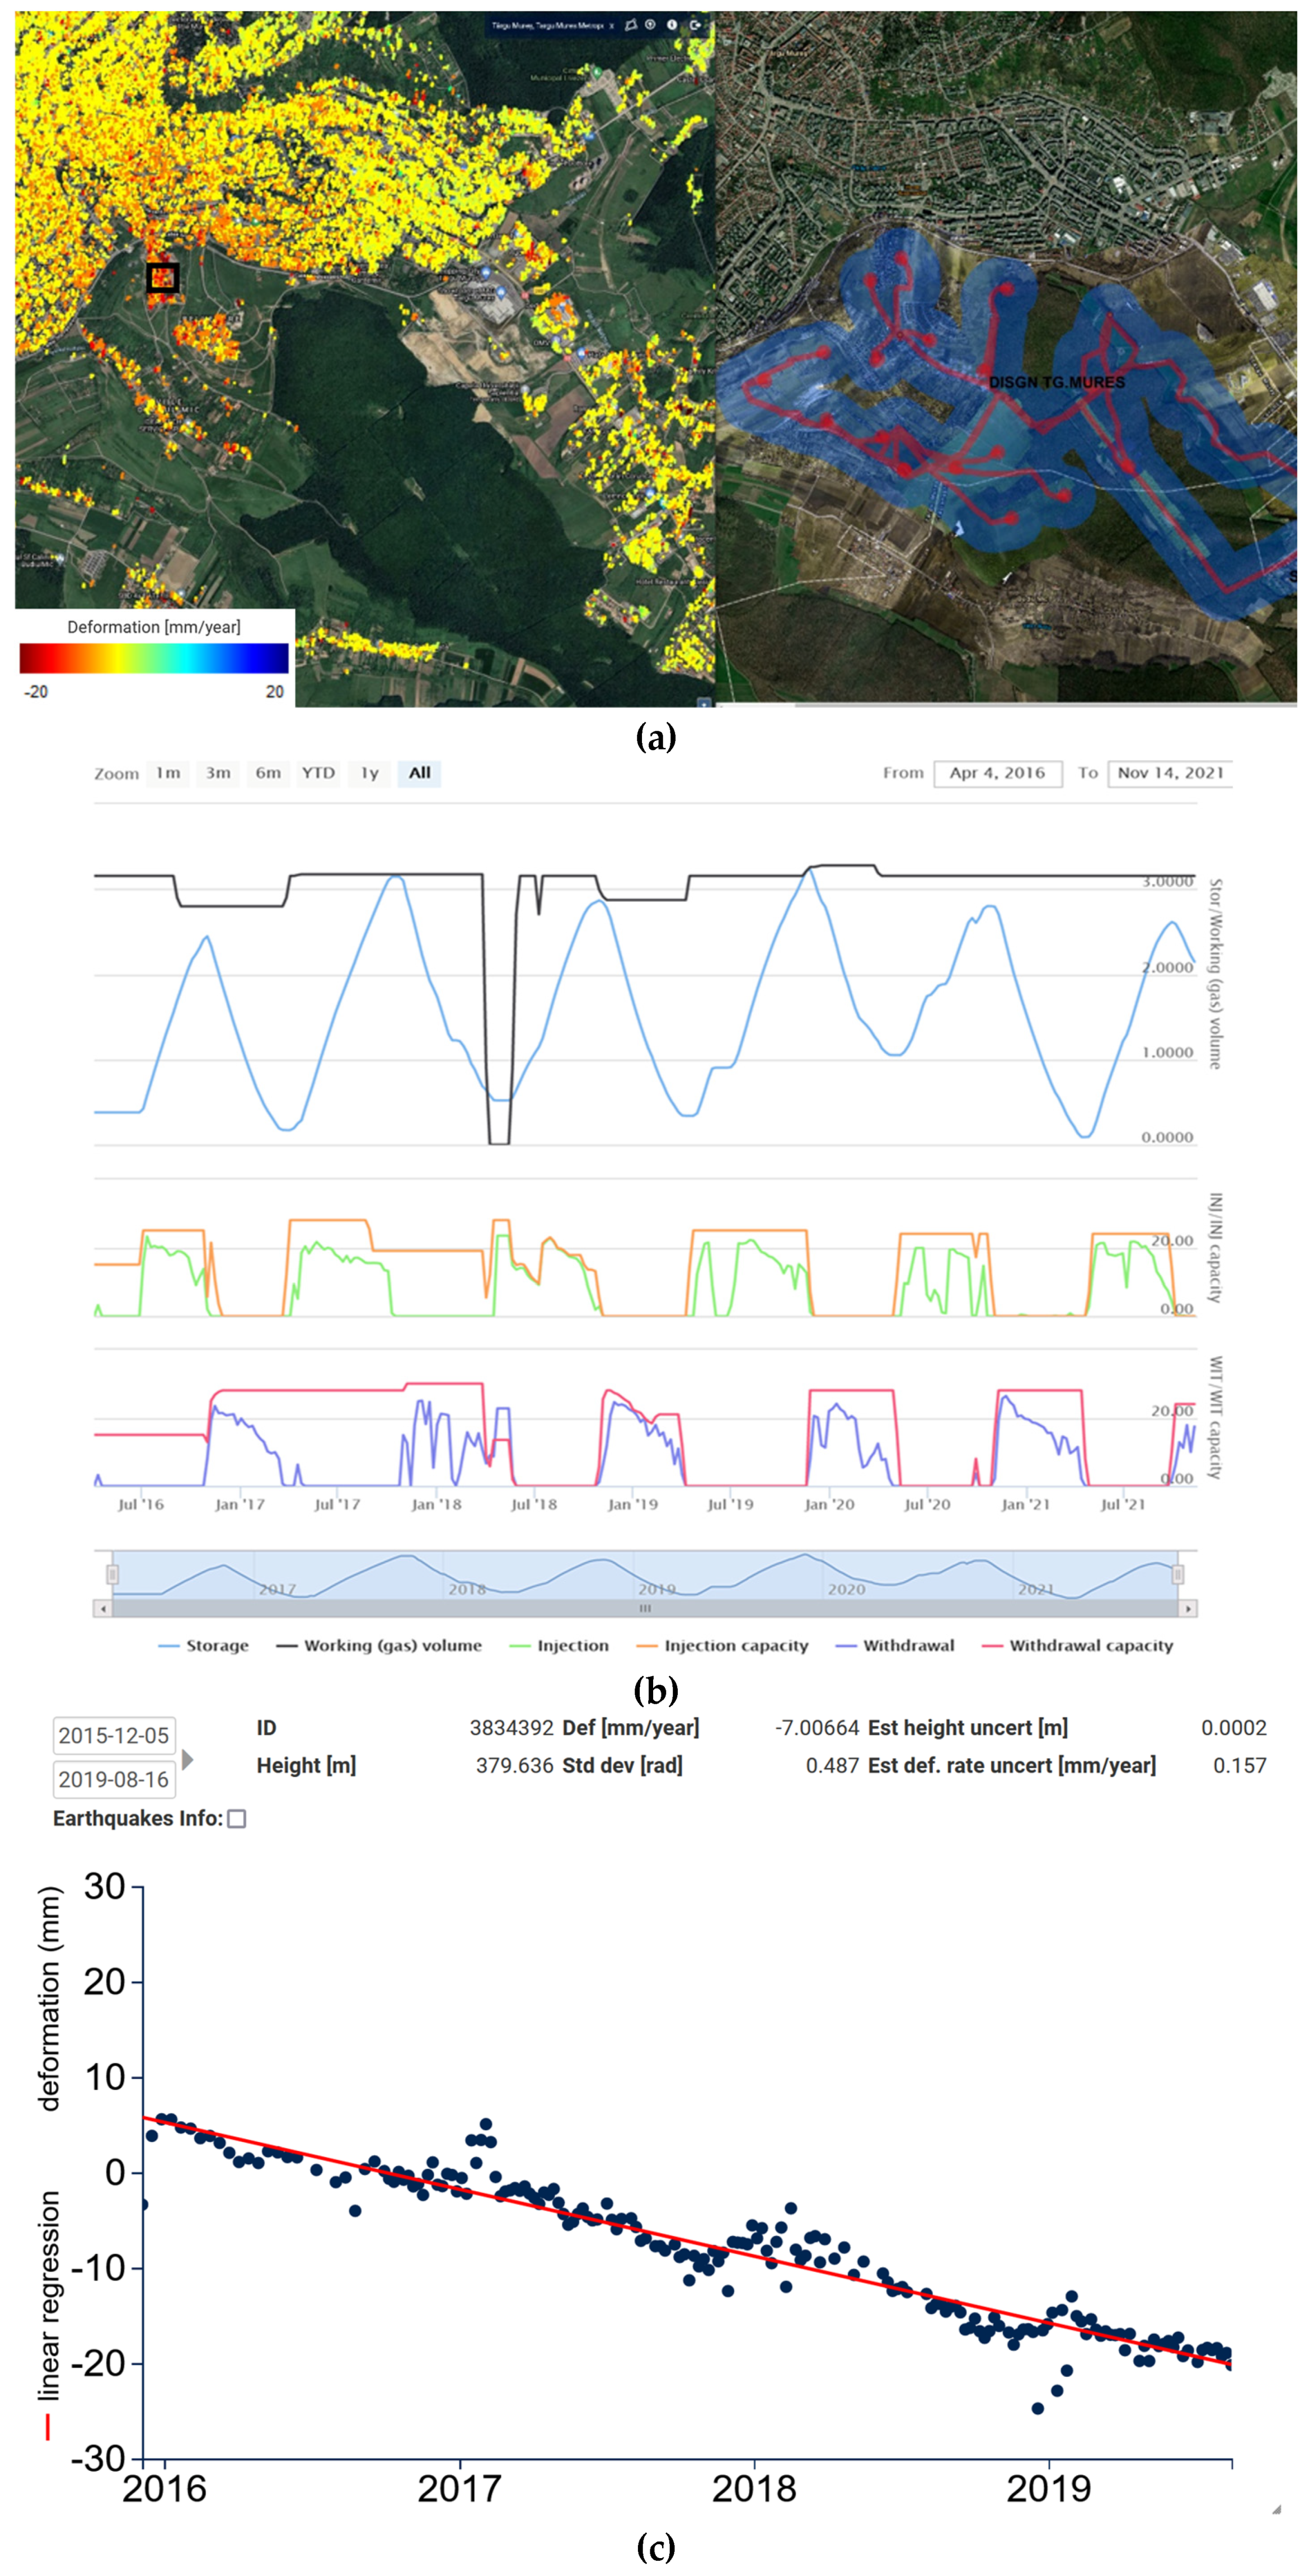
4.1.2. Critical Infrastructure Stability in the City of Cernavoda (Romania)

The Cernavoda nuclear plant is built in the vicinity of the Danube River. The reactors are built on the more stable sandstone bedrock, whereas some other infrastructure is built on the alluvial formation. Subsidence of −3–−8 mm/year (Figure 11a,b) is to be noted in the alluvial Areas 1 and especially 2 (Figure 11c), as elucidated from Sentinel-1 PSInSAR measurements. The subsidence was cross-validated with independent PSInSAR measurements using data from the ESA ASAR mission, as illustrated in Figure 11d and correlated with the geological layers as illustrated in Figure 11c.
A closer look at Area 1 confined within the nuclear plant industrial complex (Figure 12a) reveals an area affected by subsidence of around −3.0~−4.0 mm/year (Figure 12b), and an isolated structure (red dot indicated by black arrow) subsiding with an average of −7.4 mm/year which suffered a 12 mm drop in September 2018 (Figure 12c).

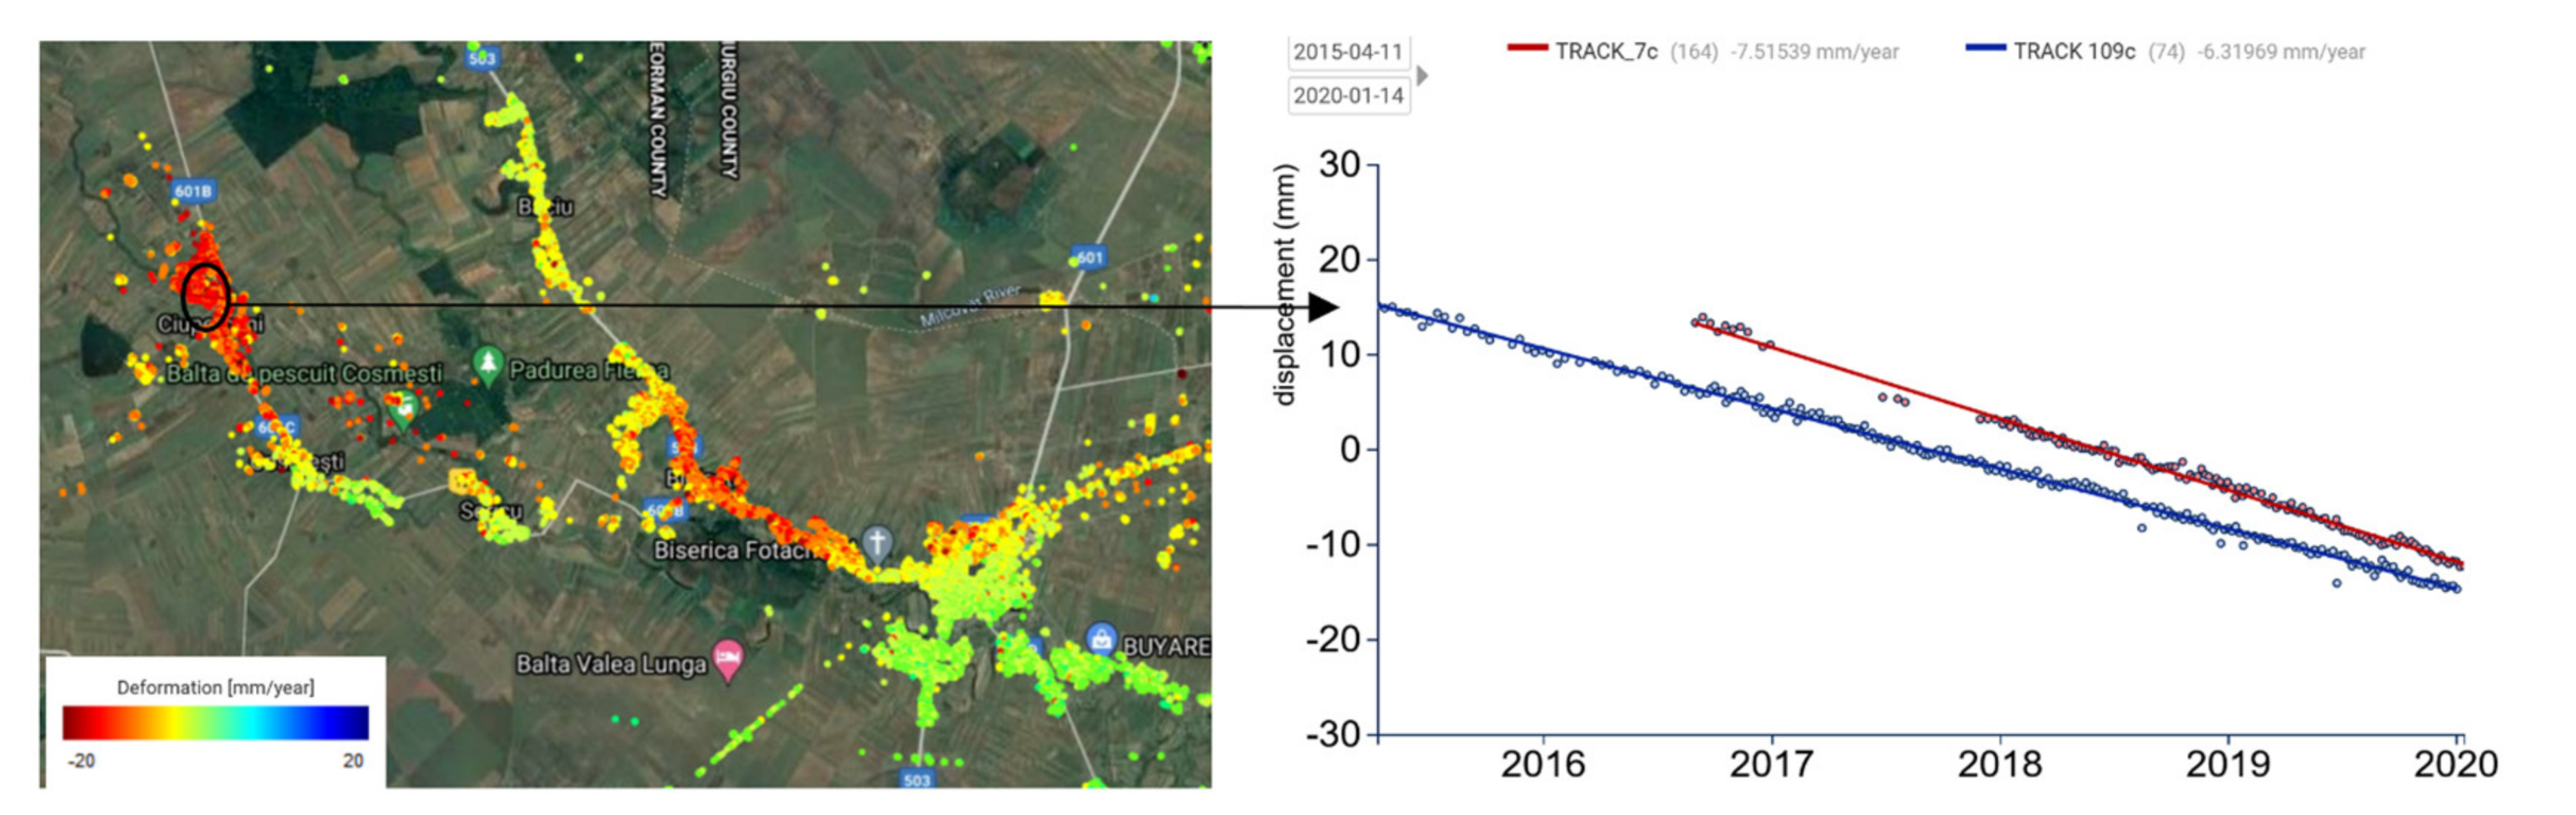
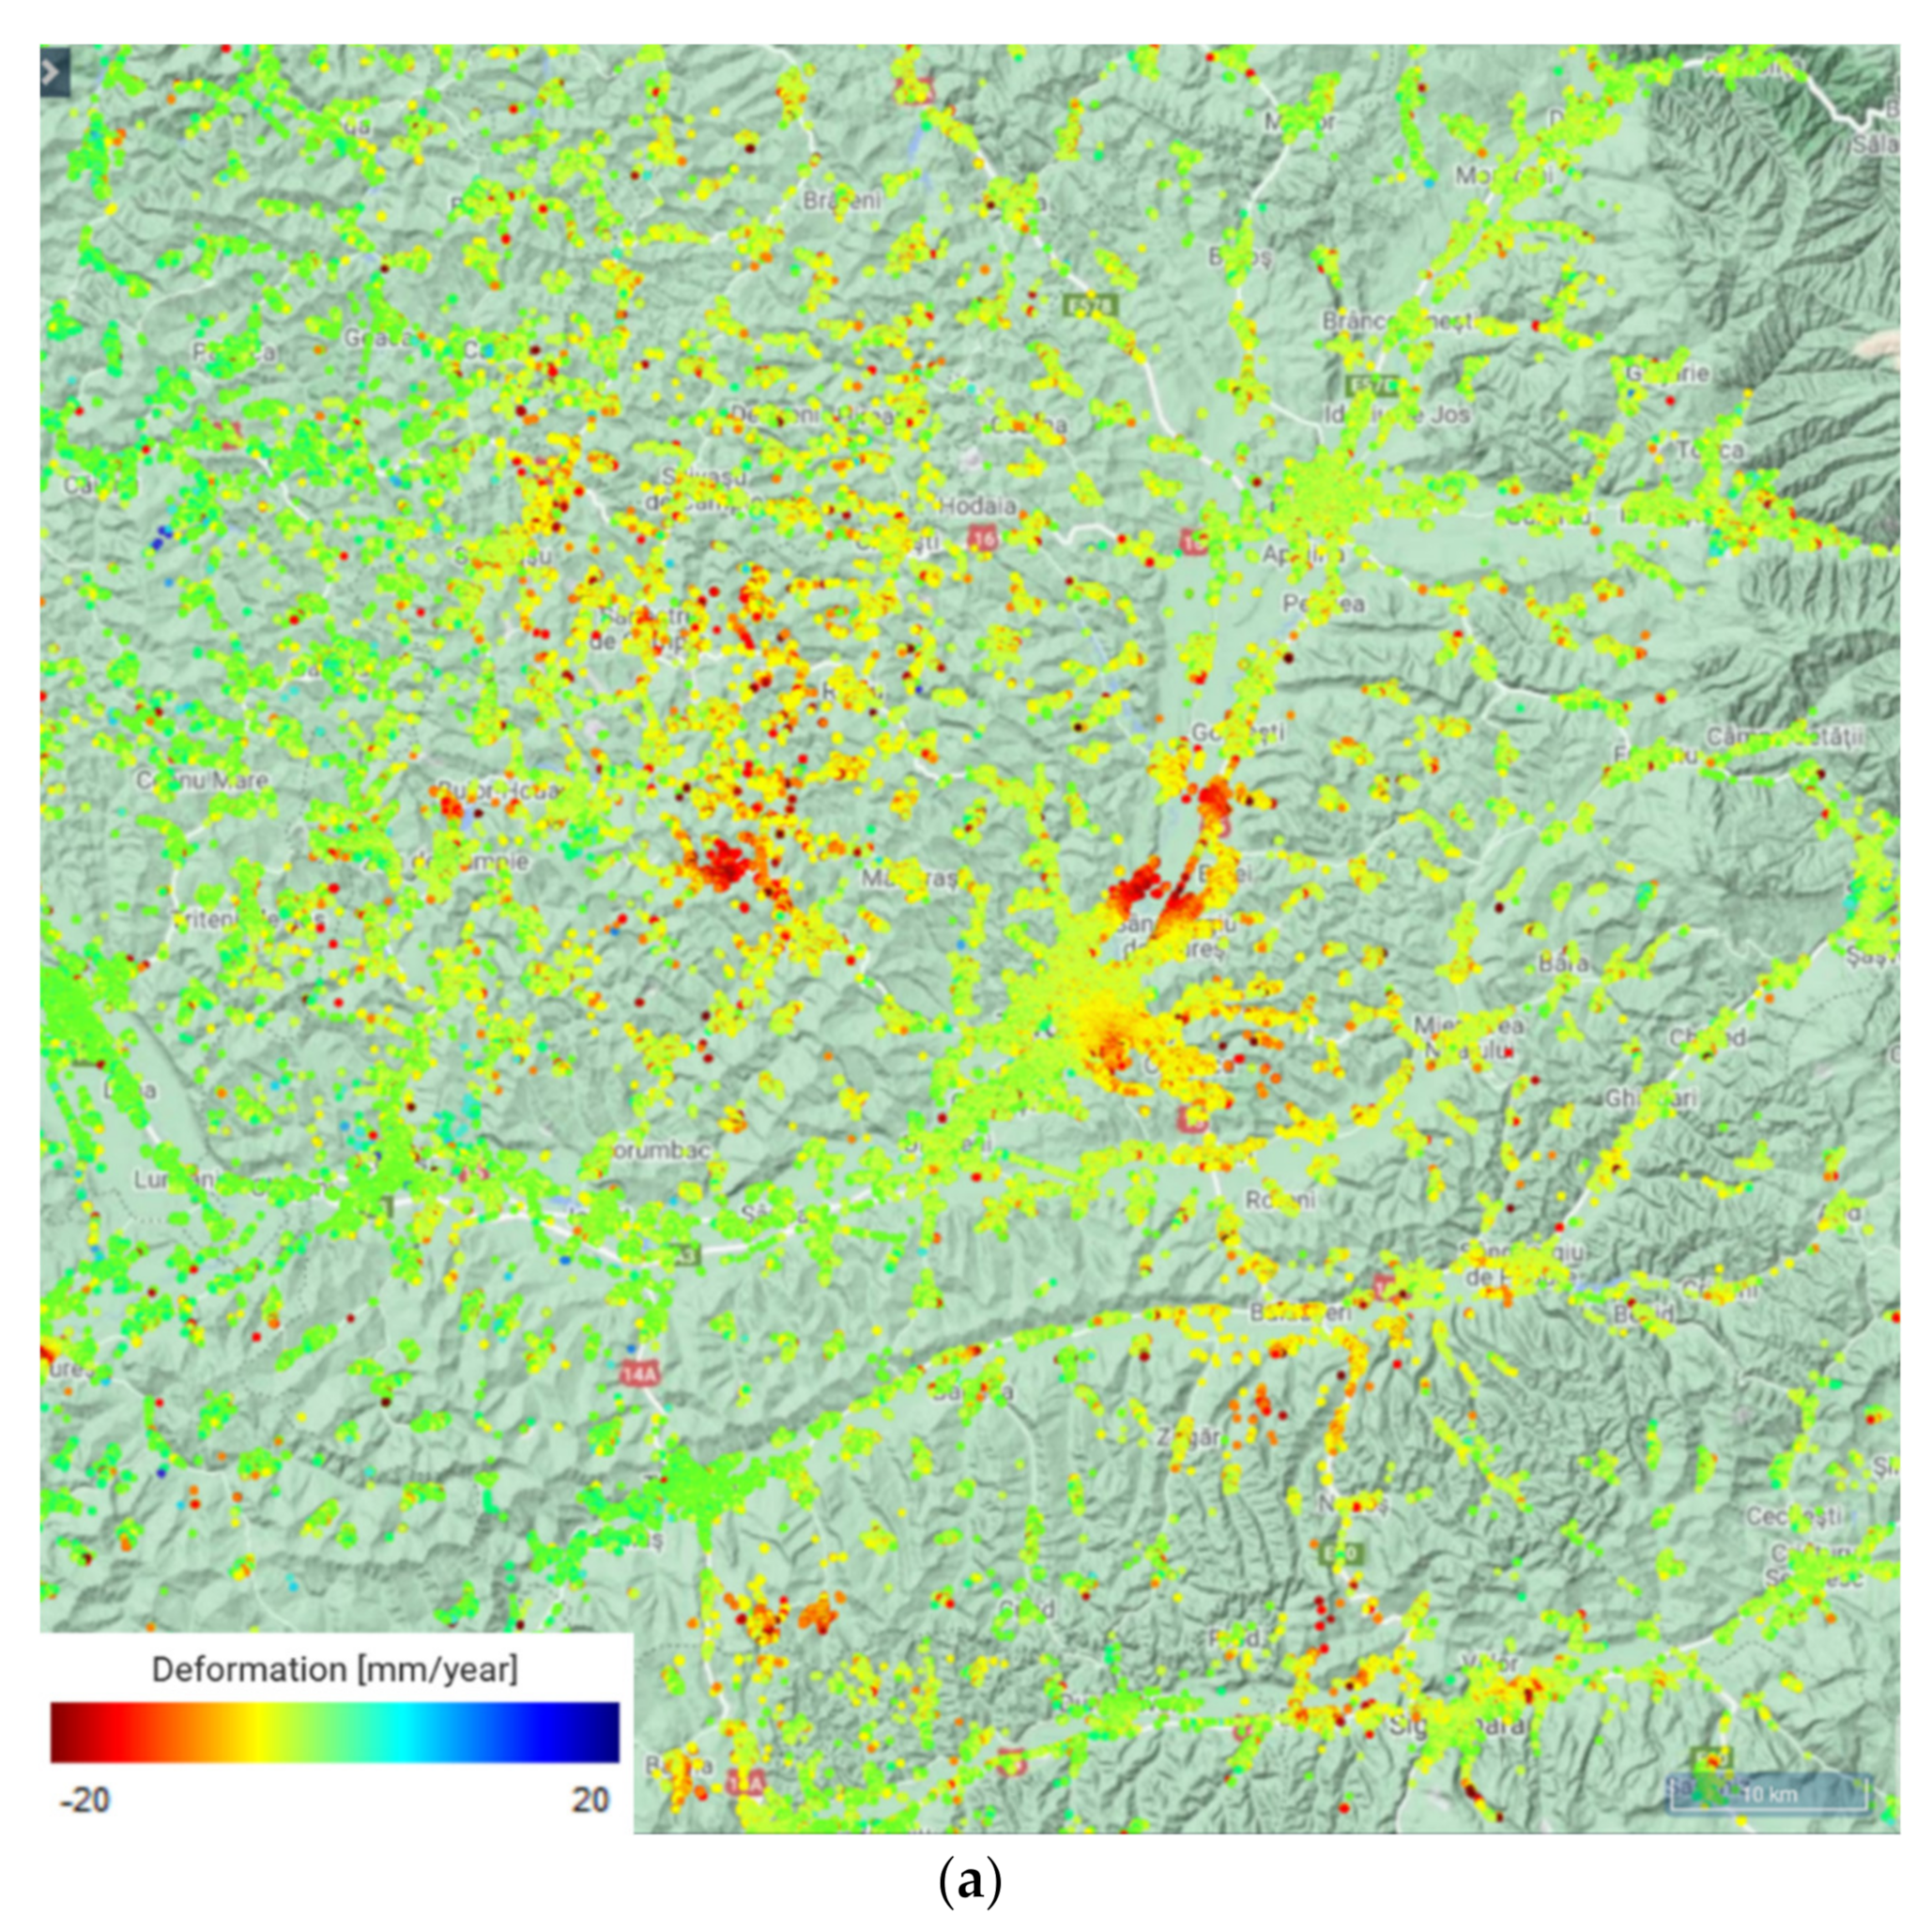
4.1.3. Oil Exploitation in Videle Area (Romania)

In the central part of the Romanian Plain (Southern Romania), PSInSAR measurement results emphasized −5–−7 mm/year subsidence in some areas (e.g., Blejesti and Ciuperceni) situated northwest of the town of Videle, Teleorman County (Figure 13).
In this region an oil field was discovered in 1958, and oil extraction activities began in 1961. The reserves of the oil field are around 300 million barrels, and production averages around 22,000 barrels (3500 m3/d) per day [50].

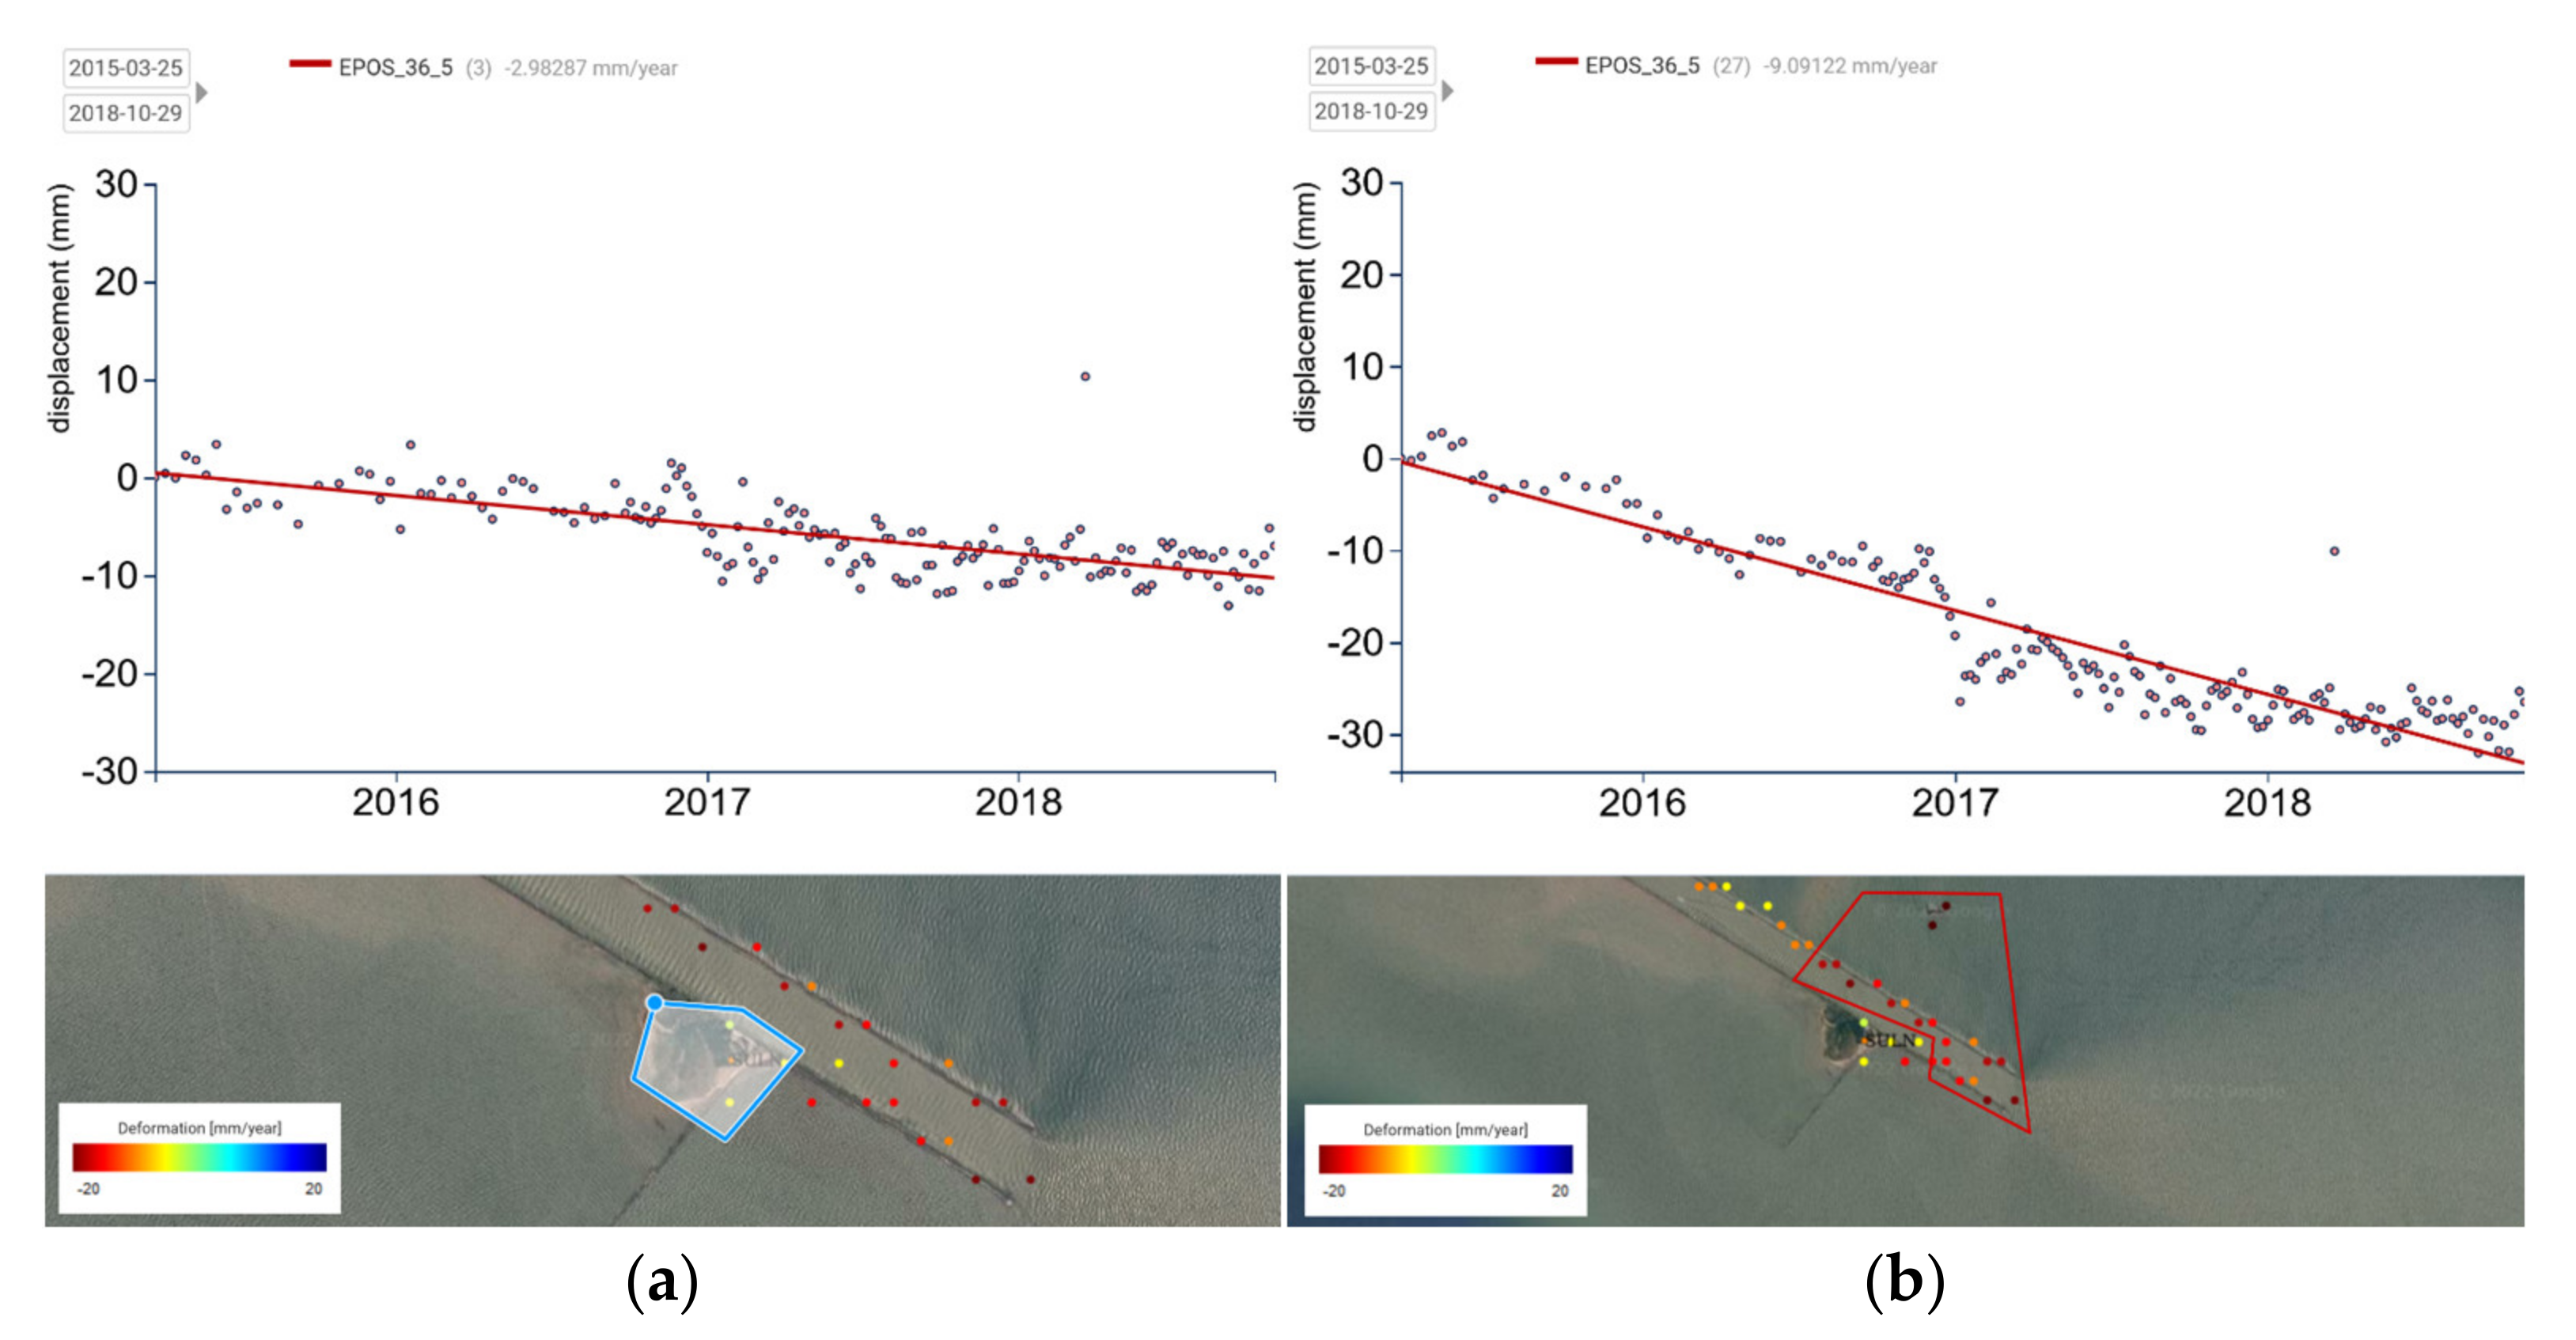
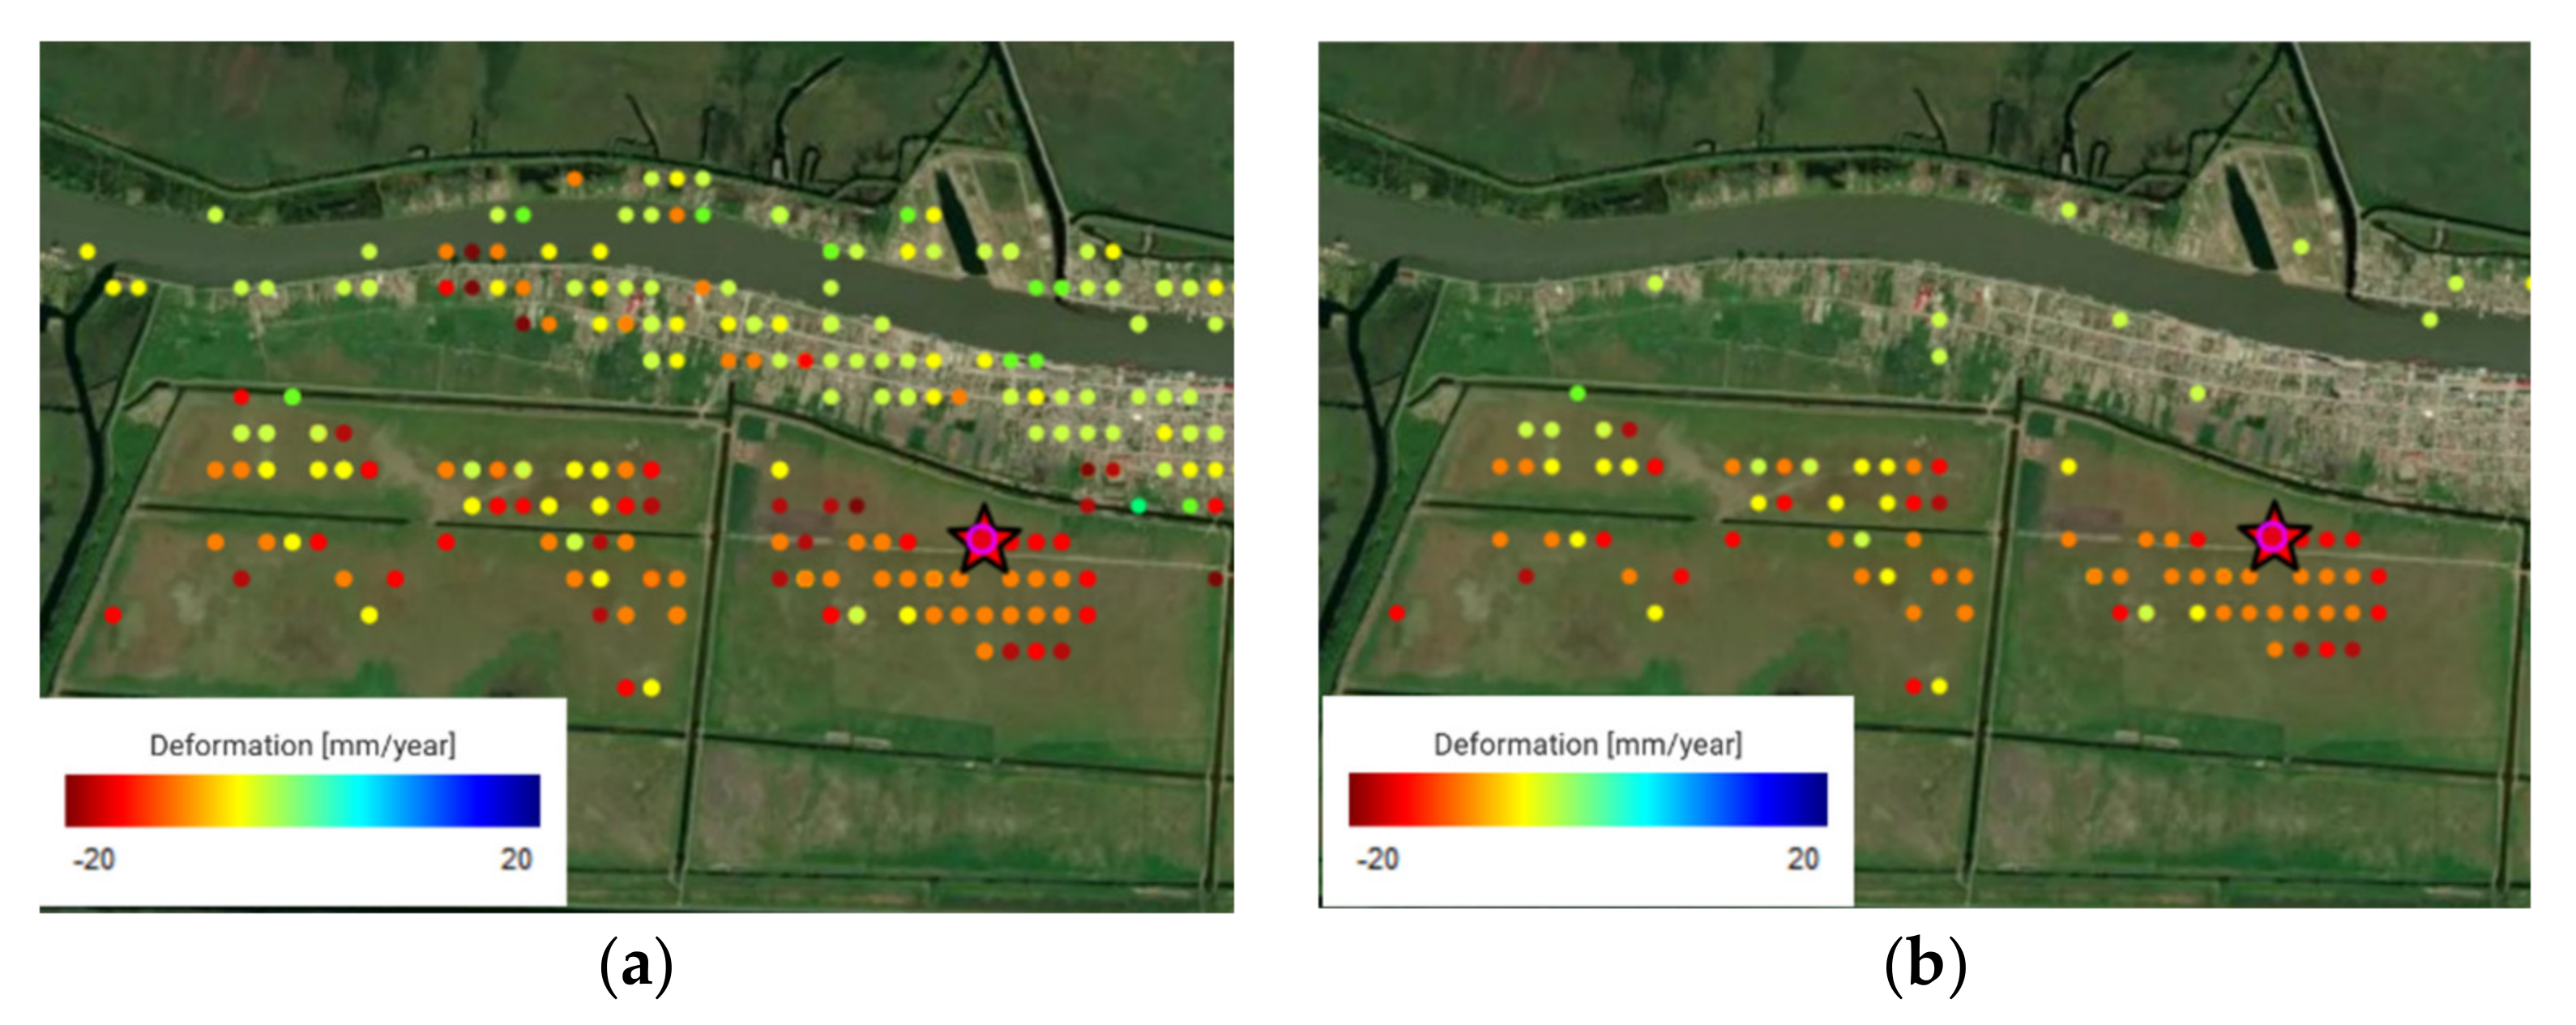
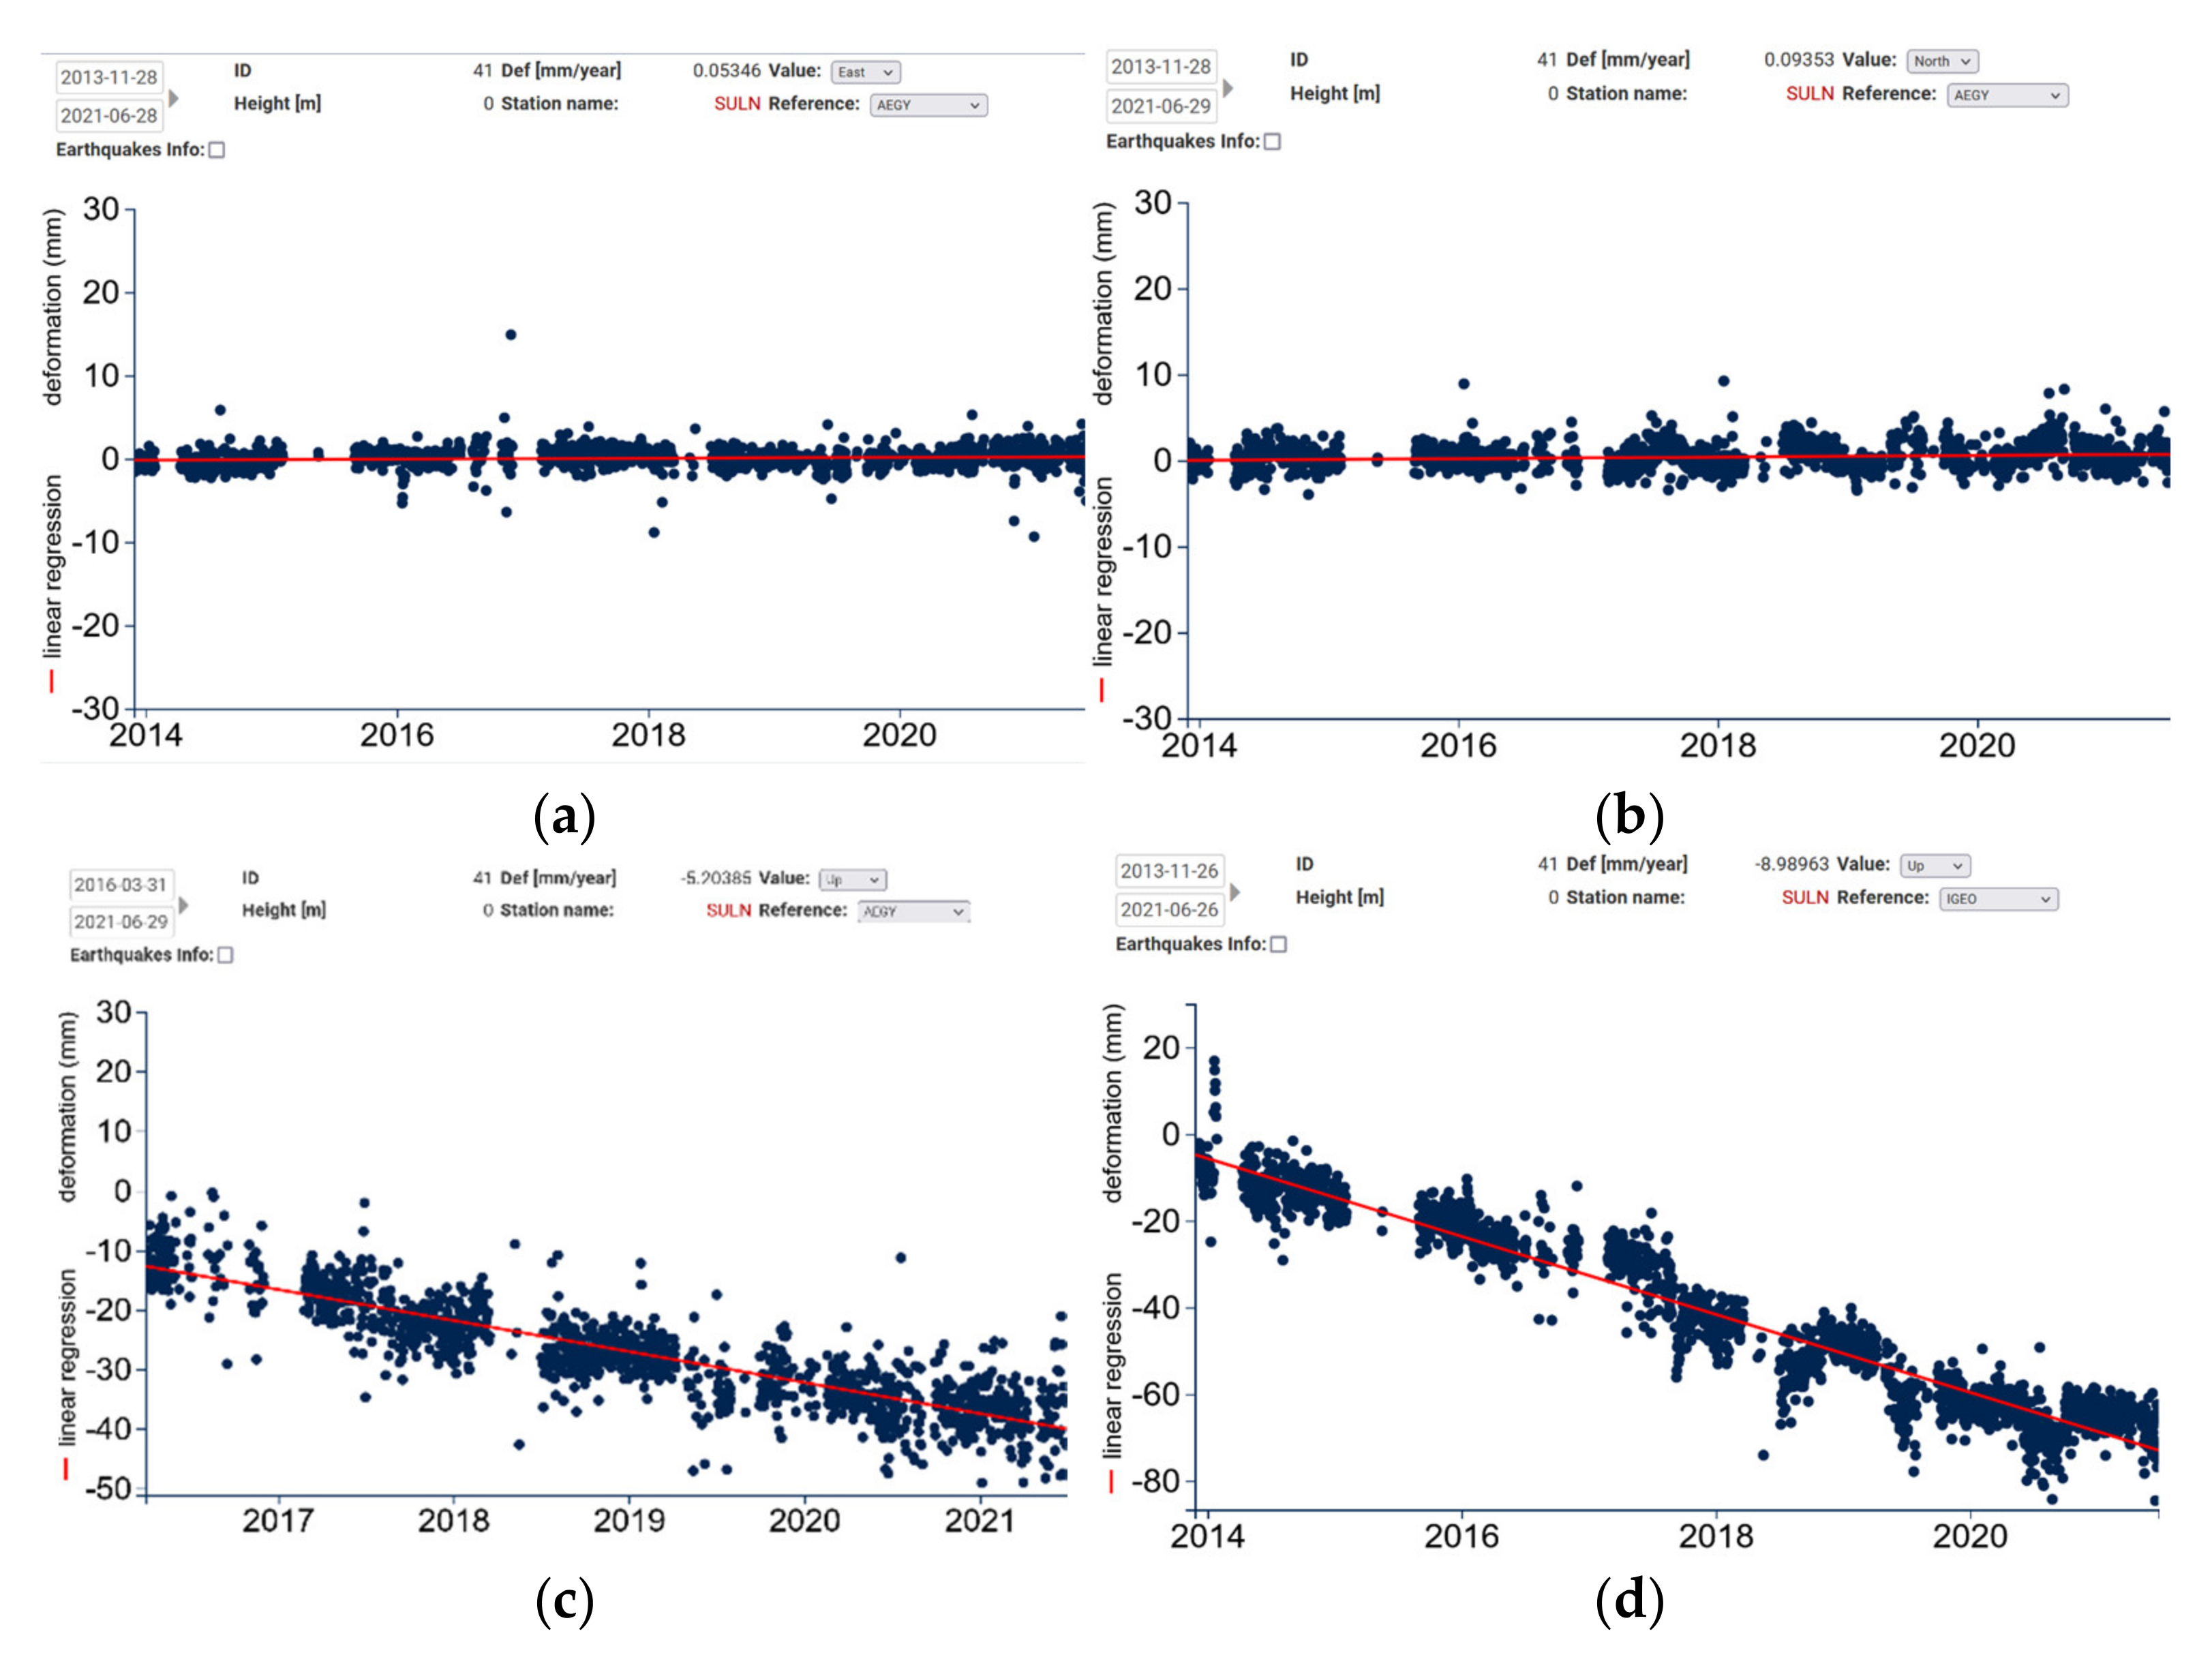
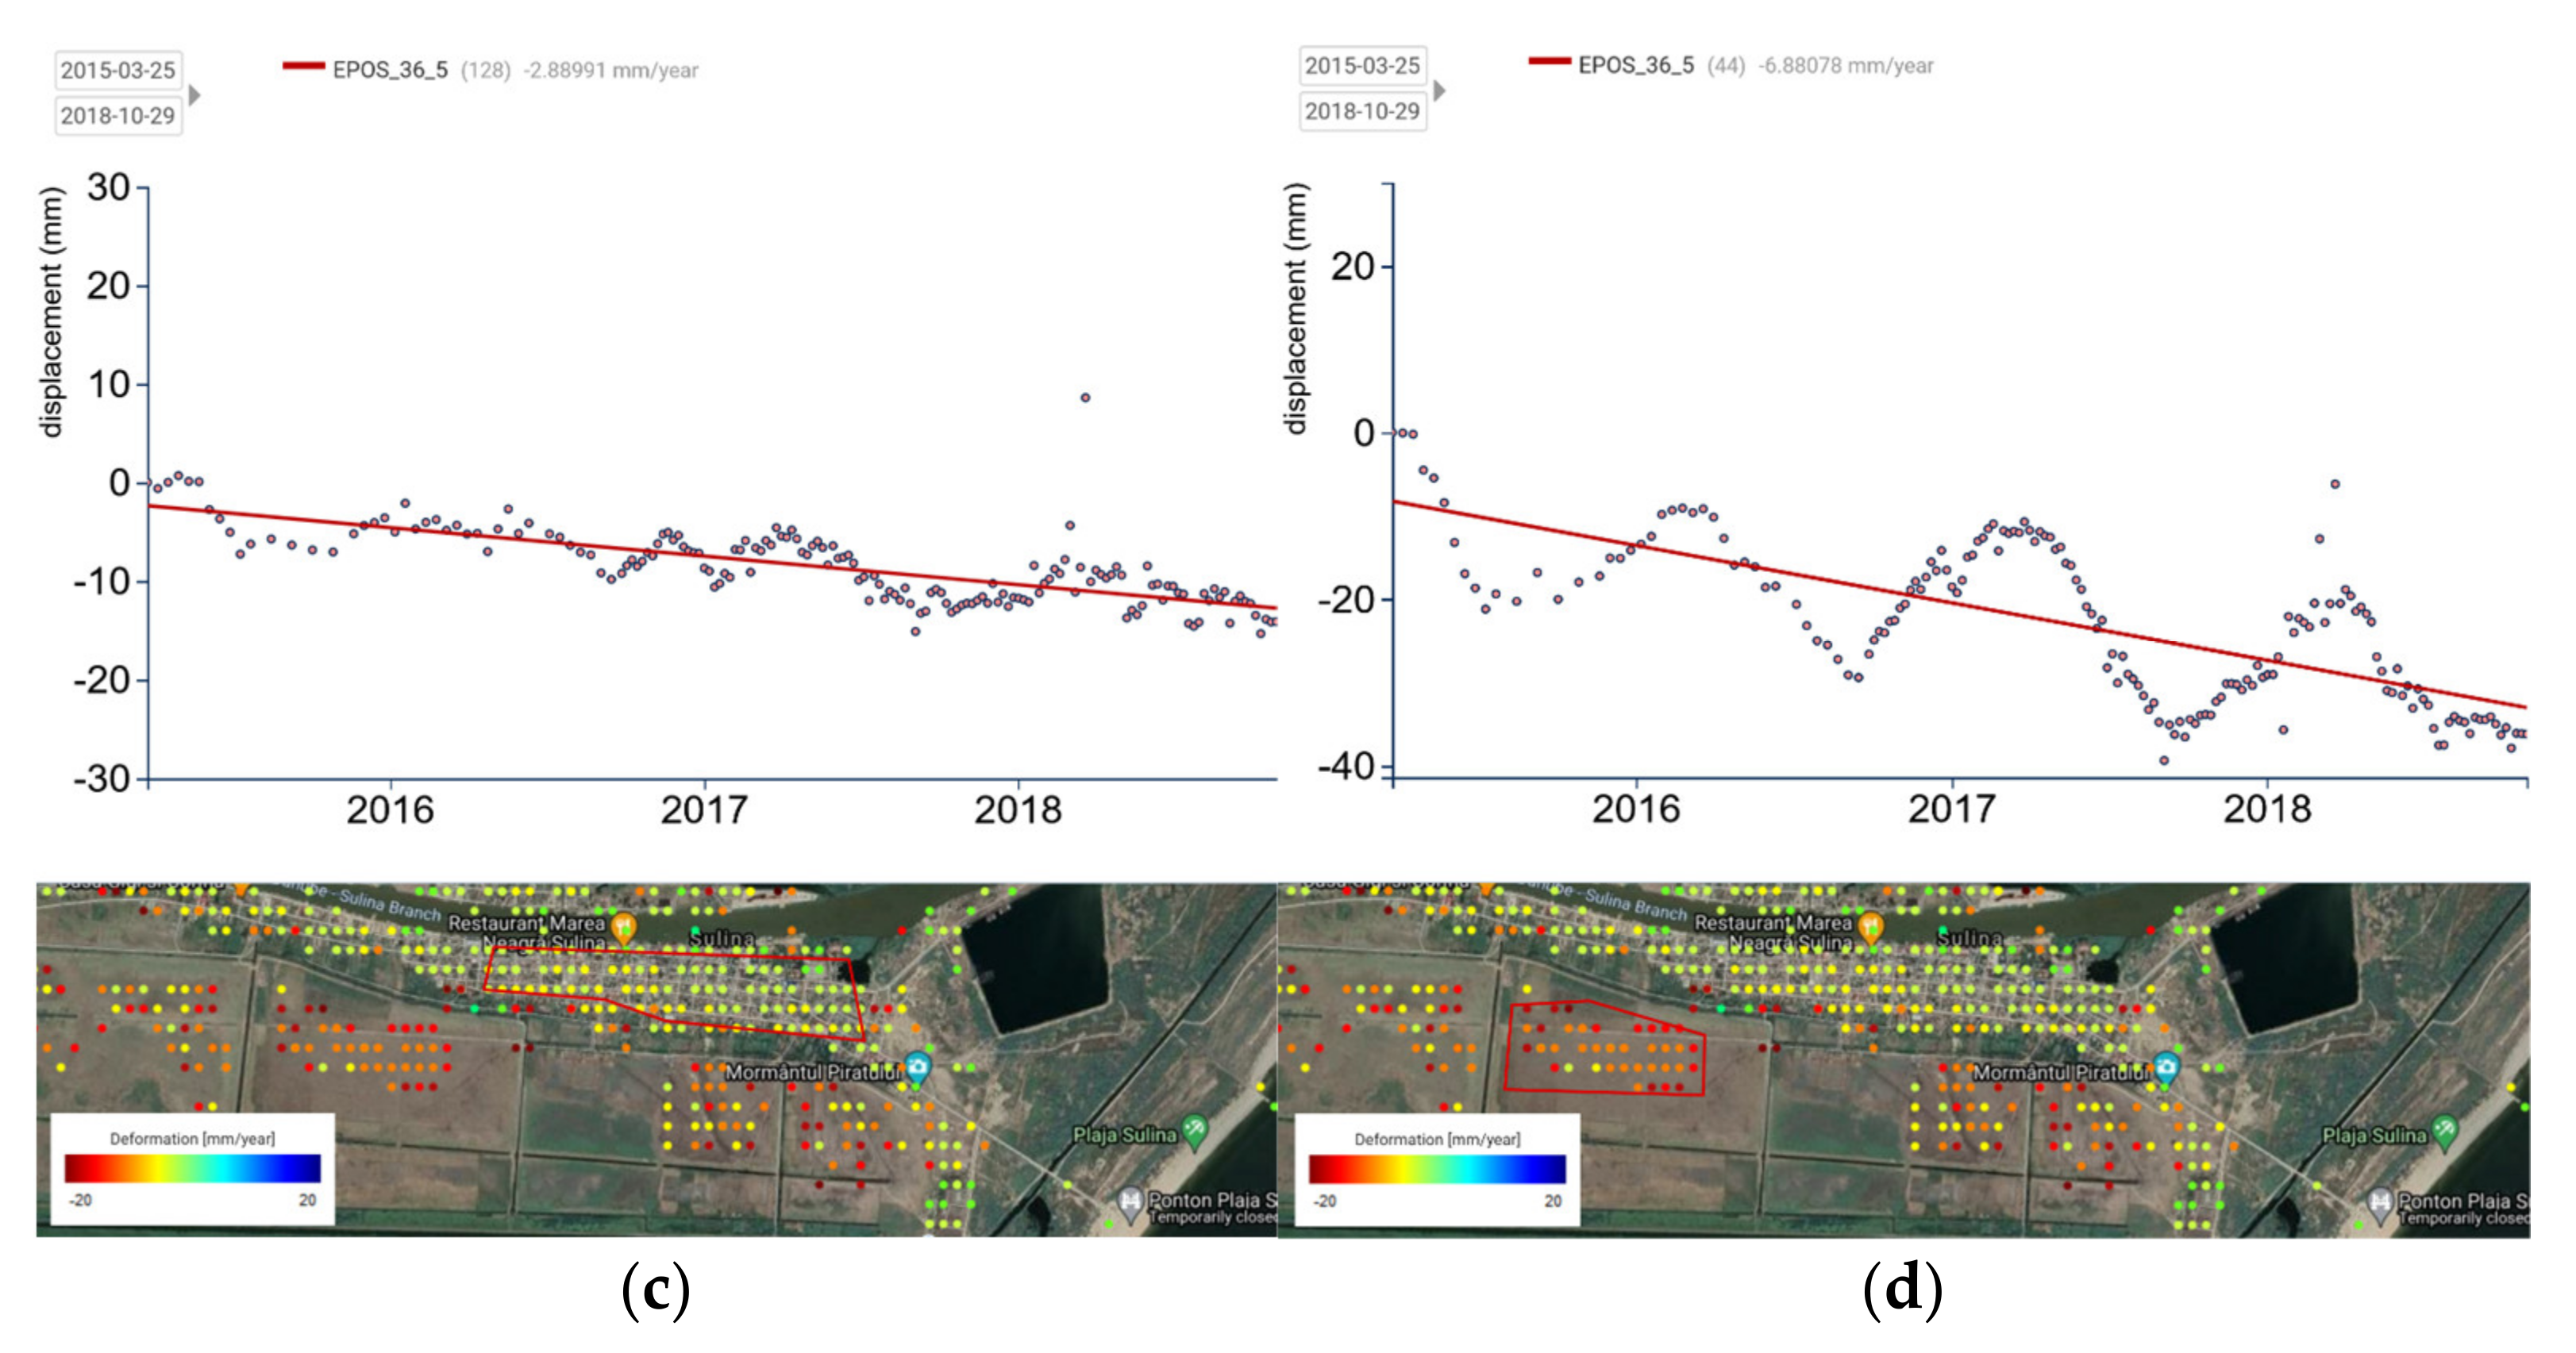
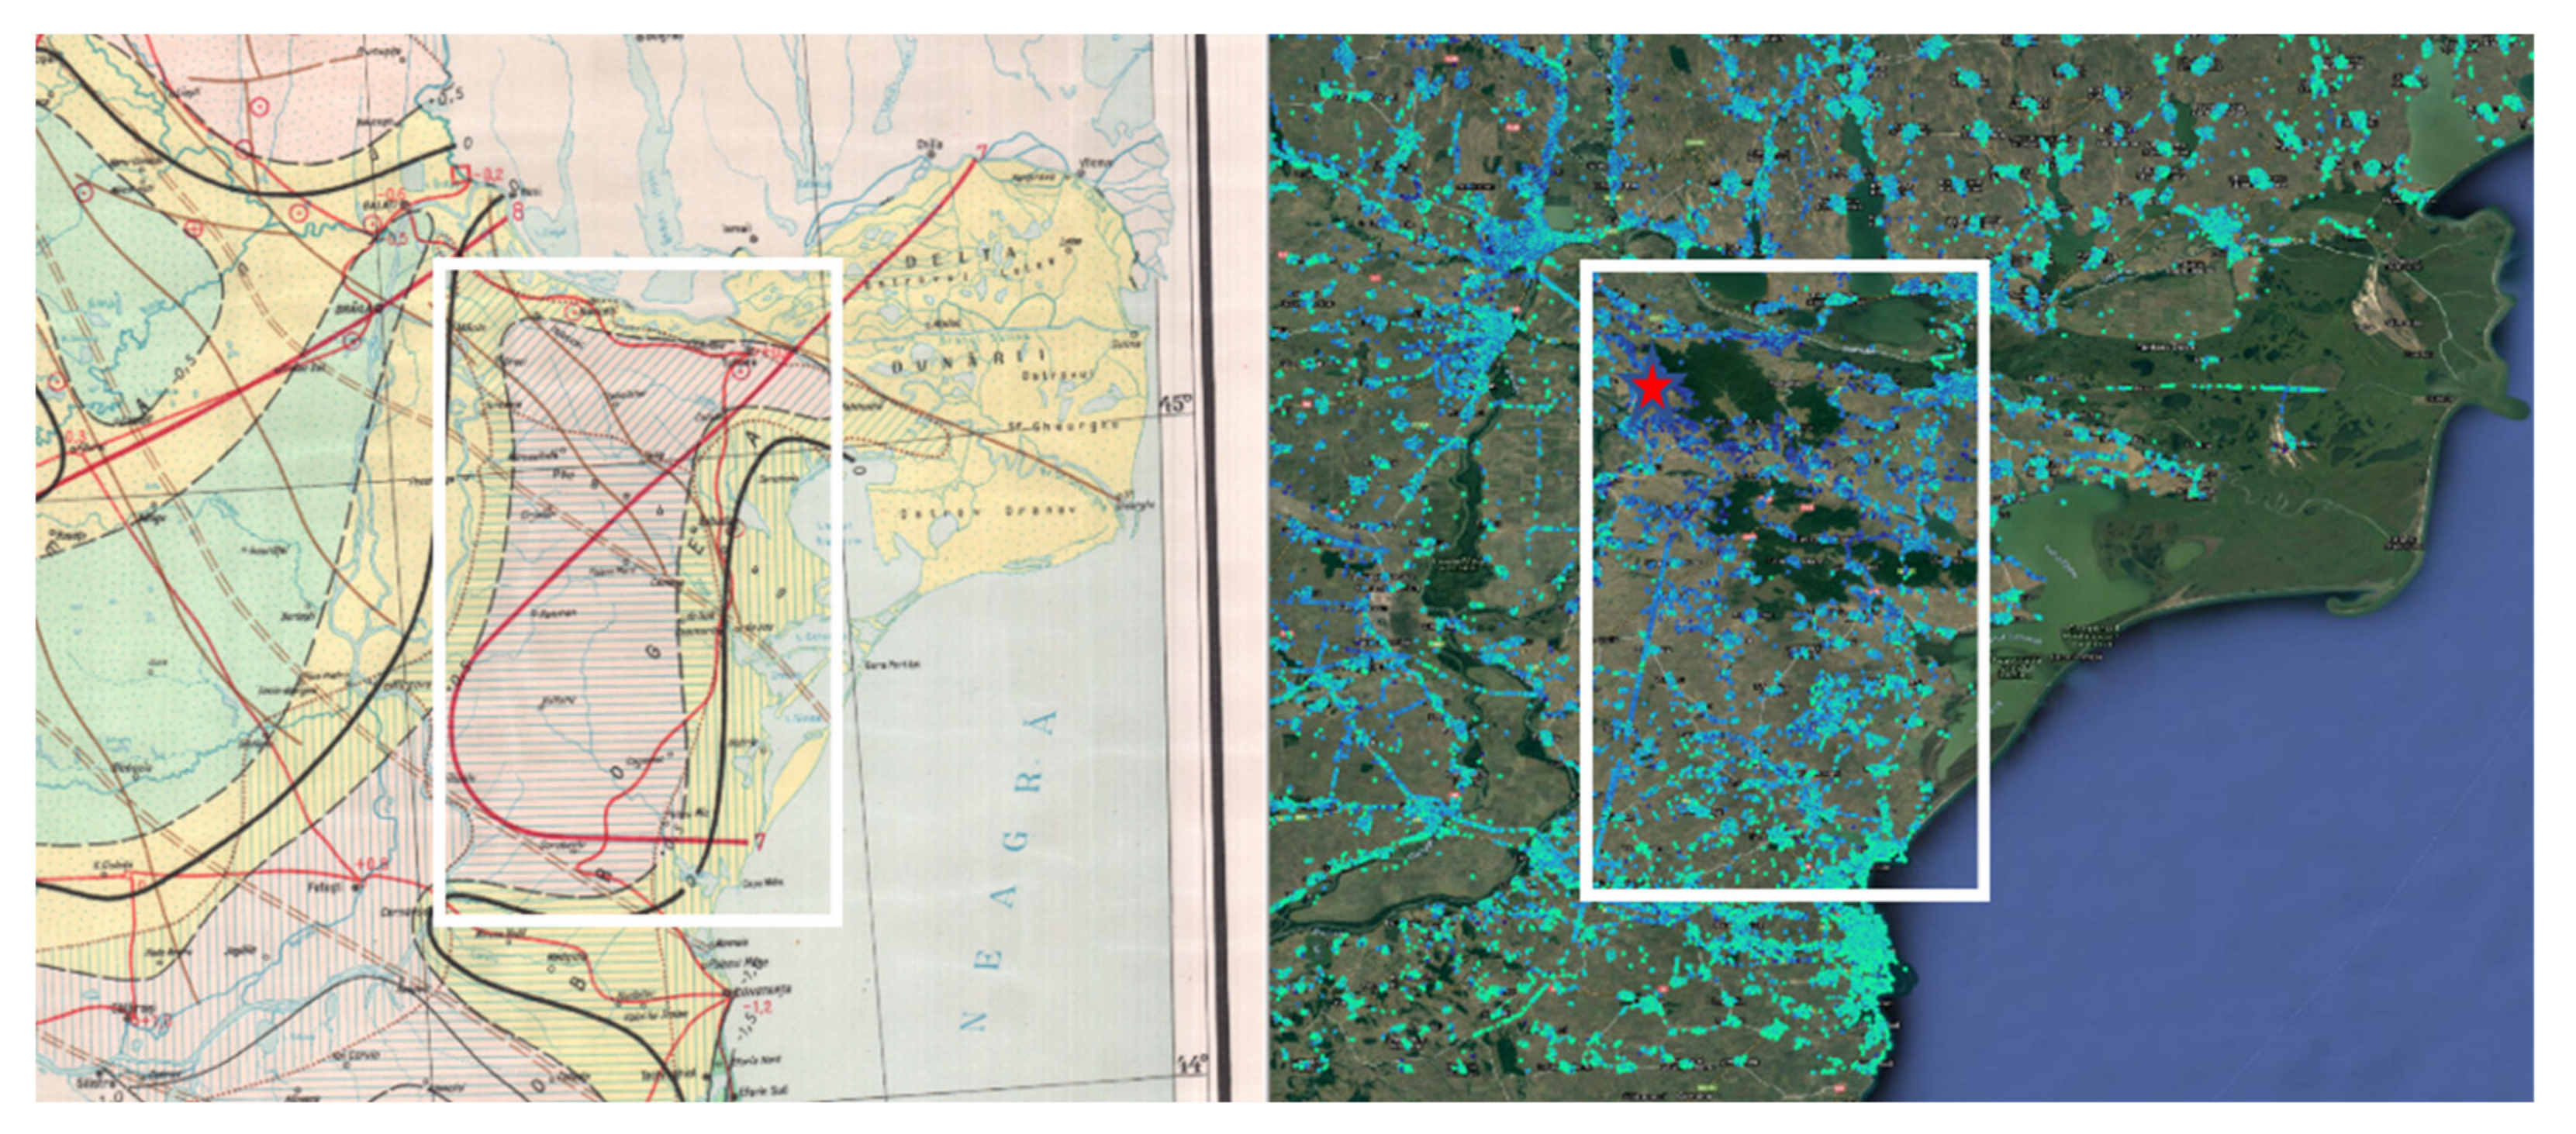
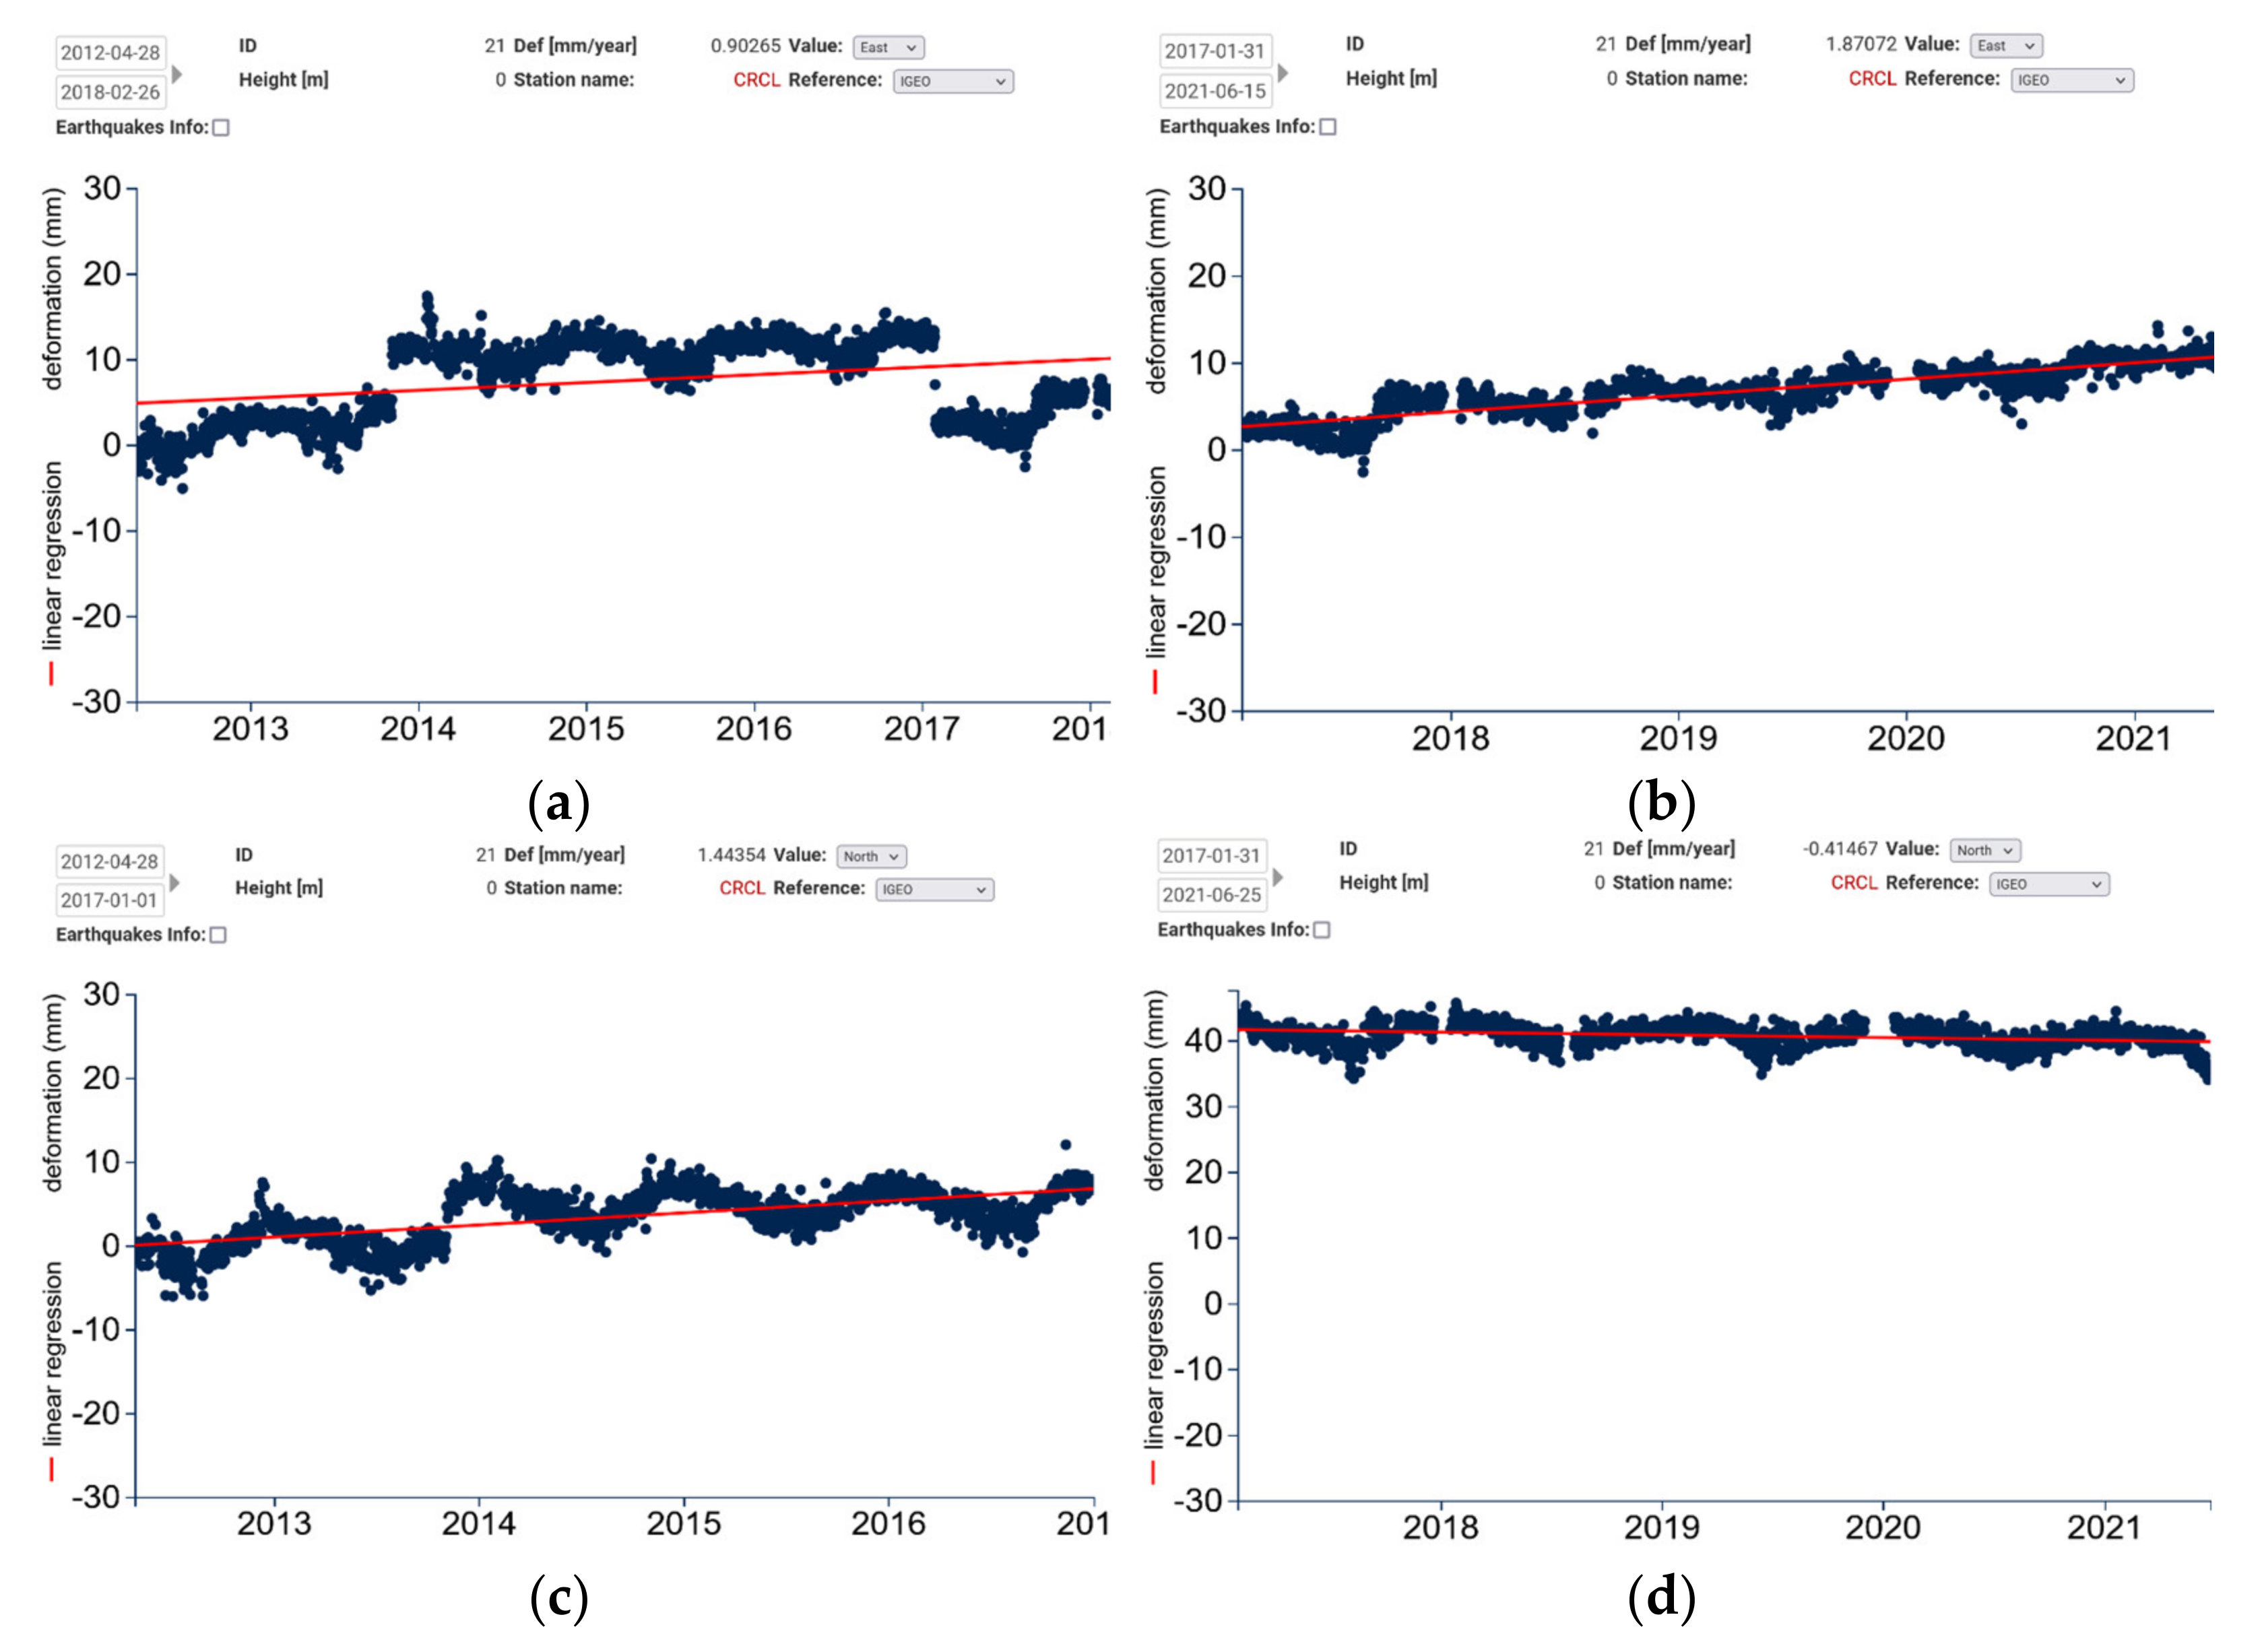
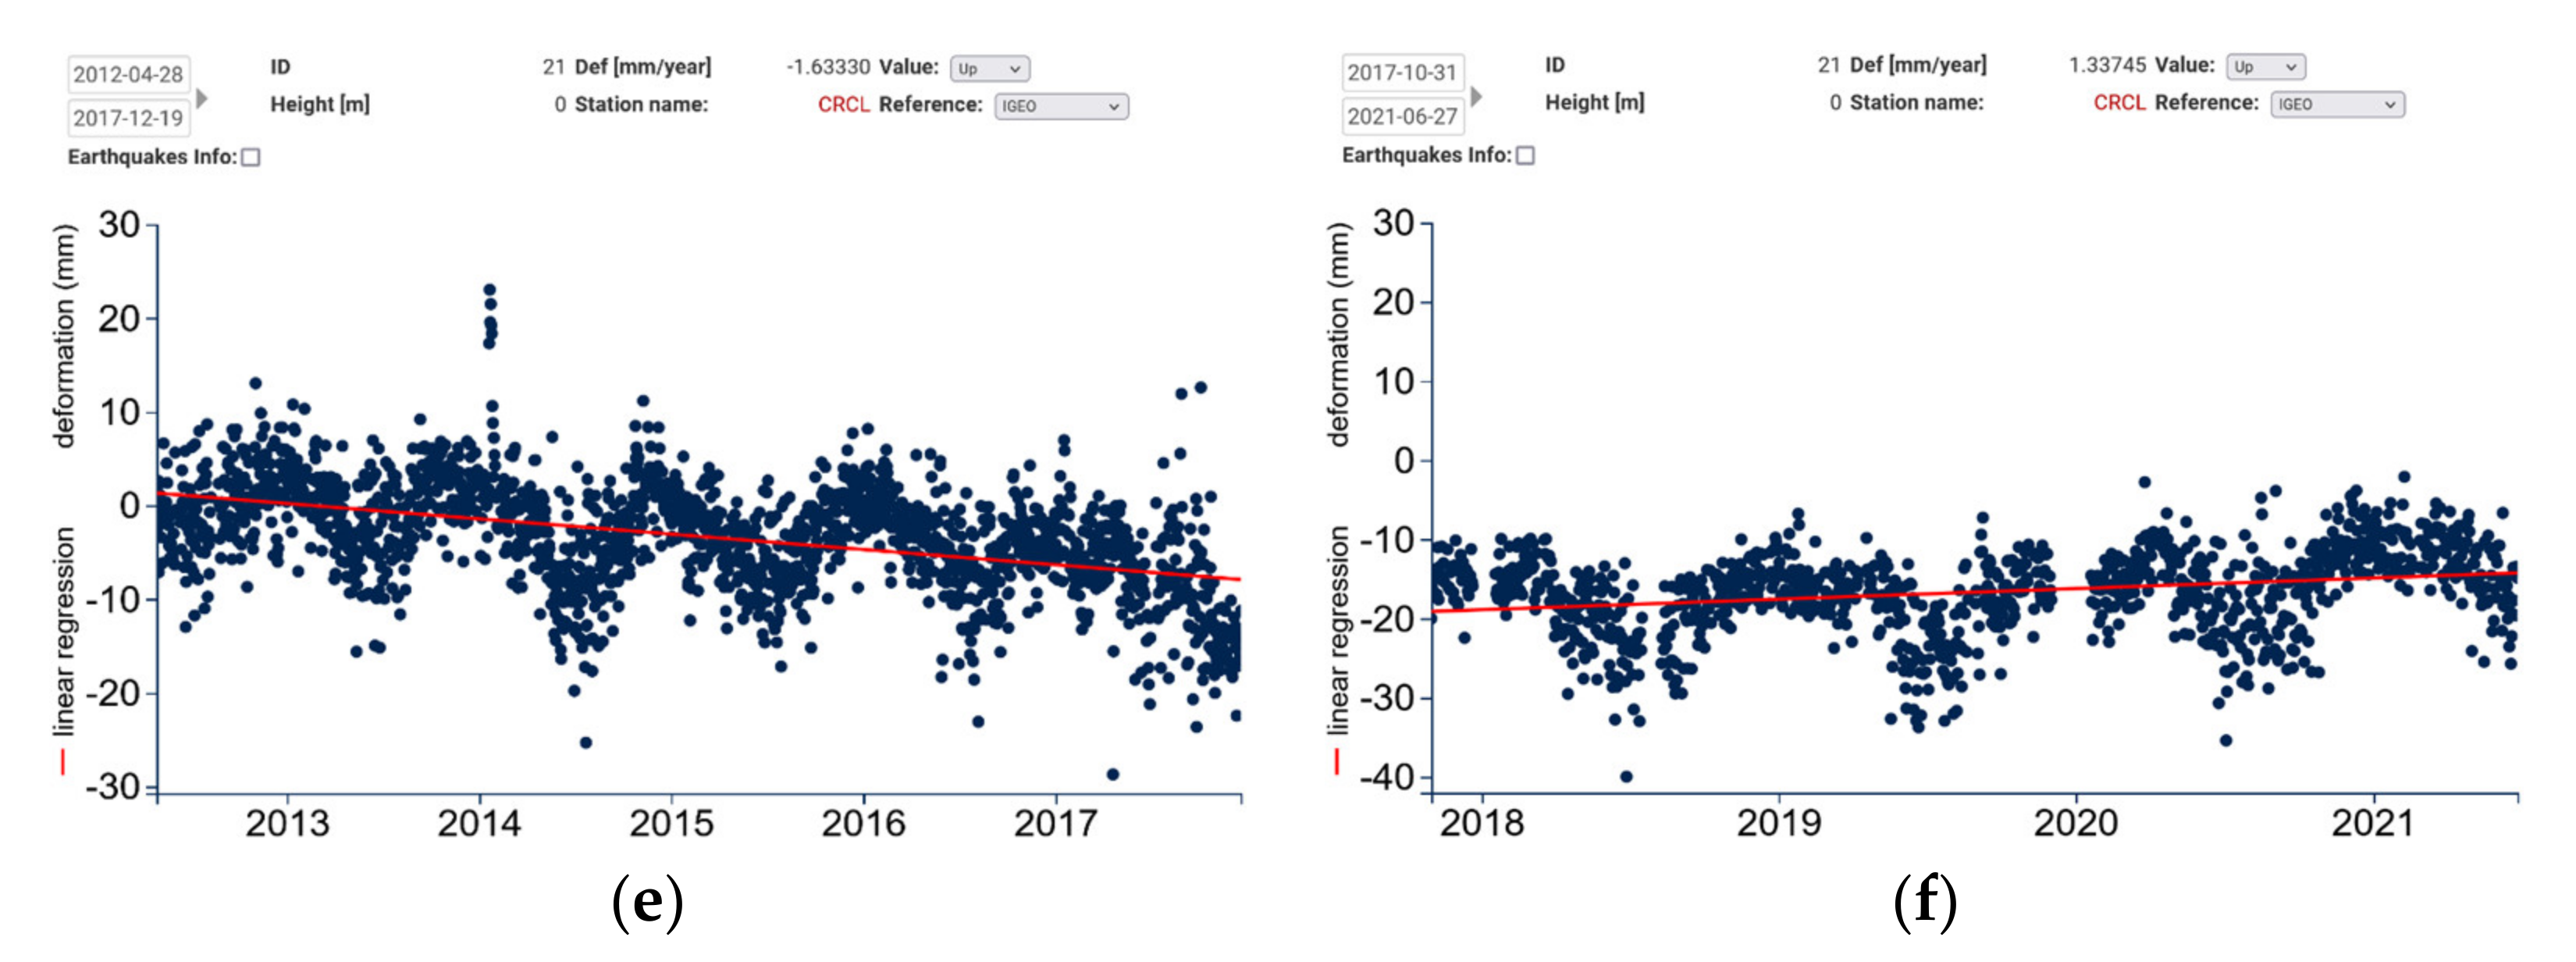
4.1.4. Land Stability within a River–Delta–Sea System (Danube Delta—Western Black Sea System, Sulina City, E Romania)

The Sulina (SULN) permanent GNSS station (GeoPontica network—EUXINUS RI) is positioned in the immediate vicinity of the “New Lighthouse”, built in 1983 and signaling the entrance to the Sulina Canal. For stability, the foundation of the lighthouse was built on top of 35 pillars made of concrete and steel and reaching the depth of 30 m, where they were anchored in a limestone layer that extends from under the Crimean Peninsula to under all of the Danube Delta.
Both GNSS and PSInSAR measurements show a subsidence process that affects this structure and the surrounding areas, though at different rates. Figure 14 and Figure 15 illustrate a cross-validation exercise between the SULN GNSS station and PSInSAR measurements. Figure 14a–c illustrates the ENU displacement of SULN relative to the AEGY GNSS reference. Figure 14d illustrates the vertical displacement (U direction) of the SULN GNSS station relative to the IGEO (Chisinau). It can be seen that the SULN GNSS station subsides with 9 mm/year relative to IGEO, but only 5.2 mm/year relative to AEGY; this means the AEGY station itself subsides with 3.8 mm/year relatively to IGEO and proves how important it is to find a common reference when working with wide-area, multiple PSInSAR datasets; with each one having different reference areas, a reference calibration is required before integrating measurements from different sources.
The PSInSAR measurements, with a reference set in Tulcea near the AEGY GNSS station, show a −3 mm/year subsidence of the topographic surface of the SULN GNSS station area in the LOS direction (Figure 15a), as well as a 9 mm subsidence in the immediate surrounding area (Figure 15b).
Projecting the 3D GNSS vector to the Sentinel-1 LOS direction results in a value of −3.91 mm/year subsidence, very close to the value of −3 mm/year measured with PSInSAR (Table 1).
Only 8 km away from the “New Lighthouse”, the same −3 mm/year subsidence rate is visible in SAR LOS (Figure 15c) south of Sulina city, whereas in agricultural land a larger subsidence of around 6 mm/year is measured (Figure 15d).
The higher dynamics observed in the area surrounding the lighthouse (but not the lighthouse itself) are related to the hydrotechnical infrastructure or jetty [19,51] (the jetty consists of large boulders grouped together that generate local eddy-like currents with a major role in very fast sediment accumulation). The jetty structure is thus still settling itself on the ground, contributing to the fast compacting of freshly accumulated sediment as a consequence of its weight.
The local compaction due to the northern and southern jetties is also visible from the PSInSAR measurements. The rhythmic variations could be due to the impact of storms and/or sea level variations (quite significant at the mouth of the Danube). The two isolated points that are visible in the central-right side (N of the jetties) of Figure 15a,b are related to the shipwreck that was stranded here in the beginning of 2010 slowly drifting SW due to the strong NE storm waves and winds.
In regards to the vicinity of Sulina town, significant subsidence was measured in an anthropogenic area where the city structures are relatively stable, while the agricultural land in the southern part is strongly subsident. The agricultural polder was protected by an embankment between 1970–1990 and is now affected by an accelerated compaction that followed the drying up of the former wetland after the land was reclaimed for agriculture. Such processes of widespread subsidence in drying peatlands have been quantified in deltaic areas by InSAR data worldwide [52,53].

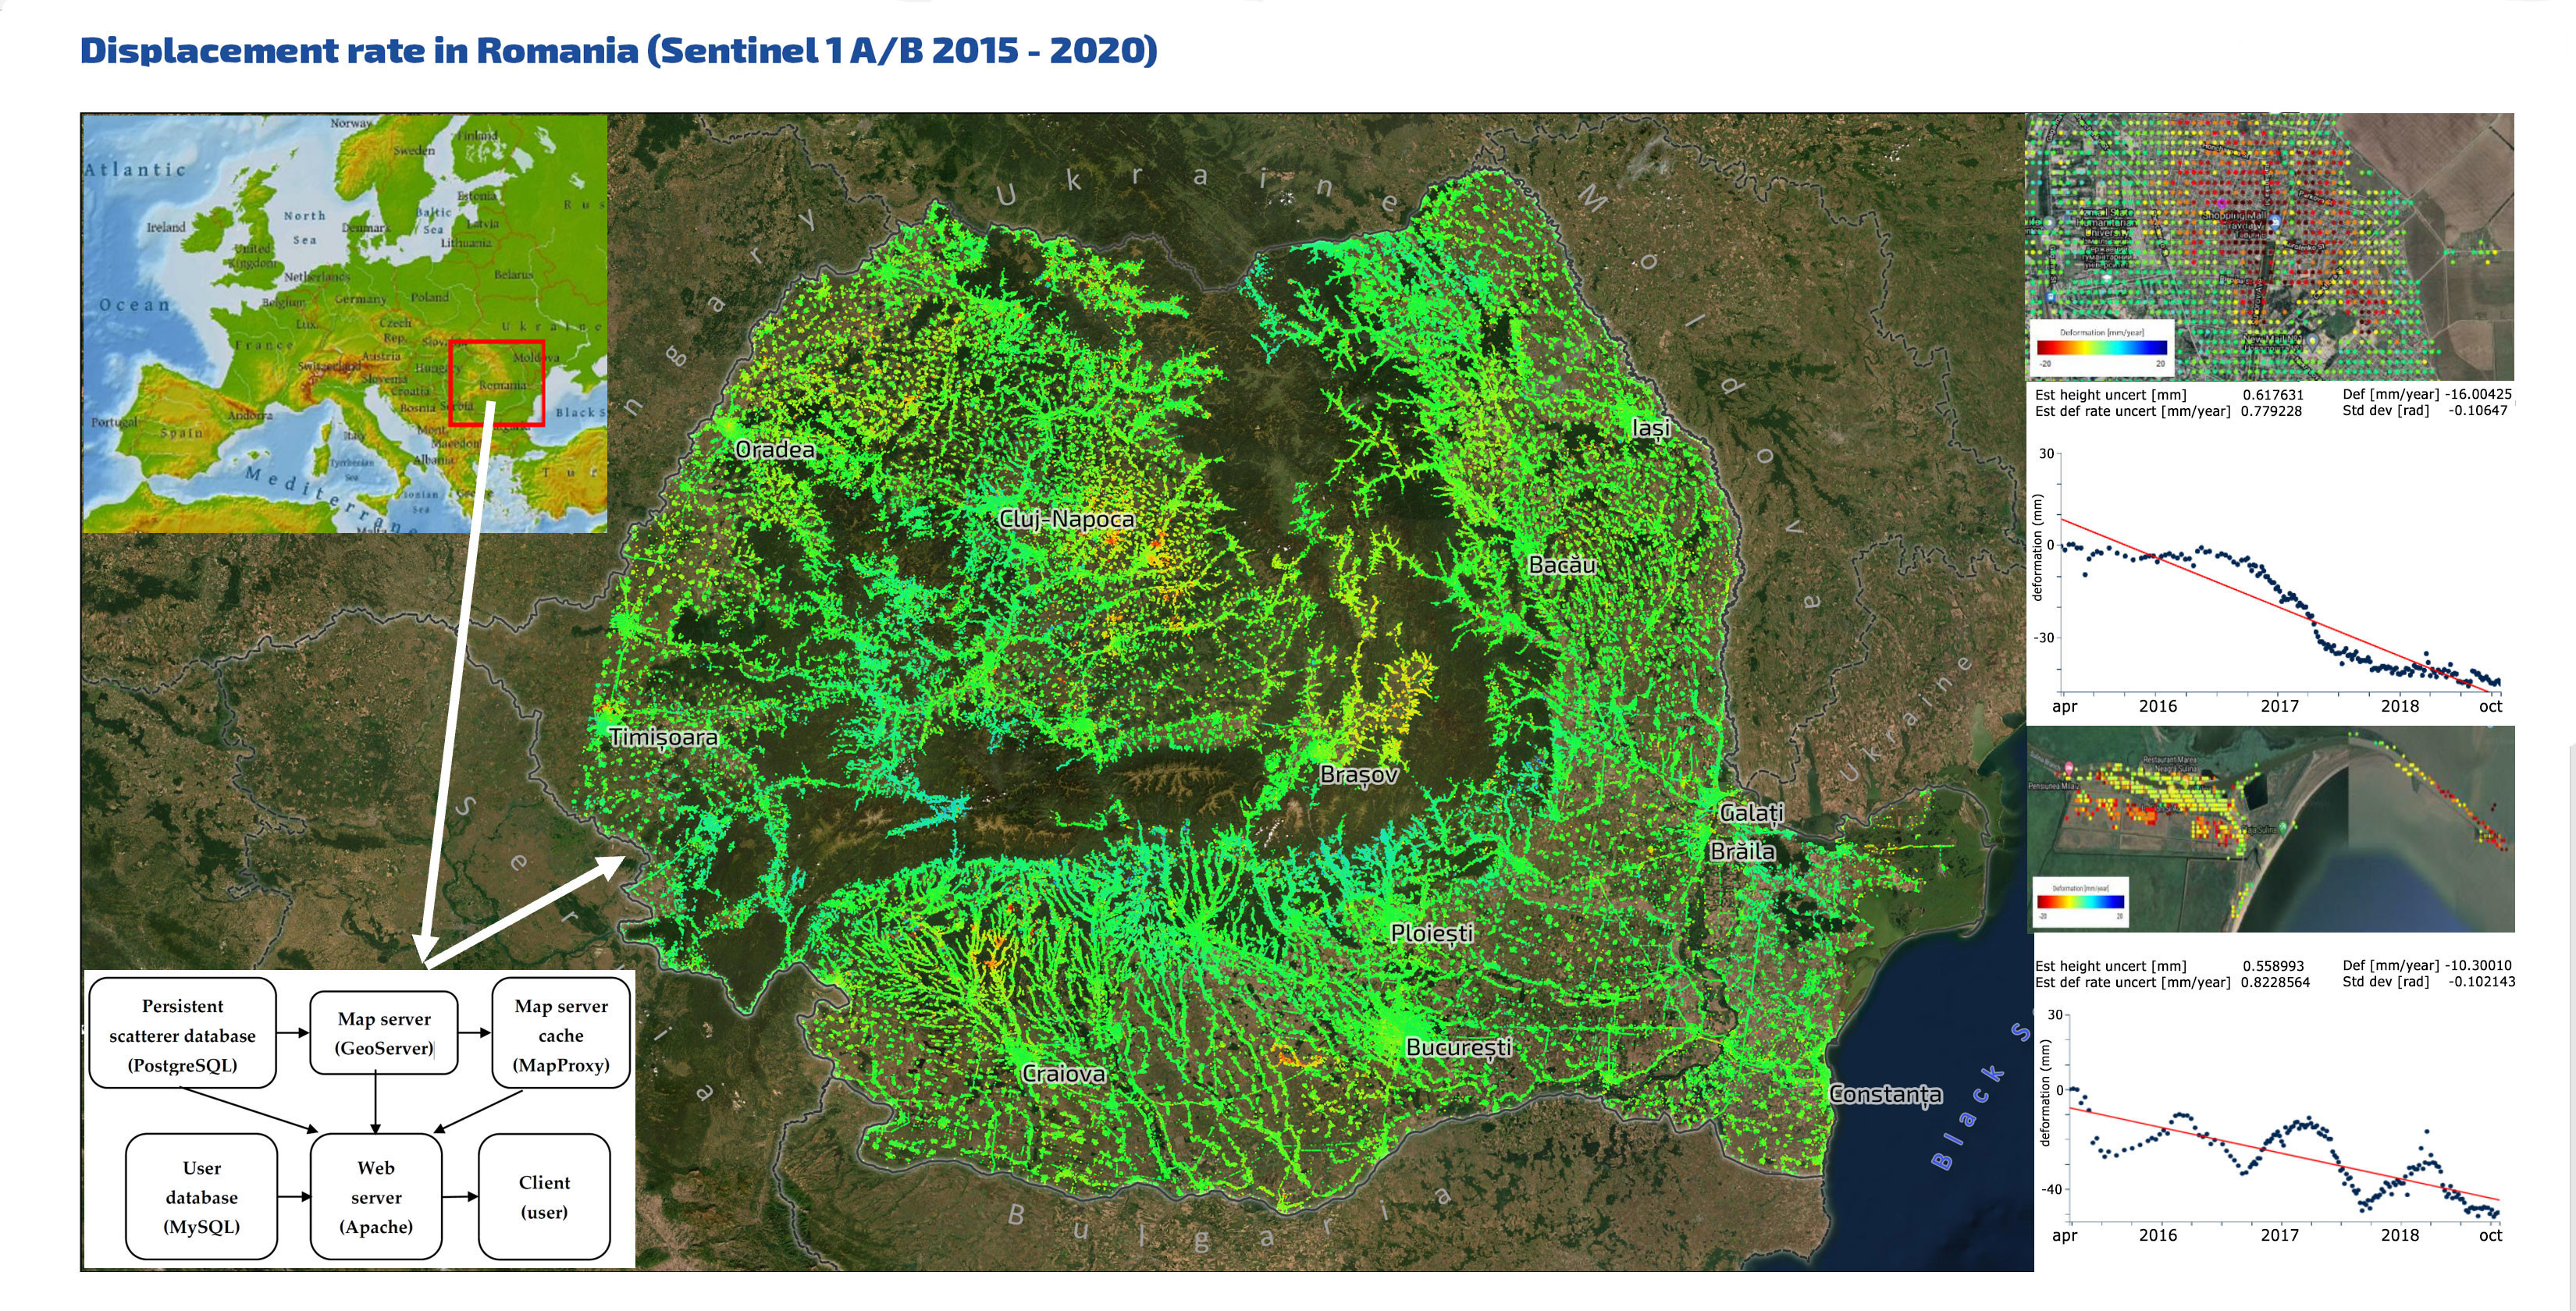
4.2. Wide-Area Displacement Maps

Wide-area displacement maps are usually dominated by a collection of clearly visible (high displacement rate) local motion areas originating at rather shallow depths and possibly masking deep (tectonic), low-amplitude motion.
The Transylvanian Basin is well known for its numerous salt diapirs, whose evolution has been described to be active during post-Miocene geological times, either as exaggerated domes in the north-eastern part of the basin, or fault-controlled salt decollement in its SW sector [20,21,54]. As an example, Figure 16a illustrates the central part of the Transylvanian Basin with numerous subsidence areas identified. Figure 16b illustrates the depths of the salt diapirs (from [21]) overlaid with PSInSAR data. The correlation between diapirs and the local zones of subsidence (Figure 16b) demonstrate that this subsidence takes place in areas where salt is located at 3–4 km depth, and diapirism is in incipient stages (pillows) along their flanks or in the immediate withdrawal synclines. The wavelength of these structures is one order of magnitude higher than that of the observed subsidence, which demonstrates that salt diapirism cannot drive the observed surface subsidence.
Another visual correlation, this time between the subsidence and gas extraction areas (dark green spots) is illustrated in Figure 16c. The correlation is quite evident within the areas outlined with black ellipses.
In Figure 16c, one strong subsidence in the SE part of the city of Targu Mures (blue circle) does not correlate with the local gas extraction sites, but with an underground gas storage facility. Figure 17a illustrates the location of the storage area and of the 18 wells used to inject/extract the gas from the natural storage [55]. Figure 17b illustrates the injection cycles [56] and Figure 17c the PSInSAR-measured temporal behavior of the ground above; a seasonal motion is visible, perhaps related to the injection cycle, although delayed with 2–3 months. This timing is likely driven by the nonlinearly elastic, viscoelastic or non-elastic response of the reservoir overburden, although such a response is highly variable based on the rock rheology and can take place from days to years [57].

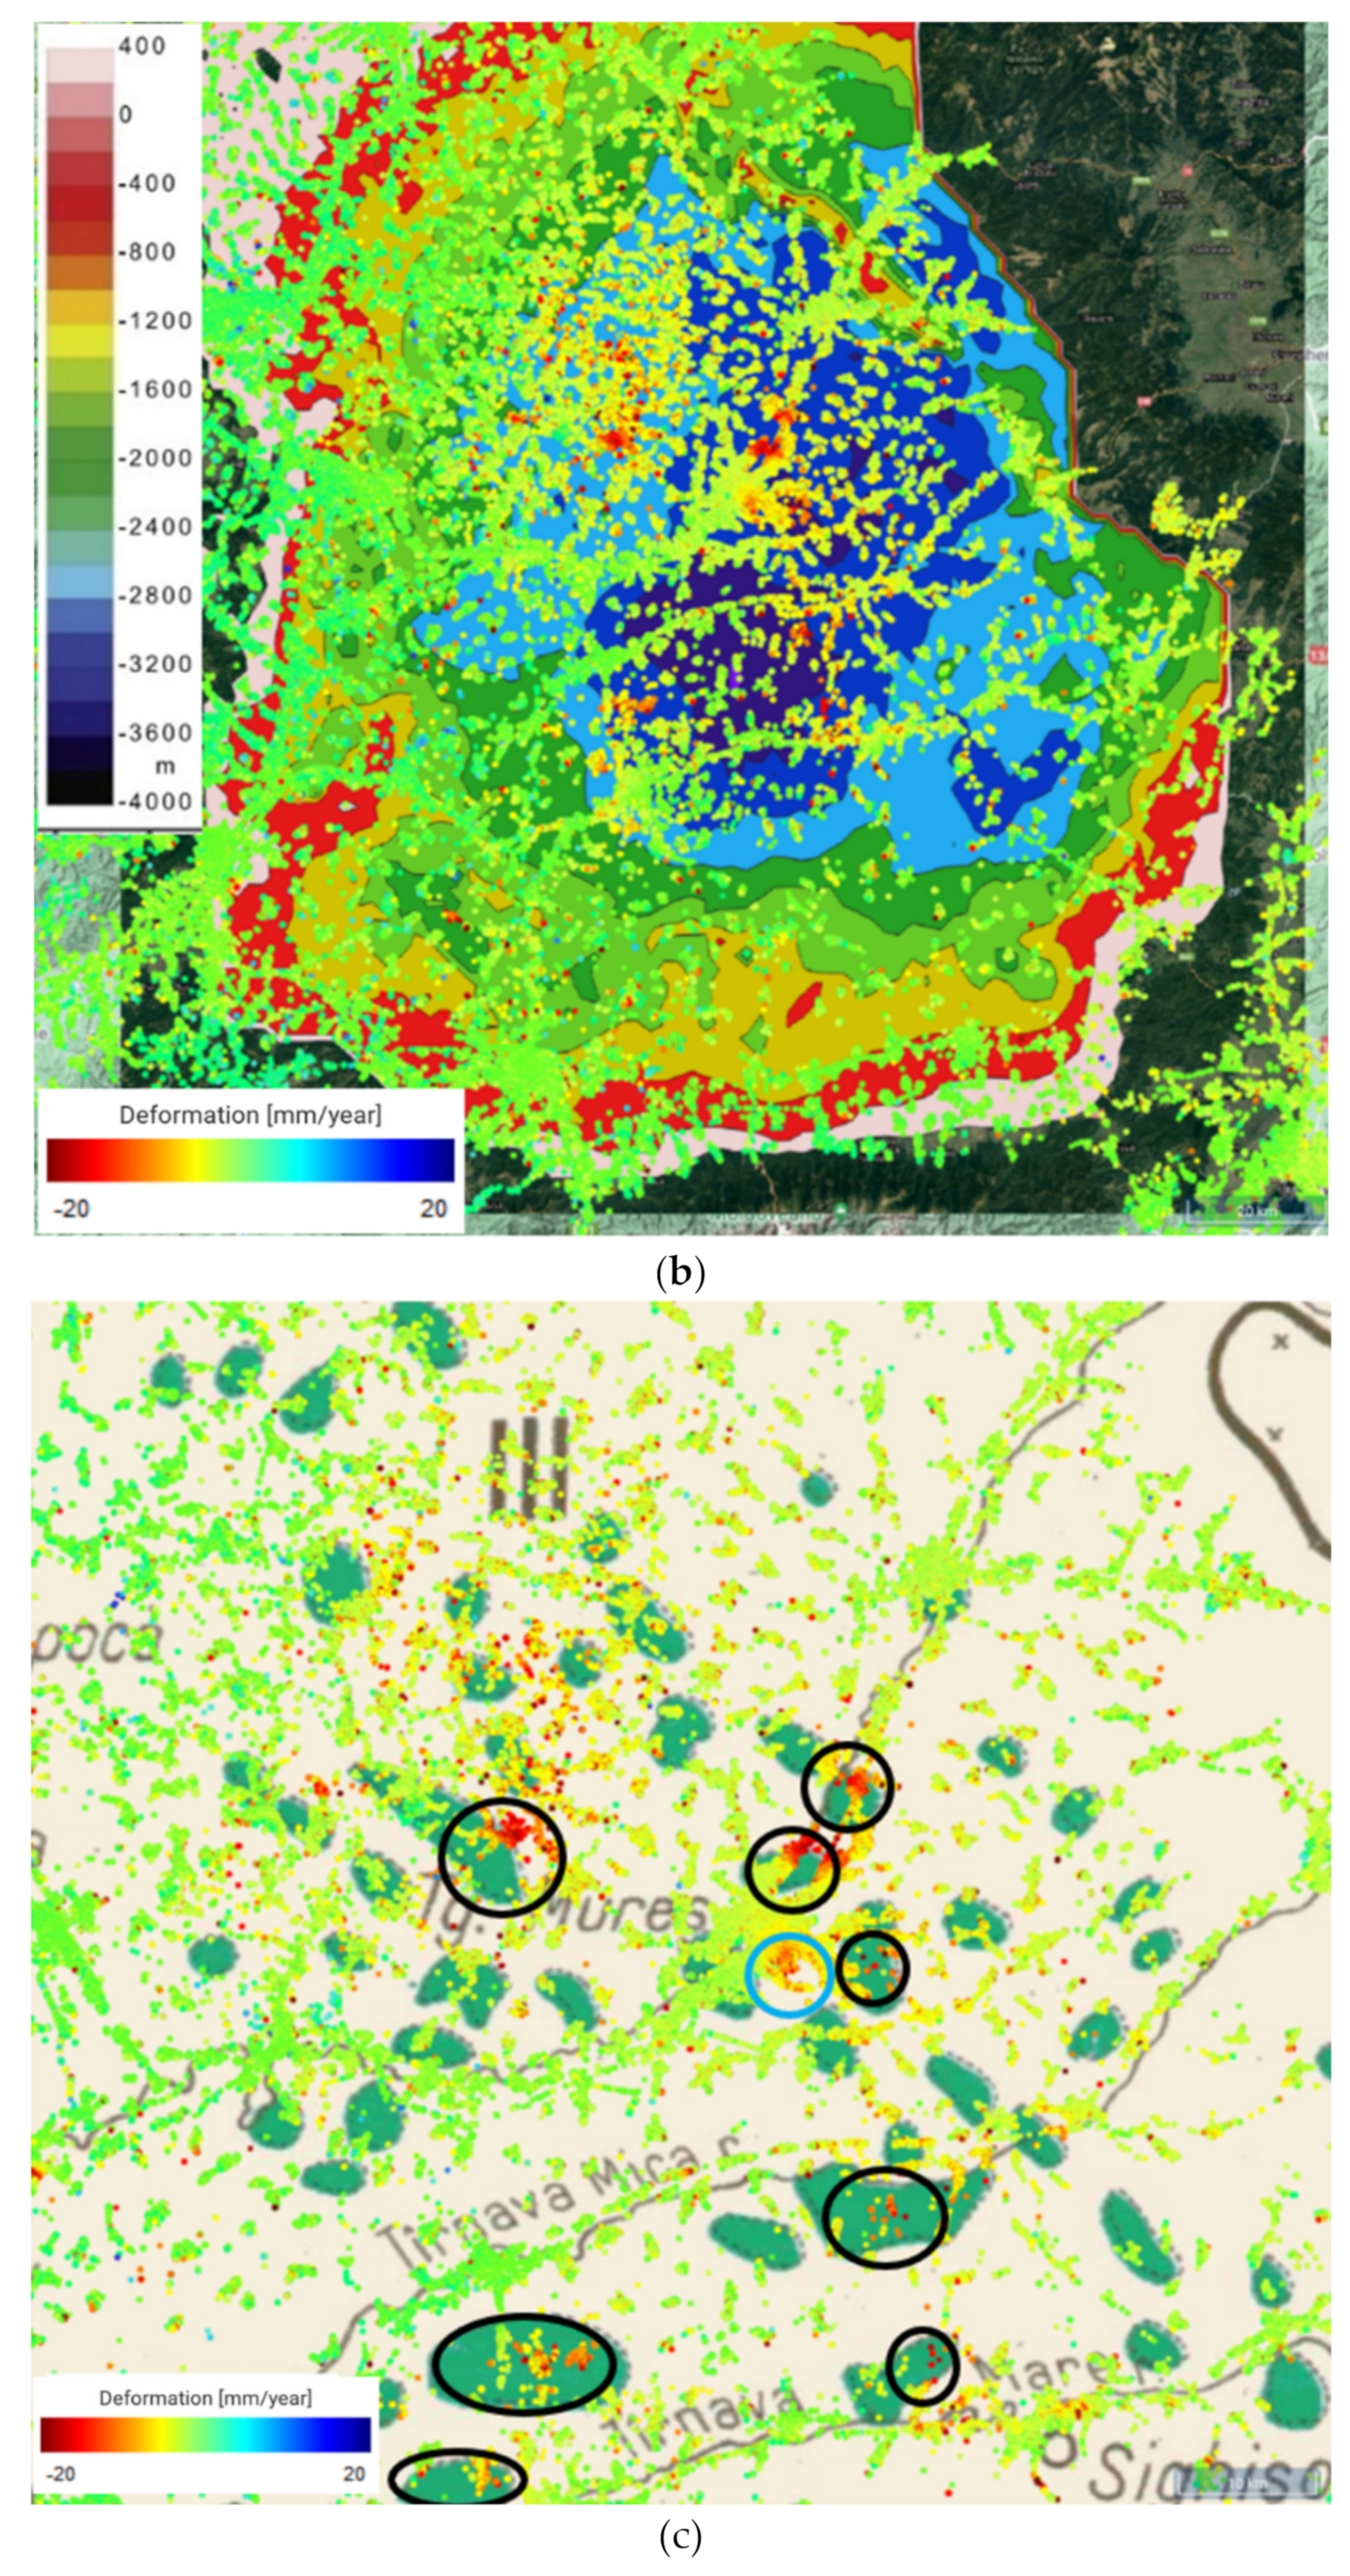
4.3. Wide-Area Deep Motion

When monitoring large areas, horizontal ground motion becomes important, since such areas could include multiple tectonic units moving in different directions. In [34], the geometry of the SAR measurements is explained; horizontal ground motion towards the nadir of the radar track could be confused with uplift, and motion in the opposite direction (away from the satellite) could be confused with subsidence. In the case of the descending Sentinel-1 track moving approximately NE to SW, subsidence and NW motion could be confused. For an ascending track, subsidence and SE motion could be confused. Thus, GNSS measurements are important to clarify the actual 3D movement vector.
The typical dynamics of tectonic units is within the range of mm/year, which is at both GNSS and PSInSAR error levels [1,2,3,4] (there are a few exceptions, such as in the Anatolia peninsula [13], where the tectonic dynamics are dominant over local dynamics and are clearly visible from direct measurements).

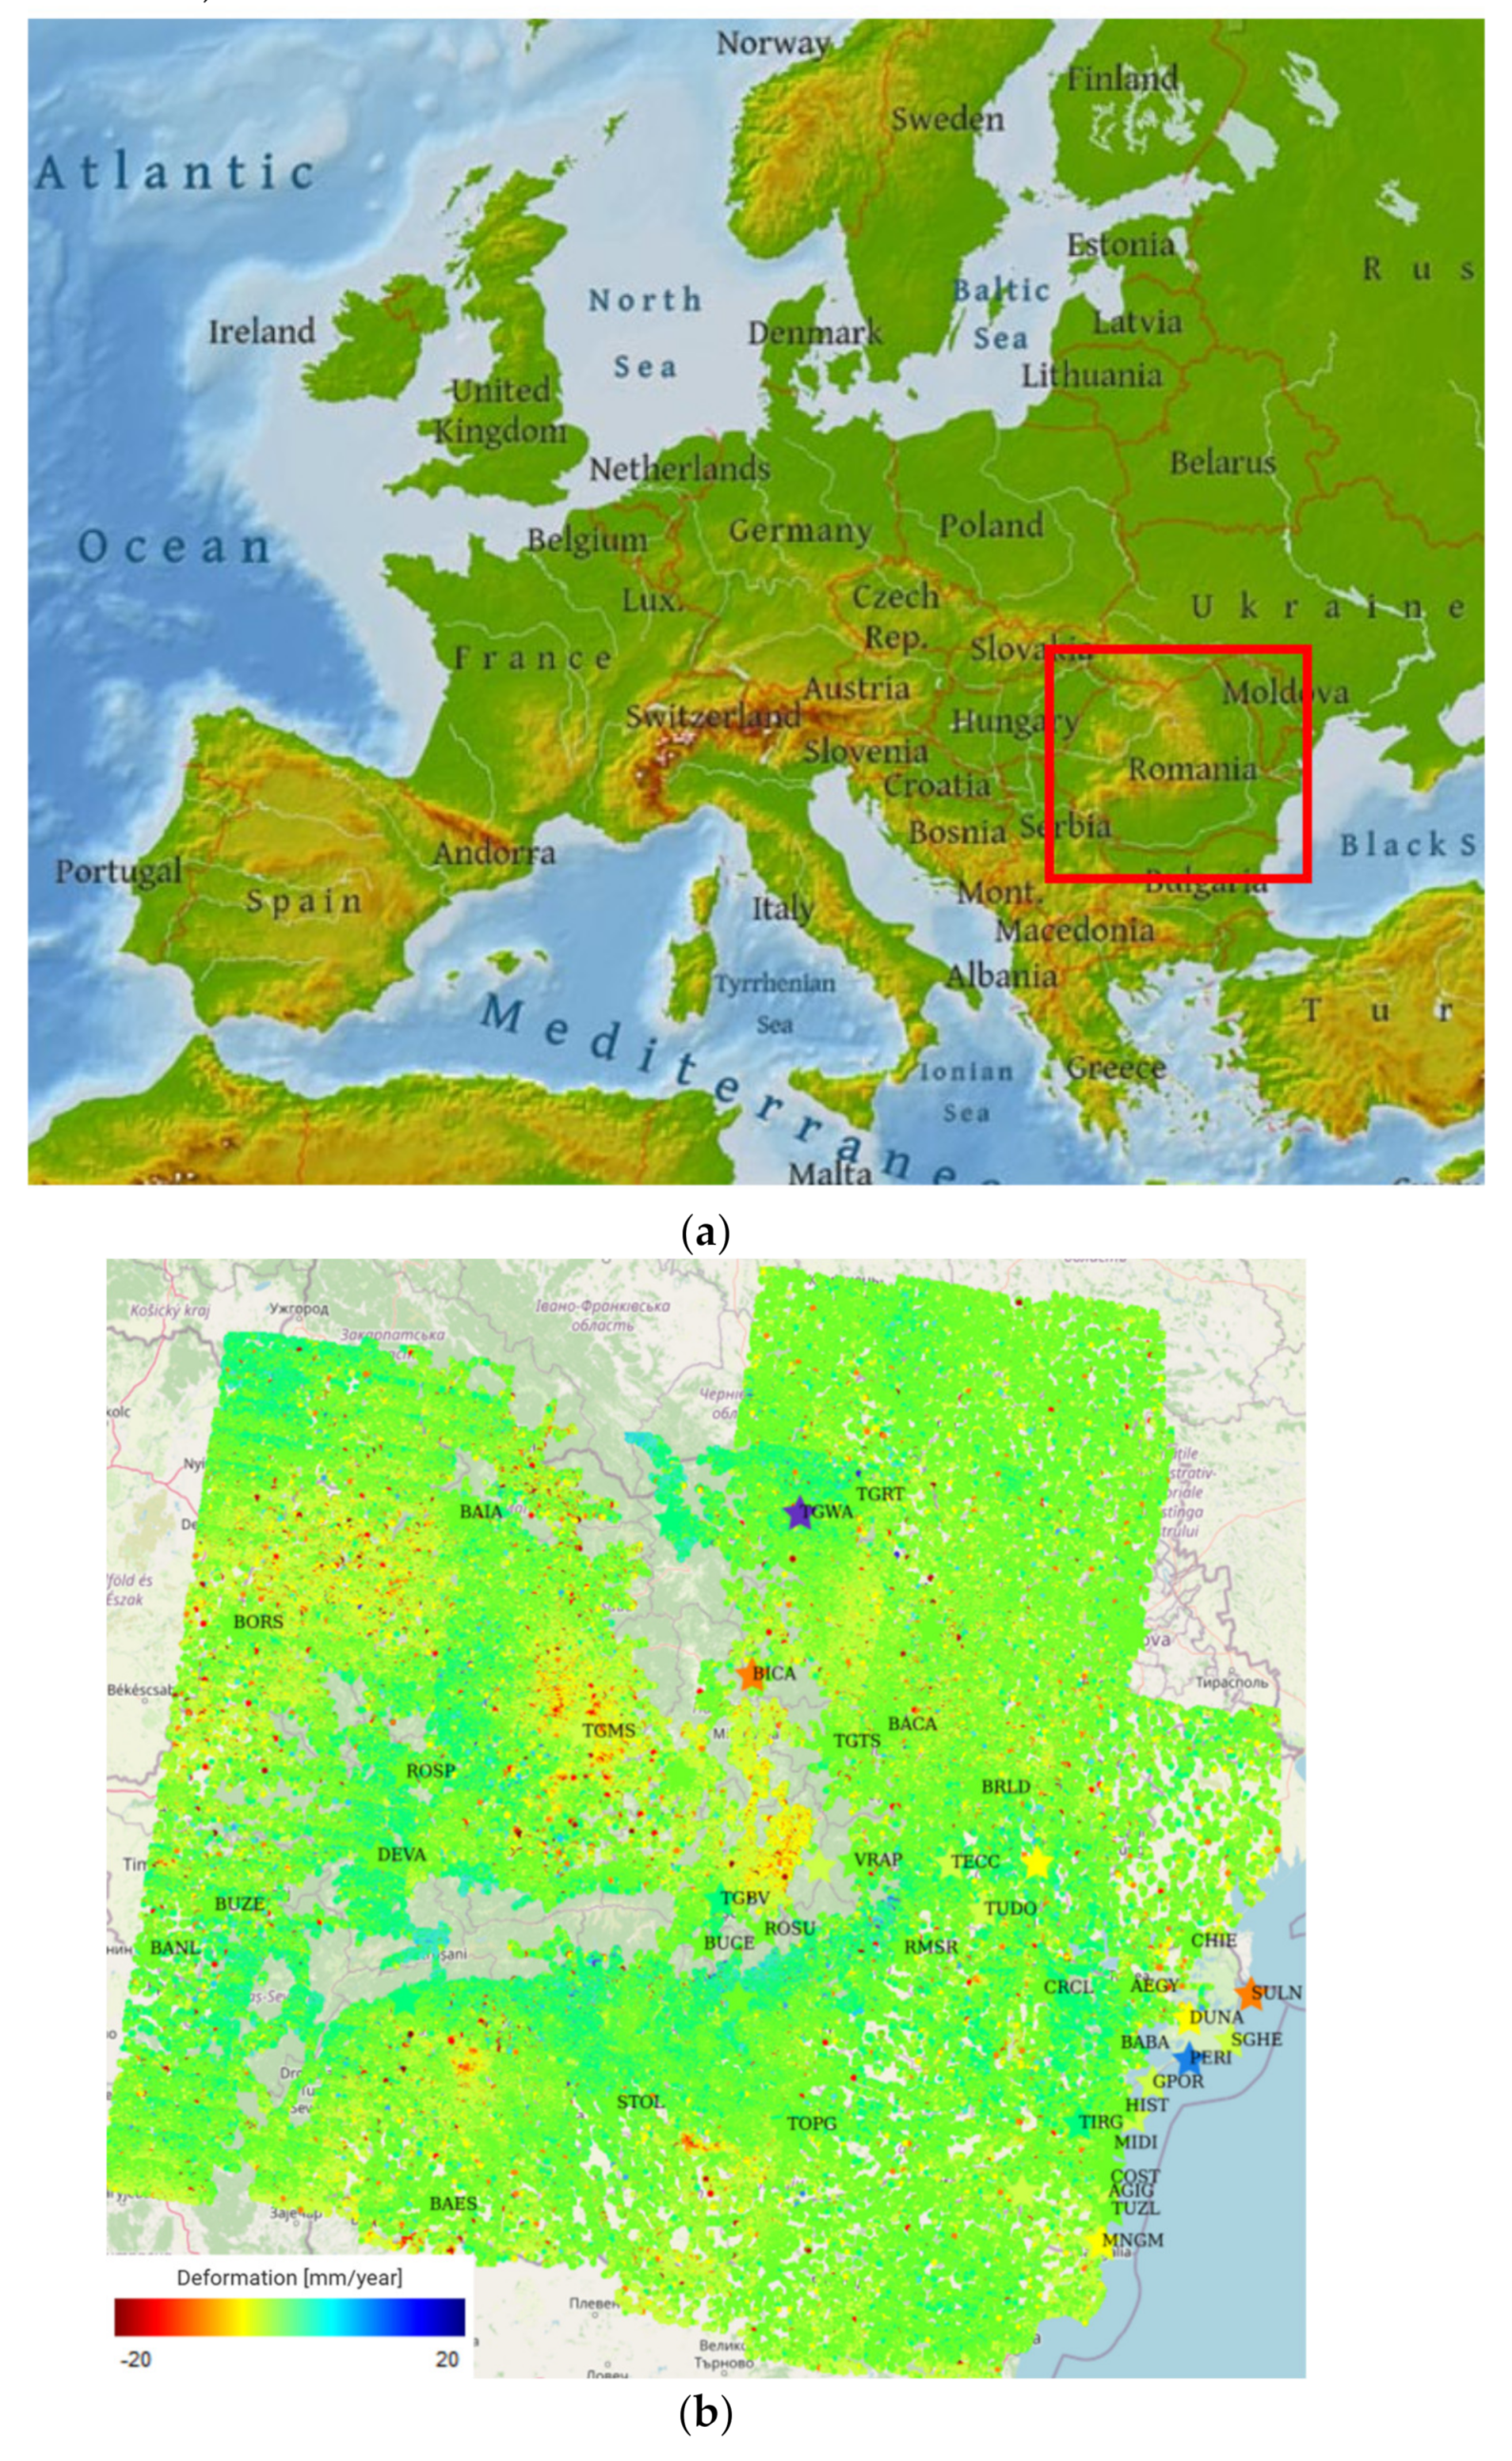
Dobrogea Region (SE Romania)

In Dobrogea and on the Black Sea coast (Romania and Bulgaria), GeoEcoMar and NIEP are operating networks of GNSS stations aiming to detect and monitor vertical and horizontal crustal movements. Data processing results are made available by NIEP [33] and NGL [2] and incorporated into the PSTool platform (Section 2.2) available online and used in this work. The GNSS data indicate very small amplitude horizontal displacements in Dobrogea with respect to the stable Eurasia domain. The resulting vertical movement vectors indicate crustal uplift in the North Dobrogean Orogen, in its prolongation along the North Dobrogean Promontory and in Central Dobrogea.
In order to detect such small-scale, slow motion, which is typically masked by a large number of local areas with higher dynamics and often moving in opposite directions, additional processing is required.
Step 1: determine the dominant motion. In order to determine the dominant ground motion, areas of “subsidence” (or rather, of motion away from the satellite), stability and “uplift” (or rather, of motion towards the satellite) are separated by their motion direction, and their relative dominance is analyzed.
Figure 18 (a, total ground motion; b, stable targets; c, subsidence; d, uplift) illustrates an example of how different dynamics are mixing within the same area, making it impossible to extract any smaller-scale motion.
Figure 18a illustrates the total motion (subsidence and uplift) in an area; with this representation it is difficult to separate slow motion at a small scale since multiple pixels with different dynamics are overlapping each other in the figure, with higher amplitude local dynamics dominating the rest. From Figure 18c it can be seen that the spatial density of the subsiding targets is much lower than the spatial density of the ‘uplifting’ targets (Figure 18d). Moreover, subsiding targets seem to be grouped in local areas, some of them natural (where it is not clear if ground motion or rather ground moisture variation are measured). From the map in Figure 18d it can be seen that the ‘uplift’ motion is much more spatially dominant (albeit at lower magnitudes than the spotty subsidence areas) and uniformly distributed, thus it seems to have a more regional characteristic, rather than local. Small-scale motion (regional, tectonic units) is expected to be spatially uniform, with either constant or slow-changing spatial gradients, in agreement with the observed ‘uplifting’ areas.
As a conclusion, local motion and wide-area motion were separated based on the direction and spatial extent of the motion.
Step two: detect structured dynamics of the ground.
By extending this representation to wider areas, certain structured motion becomes apparent.
Figure 19a illustrates the subsidence/NW component (negative displacement in radar line-of-sight (LOS) direction) of the measured motion. The spatial distribution pattern of the magnitude of the motion is relatively uniform across the whole region, spanning multiple tectonic units, such as the East European Platform, Dobrogea and the Moesian Platform [37]. No specific structure at tectonic scale can be detected based on its individual motion along this direction.
Figure 19b illustrates the uplift/SE component (positive displacement in LOS direction) of the motion; the spatial distribution pattern of this motion is nonhomogeneous. A structured motion is visible in multiple areas delimited by rectangles, which may be interpreted as being related to the south-eastward crustal displacement of the South-East Carpathians Bend Zone and its foreland as emphasized by results of repeated GNSS measurement campaigns, structural, tectonic and exhumation studies [12,17,58,59,60,61,62]. Therefore, the uplift/SE motion of the SE Carpathians and their foreland, including Dobrogea, is the likely solution.
In Figure 20, the uplifting area delimited by the white rectangle in Figure 19b was visually correlated with the crustal motion map [63]. Figure 20 (left) illustrates an area affected by uplift, determined using repeated levelling between 1960–1970; that area includes the N. Dobrogea Orogen and Central Dobrogea.
A quantitative correlation was also carried out using the existing permanent GNSS CRCL station (Figure 20 (right), red star). The GNSS measurements (Figure 21) span the 2012–2021 time interval, whereas the PSInSAR measurements span the 2016–2020 interval. The GNSS data were split into 2012–2017 and 2017–2021 time intervals; the reason for the split is twofold: (a) it was observed that around 2017 the trend in the vertical (Up) direction reversed; (b) to compare GNSS with PSInSAR in the same time interval.
Using equation (5) in [34] and the input data shown in Table 2 for the time interval 2017–2021, the 3D GNSS trend projected on Sentinel-1 SAR LOS results in a 1.07 mm/year uplift.
Figure 22 illustrates PSInSAR-derived displacement rates around the CRCL GNSS location. Both trends are upward (1.28 mm/year and 1.12 mm/year, respectively), consistent with the GNSS results projected in the PSInSAR LOS direction. Differences between the displacement rates could be related to the measurements having different reference stations (Chisinau Moldova for GNSS, Zoria Ucraine for TRACK_36c PSInSAR and Tulcea Romania for EPOS_36_5 SBAS datasets).

5. Discussion

The availability of SAR data covering the entire Earth surface and the Sentinel-1 minimum data units covering an area of 250 × 200 square km are leading to a change in the ground-motion measurement paradigm. It is more manageable to start from processing wide areas (Section 2.3) containing a large number of critical spots (known and unknown) rather than starting with local processing for a single critical area. The advantage of the new approach consists in providing a wider image of the dynamics and eventual connections between multiple local critical areas. Moreover, with this approach a number of critical sites that have been previously studied are serving as validation of the measurements (Section 4.1.1).
SAR daa is acquired at different operating frequencies. The penetration depth of the microwaves is a function of the microwave’s frequency (Section 3.2). C-band microwaves (such as those transmitted by Sentinel-1) tend to be scattered mostly at the surface, whereas L-band microwaves (ALOS PalSAR, the future NASA NISAR and the future ESA ROSE-L) tend to penetrate deeper and scatter at the interaction with the layer underneath or at the interface with high-moisture soil. Therefore, it is very important to know the source of the SAR data and the properties of the ground (infrastructure, bare ground or agricultural) in order to interpret the measurements (e.g., to differentiate between ground motion and variations in soil moisture).
Multiple PSInSAR processing algorithms are currently in use (Section 2.3). Each of them serves a specific purpose. Some algorithms are optimized to extract the exact (non-linear) motion pattern of local areas; these algorithms make assumptions about the spatial and temporal scale of the motion and filter the data accordingly in order to lower the measurement noise and improve the solution. With these algorithms, small-scale motion (such as tectonics) could be filtered out as atmospheric disturbance.
Other algorithms are optimized to extract the linear component of the displacement rate, which is a parameter of interest for long-term monitoring (such as for the dynamics of the tectonic plates). These algorithms do not produce the exact temporal local motion pattern, but they also do not filter the data before extracting the displacement rate; in this way, all the linear displacement information at any scale will be preserved. When using these algorithms, the unfiltered atmospheric disturbances could influence the linear displacement estimates; to avoid this, processing is performed in small patches for which the atmospheric effects are constant and thus do not influence the displacement information.
It is therefore important to be aware of the type of PSInSAR processing applied to the SAR data before looking at the displacement information.
Ground stability is affected by multiple factors that lead to ground displacement; separation and classification of different motion types (e.g., settlement/accelerated motion, fracture or seasonal variation) helps with identifying the underlying factors contributing to the ground displacement (Section 3.1). Based on temporal characteristics, new layers of data representing classes of motion types can be produced and used to spatially identify areas on the ground affected by specific motion.
At regional scale, multiple sources of motion interfere with each other, making it impossible to separate small-scale from local motion in one map (Section 4.3). Post-processing is required in order to detect wide-area structured motion.
Finally, wide-area maps provide valuable information by detecting critical areas (some of them previously unknown) that require further attention. For those areas, additional processing may be required; this includes local reprocessing of the Sentinel-1 data to densify the monitored network or the use of high-resolution data (TerraSAR-X, CosmoSkyMed, Radarsat-2) to obtain a more detailed map of the motion.
Future developments:
Future missions: Sentinel 1 A/B represents only the start of a new era [64], with open access C-band SAR data that will be acquired systematically until at least 2037 [64]; this long-term vision justifies sustained investment in developing the monitoring technology even further. Additionally, complementary L- and S-band missions from ESA and NASA will provide similar data coverage and volume. NISAR [6], to be launched in 2023 and with a minimum lifespan of 3 years, together with ROSE-L [24], to be launched in 2028 and with a lifespan of at least 7.5 years, will provide complete coverage of Earth at L-band for at least the period 2023–2036.
The L-band data will contribute motion information of infrastructure, leading to a densified PSInSAR network. Additionally, L-band monitoring will extend to natural areas [65], providing motion measurements on bare rocks together with ground moisture variation measurements in soil (for agriculture, wetlands, etc.)
Future data:
A number of programs will provide free ground-motion measurements using PSInSAR and variant techniques. The European Copernicus Ground Motion Service (EGMS) will provide open-access, Europe-wide, ground-motion maps for 2014–2021 produced from Sentinel-1 data [66], possibly with future updates.
The EPOS program [7] also started to make available large area PSInSAR measurements for plate-tectonic motion monitoring under a free and open license [41].
All the current and future open-access data are envisioned to be accessible from the open-access PSTool platform [23] and to use redundancy for quick cross-validation and for extraction of the maximum information in critical areas. Access to platforms hosting national or even continental data (such as EGMS [65] or NASA ASF [66]) will be realized through application programming interface (API) libraries provided by the host platforms developers. Additionally, in-house processed data will fill in missing pieces and will fulfil the requirements specified by end-users.
Future research:
Integration with the GNSS network and the expansion of the scale of the monitored areas will continue. PSInSAR is capable of detecting wide-area motion that could pinpoint interesting locations for new permanent GNSS stations, together with information about locally stable areas suitable for GNSS station foundations. In turn, GNSS can provide the 3D motion vector for the wide-area structures detected with PSInSAR. In gap areas (no infrastructure), radar corner reflectors could be installed in tandem with permanent GNSS stations. The future L-band motion maps are expected to close some of these gaps, thus emphasizing the importance of integrating all sources of information available.
The next step in research leading to an advance in the monitoring technology will be to include Artificial Intelligence (AI) in the monitoring process [67]. Correlating previous critical/disaster events measured with PSInSAR with information about external causes (e.g., extreme climate, earthquakes or anthropogenic activities) should lead to a risk analysis and/or the prediction of future disaster events when the conditions are met.

6. Conclusions

In the last 20 years, the PSInSAR techniques for ground displacement measurements evolved from scientific research to the operational stage. The Sentinel-1 mission filled in the last piece towards the operational service status by providing open access to data fully covering the Earth every 6 and 12 days.
The challenge shifted from local area PSInSAR processing algorithms to wide-area processing and information extraction from the resulting big data.
Increasing the extent of the monitoring areas also introduced challenges related to the dynamics at the scale of tectonic units, as multiple tectonic units can be contained in a single monitored area.
In the current work, a methodology was designed to address these challenges. First of all, a data integration platform (PSTool) was developed (Section 2.1). The purpose of this platform is to bring together ground motion measurements from different sources obtained with various technologies, integrate them in a practical way and make them available to potential end-users to increase their productivity and consequently increase the acceptance of PSInSAR as a ground and infrastructure stability monitoring technique.
GNSS data is harmonized with PSInSAR (Section 2.2) by producing approximate differential GNSS measurements with references located closer to the PSInSAR references. PSInSAR references can also be moved to more convenient areas (more stable or closer to available GNSS stations). Finally, 3D GNSS measurements can be back-projected to the SAR LOS direction to be cross-validated with PSInSAR measurements.

Author Contributions

Conceptualization, V.P. and I.S.; methodology, V.P., D.T. and I.S.; software, D.B., Ş.-A.T. and I.B.; validation, D.T., I.S., L.M., A.S. (Alexandru Szakács) and A.S. (Adrian Stănică); investigation, V.P. and I.B.; resources, L.M., A.S. (Adrian Stănică) and V.R.; data curation, V.R. and V.P.; original draft preparation, V.P.; writing—review and editing, all; visualization, V.P., I.S., D.T. and L.M.; supervision, V.P.; project administration, V.P., I.S. and A.S. (Adrian Stănică). All authors have read and agreed to the published version of the manuscript.

Funding

This research was funded by the Romanian Ministry of Research, Innovation and Digitalization, CCCDI–UEFISCDI, through PN-III-P3-3.6-H2020-2020-0027 project (grant number 8/2021), PN-III-P2-2.1-PTE-2019-0865 project (grant number 64PTE/2020) and PN 19 20 02 01 project of the Core Programme of the National Institute of Marine Geology and Geo-ecology - GeoEcoMar.

Institutional Review Board Statement

Not applicable.

Informed Consent Statement

Not applicable.

Data Availability Statement

Links were provided in the References section.

Acknowledgments

GeoEcoMar and NIEP GNSS data was made available to the authors through the SETTING National Project (Integrated thematic services in the field of Earth observation - a national platform for innovation), cofinanced from the Regional Development European Fund (FEDR) through the Operational Competitivity Programme 2014–2020 (contract no. 336/390012). We thank NIEP (especially Alexandra Muntean and Eduard Nastase) for their contributions to GNSS data validation and suggestions regarding free data available from NGL and suitable GNSS processing software.

Conflicts of Interest

The authors declare no conflict of interest.

References

  1. Yu, J.; Meng, X.; Yan, B.; Xu, B.; Fan, Q.; Xie, Y. Global Navigation Satellite System-based positioning technology for structural health monitoring: A review. Struct. Control. Health Monit. 2020, 27, e2467. [Google Scholar] [CrossRef] [Green Version]
  2. Nevada Geodetical Laboratory. Available online: http://geodesy.unr.edu/about.php (accessed on 15 February 2022).
  3. Rucci, A.; Ferretti, A.; Monti Guarnieri, A.; Rocca, F. Sentinel 1 SAR interferometry applications: The outlook for sub millimeter measurements. Remote Sens. Environ. 2012, 120, 156–163. [Google Scholar] [CrossRef]
  4. European Geological Data Infrastructure. European Space Agency Terrafirma Program. Available online: http://www.europe-geology.eu/terrafirma/ (accessed on 15 February 2022).
  5. Adam, N.; Parizzi, A.; Eineder, M.; Crosetto, M. Practical persistent scatterer processing 450 validation in the course of the Terrafirma project. J. Appl.Geophys. 2009, 69, 451–5965. [Google Scholar] [CrossRef] [Green Version]
  6. NASA-ISRO SAR Mission. Available online: https://nisar.jpl.nasa.gov/ (accessed on 15 February 2022).
  7. Cocco, M.; Atakan, K.; Pedersen, H.; Consortium, E. The European Plate Observing System (EPOS) Services for Solid Earth Science. 2016. Available online: https://gnss-epos.eu/about-us/ (accessed on 15 February 2022).
  8. European Space Agency. Geohazards TEP. Available online: https://eo4society.esa.int/resources/geohazards-exploitation-platform-g-tep/ (accessed on 15 February 2022).
  9. European Union. Copernicus Land Monitoring Service. Available online: https://land.copernicus.eu/pan-european/european-ground-motion-service (accessed on 15 February 2022).
  10. Cusson, D.; Trischuk, K.; Hébert, D.; Hewus, G.; Gara, M.; Ghuman, P. Satellite-Based InSAR Monitoring of Highway Bridges: Validation Case Study on the North Channel Bridge in Ontario, Canada. Transp. Res. Rec. 2018, 2672, 76–86. [Google Scholar] [CrossRef]
  11. Mațenco, L. Tectonics and Exhumation of Romanian Carpathians: Inferences from Kinematic and Thermochronological Studies. In Landform Dynamics and Evolution in Romania; Radoane, M., Vespremeanu-Stroe, A., Eds.; Springer: Cham, Switzerland, 2017. [Google Scholar] [CrossRef]
  12. Van der Hoeven, A.G.A.; Mocanu, V.; Spakman, W.; Nutto, M.; Nuckelt, A.; Matenco, L.; Munteanu, L.; Marcu, C.; Ambrosius, B.A.C. Observation of present-day tectonic motions in the Southeastern Carpathians: Results of the ISES/CRC-461 GPS measurements. Earth Planet. Sci. Lett. 2005, 239, 177–184. [Google Scholar] [CrossRef]
  13. Cakir, Z.; Ergintav, S.; Akoğlu, A.M.; Çakmak, R.; Tatar, O.; Meghraoui, M. InSAR velocity field across the North Anatolian Fault (eastern Turkey): Implications for the loading and release of interseismic strain accumulation. J. Geophys. Res. Solid Earth 2014, 119, 7934–7943. [Google Scholar] [CrossRef] [Green Version]
  14. Kotzev, V.; Nakov, R.; Burchfiel, B.C.; King, R. NW Bulgaria – The Northern Boundary of the Aegean Extensional Domain. In Vistas for Geodesy in the New Millennium; International Association of Geodesy Symposia; Ádám, J., Schwarz, K.P., Eds.; Springer: Berlin/Heidelberg, Germany, 2002; pp. 501–505. [Google Scholar] [CrossRef]
  15. Leever, K.A.; Matenco, L.; Bertotti, G.; Cloetingh, S.; Drijkoningen, G.G. Late orogenic vertical movements in the Carpathian Bend Zone—Seismic constraints on the transition zone from orogen to foredeep. Basin Res. 2006, 18, 521–545. [Google Scholar] [CrossRef]
  16. Martin, M.; Wenzel, F. High-resolution teleseismic body wave tomography beneath SE-Romania—II. Imaging of a slab detachment scenario. Geophys. J. Int. 2006, 164, 579–595. [Google Scholar] [CrossRef]
  17. Matenco, L.; Bertotti, G.; Leever, K.; Cloetingh, S.; Schmid, S.; Tărăpoancă, M.; Dinu, C. Large-scale deformation in a locked collisional boundary: Interplay between subsidence and uplift, intraplate stress, and inherited lithospheric structure in the late stage of the SE Carpathians evolution. Tectonics 2007, 26, TC4011. [Google Scholar] [CrossRef] [Green Version]
  18. Popa, M.; Radulian, M.; Szakács, A.; Seghedi, I.; Zaharia, B. New Seismic and Tomography Data in the Southern Part of the Harghita Mountains (Romania, Southeastern Carpathians): Connection with Recent Volcanic Activity. Pure Appl. Geophys. 2012, 169, 1557–1573. [Google Scholar] [CrossRef]
  19. Stănică, A.; Panin, N. Present evolution and future predictions for the deltaic coastal zone between the Sulina and Sf. Gheorghe Danube river mouths (Romania). Geomorphology 2009, 107, 41–46. [Google Scholar] [CrossRef]
  20. Szakacs, A.; Krezsek, C. Volcano-basement interaction in the Eastern Carpathians: Explaining unusual tectonic features in the Eastern Transylvanian Basin, Romania. J. Volcanol. Geotherm. Res. 2006, 158, 6–20. [Google Scholar] [CrossRef]
  21. Tiliţă, M.; Scheck-Wenderoth, M.; Matenco, L.; Cloetingh, S. Modelling the coupling between salt kinematics and subsidence evolution: Inferences for the Miocene evolution of the Transylvanian Basin. Tectonophysics 2015, 658, 169–185. [Google Scholar] [CrossRef]
  22. Niculescu, S.; Lardeux, C.; Hanganu, J. Alteration and Remediation of Coastal Wetland Ecosystems in the Danube Delta. A Remote-Sensing Approach. In Coastal Wetlands: Alteration and Remediation; Coastal Research Library; Finkl, C., Makowski, C., Eds.; Springer Nature: Cham, Switzerland, 2017; Volume 21, pp. 513–553. [Google Scholar] [CrossRef] [Green Version]
  23. Terrasigna PSTool—An Open Platform for Ground Monitoring Information. Available online: http://pstool.terrasigna.com/ (accessed on 15 February 2022).
  24. ROSE-L, ESA - Contract Signed for New Copernicus ROSE-L Mission. Available online: https://www.esa.int/Applications/Observing_the_Earth/Copernicus/Contract_signed_for_new_Copernicus_ROSE-L_mission (accessed on 15 February 2022).
  25. Geoserver.org. Available online: http://geoserver.org/about/ (accessed on 7 February 2022).
  26. MapProxy.org. Available online: https://mapproxy.org/ (accessed on 7 February 2022).
  27. Apache Web Server. Available online: https://httpd.apache.org/ (accessed on 7 February 2022).
  28. OpenLayers Library. Available online: https://openlayers.org/ (accessed on 7 February 2022).
  29. PostreSQL, PostgreSQL. Available online: https://www.postgresql.org/ (accessed on 7 February 2022).
  30. PostGIS, PostGIS. Available online: https://postgis.net/ (accessed on 7 February 2022).
  31. MySQL. Available online: https://www.mysql.com/ (accessed on 7 February 2022).
  32. Toma, S.-A.; Teleagă, D.; Poncoş, V.; Grozea, C. Ground Motion Patterns Analysis from the National Persistent Scatterer Deformation Map of Romania. In Proceedings of the 2021 IEEE International Geoscience and Remote Sensing Symposium IGARSS, Brussels, Belgium, 11–16 July 2021; pp. 6237–6239. [Google Scholar] [CrossRef]
  33. National Institute for Research and Development of Earth Physics (NIEP). GNSS Measurements Results in Romania. Available online: http://tsunami.infp.ro/en/gnss_network.php (accessed on 15 February 2022).
  34. Bányai, L.; Szűcs, E.; Wesztergom, V. Geometric features of LOS data derived by SAR PSI technologies and the three-dimensional data fusion. Acta Geod. Geophys. 2017, 52, 421–436. [Google Scholar] [CrossRef] [Green Version]
  35. Transformations between ECEF and ENU Coordinates. Available online: https://gssc.esa.int/navipedia/index.php/Transformations_between_ECEF_and_ENU_coordinates (accessed on 15 February 2022).
  36. ESA GNSS-Book TM-23 Vol II. Available online: https://www.scribd.com/document/459240968/ESA-GNSS-Book-TM-23-Vol-II-pdf (accessed on 15 February 2022).
  37. Dumitrescu, I.; Sandulescu, M. Tectonic map of Romania, scale 1:1000000. In Geological Atlas, Sheet no. 6; Geological Institute of Romania: Bucharest, Romania, 1970. [Google Scholar]
  38. Copernicus DEM. Available online: https://spacedata.copernicus.eu/explore-more/news-archive/-/asset_publisher/Ye8egYeRPLEs/blog/id/434960 (accessed on 15 February 2022).
  39. Crosetto, M.; Monserrat, O.; Cuevas-González, M.; Devanthéry, N.; Crippa, B. Persistent Scatterer Interferometry: A review. ISPRS J. Photogramm. Remote Sens. 2016, 115, 78–89. [Google Scholar] [CrossRef] [Green Version]
  40. Lanari, R.; Casu, F.; Manzo, M.; Zeni, G.; Berardino, P.; Manunta, M.; Pepe, A. An Overview of the Small BAseline Subset Algorithm: A DInSAR Technique for Surface Deformation Analysis. Pure Appl. Geophys. 2007, 164, 637–661. [Google Scholar] [CrossRef]
  41. EPOS Geodesy and InSAR Data. Available online: https://www.ics-c.epos-eu.org/data/search (accessed on 15 February 2022).
  42. Rao, K.S.; Chandra, G.; Narasimha Rao, P.V. Study on penetration depth and its dependence on frequency, soil moisture, texture and temperature in the context of microwave remote sensing. J. Indian Soc. Remote Sens. 1988, 16, 7–19. [Google Scholar] [CrossRef]
  43. Romania National Atlas of Ground Stability. Available online: http://www.terrasigna.com/uploads/downloads/TERRASIGNA_Ground_Motion_Romania.pdf (accessed on 15 February 2022).
  44. Nikolov, V. The prehistoric salt-production and urban center of Provadia-Solnitsata, Northeastern Bulgaria. Mediter. J. Mediterr. Geogr. 2016, 126, 71–78. [Google Scholar] [CrossRef]
  45. Paskaleva, I.; Nikolova, S.; Dimitrova, L.; Georgieva, G. Monitoring networks—Way for improving risk assessment from natural and man-made hazards: Case study salt mine Provadia (NE Bulgaria). Acta Geod. Geoph. Hung. 2010, 45, 388–402. [Google Scholar] [CrossRef]
  46. Botev, E.; Glavcheva, R.; Matova, M. Provadia region in Bulgaria—Natural or induced seismicity? Rep. Geod. 2006, 5/80, 247–255. [Google Scholar]
  47. Dimitrov, D.; Georgiev, I.; Dimitrova, L.; Botev, E. Deformations and seismicity in the region of Mirovo salt deposit, Bulgaria. In Conference Proceedings, 7th Congress of the Balkan Geophysical Society; European Association of Geoscientists & Engineers: Tirana, Albania, 2013; cp-362-00058; ISBN 978-90-73834-55-2. [Google Scholar] [CrossRef]
  48. Szűcs, E.; Gönczy, S.; Bozsó, I.; Bányai, L.; Szakács, A.; Szárnya, C.S.; Wesztergom, V. Evolution of surface deformation related to salt extraction-caused sinkholes in Solotvyno (Ukraine) revealed by Sentinel-1 radar interferometry. Nat. Hazards Earth Syst. Sci. 2021, 21, 977–993. [Google Scholar] [CrossRef]
  49. Chiriac, M.; Mutihac, V.; Mirăuţă, O. Geological Map of Romania, Scale 1:200000, Constanta Sheet; Geological Institute of Romania: Bucharest, Romania, 1968. [Google Scholar]
  50. Videle Oil Field. Available online: https://www.morebooks.de/store/fr/book/videle-oil-field/isbn/978-613-3-58421-1 (accessed on 15 February 2022).
  51. Stanica, A.; Dan, S.; Ungureanu, V.G. Coastal changes at the Sulina mouth of the Danube River as a result of human activities. Mar. Pollut. Bull. 2007, 55, 555–563. [Google Scholar] [CrossRef]
  52. Cuenca, M.C.; Hanssen, R. Subsidence due to peat decomposition in the Netherlands: Kinematic observations from radar interferometry. In Proceedings of the Fifth International Workshop on ERS/Envisat SAR Interferometry ‘FRINGE07’, Frascati, Italy, 26–30 November 2008; pp. 1–6. [Google Scholar]
  53. Hoyt, A.M.; Chaussard, E.; Seppalainen, S.S.; Harvey, C.F. Widespread subsidence and carbon emissions across Southeast Asian peatlands. Nat. Geosci. 2020, 13, 435–440. [Google Scholar] [CrossRef]
  54. Krézsek, C.; Bally, A.W. The Transylvanian Basin (Romania) and its relation to the Carpathian fold and trust belt: Insights in gravitational salt tectonics. Mar. Pet. Geol. 2006, 23, 405–442. [Google Scholar] [CrossRef]
  55. Map of Natural Gas Storage and Injection Wells in Targu Mures, Romania. Available online: http://www.depomures.ro/Harta_distante_zone_siguranta.pdf (accessed on 15 February 2022).
  56. Aggregated Storage Gas Inventory. Available online: https://agsi.gie.eu/#/graphs/21Z000000000309P/RO/21X000000001300T (accessed on 15 February 2022).
  57. Van Thienen-Visser, K.; Fokker, P.A. The future of subsidence modelling: Compaction and subsidence due to gas depletion of the Groningen gas field in the Netherlands. Neth. J. Geosci. 2017, 96, s105–s116. [Google Scholar] [CrossRef] [Green Version]
  58. Hefty, J. Work-Package 5 of the CERGOP-2/Environment: GPS data analysis and the definition of reference frames, Activity report April 2004—September 2004. Rep. Geod. 2004, 4, 23–34. [Google Scholar]
  59. Hefty, J. Work-Package 7 of the CERGOP-2/Environment: Geokinematical modelling and strain analysis activity report April 2004—September 2004. Rep. Geod. 2004, 4, 39–42. [Google Scholar]
  60. Milev, G.; Vassileva, K. Geodynamics of the Balkan Peninsula and Bulgaria. In Proceedings of the International Symposium on Strong Vrancea Earthquakes and Risk Mitigation, Bucharest, Romania, 4–6 October 2007; pp. 55–70. Available online: http://digbib.ubka.uni-karlsruhe.de/volltexte/beilagen/1/proceedings/pdf/10_Symposium_Bucharest_07_040_Milev.pdf (accessed on 15 February 2022).
  61. Munteanu, L. Tectonic blocks movement in and around Vrancea, based on precise GPS measurements. In Researches Related to the Disaster Management of Romanian Earthquakes; Tehnopress: Iaşi, Romania, 2009. (In Romanian) [Google Scholar]
  62. Necea, D.; Juez-Larré, J.; Matenco, L.; Andriessen, P.A.M.; Dinu, C. Foreland migration of orogenic exhumation during nappe stacking: Inferences from a high-resolution thermochronological profile over the Southeast Carpathians. Glob. Planet. Chang. 2021, 200, 103457. [Google Scholar] [CrossRef]
  63. Visarion, M.; Săndulescu, M.; Drăgoescu, I.; Drăghici, M.; Cornea, I.; Popescu, M. Map of Recent Vertical Crustal Movements, 1:1000000; Geological Institute of Romania: Bucharest, Romania, 1977. (In Romanian) [Google Scholar]
  64. Indicative Copernicus Constellation Deployment Schedule. p. 136. Available online: https://www.copernicus.eu/sites/default/files/2019-01/Copernicus_Work_Programme_2019.pdf (accessed on 15 February 2022).
  65. Crosetto, M.; Solari, L.; Mróz, M.; Balasis-Levinsen, J.; Casagli, N.; Frei, M.; Oyen, A.; Moldestad, D.A.; Bateson, L.; Guerrieri, L.; et al. The Evolution of Wide-Area DInSAR: From Regional and National Services to the European Ground Motion Service. Remote Sens. 2020, 12, 2043. [Google Scholar] [CrossRef]
  66. NASA Alaska SAR Facility Data and Processing Platform. Available online: https://asf.alaska.edu/ (accessed on 15 February 2022).
  67. Fiorentini, N.; Maboudi, M.; Leandri, P.; Losa, M. Can Machine Learning and PS-InSAR Reliably Stand in for Road Profilometric Surveys? Sensors 2021, 21, 3377. [Google Scholar] [CrossRef]
Figure 3. PSTool application architecture.
Remotesensing 14 01046 g003
Figure 4. Permanent GNSS stations in Romania. The color represents the yearly vertical displacement rate.
Remotesensing 14 01046 g004
Figure 5. (a) Data selection (time interval, axis, reference station); (b) variation of local vertical axis orientation over the Romanian coordinates compared to a reference point defined in the SW corner (longitude: 20°; latitude: 43.5°). GNSS analysis with PSTool (a) and variation of the vertical axis of the local ENU coordinate system over the studied area (b).
Remotesensing 14 01046 g005
Figure 6. Types of motion detected from temporal classification. (a) Map of PS targets; (b) subset of PS targets affected by displacement rate changes; (c) quasi-linear displacement rate; (d) variable displacement rate of the point indicated by the magenta circle.
Remotesensing 14 01046 g006
Figure 7. Set of PSInSAR targets and subset of targets affected by seasonal motion: (a) PSInSAR motion map in Sulina, Romania; (b) areas affected by seasonal motion in Sulina, Romania; (c) profile from area Figure 6b affected by seasonal motion (red star); (d) seasonal motion removed from the profile in Figure 7c (red star).
Remotesensing 14 01046 g007aRemotesensing 14 01046 g007b
Figure 8. Infrastructure versus natural area displacement (village of Razboieni, Romania): (a) infrastructure only (buildings); (b) infrastructure and natural areas; (c) example of LOS displacement time-series of infrastructure in Figure 7a; (d) example of LOS displacement time-series in natural areas (blue circle in Figure 7b).
Remotesensing 14 01046 g008
Figure 9. Ground subsidence related to salt exploitation in Provadia area, northeastern Bulgaria. Temporal series represents an average of profiles for targets located in the red polygon.
Remotesensing 14 01046 g009
Figure 10. Ground subsidence related to salt exploitation in Solotvyno, Ukraine.
Remotesensing 14 01046 g010
Figure 11. Correlation between geology and measured ground displacement: (a) Sentinel-1 ground displacement map; (b) Sentinel-1 LOS time-series displacement (area 2); (c) geology of the Cernavoda area (detail from [49]); (d) ASAR PSInSAR displacement map (2003–2009).
Remotesensing 14 01046 g011aRemotesensing 14 01046 g011b
Figure 12. PSInSAR displacement results for the infrastructure area of Cernavoda nuclear plant: (a) unstable infrastructure on alluvial formation; (b) subsidence on the alluvial formation; (c) sudden change in LOS displacements for isolated structure.
Remotesensing 14 01046 g012
Figure 13. PSInSAR measurement results in Videle area (Southern Romania).
Remotesensing 14 01046 g013
Figure 14. On-the-fly differential measurements between selected GNSS stations: (a) east, SULN vs. AEGY; (b) north, SULN vs. AEGY; (c) up, SULN vs. AEGY; (d) up, SULN vs. IGEO.
Remotesensing 14 01046 g014
Figure 15. PSInSAR measurements in the SULN GNSS area. (a) SULN GNSS station area, −3mm/year; (b) SULN GNSS station neighboring area, −9.2 mm/year; (c) Sulina city, −3 mm/year; (d) polder south of Sulina city, −6 mm/year.
Remotesensing 14 01046 g015aRemotesensing 14 01046 g015b
Figure 16. Subsidence areas in central Transylvania: (a) subsidence measured with PSInSAR; (b) salt diapirs—color contours (from modified from [21]) illustrate the depth of the salt below surface; (c) gas extraction fields marked with black contours.
Remotesensing 14 01046 g016aRemotesensing 14 01046 g016b
Figure 17. Subsidence of underground gas storage area: (a) subsidence related to gas storage (left) and gas storage facilities (right; detail from [55]); (b) injection/extraction cycles (gas storage historical data from [56]); (c) subsidence cycles measured with PSInSAR.
Remotesensing 14 01046 g017
Figure 18. Total ground motion and separation in three components (stable, up and down): (a) total ground motion; (b) stable targets; (c) subsidence; (d) uplift. Black lines = local and regional fault systems (from [11]).
Remotesensing 14 01046 g018
Figure 19. Small-scale motion detection: (a) subsidence/westward motion; (b) uplift/eastward motion (black lines = local and regional fault systems, from [11]).
Remotesensing 14 01046 g019
Figure 20. Qualitative correlation between a crustal motion map (left, detail from [63]) and PSINSAR measurement (right).
Remotesensing 14 01046 g020
Figure 21. GNSS measured trend reversal at GNSS station CRCL: (a) 2012–2018 east, 0.9 mm/year; (b) 2017–2021 east, 1.9 mm/year; (c) 2012–2017 north,1.45 mm/year; (d) 2017–2021 north, −0.41 mm/year; (e) 2012–2017 up, −1.63 mm/year; (f) 2017–2021 up, 1.33 mm/year.
Remotesensing 14 01046 g021aRemotesensing 14 01046 g021b
Figure 22. PSInSAR LOS trends: EPOS_36_5, 1.28 mm/year; TRACK_36c, 1.12 mm/year.
Remotesensing 14 01046 g022
Table 1. Projection of 3D SULN GNSS measurements to Sentinel-1 LOS direction (2017–2021).
GNSSReferenceEastNorthUpHeading [°]Incidence [°]LOS [mm/Year]
SULNAEGY−0.030.17−5.2193.9839.39−3.91
Table 2. Projection of 3D CRCL GNSS measurements to Sentinel-1 LOS direction (2017–2021).
GNSSReferenceEastNorthUpHeading [°]Incidence [°]LOS [mm/Year]
CRCLIGEO1.9−0.411.33193.9839.391.07
Publisher’s Note: MDPI stays neutral with regard to jurisdictional claims in published maps and institutional affiliations.

