
Radiometric Assessment of ICESat-2 over Vegetated Surfaces


Abstract
:1. Introduction
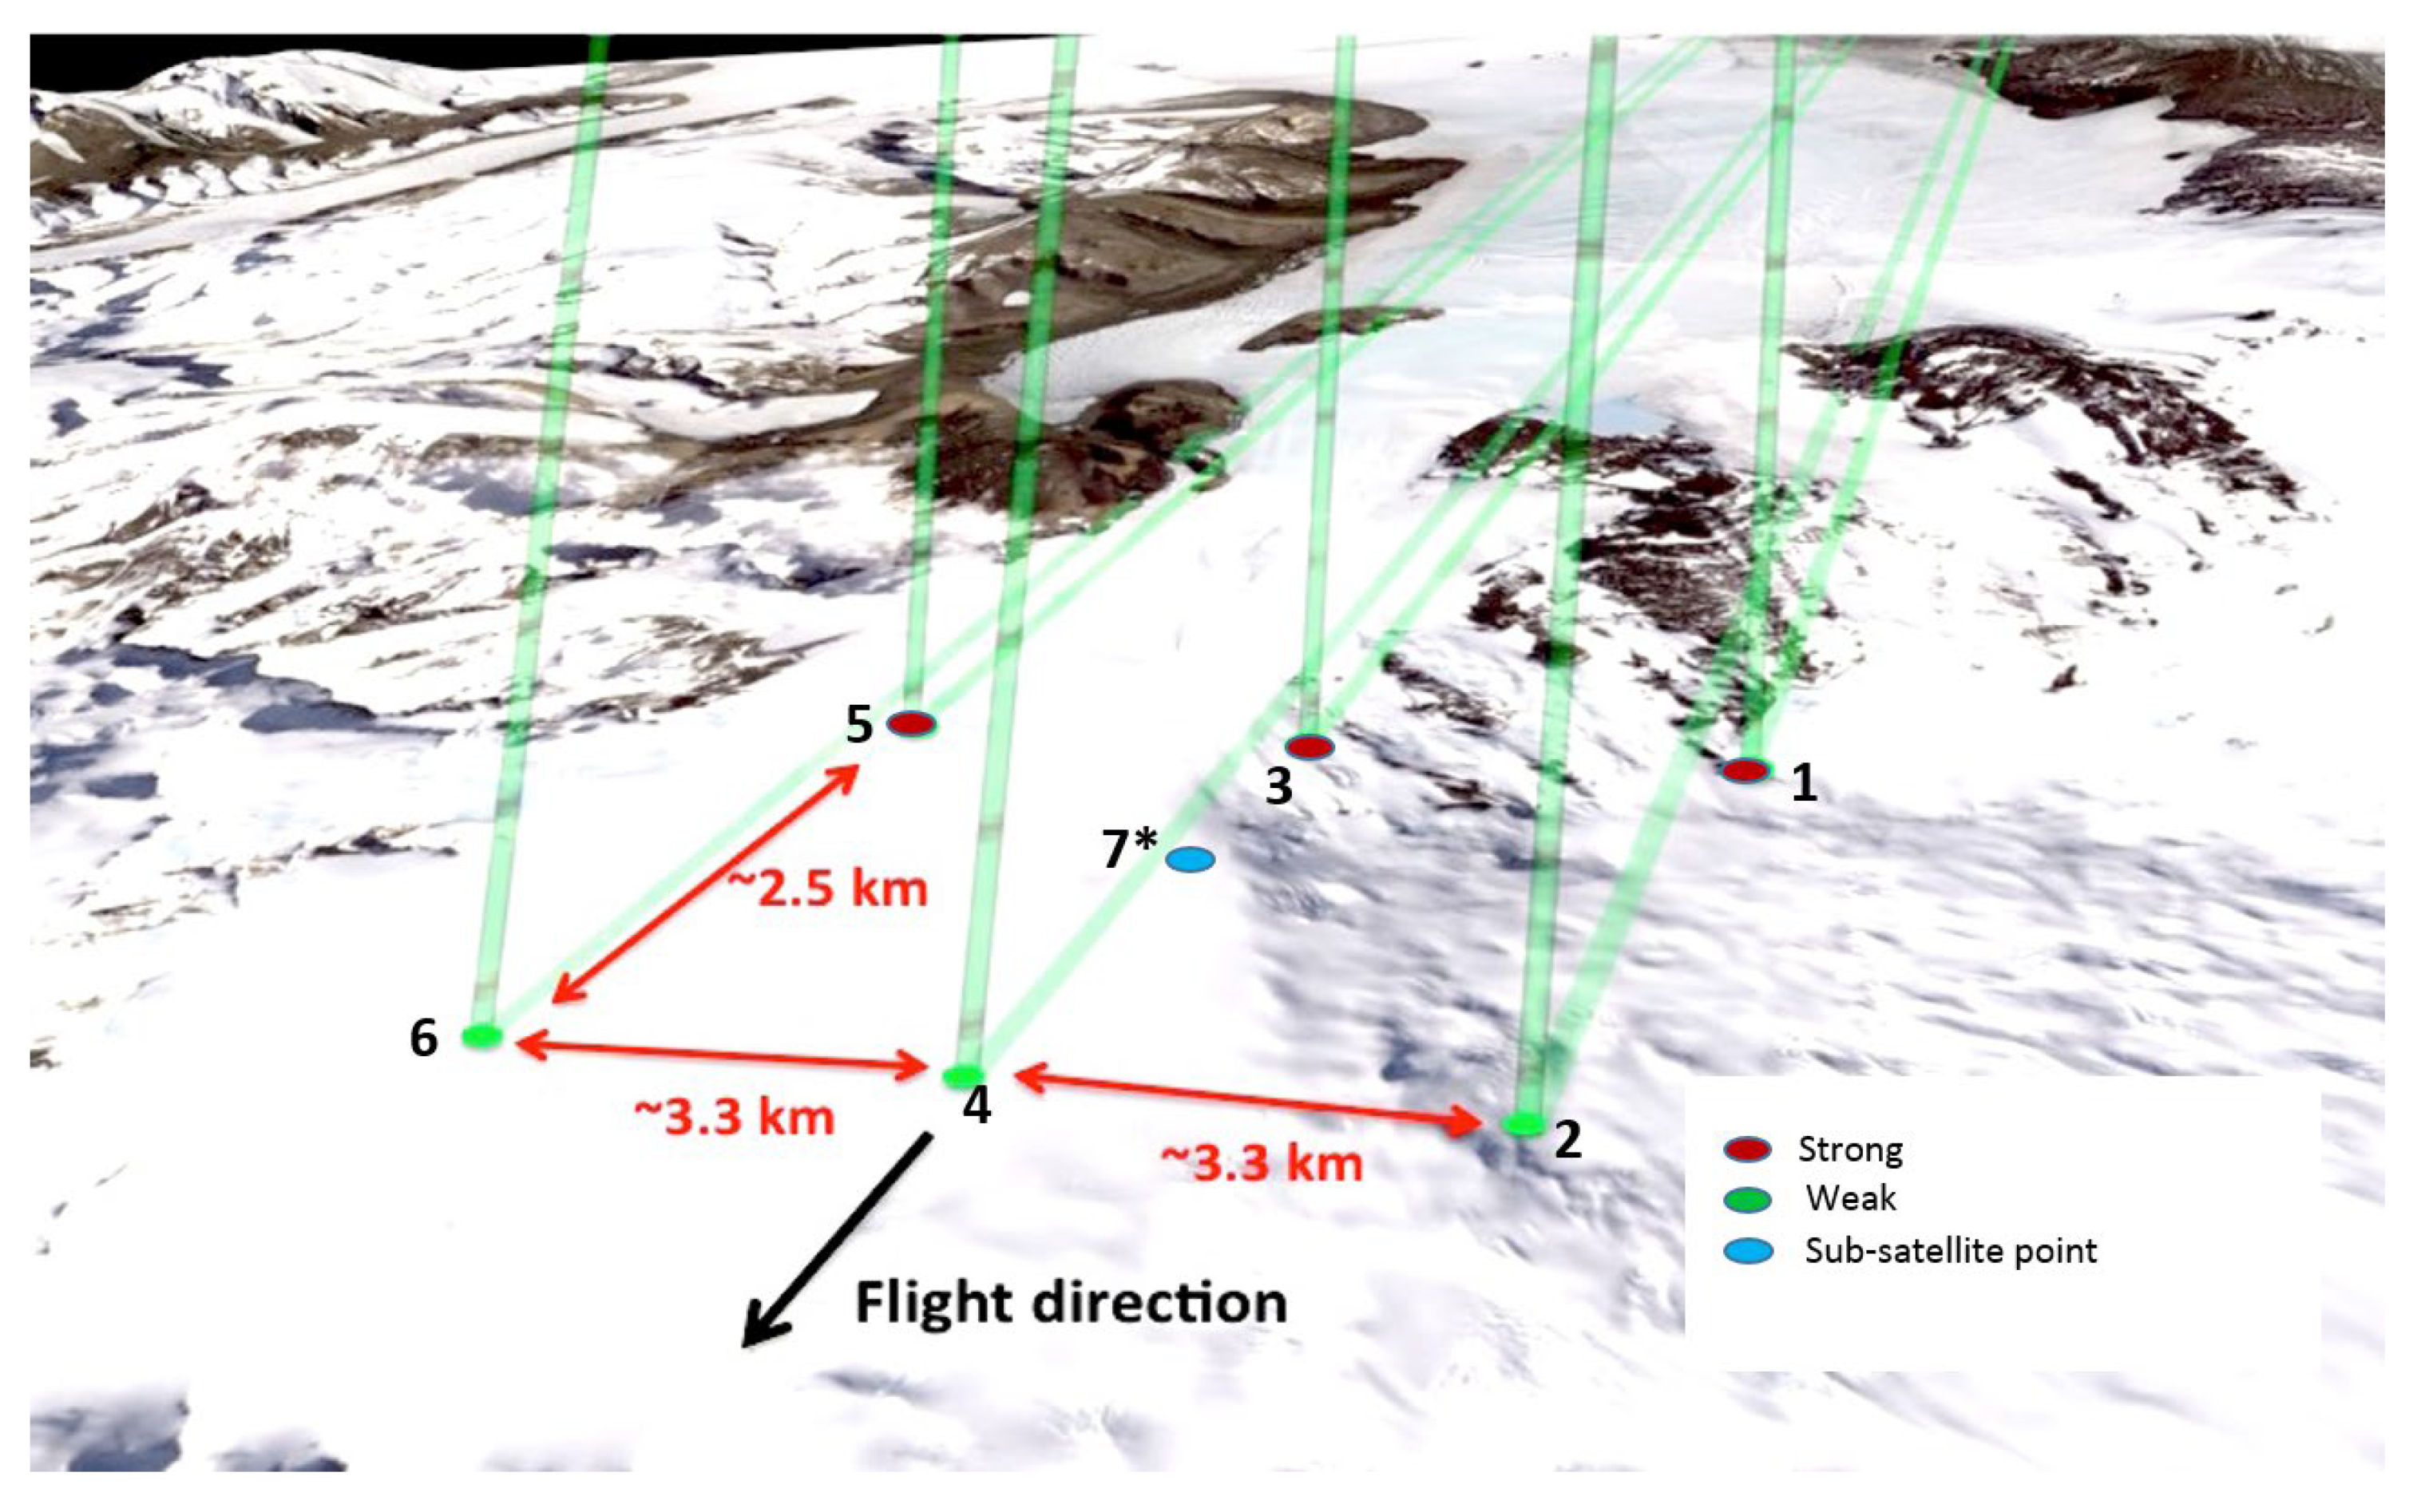
ATLAS
- (1)
- What is the overall observed radiometry for three forest types used as pre-launch design cases: boreal, temperate, and tropical?
- (2)
- What is the ATLAS beam radiometric observed variability?
- (3)
- What impact does atmospheric scattering have on the observed radiometry
- (4)
- What impact does day vs. night (e.g., solar elevation) have on the observed radiometry?
- (5)
- What impact does snow have on the observed radiometry?
2. Materials and Methods
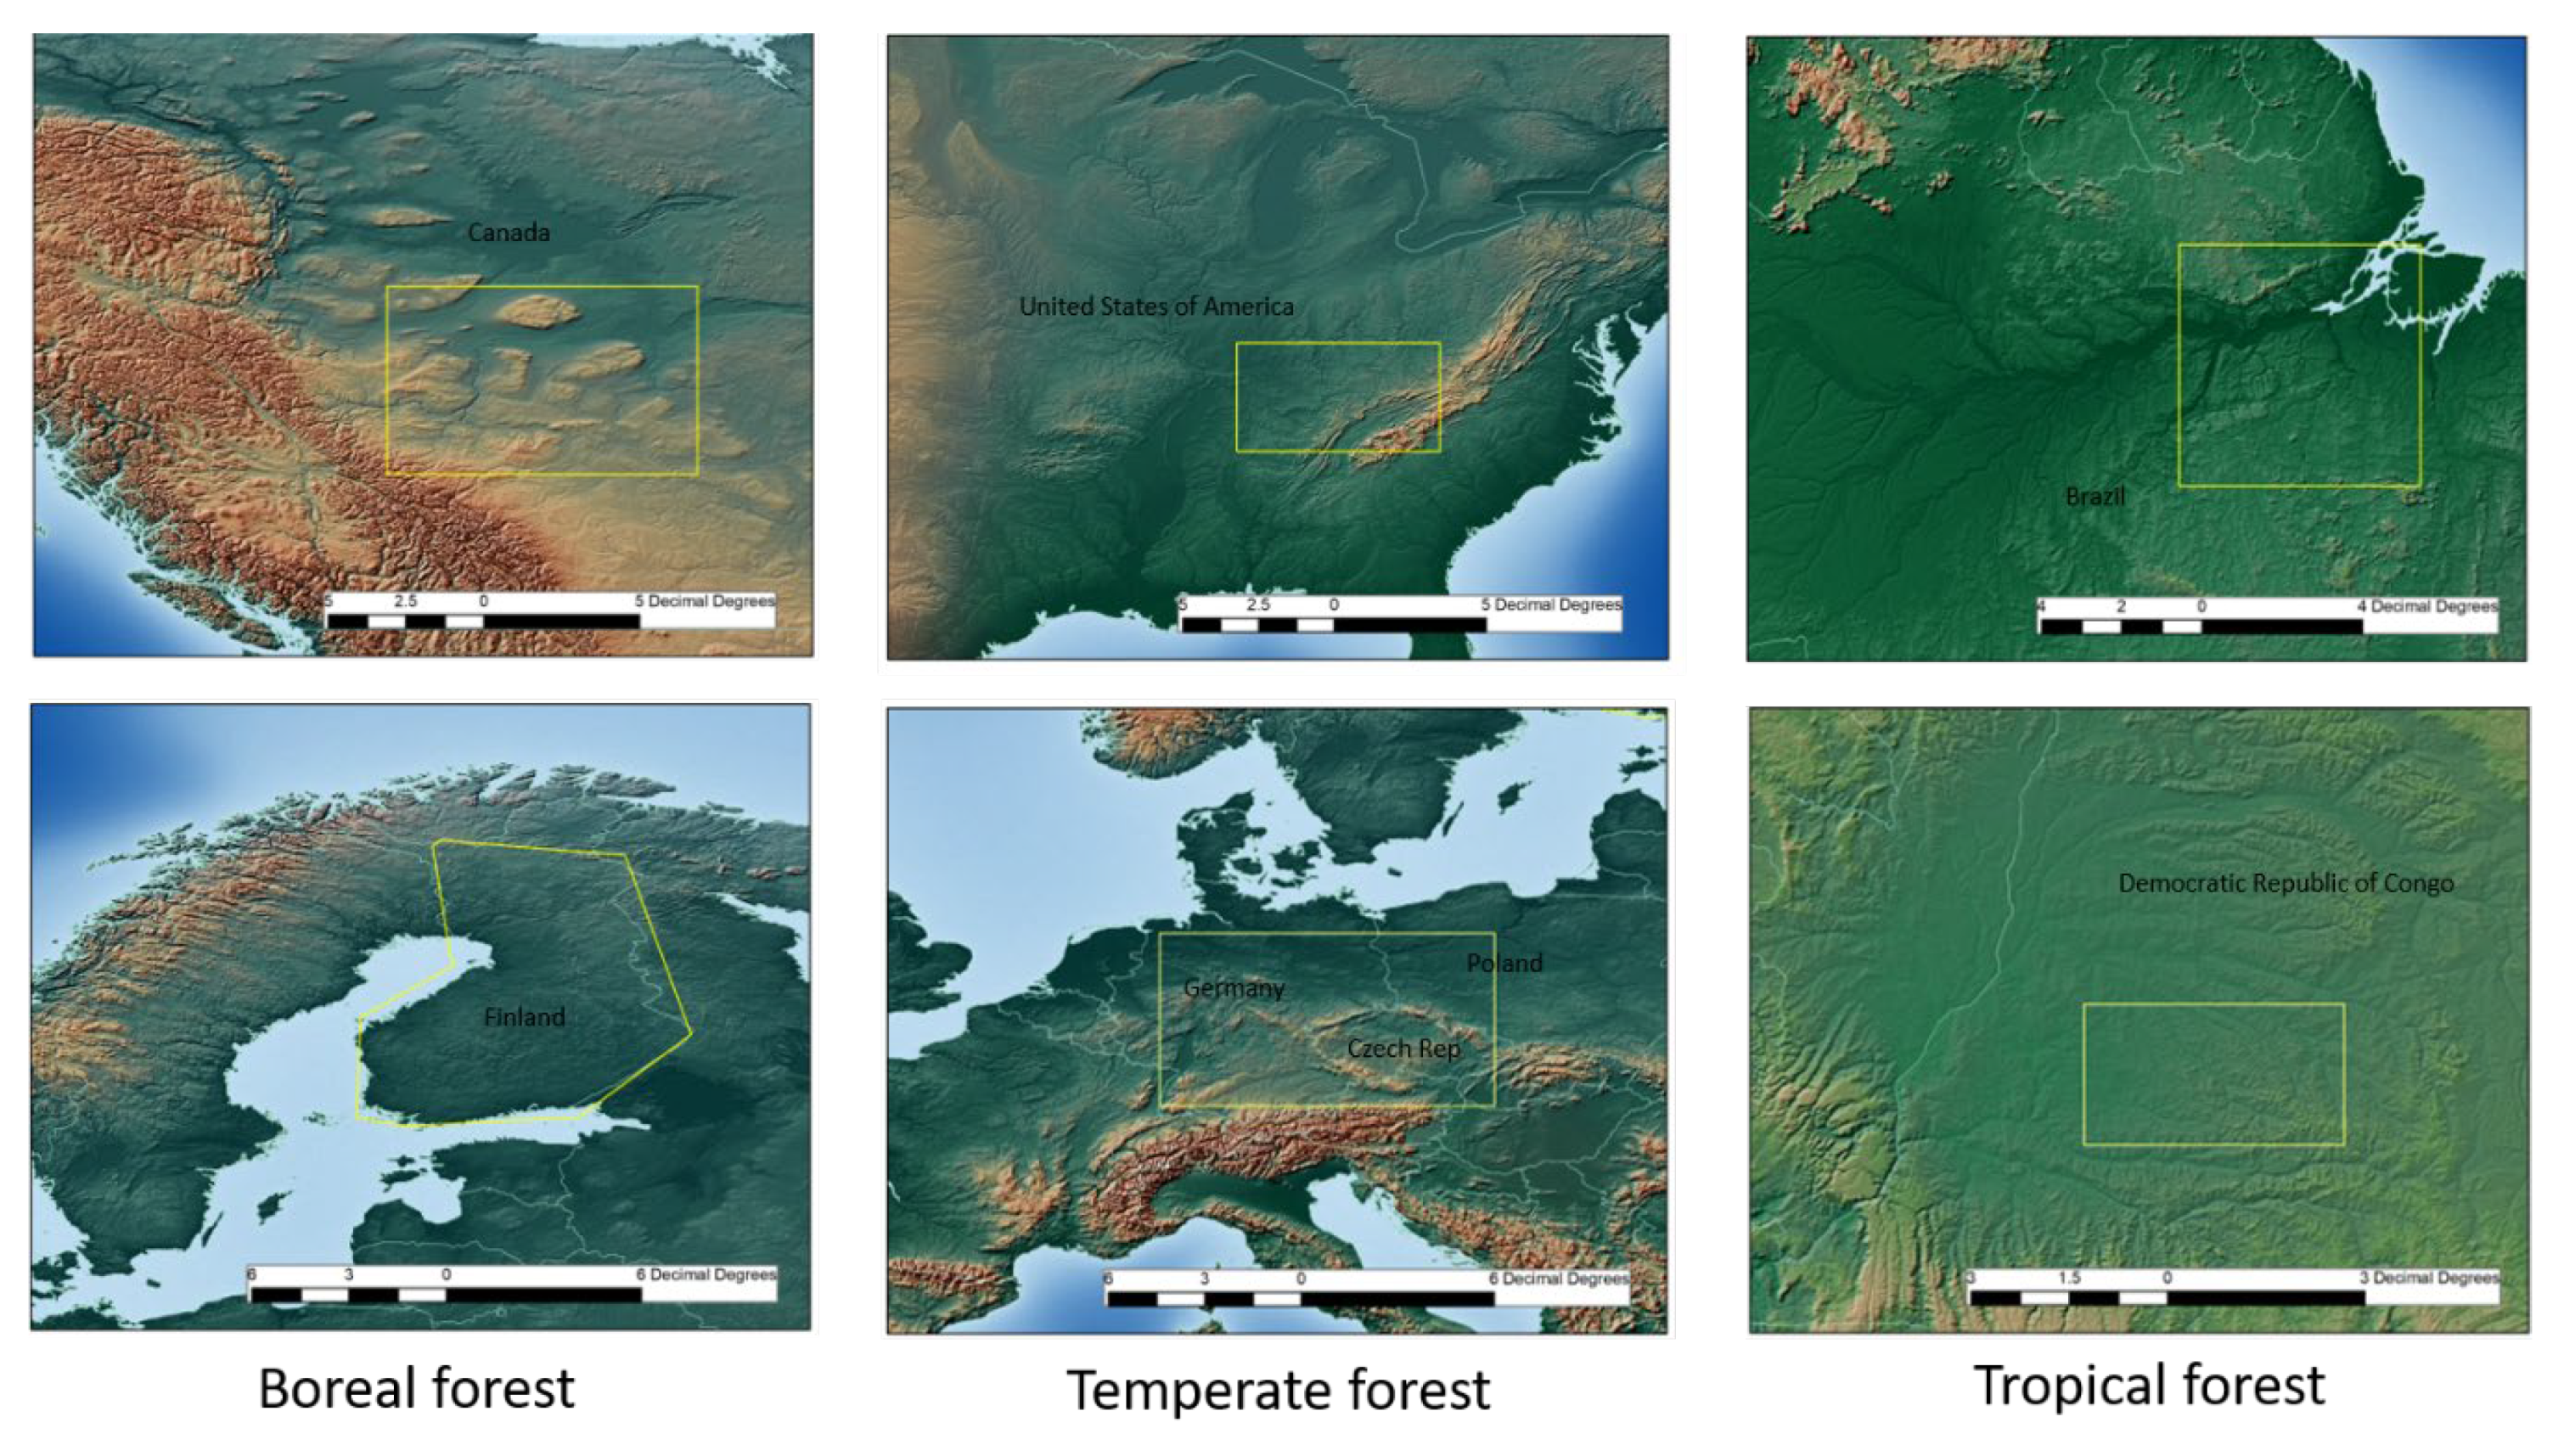
2.1. Study Areas
2.2. ATL08 Data Filtering
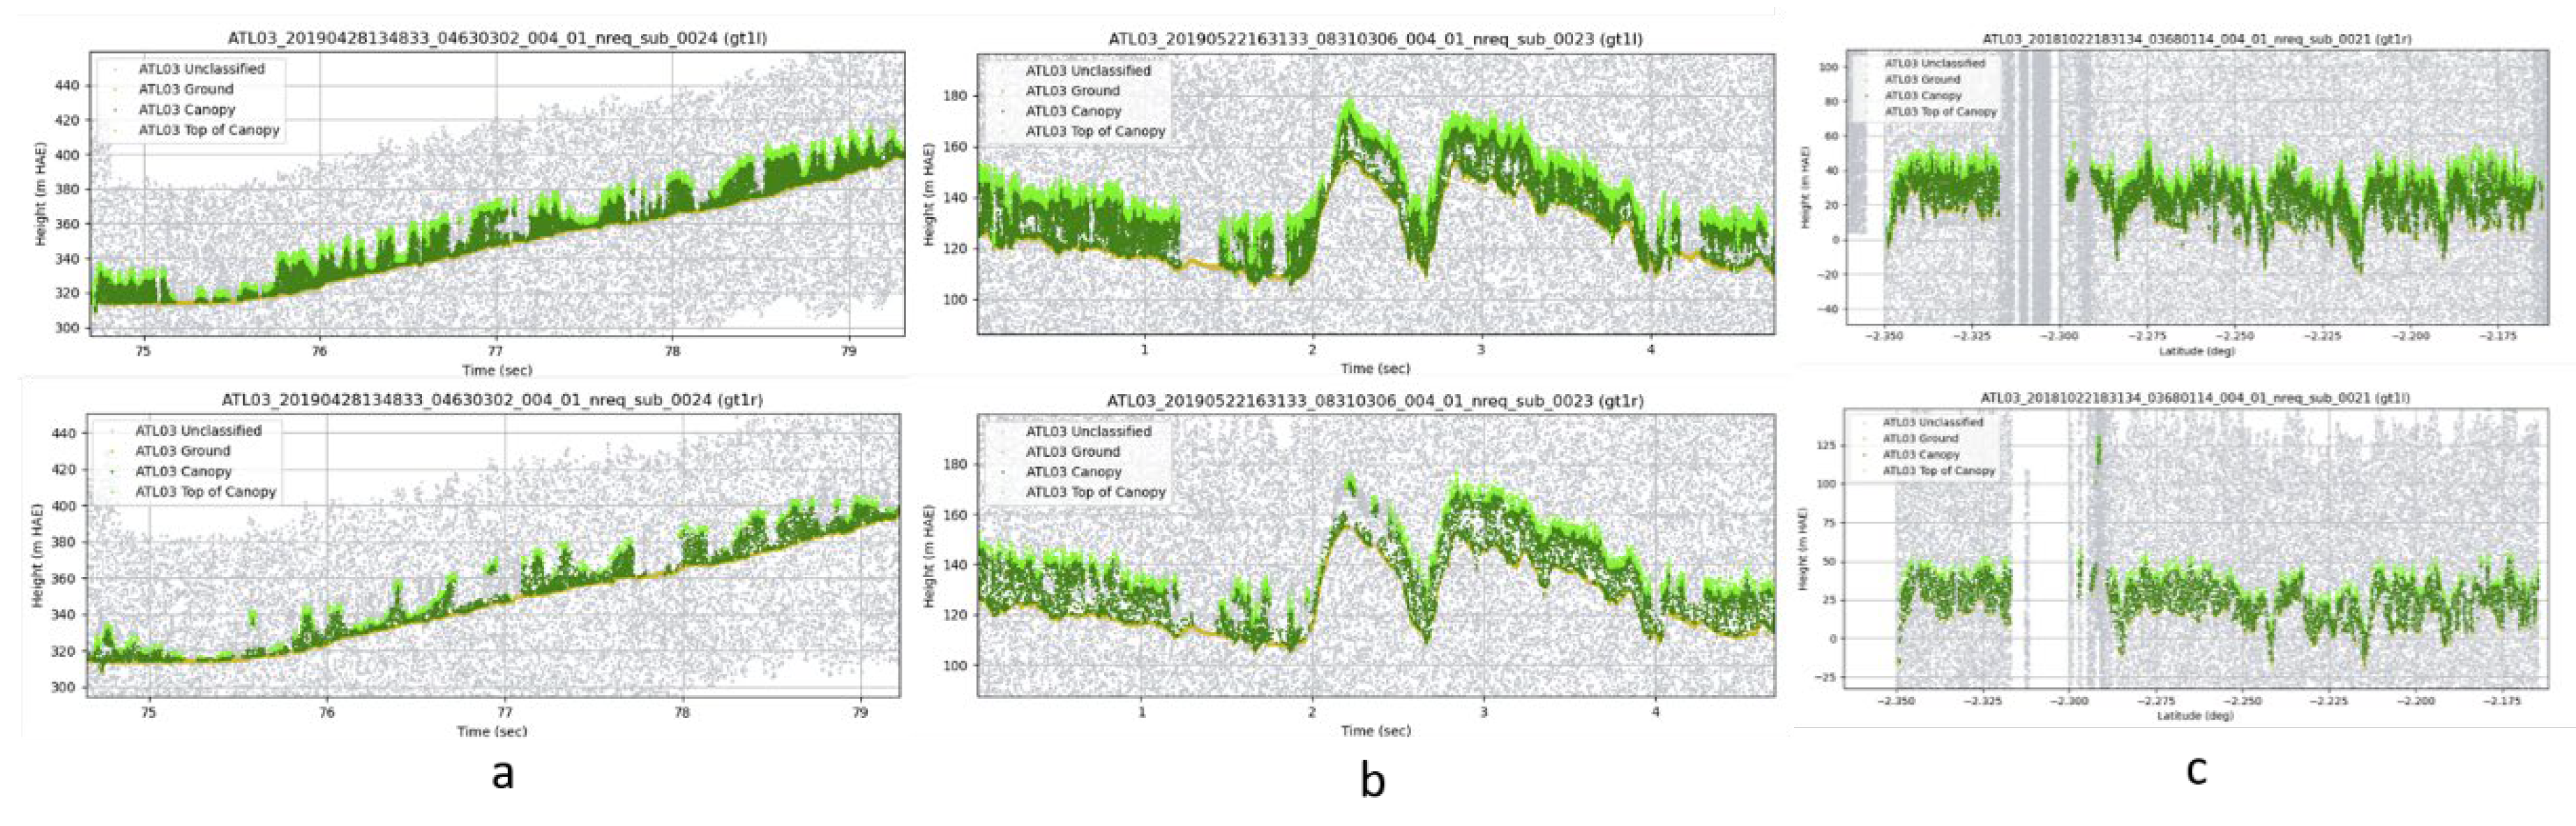
2.3. ATL08 Radiometry
3. Results
3.1. Boreal Forests
3.2. Temperate Forest
3.3. Tropical Forest
4. Discussion
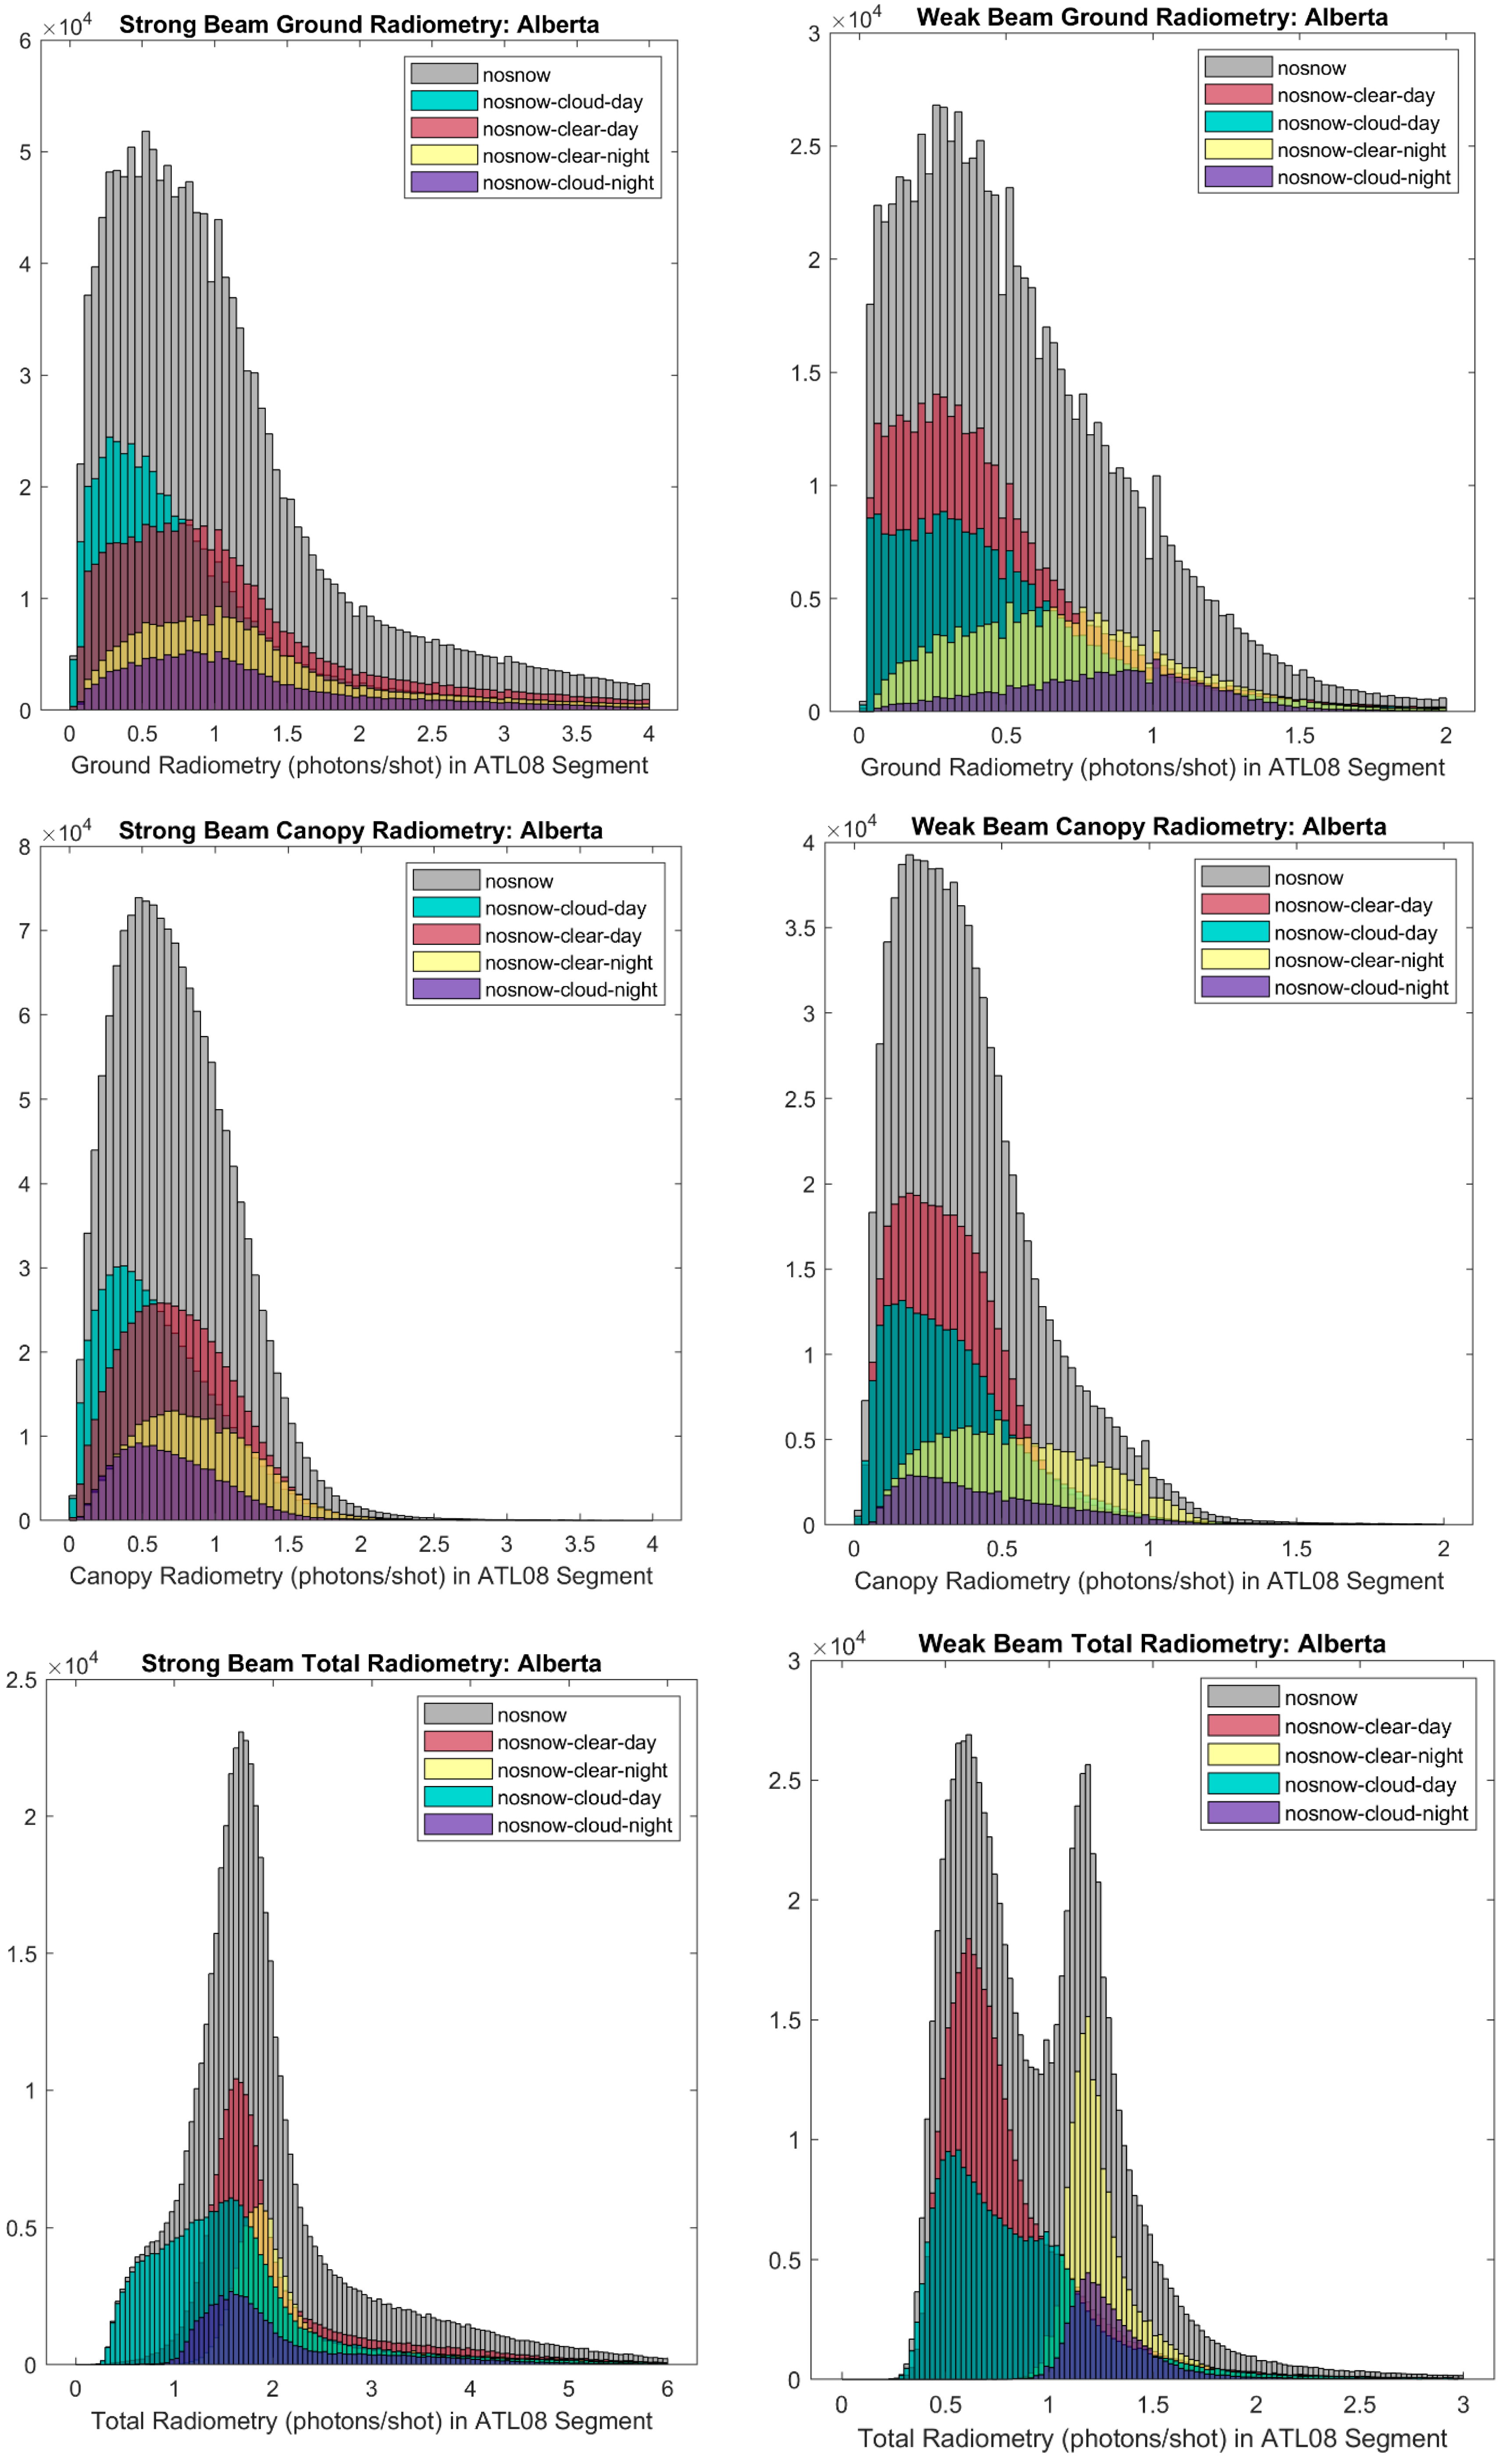
4.1. ATLAS Per-Beam Radiometric Response
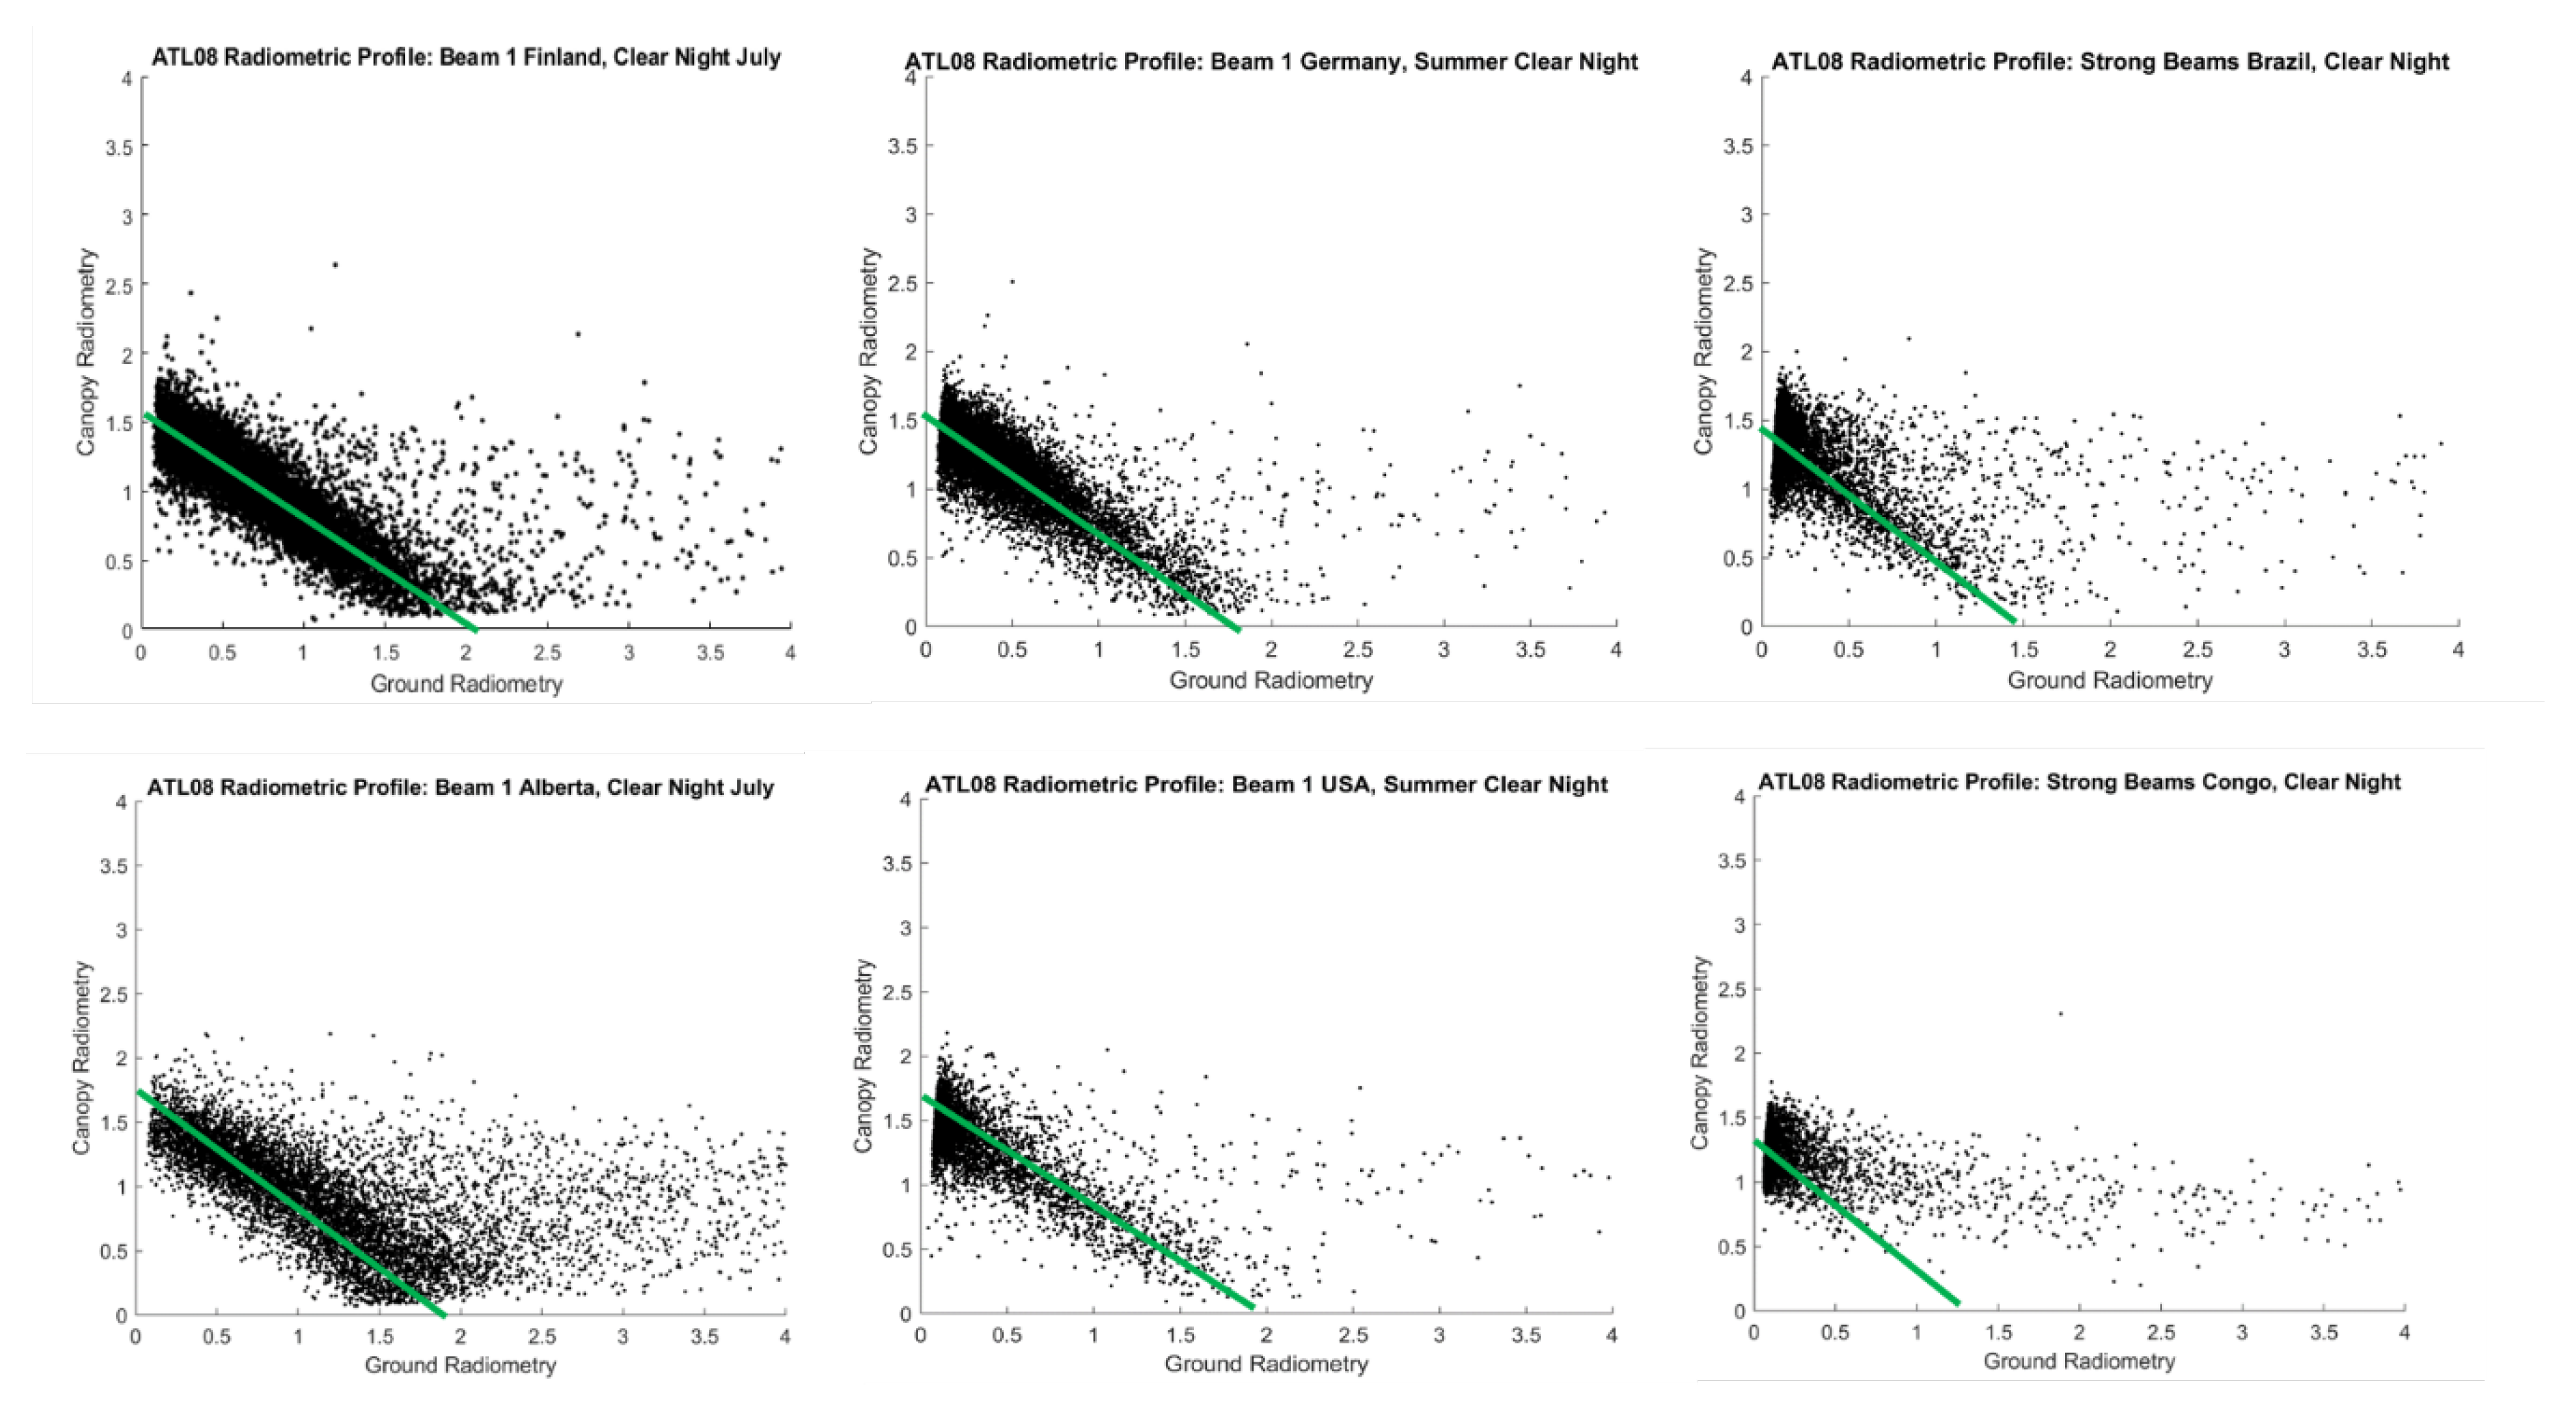
4.2. Radiometric Profiles
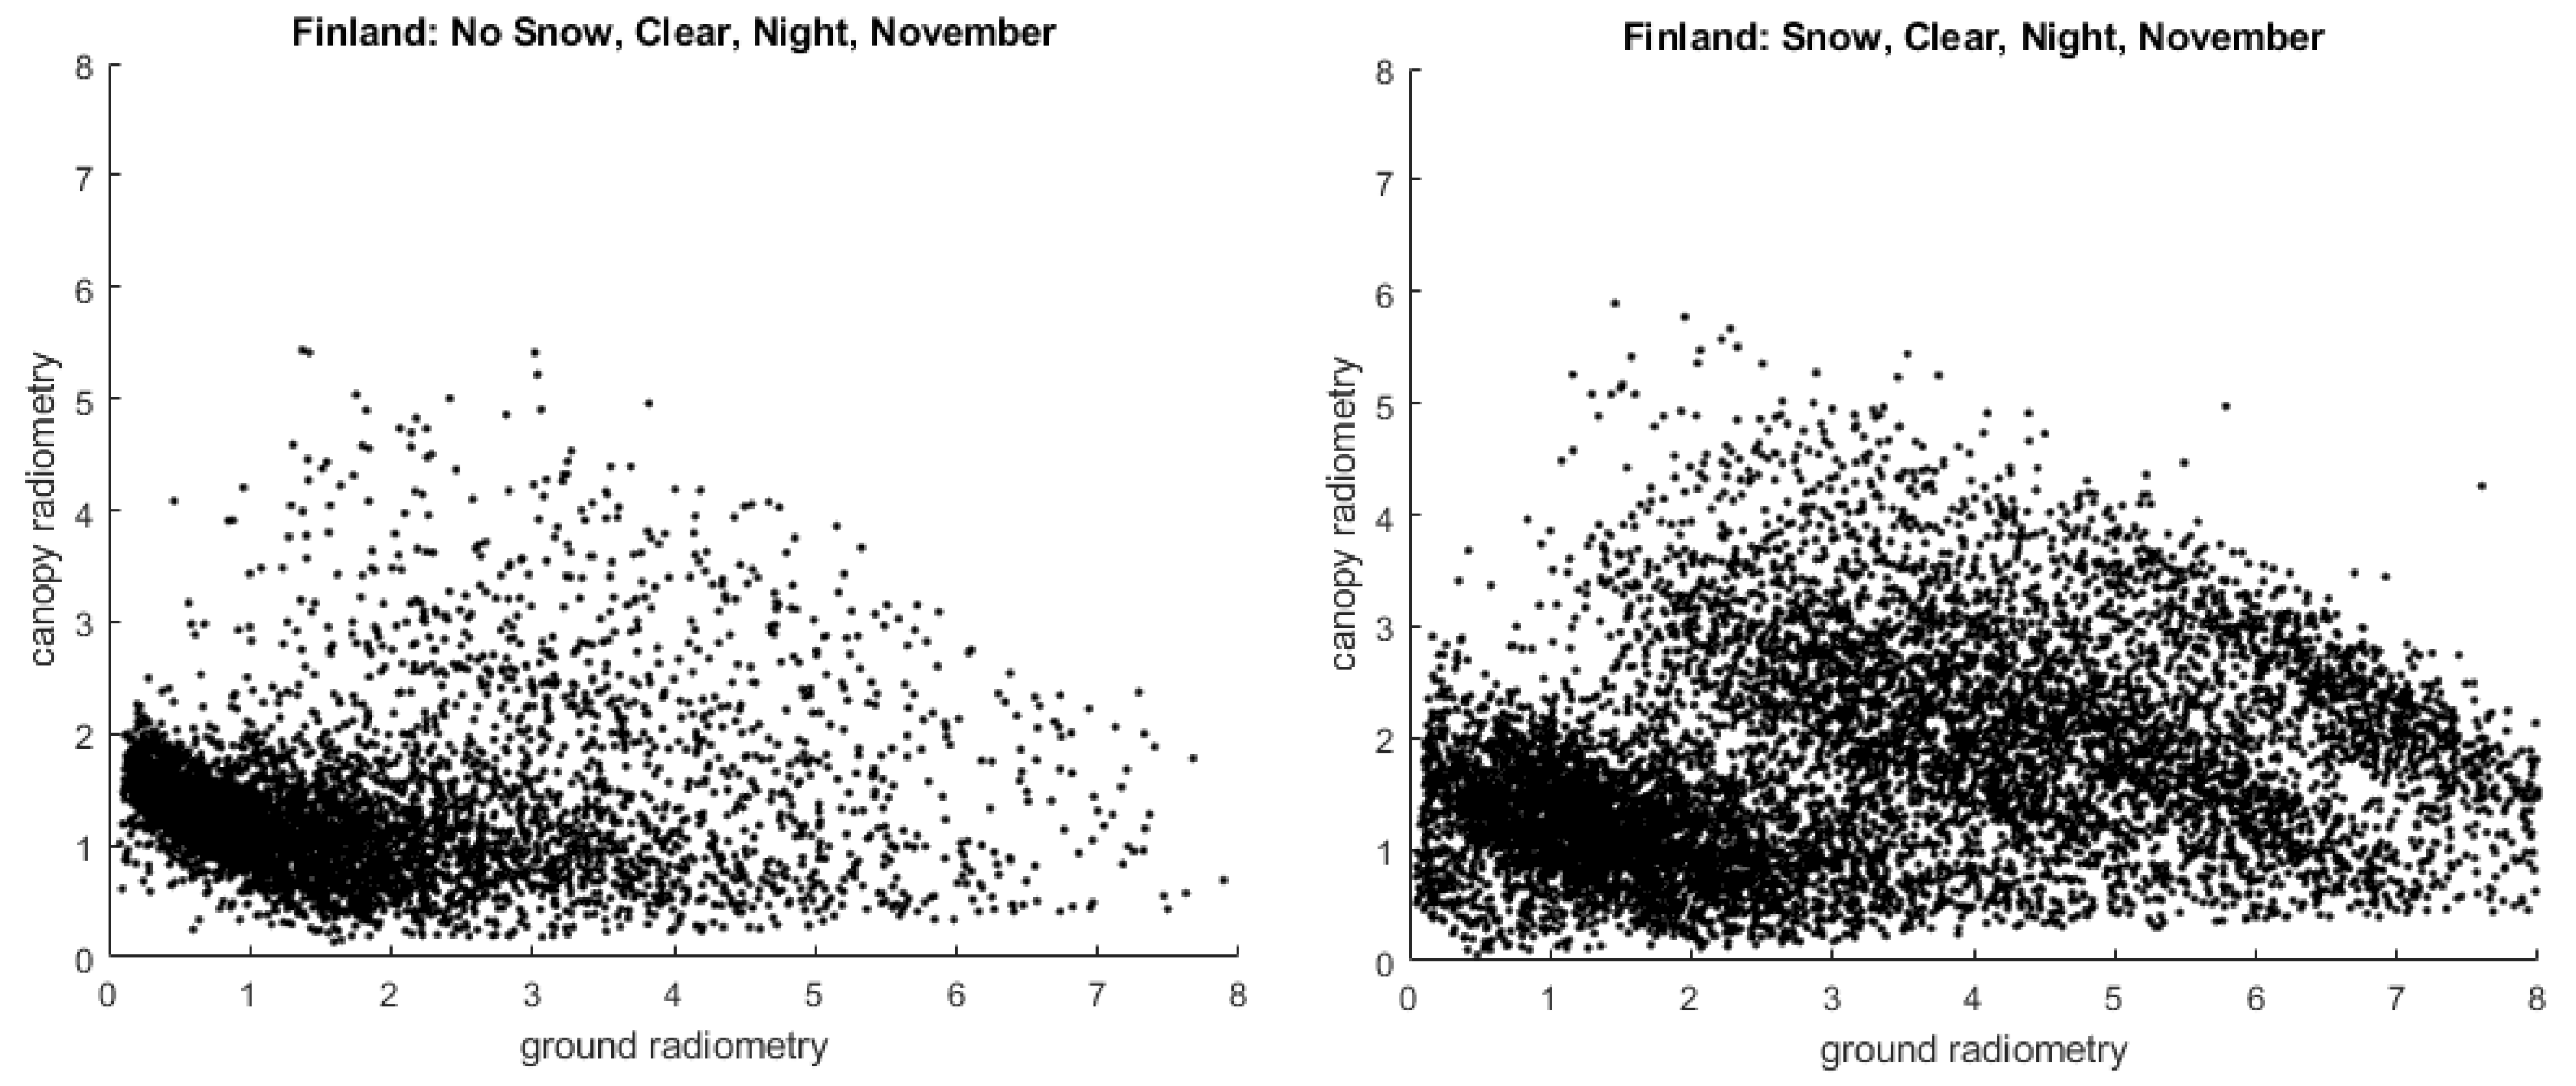
4.3. NOAA Snow Flag
5. Conclusions
Author Contributions
Funding
Institutional Review Board Statement
Informed Consent Statement
Data Availability Statement
Acknowledgments
Conflicts of Interest
References
- Magruder, L.; Neumann, T.; Kurtz, N. ICESat-2 early mission synopsis and observatory performance. Earth Space Sci. 2021, 8, e2020EA001555. [Google Scholar] [CrossRef] [PubMed]
- Markus, T.; Neumann, T.; Martino, A.; Abdalati, W.; Brunt, K.; Csatho, B.; Farrell, S.; Fricker, H.; Gardner, A.; Harding, D.; et al. The Ice, Cloud and land Elevation Satellite-2 (ICESat-2): Science requirements, concept and implementation. Remote Sens. Environ. 2017, 190, 260–273. [Google Scholar] [CrossRef]
- Magruder, L.A.; Brunt, K.M.; Alonzo, M. Early ICESat-2 on-orbit Geolocation Validation Using Ground-Based Corner Cube Retro-Reflectors. Remote Sens. 2020, 12, 3653. [Google Scholar] [CrossRef]
- Magruder, L.; Brunt, K.; Neumann, T.; Klotz, B.; Alonzo, M. Passive ground-based optical techniques for monitoring the on-orbit ICESat-2 altimeter geolocation and footprint diameter. Earth Space Sci. 2021, 10, e2020EA001414. [Google Scholar] [CrossRef]
- Neuenschwander, A.; Magruder, L. Potential performance characteristics of ICESat2/ATLAS for terrain and canopy height retrievals over multiple ecosystems. Remote Sens. 2016, 8, 1039. [Google Scholar] [CrossRef] [Green Version]
- Queinnec, M.; White, J.C.; Coops, N.C. Comparing airborne and spaceborne photon-counting lidar canopy structural estimates across different boreal forest types. Remote Sens. Environ. 2021, 262, 112510. [Google Scholar] [CrossRef]
- Neuenschwander, A.; Guenther, E.; White, J.; Duncanson, L.; Montesano, P. Validation of ICESat-2 terrain and canopy heights in boreal forests. Remote Sens. Environ. 2020, 251, 112110. [Google Scholar] [CrossRef]
- Neumann, T.A.; Martino, A.J.; Markus, T.; Bae, S.; Bock, M.R.; Brenner, A.C.; Brunt, K.M.; Cavanaugh, J.; Fernandes, S.T.; Hancock, D.W.; et al. The Ice, Cloud, and Land Elevation Satellite-2 mission: A global geolocated photon product derived from the Advanced Topographic Laser Altimeter System. Remote Sens. Environ. 2019, 233, 111325. [Google Scholar] [CrossRef] [PubMed]
- Martino, A.; Neumann, T.; Kurtz, N.; McLennan, D. ICESat-2 mission overview and early performance. In Proceedings of the Sensors, Systems, and Next-Generation Satellites XXIII, Strasbourg, France, 9–12 September 2019; p. 111510C. [Google Scholar] [CrossRef]
- Gibbons, A.; Neumann, T.; Hancock, D.; Harbeck, K.; Lee, J. On-orbit radiometric performance of ICESat-2. Earth Space Sci. 2021, 8, e2020EA001503. [Google Scholar] [CrossRef]
- Neuenschwander, A.; Magruder, L. Canopy and Terrain height retrievals from ICESat-2: A first look. Remote Sens. 2019, 11, 1721. [Google Scholar] [CrossRef] [Green Version]
- National Snow and Ice Data Center. Boulder, Colorado, USA. Available online: https://nsidc.org/data/icesat-2. ATL08 release 004_20181016 through 20210228 (accessed on 27 June 2021). [CrossRef]
- Yamazaki, D.; Ikeshima, D.; Tawatari, R.; Yamaguchi, T.; O’Loughlin, F.; Neal, J.C.; Sampson, C.C.; Kanae, S.; Bates, P.D. A high accuracy map of global terrain elevations. Geophys. Res. Lett. 2017, 44, 5844–5853. [Google Scholar] [CrossRef] [Green Version]
- Yang, Y.; Marshak, A.; Palm, S.P.; Wang, Z.; Schaaf, C. Assessment of Cloud Screening With Apparent Surface Reflectance in Support of the ICESat-2 Mission. IEEE Trans. Geosci. Remote Sens. 2013, 51, 1037–1045. [Google Scholar] [CrossRef]
- Neuenschwander, A.; Pitts, K. The ATL08 land and vegetation product for the ICESat-2 Mission. Remote Sens. Environ. 2019, 221, 247–259. [Google Scholar] [CrossRef]
- Palm, S.; Yang, Y.; Herzfeld, U.; Hancock, D.; Hayes, A.; Selmer, P.; Hart, W.; Hlavka, D. ICESat-2 atmospheric channel description, data processing, and first results. Earth Space Sci. 2021, 8, e2020EA001470. [Google Scholar] [CrossRef]
- Ni-Meister, W.; Jupp, D.; Dubayah, R. Modeling lidar waveforms in heterogeneous and discrete canopies. IEEE Trans. Geosci. Remote Sens. 2001, 39, 1943–1958. [Google Scholar] [CrossRef] [Green Version]
- Armston, J.; Disney, M.; Lewis, P.; Scarth, P.; Phinn, S.; Lucas, R.; Bunting, P.; Goodwin, N. Direct retrieval of canopy gap probability using airborne waveform lidar. Remote Sens. Environ. 2013, 134, 24–38. [Google Scholar] [CrossRef]
- Tang, H.; Dubayah, R.; Swatantran, A.; Hofton, M.; Sheldon, S.; Clark, D.; Blair, B. Retrieval of vertical LAI profiles over tropical rain forest using waveform lidar data La Selva, Costa Rica. Remote Sens. Environ. 2012, 124, 242–250. [Google Scholar] [CrossRef]
- Tang, H.; Dubayah, R.; Brolly, M.; Ganguly, S.; Zhang, G. Large-scale retrieval of leaf area index and vertical foliage profile from spaceborne waveform lidar (GLAS/ICESat). Remote Sens. Environ. 2014, 154, 8–18. [Google Scholar] [CrossRef]
- Estilow, T.; Young, A.; Robinson, D. A long-term northern hemisphere snow cover extent data record for climate studies and monitoring. Earth System Sci. Data 2015, 7, 137–142. [Google Scholar] [CrossRef] [Green Version]


| Vegetation Type | Poisson Mean Photoelectrons Per Outgoing Shot | Poisson Distribution |
|---|---|---|
| Boreal Forest | 1.0 | [0 1 2] |
| Temperate Forest | 1.9 | [0 1 2 3] |
| Tropical Forest | 0.6 | [0 1] |
| Region, Forest Type | Strong Beams | Weak Beams | ||||||
|---|---|---|---|---|---|---|---|---|
| MSW = 0, Day | MSW = 0, Night | MSW > 0, Day | MSW > 0, Night | MSW = 0, Day | MSW = 0, Night | MSW > 0, Day | MSW > 0, Night | |
| Alberta, Boreal | 2.06 | 2.31 | 1.63 | 2.06 | 0.86 | 1.29 | 0.93 | 1.32 |
| Finland, Boreal | 1.65 | 1.79 | 1.36 | 1.68 | 0.81 | 1.35 | 0.83 | 1.37 |
| Germany, Temperate | 1.38 | 1.63 | 1.19 | 1.56 | 0.66 | 1.27 | 0.70 | 1.33 |
| USA, Temperate | 1.45 | 1.68 | 1.22 | 1.53 | 0.63 | 1.30 | 0.67 | 1.43 |
| Brazil, Tropical | 1.25 | 1.58 | 1.05 | 1.54 | 0.69 | 1.93 | 0.67 | 1.99 |
| Congo, Tropical | 0.89 | 1.62 | 0.88 | 1.32 | 0.75 | 1.67 | 1.01 | 1.84 |
| Region, Forest Type | On-Orbit Observed | Pre-Launch Design | ||
|---|---|---|---|---|
| Strong | Weak | Strong | Weak | |
| Alberta, Boreal | 1.95 | 1.00 | 1.00 | 0.25 |
| Finland, Boreal | 1.63 | 0.87 | 1.00 | 0.25 |
| Germany, Temperate | 1.42 | 0.81 | 1.90 | 0.48 |
| USA, Temperate | 1.49 | 0.83 | 1.90 | 0.48 |
| Tapajos, Tropical | 1.31 | 0.96 | 0.60 | 0.15 |
| Congo, Tropical | 1.05 | 0.89 | 0.60 | 0.15 |
| Region, Forest Type | Beam 1 | Beam 3 | Beam 5 | Beam 2 | Beam 4 | Beam 6 | B1:B2 | B3:B4 | B5:B6 |
|---|---|---|---|---|---|---|---|---|---|
| Alberta, Boreal | 2.33 | 1.95 | 2.27 | 0.96 | 1.05 | 0.93 | 2.62 | 2.14 | 2.62 |
| Finland, Boreal | 1.86 | 1.61 | 1.85 | 0.76 | 1.00 | 0.81 | 2.76 | 2.09 | 2.68 |
| Germany, Temperate | 1.65 | 1.41 | 1.63 | 0.75 | 0.82 | 0.75 | 2.48 | 2.07 | 2.32 |
| USA, Temperate | 1.69 | 1.42 | 1.65 | 0.75 | 0.81 | 0.77 | 2.67 | 2.18 | 2.60 |
| Brazil, Tropical | 1.52 | 1.38 | 1.54 | 0.70 | 1.20 | 0.78 | 2.57 | 1.84 | 2.50 |
| Congo, Tropical | 1.16 | 1.22 | 1.33 | 0.65 | 1.08 | 0.70 | 2.12 | 1.59 | 2.22 |
| Region, Forest Type | Beam 1 | Beam 3 | Beam 5 | Beam 2 | Beam 4 | Beam 6 | B1:B2 | B3:B4 | B5:B6 |
|---|---|---|---|---|---|---|---|---|---|
| Alberta, Boreal | 4.95 | 3.82 | 4.82 | 1.46 | 1.42 | 1.45 | 3.40 | 2.72 | 3.34 |
| Finland, Boreal | 4.54 | 3.53 | 4.41 | 1.35 | 1.33 | 1.35 | 3.39 | 2.71 | 3.29 |
| Germany, Temperate | 3.62 | 2.93 | 3.67 | 1.16 | 1.13 | 1.17 | 3.29 | 2.72 | 3.26 |
| USA, Temperate | 3.47 | 2.54 | 3.37 | 1.08 | 1.02 | 1.07 | 3.43 | 2.63 | 3.32 |
| Brazil, Tropical | N/A | N/A | N/A | N/A | N/A | N/A | N/A | N/A | N/A |
| Congo, Tropical | N/A | N/A | N/A | N/A | N/A | N/A | N/A | N/A | N/A |
Publisher’s Note: MDPI stays neutral with regard to jurisdictional claims in published maps and institutional affiliations. |
© 2022 by the authors. Licensee MDPI, Basel, Switzerland. This article is an open access article distributed under the terms and conditions of the Creative Commons Attribution (CC BY) license (https://creativecommons.org/licenses/by/4.0/).
Share and Cite
Neuenschwander, A.; Magruder, L.; Guenther, E.; Hancock, S.; Purslow, M. Radiometric Assessment of ICESat-2 over Vegetated Surfaces. Remote Sens. 2022, 14, 787. https://doi.org/10.3390/rs14030787
Neuenschwander A, Magruder L, Guenther E, Hancock S, Purslow M. Radiometric Assessment of ICESat-2 over Vegetated Surfaces. Remote Sensing. 2022; 14(3):787. https://doi.org/10.3390/rs14030787
Chicago/Turabian StyleNeuenschwander, Amy, Lori Magruder, Eric Guenther, Steven Hancock, and Matt Purslow. 2022. "Radiometric Assessment of ICESat-2 over Vegetated Surfaces" Remote Sensing 14, no. 3: 787. https://doi.org/10.3390/rs14030787
APA StyleNeuenschwander, A., Magruder, L., Guenther, E., Hancock, S., & Purslow, M. (2022). Radiometric Assessment of ICESat-2 over Vegetated Surfaces. Remote Sensing, 14(3), 787. https://doi.org/10.3390/rs14030787