Article

Mapping Forest Restoration Probability and Driving Archetypes Using a Bayesian Belief Network and SOM: Towards Karst Ecological Restoration in Guizhou, China

1
College of Geography and Resources, Sichuan Normal University, Chengdu 610101, China
2
Institute of Mountain Hazards and Environment, Chinese Academy of Sciences, Chengdu 610041, China
3
University of Chinese Academy of Sciences, Beijing 100049, China
4
College of Geography and Tourism, Chongqing Normal University, Chongqing 401331, China
*
Author to whom correspondence should be addressed.
Remote Sens. 2022, 14(3), 780; https://doi.org/10.3390/rs14030780
Submission received: 7 January 2022 / Revised: 2 February 2022 / Accepted: 3 February 2022 / Published: 8 February 2022

Abstract

:
To address ecological threats such as land degradation in the karst regions, several ecological restoration projects have been implemented for improved vegetation coverage. Forests are the most important types of vegetation. However, the evaluation of forest restoration is often uncertain, primarily owing to the complexity of the underlying factors and lack of information related to changes in forest coverage in the future. To address this issue, a systematic case study based on the Guizhou Province, China, was carried out. First, three archetypes of driving factors were recognized through the self-organizing maps (SOM) algorithm: the high-strength ecological archetype, marginal archetype, and high-strength archetype dominated by human influence. Then, the probability of forest restoration in the context of ecological restoration was predicted using Bayesian belief networks in an effort to decrease the uncertainty of evaluation. Results show that the overall probability of forest restoration in the study area ranged from 22.27 to 99.29%, which is quite high. The findings from regions with different landforms suggest that the forest restoration probabilities of karst regions in the grid and the regional scales were lower than in non-karst regions. However, this difference was insignificant mainly because the ecological restoration in the karst regions accelerated local forest restoration and decreased the ecological impact. The proposed method of driving-factor clustering based on restoration as well as the method of predicting restoration probability have a certain reference value for forest management and the layout of ecological restoration projects in the mid-latitude ecotone.

1. Introduction

Recent change in global climate and increased human activity have led to dynamic changes in global vegetation coverage. Forests account for about 31% of the planet’s land area and play an extremely important role in ecosystem and maintaining regional ecological safety [1]. Nevertheless, forest coverage in many places worldwide is declining in response to increased human interference, which has led to various long-term negative ecological consequences, such as soil erosion, desertification, and species extinction [2,3]. To ameliorate the environmental conditions of forests, several countries have implemented various ecological restoration projects, particularly afforestation programs. Accordingly, studies on forest coverage changes have garnered significant research attention [4,5,6]. However, the prediction of forest restoration requires insight into the spatial patterns and driving factors of forest systems to formulate reasonable restoration measures.
The global karst area comprises approximately 2,200,000 km2, accounting for nearly 15% of all land area [7]. The karst ecosystem in China is one of the largest exposed carbonate rock areas in the world, with an area larger than 540,000 km2 and a living population of 220 million [8]. Recently, issues such as the increased vulnerability of local ecosystems, special hydrogeological structures, and stony desertification have attracted significant research attention [9]. To improve the ecological conditions in karst regions, the Government of China (GOC) has implemented a series of ecological measures, including afforestation and stony desertification. Nevertheless, forest restoration is a long-term project as the succession of species and changes in the local geographical environment affect the restoration of the forest ecosystem. At present, the implementation time of ecological engineering is relatively short, and most regions are in the initial stages of vegetation restoration. Variations in forest coverage are highly uncertain. Further, the effects of stony desertification in karst regions present obvious spatial differences owing to the complexity of the geological background and uncertainty during ecological restoration. Given the lack of relevant knowledge and unknown afforestation area, the variation can only be surmised as a probability event. Further, previous studies are limited in terms of modeling and data availability, and depict only quantitative changes and trends in forest coverage [10]. For example, Ma et al. (2021) [11] ignored the uncertainty associated with changing vegetation, but only established a non-linear model of the relationship between normalized difference vegetation index (NDVI) and multiple factors based on the beetle antenna search (BAS) algorithm to predict the value of interannual variation in the NDVI. Further, previous studies mainly describe variations in forest coverage based on short-term field investigations and multi-temporal satellite imagery; however, they ignore the driving forces of forest coverage changes as well as their interactive effect [12,13]. Therefore, it is necessary to comprehensively evaluate changes in forest coverage changes and their driving factors, along with the internal interactions of driving factors during the prediction of forest changes.
Although the driving factors contributing to changes in forest coverage are generally investigated, it is important to focus on their interaction to comprehensively understand their relationship with changing forest coverage. Self-organizing mapping (SOM) is an effective clustering tool and is widely used to identify the impact of driving factor interactions on explained variables [14,15]. These maps can be applied at different spatial scales for trans-regional comparability [16]. Thus far, SOM has been extensively used to study climatic changes, national ecosystem services, water-resource control, and land resource management [15,17,18,19]. In this study, the SOM method was used to interpret the complex relationships among driving factors underlying changes in forest coverage, as well as to implement spatial clustering and regional recognition.
In addition, a comprehensive effect assessment is needed not only to reveal the uncertainty of forest restoration, but also to identify the distribution of forest restoration at different levels based on the causality between the trends of forest coverage changes and driving factors. Recently, Bayesian belief networks (BBN) have been widely used to measure the risk and benefits to resolve uncertainty based on probability theory [20]. For example, Li et al. (2019) [21] applied the BBN model to analyze the risk of forest landscape degradation to resolve the uncertainty of risk assessment due to natural and human disturbances. Further, the method not only utilizes various data sources such as expert knowledge, observation, and empirical data to determine the causality effectively [20], but also interprets the benefits of probability based on quantitative inference patterns [22]. Here, the probability of benefit is expressed as a measure of the confidence level; that is, the reliability of the results [23]. Notably, the estimation of forest restoration is an iterative process. When the observational data are updated or substituted, BBNs can still be used to re-estimate the probability of forest restoration and provide stakeholders with a reference standard to facilitate scientific decision-making [24]. Therefore, theoretically, BBNs can also be used as an effective tool to recognize and predict forest changes.
Guizhou, a province of southwest China, is a typical karst region, where karst landforms constitute 70% of the gross area. Guizhou is not only the province with the largest proportion of karst regions in China, but is also one of the key regions undergoing ecological restoration. Therefore, a case study based on the Guizhou Province was carried out to (1) analyze the dynamic trend in forest coverage from 2005 to 2018 mainly using NDVI; (2) describe socio-environmental clusters using SOM based on the selected driving response factor in changing forest coverage; (3) predict the probability of forest restoration at the grid-scale using BBN. This study was conducted to explore the relationships between changes in forest coverage and social and environmental gradients, interpreting the evolutionary process of the regional ecological environment. Finally, it provides decision-makers with a valuable reference standard based on comprehensive research conclusions.

2. Materials and Methods
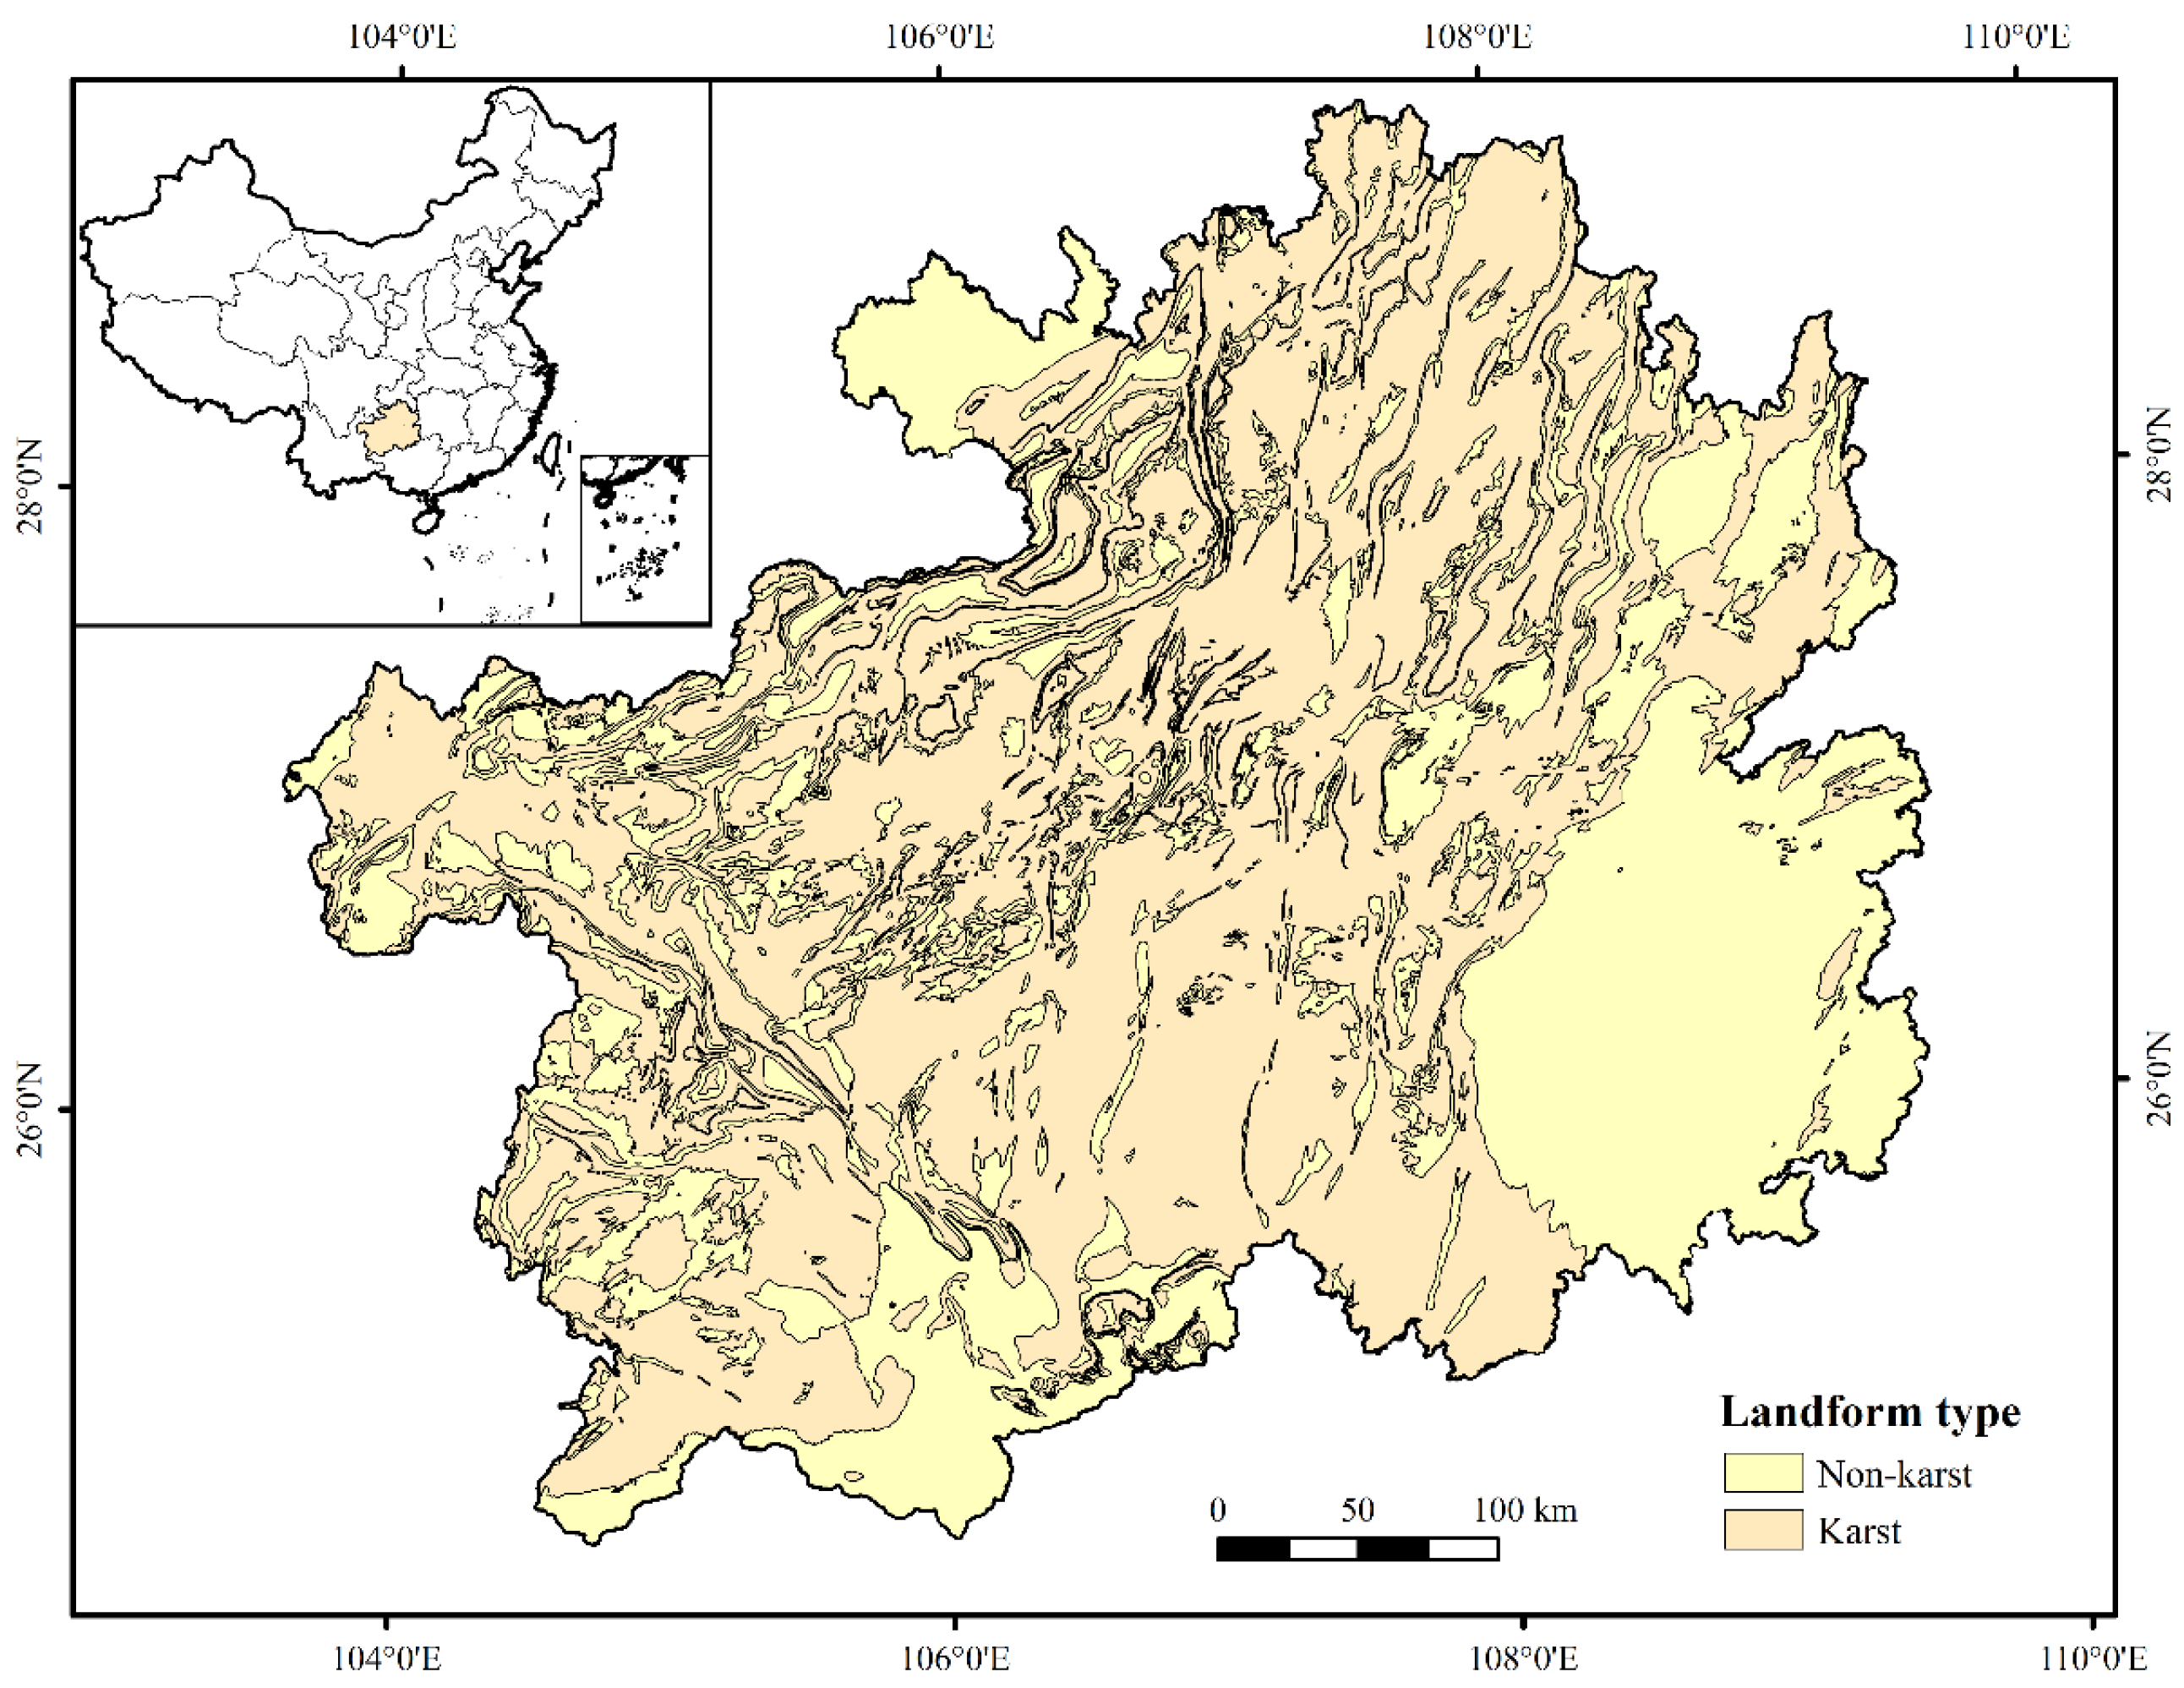
2.1. Study Area

The Guizhou Province is located between 24°37′–29°13′ N and 103°36′–109°35′ E, covering an area of 176,200 km2 (Figure 1). The province has a high average altitude in the west and a low average altitude in the east, with an average elevation of about 1100 m. It experiences a subtropical monsoon climate, which is erratic due to the influence of mountains. The annual duration of sunshine is 1300 h. The frost-free season lasts for about 270 days. The climate, soil, and terrain conditions contribute to diverse vegetation. Mid-subtropical evergreen broad-leaf forests occur predominantly in central and northern regions of the province, while south-subtropical evergreen broad-leaf forests are dominant in the southern regions.
Karst landforms—dominated by limestone, dolomite, and other carbonates—account for more than 70% of the total area in the province [25]. In past decades, degradation of vegetation and ecosystems occurred worldwide, including stony desertification. Since 2000, the GOC has invested 13 billion yuan to control stony desertification and vegetation degradation, minimizing the influence of human activities on the ecosystem via ecological migration and other measures. However, ecological restoration is marked by spatial differences owing to the complexity of the local geological conditions and uncertainties.

2.2. Data Sources

NDVI can be used to effectively evaluate and monitor changes in green vegetation [26]. Therefore, NDVI data can be used to monitor large-scale changes in forest land cover over a long period of time. In this study, the Terra Moderate Resolution Imaging Spectroradiometer (MODIS) Vegetation Indices (MOD13Q1) NDVI data and land use and land cover (LULC) data were used to ascertain the trends in forest variation from 2005 to 2018. MOD13Q1 NDVI was provided by the United States Geological Survey (https://www.usgs.gov/, accessed on 6 January 2022), with a spatial resolution of 250 m. In order to improve the image quality, we preprocessed the data via radiometric calibration, atmospheric correction, image mosaic and clipping, cloud removal, shadow processing and spectral normalization. LULC data in 2005 and 2018, with a spatial resolution of 1 km, were published online by the Resource and Environmental Science Data Center of the Chinese Academy of Sciences (http://www.resdc.cn/, accessed on 6 January 2022).
In addition, six datasets were selected to obtain the driving factors. The Shuttle Radar Topography Mission (SRTM) digital elevation data at 90 m (SRTM 90 m) were acquired from the Resource and Environmental Science Data Center of the Chinese Academy of Sciences (http://www.resdc.cn/, accessed on 6 January 2022). Meteorological data from 2005 to 2018 collected by the meteorological stations, including temperature, precipitation, and potential evapotranspiration, were downloaded from China’s meteorological-data-sharing service system (http://data.cma.cn/, accessed on 6 January 2022). The spatial grids of temperature, precipitation, and potential evapotranspiration with 1 km resolution were interpolated using the meteorological interpolation software Anusplin. Soil data, including soil texture and soil depth with a spatial resolution of 1 km, were obtained from the 1:1,000,000 soil database of the National Tibetan Plateau Data Center (http://data.tpdc.ac.cn/, accessed on 6 January 2022). Nighttime light data with a spatial resolution of 500 m were obtained from the Harvard Dataverse (https://doi.org/10.7910/DVN/YGIVCD, accessed on 6 January 2022). Geographic information data were derived from the National Geomatics Center of China (https://www.openstreetmap.org/, accessed on 6 January 2022), including administrative boundaries, settlements, and traffic network. The distances of sample locations from roads and settlements were obtained using the near tool in ArcGIS10.6. The afforestation area data was determined with the help of the local governmental departments. The afforestation area of each grid was obtained via geostatistical analysis. In this study, all the selected driving factors were resampled into a raster with 1 × 1 km pixel size to ensure the same spatial resolution and grid number.

2.3. Methods

2.3.1. SOM Model

Based on a survey of local data and previous studies [10], 18 driving factors were selected (see Table 1). The mean value of NDVI (NDVIm) was regarded as one of the factors since NDVIm had the highest correlation coefficient with the slope value of NDVI (NDVIs), as shown in Figure 2. To estimate the archetypes of socio-environmental drivers, we used the SOM algorithm to analyze the selected factors (Table 1). First, all impact factors were standardized using the z-score to reconstruct a consistent scale to determine the distance between the value of each driving factor and the average value, which indicates the importance of variables in each cluster [15]. A z-score = 0 suggests a mean/low influence of the factor has a mean/low influence; a z-score > 0 indicates a positive impact, while a z-score < 0 suggests a negative impact. Further, the greater the absolute value of the z-score, the stronger the importance in the cluster. The variable values in each cluster can be represented graphically to display the characteristics of the factors in each cluster. In the second step, we completed the parameterization of SOM by defining a priori number of clusters in a two-dimensional plane. This step is crucial as defining too many clusters may lead to the separation of relatively homogeneous clusters, while defining too few clusters may lead to inhomogeneity with high variability of input data [15]. To define an appropriate number of clusters, we analyzed the number of hexagonal plane prototypes in different combinations (e.g., 5 × 5 vs. 10 × 10) based on the Davies–Bouldin (DB) index and the mean distance of samples in each cluster [27]. In this study, we selected a 5 × 5 hexagonal plane for the drivers associated with forest coverage change, as the DB index (6.52) and the mean distance (7.02) to the cluster centroids was more satisfactory at this point. The SOM method was used to generate a monolayer map of the clusters of forest coverage change drivers. Finally, an actual monolayer map of the clusters was generated iteratively. The SOM method involves creation of patterns from factors based on similarities and differences [19]. The optimal clustering mode was obtained and codebook vectors were used to detect the relative importance of each factor under each archetype. This method facilitated the identification of the impact of spatial allocation of driving factors on forest coverage change.

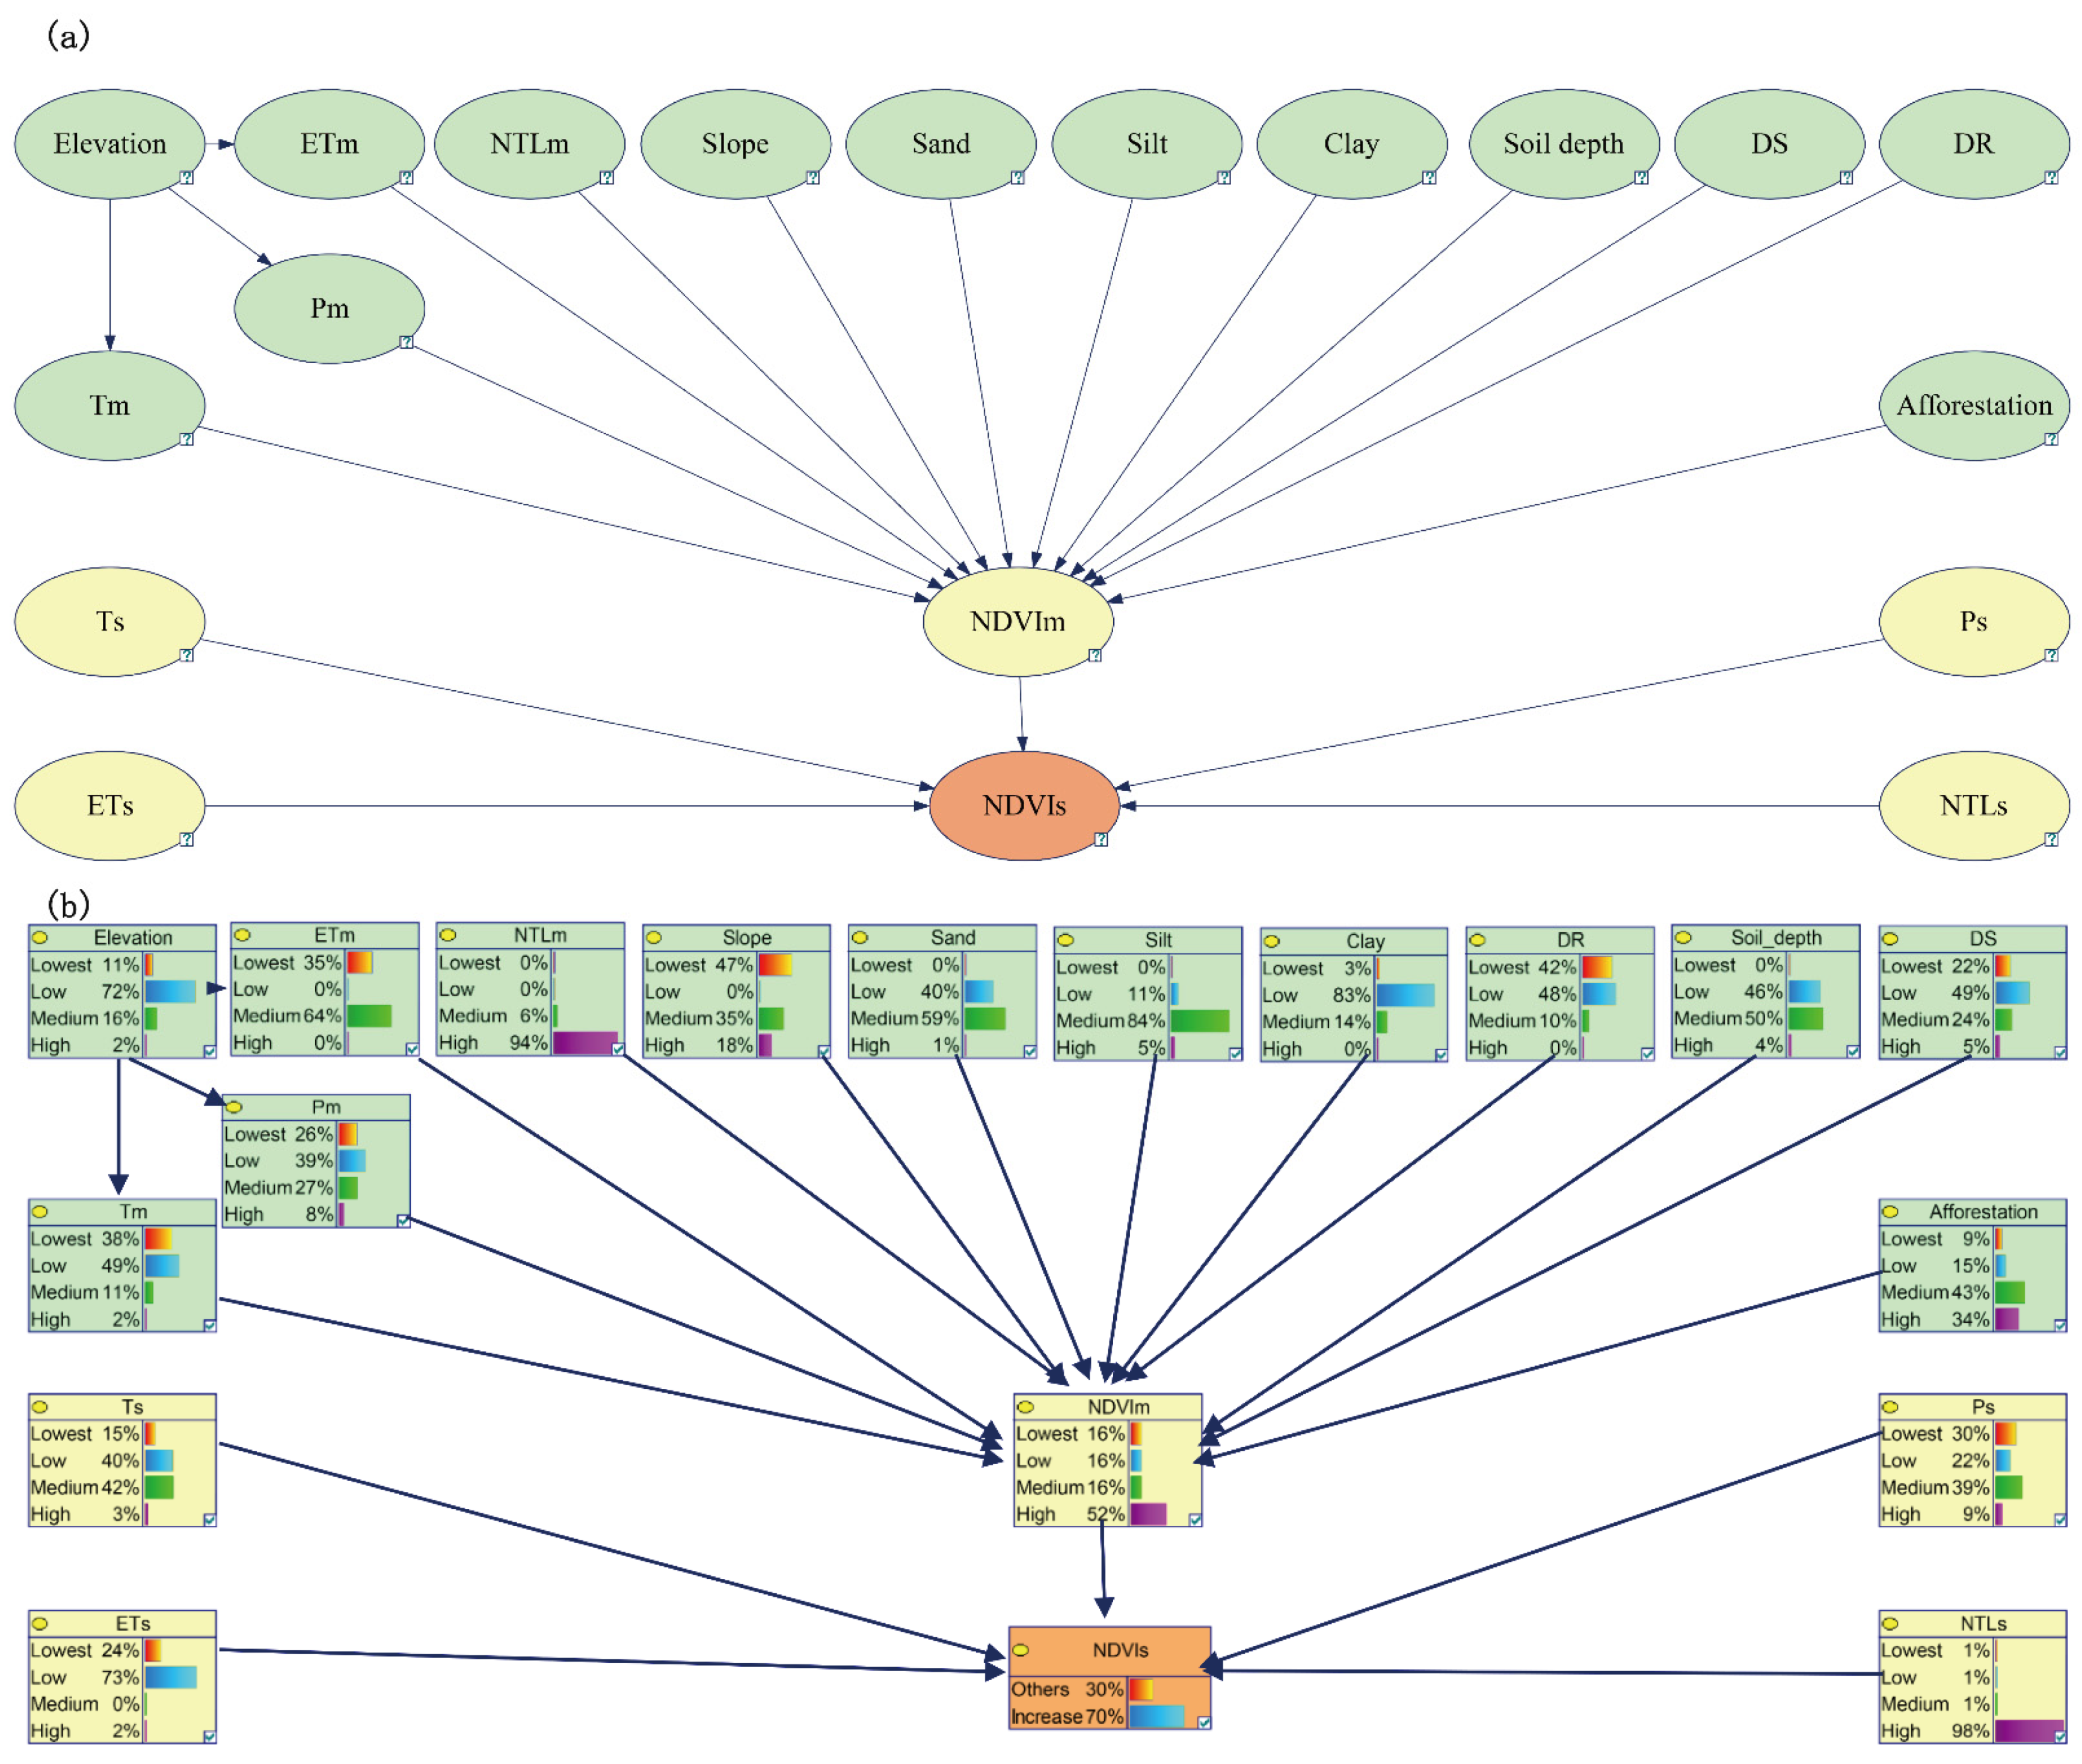
2.3.2. Model Design and Parametrization

BBN is a multivariate statistical model consisting of nodes of random variables (i.e., nodes) and the causal relationship (i.e., arrows) [28]. Each node is discretized into limited states, and the cause–effect relationship can be constructed based on related studies, empirical observations, or expert knowledge. The most significant advantage of the BBN model is that it can transfer the uncertainty of a parent node to a child node via conditional probability distribution (Equation (1)) [29]. To construct a well-designed BBN model, we used the Genie and MATLAB programs to analyze and adjust the model as detailed below.
P ( B A ) = P ( A B ) × P ( B ) P ( A )
Equation (1) expresses the conditional probability (posterior probability) of the event B based on evidence A, the conditional probability of A given B  P ( A | B ) , and the prior or marginal probability of A P ( A ) .
As the first step, correlations were calculated to identify the relationship between factors and forest restoration limiting the analysis, as shown in Figure 2. The trend of forest change was characterized by the slope of NDVI (NDVIs), and NDVIs > 0 was regarded as forest restoration. The red pixels represent a positive effect and the blue pixels represent a negative effect between two factors; the flatter the ellipse, the stronger the correlation [20]. The results imply that the selected drivers are directly or indirectly related to change in forest coverage partially.
The parameterization of the BBN model requires discretized variables. However, the selected variables are all continuous. Therefore, we need to select an appropriate method to discretize these variables. The frequency ratio (FR) can be used to rank the driving factors based on the susceptibility of each attribute interval of the factor to the event (Equation (2)). Then, the intervals with similar frequency ratios can be merged to realize the scientific division of indicator factor status, which provides a more reliable prior probability for the nodes in the BBN model [20]. Therefore, the 18 potential factors were divided into four levels using FR models (Table 2), and a sample file with a training set (n = 75,762; 80%) and a testing set (n = 18,940; 20%) was generated. Based on the training set, the conditional probability distribution of each variable was obtained via the parameterization.
F R = a / b ( % ) c / d ( % )
where a represents the number of forest restorations associated with each driving factor, b is the total number of forest restorations, c is the number of pixels in a given driving factor, and d is the total pixel number in the study area.

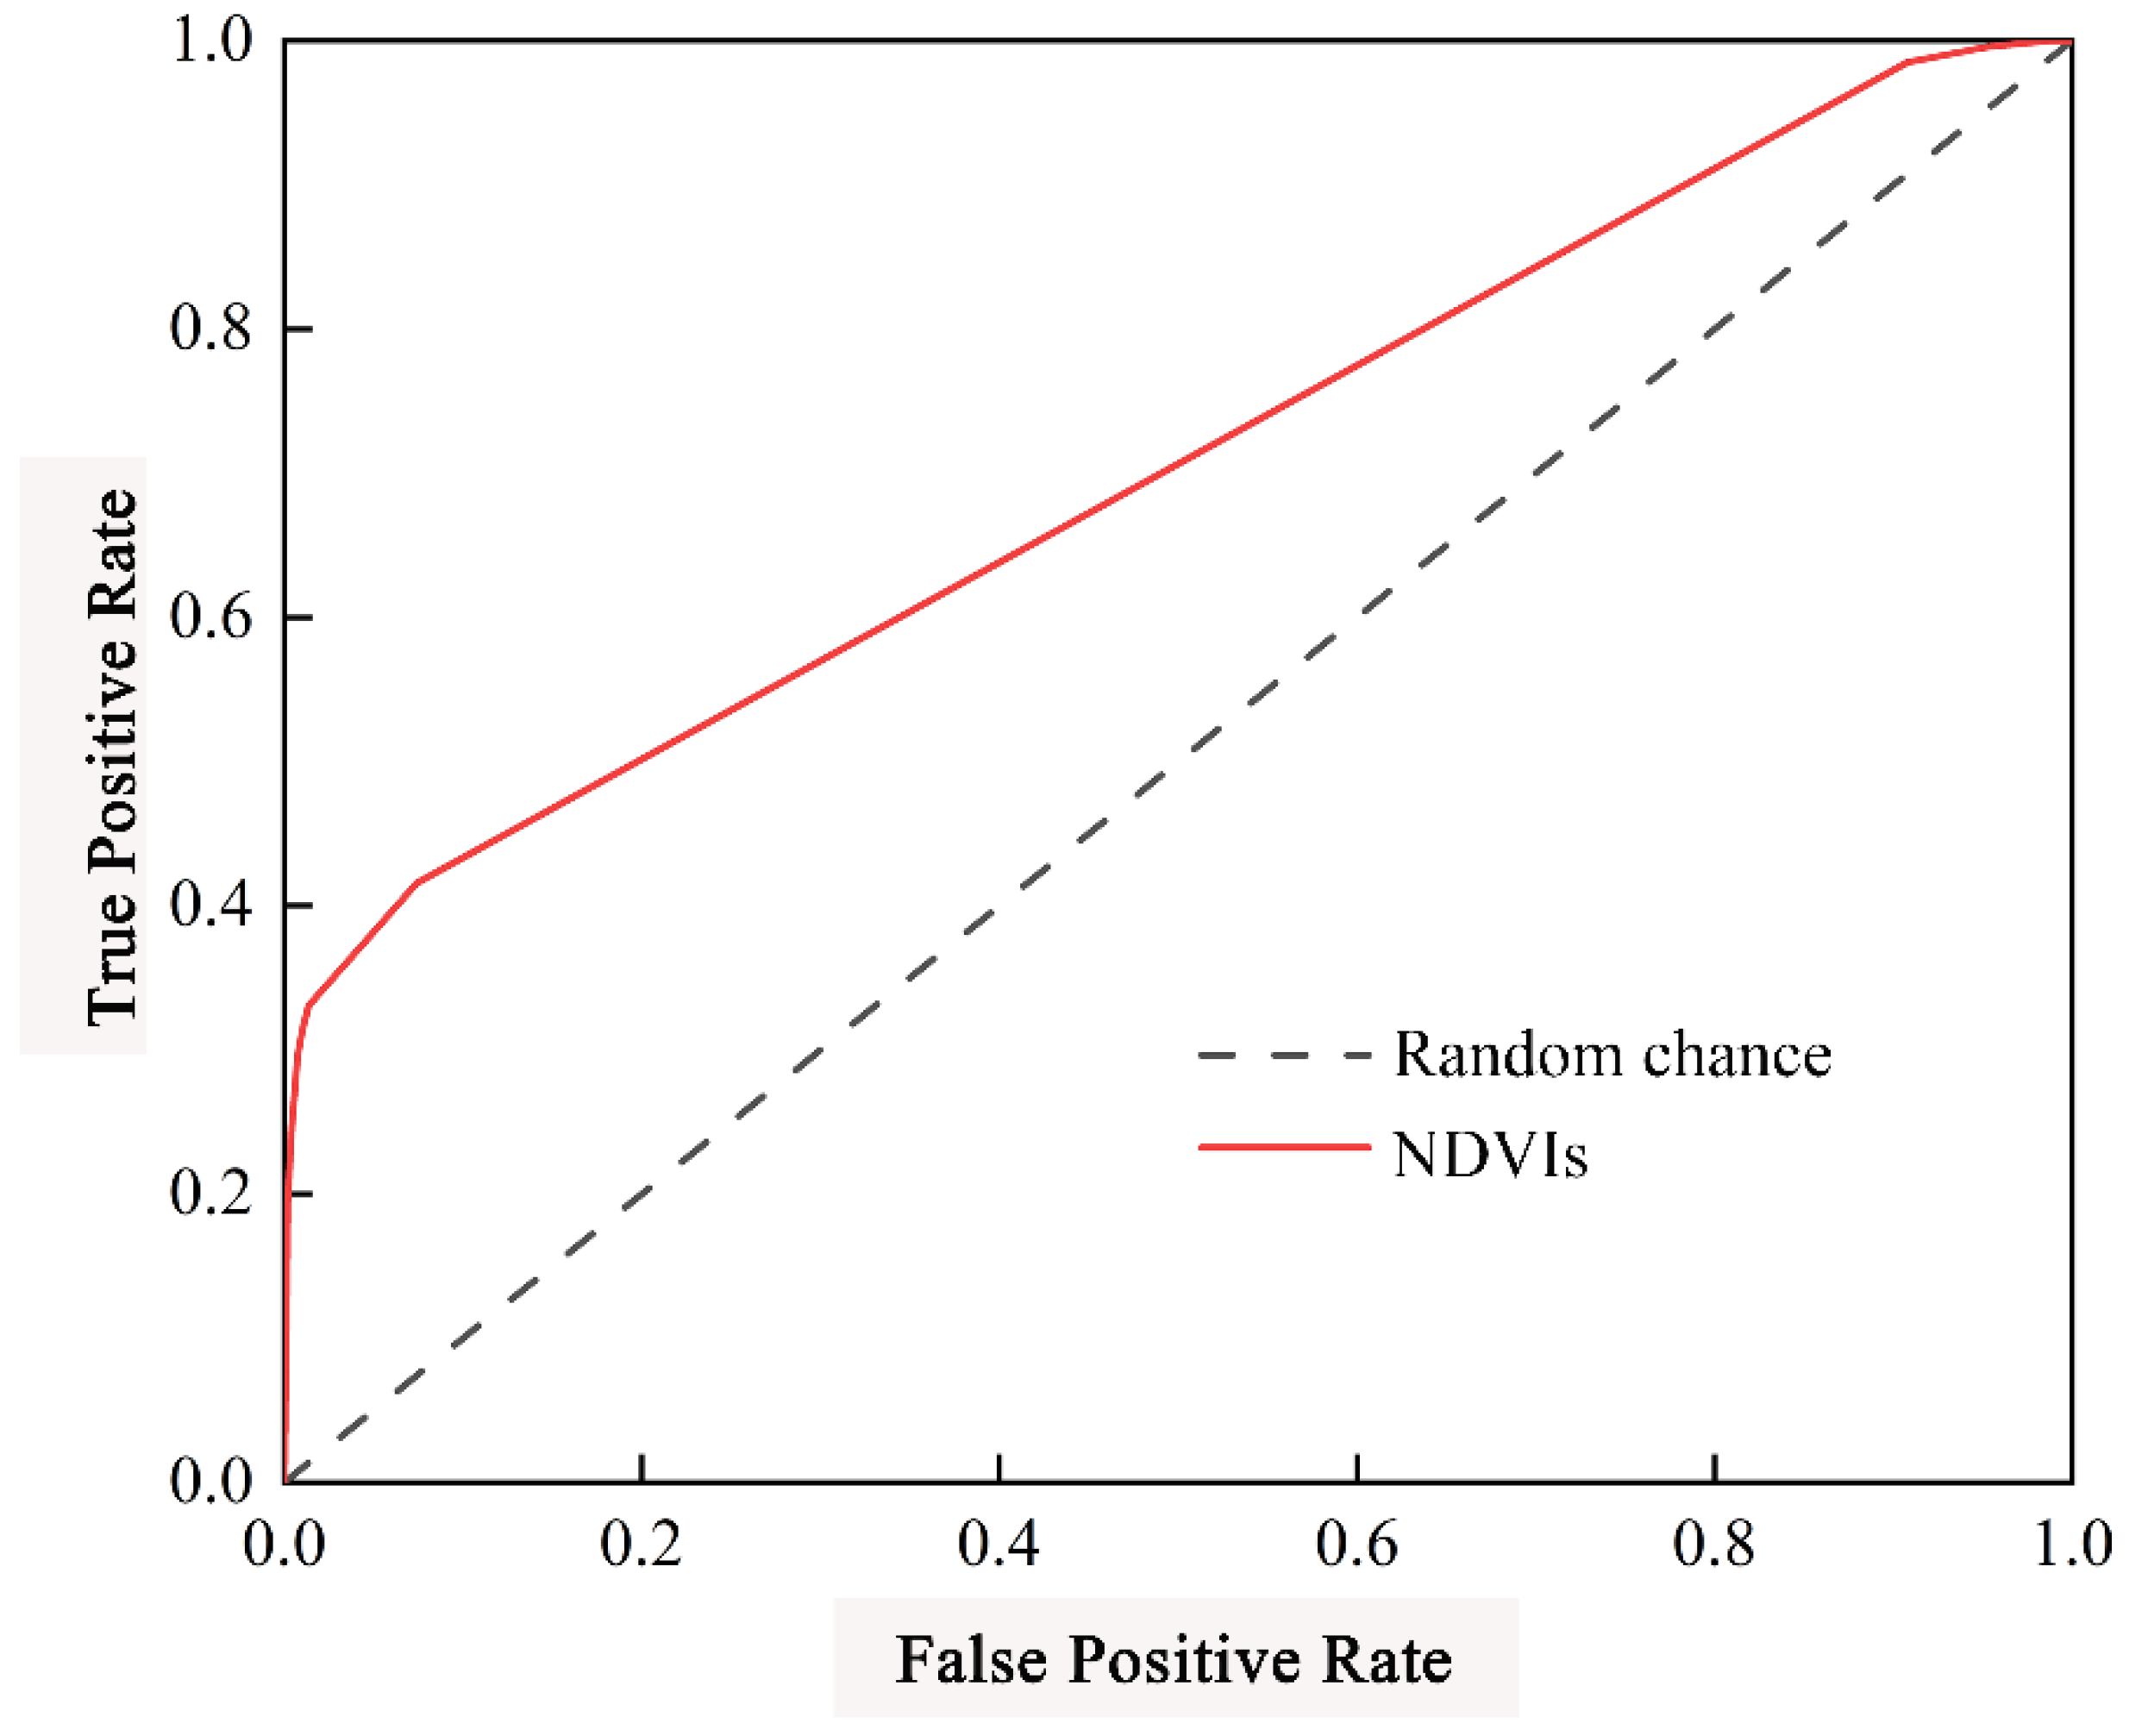
2.3.3. Model Validation and Implementation

To evaluate model performance, the confusion matrix and receiver operating characteristic (ROC) curve were calculated based on the testing set. The confusion matrix determines the overall accuracy of the prediction by comparing the true value with the predicted value [30]. The ROC curve provides a threshold-independent assessment that is used to appraise the judgment by calculating the area under the curve (AUC). The ROC curve is demarcated based on the value of the AUC, e.g., a value between 0.9 and 1.0 for the AUC indicates excellent model performance, and 0.8–0.9, 0.7–0.8, 0.6–0.7 and 0.5–0.6 indicate good, fair, poor, and fail, respectively [31].
To determine the key factors predicting forestland restoration, a sensitivity analysis was conducted. The control variable is relatively important to the target node. In this study, the variance of belief (VB) and mutual information (MI) were used to determinate the significance of each variable [32]. The VB and MI are calculated as follows:
V B = V ( S ) V ( S I ) = Σ S P ( S ) × ( S E ( S ) ) 2 Σ S P ( S I ) × ( S E ( S I ) ) 2
M I = H ( S ) H ( S I ) = Σ s Σ i P ( s , i ) log 2 ( P ( s , i ) P ( s ) × P ( i ) )
where S is the target node, I is other node, and s and i represent the states of S and I, respectively. The larger the value of VB and MI, the stronger the influence of other nodes on the target node.
Based on the sensitivity analysis, variables with higher sensitivities (VB > 0.1%) were selected as the key variables [20]. Furthermore, the selected key variables, as evidence variables, were incorporated into the model to evaluate the restoration probability of forest areas under uncertain conditions. In addition, to determine the effect of geomorphological features on the probability of forest restoration, the probability of forest restoration in karst and non-karst regions at the grid and regional scales was analyzed.

3. Results

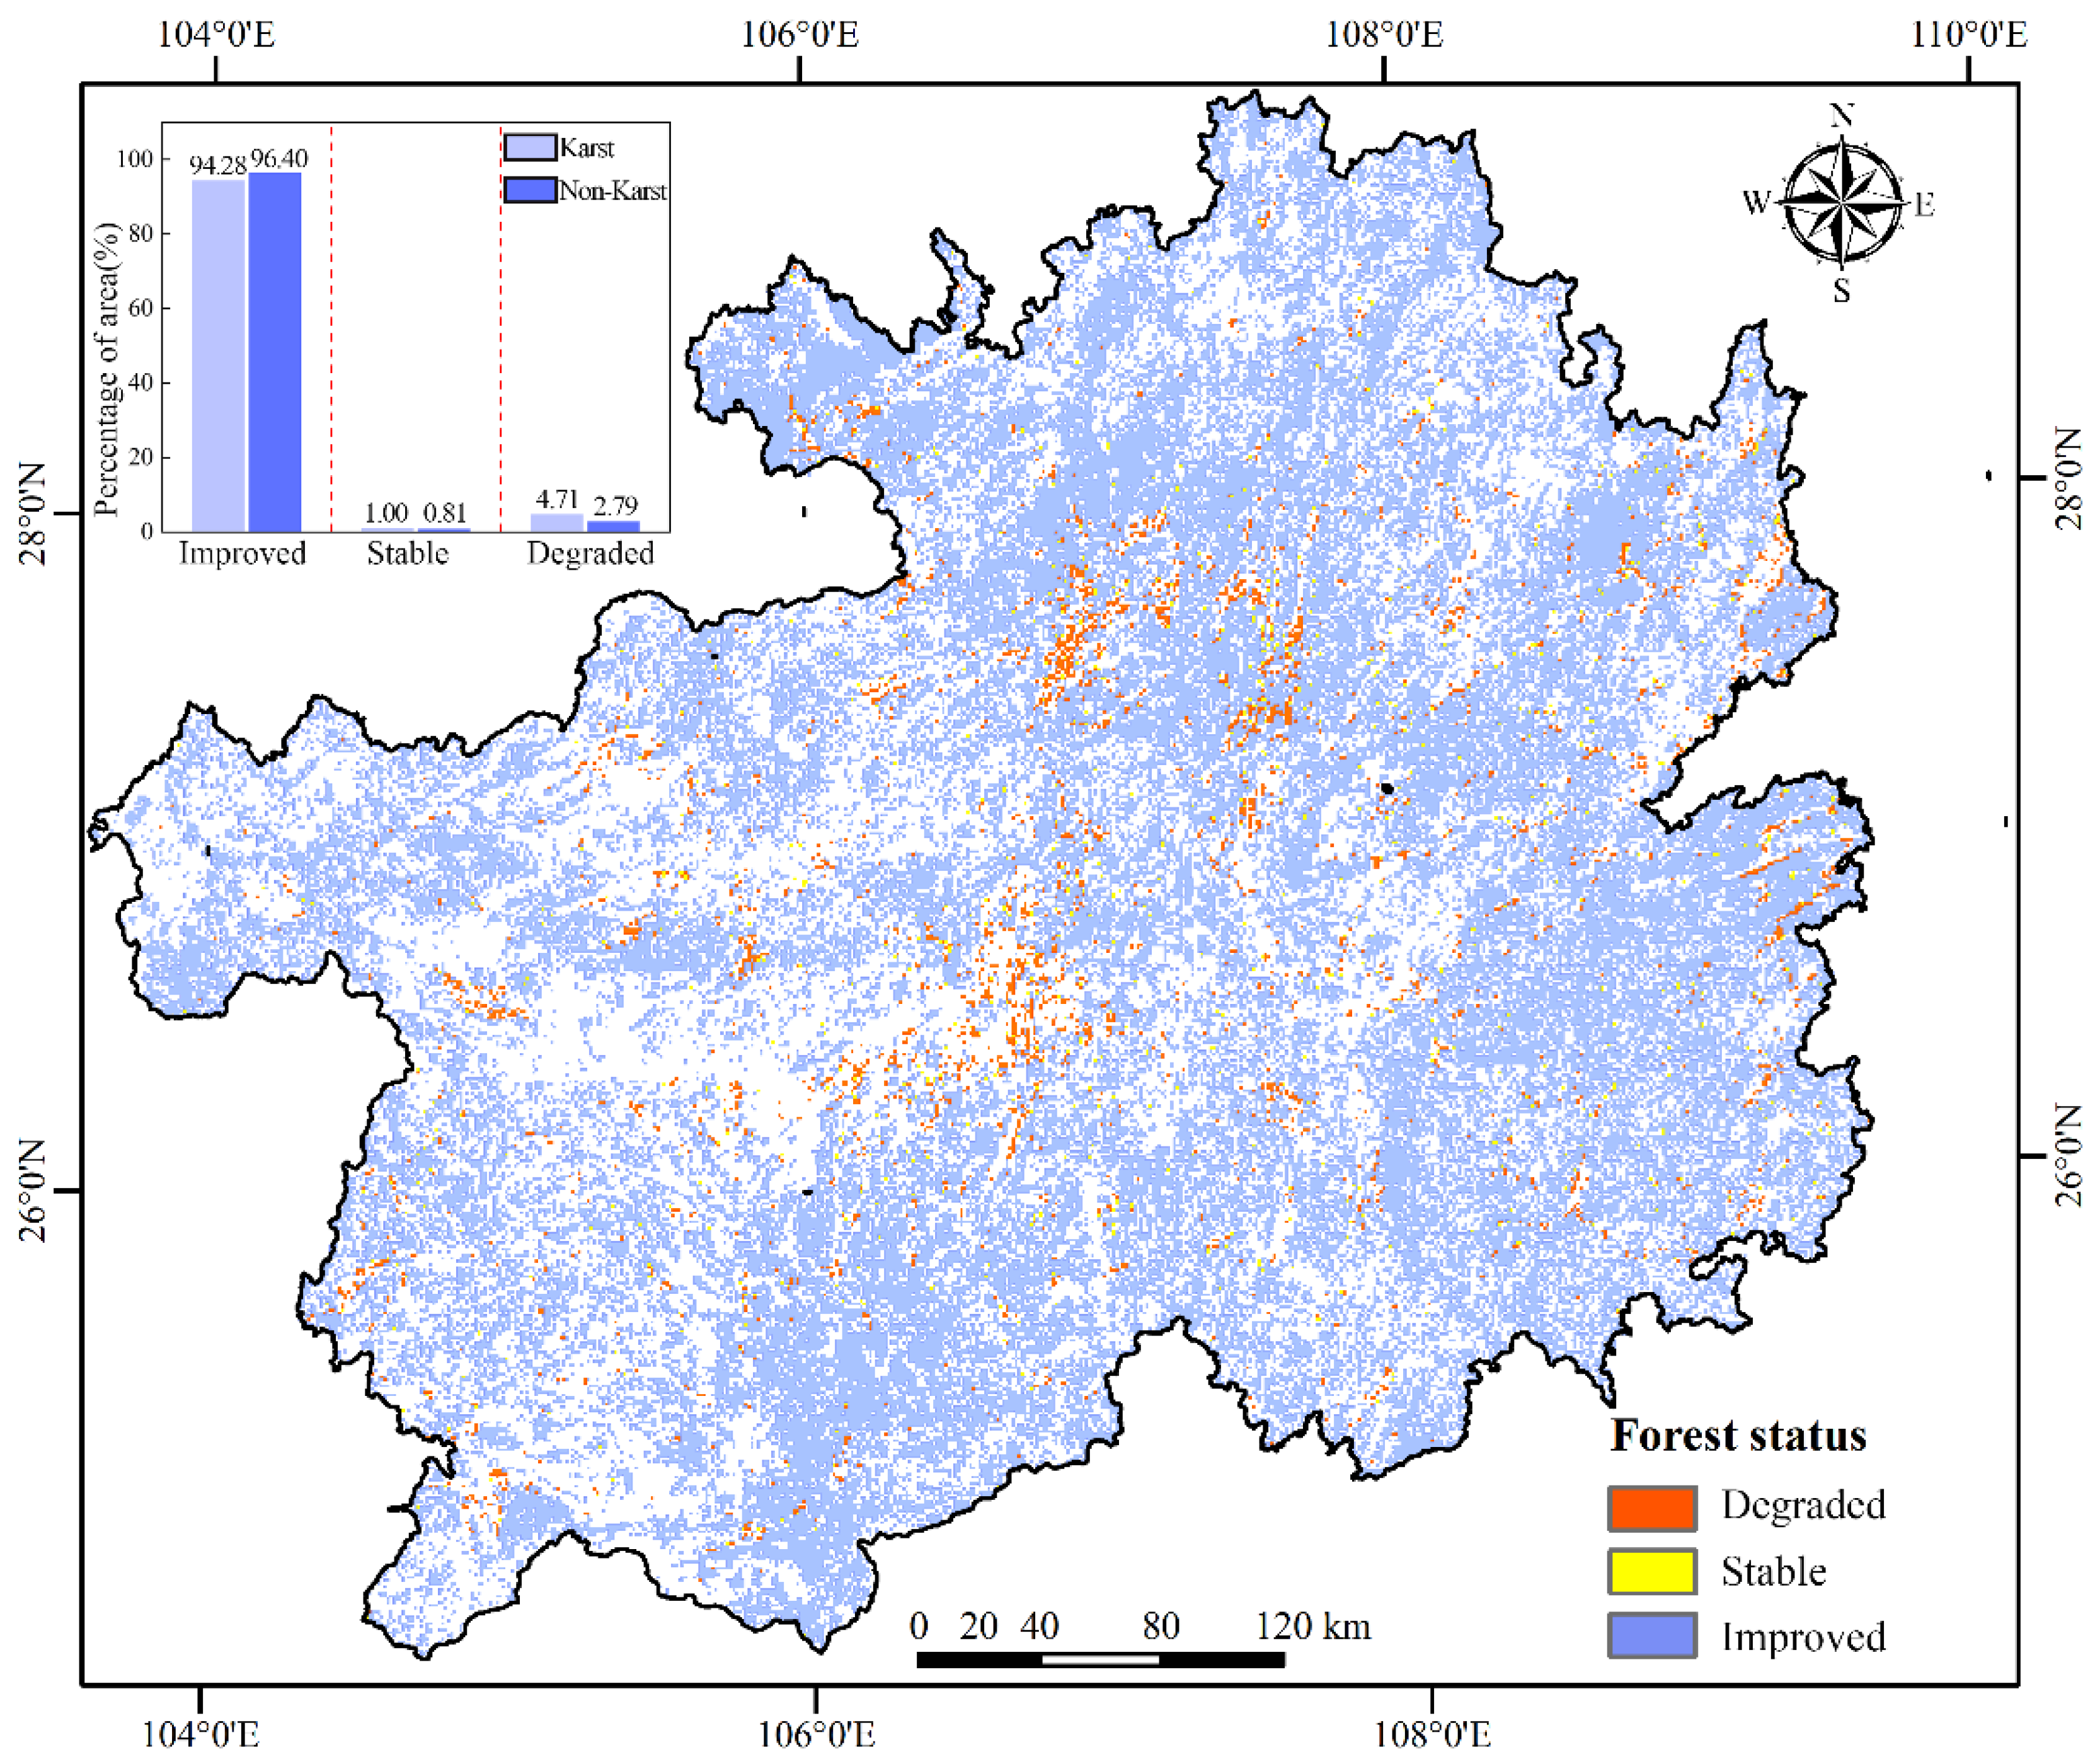
3.1. Analysis of Forest Areas

Between 2005 and 2018, the annual NDVI of forest grids in the study area exhibited a growth trend (Figure 3), indicating statistically significant improvement in forest coverage. Quantitatively, the improved forest area was 90,130 km2, including 71.36% significant improvement and 23.82% insignificant improvement. The combined stable and degraded area was only 4572 km2. As shown in Figure 3, regions with stable and degraded forests were relatively concentrated in the middle region of the Guizhou Province. Further, the proportion of forest restoration in non-karst regions (96.40%) differed slightly from that of karst regions (94.28%), while ecological vulnerability varied significantly between the two regions. This result could be attributed to ecological restoration, including control of stony desertification in karst regions.

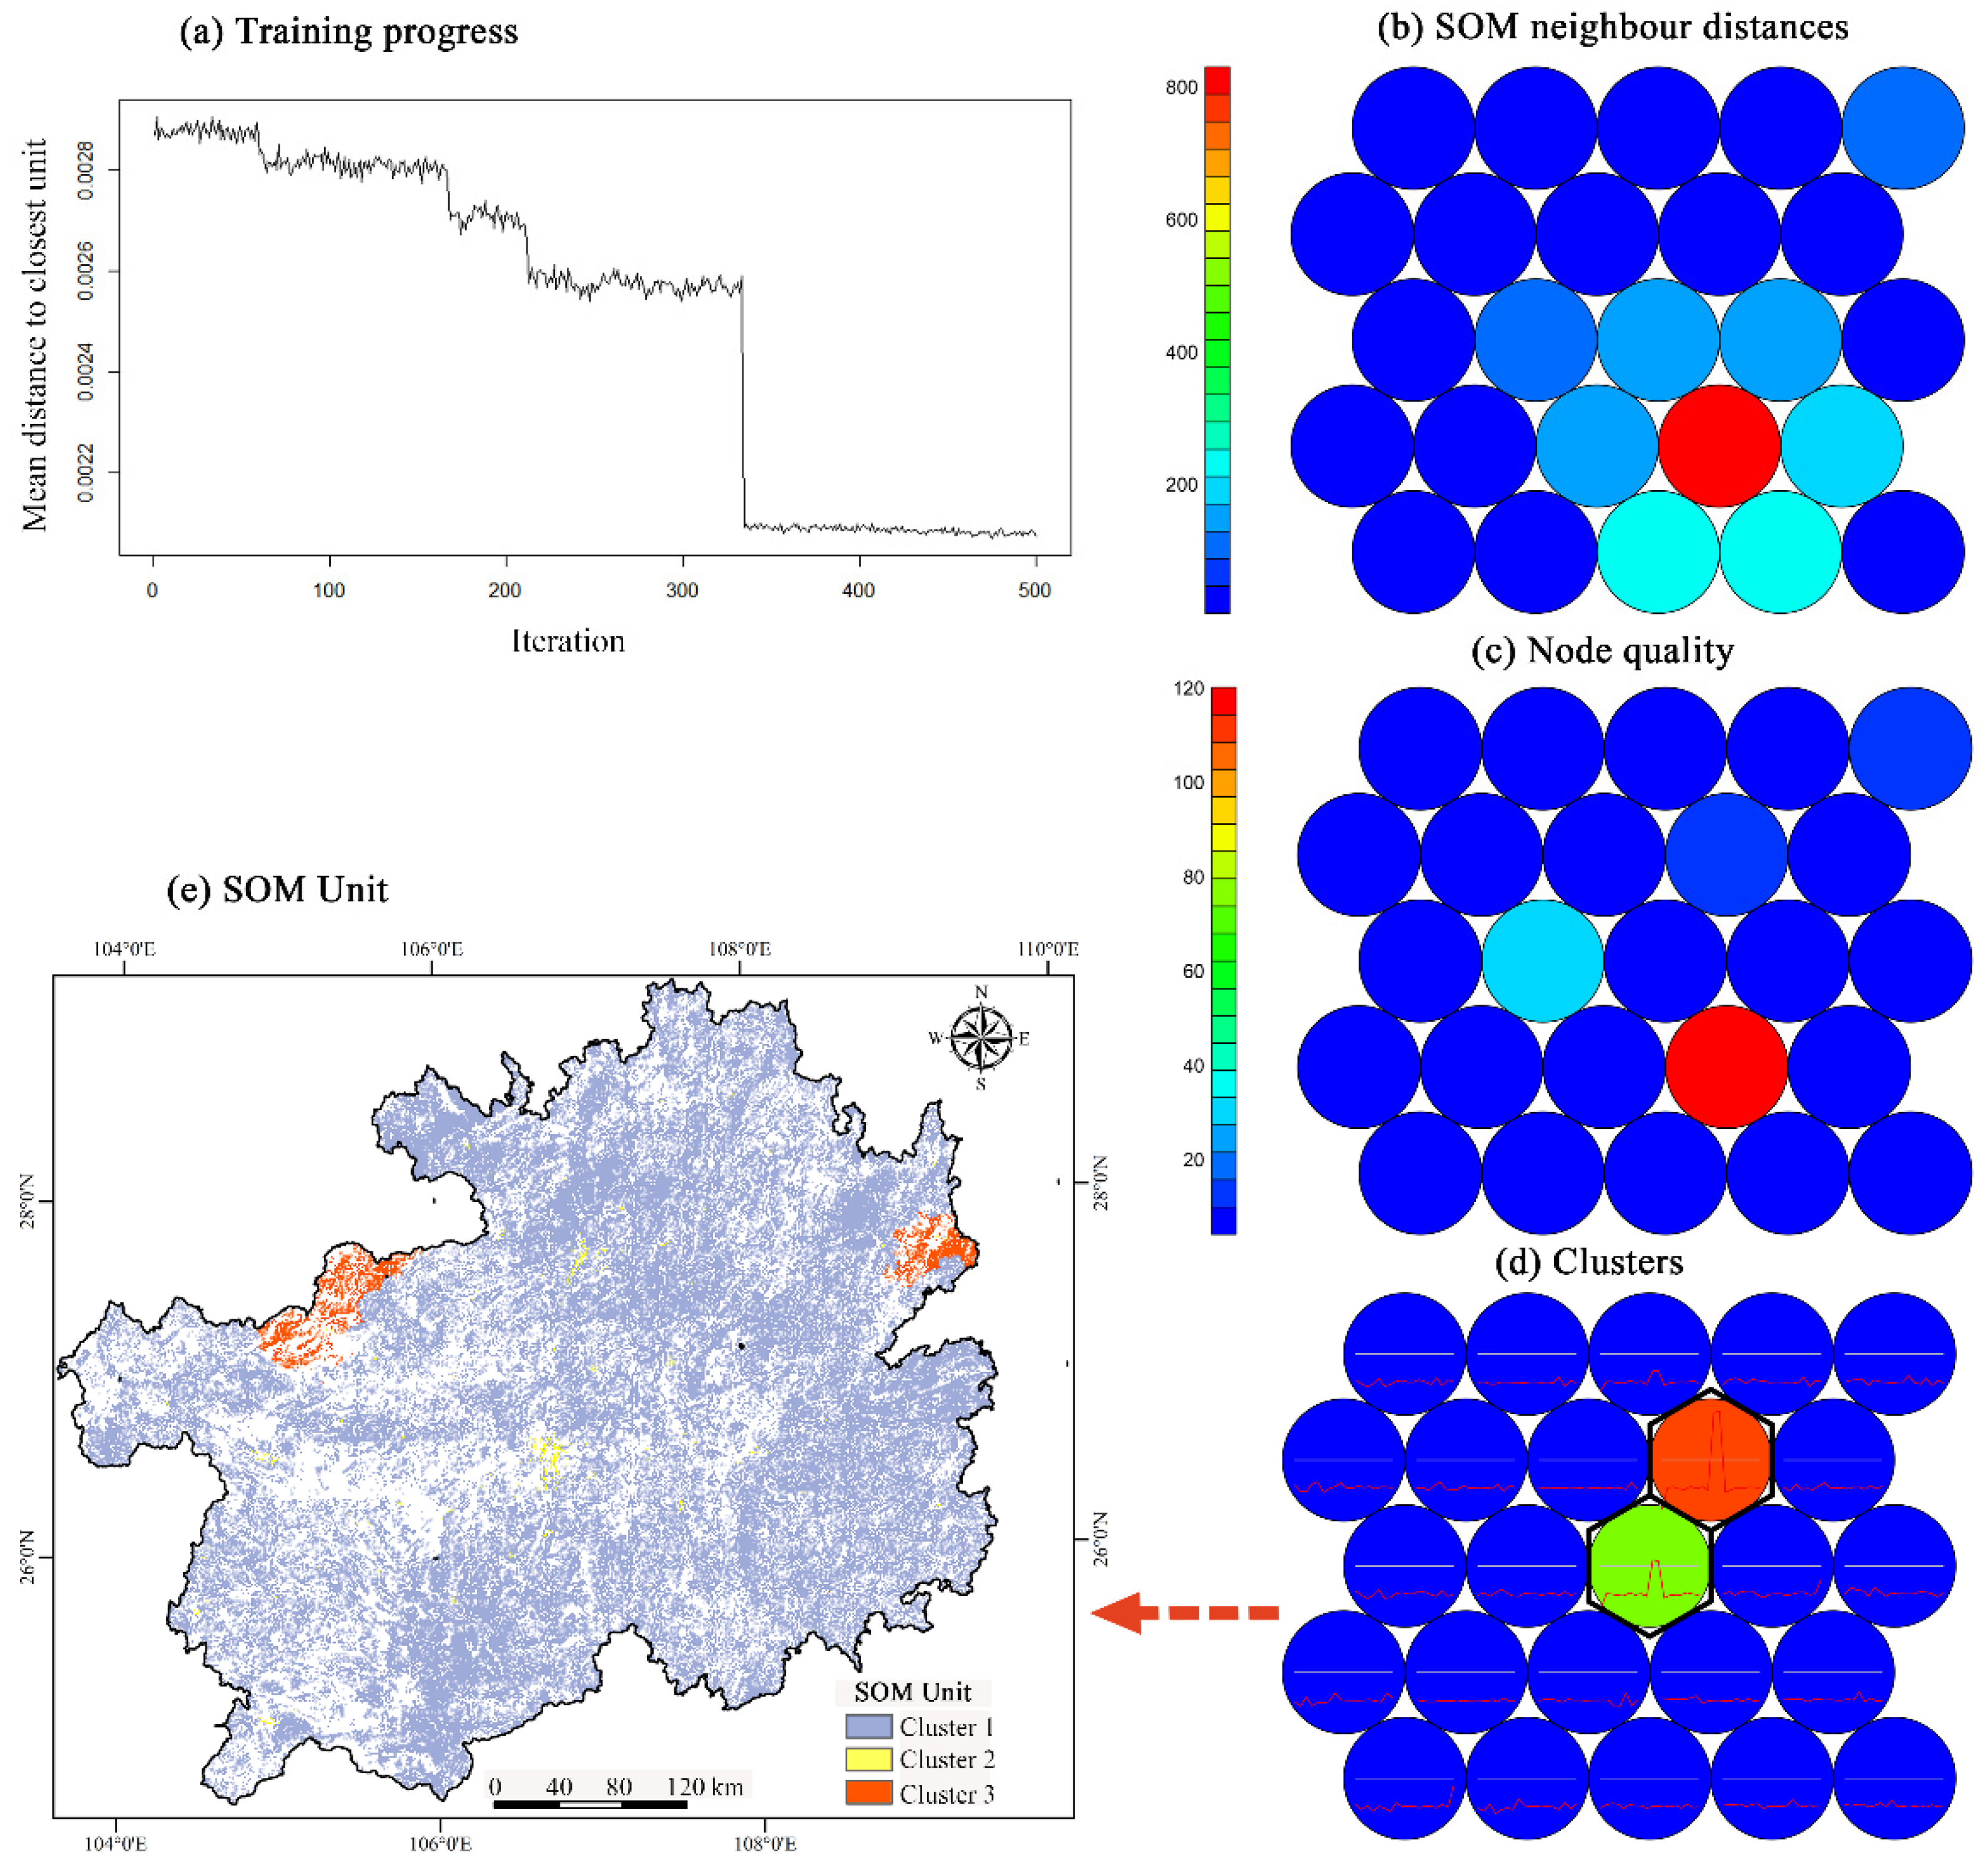
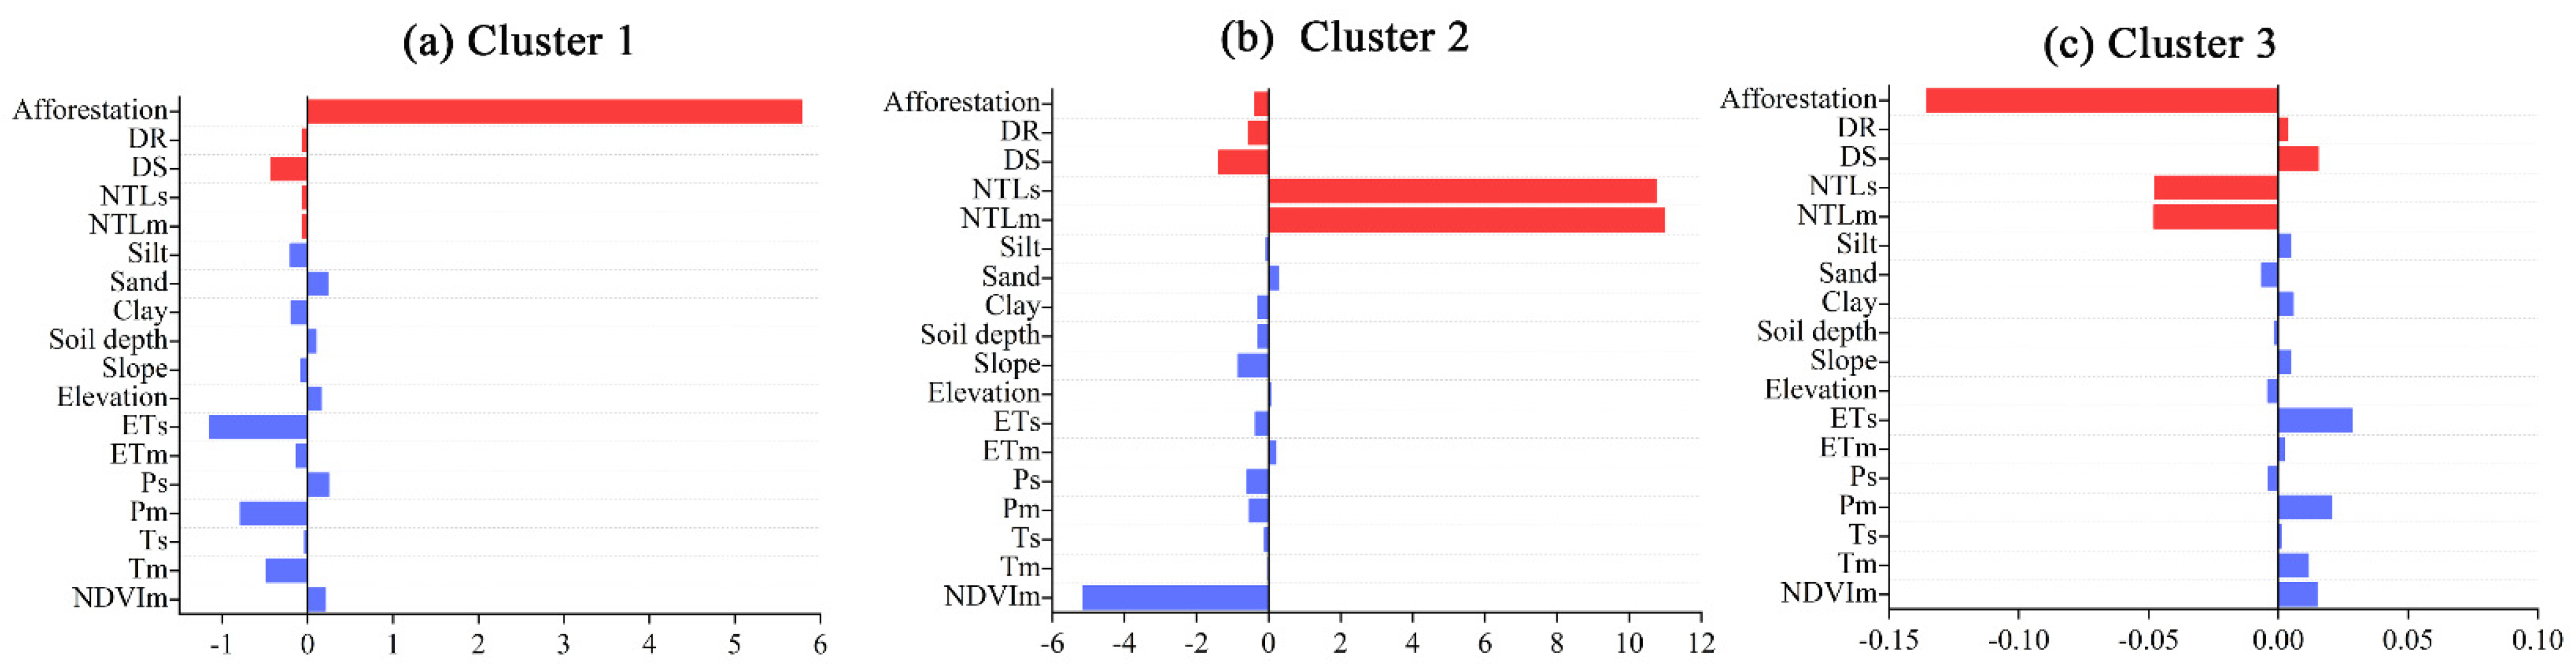
3.2. Characteristics of Socio-Environmental Archetypes

To further explore the spatial distribution of driving factors and the effects of their interactions on forest coverage, and to obtain a priori knowledge for constructing the BBN model to predict the forest restoration, the SOM method was used for spatial clustering and regional recognition of monitoring data, as shown in Figure 3. As shown in Figure 4a, 18 driving factors associated with forest variation reached the point of convergence after about 320 iterative analyses. As shown in Figure 4b, the proximity between the clusters indicates similarities and differences among the clustering units. Blue denotes a small distance and red indicates a large distance. A smaller distance between nodes in the cluster indicates higher similarity, while a larger distance indicates greater differences. As shown in Figure 4b, all clusters were divided into five types, according to differences between nodes in the cluster. A single red cluster shows large differences between the cluster nodes, whereas 16 blue clusters show similar characteristics. The average distance between observed samples in the cluster and the center of the cluster is depicted in Figure 4c. Blue denotes a small mean distance, while red denotes a large mean distance. The smaller distance represents an ideal clustering effect. As shown in Figure 4c, 23 blue clusters exhibit small distances and the other two clusters (red and baby blue) show large distances.
The results of clustering involving the driving factors of forest variations reveal three socio-environmental archetypes (Figure 4d). The spatial distributions and characteristics of these three archetypes are shown in Figure 4e and Figure 5. Archetype 1 is mainly controlled by the afforestation area (64.23%) and represents a high-strength and dominant ecological archetype, covering a total area of 92,182 km2. It mainly occurs in regions with large afforestation areas. Improved, stable, and degraded areas constitute 95.4, 0.9, and 3.5% of the total area, respectively (Figure 5a). Archetype 2 is mainly influenced by high NTLs/NTLm and low NDVIm (81.82%), and the area only covers 338 km2. Specifically, improved, stable, and degraded archetypes account for 17.1, 1.7, and 81.2% of the total area, respectively. It is a high-strength and predominantly human archetype and mainly occurs in regions with strong human interference and activity (Figure 5b), such as those involving urban construction and dense population. Archetype 3 only accounts for 2.3% of the study area, with afforestation areas and NTLs/NTLm accounting for 55.55% of the dominant area (Figure 5c). In this region, few disturbances related to human activities occur, and the ecological quality is relatively poor. It is a typical marginal archetype. The potential for afforestation in this area is limited and low-intensity human activities facilitate forest restoration, with 93.9, 0.8, and 5.2% of the total area showing improved, stable, and degraded conditions, respectively.

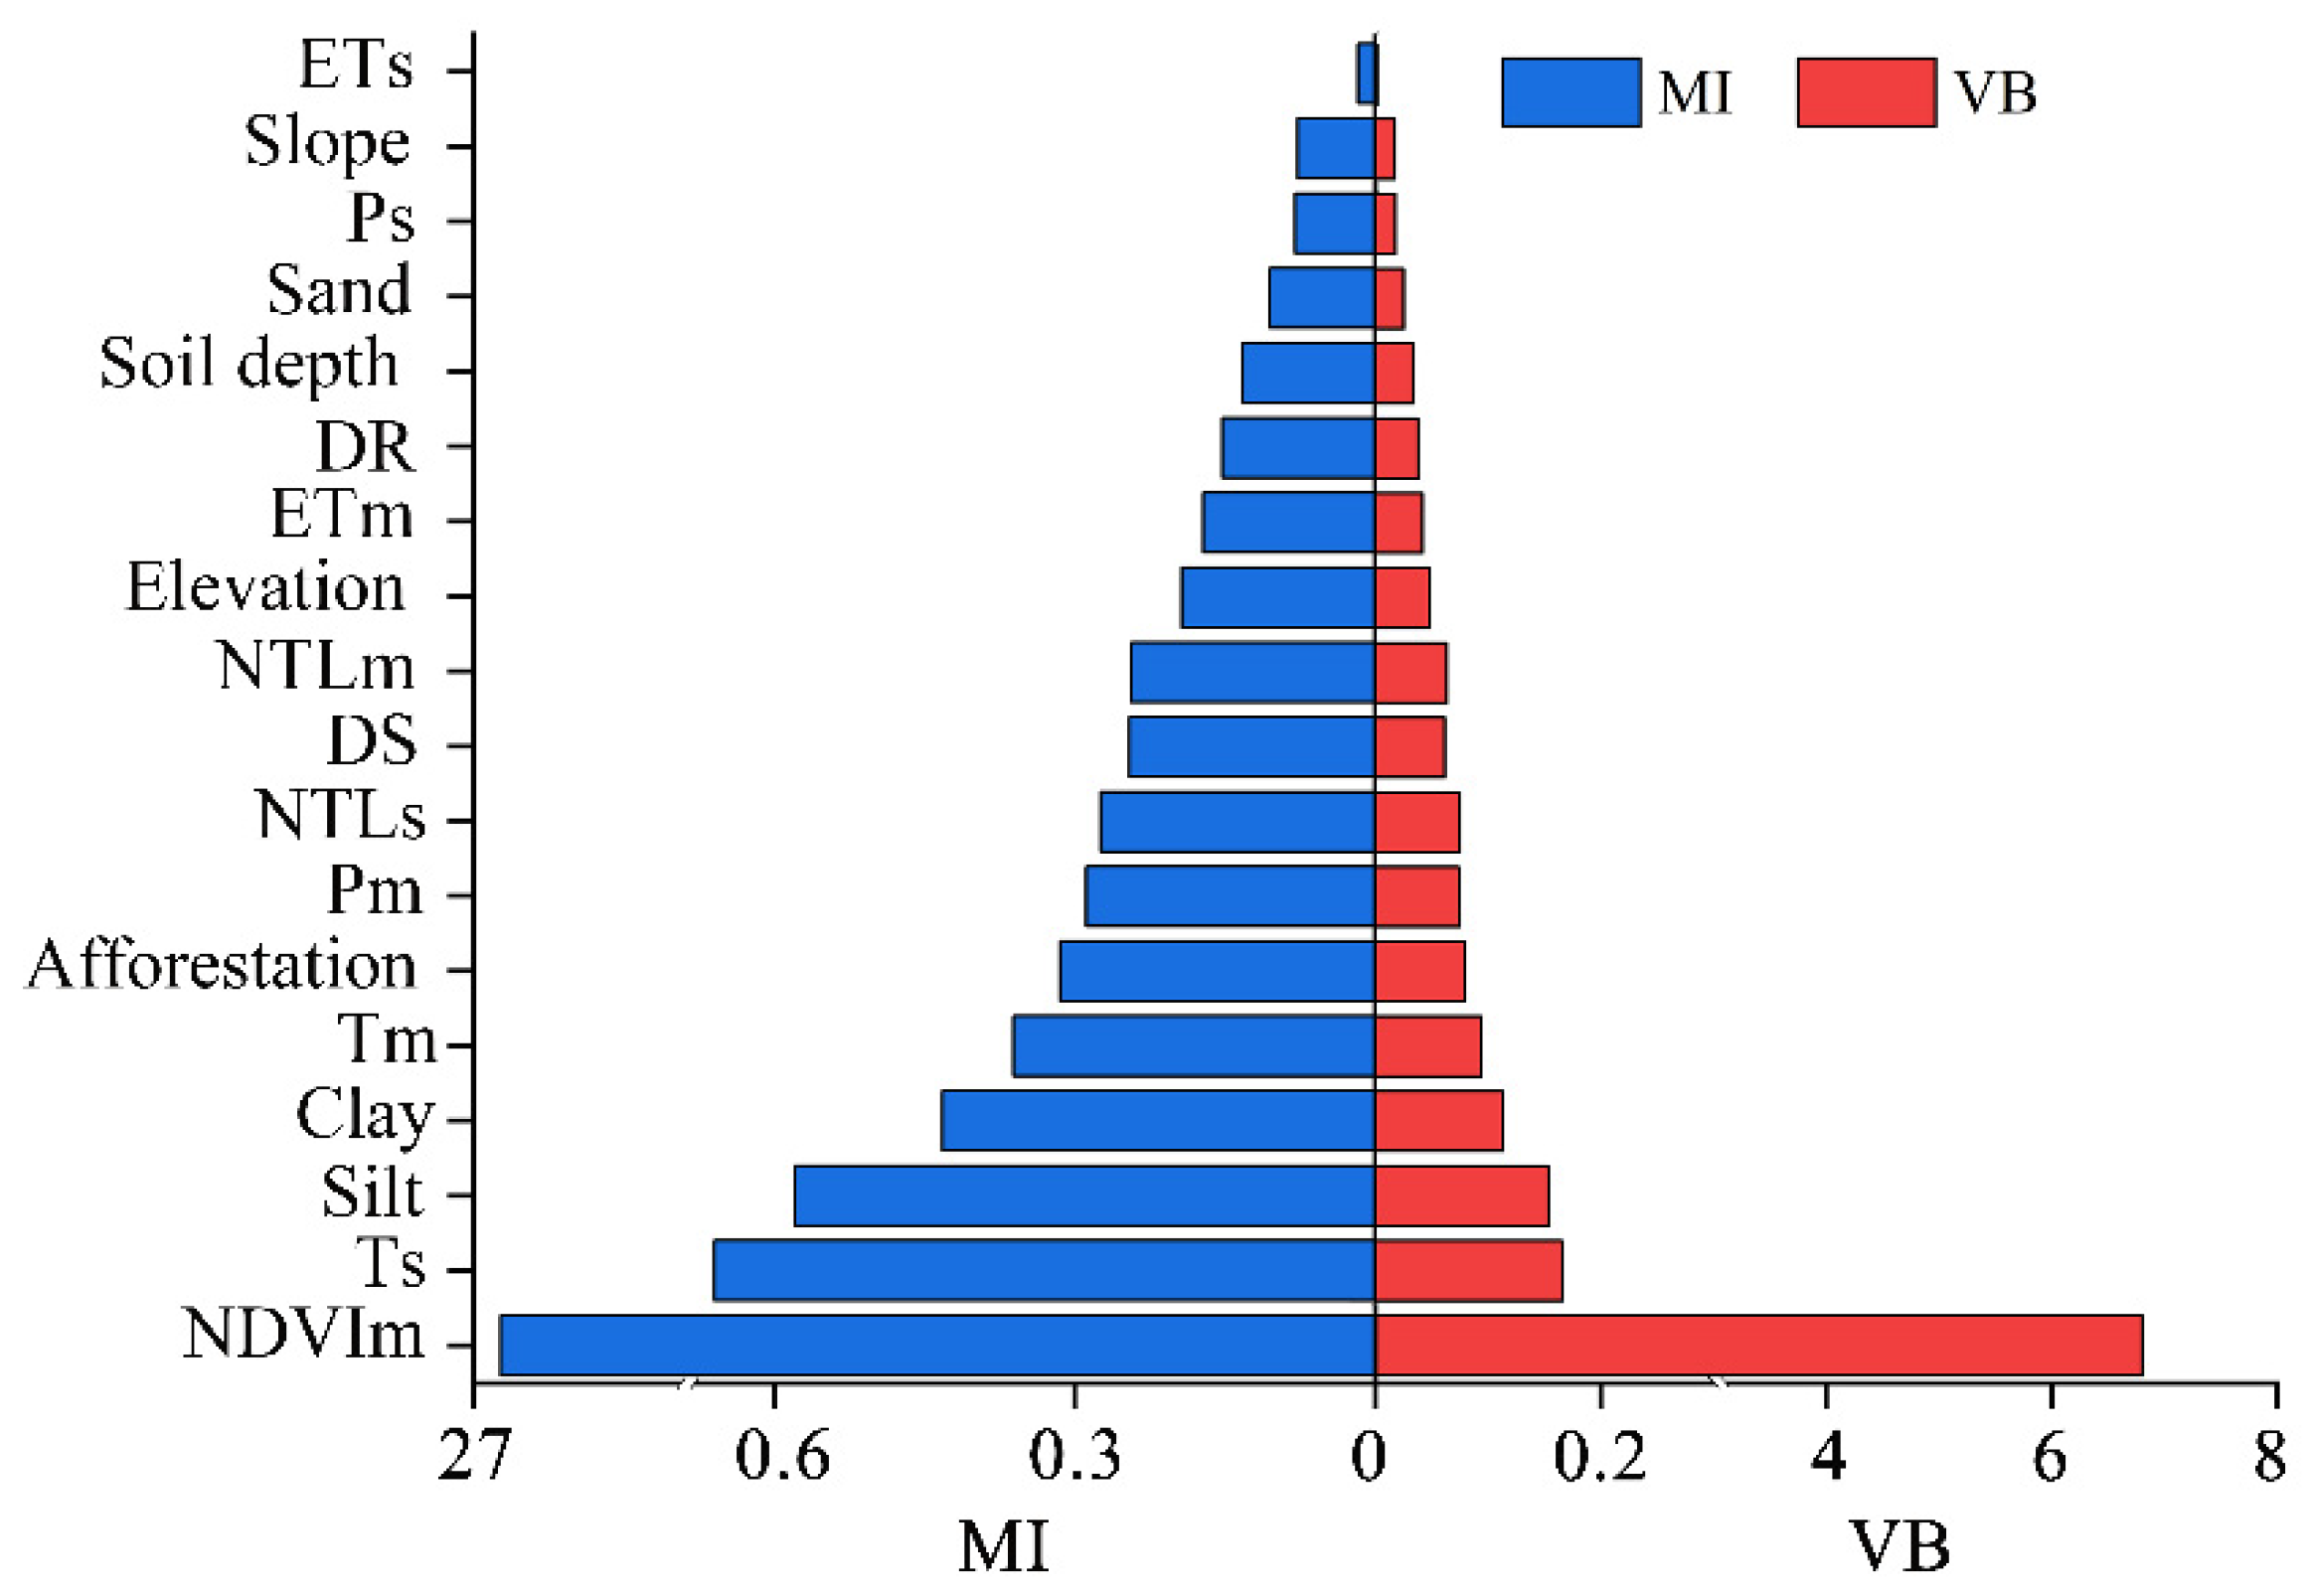
3.3. Parameter Learning and Model Validation

The BBN model shown in Figure 6a was constructed using the results obtained from the correlations and the SOM algorithm. The driving factors were discretized based on the FR model (Table 2); 80% of the samples were then randomly selected to parametrize nodes in the BBN conceptual model (see the result in Figure 6b). The remaining 20% of the driving factors in the test set were fed into the network. The accuracy of the BBN model for forest restoration evaluation was evaluated using the confusion matrix and ROC curve. The overall accuracy of the model was 95.95% and the AUC value was 70.16% (p < 0.05) (Figure 7) establishing that the BBN mode has a reasonable structure and exhibits adequate recognition of forest changes. Therefore, it can be used to predict forest variation states in the future.

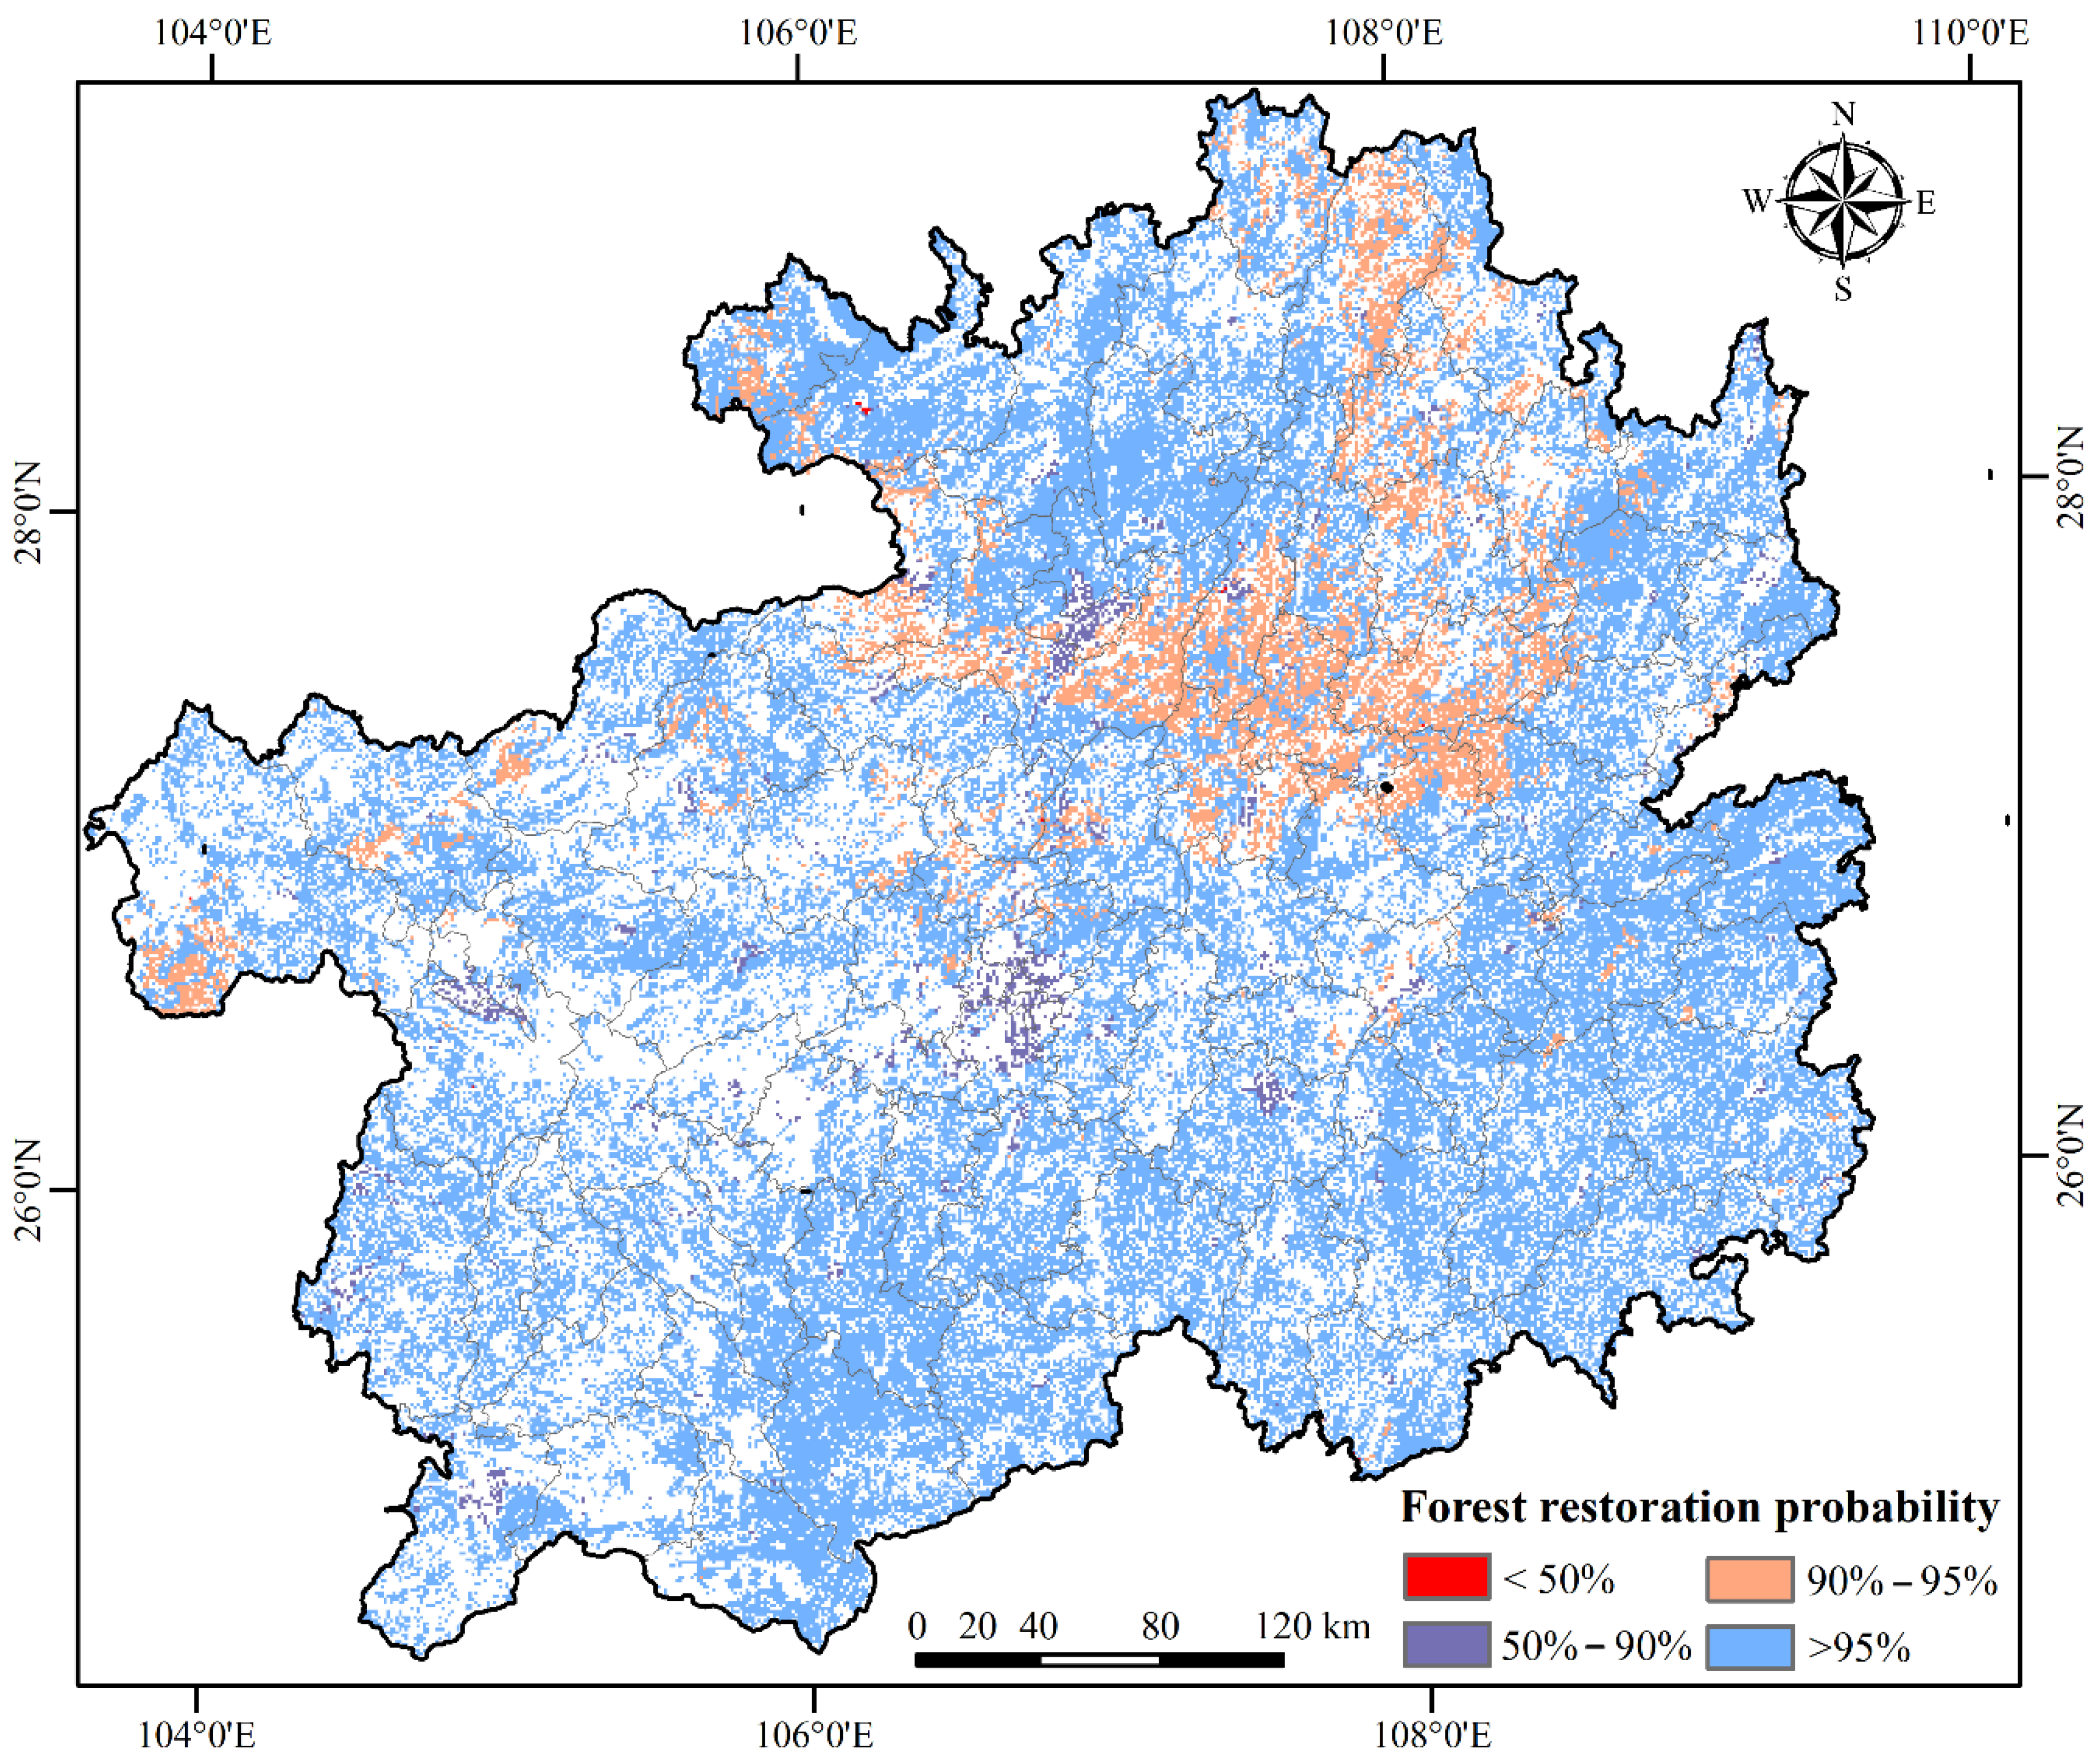
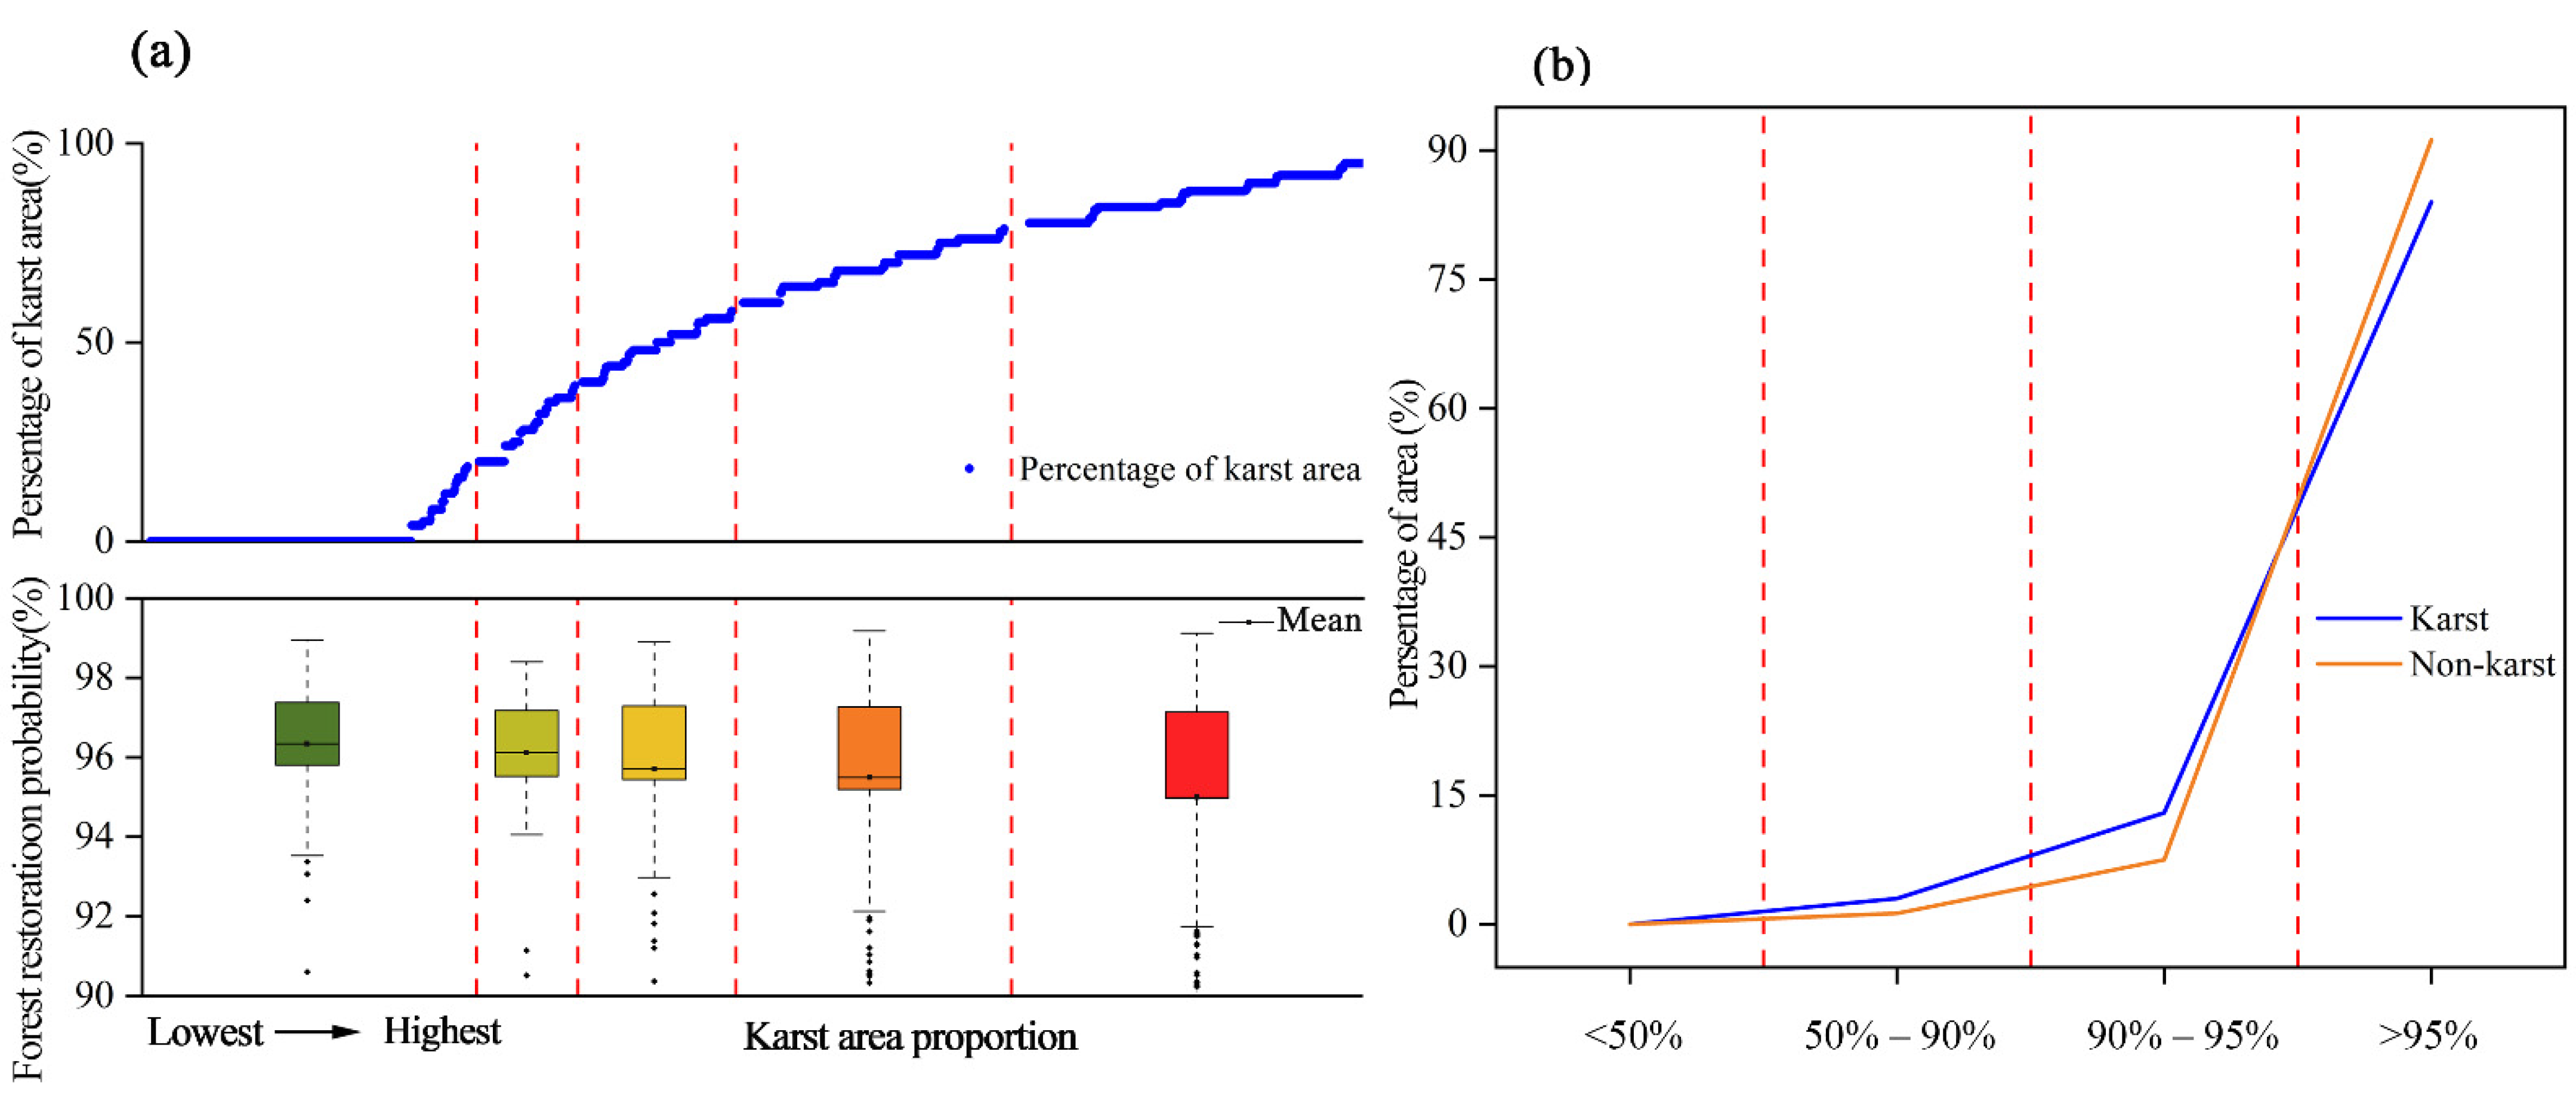
3.4. Prediction of Forest-Restoration Probability

The parameter sensitivity underlying changes in forest coverage in the BBN model was analyzed. The results are shown in Figure 8. The higher the VB or MI, the higher the sensitivity of the node variables to forest changes. Key variables that greatly influence forest changes were recognized according to the MI and VI parameters (VB > 0.1%) including NDVIm, Ts, Silt, Clay, Tm, and afforestation, which were chosen as key variables to predict the forest restoration probability of grid units. The results demonstrate that the forest restoration probability of the study area ranged from 22.27 to 99.29%. Based on the classification of the forest restoration probability into lowest (p < 50%), low (50% < p < 90%), medium (90% < p < 95%), and high (p > 95%), the spatial distribution of the forest-restoration probability in Guizhou Province was evaluated (Figure 9). According to the predicted results, the probability of forest restoration in the study area was generally medium to high; it was generally higher and the local ecological environment was greatly improved. Given the spatial distribution, the regions at the lowest level were mainly located in the Honghuagang distract and Longli county, dominated by karst topography.
To further elucidate the effects of geological landforms in karst regions on local forest restoration, a statistical analysis of the forest restoration probabilities in karst and non-karst regions was carried out at the grid and regional scale. Based on the landform characteristics of the study area, the grid unit of 10 km was finally used. The proportion and probability of forest restoration (expressed as mean values) of karst landforms in each grid were counted (Figure 10A). The proportion of karst area on a grid scale ranged from 0 to 100%. Grids were divided into the lowest, low, medium, high, and the highest categories, according to the proportion of the karst area. The probability of forest restoration in the grids ranged between 93.75 and 99.23%. Specifically, the means of the forest restoration probability corresponding to the lowest, low, medium, high, and the highest categories were 6.30, 96.20, 95.66, 95.46, and 95.05%, respectively. Therefore, the probability of forest restoration is negatively correlated with the proportion of karst areas in the grids. The proportions of areas with different levels of restoration probability in karst and non-karst regions are shown in Figure 10B. The mean forest restoration probabilities in the karst and non-karst regions were 95.44 and 96.03%, respectively. Further, a high restoration probability (p > 95%) was dominant and associated with only small differences. However, the forest restoration with low probability (p < 95%) in karst areas was significantly higher than in the non-karst areas, while the area of forest restoration with high probability (p > 95%) in non-karst areas was significantly lower than in karst areas. Forest restoration probability is a measure of the positive impact on the confidence level. In essence, the probability reflects uncertainty [20]; therefore, the results must be understood based on probability theory rather than as the simple area proportion.

4. Discussion

4.1. Driving Forces Based on Socio-Environmental Archetypes

Consistent with the conclusions underlying changes in vegetation in the karst regions of Southwest China [12,33,34], this study determined that the overall forest coverage in the study area improved steadily. Specifically, the proportion of improved forest status in non-karst regions (96.40%) was slightly larger than in karst areas (94.28%), which does not suggest an obvious difference. Owing to the unique hydrogeological structures of the karst regions in Guizhou Province, the vegetation is relatively vulnerable and sensitive to land degradation, including stony desertification. Therefore, theoretically, forest restoration in karst regions is significantly more difficult than in non-karst regions [35]. However, this study revealed small differences in the effects of forest restoration, indicating that ecological engineering is one of the significant factors underlying land degradation.
Based on the spatial distribution and the interactions between factors underlying changes in forest coverage, the driving factors were clustered using the SOM algorithm. This algorithm can recognize the spatial combination of different factors and corresponding changes in forest coverage, which are significant for stakeholders implementing ecological restoration and protection measures. SOM is an effective tool for archetype clustering; however, it is rarely used in studies involving forest coverage. Combining dimensionality reduction and clustering analysis, the different regions can be analyzed intuitively and in depth, along with the archetypes, which are analyzed comprehensively based on the interaction between driving factors [36]. In this study, three archetypes were recognized. Specifically, the proportions of improved areas in archetypes 1 and 3 were higher than 93%, which further demonstrated the positive impact of afforestation-related activities such as ecological engineering on vegetation restoration [37]. Further, archetypes 2 and 3 were dominated by human activities. A few studies reported that areas with significant declines in forest land cover are usually located near roads or residential areas, suggesting that frequent human activities lead to degradation of forest coverage [12,38]. The proportion of degraded states in archetype 2 was relatively high (81.2%), which mainly involved regions with a high intensity of human production and activity, reinforcing the conclusions above. Spatial recognition and the division of archetypes facilitate our understanding of forest restoration, which, combined with the restoration effects, recognize spatial laws and promote the optimization of ecological engineering layouts.

4.2. Assessing the Potential Forest Restoration Probability

In this study, a BBN conceptual model of forest restoration was designed by combining expert experience, factor correlation analysis, and existing research results [39,40]. The model was then applied for the quantitative assessment of forest restoration probabilities in the background of ecological restoration. Based on conditional probabilities, the uncertainty of assessment results caused by the lack of relevant knowledge or information (evaluation data) can be eased [41]. Therefore, this model is very valuable. Further, it can be used to re-evaluate forest restoration probabilities using updated or replaced data [42], to enable formulation of reasonable and effective management measures by the stakeholder. As a result, the BBN model exhibits relatively strong reliability and practicability.
Understanding the influences of landforms (karst and non-karst) on forest restoration at different research scales can provide decision-makers with a reference base to develop and implement ecological restoration measures. The forest restoration probability on the grid scale generally decreases with increased proportion of karst area in the grid; however, the differences in forest restoration probability corresponding to the proportion of karst areas in different states are small, probably due to the close relationship with the input of ecological engineering [9]. Since 2000, the GOC has invested more than 130 billion yuan into ecological environmental governance in karst regions [8]. The forest coverage in the karst regions has changed from negative to net growth [43]. This artificial improvement has increased the rate of vegetation restoration in the grids dominated by karst areas, and the forest restoration probability showed no significant differences compared with grids dominated by non-karst areas. At the regional scale, both non-karst and karst regions showed a high level of forest restoration probability (p > 95%). The average forest restoration probability of non-karst regions (96.03%) was slightly higher than in karst regions (95.44%). Theoretically, the average vegetation coverage and succession rates of karst regions were lower than those of non-karst regions, and the forest restoration in karst regions was relatively more difficult [40]. Therefore, this study demonstrated that ecological engineering plays an important role in determining the forest restoration rate.

4.3. Implications and Future Directions

The fundamental goal of ecological restoration is to protect or increase vegetation coverage [44]. However, vegetation restoration is influenced by other biological and physical factors, in addition to socio-economic factors. Different conditions, including climatic changes, soil features, and human activities, restrict the spatial configuration of the water–soil resources and geochemical cycling of nutrients, influencing vegetation growth [45].
In this study, the dominant effect of human activities and landform features on forest restoration was determined via forest restoration evaluation and archetype analysis. The effects of human activities on forest restoration can be considered from two aspects. First, it is difficult to implement forest restoration in regions of high-intensity human activity due to utilization of forest resources for living and production [46]. However, ecological engineering related to ecological protection and vegetation restoration accelerates forest restoration [47]. For example, Tong et al. [13] found that ecological restoration had a positive impact on vegetation restoration in the Guizhou Province, Yunnan Province, and Guangxi Province by eliminating the role of meteorological factors in vegetation changes. Therefore, future ecological restoration efforts should consider forest restoration in regions with significant human activities based on the principle of “ecology-economy”. It is also suggested that economic interventions during afforestation should be based not only on economic benefits for the public, but on local environmental conditions. Other plant areas such as pastures can be considered for regions inappropriate for afforestation. The effect of landform types on forest restoration is mainly reflected in the forest restoration probability and differences between karst and non-karst regions. This is mainly because it is more difficult to restore vegetation in vulnerable environments, which are characterized by poor soil formation and high permeability of carbonates [9]. In the future, additional capital investment is required for ecological restoration in karst regions. Further, appropriate governance is needed according to the degree of land degradation.
As an ecological transition zone, the mid-latitude ecotone (MLE) experienced land degradation, deforestation and a serious loss of forest ecosystem due to environmental changes and social pressure. In this study, the results of forest restoration in typical ecologically fragile areas served as an important reference base for the restoration of forest ecosystem in MLE. Specifically, relevant measures to enhance the positive effects of human activities on forest land restoration and reduce its negative effects decreased the interference of human activities in forest restoration. However, the increased capital investment in ecological restoration and implementation enhances the ecological outcomes.
The study has some limitations. Although this study has analyzed the forest restoration in karst areas, additional research is needed to quantitatively identify the relationship between changes in vegetation and the underlying factors in combination with the local geographical environment and explore the mechanisms of local ecological restoration. In addition, BBN can be used to address the uncertainty associated with structural parameters and data input during forest restoration [48]. Nevertheless, the reasonability of the model structure is very important to enhance the accuracy of prediction. Therefore, further a priori knowledge is required to optimize the model structure. For example, further findings regarding vegetation restoration could be used to systematically formulate additional laws.

5. Conclusions

This study analyzes forest restoration in the Guizhou province from the perspective of ecological restoration, as well as its relationship with environmental and socio-economic factors, by combining the SOM algorithm and the BBN model. First, the dynamic variation in the forest coverage trend is analyzed based on NDVI data. Results show that following ecological restoration, forest coverage in the study region generally improved significantly from 2005 to 2018. The improved area accounted for 90,130 km2, while stable and degraded areas extended to 4572 km2. Second, three socio-environmental archetypes are recognized by the SOM algorithm. The improved areas in the high-strength eco-dominant archetype and the high-strength predominantly human archetype constituted 95.4 and 93.9%, respectively. However, only 17.1% of the improved area represented the marginal archetype. Based on prior knowledge of forest restoration and driving factors, a BBN model predicting forest restoration probability was constructed to comprehensively evaluate the changes in forest and driving factors, as well as the internal interactions. The overall accuracy of the BBN model was 95.95% and the AUC value was 70.16%. Overall, the model showed robust performance and provided reasonable predictions for the forest restoration probability, which ranged from 22.27 to 99.29% in this study. The prediction of forest restoration probability in karst and non-karst regions at different scales was analyzed. In the grid scale, the forest restoration probability was negatively correlated with the proportion of karst area in the grid. At the regional scale, minor differences in the average forest restoration probabilities were detected between karst and non-karst regions, at 95.44 and 96.03%, respectively. It is believed that the low forest restoration probability of karst regions is caused by the vulnerable environment, owing to low soil-forming rates and the high permeability of carbonates. Nevertheless, the implementation of ecological restoration accelerates forest restoration in karst regions within the study period. No apparent differences in forest restoration probabilities were observed between karst and non-karst regions, suggesting the need for implementation of ecological restoration projects and formulation of flexible and relevant ecological protection policies, according to the locally predicted probability of forest restoration.

Author Contributions

L.P.: Methodology, investigation, formal analysis, supervision, writing—original draft. S.Z.: methodology, investigation, formal analysis, software, data curation, visualization. T.C.: investigation, project administration, writing—review and editing. All authors have read and agreed to the published version of the manuscript.

Funding

This work is funded by the National Natural Science Foundation of China (42001090), and the Special fund projects of central government guiding local science and technology development (Guike ZY20198012).

Data Availability Statement

Data are not currently available to the public as of the publication of this paper.

Conflicts of Interest

The authors declare that they have no known competing financial interests or personal relationships that could have appeared to influence the work reported in this paper.

References

  1. Liu, Y.L.; Feng, Y.H.; Zhao, Z.; Zhang, Q.W.; Su, S.L. Socioeconomic drivers of forest loss and fragmentation: A comparison between different land use planning schemes and policy implications. Land Use Policy 2016, 54, 58–68. [Google Scholar] [CrossRef]
  2. Newman, M.E.; McLaren, K.P.; Wilson, B.S. Assessing deforestation and fragmentation in a tropical moist forest over 68 years; the impact of roads and legal protection in the Cockpit Country, Jamaica. For. Ecol. Manag. 2014, 315, 138–152. [Google Scholar] [CrossRef]
  3. Carranza, M.L.; Hoyos, L.; Frate, L.; Acosta, A.T.R.; Cabido, M. Measuring forest fragmentation using multitemporal forest cover maps: Forest loss and spatial pattern analysis in the Gran Chaco, central Argentina. Landsc. Urban Plan. 2015, 143, 238–247. [Google Scholar] [CrossRef]
  4. Roth, M.; Müller-Meißner, A.; Michiels, H.-G.; Hauck, M. Vegetation changes in the understory of nitrogen-sensitive temperate forests over the past 70 years. For. Ecol. Manag. 2022, 503, 119754. [Google Scholar] [CrossRef]
  5. Villa, P.M.; Martins, S.V.; Diniz, É.S.; Nolasco de Oliveira Neto, S.; Neri, A.V.; Pinto-Junior, H.; Nunes, J.A.; Bueno, M.L.; Ali, A. Taxonomic and functional beta diversity of woody communities along Amazon forest succession: The relative importance of stand age, soil properties and spatial factor. For. Ecol. Manag. 2021, 482, 118885. [Google Scholar] [CrossRef]
  6. Akay, A.O.; Akgul, M.; Demir, M.; Acar, H.H. Analysis of factors associated with the amount of forest road reconstruction activity in Turkey: Autoregressive distributed lag modelling approach. For. Ecol. Manag. 2020, 458, 117800. [Google Scholar] [CrossRef]
  7. Xiao, H.L.; Weng, Q.H. The impact of land use and land cover changes on land surface temperature in a karst area of China. J. Environ. Manag. 2007, 85, 245–257. [Google Scholar] [CrossRef]
  8. Tong, X.W.; Brandt, M.; Yue, Y.M.; Horion, S.; Wang, K.; Keersmaecker, W.D.; Tian, F.; Schurgers, G.; Xiao, X.M.; Luo, Y.Q.; et al. Increased vegetation growth and carbon stock in China karst via ecological engineering. Nat. Sustain. 2018, 1, 44–50. [Google Scholar] [CrossRef]
  9. Zhang, X.M.; Yue, Y.M.; Tong, X.W.; Wang, K.L.; Qi, X.K.; Deng, C.X.; Brandt, M. Eco-engineering controls vegetation trends in southwest China karst. Sci. Total Environ. 2021, 770, 145160. [Google Scholar] [CrossRef]
  10. Stoddard, M.T.; Roccaforte, J.P.; Meador, A.J.S.; Huffman, D.W.; Fulé, P.Z.; Waltz, A.E.M.; Covington, W.W. Ecological restoration guided by historical reference conditions can increase resilience to climate change of southwestern U.S. Ponderosa pine forests. For. Ecol. Manag. 2021, 493, 119256. [Google Scholar] [CrossRef]
  11. Ma, Y.; Zuo, L.; Gao, J.; Liu, Q.; Liu, L. The karst NDVI correlation with climate and its BAS-BP prediction based on multiple factors. Ecol. Indic. 2021, 132, 108254. [Google Scholar] [CrossRef]
  12. Tong, X.; Wang, K.; Martin, B.; Yue, Y.; Liao, C.; Rasmus, F. Assessing future vegetation Ttrends and restoration prospects in the karst regions of southwest China. Remote Sens. 2016, 8, 357. [Google Scholar] [CrossRef] [Green Version]
  13. Tong, X.W.; Wang, K.L.; Yue, Y.M.; Brandt, M.; Liu, B.; Zhang, C.H.; Liao, C.J.; Fensholt, R. Quantifying the effectiveness of ecological restoration projects on long-term vegetation dynamics in the karst regions of Southwest China. Int. J. Appl. Earth Obs. Geoinf. 2017, 54, 105–113. [Google Scholar] [CrossRef] [Green Version]
  14. Sietz, D.; Fleskens, L.; Stringer, L.C. Learning from non-linear ecosystem dynamics is vital for achieving land degradation neutrality. Land Degrad. Dev. 2017, 28, 2308–2314. [Google Scholar] [CrossRef] [Green Version]
  15. Dittrich, A.; Seppelt, R.; Václavík, T.; Cord, A.F. Integrating ecosystem service bundles and socio-environmental conditions—A national scale analysis from Germany. Ecosyst. Serv. 2017, 28, 273–282. [Google Scholar] [CrossRef]
  16. Oberlack, C.; Sietz, D.; Bonanomi, E.B.; Bremond, A.D.; Villamayor-Tomas, S. Archetype analysis in sustainability research: Meanings, motivations, and evidence-based policy making. Ecol. Soc. 2019, 24, 1–19. [Google Scholar] [CrossRef] [Green Version]
  17. Adenle, A.A.; Speranza, C. Social-ecological archetypes of land degradation in the Nigerian Guinea Savannah:Insights for sustainable land management. Remote Sens. 2020, 13, 32. [Google Scholar] [CrossRef]
  18. Oberlack, C.; Eisenack, K. Archetypical barriers to adapting water governance in river basins to climate change. J. Inst. Econ. 2018, 14, 527–555. [Google Scholar] [CrossRef]
  19. Moosavi, V. Contextual mapping: Visualization of high-dimensional spatial patterns in a single geo-map. Comput. Environ. Urban Syst. 2017, 61, 1–12. [Google Scholar] [CrossRef]
  20. Zhou, S.; Peng, L. Applying Bayesian belief networks to assess alpine grassland degradation risks: A case study in northwest Sichuan, China. Front. Plant Sci. 2021, 12, 2530. [Google Scholar] [CrossRef]
  21. Li, H.; Zhang, X.; Zhang, Y.; Yang, X.; Zhang, K. Risk assessment of forest landscape degradation using Bayesian network modeling in the Miyun Reservoir catchment (China) with emphasis on the Beijing–Tianjin sandstorm source control program. Land Degrad. Dev. 2018, 29, 3876–3885. [Google Scholar] [CrossRef]
  22. Zhu, W.J.; Gao, Y.; Zhang, H.B.; Liu, L.L. Optimization of the land use pattern in Horqin Sandy Land by using the CLUMondo model and Bayesian belief network. Sci. Total Environ. 2020, 739, 139929. [Google Scholar] [CrossRef]
  23. Kerebel, A.; Gélinas, N.; Déry, S.; Voigt, B.; Munson, A. Landscape aesthetic modelling using Bayesian networks: Conceptual framework and participatory indicator weighting. Landsc. Urban Plan. 2019, 185, 258–271. [Google Scholar] [CrossRef]
  24. Calder, R.S.D.; Shi, C.; Mason, S.A.; Olander, L.P.; Borsuk, M.E. Forecasting ecosystem services to guide coastal wetland rehabilitation decisions. Ecosyst. Serv. 2019, 39, 101007. [Google Scholar] [CrossRef]
  25. Peng, J.; Tian, L.; Zhang, Z.; Zhao, Y.; Green, S.M.; Quine, T.A.; Liu, H.; Meersmans, J. Distinguishing the impacts of land use and climate change on ecosystem services in a karst landscape in China. Ecosyst. Serv. 2020, 46, 101199. [Google Scholar] [CrossRef]
  26. Pinzon, J.E.; Tucker, C.J. A non-stationary 1981–2012 AVHRR NDVI3g time series. Remote Sens. 2014, 6, 6929–6960. [Google Scholar] [CrossRef] [Green Version]
  27. Levers, C.; Mueller, D.; Erb, K.; Haberl, H.; Jepsen, M.R.; Metzger, M.J.; Meyfroidt, P.; Plieninger, T.; Plutzar, C.; Sturck, J. Archetypical patterns and trajectories of land systems in Europe. Reg. Environ. Chang. 2018, 18, 715–732. [Google Scholar] [CrossRef]
  28. Rusek, J.; Tajduś, K.; Firek, K.; Jędrzejczyk, A. Score-based Bayesian belief network structure learning in damage risk modelling of mining areas building development. J. Clean. Prod. 2021, 296, 126528. [Google Scholar] [CrossRef]
  29. Bicking, S.; Burkhard, B.; Kruse, M.; Müller, F. Bayesian Belief Network-based assessment of nutrient regulating ecosystem services in Northern Germany. PLoS ONE 2019, 14, e0216053. [Google Scholar] [CrossRef] [PubMed]
  30. Deng, X.Y.; Liu, Q.; Deng, Y.; Mahadevan, S. An improved method to construct basic probability assignment based on the confusion matrix for classification problem. Inf. Sci. 2016, 340–341, 250–261. [Google Scholar] [CrossRef]
  31. Anderson, B. Using Bayesian networks to perform reject inference. Expert Syst. Appl. 2019, 137, 349–356. [Google Scholar] [CrossRef]
  32. Shi, H.Y.; Luo, G.P.; Zheng, H.W.; Chen, C.B.; Bai, J.; Liu, T.; Ochege, F.U.; De Maeyer, P. Coupling the water-energy-food-ecology nexus into a Bayesian network for water resources analysis and management in the Syr Darya River basin. J. Hydrol. 2020, 581, 124387. [Google Scholar] [CrossRef]
  33. Zhong, F.X.; Xu, X.L.; Li, Z.W.; Zeng, X.M.; Yi, R.Z.; Luo, W.; Zhang, Y.H.; Xu, C.H. Relationships between lithology, topography, soil, and vegetation, and their implications for karst vegetation restoration. Catena 2022, 209, 105831. [Google Scholar] [CrossRef]
  34. Qiao, Y.N.; Jiang, Y.J.; Zhang, C.Y. Contribution of karst ecological restoration engineering to vegetation greening in southwest China during recent decade. Ecol. Indic. 2021, 121, 107081. [Google Scholar] [CrossRef]
  35. Zhu, X.C.; Ma, M.G.; Tateno, R.; He, X.H.; Shi, W.Y. Effects of vegetation restoration on soil carbon dynamics in karst and non-karst regions in southwest China: A synthesis of multi-source data. Plant Soil 2021. [Google Scholar] [CrossRef]
  36. Turner, K.G.; Odgaard, M.V.; Bøcher, P.K.; Dalgaard, T.; Svenning, J.-C. Bundling ecosystem services in Denmark: Trade-offs and synergies in a cultural landscape. Landsc. Urban Plan. 2014, 125, 89–104. [Google Scholar] [CrossRef]
  37. Wang, J.; Wang, K.; Zhang, M.; Zhang, C. Impacts of climate change and human activities on vegetation cover in hilly southern China. Ecol. Eng. 2015, 81, 451–461. [Google Scholar] [CrossRef]
  38. Mao, J.F.; Ribes, A.; Yan, B.Y.; Shi, X.Y.; Thornton, P.E.; Séférian, R.; Ciais, P.; Myneni, R.B.; Douville, H.; Piao, S.L.; et al. Human-induced greening of the northern extratropical land surface. Nat. Clim. Chang. 2016, 6, 959–963. [Google Scholar] [CrossRef]
  39. Huo, H.; Sun, C.P. Spatiotemporal variation and influencing factors of vegetation dynamics based on Geodetector: A case study of the northwestern Yunnan Plateau, China. Ecol. Indic. 2021, 130, 108005. [Google Scholar] [CrossRef]
  40. Tang, W.X.; Liu, S.G.; Kang, P.; Peng, X.; Li, Y.Y.; Guo, R.; Jia, J.N.; Liu, M.C.; Zhu, L.J. Quantifying the lagged effects of climate factors on vegetation growth in 32 major cities of China. Ecol. Indic. 2021, 132, 108290. [Google Scholar] [CrossRef]
  41. Liu, R.; Chen, Y.; Wu, J.; Gao, L.; Barrett, D.; Xu, T.; Li, X.; Li, L.; Huang, C.; Yu, J. Integrating Entropy-Based Naïve Bayes and GIS for Spatial Evaluation of Flood Hazard. Risk Anal. 2017, 37, 756–773. [Google Scholar] [CrossRef] [PubMed]
  42. Dai, L.; Han, Q.; de Vries, B.; Wang, Y. Applying Bayesian Belief Network to explore key determinants for nature-based solutions’ acceptance of local stakeholders. J. Clean. Prod. 2021, 310, 127480. [Google Scholar] [CrossRef]
  43. Cai, H.; Yang, X.; Wang, K.; Xiao, L. Is forest restoration in the southwest China karst promoted mainly by climate change or human-induced factors? Remote Sens. 2014, 6, 9895–9910. [Google Scholar] [CrossRef] [Green Version]
  44. Tian, H.J.; Cao, C.X.; Chen, W.; Bao, S.N.; Yang, B.; Myneni, R.B. Response of vegetation activity dynamic to climatic change and ecological restoration programs in Inner Mongolia from 2000 to 2012. Ecol. Eng. 2015, 82, 276–289. [Google Scholar] [CrossRef]
  45. Li, Y.; Zheng, Z.C.; Qin, Y.C.; Rong, P.J. Relative contributions of natural and man-made factors to vegetation cover change of environmentally sensitive and vulnerable areas of China. J. Clean. Prod. 2021, 321, 128917. [Google Scholar] [CrossRef]
  46. Lang, Y.Q.; Song, W.; Deng, X.Z. Projected land use changes impacts on water yields in the karst mountain areas of China. Phys. Chem. Earth 2018, 104, 66–75. [Google Scholar] [CrossRef]
  47. Xiao, L.L.; Huan, Y.X.; Xu, C.S.; Yan, C.H. An assessment of erosivity distribution and its influence on the effectiveness of land use conversion for reducing soil erosion in Jiangxi, China. Catena 2015, 125, 50–60. [Google Scholar] [CrossRef]
  48. Chen, S.H.; Pollino, C.A. Good practice in Bayesian network modelling. Environ. Model. Softw. 2010, 37, 134–145. [Google Scholar] [CrossRef]
Figure 1. Location and landform type of the study area.
Remotesensing 14 00780 g001
Figure 2. Correlation matrix showing the selected variables for forest restoration.
Remotesensing 14 00780 g002
Figure 3. Trends in forest coverage variation from 2005 to 2018.
Remotesensing 14 00780 g003
Figure 4. Self-organizing map of the socio-environmental factors.
Remotesensing 14 00780 g004
Figure 5. Z-score normalized values of drivers characterizing the three archetypes of socio-environmental factors: zero represents the mean of the factors; the natural drivers are presented in blue and the human drivers shown in red.
Remotesensing 14 00780 g005
Figure 6. Bayesian conceptual network and parametric results of forest restoration model. (a) Bayesian conceptual network of forest restoration model; and (b) Parametric results of forest restoration model.
Remotesensing 14 00780 g006
Figure 7. ROC curve of the slope of NDVI change.
Remotesensing 14 00780 g007
Figure 8. Sensitivity analysis of the driving factors.
Remotesensing 14 00780 g008
Figure 9. Distribution of the forest-restoration probability.
Remotesensing 14 00780 g009
Figure 10. Analysis of the probability of forest restoration in karst and non-karst regions at the (a) grid and (b) regional scales.
Remotesensing 14 00780 g010
Table 1. Potential factors associated with grassland degradation.
FactorsDescription
NaturalElevationElevation (m)
SlopeSlope (°)
ClayProportion of soil clay (%)
SandProportion of soil sand (%)
SiltProportion of soil silt (%)
Soil depthSoil depth (%)
TmMean value of annual temperature (2005–2018) (°C)
TsSlope of annual temperature change (2005–2018)
ETmMean value of annual potential evaporation (2005–2018) (mm)
ETsSlope of annual potential evaporation change (2005–2018)
PmMean value of annual precipitation (2005–2018) (mm)
PsSlope of annual precipitation change (2005–2018)
NDVImMean value of annual normalized difference vegetation index (2005–2018)
Social and economicAfforestationMean value of the area of afforestation (2005–2018) (m2)
NTLmMean value of nighttime light (2005–2018)
NTLsSlope of nighttime light change (2005–2018)
DSDistance between each grid and its nearest settlement (m)
DRDistance between each grid and its nearest road (m)
Table 2. Discretization of the BBN model nodes.
VariableClasses
LowestLowMediumHighest
NDVIm<0.50.5–0.60.6–0.7≥0.7
Tm16~18<1212–1414–16 and ≥18
Ts−0.06–0.040.04–0 and 0.04–0.06−0.08–−0.06 and 0–0.04 and ≥0.06<−0.08
Pm1000–11001100–12001200–1300≥1300 and <1000
Ps18–21<15 and 21–2415–18 and 24–27≥27
NTLm5–25≥250–50
NTLs≥0.40.2–0.4<0 and 0–0.20
ETm≥1000950–1000900–950<900
ETs1–2 and ≥42–400–1
Elevation<600600–14001400–2200≥2200
Slope<5≥305–1010–30
soil depth<5070–80 and 90–10050–70 and 80–90≥100
Sand55–60<35 and ≥6035–40 and 45–5540–45
Silt<2035–4020–35≥40
Clay30–3510–15 and ≥40 and 25–3015–25 and 35–40<10
DS<30003000–60006000–9000≥9000
DR<500500–15001500–3000 and ≥40003000–4000
Afforestation<10001000–20002000–3000 and 4000–5000
and 7000–8000
3000–4000 and 5000–70,000 and ≥8000
Publisher’s Note: MDPI stays neutral with regard to jurisdictional claims in published maps and institutional affiliations.

