Abstract
The Landsat 8 Operational Land Imager (OLI) is a high-resolution satellite sensor that is carried on the next-generation Landsat which was launched by the National Aeronautics and Space Administration (NASA) in 2013. Compared to the previous land observation satellites in this series, Landsat 8 OLI has been further optimized in regard to its band setting and data acquisition frequency. The application scope of the data and the ability of information extraction have been further expanded and enhanced. However, the existence of clouds reduces the efficiency and the quality of satellite data. Therefore, in order to identify cloud pixels with a high level of accuracy and efficiency, a variety of cloud detection methods have been developed for Landsat 8 OLI sensors. Distinct treatment methods have been adopted for identifying different surface backgrounds and various types of cloud characteristics in order to improve the accuracy of cloud detection. The present study compares and analyzes the detection results from five typical cloud detection algorithms for different cloud types over different ground types. In addition, it discusses the various cloud detection algorithms used for different types of adaptive backgrounds and clouds in order to shed light upon the comprehensive application of different methods. Subsequently, these findings may provide a reference for the development of an algorithm with a higher precision of cloud detection.
1. Introduction
Clouds cover approximately 67% of the earth’s surface, of which the amount of cloud over land and ocean is approximately 55% and 72%, respectively [1]. The existence of clouds not only reduces the quality of remote sensing images [2], but also affects the accuracy and reliability of the inversion of surface and atmospheric parameters [3,4,5,6,7]. High-precision, convenient, and rapid cloud detection is an indispensable step for remote sensing image pre-processing [8]. Cloud detection mostly utilizes the differences in reflectivity, brightness, temperature, and texture between the cloud and the typical ground surface to distinguish the cloud from the background ground surface. To improve the cloud detection accuracy of different types of satellite data, a variety of cloud detection methods have been developed. The most common cloud detection method is the threshold method, which sets specific thresholds for different bands or band combinations to distinguish clouds from the typical surface. It utilizes the reflectivity difference between clouds and the typical surface in visible to near-infrared bands and the brightness and temperature difference between mid-infrared and thermal infrared bands. A few examples include the CLAVR (NOAA Cloud Advanced Very High-Resolution Radiometer), APPOLLO (the AVHRR Processing Scheme Over Cloud Land and Ocean), and DTCM (Dynamic threshold cloud-masking) methods developed for AVHRR data, and the MODIS Cloud Mask method developed for MODIS data. The threshold method is widely utilized, as it is more convenient to use, especially in the case of enhanced band information, and achieves a relatively high level of accuracy. However, owing to the complexity of the surface and the diversity of the cloud types, it is often difficult for this method to achieve a high degree of accuracy, due to the limited band information of the sensor. In particular, for cloud detection over regions with relatively high-surface reflectivity and thin cloud detection, the accuracy is low. To improve the detection accuracy of thin and broken clouds, especially over low-reflectivity backgrounds, Sun et al. proposed a cloud detection method supported by a priori surface products utilizing the cloudless albedos product data that provides a priori information of the surface for the cloud detection image. This is based on a priori surface information, which is in turn set up based on the reflectivity of the cloud detection threshold. As the threshold value of this method changes with the change of surface reflectance provided by prior data, it is also called the ‘dynamic threshold method’. However, the update frequency of the surface reflectance greatly influences the value of the dynamic threshold method for cloud detection. When the time gap between the prior database and the image to be detected is large, the change in the surface reflectance influences the cloud detection. However, the high frequency of prior data updates reduces the efficiency of the method and increases the operating cost. To reduce the requirement of the dynamic threshold method for the high update frequency of prior data, Sun et al. proposed utilizing the surface type to provide prior knowledge support for the image to be detected. In addition, the dynamic threshold was set based on the surface type and time changes. As the known surface reflectance, the threshold setting was more targeted, owing to the nature of the dynamic threshold method. Compared with previous threshold methods, this method has distinct advantages in the detection of thin clouds and broken clouds over a surface with low reflectance. However, owing to the error margin of the a priori data itself, the surface information rapidly changes. This results in spatial matching errors between prior data and testing data, which affects the cloud detection results. Cloud detection based on deep learning is a type of cloud detection technology that has been gradually promoted and applied along with the rapid development of deep learning technology in recent years. The technology has been implemented in the cloud detection of a number of satellites’ data and displays great advantages. However, the application efficiency and accuracy of the deep learning method are limited due to the huge demand for sample quantity and quality.
Landsat 8 OLI is the operational land imager carried on the eighth satellite of the U.S. Landsat Program, launched into space on 11 February 2013. The sensor includes nine bands with a spatial resolution of 30 m, including a 15 m panchromatic band, and an imaging width of 185 × 185 km. OLI includes all the bands of the ETM+ sensor. To avoid atmospheric absorption characteristics, OLI has re-adjusted its bands; it has added two new bands: a blue band (band 1; 0.433–0.453 μm) and a shortwave infrared band (band 9; 1.360–1.390 μm) [9]. The former is mostly used for coastal observations, and the latter possesses strong water vapor absorption characteristics that can be utilized for cloud detection. Compared with the previous Landsat series, this particular sensor has a wider range of applications and a higher information extraction capability. The existence of clouds, to some extent, limits the user efficiency of the satellite data. In order to fully utilize the high-quality applications of the sensor, a variety of cloud detection algorithms have been developed. In this study, several typical cloud detection algorithms were analyzed. The advantages and existing problems of each algorithm are further summarized to provide a reference for the joint applications of the cloud detection algorithms and for further research regarding the achievement of a higher precision of cloud detection.
2. Typical Landsat 8 OLI Cloud Detection Algorithm
2.1. Fmask Cloud Detection Algorithm
The Fmask algorithm is a typical threshold method used for cloud detection in Landsat 8 OLI data. This method sets different rules based on the different spectral characteristics and brightness temperature characteristics of clouds and ground objects in order to extract potential cloud pixels [10,11,12]. The method includes the following process: first, by utilizing the “highlight” characteristic of clouds in the spectral band, the Landsat 8 OLI shortwave infrared band, the thermal infrared band, the normalized vegetation index and normalized snow index are utilized to extract potential cloud layer; then, cloud, aerosol, and bright surfaces are distinguished by means of whiteness optimization, fog optimization, and ratio detection. Finally, the remaining pixel is divided into water pixel and land pixel, and its cloud probability is calculated. Fmask 4.0 [13] improved the identification accuracy of cirrus clouds through enhancing the separation method of land and water by implementing a global digital elevation model (GDEM). In addition, spectral background features were utilized to create a spectral background snow index (SCSI) to better distinguish snow, ice, and clouds in polar regions. A morphology-based approach was adopted to reduce errors in detecting bright surface (e.g., urban/building and mountain snow/ice) clouds.
2.2. Automatic Threshold Generation Cloud Detection Technology Based on Hyperspectral Data
The traditional threshold method of cloud detection determines the cloud detection threshold based on the analysis of the spectral difference between clouds and typical ground objects. Such a threshold determination method often fails to entirely consider the complexity of clouds and typical surface pixels. In addition, based on artificial spectral difference analysis, insufficient consideration is given to the difference in the information source between clouds and a typical surface. Finally, the cloud detection threshold utilized displays great limitations. To solve the above-mentioned problems, Sun et al. proposed an automatically generated cloud detection threshold based on the support of hyperspectral resolution data (CDAG) [14].
Based on Airborne Visible/Infrared Imaging Spectrometer (AVIRIS) data with high spatial and spectral resolution, a cloud pixel library composed of different types of clouds and clear sky was composed based on different types of land surfaces. Using the constructed cloud and clear sky pixel library, the cloud and clear sky sample pixel of the Landsat 8 OLI data in the visible band and the near-infrared band was simulated by the process of data simulation [15,16]. To set a certain accuracy level, we analyzed the reflectance difference of the pixels that have marked the clouds and the typical ground surface using a computer program. The objects of analysis include the reflectivity of a single-band, multi-band combination, the band ratio, and the band difference, among others. Finally, for the Landsat 8 OLI data, six single-band algorithms, eight multi-band combination algorithms, one band ratio algorithm, and three band difference algorithms were generated. Compared with the traditional threshold method, this method utilizes more abundant information sources.
2.3. Dynamic Threshold Cloud Detection Method Supported by Surface Reflectance Products
The traditional threshold method distinguishes cloud pixels from clear sky pixels by analyzing the reflectance difference between cloud and typical surface. Cloud pixel reflectance, especially the reflectance of thin clouds and broken clouds, is the result of the mixing of the cloud and the surface. It is difficult to set a unified threshold to distinguish clouds from a typical land surface, especially for the identification of thin and broken clouds covering the land surface with relatively low reflectivity. The major reason for this problem is the unknown surface information. If the surface information is known, thresholds can be set based on the actual reflectivity of the surface rather than on a uniform threshold for all surfaces. The dynamic threshold cloud detection algorithm (UDTCDA) [17,18] supported by the ground reflectance product was developed to address this problem. The UDTCDA cloud detection method provides a priori surface reflectance information from the MOD09 surface reflectance data product and matches it with Landsat 8 OLI data in time and space to determine the surface reflectance of the Landsat 8 OLI data. The cloud detection threshold is set for the determined surface reflectance. Since the threshold changes with the change in surface reflectance, this method is termed as the dynamic threshold method.
2.4. Dynamic Threshold Cloud Detection Algorithm Supported by Surface Type Products
Although the UDTCDA algorithm is capable of distinguishing complex ground from clouds based on a priori surface reflectance, this method requires a change in the surface reflectance database with high time frequency. Otherwise, it is vulnerable to the impacts of land cover change and vegetation phenology. The large amount of surface reflectance data requirements limits the effectiveness of this method. In addition, the surface reflectance information provided by the surface reflectance data set differs greatly from the spatial scale of the Landsat 8 OLI data. Furthermore, the determination accuracy of the surface reflectance is greatly limited, which eventually affects the accuracy of the cloud detection. In response to the above problems, Sun et al. proposed a dynamic threshold cloud detection algorithm based on the support of surface type products (LCCD) [19]. The GlobeLand30 land surface type dataset was utilized to provide land cover information for the purpose of cloud detection. By analyzing the temporal variation characteristics of different land cover types, appropriate thresholds were set to distinguish cloud from clear sky pixels. The GlobeLand30 land surface type database was constructed by combining 30 m of Landsat TM5, The Enhanced Thematic Mapper Plus (ETM+), and HJ-1 with the global ecogeographic partition data, global basic geographic information data, and global DEM data. The Landsat 8 OLI data have a high spatial consistency with the GlobeLand 30 land surface type database. In the threshold setting, the land surface types were divided into two categories: constant attribute land surfaces and variable attribute land surfaces. The former includes sea and water, wetland, bare soil, and urban artificial surfaces, whereas the latter includes cultivated land, forest, grassland, and shrub land. Finally, different threshold rules were set on different surface types to identify clouds.
2.5. Deep Learning Cloud Detection Algorithm Supported by Hyperspectral Data
Both the traditional fixed threshold method and the dynamic threshold method analyzes the radiation difference between clouds and a typical surface through limited and different combinations of band information to achieve the goal of cloud identification. These methods demonstrate a limited ability to determine the difference in information between cloud and typical surface radiation, so the accuracy of cloud detection is limited to a considerable degree. Deep learning technology based on artificial neural networks [20] can extract additional spectral difference information between clouds and typical ground objects owing to its improved mining ability; this approach has great potential in cloud detection applications. However, deep learning techniques require a large amount of high-quality, representative training data. In order to reduce the level of analysis related to sample selection, Sun et al. proposed a deep learning cloud detection algorithm supported by hyperspectral data (HDLCDA) [21]. A large quantity of hyperspectral AVIRIS data labelled with cloud and clear sky pixels is utilized to simulate the cloud and non-cloud pixel sample data for bands 1–7 and band 9 of the multi-spectral Landsat 8 OLI data. Furthermore, the cloud and non-cloud pixel sample data are utilized as training samples in the deep learning method, based on the Keras deep learning framework platform. A deep back propagation (BP) neural network was designed for cloud detection, and the results of the Landsat 8 OLI data cloud detection were obtained.
3. Analysis of Cloud Detection Results by Different Methods
In order to improve the accuracy and stability of cloud detection results using the Landsat 8 OLI data, this study conducted comparative analysis experiments on five typical cloud detection algorithms in different areas covered by different cloud types over different land surfaces. Here, we compared the detection accuracy of different types of cloud pixels such as thick cloud, thin cloud, broken cloud, and cloud edge pixels over various types of surfaces such as vegetation, water, bare land, artificial ground, ice and snow, in order to further analyze the advantages and disadvantages of each algorithm.
3.1. Cloud Detection over Vegetation
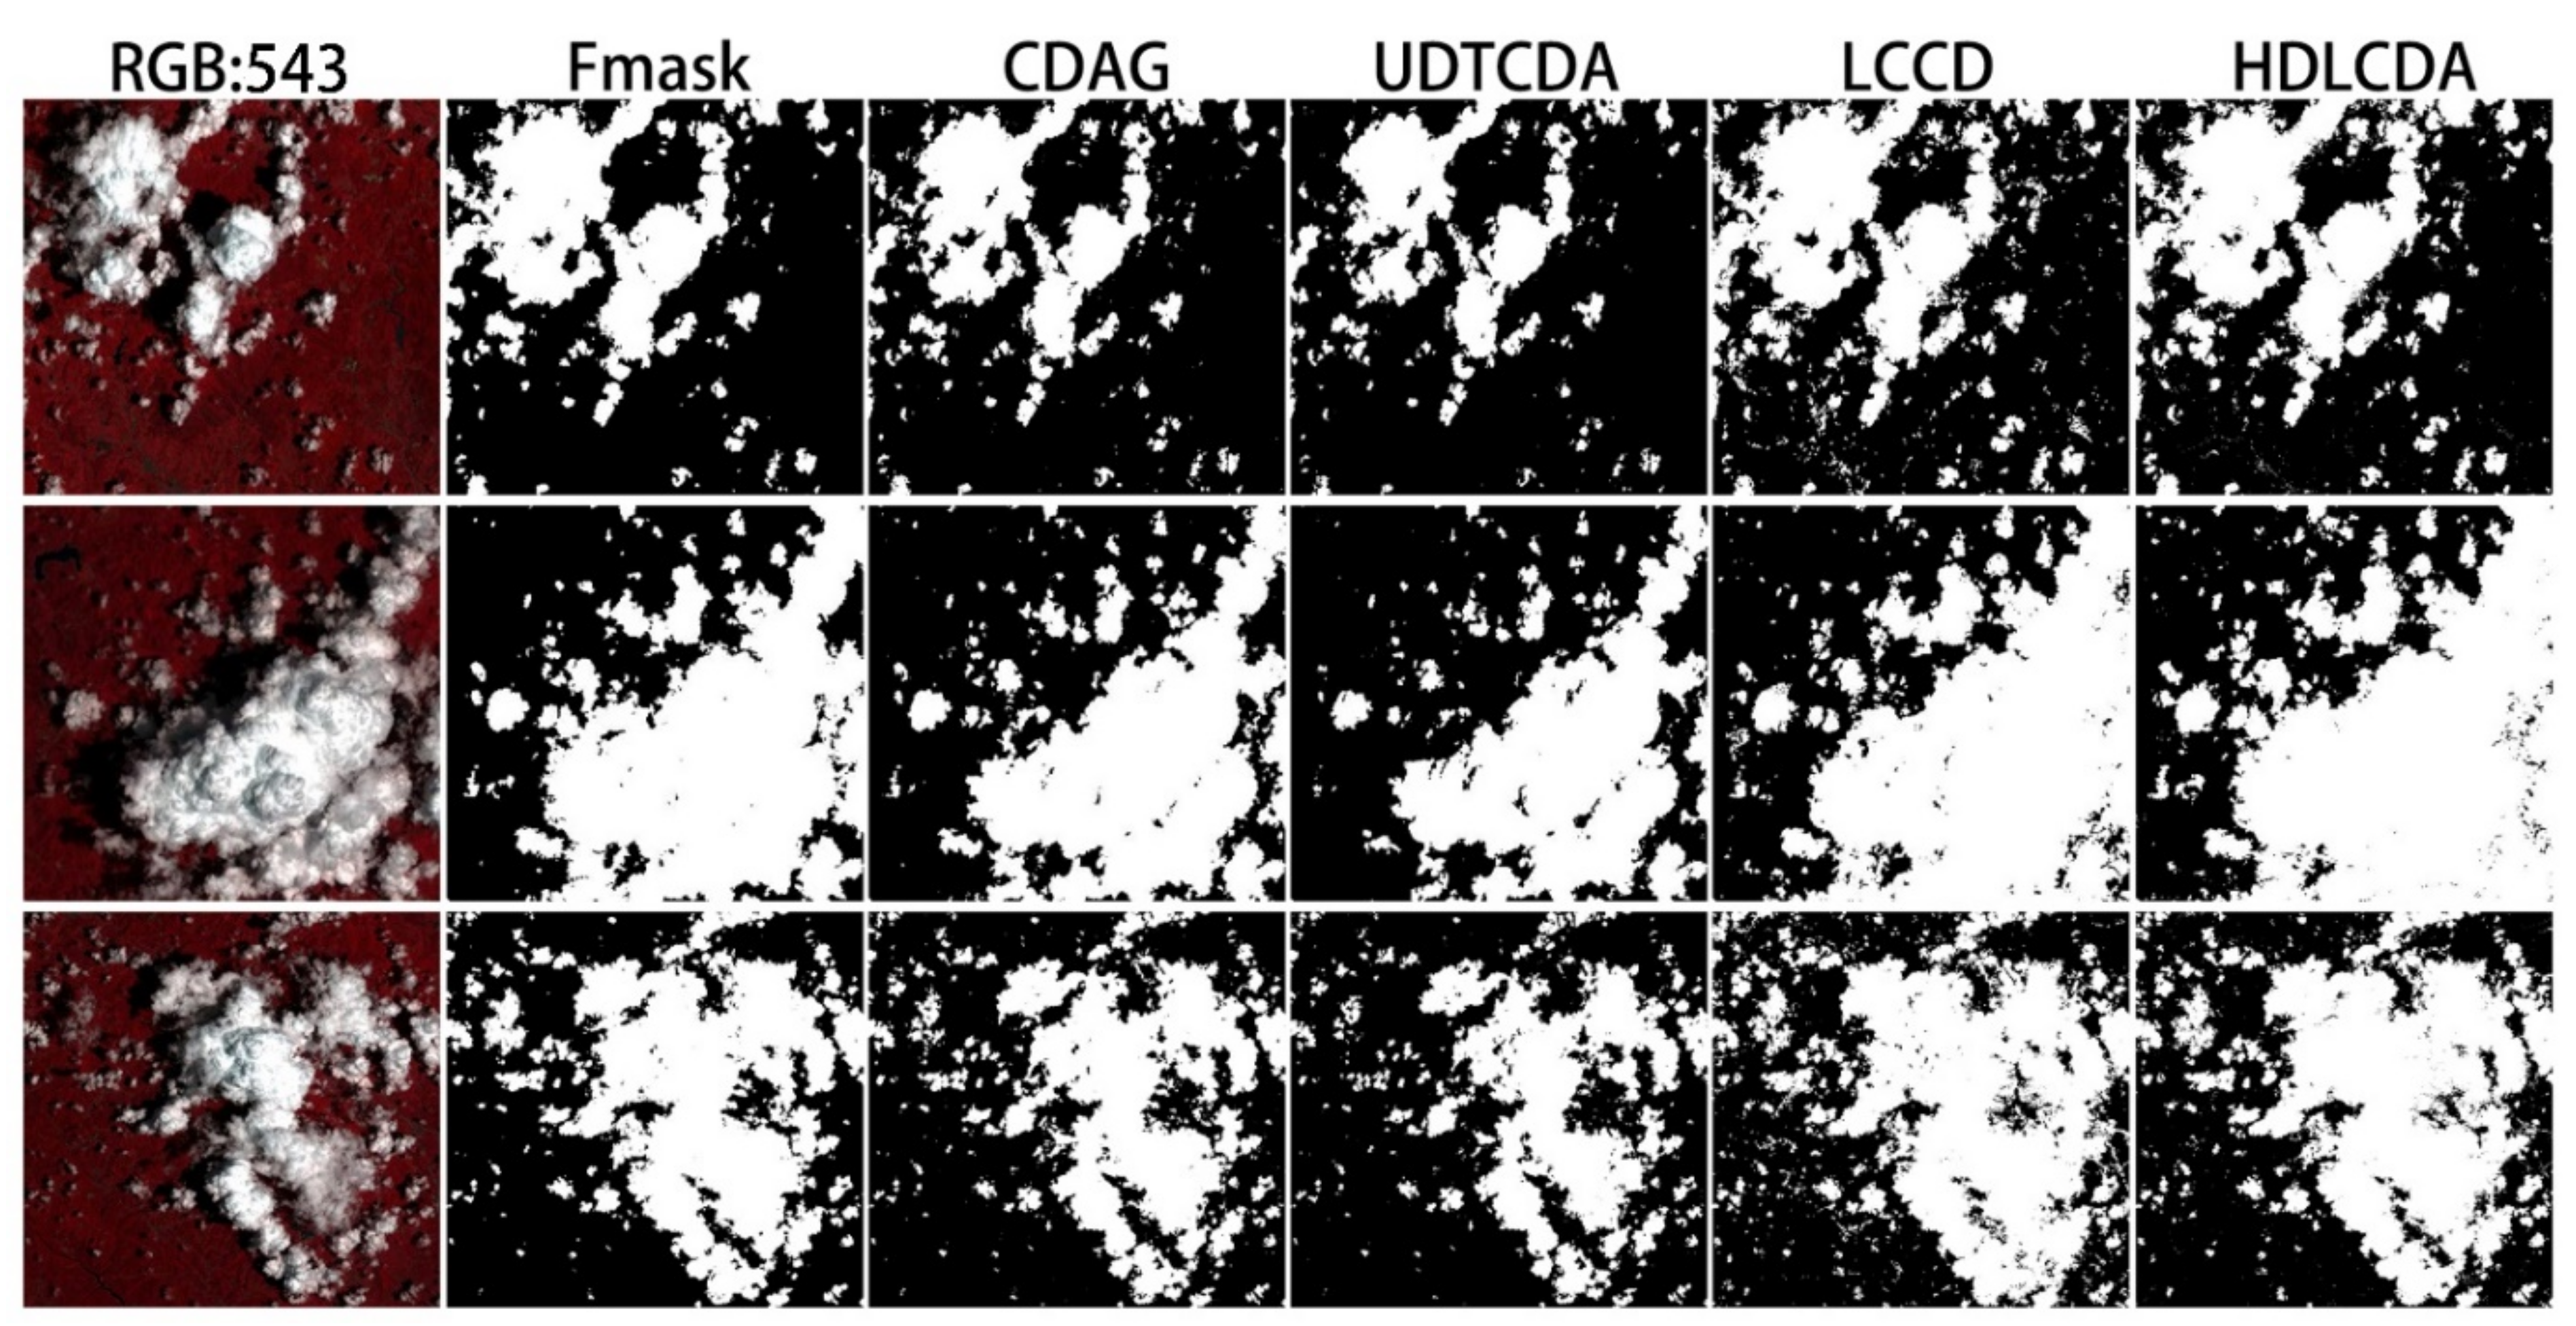
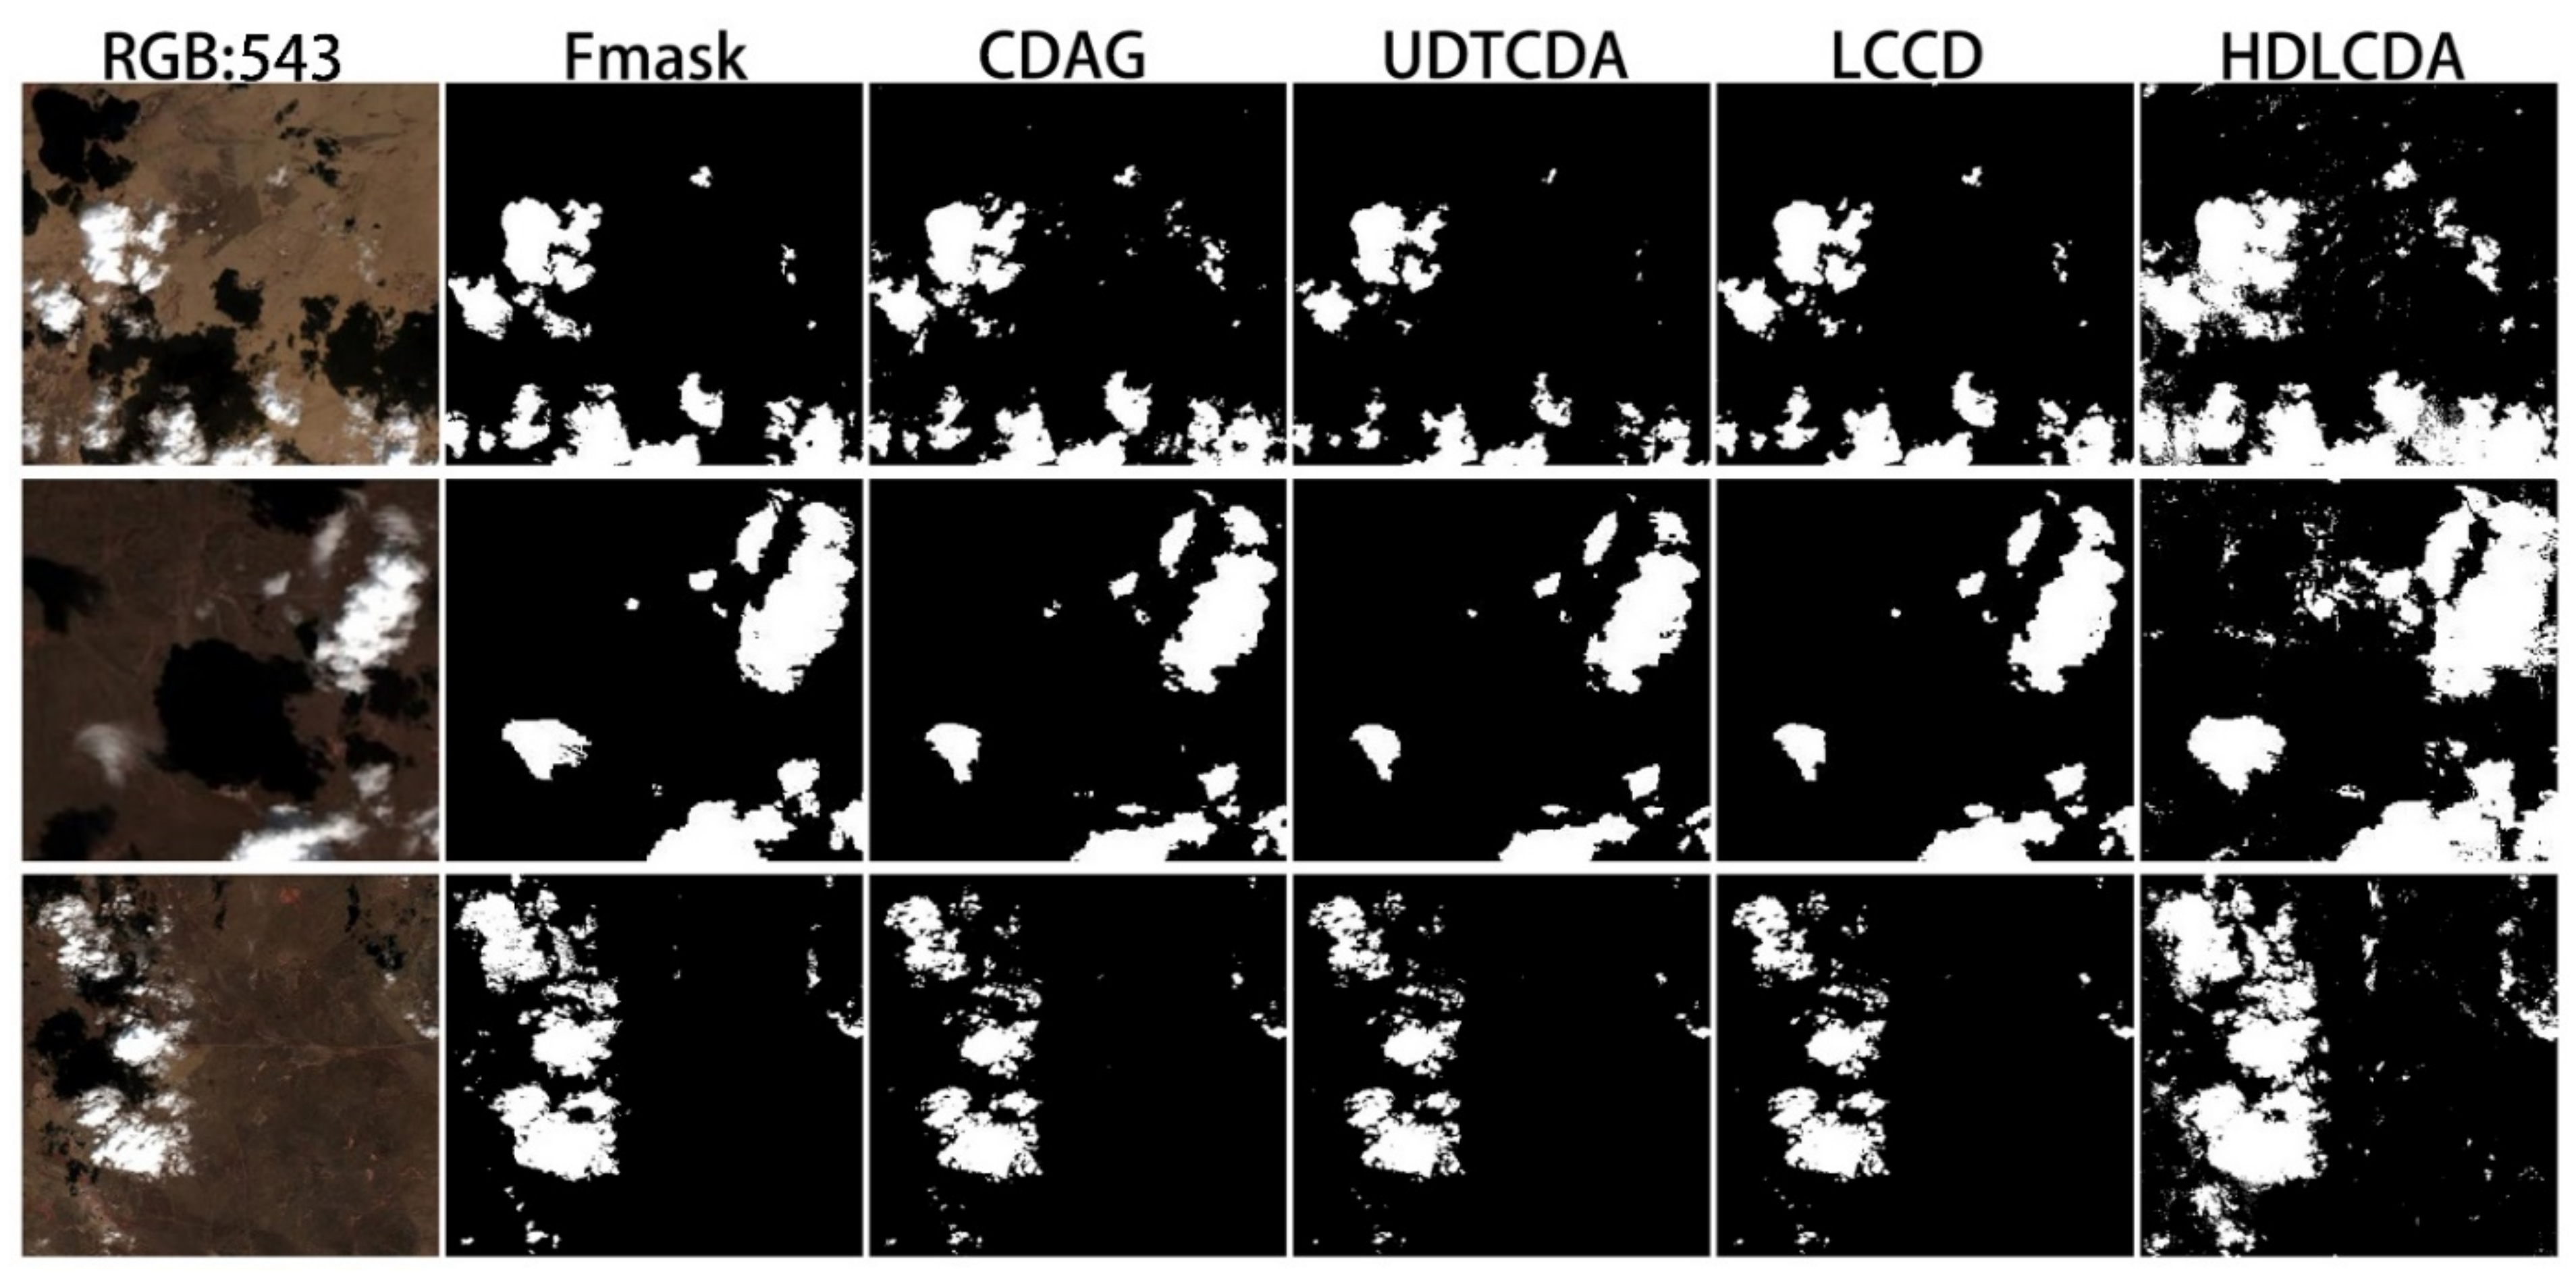
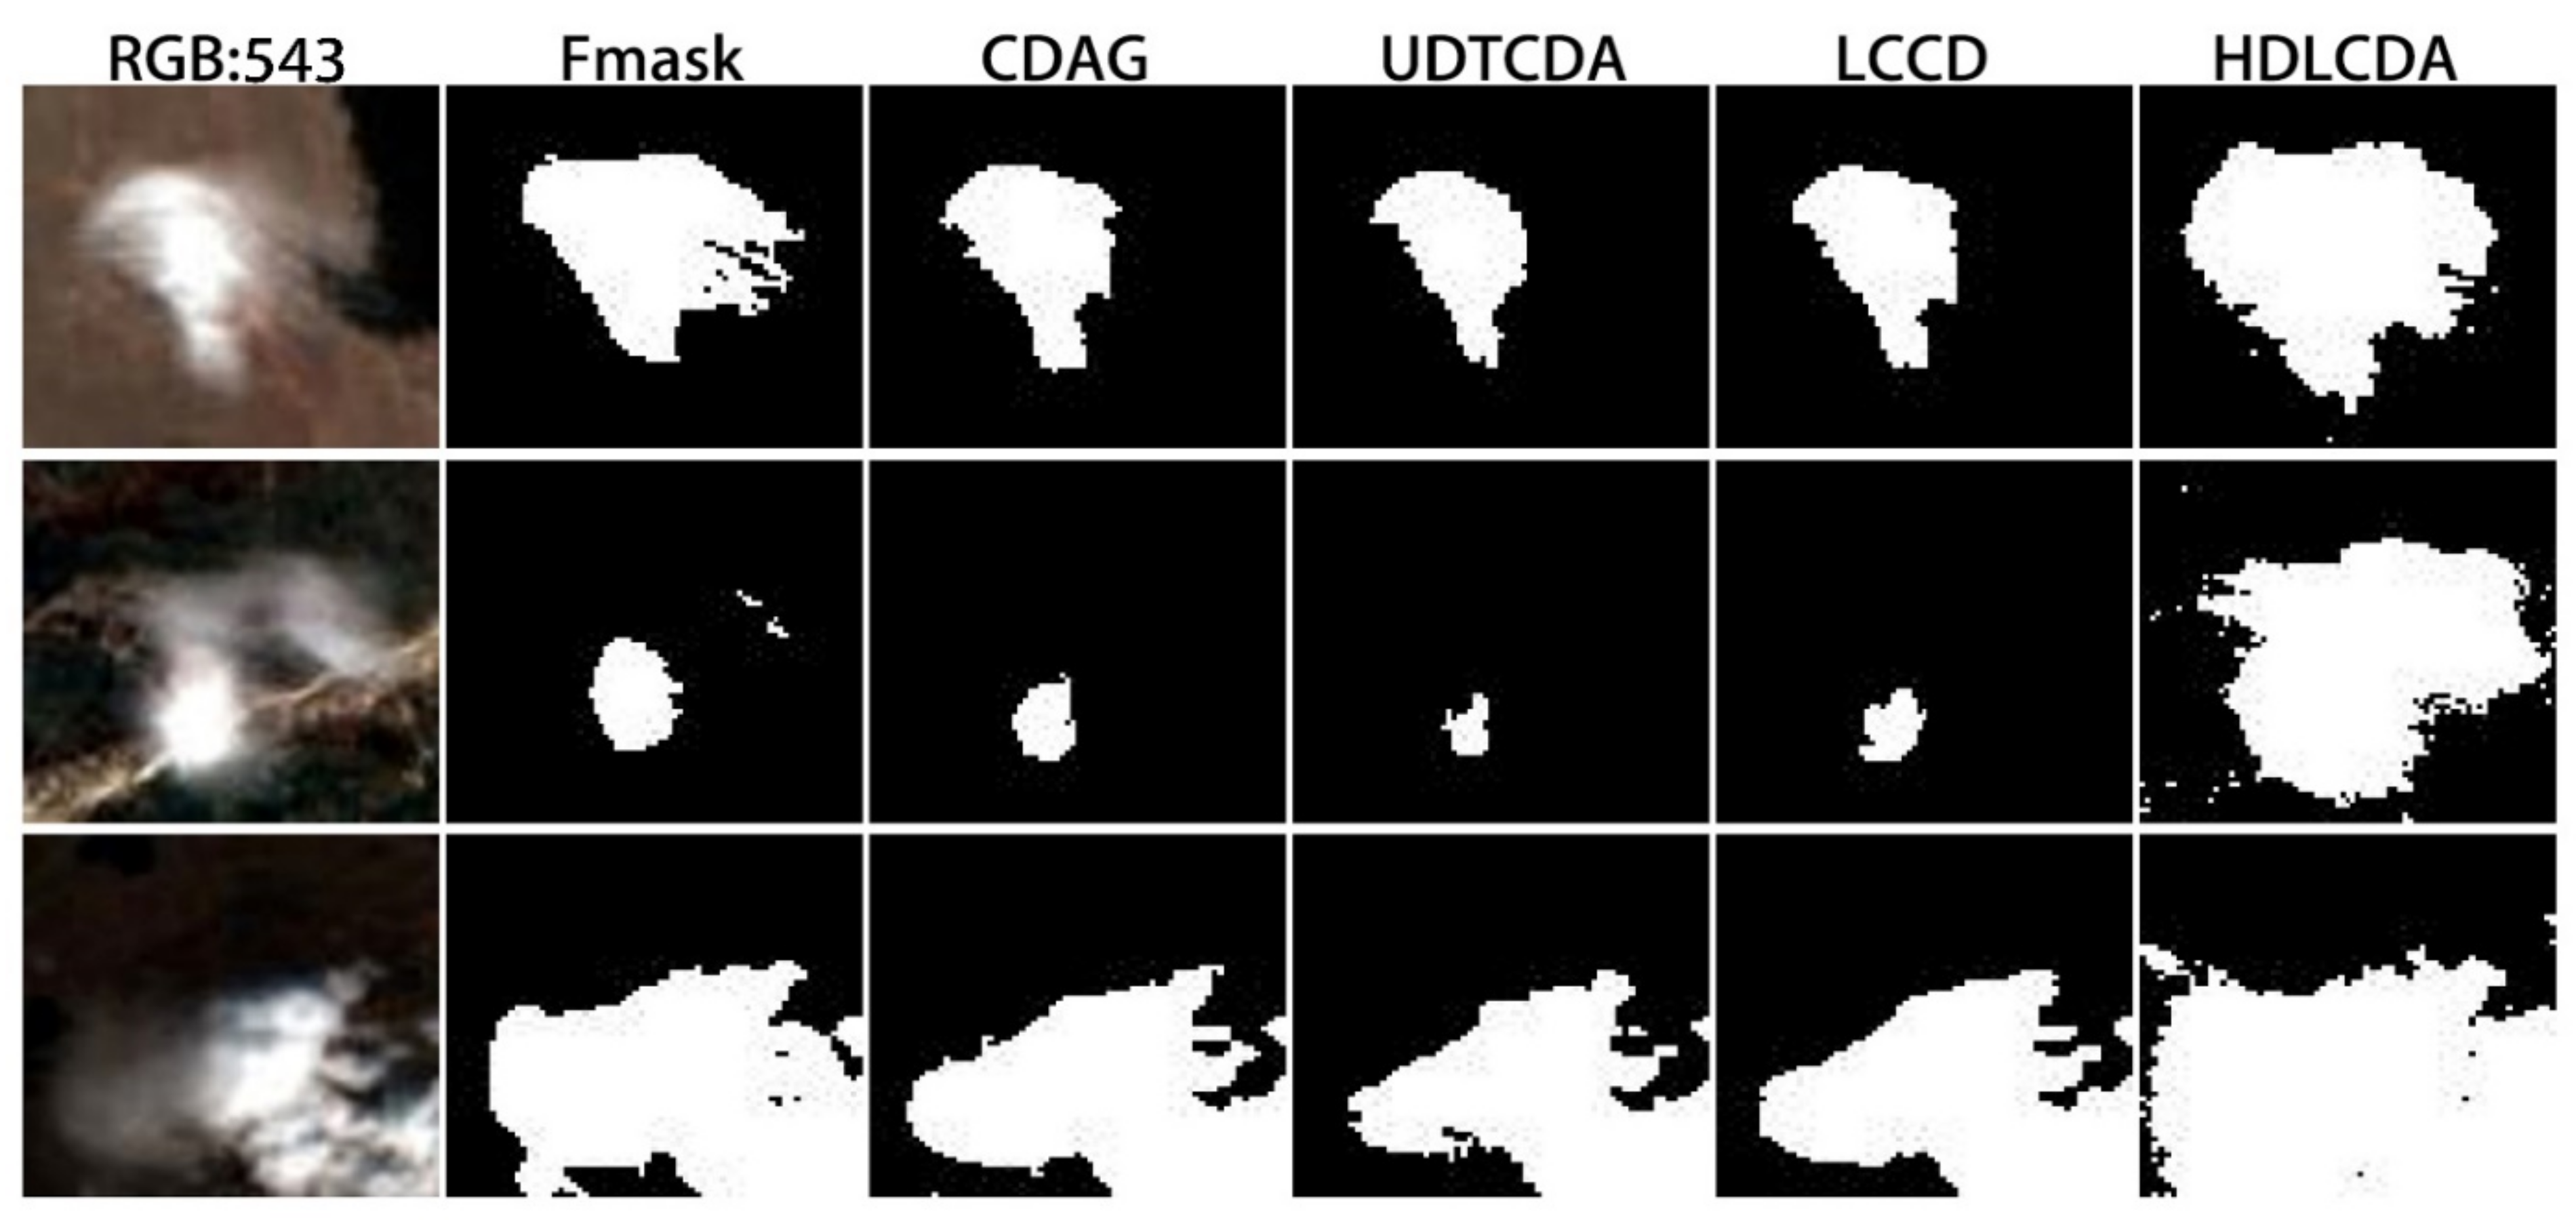
Figure 1 displays the recognition results for different types of clouds over varied vegetation. On the far left are the false color images from the Landsat 8 OLI data, and on the right are the results from the Fmask algorithm, CDAG algorithm, UDTCDA algorithm, LCCD algorithm, and HDLCDA algorithm. For all different types of cloud detection methods, thick clouds over vegetation were able to be more accurately identified. The CDAG algorithm missed the detection of cloud edges. In contrast, the UDTCDA, LCCD, Fmask, and HDLCDA algorithms were better able to identify thick cloud edges, but the LCCD algorithm detected cloud edges with more noise, fuzzy, and misjudgment phenomena. The cloud contour recognized by the Fmask and HDLCDA algorithms was clear and complete, with the best recognition effect.
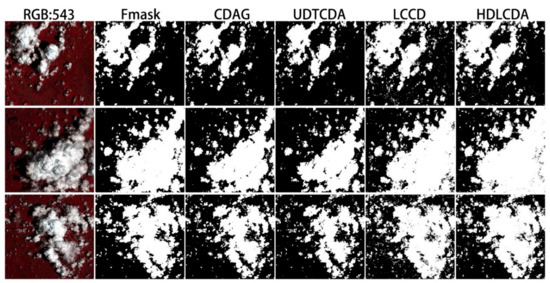
Figure 1.
The detection results of thick clouds over vegetation.
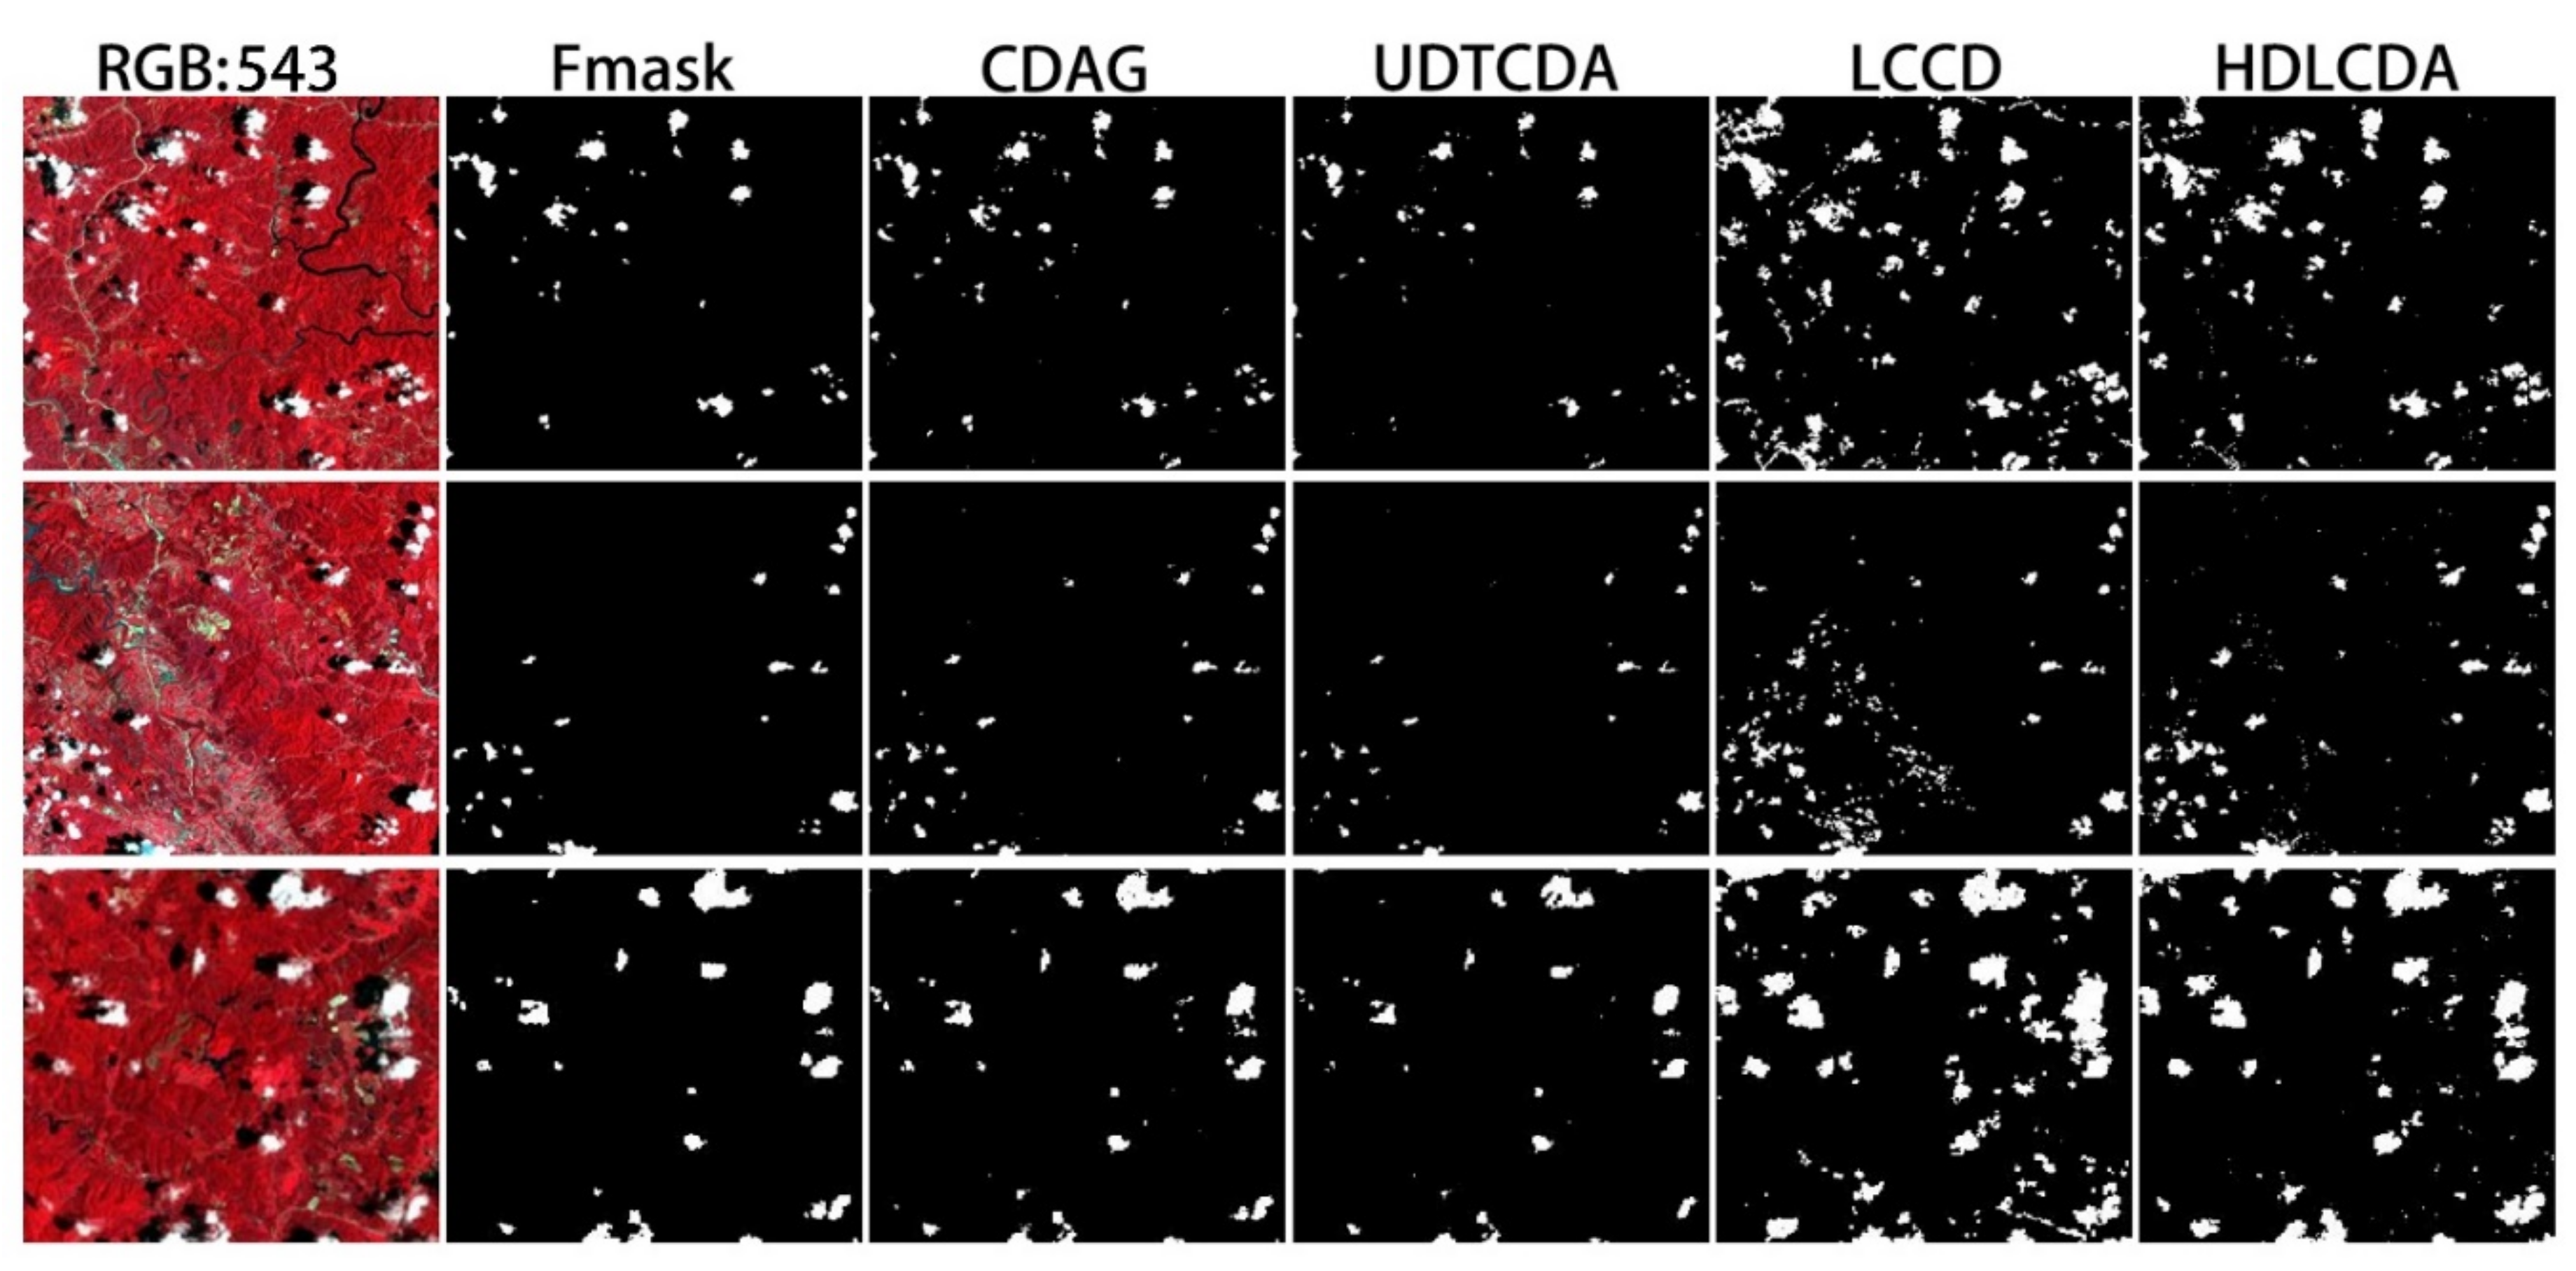
Figure 2 displays the detection results for small patches of broken clouds. In general, these five cloud detection methods have a good recognition effect on broken clouds. However, the different algorithms exhibit different degrees of mis-mention and omission phenomena. The CDAG algorithm, UDTCDA algorithm, and the LCCD algorithm missed the extraction of the shape of the broken cloud. The LCCD algorithm easily misjudged the bright surface as the cloud pixel. However, the Fmask and HDLCDA algorithms were able to identify the complete broken cloud area.
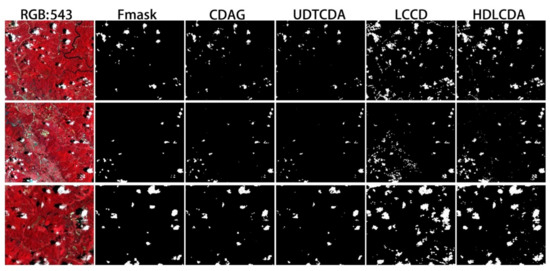
Figure 2.
The detection results of broken clouds over vegetation.
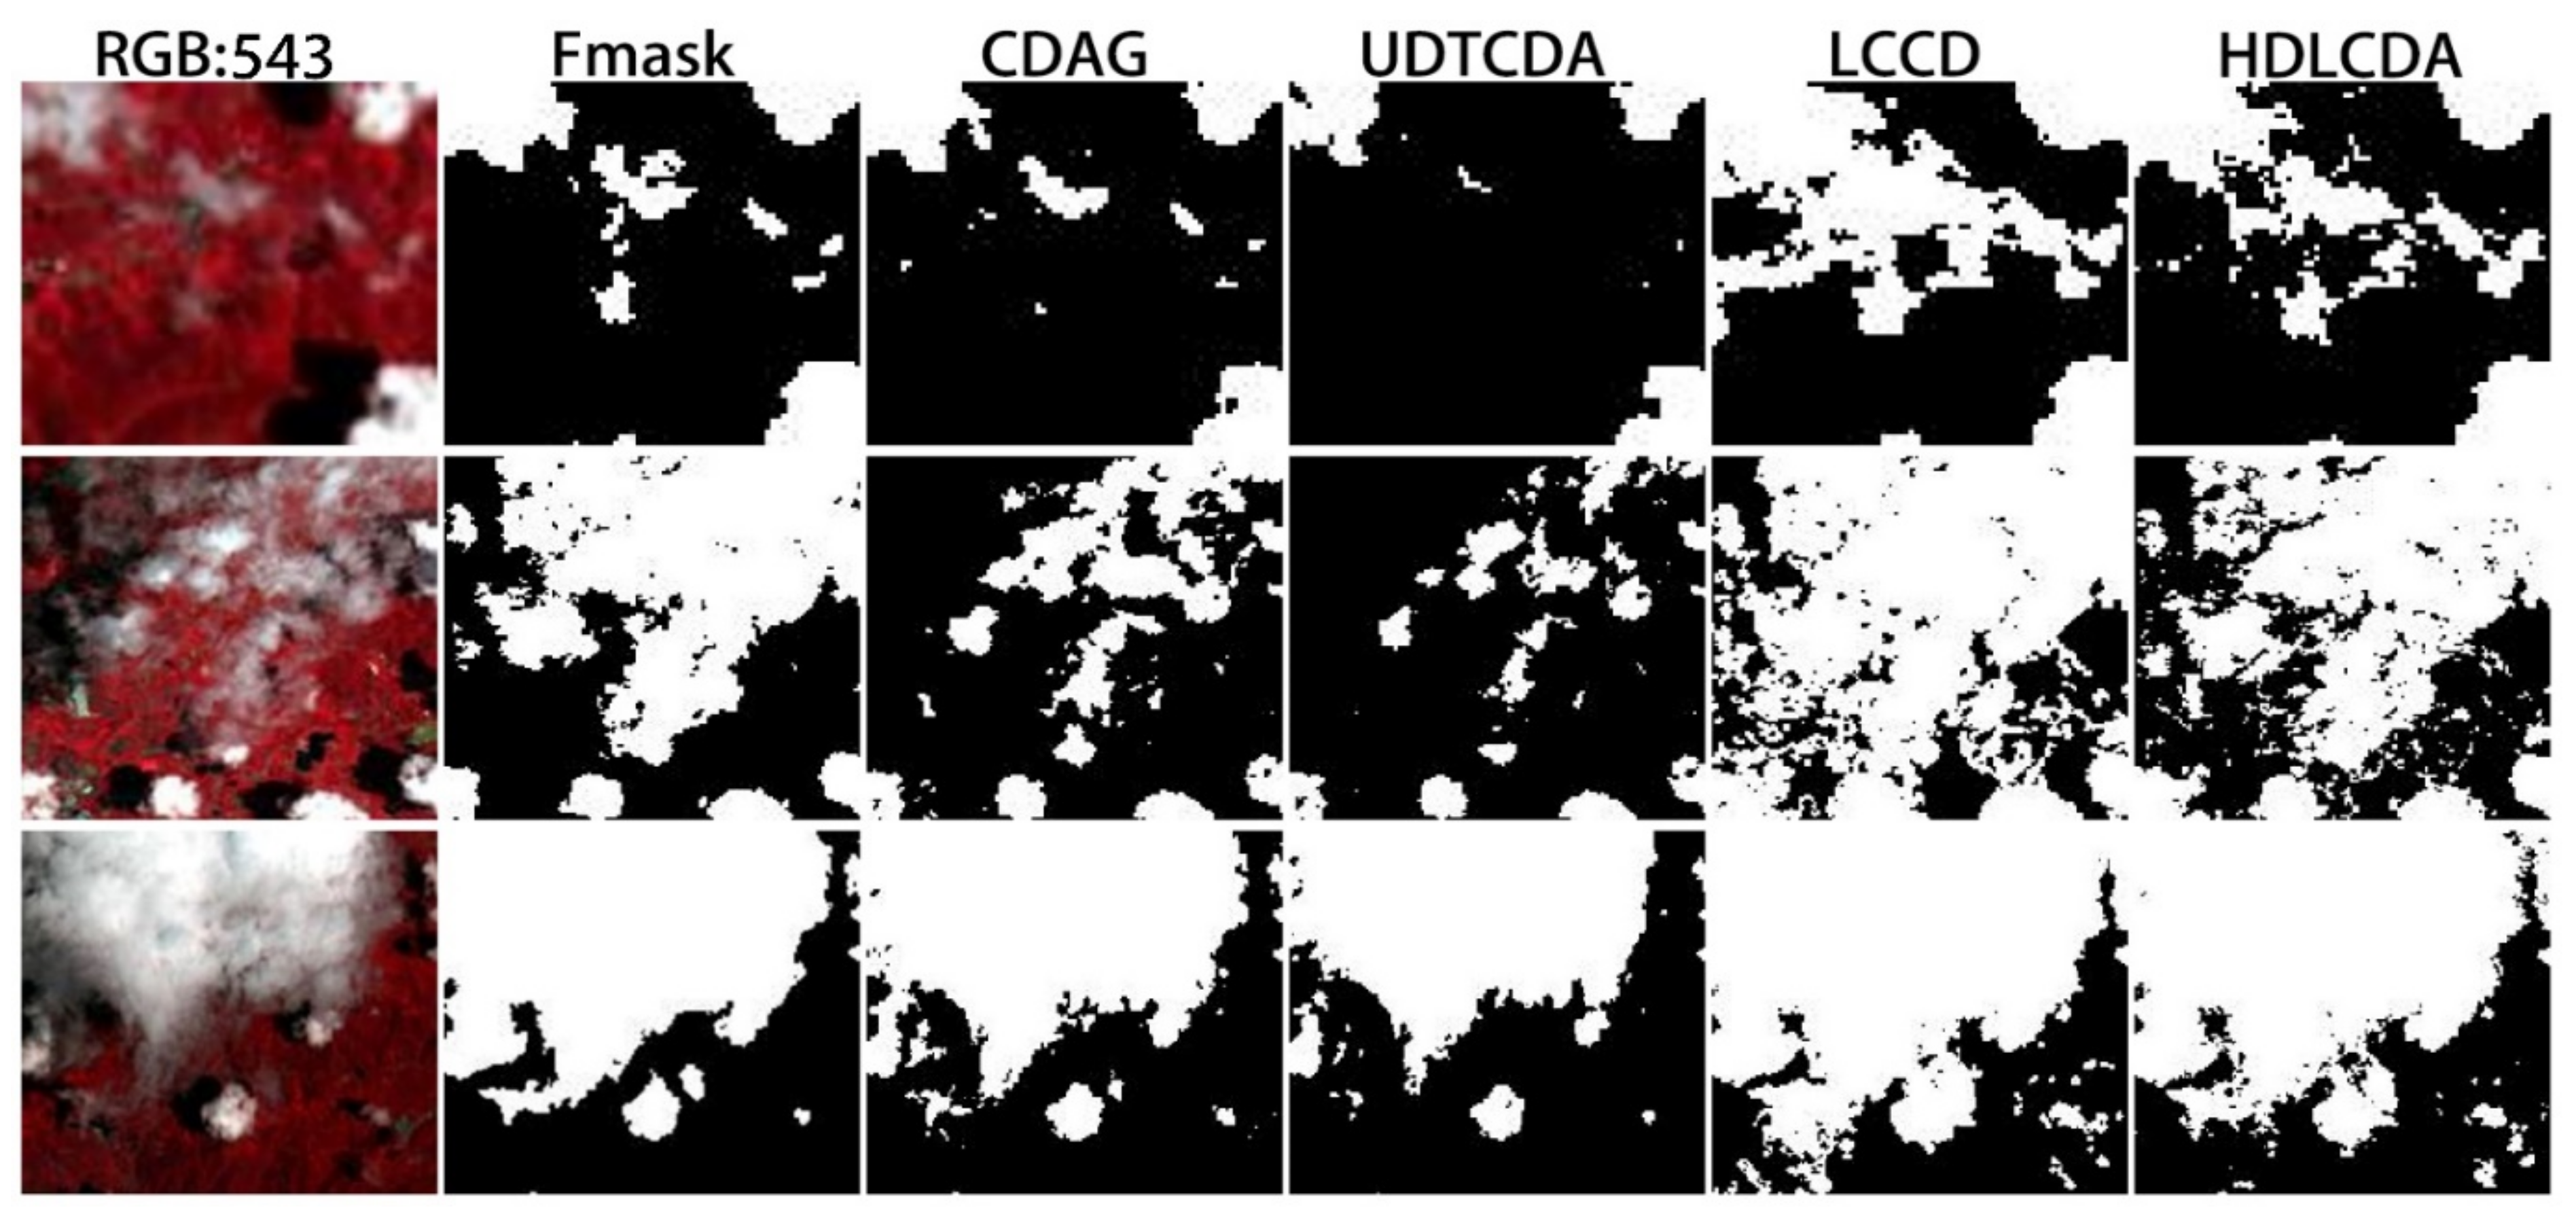
Figure 3 displays the detection results for thin clouds. The reflectance of thin cloud is the result of the combined effect of the cloud and the surface. In comparison, the LCCD, Fmask, and HDLCDA algorithms exhibited better performance in thin cloud recognition. The UDTCDA and CDAG algorithms displayed evident omissions in large patches of thin clouds.
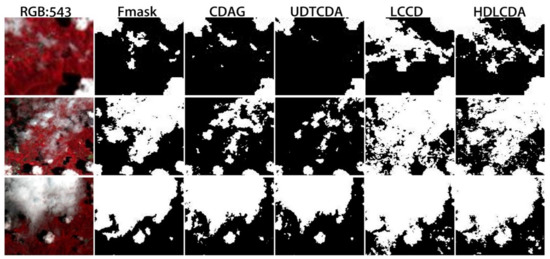
Figure 3.
The detection results for thin clouds over vegetation.
In general, the Fmask algorithm demonstrated the best and most stable cloud recognition effect when used over vegetation. Compared to the CDAG algorithm, the Fmask algorithm not only sets the single-band apparent reflectance threshold, it also sets the brightness temperature threshold and the normalized vegetation index in order to distinguish between vegetation and thin clouds over vegetation. The NDVI value of clouds was usually around zero and the temperature was low. Therefore, this feature could be utilized to distinguish clouds from vegetation.
3.2. Cloud Detection over Water
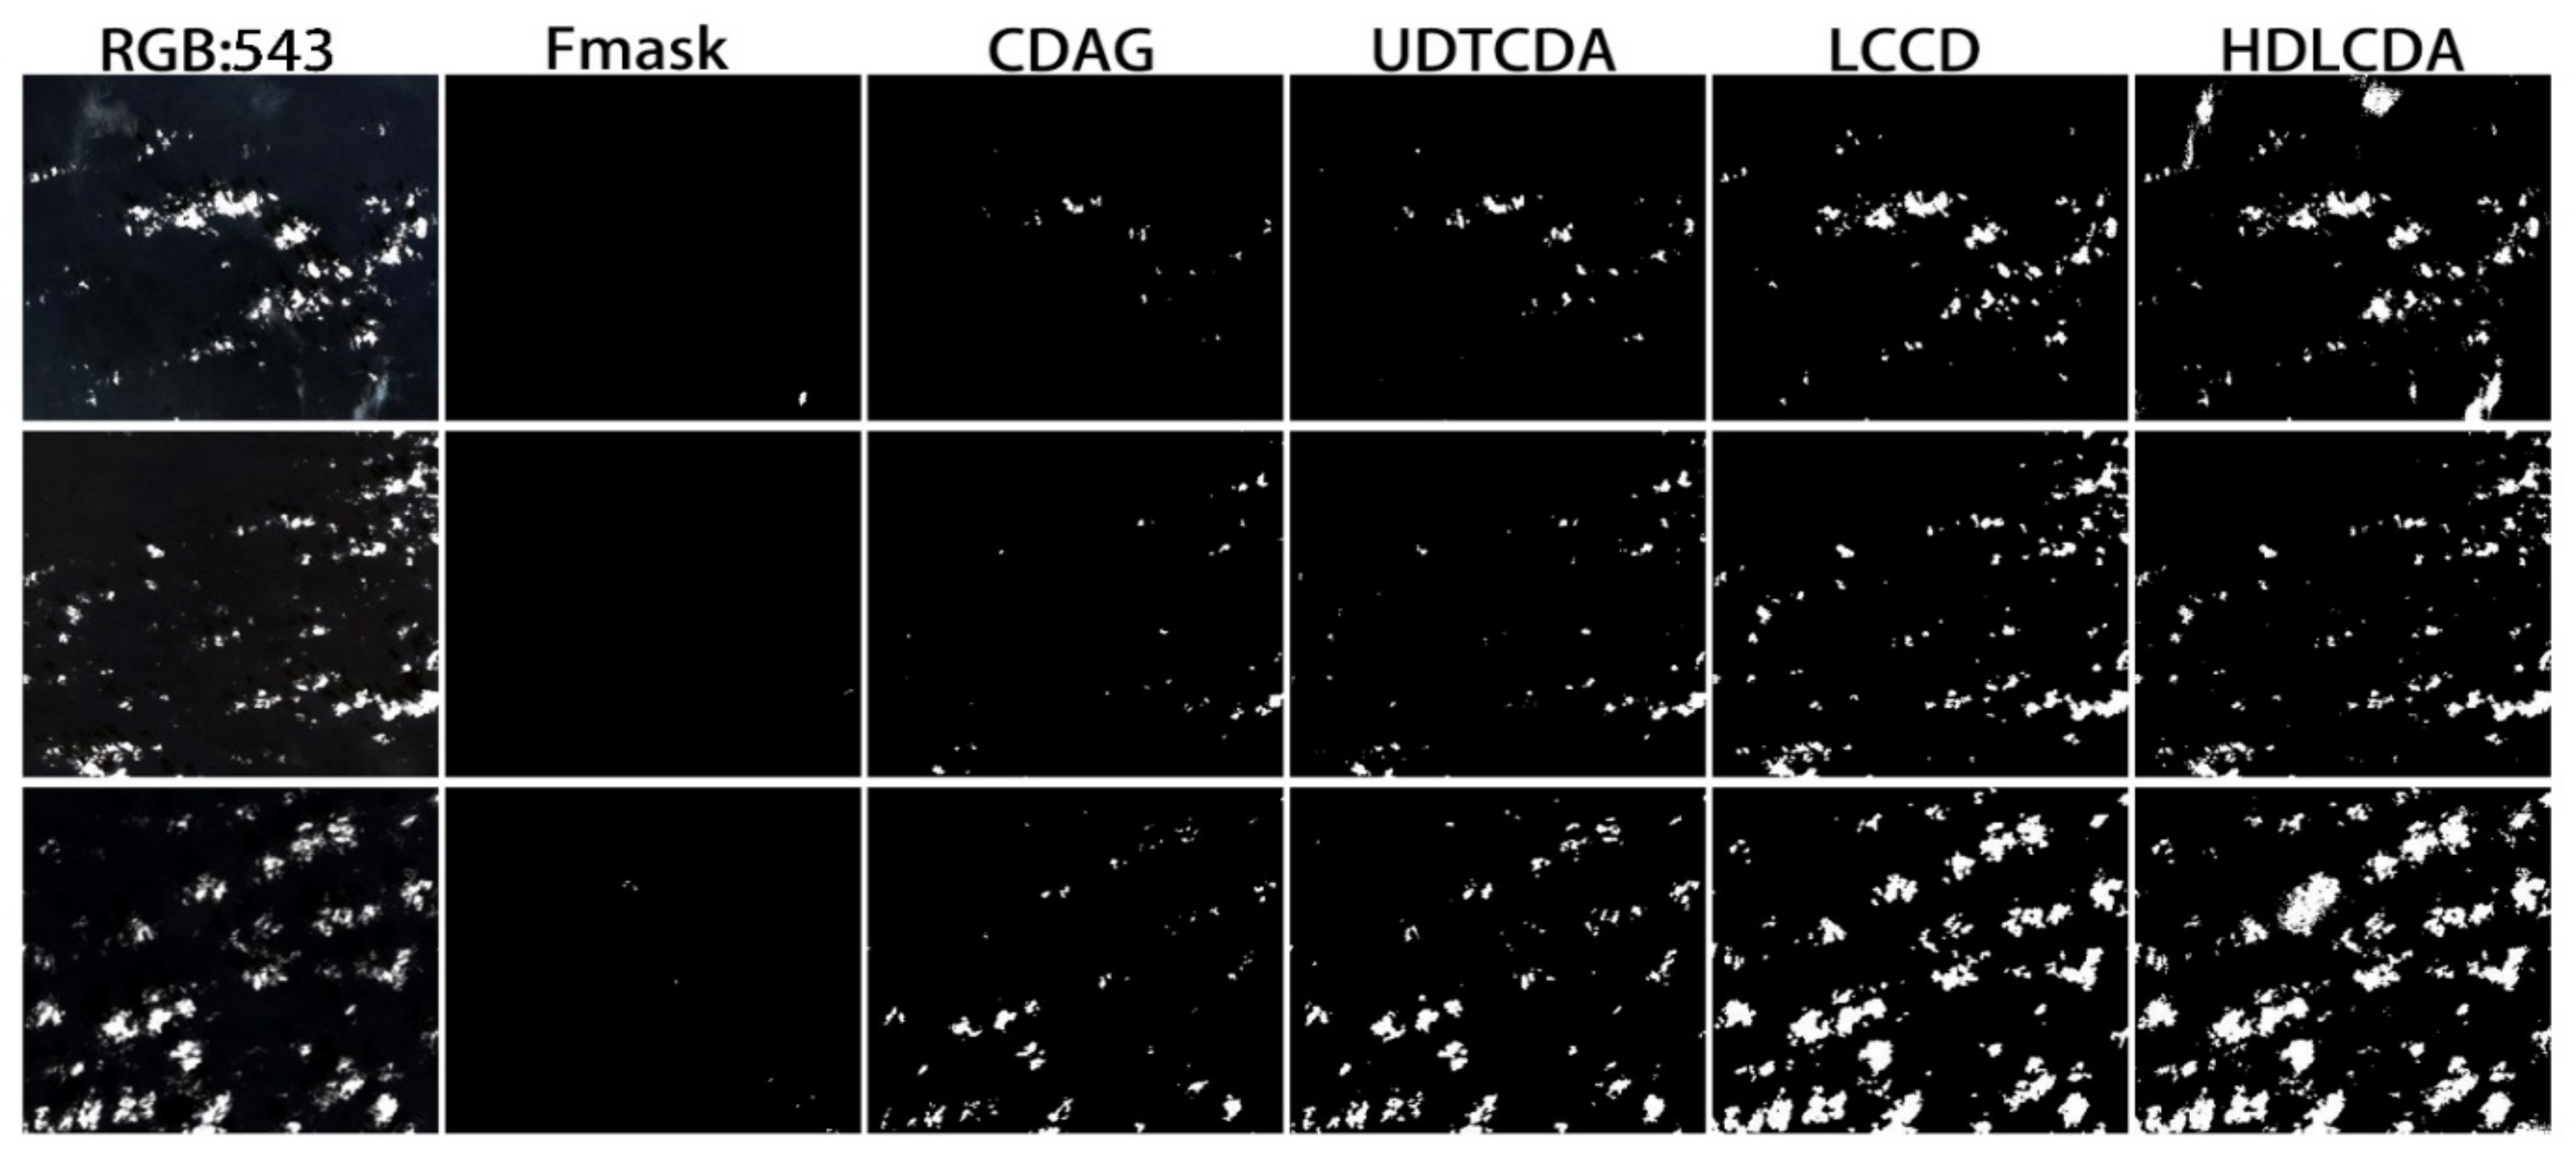
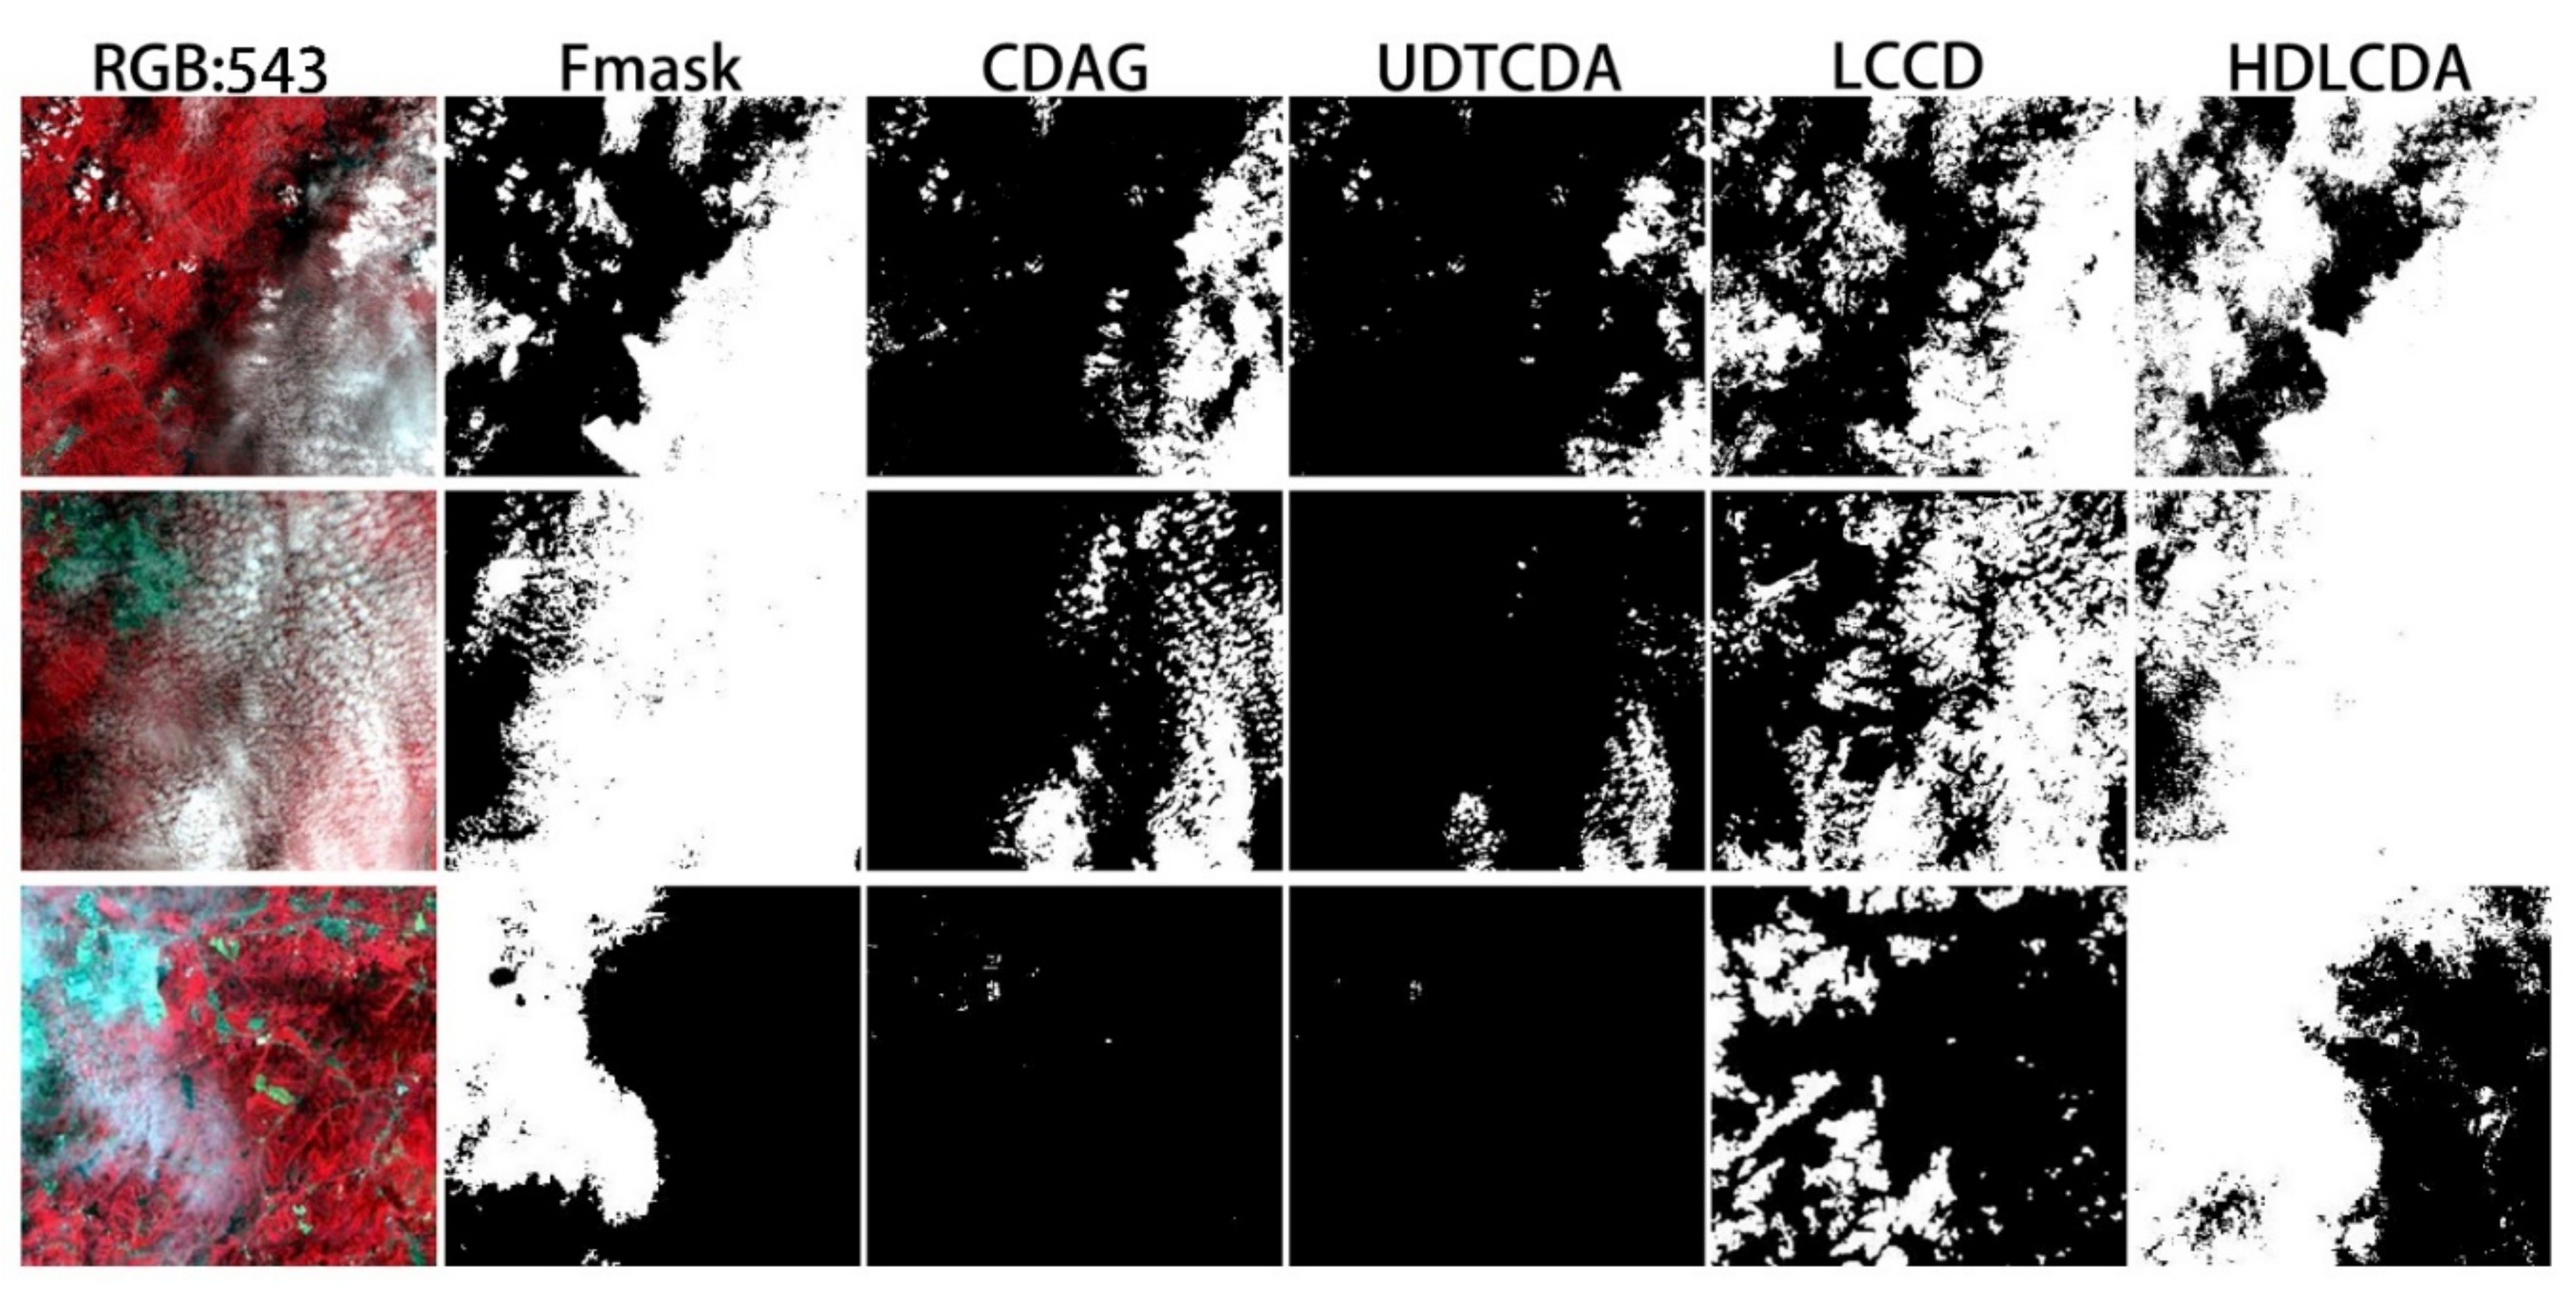
Figure 4 displays the thick cloud detection results from five cloud detection algorithms over water. It can be observed that the LCCD algorithm and the HDLCDA algorithm displayed the acquisition of thick clouds over water most accurately, followed by the UDTCDA algorithm. However, the omissions of the Fmask and CDAG algorithms were serious.
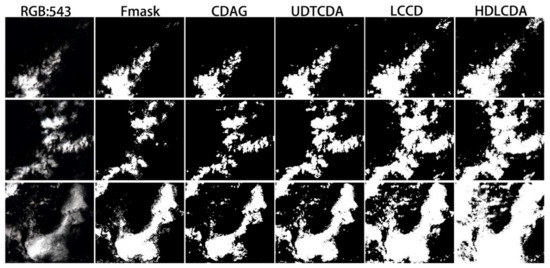
Figure 4.
The detection results for thick clouds over water.
Figure 5 displays the detection results for broken clouds over water from five cloud detection methods. It can be observed that the LCCD algorithm and the HDLCDA algorithm obtained a relatively complete broken cloud shape over the water. The UDTCDA algorithm and the CDAG algorithm detected the center of the broken cloud. However, a few small broken clouds could not be detected. The Fmask algorithm could hardly detect broken clouds over the water.
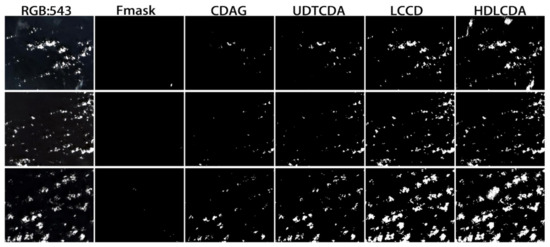
Figure 5.
The detection results for broken clouds over water.
As shown in Figure 6, the HDLCDA algorithm could identify only a few extremely thin clouds over the water, followed by the LCCD algorithm. The UDTCDA, CDAG, and Fmask algorithms failed to obtain thin cloud information over water, and a large range of omission was detected.
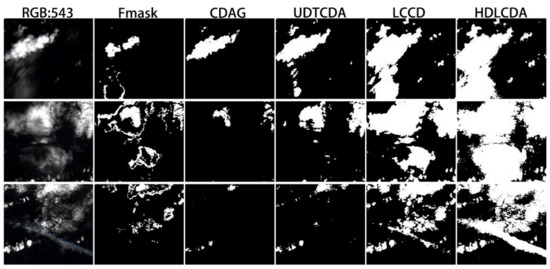
Figure 6.
The detection results for thin clouds over water.
Comparing the recognition results from five cloud detection algorithms for different types of clouds over water, the HDLCDA algorithm demonstrated the highest recognition accuracy, followed by the UDTCDA algorithm and LCCD algorithm with the support from surface information. However, the Fmask and CDAG algorithms without any support from the surface information demonstrated relatively low levels of accuracy. This is because when water is covered by thin clouds or broken clouds, the reflectance is the combined result of the low water reflectance and the cloud reflectance. Since the reflectance of water is low, the reflectance of thin clouds and broken clouds is usually low. As a result, cloud detection methods with unknown surface information, such as the CDAG and the Fmask algorithms, cannot set appropriate thresholds to detect them. However, if the surface information is known, the threshold can be set based on the reflectance of water or the water type. Owing to the large difference in reflectance between clouds and water, thin clouds and broken clouds can be easily identified. Therefore, the UDTCDA and LCCD algorithms exhibit high accuracy. However, the HDLCDA algorithm contains stronger information mining ability and displays an apparent advantage in the detection of thin cloud fragments over water.
3.3. Cloud Detection over Bare Land
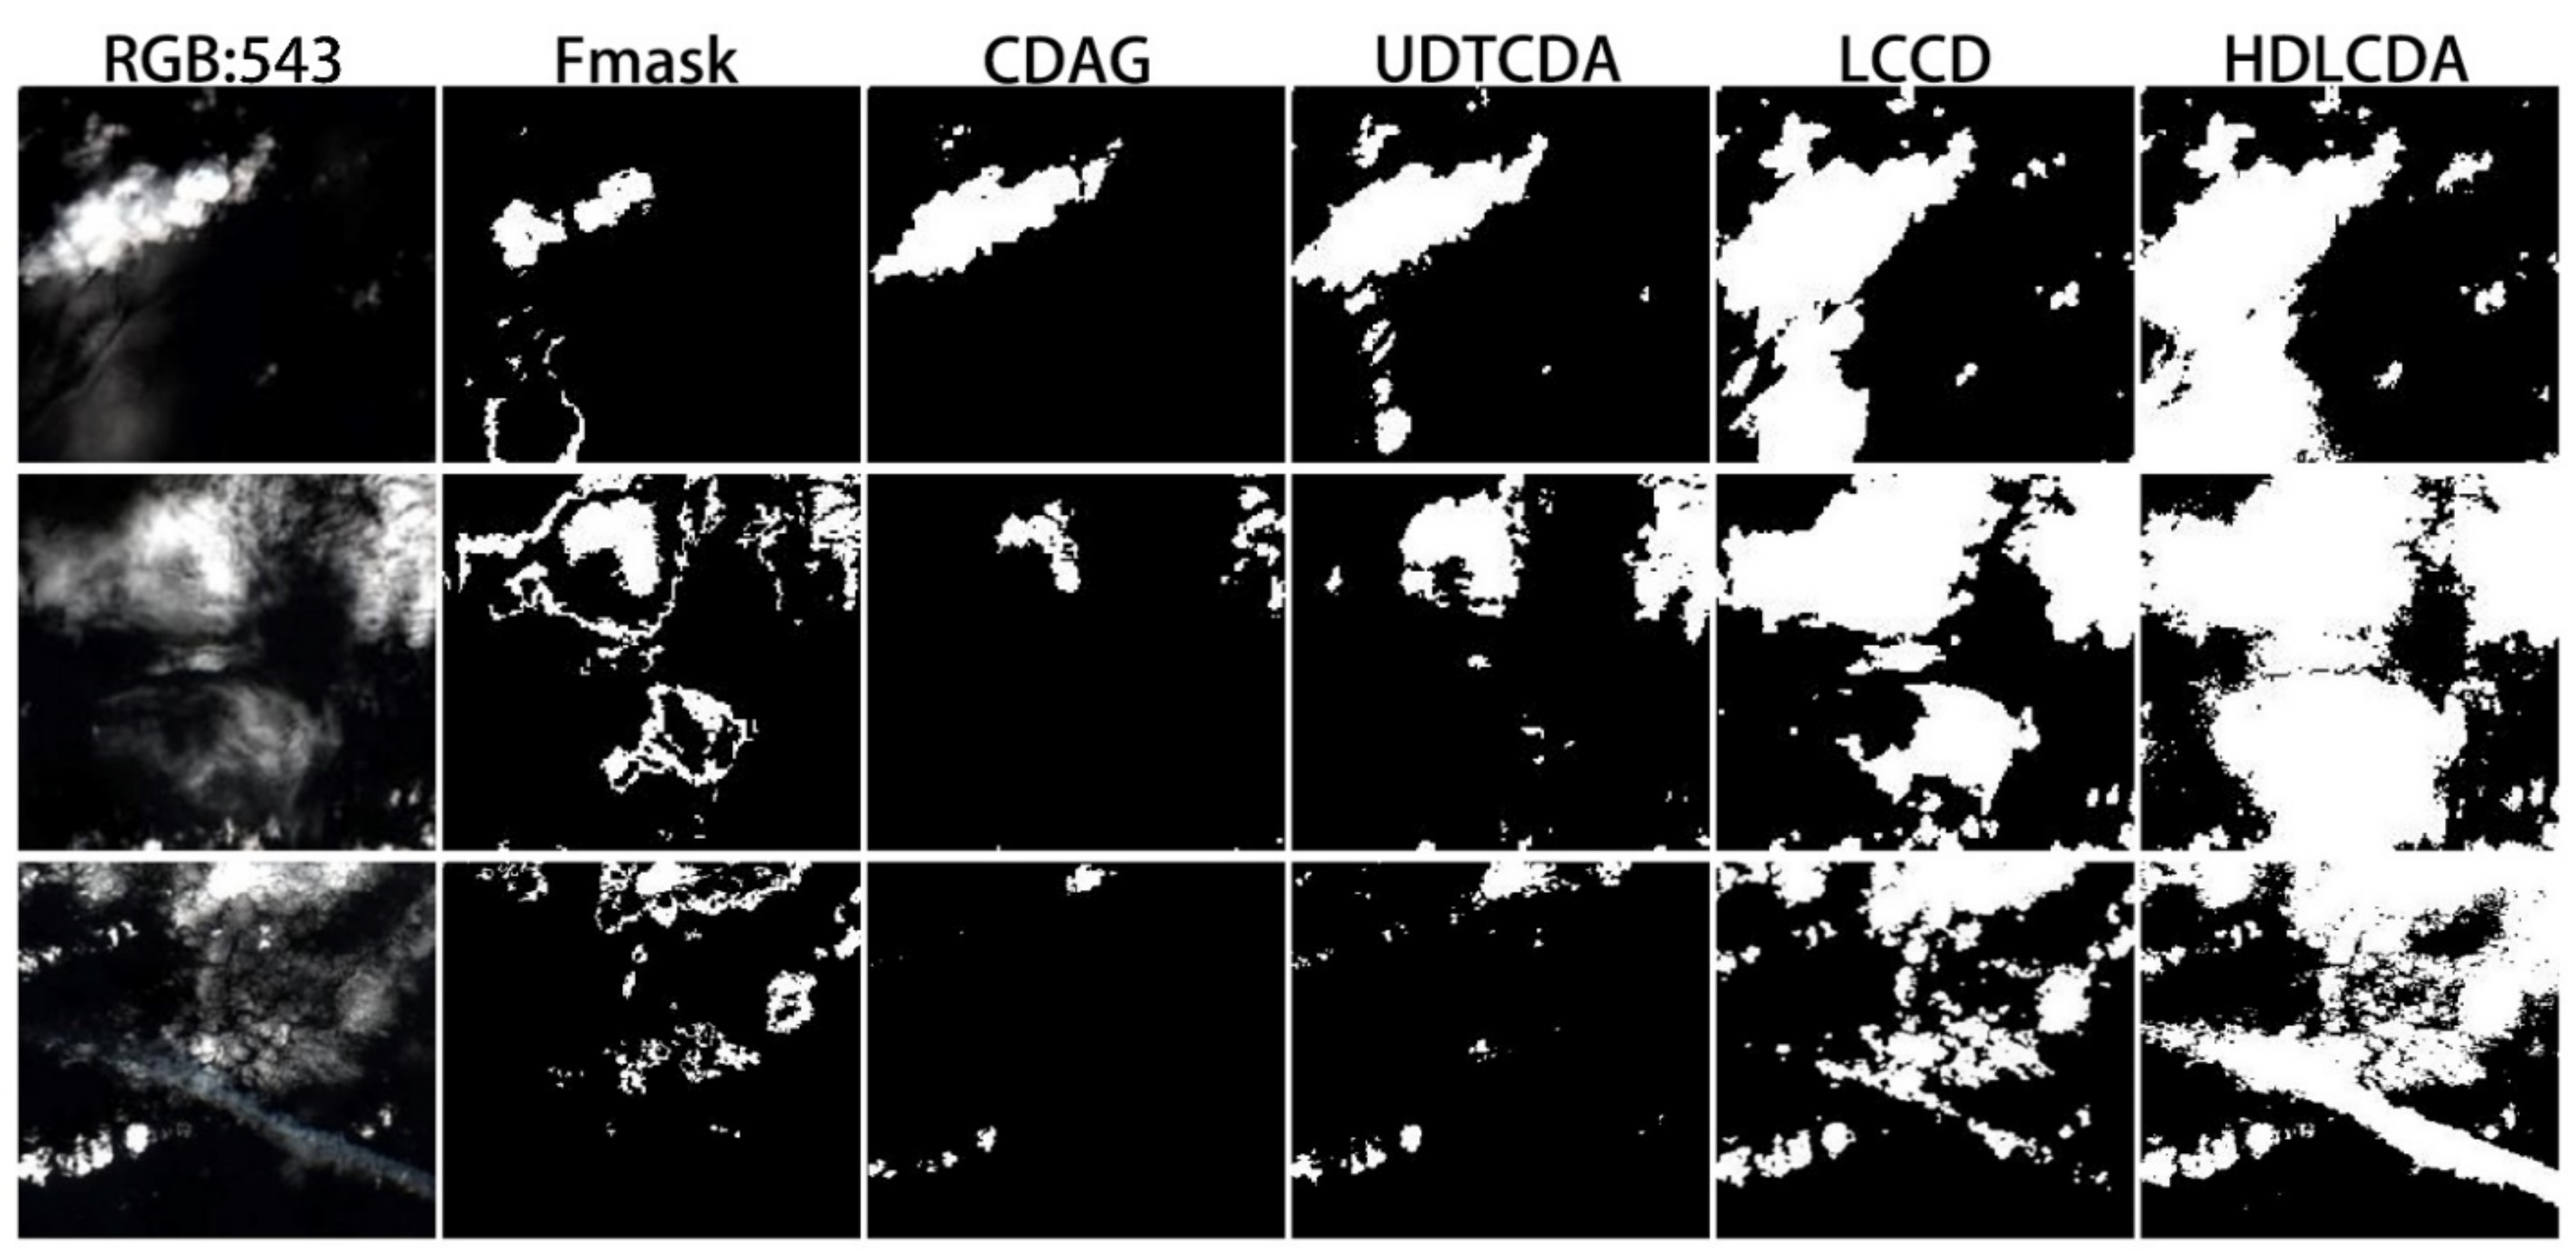
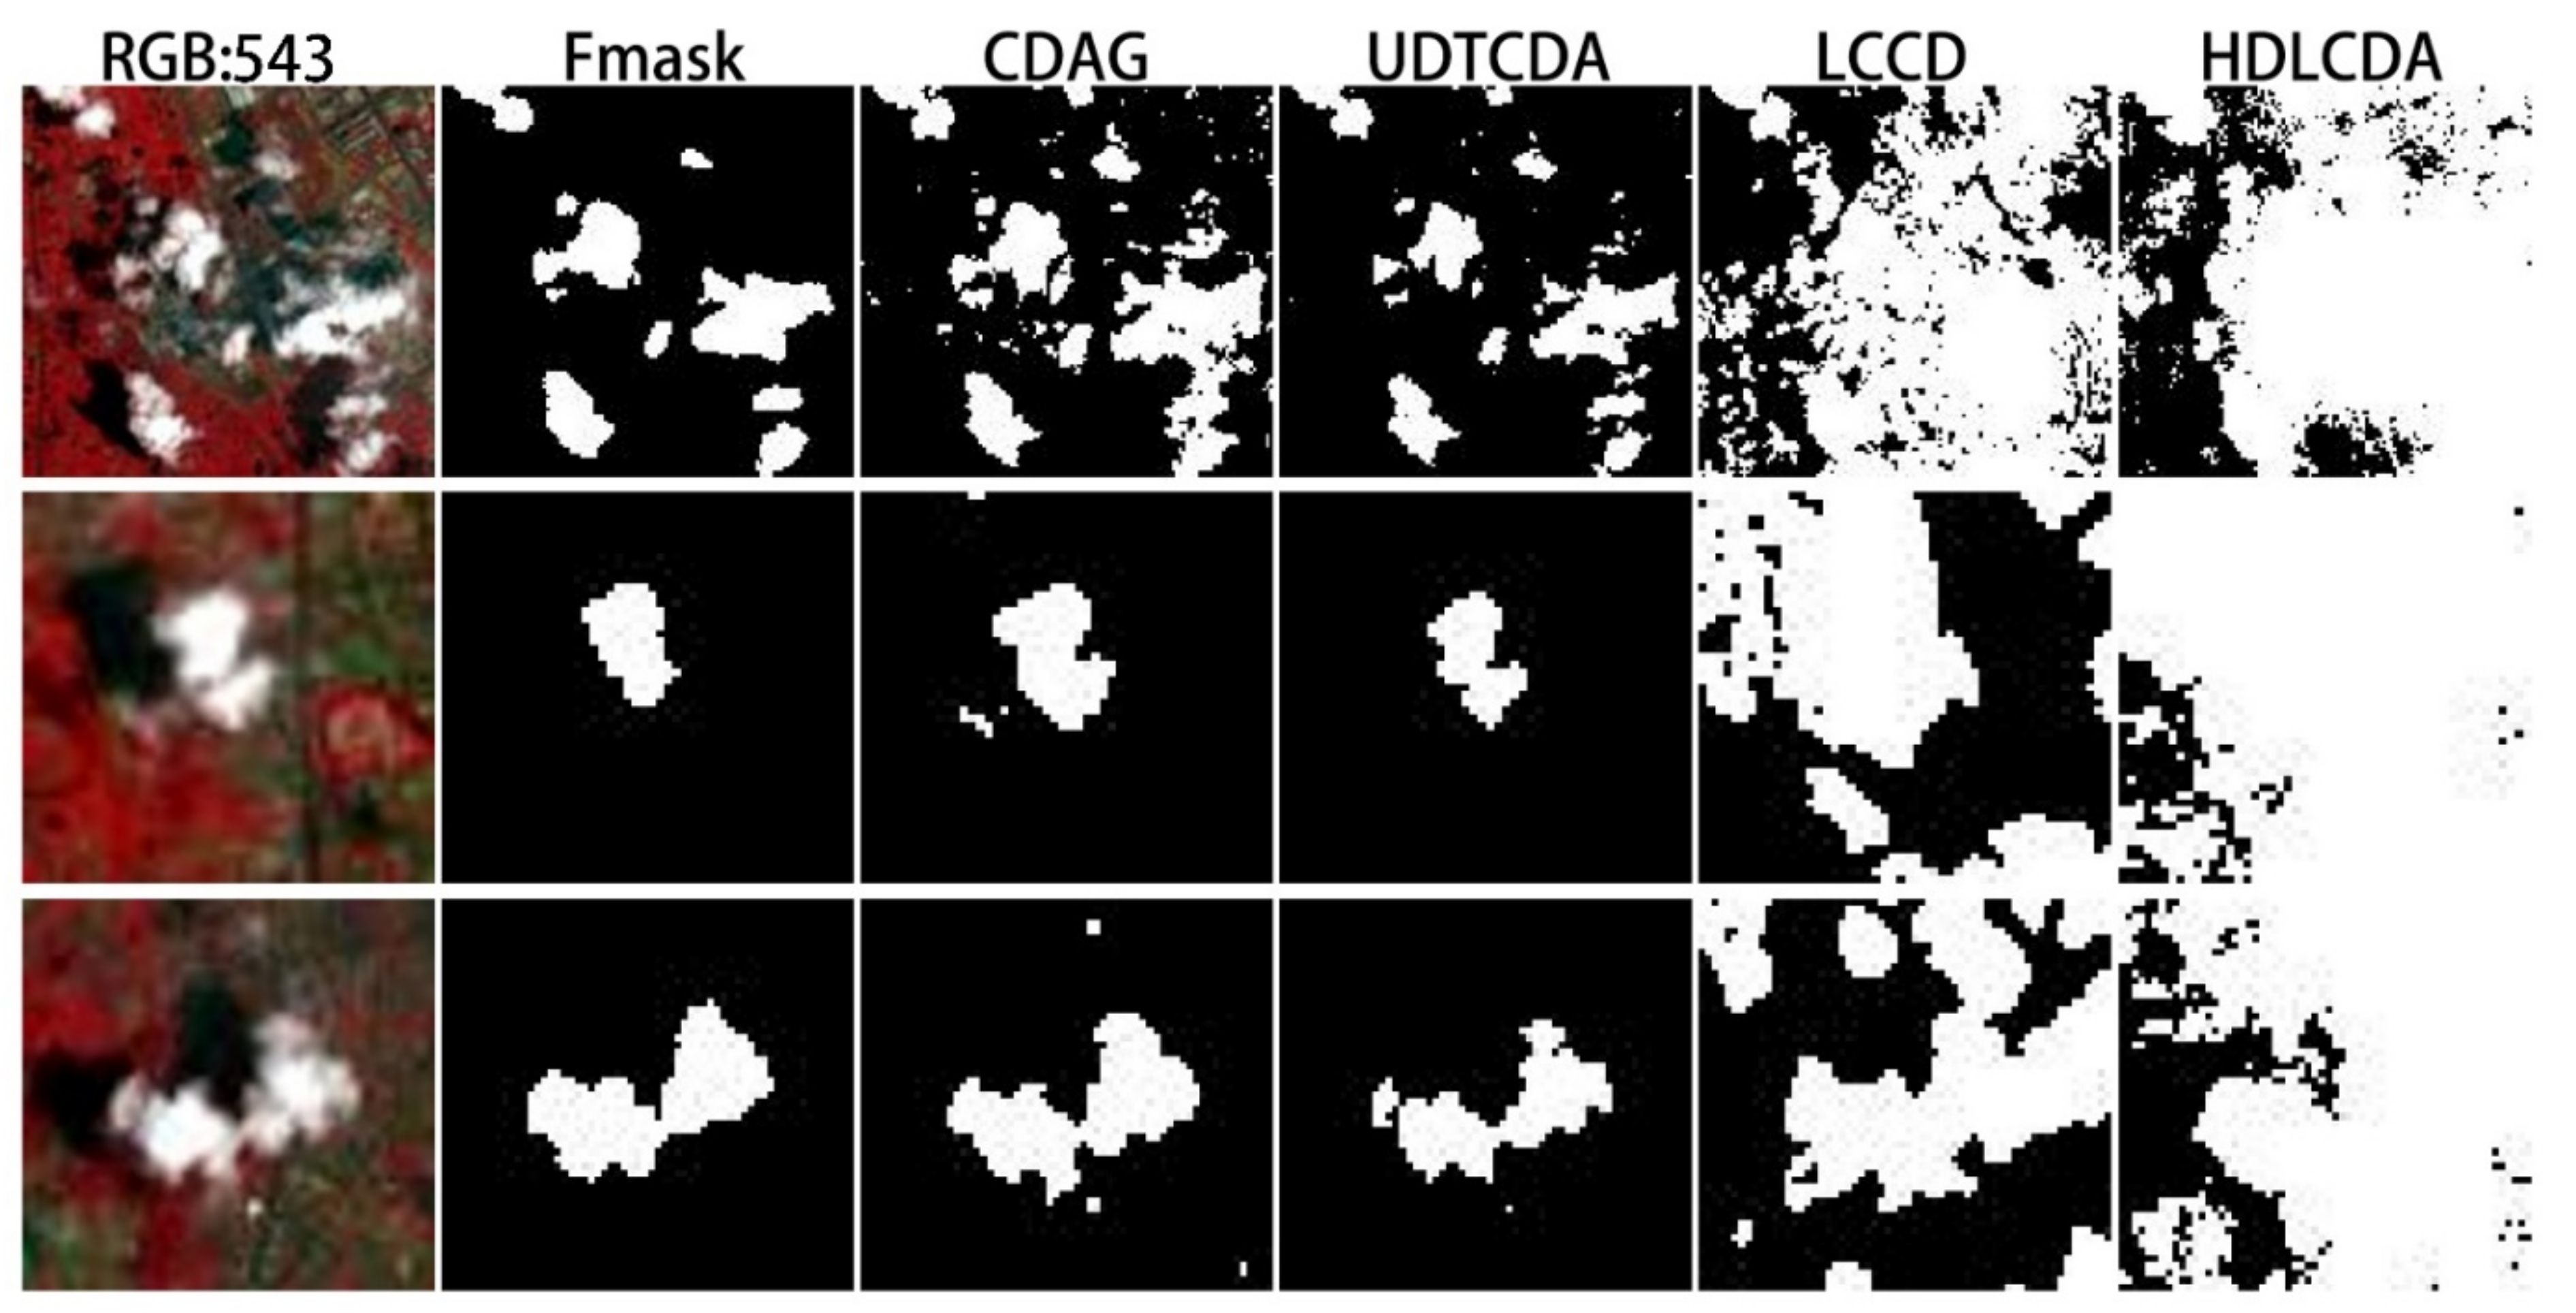
Figure 7 displays the thick cloud detection results from five cloud detection algorithms over bare land. It can be observed that the HDLCDA algorithm not only accurately extracted the contour of thick clouds over bare land, but also perfectly depicted the thin clouds enveloped by the edge of thick clouds. The Fmask, UDTCDA, and LCCD algorithms also accurately extracted the contours of thick clouds. However, minute details pertaining to thin cloud edges could not be extracted competently. The detection results of the CDAG algorithm were unstable, resulting in inaccurate information on a bright surface.
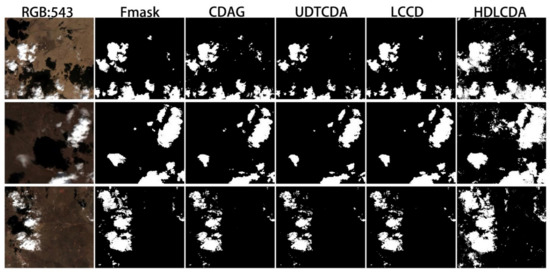
Figure 7.
The detection results for thick clouds over bare ground.
As shown in Figure 8, the HDLCDA algorithm still maintains a high level of recognition accuracy and could accurately identify the edges of broken clouds and small broken clouds. The Fmask, UDTCDA, and LCCD algorithms could only detect the centers of broken clouds, but they were not effective in edge detection. The CDAG algorithm still has a wide range of false mentions.
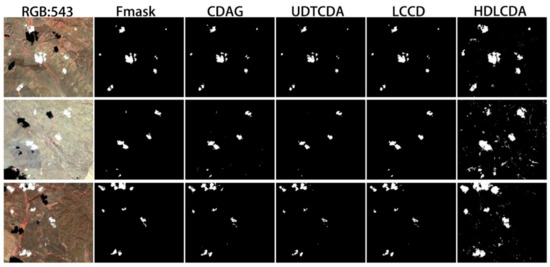
Figure 8.
The detection results for broken clouds over bare ground.
As observed from the recognition results for the thin clouds over the highlighted bare ground (Figure 9), the HDLCDA algorithm demonstrated the best recognition effect and could obtain the complete information for thin clouds, with a significantly higher level of detection detail than the other four algorithms. The other four cloud detection algorithms did not detect the edges of thin clouds properly, and even failed to accurately identify the area covered by thin clouds.
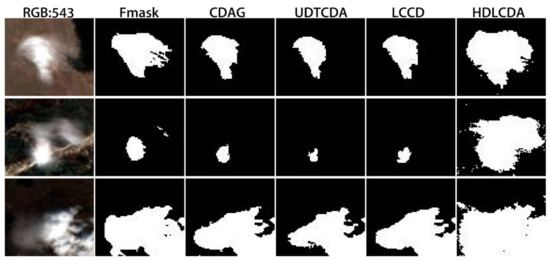
Figure 9.
The detection results for thin clouds over bare ground.
3.4. Cloud Detection over Artificial Surface
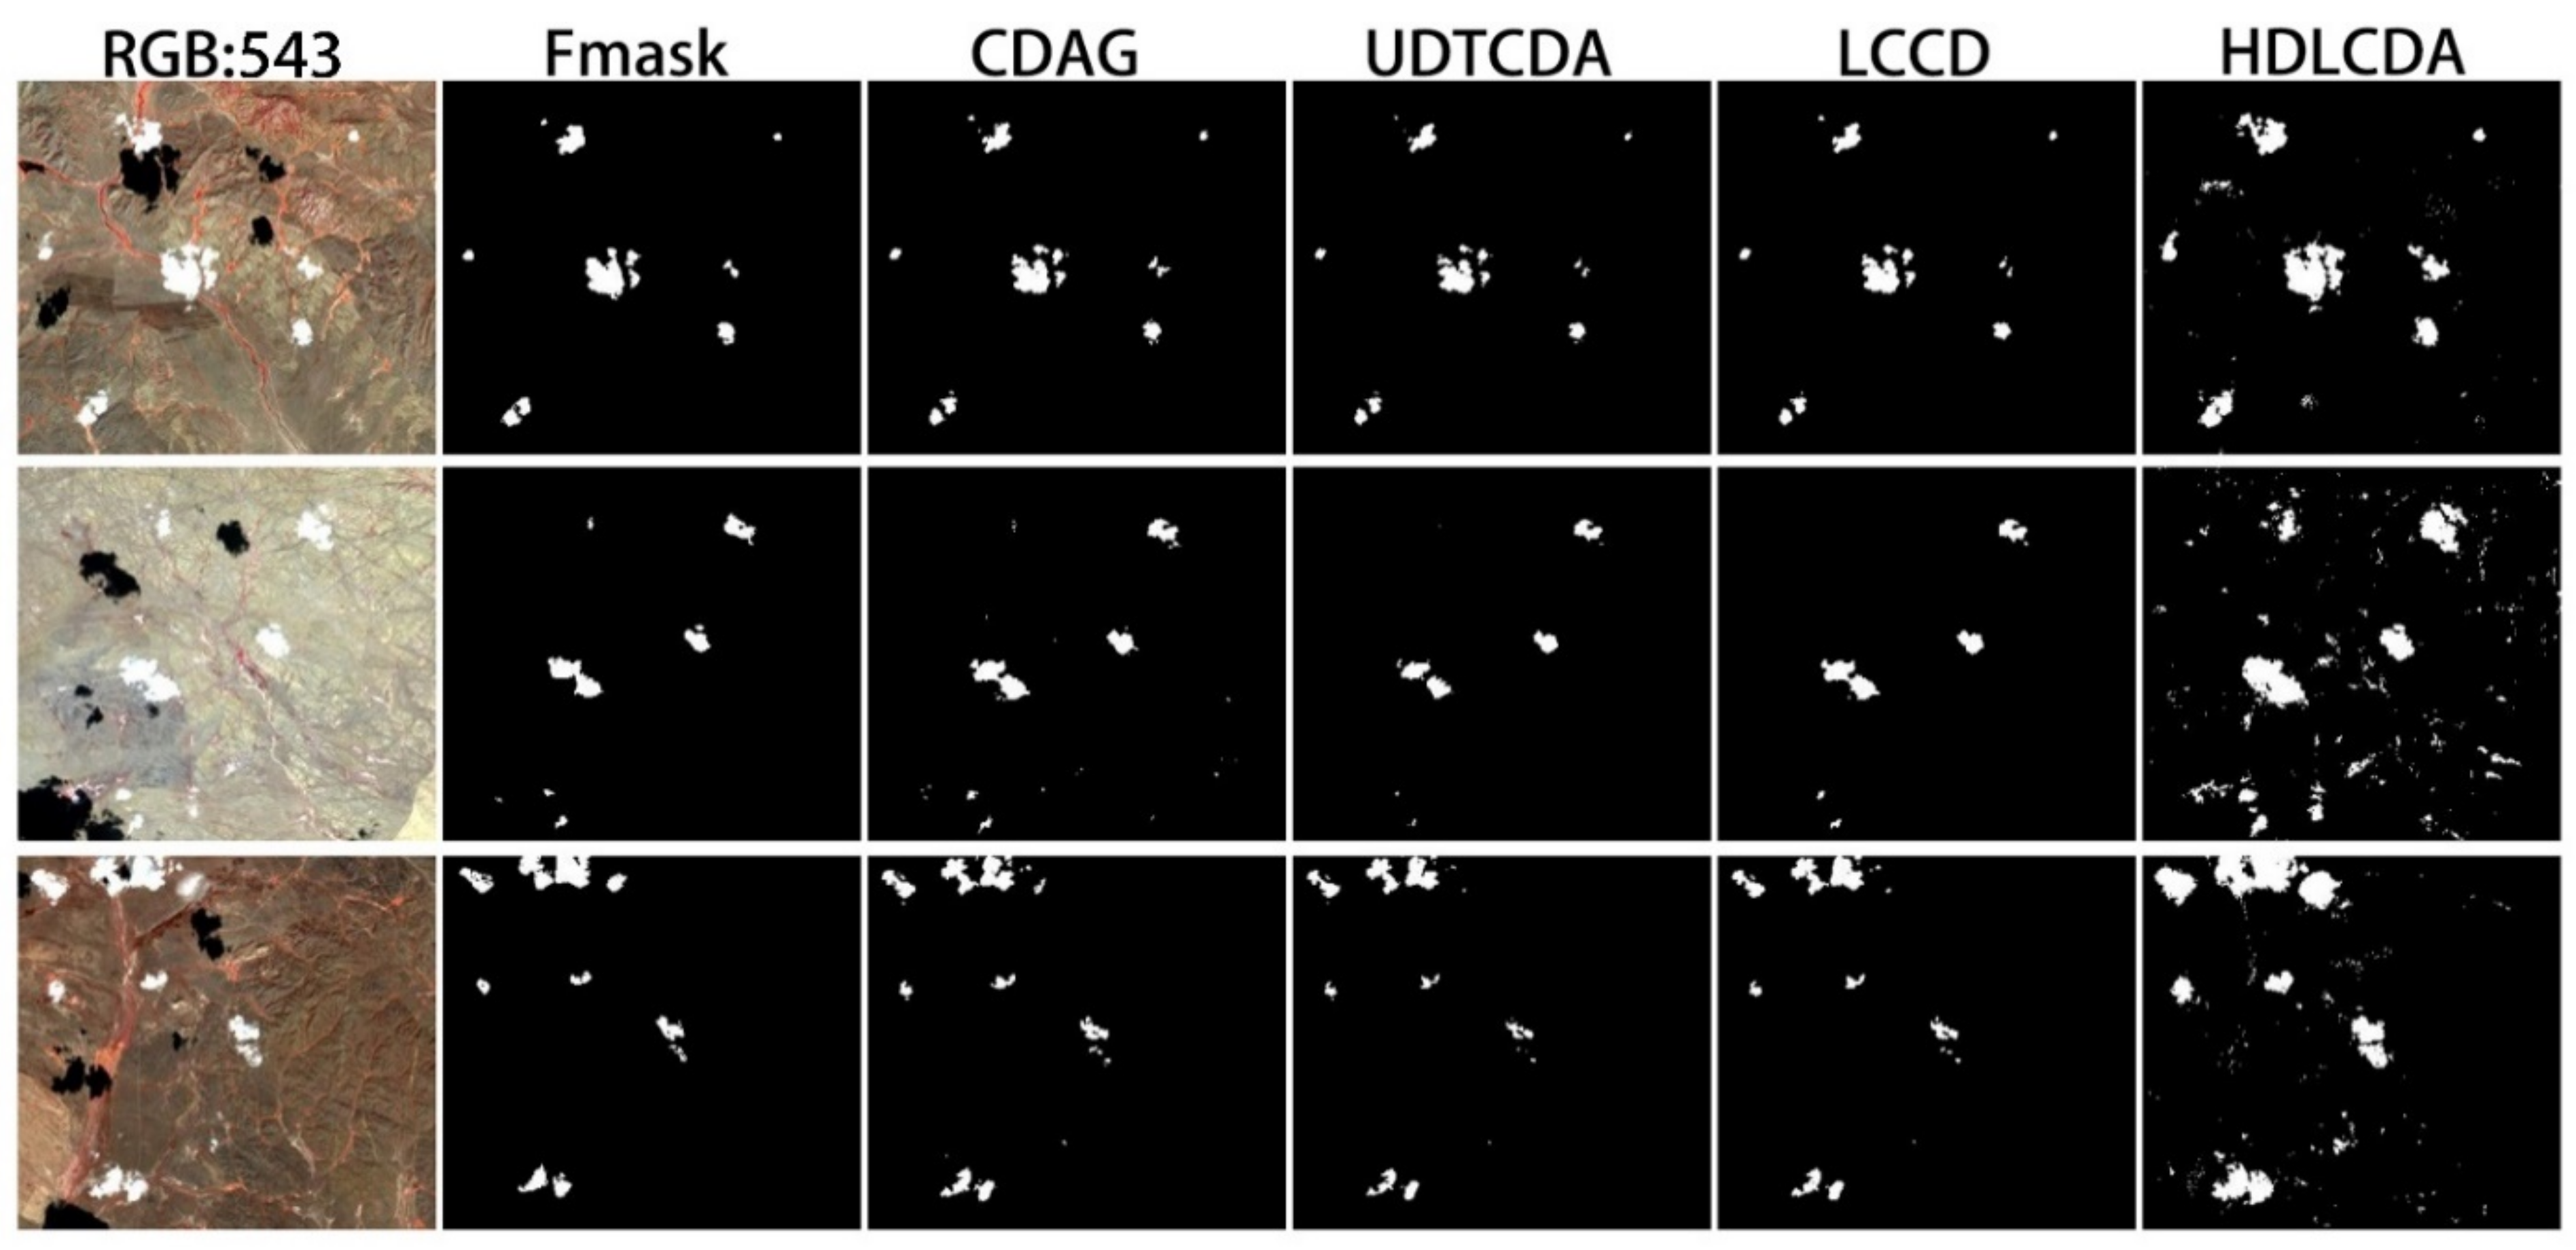
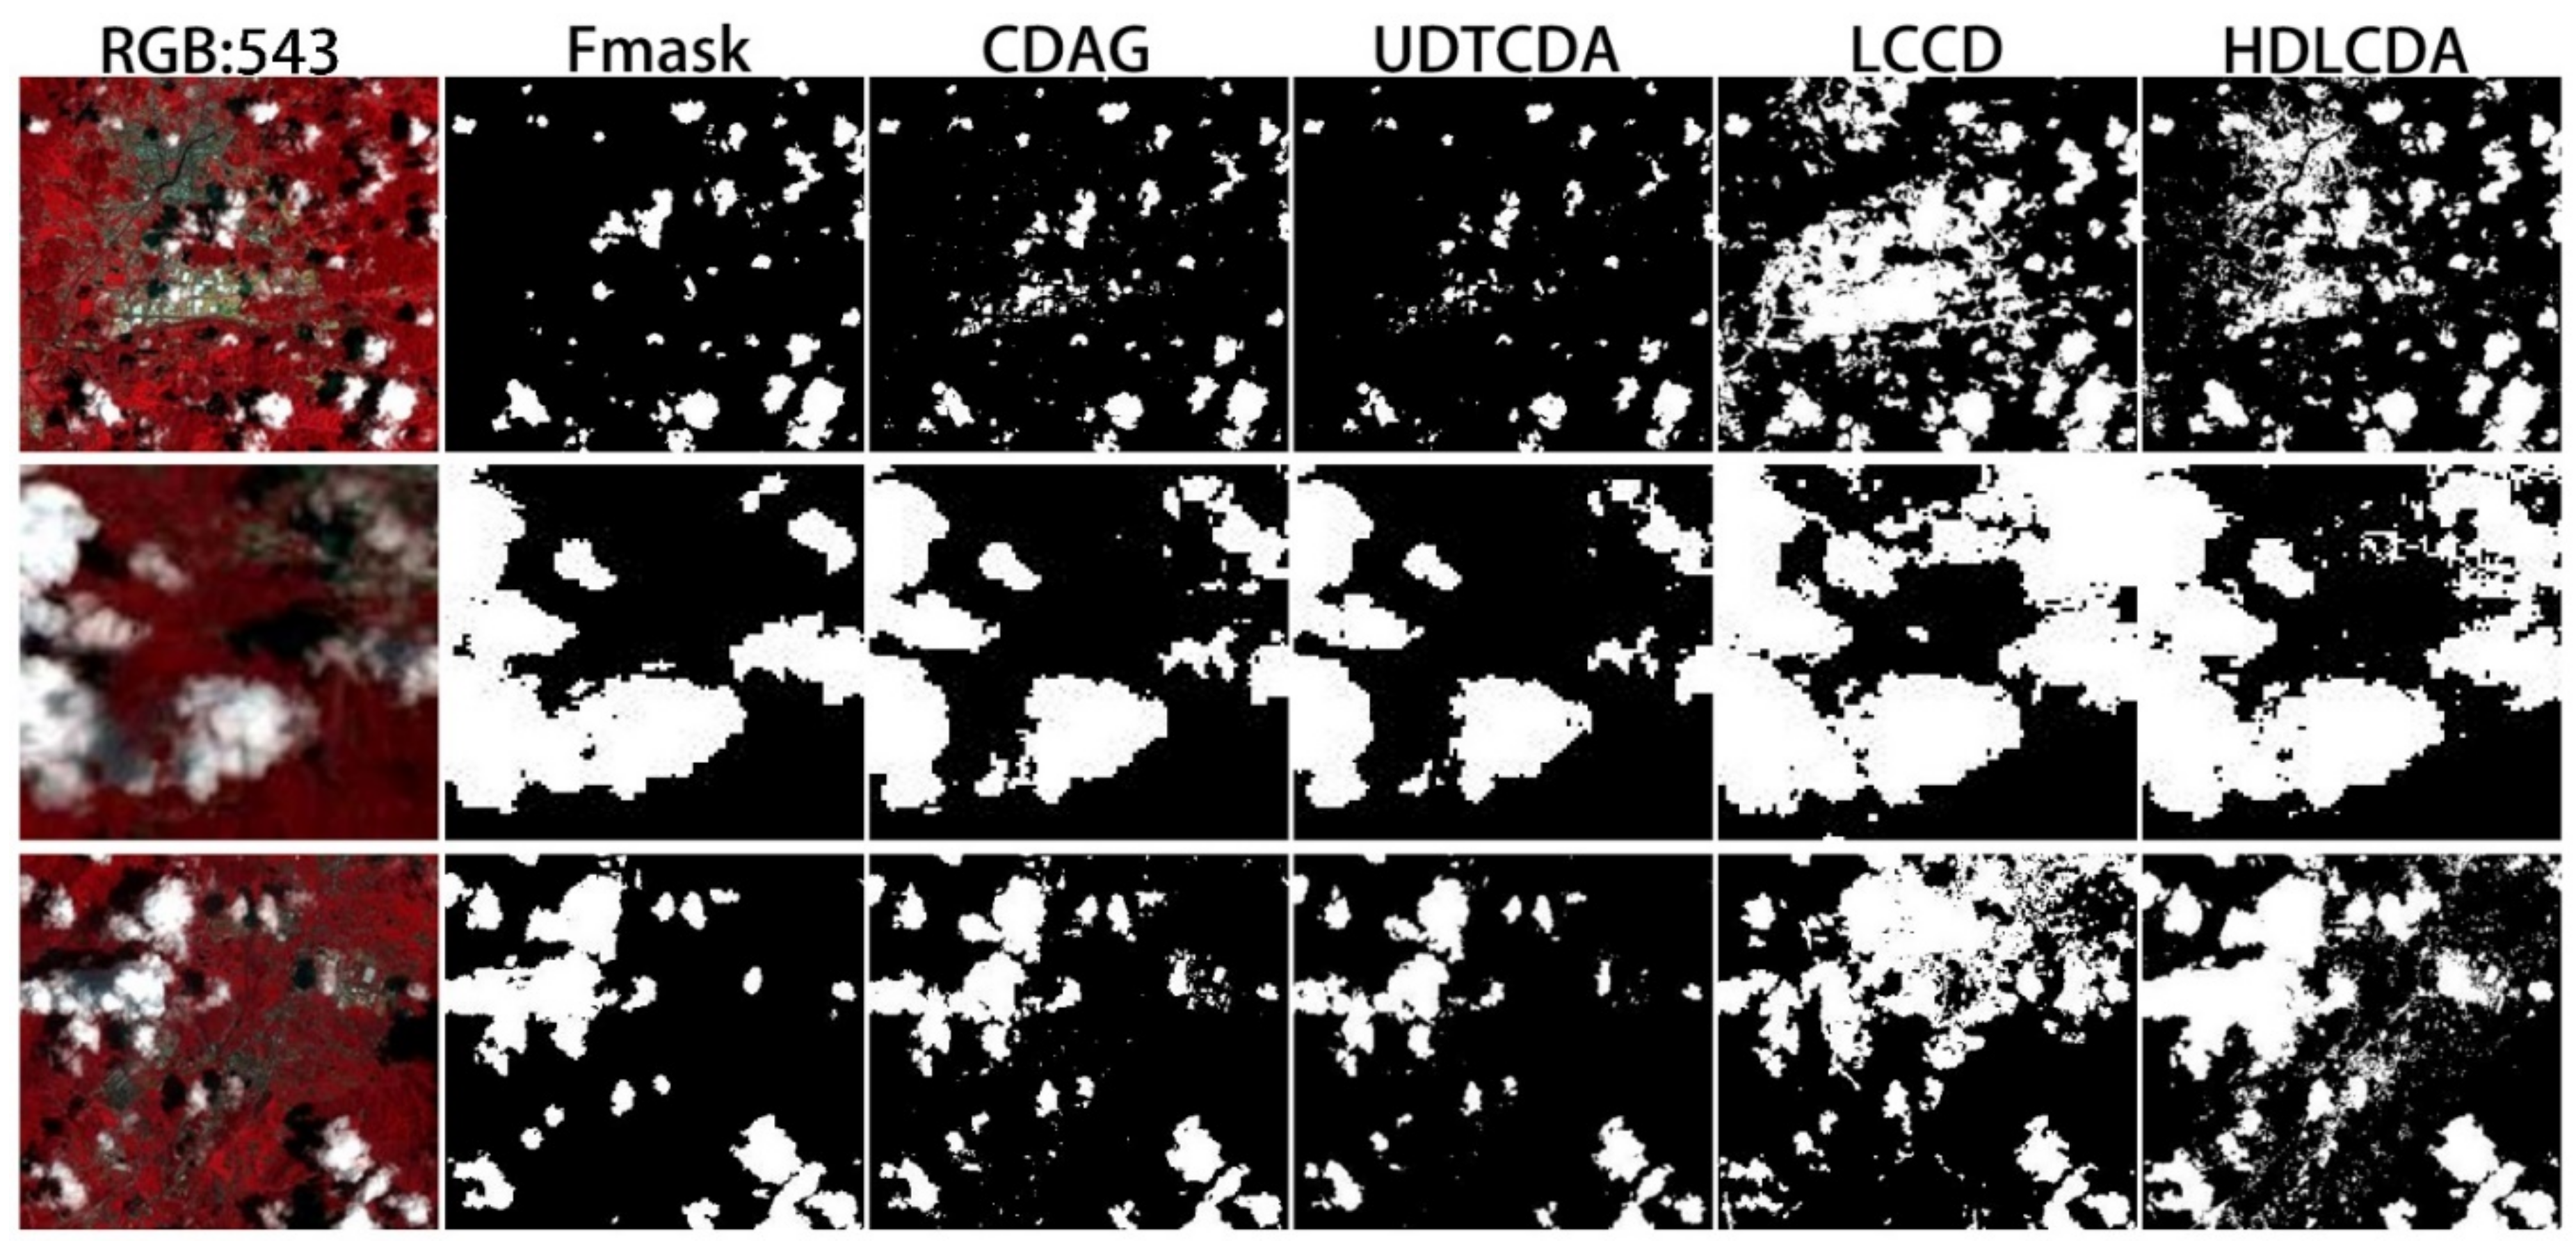
Most artificial surfaces are composed of high-resolution pixel, and cloud detection is rendered very difficult. Figure 10 displays the detection results for thick clouds. In contrast, the Fmask, CDAG, and UDTCDA algorithms demonstrated the most stable recognition effects on thick clouds over an artificial surface and the most accurate extraction of details from thick cloud edges. The LCCD and HDLCDA algorithms misjudged a large proportion of artificial ground surface as cloud with poor cloud detection.
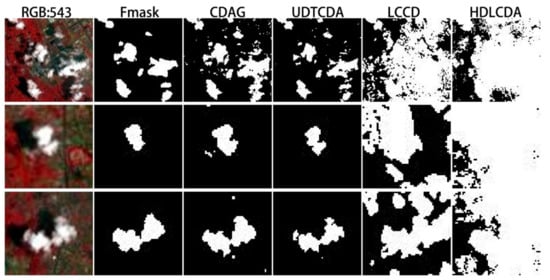
Figure 10.
The detection results for thick clouds over a man-made surface.
The Fmask algorithm displays a relatively stable recognition effect on broken cloud over artificial surface (Figure 11). However, UDTCDA algorithm can also identify the contour of broken cloud but contains a poor edge detection problem. The other three algorithms recognize large, highlighted artificial surfaces as clouds, reducing cloud detection accuracy.
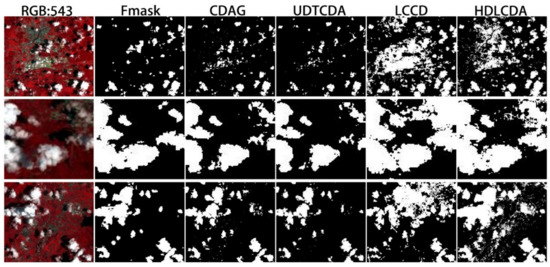
Figure 11.
The detection results for broken clouds over a man-made surface.
The Fmask and HDLCDA algorithms completely recognized the shape of the thin cloud (Figure 12). However, the results from the other three cloud detection algorithms contained a large number of omissions.
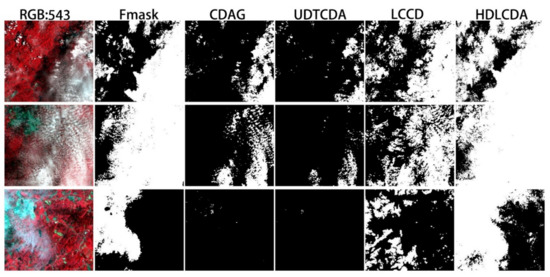
Figure 12.
The detection results for thin clouds over a man-made surface.
When the underlying surface was an artificial surface with high reflectivity, the Fmask algorithm exhibited the most stable recognition effect. The HDLCDA algorithm misidentified bright surfaces as clouds. However, the CDAG and the UDTCDA algorithms displayed a large number of omissions when identifying thin clouds. The LCCD algorithm was able to recognize thick and broken clouds over the artificial surface and misjudged the highlighted artificial surface as cloud. When identifying thin clouds, the phenomenon of missing recognition occurred.
3.5. Quantitative Analysis
In this paper, a number of sample areas with a size of 800 × 800 were randomly selected from different surface types to verify the level of quantitative accuracy. The accuracy (PA) and user accuracy (UA) were calculated by constructing an error matrix based on the visual interpretation results and the algorithm recognition results. The calculation formula for these two indicators is as follows:
where CloudBoth is the pixel identified as cloud by both visual interpretation and cloud detection algorithm, Cloud is the pixel identified as cloud by visual interpretation, and CloudResults is the pixel identified as cloud by the cloud detection algorithm.
As observed from the quantitative analysis results from the five cloud detection algorithms in Table 1, the mapping accuracy and the UA of the HDLCDA algorithm for all surface types are at a high level, indicating that the HDLCDA algorithm was able to completely identify cloud boundaries over all surface types with a low miss rate. Both thin clouds at the edge of thick clouds and very thin clouds above the surface were accurately identified, which was more prominent in the cloud detection results over water. The UDTCDA algorithm demonstrated a low mapping accuracy, but a high UA; it accurately identified the center of cloud pixel, but the phenomenon of missing cloud edges and thin clouds was serious. The mapping accuracy and the UA of the other three cloud detection algorithms are all at a moderate level. When the ground surface type was vegetation, the cloud detection results and the visual interpretation results displayed good spatial consistency. However, when the underlying surface was water, bare land, or artificial surface, these algorithms proved to be unstable.

Table 1.
The Quantitative analysis results from the cloud detection algorithms over different surface types.
4. Discussion
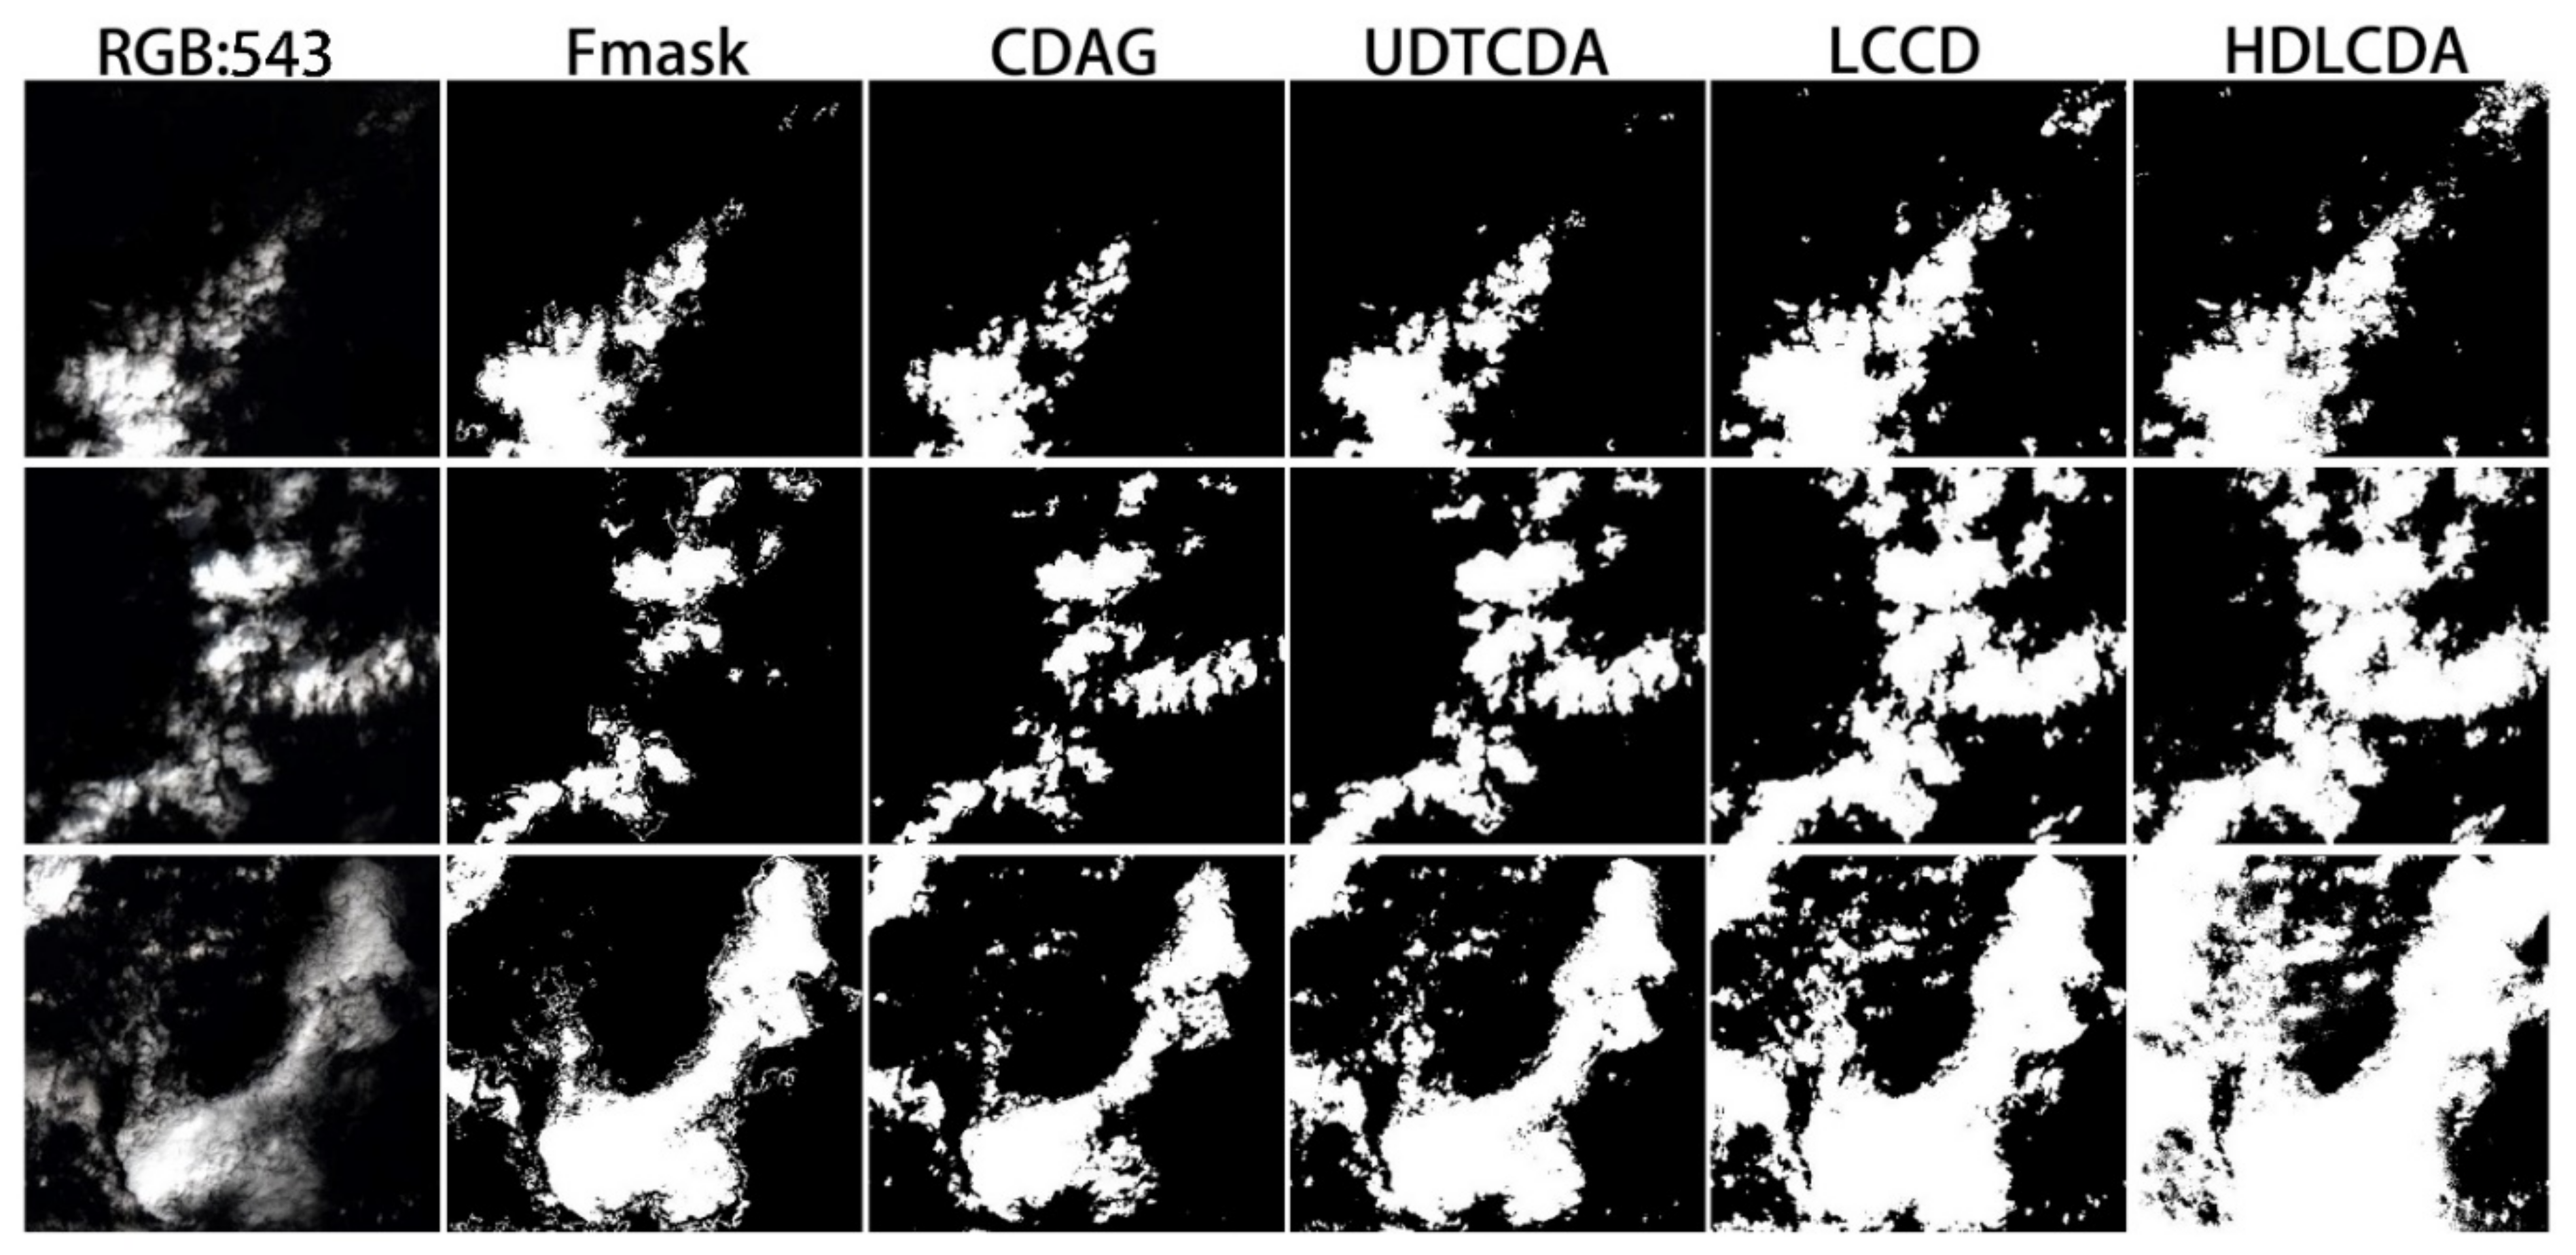
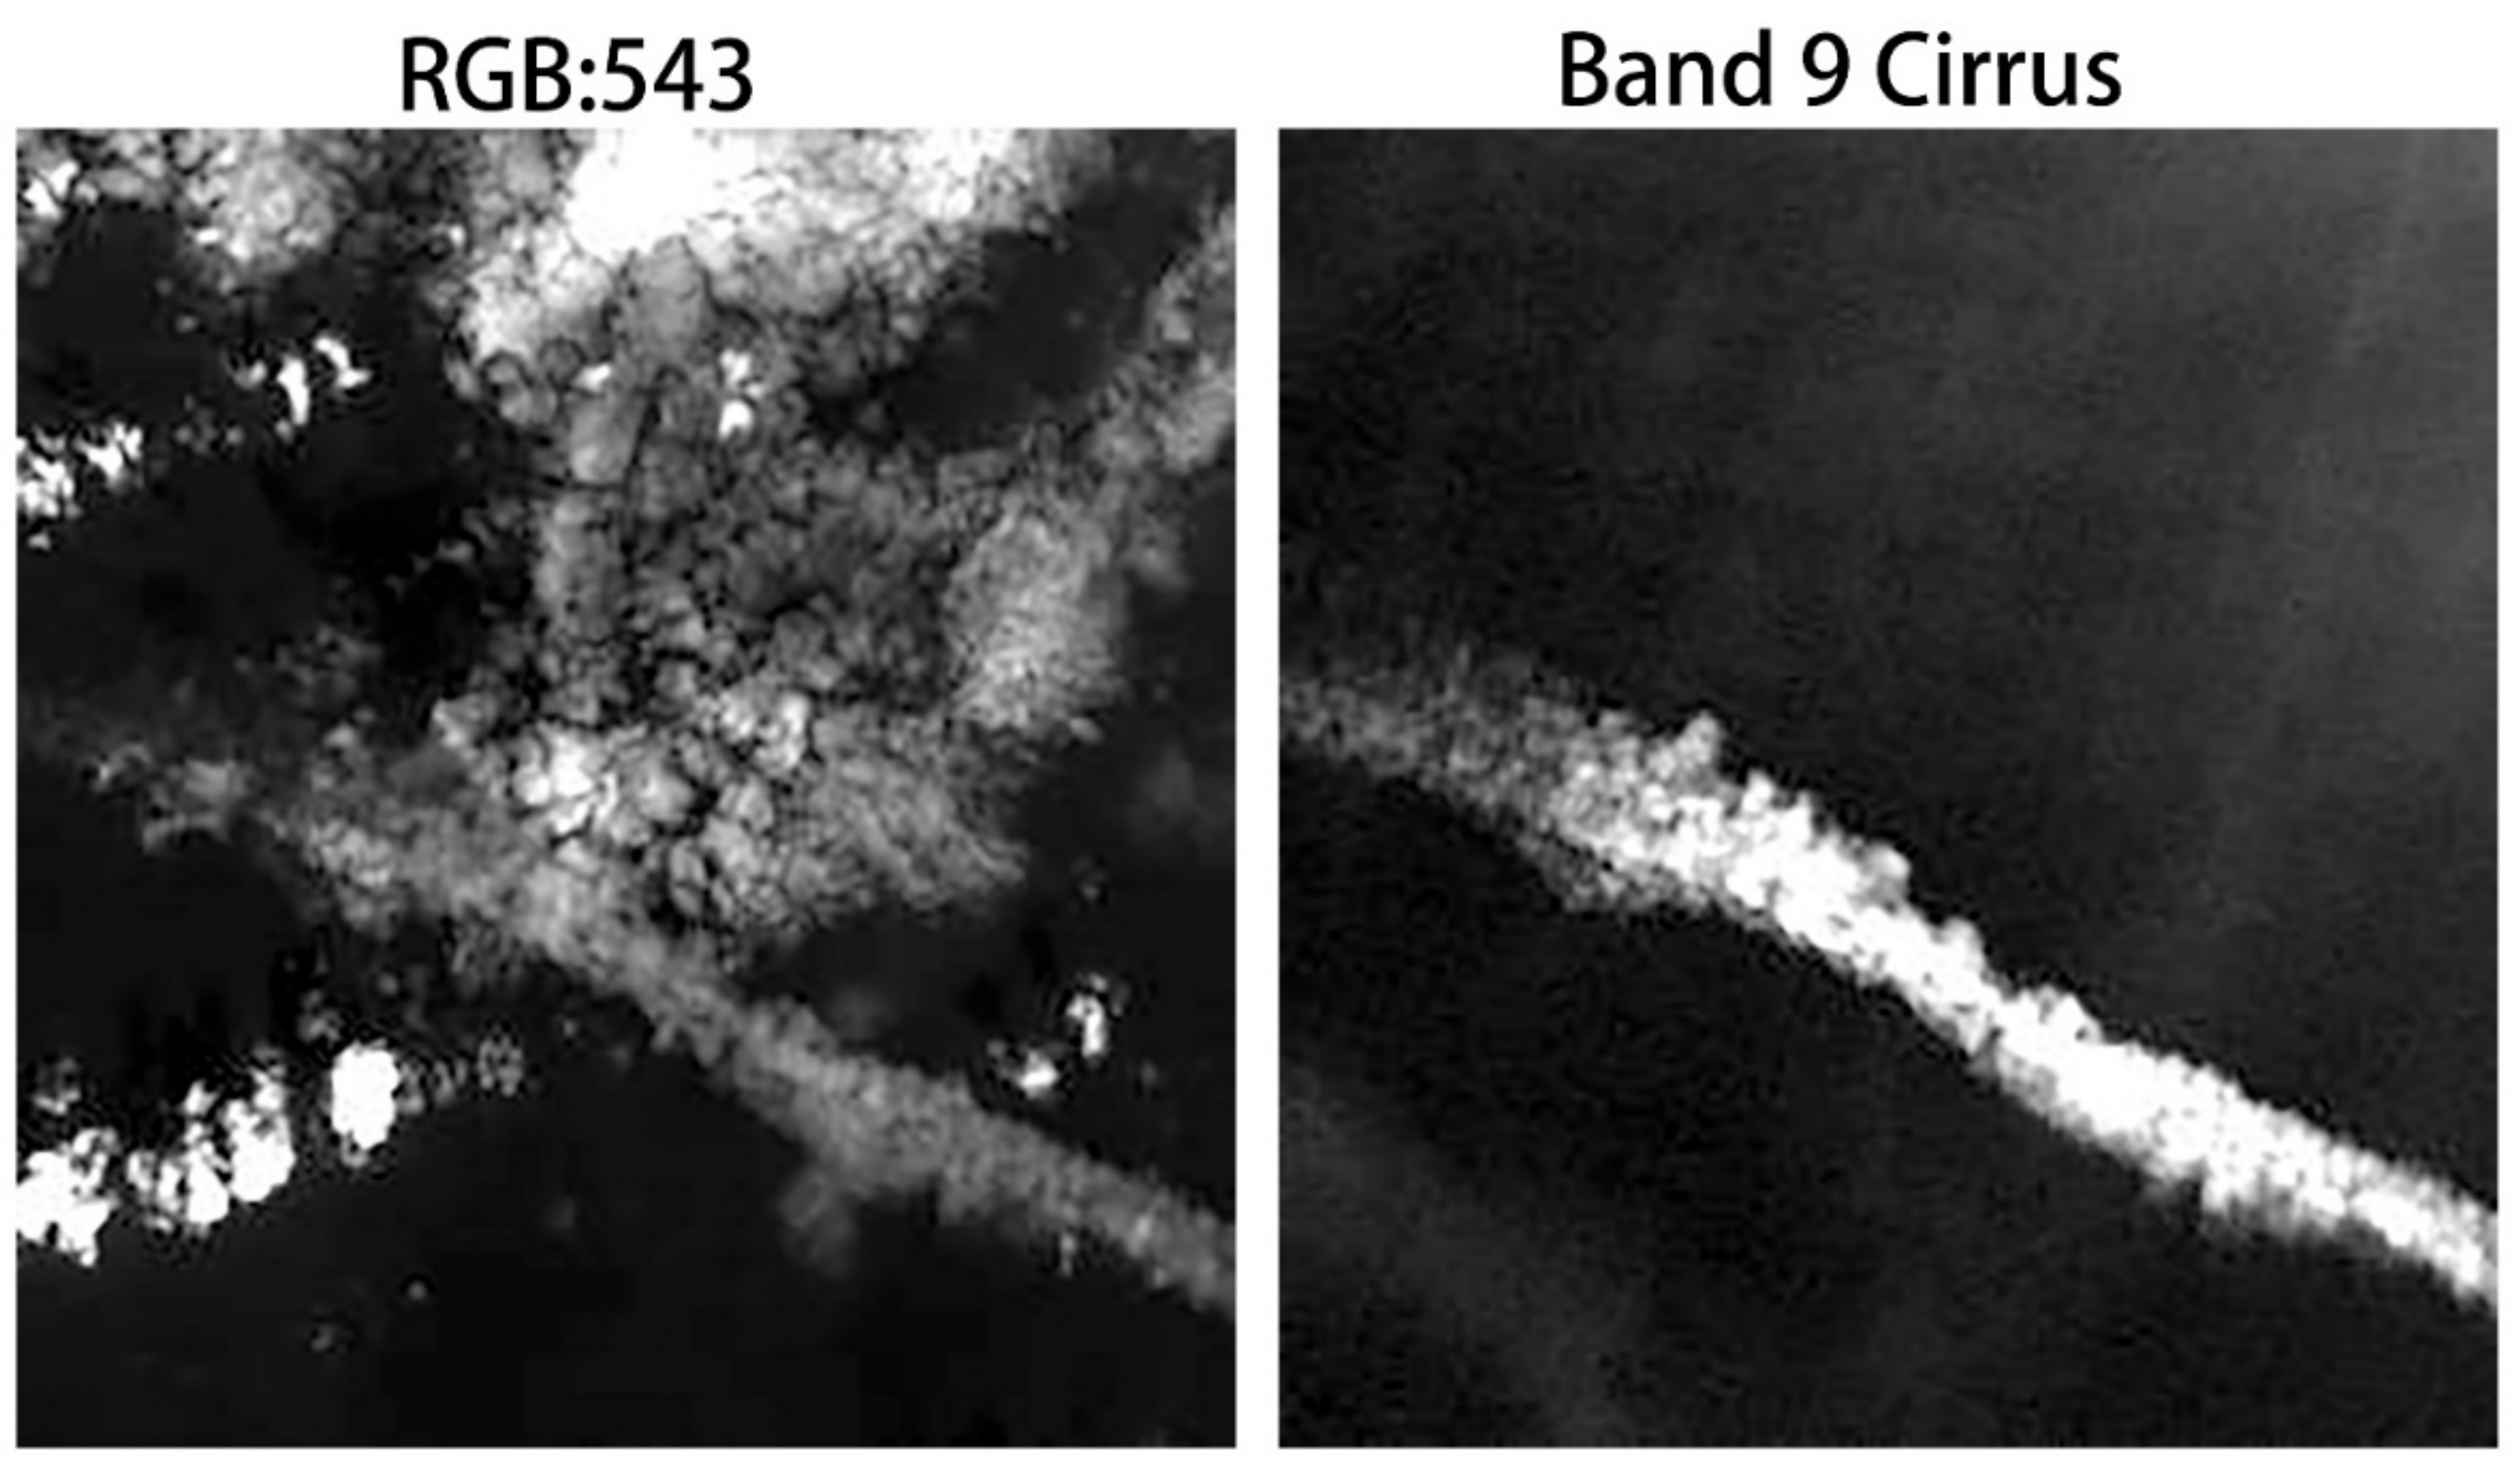
Five cloud detection algorithms were utilized to detect the data for different surface types of Landsat 8 OLI. The detection results showed that, for thick clouds over vegetation, water, and bare land, the five classical cloud detection algorithms completely identified thick clouds with a high level of overall accuracy. For thick clouds on artificial surfaces, the Fmask algorithm, CDAG algorithm and UDTCDA algorithm had higher recognition accuracy, while the LCCD algorithm and HDLCDA algorithm misjudged bright artificial surface as cloud pixel, reducing the accuracy of cloud detection. There are obvious differences in the detection results of the five cloud detection algorithms for broken clouds over different backgrounds. The HDLCDA algorithm showed a powerful ability to mine information, separating fragmented clouds on the surface from the surface. The UDTCDA algorithm and the LCCD algorithm successfully used the known surface information to detect and identify the overall outline of the broken clouds above the surface, and their ability to detect the effects of broken clouds comes second. The Fmask algorithm and the CDAG algorithm have no prior surface information support and were only able to detect broken clouds on complex surfaces by setting a fixed threshold; the cloud detection effect for both is poor. In the thin cloud detection results for different surface types, the HDLCDA algorithm was able to completely detect thin clouds over different surface types. The HDLCDA algorithm accurately identified the contours and the edges of thin clouds even on dark surfaces such as water. In addition, the HDLCDA algorithm also showed a good recognition effect on cirrus clouds over water. As shown in Figure 13, the HDLCDA algorithm is able to completely identify cirrus clouds over water.
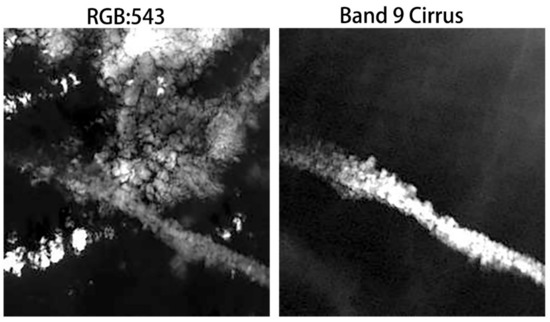
Figure 13.
False color imagery and cirrus imagery over water.
These five cloud detection algorithms are supported by different theories and have different cloud detection effects against different backgrounds. The HDLCDA algorithm has great advantages in the recognition of broken and thin cirrus clouds, while the Fmask algorithm has better performance in the recognition of clouds on artificial surfaces. In this paper, five cloud detection algorithms are compared and analyzed to provide a reference for the subsequent development of cloud detection algorithms with higher applicability.
5. Summary and Conclusions
In this study, five typical algorithms for Landsat 8 OLI data were utilized to compare and analyze the cloud detection results of different characteristics over different surface types. Different cloud detection methods demonstrated immense differences in their ability to identify different types of clouds against different backgrounds. In general, the HDLCDA algorithm displayed the highest accuracy in the recognition of different types of clouds, especially in the recognition of cloud edges, thin clouds, and fragmented clouds. In contrast, the cloud detection effect of the CDAG algorithm was poor. For surfaces with low reflectivity, such as vegetation and water, obvious incidences of the missed detection of broken clouds, thin clouds, and thin clouds at the edges of thick clouds were recognized. In addition, the CDAG algorithm mistakenly identified a large proportion of bare land, artificial surfaces, and other backgrounds with high-surface reflectivity as cloud pixels. In contrast, the UDTCDA and Fmask algorithms were able to conspicuously identify the clouds in a highlighted surface area with low misjudgment rates. However, there were some serious instances of the missed detection of thin clouds and broken clouds above the water. In addition, the LCCD algorithm missed the detection of thin clouds over water.
Author Contributions
Conceptualization, L.S. and S.S.; methodology, S.S.; software, S.S.; validation, S.S.; formal analysis, S.S.; investigation, S.S.; resources, S.S.; data curation, S.S.; writing—original draft preparation, S.S.; writing—review and editing, S.S.; visualization, S.S.; supervision, L.S.; project administration, L.S.; funding acquisition, L.S. All authors have read and agreed to the published version of the manuscript.
Funding
This work was supported by the National Key Research and Development Program (No. 2019YFE0126700) and Shandong Provincial Natural Science Foundation (No. ZR2020MD051).
Institutional Review Board Statement
Not applicable.
Informed Consent Statement
Not applicable.
Data Availability Statement
Not applicable.
Acknowledgments
Due credit is given to the NASA website (https://www.nasa.gov/, 15 November 2021) for providing relevant Landsat 8 OLI remote sensing data. We would also like to thank Zhu et al. for providing the Fmask algorithm code, Mi et al. for providing the CDAG algorithm code, Wang et al. for providing the UDTCDA algorithm code, Zhou et al. for the LCCD algorithm code, and Yang et al. for providing the HDLCDA algorithm code.
Conflicts of Interest
The authors declare no conflict of interest.
References
- King, M.D.; Platnick, S.; Menzel, W.P.; Ackerman, S.A.; Hubanks, P.A. Spatial and temporal distribution of clouds observed by MODIS onboard the Terra and Aqua satellites. IEEE Trans. Geosci. Remote Sens. 2013, 51, 3826–3852. [Google Scholar] [CrossRef]
- Li, B.; Xin, X.Z.; Zhang, H.L.; Hu, J.C. Algorithm for cloud shadow identification on complex terrains. Int J. Remote Sens. 2017, 21, 263–272. [Google Scholar] [CrossRef]
- Randall, D.A.; Corsetti, T.G. Earth radiation budget and cloudiness simulations with a general circulation model. J. Atmos. Sci. 1989, 46, 1922–1942. [Google Scholar] [CrossRef]
- Jedlovec, G.J.; Haines, S.L.; LaFontaine, F.J. Spatial and temporal varying thresholds for cloud detection in GOES imagery. IEEE Trans. Geosci. Remote Sens. 2008, 46, 1705–1717. [Google Scholar] [CrossRef]
- Hagolle, O.; Huc, M.; Pascual, D.V.; Dedieu, G. A multi-temporal method for cloud detection, applied to FORMOSAT-2, VENµS, LANDSAT and SENTINEL-2 images. Remote Sens. Environ. 2010, 114, 1747–1755. [Google Scholar] [CrossRef] [Green Version]
- Huang, C.Q.; Thomas, N.; Goward, S.N.; Masek, J.G.; Zhu, Z.L. Automated masking of cloud and cloud shadow for forest change analysis using Landsat images. Int J. Remote Sens. 2010, 31, 5449–5464. [Google Scholar] [CrossRef]
- Liang, D.; Kong, J.; Hu, G.S.; Huang, L.S. The Removal of Thick Cloud and Cloud Shadow of Remote Sensing Image Based on Support Vector Machine. Acta Geod. Cartogr. Sin. 2012, 41, 225–231. [Google Scholar]
- Hu, C.M.; Bai, Y.; Tang, P. Automatic cloud detection for GF-4 series images. J. Remote Sens. 2018, 22, 132–142. [Google Scholar] [CrossRef]
- Xu, H.Q.; Tang, F. Analysis of new characteristics of the first Landsat 8 image and their ecoenvironmental significance. Acta Ecol. Sinica 2013, 33, 9. [Google Scholar] [CrossRef]
- Zhu, Z.; Woodcock, C.E. Automated cloud, cloud shadow, and snow detection in multitemporal Landsat data: An algorithm designed specifically for monitoring land cover change. Remote Sens Environ. 2014, 152, 217–234. [Google Scholar] [CrossRef]
- Zhu, Z.; Wang, S.; Woodcock, C.E. Improvement and expansion of the Fmask algorithm: Cloud, cloud shadow, and snow detection for Landsats 4-7, 8, and Sentinel 2 images. Remote Sens. Environ. 2015, 159, 269–277. [Google Scholar] [CrossRef]
- Chen, X.D.; Zhang, X.; Liu, L.Y.; Wang, X.F. Enhanced multi-temporal cloud detection algorithm for optical remote sensing images. J. Remote Sens. 2019, 23, 280–290. [Google Scholar] [CrossRef]
- Qiu, S.; Zhu, Z.; He, B. Fmask 4.0: Improved cloud and cloud shadow detection in Landsats 4-8 and Sentinel-2 imagery. Remote Sens. Environ. 2019, 231, 111205. [Google Scholar] [CrossRef]
- Sun, L.; Mi, X.T.; Wei, J.; Wang, J.; Tian, X.P.; Yu, H.; Gan, P. A cloud detection algorithm-generating method for remote sensing data at visible to short-wave infrared wavelengths. ISPRS J. Photogramm. 2016, 124, 70–88. [Google Scholar] [CrossRef]
- Green, R.O.; Shimada, M. On-orbit calibration of a multi-spectral satellite sensor using a high altitude airborne imaging spectrometer. Adv. Space Res. 1997, 19, 1387–1398. [Google Scholar] [CrossRef]
- Zanoni, V.; Davis, B.; Ryan, R.; Gasser, G.; Blonski, S. Remote sensing requirements development: A simulation-based approach. Mid-Term Symposium in Conjunction with Pecora 15/Land Satellite Information IV Conference Integrated Remote Sensing at the Global, Regional and Local Scale, Denver, CO, USA, 10–15 November 2002; 10, p. 419. [Google Scholar]
- Sun, L.; Wei, J.; Wang, J.; Mi, X.T.; Guo, Y.M.; Yang, Y.K.; Gan, P.; Zhou, X.Y.; Jia, C.; Tian, X.P.A. Universal Dynamic Threshold Cloud Detection Algorithm (UDTCDA) with a prior surface reflectance database support. J. Geophys. Res. Atmos. 2016, 121, 7172–7196. [Google Scholar] [CrossRef]
- Sun, L.; Wang, Q.; Zhou, X.Y.; Wei, J.; Yang, X.; Zhang, W.; Ma, N. A Priori Surface Reflectance-Based Cloud Shadow Detection Algorithm for Landsat 8 OLI. IEEE Geosci. Remote Sens. 2018, 15, 1610–1614. [Google Scholar] [CrossRef]
- Sun, L.; Zhou, X.Y.; Wei, J. A New Cloud Detection Method Supported by GlobeLand30 Data Set. IEEE J. Stars. 2018, 11, 3628–3645. [Google Scholar] [CrossRef]
- Liu, C.L.; Wu, B.F. Application of Cloud Detection Algorithm for the AVHRR Data. J. Remote Sens. 2004, 8, 677–687. [Google Scholar] [CrossRef]
- Sun, L.; Xu, Y.; Jia, S.F.; Wang, Q.; Liu, X.Y.; Wei, J.; Zhou, X.Y. Satellite data cloud detection using deep learning supported by hyperspectral data. Int. J. Remote Sens. 2020, 4, 1349–1371. [Google Scholar] [CrossRef] [Green Version]
Publisher’s Note: MDPI stays neutral with regard to jurisdictional claims in published maps and institutional affiliations. |
© 2022 by the authors. Licensee MDPI, Basel, Switzerland. This article is an open access article distributed under the terms and conditions of the Creative Commons Attribution (CC BY) license (https://creativecommons.org/licenses/by/4.0/).

