Article

A Precision Efficient Method for Collapsed Building Detection in Post-Earthquake UAV Images Based on the Improved NMS Algorithm and Faster R-CNN

School of Geodesy and Geomatics, Wuhan University, Wuhan 430079, China
*
Author to whom correspondence should be addressed.
These authors contributed equally to this work.
Remote Sens. 2022, 14(3), 663; https://doi.org/10.3390/rs14030663
Submission received: 17 December 2021 / Revised: 18 January 2022 / Accepted: 27 January 2022 / Published: 29 January 2022
(This article belongs to the Special Issue Intelligent Damage Assessment Systems Using Remote Sensing Data)

Abstract

:
The results of collapsed building detection act as an important reference for damage assessment after an earthquake, which is crucial for governments in order to efficiently determine the affected area and execute emergency rescue. For this task, unmanned aerial vehicle (UAV) images are often used as the data sources due to the advantages of high flexibility regarding data acquisition time and flying requirements and high resolution. However, collapsed buildings are typically distributed in both connected and independent pieces and with arbitrary shapes, and these are generally more obvious in the UAV images with high resolution; therefore, the corresponding detection is restricted by using conventional convolutional neural networks (CNN) and the detection results are difficult to evaluate. In this work, based on faster region-based convolutional neural network (Faster R-CNN), deformable convolution was used to improve the adaptability to the arbitrarily shaped collapsed buildings. In addition, inspired by the idea of pixelwise semantic segmentation, in contrast to the intersection over union (IoU), a new method which estimates the intersected proportion of objects (IPO) is proposed to describe the degree of the intersection of bounding boxes, leading to two improvements: first, the traditional non-maximum suppression (NMS) algorithm is improved by integration with the IPO to effectively suppress the redundant bounding boxes; second, the IPO is utilized as a new indicator to determine positive and negative bounding boxes, and is introduced as a new strategy for precision and recall estimation, which can be considered a more reasonable measurement of the degree of similarity between the detected bounding boxes and ground truth bounding boxes. Experiments show that compared with other models, our work can obtain better precision and recall for detecting collapsed buildings for which an F1 score of 0.787 was achieved, and the evaluation results from the suggested IPO are qualitatively closer to the ground truth. In conclusion, the improved NMS with the IPO and Faster R-CNN in this paper is feasible and efficient for the detection of collapsed buildings in UAV images, and the suggested IPO strategy is more suitable for the corresponding detection result’s evaluation.

Graphical Abstract

1. Introduction

Earthquake disasters have become a key social concern due to their huge destructive power and colossal threat to public lives and property. Although the prevention of such disasters is challenging, it is crucial for post-disaster reconstruction to commence as soon as possible for sufferers, for which emergency surveying and mapping are typically the first steps. The primary public property damaged caused by an earthquake is the destroyed architecture, and the information of destroyed buildings is very important for decision-makers to choose a correct reconstruction direction. In addition, the detection of collapsed buildings can provide an important reference for damage assessment after earthquake disasters, and become a crucial composition in the deployment of disaster analysis and emergency rescue [1]. Due to the rapid development of high-resolution sensors, which have more abundant ground object texture information, the application of relevant technologies to the detection of collapsed buildings in the post-earthquake area has become the focus of research in the field of remote sensing, computer vision, etc. unmanned aerial vehicle (UAV) images have several advantages such as high resolution, low cost, and timely acquisition [2], and they are widely used to perceive disaster areas and assist in the procedure of post-disaster rescue. Therefore, it is of great significance to investigate the usage of post-earthquake images collected by UAV and quickly identify the corresponding objects of collapsed buildings.
Over recent years, according to the employed datasets, the methods for object detection aiming at detecting collapsed buildings, in particular, can mainly be divided into two categories: multi-temporal and single-temporal methods [3]. The core idea of the multi-temporal approach is to compare discrepancies in the images of buildings from the same area but with different time stamps, with specific image processing and analysis techniques such as direct comparison [4,5,6,7] and post-classification by comparison [8,9]. Direct comparison aims to construct difference images by using images from different times and then improve these difference images by decreasing the noise; post-classification, by comparison, means the images are firstly classified with various classes attributed to each pixel and these attributed images are compared. There are also other methods by virtue of the characteristics of buildings, such as shadow [10,11], and roof [12] analysis and the corresponding digital elevation model (DEM) [13]. Collapsed buildings can be found by comparing shadow length and the correlation between the roof pixels and the difference between DEMs in pre- and post-earthquake imagery. However, these methods require a reference image of a specific area and time and a target image which observes the same area at a different time, which typically yields difficulties for data acquisition and is not feasible for real-time application. In contrast, single- temporal methods, which investigate some hand-crafted features such as the salient point, edge, texture and the spectrum of collapsed buildings [14,15,16,17], are more popular in detecting collapsed buildings due to their efficiency in data acquisition. Compared with intact buildings, collapsed buildings show arbitrary deformation, such as the disappearance of regular geometric shapes, the irregular distribution of texture features and the non-existence of building shadows [18], resulting in the limitations of handcrafted features and the weak generalization ability of the corresponding detection methods.
Recently, convolutional neural networks (CNNs) have been widely used in object detection and recognition from remote sensing imagery due to their superiority in feature extraction [19,20,21]. For instance, the well-known object detection model, namely faster region-based convolutional neural network (Faster R-CNN), which was proposed in the literature [22], gives high recall region proposals at a low cost via the region proposal network (RPN), which can significantly improve the efficiency of object detection. Compared with traditional methods, this end-to-end detection model is considered more attractive as it can reduce the complex steps of data preprocessing, manually handcrafted feature design, etc. The existing research content can be roughly divided into three categories [23]: scene classification based on image-level labeling samples, semantic segmentation based on pixel-level labeling samples and object detection based on object-level labeling samples. Most image-based scene detection methods use artificial outlines of building boundaries, using regular domain or adaptive domain windows provided by object-oriented segmentation to analyze remote sensing images for classification and detection. As a result, the small pieces classified as collapsed buildings are generated on the images. If the collapsed buildings cover a large area, the time efficiency of this method cannot be guaranteed, which is not suitable for the rapid determination of the affected area of the disaster. Duarte et al. [24] combined satellite images and aerial images of collapsed buildings to improve the quality and quantity of sample data, and a CNN was applied based on residual connection and cavity convolution to improve the classification efficiency by nearly 4%. Ji et al. [25] first used ArcGIS to construct the vector boundary of buildings and solve the problem of sample imbalance on the training data between damaged and undamaged buildings by constructing the vector boundary of buildings. Then, a CNN was used to identify buildings in post-earthquake satellite images. Vetrivel et al. [26] studied a CNN with 3D point cloud features and used a multiple kernel learning framework to improve detection precision; the destroyed buildings were determined after the disaster, obtaining a detection precision of up to 85%. Xiong et al. [27] used the old Beichuan town as an example to generate a 3D building model based on 2D-GIS data, using it as a georeference to obtain multi-view segmented building images, and used a CNN to classify each building to obtain the damage distribution of the area with an accuracy of 89.39%. Miura et al. [28] used a CNN to classify damaged buildings into three categories: collapsed buildings, non-collapsed buildings, and moderately damaged buildings covered with blue tarps after the disaster, based on post-disaster aerial imagery from the 2016 Kumamoto earthquake and the 1995 Kobe earthquake, with an accuracy of approximately 95% in data for both earthquakes. Pixel-based semantic segmentation requires a large number of professionals to manually mark according to the building’s boundaries when creating samples, resulting in a large workload. Rudner et al. [29] proposed a new framework, Multi3Net, to achieve rapid and accurate building damage segmentation by fusing multiresolution, multisensory and multitemporal satellite images in a CNN. Shen [30] proposed a new cross-directional fusion strategy to better investigate the correlation between pre- and post-disaster images. In addition, Cut Mix was used for data enhancement. This method achieved excellent results for the xBD dataset of the building damage assessment. Wu et al. [18] proposed a Siamese neural network with an attention mechanism to focus on effective features and achieved an F1 score of 0.787 on the xBD dataset. Adriano et al. [31] proposed a damage mapping framework based on an Attention U-Net architecture for the semantic segmentation of damaged buildings, which can achieve a considerable prediction for datasets from various scenarios. The object-level detection of post-earthquake collapsed buildings can help quickly determine the affected areas and achieve rapid disaster relief after the disaster. Ma et al. [32] used YOLOv3 to detect collapsed buildings in post-earthquake remote sensing imagery and improved the backbone and loss function of YOLOv3. Their experiment shows that the improved method based on YOLOv3 is feasible for detecting collapsed buildings with practical application requirements.
Despite the large amount of work devoted to the detection of collapsed buildings in emergency and disaster relief, there are several outstanding difficulties which are worthy of further exploration.
Firstly, the properties of the target object, i.e., collapsed buildings, are relatively specialized. In general, collapsed buildings are distributed in a large area with ambiguous boundaries and no specific geometric shapes; this leads to considerable subjectivity when labeling datasets, which means that the same area of the collapsed building can be covered either by one large rectangular bounding box or by several smaller ones. On the other hand, the shape of collapsed buildings is arbitrary, and in the traditional CNN, the convolution kernels with regular sizes have difficulties in adapting to the variability of irregular shapes. In addition, although non-maximum suppression (NMS) manages to eliminate most of the detected overlapping bounding boxes with Faster R-CNN (for example), the detected results of large bounding boxes might contain small bounding boxes due to the fact that collapsed buildings have irregular shapes and the labeled training bounding boxes are variable. In this case, the intersection over union (IoU) between large and small bounding boxes cannot reach the corresponding threshold set by NMS, and the related overlapping detected bounding boxes can be suppressed, which can negatively influence the precision of the final detection result.
Secondly, the detected results are hard to evaluate. In the common object detection case shown in Figure 1, the target objects to be detected corresponding to ground truth appear basically as regular shapes. As a consequence, one ground truth bounding box corresponds to only one detected bounding box; that is to say, this is a one-to-one detection mode. In this “one-to-one” mode, the IoU is the most commonly used evaluation metric for comparing similarities between the detected bounding box and ground truth bounding box. However, the main goal of object detection represented by collapsed buildings is to detect the corresponding approximate position in the image. The irregularity and uncountability of collapsed buildings make it impractical for them to be marked separately by a minimum enclosing rectangle. Thus, when targeting collapsed buildings, a "many-to-many" situation may occur in which one ground truth bounding box corresponds to one or more detected bounding boxes, and multiple ground truth bounding boxes correspond to one or more detected bounding boxes. Thus, an explicit mapping relationship between detected and ground truth bounding boxes is difficult to determine. In the "many-to-many" case, the traditional IoU-based evaluation strategy and mean average precision (mAP) are no longer applicable to some extent. The labeling strategy for collapsed buildings in a certain area is subjective regarding the scales and numbers of the ground truth bounding boxes, as shown in Figure 2.
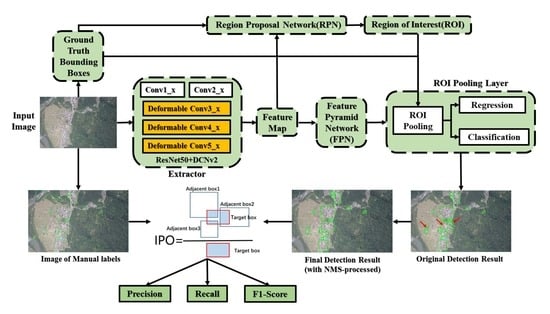
To address the problems introduced above, based on Faster R-CNN, this study addressed an efficient precision method for the detection of post-earthquake collapsed buildings. This method can be used to efficiently determine the disaster area and assist emergency and disaster relief work. The main contributions are threefold:
  • The Faster R-CNN model was taken as a basic framework, and deformable convolution (DCN) [33,34] was introduced to learn information related to the irregular geometric features of post-earthquake collapsed buildings, so as to improve the detection result.
  • To ease the difficulty of evaluating the detection results of collapsed buildings, instead of the traditional IoU, this paper proposes a new strategy called the intersected proportion of objects (IPO), which was used to estimate the degree of intersection among boxes. The proposed IPO was also applied to determine the positive and negative bounding boxes and introduce a more reasonable approach to calculate precision and recall in the evaluation stage.
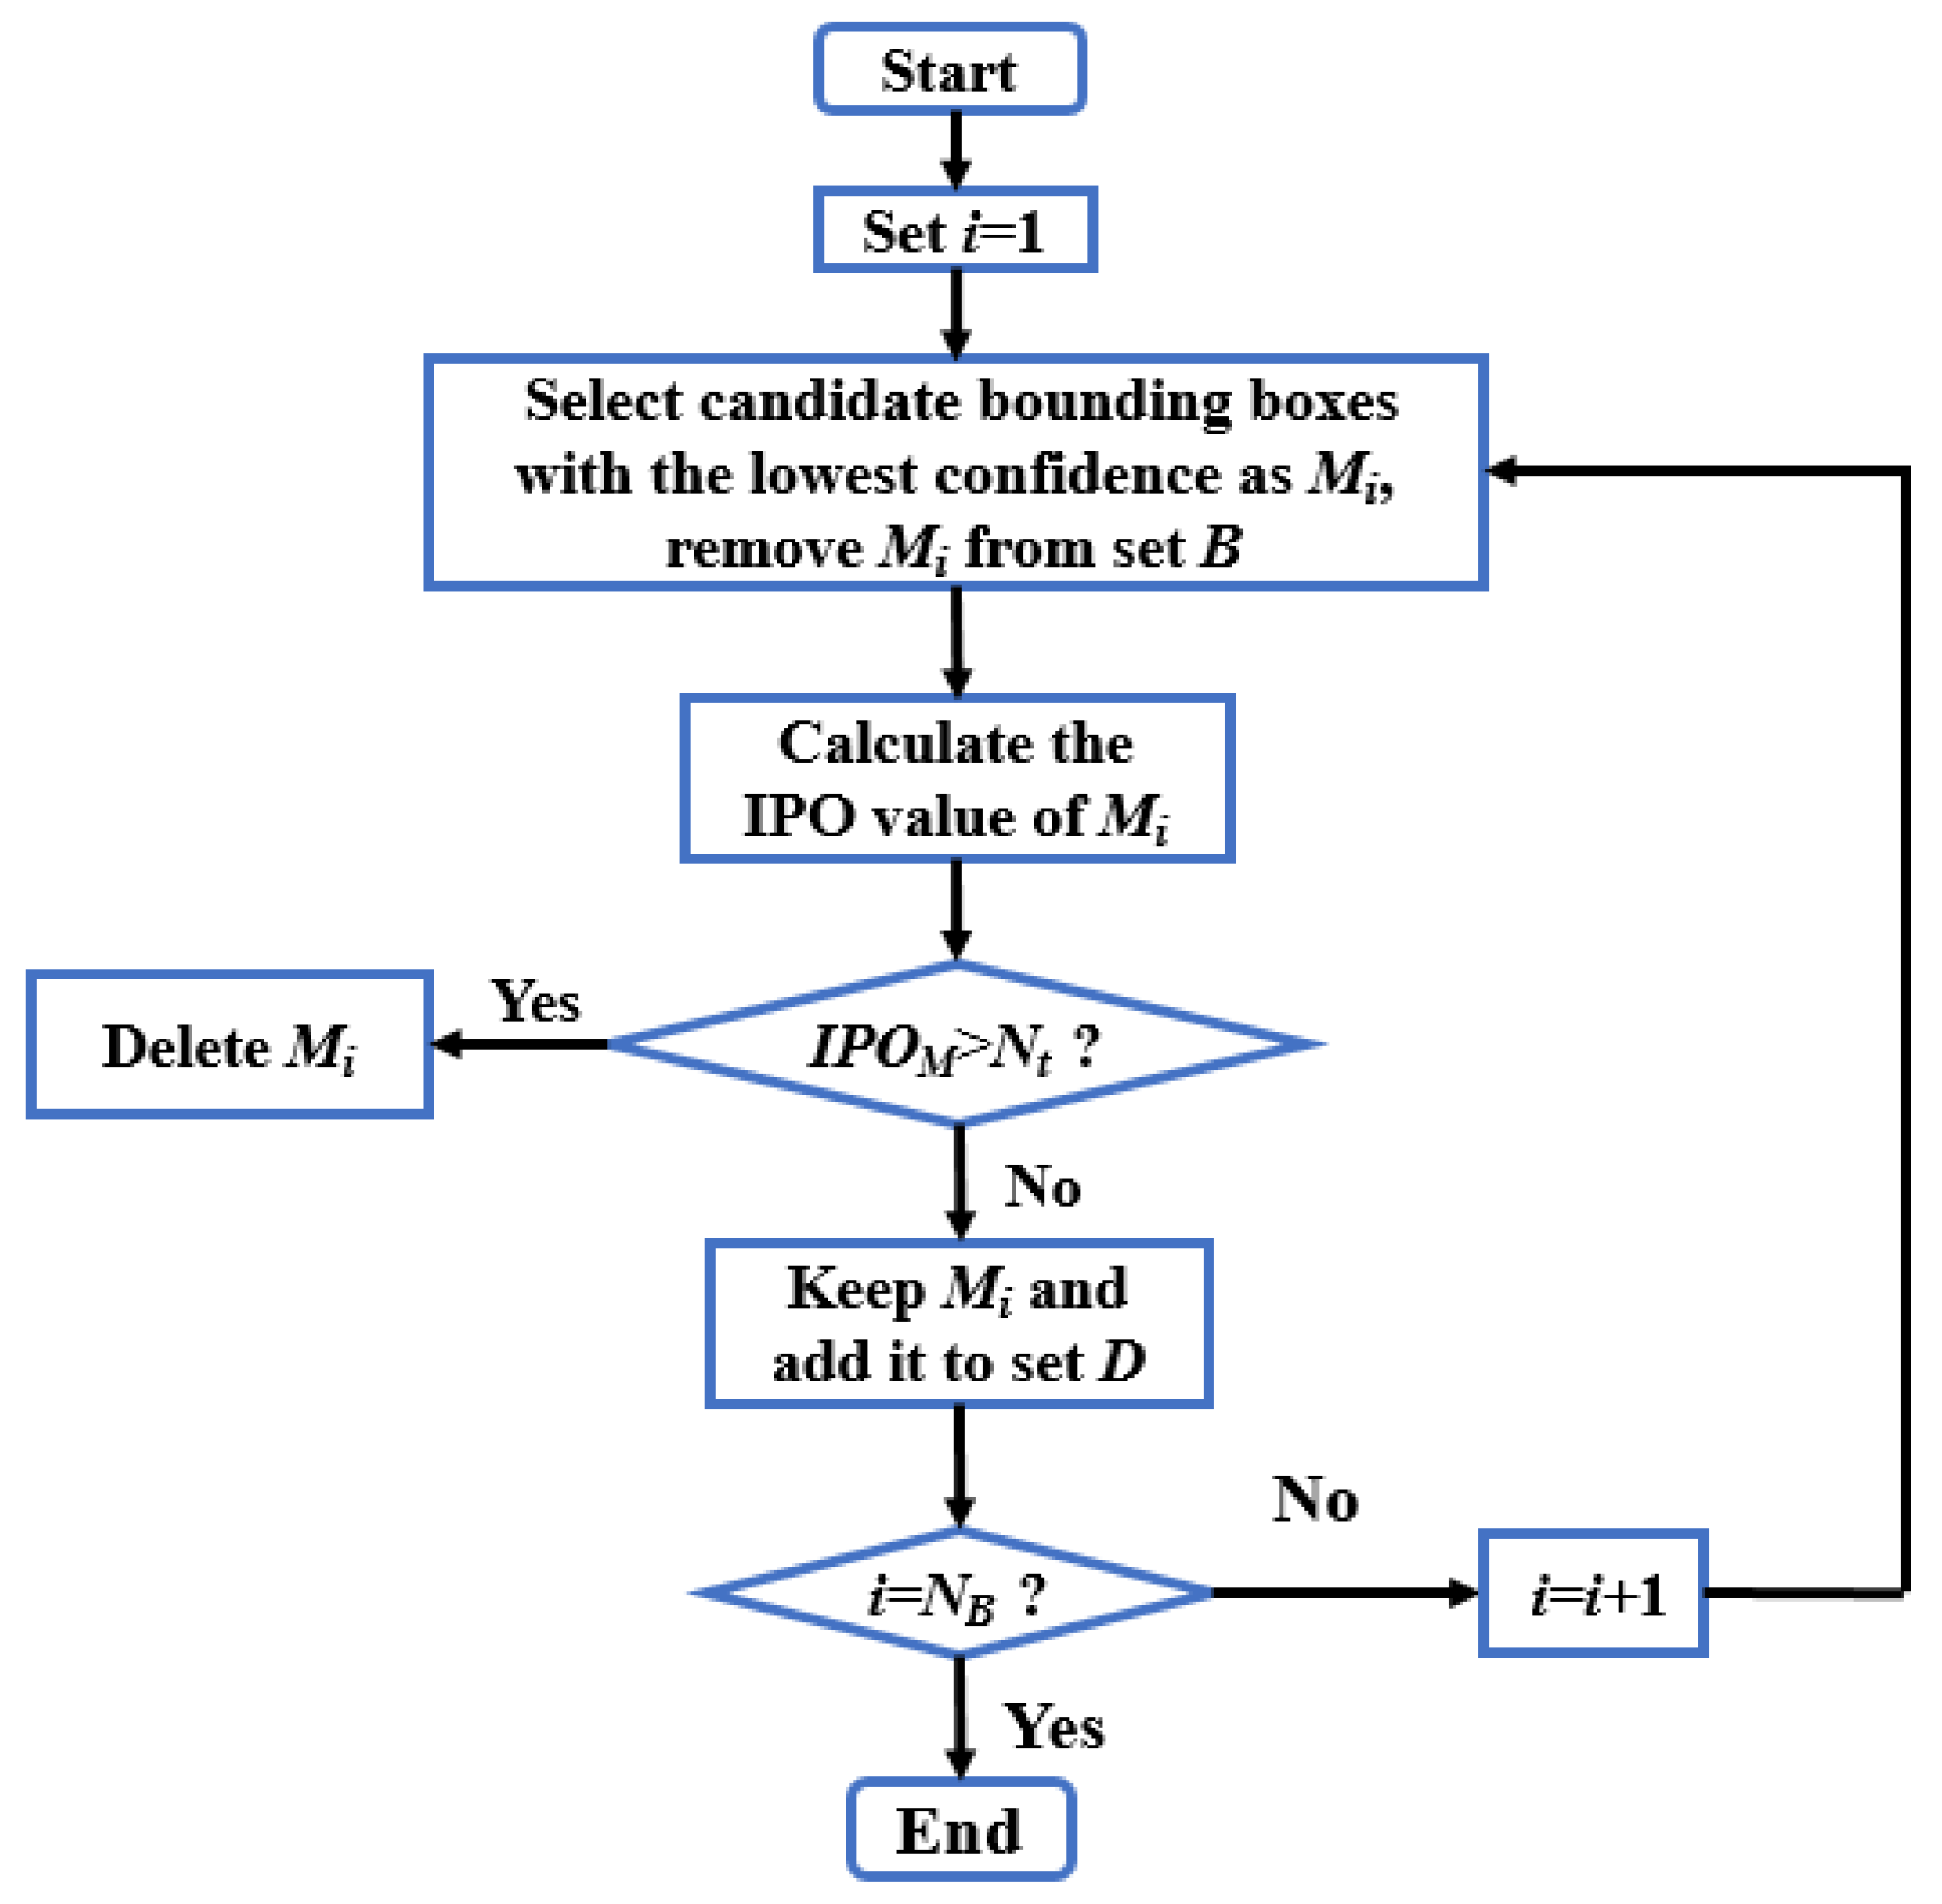
  • In the “many-to-many” case, to solve the problem of a few duplicate boxes still existing in the detection result after the NMS algorithm, this paper also proposes a new IPO-NMS algorithm for eliminating detected overlapping bounding boxes.
The remainder of this paper is structured as follows:
Section 2 first introduces the employed dataset of the work. Then, the corresponding proposed object detection framework and the IPO are addressed. Lastly, the relevant evaluation strategy is presented.
Section 3 reports the experimental settings and shows the comprehensive results of the proposed methods.
Section 4 discusses several detection results which are compared to ground truth pixelwise labeling, and further demonstrates the effectiveness of the proposed IPO strategy.
Section 5 summarizes and outlines the prospects for our work.

2. Materials and Methods

2.1. Datasets

2.1.1. UAV Images after Three Severe Earthquakes

The dataset used in this study is named Disaster Event Dataset-1 (DED-1) and contains three typical geological disaster objects (collapsed buildings, landslide and debris flow) and 16,535 labeled objects in total (11,336 labels of collapsed buildings were considered in this work). This dataset is currently confidential and may be disclosed upon request.
This work collected around 7000 post-earthquake images captured by UAV from Sichuan, Qinghai and Yunnan province in China. The relative flying height was from 300 to 500 m, and the ground resolution was around 10–15 cm, all of which had a three-channel RGB. According to the requirements of overlapping degrees (anti-overfitting) and image quality (avoid blurry images), the 1062 most representative images of earthquake-affected collapsed buildings were selected for this study, with some of the main information listed in Table 1. These images were selected from different regions and different seasons, where severe earthquakes had taken place, so that the diversity of experimental data could be guaranteed. The image size is 4368 × 2912 for Sichuan and 5616 × 3744 for both Qinghai and Yunnan; there were 842, 112 and 108 images of these regions, respectively, and each of them was given a corresponding sample image. The preprocessing procedure includes the annotation of collapsed buildings, data enhancement and division.
The dataset used in this study has a PASCAL VOC [35] format and is divided into three folders: JPEGImages, Annotations and ImageSets. In the JPEGImages folder, the UAV images of collapsed buildings are stored. In ImageSets, four TXT files named “train”, “trainval”, “val” and “test” were created, indicating the numbers of training, validation and testing images. The folder of Annotations stores the coordinates of the collapsed buildings (xmin, xmax, ymin, ymax) in each image in XML format.
LabelImg is an image tagging tool which was specifically developed for deep learning research. Users can flexibly adjust the labels by using menu tools to sketch and adjust the border and automatically generate the corresponding XML files. In this work, the selected raw images were annotated with this tool, and the detection targets were marked with green rectangles. The annotation interface and examples are shown in Figure 3.

2.1.2. Data Enhancement

In order to increase the generalization of the presented deep-learning-based detection model and avoid potential overfitting as much as possible, the collected data were augmented in this study. The method of data augmentation can be simply described as a simple data augmentation method including translation, rotation, color transformation, image transformation, image clipping and image aliasing based on various positions and operations. The following seven methods of data augmentation were employed in this study [36]: flipping horizontally, translation, clipping, rotating 90 degrees, contrast enhancement and adding noise. The resulting images are shown in Figure 4.
Each collected image was enhanced by randomly selecting the introduced enhancement methods, and the final number of input images was 2124. The enhanced images were divided into training, validation and test sets according to the ratio of 8:2. Detailed information on the division of the enlarged dataset is shown in Table 2.

2.2. Detection Framework Based on Faster R-CNN+DCNv2

2.2.1. Network Architecture

In this study, the collapsed building detection framework based on Faster R-CNN was investigated as shown in Figure 5, and ResNet50 [37] was embedded as the feature extraction network. Firstly, the image to be detected was fed into the detection framework and re-sampled to a fixed size of 1000 × 600. Secondly, multi-scale feature maps were generated by the corresponding deep feature extraction network ResNet50. Subsequently, RPN convolved the input feature maps with a 3 × 3 convolution kernel, and the candidate bounding boxes of nine different sizes were generated, which were further resized by region of interest (ROI) pooling and used as input fully connected layers for object detection and the regression of the bounding boxes.
In this work, when using Faster R-CNN for feature fusion, the extracted high-level semantic feature information was obtained by fusing features from shallow and deep convolutional layers to improve the performance of extraction for the collapsed building. Moreover, each dimension of the final generated features can better describe the input image.

2.2.2. Deformable Convolution

Based on the Faster R-CNN framework, deformable convolution [34] was introduced in this work to substitute all the 3 × 3 convolution layers in the Conv3_x, Conv4_x and Conv5_x stages of ResNet50 in the feature extraction network. The pixel information in the target area of collapsed buildings in the high-resolution image is very limited, and even slight geometric deformation has a great influence on the detection result. When capturing the images, the position and motion state of the UAV constantly change. Furthermore, when affected by the rotation of the Earth and the curvature of the Earth’s surface, the target of collapsed buildings might be influenced by geometric deformation. In addition, the geometry of collapsed buildings is deformed compared with undamaged buildings, resulting in arbitrary shapes. Thus, applying deformable convolution can help to solve the problem of the target deformation of collapsed buildings in high-resolution remote sensing images.
The convolution kernel of a traditional CNN is a regular window with a fixed size as shown in Figure 6a. Deformable convolution adds a learnable convolution kernel offset to the region of convolution and changes its geometry. Thus, the feature extraction network might adaptively change the feature region and focus on the image region of interest, as shown in Figure 6b.
Taking the 3 × 3 convolution kernel as an example, for each output y(P0), nine surrounding positions are considered, centralized by P0, and the corresponding feature map x is sampled accordingly to estimate y(P0), which is defined as:
R = { ( 1 , 1 ) , ( 1 , 0 ) , , ( 0 , 1 ) , ( 1 , 1 ) }
For point P0 on the output feature maps y, the traditional convolution is operated as:
y ( P 0 ) = P n R ω ( P n ) x ( P 0 + P n )
In order to find the region containing effective information, the deformable convolution layer (DCNv1) introduces one offset parameter ΔPn on the convolution kernel, which is learned by adding another layer of convolution before the original convolution. Based on DCNv1, DCNv2 employs the weight coefficient of effective information, and the corresponding output is computed by the following formula:
y ( P 0 ) = P n R ω ( P n ) x ( P 0 + P n + Δ P n ) Δ m ( P n )
where ω is the weight of the convolution kernel, Δm(Pn) indicates the weight of each sampled point, and P represents the points on the feature maps. Since the learned offset ΔPn might be a float number, bilinear interpolation should be used as Equation (4) denotes.
x ( p ) = q G ( q , p ) x ( q )
where p is the sampling position of the floating point P0 + Pn + ΔPn; q represents the feature mapping position corresponding to the input feature map; and G (q, p) stands for the bilinear interpolation kernel, including x and y dimensions, which can be calculated by the following formula:
G ( q , p ) = g ( q x , p x ) g ( q y , p y )
g ( a , b ) = m a x ( 0 , 1 | a b | )

2.3. IPO-Based Algorithm for Detected Overlapping Bounding Boxes Removal and Evaluation Strategy

In this section, the IPO computation is first addressed, and then a new NMS method based on the IPO, called IPO-NMS, is presented. Lastly, a new evaluation strategy based on the IPO is introduced in detail.

2.3.1. Calculation Principle of the IPO

In this paper, instead of the traditional IoU, a new calculation method called the intersected proportion of objects (IPO) is proposed. This method is used to determine the degree of intersection among boxes. The approach is simple and inspired by the idea of pixelwise segmentation; the IPO value is defined as the ratio between the total number of pixels in a rectangular box that intersect with multiple adjacent boxes and the total number of pixels in the rectangular box itself. The schematic diagram of IPO calculation is shown in Figure 7.

2.3.2. Algorithm for Overlap Removal Based on IPO-NMS

Conventional NMS eliminates all the candidate bounding boxes whose IoU with the highest confidence candidate bounding box is larger than a predefined threshold. However, the IoU of some small incorrect duplicate candidate bounding boxes in the detection results of collapsed buildings is lower than the predefined threshold, and they can survive. To address this limitation, we propose a new algorithm integrated with the IPO (IPO-NMS) for removing duplicate boxes to suppress incorrect candidate bounding boxes with overlapping. The detailed working flow of this algorithm is illustrated in Figure 8.
First, the candidate bounding boxes after the NMS algorithm are denoted as set B, and the total number of the corresponding candidate bounding boxes are denoted as NB. At the same time, the set of candidate bounding boxes processed by the IPO-MNS post-processing algorithm is denoted as set D.
  • Candidate bounding boxes with the lowest confidence, denoted as M, are chosen, and M is subtracted from set B Then, the IPO value of M(IPOM) is calculated.
  • If IPOM is greater than the threshold value Nt, M is discarded; otherwise, it is kept and added to set D.
  • If set B is empty, the loop ends.

2.3.3. New Evaluation Strategy

The mean average precision (mAP) is usually considered the evaluation criterion in object detection, in which the IoU is typically applied to measure the similarity degree between detected bounding boxes and ground truth bounding boxes. The IoU is defined as the ratio of the intersection and the union between a certain detected bounding box and its corresponding ground truth bounding box. If the IoU is higher than a threshold, the detection is considered to be successful. Otherwise, the detection is invalid. In general, detection results are divided into true positive (TP), false positive (FP), true negative (TN) and false negative (FN), and precision and recall are estimated accordingly. The precision–recall (PR) curve was made with recall under various confidence intervals as the X-axis and precision as the Y-axis. The area below the PR curve is the mAP for running the detection on the corresponding class; the higher the mAP is, the better the proposed detection model. The IoU takes regular rectangles as the basic computing unit and forms a good evaluation strategy in object detection with clear boundaries and regular outlines. However, when dealing with widely distributed collapsed buildings without a specific shape, and a fixed number or one-to-one relationship between detected bounding boxes and ground truth bounding boxes, the IoU can wrongly classify positive samples as negative samples, making the evaluation results unreliable. Therefore, we advocate for the use of the IPO to replace the traditional IoU along with different calculation methods of precision and recall. This strategy, inspired by the idea of pixelwise segmentation, bypasses the limitation that only one ground truth bounding box corresponds to one detected bounding box, evaluating object detection as a pixelwise intersection degree.
The evaluation strategy proposed in this paper includes precision, recall and the F1 score. Precision (P) is defined as the ratio between the number of correct detections and the total number of detections, whereas recall (R) is defined as the ratio between the number of ground truth bounding boxes that are successfully detected and the total number of ground truth bounding boxes. The F1 score (F1) is defined as the harmonic mean of precision and recall. The explicit equation of the criteria mentioned above is as follows, in which k is the number of classes; f(i) and g(i) in Equation (9) can be obtained as Equation (10).
P = 1 k i = 1 k f ( i ) , R = 1 k i = 1 k g ( i )
F 1 = 2 P R P + R
f ( i ) = 1 N i n = 1 N i φ p ( i , j , n ) , g ( i ) = 1 M i n = 1 M i φ r ( i , j , n )
φ p ( i , j , n ) = { 1 , I P O p δ 0 , I P O p < δ , φ r ( i , j , n ) = { 1 , I P O r δ 0 , I P O r < δ
where δ is a free parameter for the IPO threshold. Mi and Ni represent the number of ground truth bounding boxes and detected bounding boxes of class i. In Equation (11), the value of IPOp is the ratio between the number of pixels that are simultaneously located in both the detected bounding box and all the corresponding ground truth bounding boxes and the number of pixels in the detected bounding box. Similarly, the value of IPOr is the ratio between the number of pixels that are located in both one ground truth bounding box and all the corresponding detected bounding boxes; they can be calculated as Equation (11).
I P O p = P i n i j = 0 k P i n j , I P O r = Q i n i j = 0 k Q i n j
In Equation (11), k represents the number of classes; Pinj denotes the number of pixels of class j which are detected in the n-th bounding box of class i; Qinj is the number of pixels of class j which are detected in the n-th ground truth of class i, where i = 1, 2, …, k and j = 0, 1, …, k; and 0 represents the result of the background. If IPOp is larger than a threshold, the detected bounding box is identified as correct, and vice versa. If IPOr is larger than a threshold, we consider that the ground truth bounding box is successfully detected. The detailed settings of the abovementioned thresholds are explored and discussed in Section 3. For the sake of an understandable explanation, a simple schematic diagram for estimating precision and recall by the IPO is presented in Figure 9a–d. In the figure, blue box represents detected bounding box and red box represents ground truth bounding box. Besides, black box represents negative box and green area represents the intersection of the ground truth bounding box and detected bounding box.

3. Results

All the reported experiments in this paper were carried out on a platform with Ubuntu 18.04 and PyTorch 1.4.0 as the training framework. In the training stage, an SGD optimizer and warmup optimization were used with 12 epochs, the learning rate was set to 0.0025 after the first 500 iterations and it started to decay from the 8th to 11th epoch, finally remaining stable at 0.00025 with a weight decay of 0.0001. This setting is applied in our network and other state-of-the-art networks (RetinaNet [38], FSAF [39]), whereas YOLOv3 [40] contains 273 rounds of epochs, and the leaning rate remains at 0.001 after 2000 iterations, starts to decrease from the 218th to 246th epochs and stabilizes at 0.00001 with a weight decay of 0.0005. The programs used are from the open-source Shang Tang mmdetection v2.6.0.
The primary goal of the conducted experiments was to demonstrate the performance of our methods. Four subsections are included in this paper: in Section 3.1, the efficacy of the proposed evaluation strategy based on the IPO is shown by the results of eliminated detected overlapping bounding boxes and the determination of positive and negative detections; in the second subsection, the performance of the introduced DCNv2 on the main framework is investigated. Section 3.3 compares the quantitative and qualitative results of our method with those of three other different methods for detecting collapsed buildings. Lastly, Section 3.4 discusses the settings of thresholds in the period of eliminating detected overlapping bounding boxes and the determination of positive and negative detection.

3.1. Demonstration of the Efficacy of the Proposed IPO

In order to demonstrate the efficacy of the proposed IPO, an ablation study was performed based on the framework of Faster R-CNN+DCNv2. The results with and without the IPO-NMS are discussed and the evaluation criteria of precision (P), recall (R), and F1 score (F1) computed by the IoU and IPO (see Section 2.3.3 for more details) are shown. Table 3 lists the corresponding quantitative results, and Figure 10 and Figure 11 show the qualitative results. The thresholds of IPO-NMS (Nt) and determining positive and negative detection (δ) were both set at 0.6. A detailed discussion of the investigation thresholds can be found in Section 3.4.
In Table 3, the values of P, R and F1, which are estimated based on the IoU, are significantly lower than those based on the IPO. This can be explained by the fact that when the IoU is applied to determine the correctness of the detected bounding boxes, it is very possible that only a small portion of the detected bounding boxes can be classified as positive detections, especially in our case for dealing with collapsed buildings, and the ground truth labels are typically generated with high subjectivity (see also Figure 2). Such detection is also inconsistent with the visualization result, as shown in Figure 11 and Figure 12. Therefore, to some extent, it can be concluded that the evaluation by using the IoU is not as suitable as the IPO for region-level object detection such as collapsed buildings.
To further assess the performance of the proposed IPO, taking the red box in Figure 10a and the yellow box in Figure 10b as examples, the conventional IoU between the red detected bounding box and the yellow ground truth bounding box is obviously less than the threshold (δ) for determining positive and negative detections; thus, the red box is fed back as a negative result. In contrast, with the strategy of the proposed IPO, the red box is predicted as a positive detection, which is consistent with the visual result of the ground truth.
The qualitative detection results from the dataset of Sichuan, Qinghai and Yunnan are presented, and for each of them, we randomly selected the detections of one representative image to be shown. Thus, Figure 11 and Figure 12 compare the detection results with overlapping bounding boxes with and without the proposed IPO-NMS algorithm, in which some completed overlapping bounding boxes are indicated by red arrows. Without using our IPO-NMS algorithm, in the detection result, there are few explicit repeated bounding boxes, which are nearly completely overlapping with others in the images from Sichuan and Yunnan, whereas in Qinghai, the buildings are densely distributed and, therefore, are collapsed in mutually overlapping pieces. More repeated bounding boxes were detected due to the collapsed buildings having arbitrary shapes. As mentioned, repeated bounding boxes mostly have mutually overlapping relationships, and some repeated bounding boxes were removed in the normal NMS stage but without a reliable performance. After employing the proposed IPO-NMS method, we found that all these repeated bounding boxes disappear as shown in Figure 12. This is because instead of the IoU, which only considers a “one-to-one” case, the IPO considers cases of “one-to-many” and “many-to many” that estimate the intersection degree by using all the overlapping bounding boxes as a toy example as shown in Figure 9. Finally, the visualization results of the experiment and evaluation indexes shown in Table 3 prove that the IPO-NMS algorithm can effectively remove the overlapped boxes.
Revisiting Table 3, the precision and recall are slightly lower with the introduction of the IPO-NMS algorithm. However, this result can be generated on account of these detected repeated bounding boxes as shown in the qualitative result of Figure 11 where the IPO-NMS algorithm is not used. In other words, several detected repeated bounding boxes are likely to be classified as a positive detection in practice, as they typically perceive the same collapsed area, and the same area might be repeatedly calculated by several positive detections, resulting in an artificially high precision and recall. Therefore, the proposed IPO can act as a more objective and reasonable method for evaluating the performance of the collapsed building detection method, and the embedded IPO-NMS algorithm is superior in the case of completely mutually overlapping bounding boxes.

3.2. Evaluation of the DCNv2 Module Based on Faster R-CNN

In order to explore the performance of the DCNv2 module in collapsed building detection, another ablation study was conducted in this work by comparing the original Faster R-CNN and the improved Faster R-CNN+DCNv2.
Figure 13 shows one example of the corresponding labeled ground truth bounding boxes investigated in this study. The quantitative and qualitative results before and after integrating with the DCNv2 module are shown in Table 4 and Figure 14, respectively. In Figure 14a,b, the red circles represent the false detected bounding box, and yellow circles represent the ground truth bounding boxes that are not successfully detected. After applying DCNv2, more collapsed buildings are detected as the yellow circle indicates, and fewer buildings incorrectly identified as collapsed are found, as the red circle denotes.
From the numerical results listed in Table 4, based on the proposed IPO, and compared with the original Faster R-CNN, the values of the precision, recall and F1 score of Faster R-CNN+DCNv2 increased by around one to two percentage points. It can be further seen that, from Figure 14, compared with the original Faster R-CNN, the new framework has a stronger ability to perceive the information of object edges due to the addition of the DCNv2 module, which can effectively reduce the chances of false detection and missing detection. Thus, a corresponding conclusion can be drawn that the presented DCNv2 works effectively to improve the model’s ability for feature extraction and detection for variable objects with arbitrary shapes.

3.3. Comparison with Other Detection Networks

Four object detection models including the proposed one (namely, YOLOv3, RetinaNet, FSAF and Faster R-CNN+DCNv2) were individually trained and validated on the introduced dataset of collapsed buildings. The models mentioned above were mainly divided into single-stage (YOLOv3, RetinaNet, FSAF) and two-stage (Faster R-CNN+DCNv2) detection models, and the performances of different detection frameworks were compared on the same testing dataset.
Table 5 lists the numerical results of the four models with IPO-NMS. In general, the values of P, R and F1 with the IPO strategy are much higher than the corresponding values using IoU. This conclusion is analogous to Section 3.1 where the relevant reasons are given. In addition, the P, R and F1 of Faster R-CNN+DCNv2 are not the best among the four models in the IoU, whereas R and F1 are the highest using the strategy of the IPO. The experimental results displayed above can be explained by the fact that YOLOv3 and FSAF generate fewer detected bounding boxes than Faster R-CNN+DCNv2 does, so their precision is higher with both the IoU and the IPO. However, on account of the fewer detected bounding boxes, there are fewer positive samples as well, resulting in a low value of recall. Accordingly, although there are more detected bounding boxes generated by RetinaNet, there are fewer positive samples in the detection result; hence, the value of recall is slightly lower than that of Faster R-CNN+DCNv2 using the strategy of the IPO. Consequently, compared with other models, the overall performance of Faster R-CNN+ DCNv2 is better with the proposed IPO strategy, the precision achieves fairly good values, and the recall and F1 scores are both higher.
Figure 15 shows one qualitative result detected by the presented Faster R-CNN+DCNv2 and three other models. The green boxes in the figure are the detected objects of collapsed buildings, red circles represent false detection, and yellow circles indicate missing detections. The results detected by YOLOv3 and FSAF contain many missing detections, shown by the corresponding yellow ellipses and circles which demonstrate their inferior detection capability for small objects. Meanwhile, there are more false detections for RetinaNet, in which a landslide with a similar texture is mistaken for collapsed buildings, as this model cannot easily distinguish between similar textures. The detection results above indicate that the single-stage detection model is not especially suitable for datasets of collapsed buildings, which is why the direct regression mechanism of the single-stage detector experiences difficulties in learning the parameters of the model’s localization regression, which leads to poor detection results.
Other than the single-stage detection model, Faster R-CNN+DCNv2 as a two-stage detection model obtains superior performance for object detection as it occupies two-stage features to describe the object, and the presented DCNv2 module is more flexible than the traditional convolution module, which can adaptively change the perceived feature region to obtain more effective features. Therefore, the model is more invariant to arbitrary shapes and more advanced for detecting collapsed buildings from UAV images, which decreases the occurrence of false detection and missing detection. The experimental result indicates that Faster R-CNN+DCNv2 performs better than the other detection models when detecting collapsed buildings.

3.4. Investigation of the Threshold Settings

In this work, there are two free parameters which need to be discussed: the threshold for determining positive and negative detections (δ) and the threshold used in the IPO-NMS algorithm (Nt). As for the threshold of δ, the empirical threshold value 0.6 was selected as a passing score; that is, if the IPO value of this detection is over 60%, it can be identified as a positive result. The selection of the threshold for IPO-NMS is qualitatively investigated in Figure 16; the same image is used to show the removal of detected overlapping bounding boxes in visual results when IPO-NMS thresholds (Nt) are input as 0.5, 0.6 and 0.7.
As can be seen from these four detection results in Figure 16, when Nt equals 0.7, there is still a small number of overlapping bounding boxes (marked by a red circle in the figure) in the detection results. When Nt = 0.5 and Nt = 0.6, in general, all the detected overlapping bounding boxes disappear. Therefore, in this study, the threshold of IPO-NMS was also selected as 0.6 which is identical to δ.

4. Discussion

There are some existing pixelwise detection and recognition methods for collapsed buildings based on deep learning [18,29,30,31]. However, the main purpose of this study was to find an approximated area where the collapsed buildings are located in the UAV images and help to implement rescue after earthquake disasters. Thus, the target object which needs to be sought simply requires rough information of the affected area instead of boundary demarcation of the damaged buildings. Nevertheless, to further verify the effectiveness of the proposed IPO strategy, we selected two representative images (named 01 and 02) and carried out pixelwise labeling, which means the boundaries of the collapsed buildings were clearly generated (shown by the dark red area in Figure 17a and Figure 18a), and our method was analyzed based on the pixelwise labeling results, using the number of pixels that are located in both the detected bounding boxes. The pixelwise labeling results are also discussed.
The experimental results are shown in Table 6, Table 7, Figure 17 and Figure 18, in which the light-yellow areas are generated by overlapping the detected bounding boxes with the ground truth pixelwise labeling, and the light red areas are the result of ground truth pixelwise labeling and are not successfully found by the detected bounding boxes. In this experiment, precision (P) was estimated by the ratio of the pixels in the light yellow areas and the pixels in the dark red areas in the detected bounding boxes, recall (R) was calculated by the ratio of the pixels in the light yellow areas and the pixels in the dark red areas in the ground truth pixelwise labeling, and the F1 was estimated by using the corresponding P and R.
From these two tables, a similar conclusion to that in Section 3.1 can be drawn. First, after applying the IPO-NMS, these three criteria decreased slightly, as some pixels lying in the overlapping bounding boxes (in principle, these boxes should be eliminated) were used as correct detection multiple times. Second, the precision, recall and F1 score estimated from the traditional IoU method were obviously lower than the values based on the proposed IPO strategy. This is probably due to the fact that the IPO strategy is more suitable for determining the positive and negative detection when dealing with images with arbitrarily distributed collapsed buildings, and the relationship between the detected bounding boxes and the ground truth is more complex with “many-to-many”, “one-to-many” and “many-to-one” situations.
The numerical results provided in Table 6 and Table 7 can also be seen in Figure 17 and Figure 18. The IPO-based detection framework is able to find more positive detections (marked by green rectangles in Figure 17d and Figure 18d), and these positive detections contain more ground truth pixels (marked by the corresponding yellow parts) which also indicates that fewer ground truth pixels are missed, and consequently, the recall value is better. When comparing the yellow areas to the dark red areas shown in Figure 17b and Figure 18b, in general, more bounding boxes which have a higher percentage of collapsed buildings, are detected. Thus, it can be concluded that the IPO strategy is more sensitive to large collapsed areas, as more collapsed buildings can be detected while fewer incorrect detections remain. This also supports the findings in Section 3.1.
One shortcoming that needs further consideration was found by comparing the ground truth pixelwise labeling and the detection result of the IPO, i.e., the contents shown by Figure 17d and Figure 18d; there are quite a few ambiguous background pixels which are included in some large detected bounding boxes and incorrectly identified as collapsed buildings. Extracting fewer ambiguous background pixels would be very helpful; for example, the rescue operation can be launched with a highly accurate position, and the government can provide suitable funding for rebuilding the disaster areas.

5. Conclusions

Based on high-resolution UAV images of collapsed buildings from three different post-earthquake areas in China, this study investigated one of the most popular deep-learning-based object detection models, i.e., Faster R-CNN, in relation to the target of collapsed buildings. The feature extraction network of the original Faster R-CNN was improved by introducing deformable convolution (DCNv2) to extend its adaptability to the irregular geometric characteristics of collapsed buildings. The experimental results indicate that the improved Faster R-CNN+DCNv2 model can effectively alleviate the problems of false detection and missing detection. To address the subjectivity when generating ground truth bounding boxes, which result in a more complex relationship between detections and ground truth (such as, “one-to-many”, “many-to-one”, “many-to-many”), instead of the conventional IoU, we propose the intersected proportion of objects (IPO) and improved the NMS algorithm and evaluation criteria (precision and recall) using this strategy. Finally, some corresponding experiments were conducted to assess the performance of the IPO compared with the IoU strategy in the elimination of detected overlapping bounding boxes and the evaluation of detecting collapsed buildings.
In the future, we aim to investigate the shortage of ambiguous background pixels, and three potential directions can be explored. First, instead of large bounding boxes, small yet overlapping bounding boxes are preferred. Second, the computation of the IPO could be integrated in the training loss, thus making the model more sensitive to the collapsed buildings with arbitrary shapes. Three, bounding boxes could be improved with certain degrees of rotations.

Author Contributions

Conceptualization, J.D. and Z.Z.; methodology, J.D.; software, J.D. and J.Z.; validation, Z.Z., J.D., J.Z. and X.W.; formal analysis, J.Z. and X.W.; investigation, J.D. and J.Z.; resources, Z.Z.; data curation, J.D.; writing—original draft preparation, J.D., X.T. and J.Z.; writing—review and editing, X.W.; visualization, J.D., J.Z. and X.T.; supervision, Z.Z and X.W.; project administration, Z.Z.; funding acquisition, Z.Z. All authors have read and agreed to the published version of the manuscript.

Funding

This research was funded by the National Natural Science Foundation of China, grant number 61871295.

Data Availability Statement

Access to the data will be considered upon request.

Acknowledgments

The authors would like to thank the editors and anonymous reviewers for their valuable comments and suggestions, which helped us improve this work.

Conflicts of Interest

The authors declare no conflict of interest.

References

  1. Dell’Acqua, F.; Gamba, P. Remote sensing and earthquake damage assessment: Experiences, limits, and perspectives. Proc. IEEE 2012, 100, 2876–2890. [Google Scholar] [CrossRef]
  2. Yeom, J.; Jung, J.; Chang, A.; Choi, I. Hurricane Harvey Building Damage Assessment Using UAV Data. Proc. AGU Fall Meet. Abstr. 2017, 2017, NH23E-2837. [Google Scholar]
  3. Dong, L.; Shan, J. A comprehensive review of earthquake-induced building damage detection with remote sensing techniques. ISPRS J. Photogramm. Remote Sens. 2013, 84, 85–99. [Google Scholar] [CrossRef]
  4. Sugiyama, M.; Abe, H.S.K. Detection of Earthquake Damaged Areas from Aerial Photographs by Using Color and Edge Information. In Proceedings of the 5th Asian Conference on Computer Vision, Melbourne, Australia, 23–25 January 2002; pp. 23–25. [Google Scholar]
  5. Zhang, J.; Xie, L.; Tao, X. Change detection of remote sensing image for earthquake-damaged buildings and its application in seismic disaster assessment. J. Nat. Disasters 2002, 11, 59–64. [Google Scholar]
  6. Rathje, E.M.; Woo, K.S.; Crawford, M.; Neuenschwander, A. Earthquake damage identification using multi-temporal high-resolution optical satellite imagery. In Proceedings of the 2005 IEEE International Geoscience and Remote Sensing Symposium, 2005. IGARSS’05, Seoul, Korea, 29 July 2005; Volume 7, pp. 5045–5048. [Google Scholar]
  7. Miura, H.; Midorikawa, S.; Soh, H.C. Texture analysis of high-resolution satellite images for damage detection in the 2010 Haiti earthquake. J. Jpn. Assoc. Earthq. Eng. 2012, 12, 2–20. [Google Scholar]
  8. Li, P.; Xu, H.; Liu, S.; Guo, J. Urban building damage detection from very high-resolution imagery using one-class SVM and spatial relations. In Proceedings of the 2009 IEEE International Geoscience and Remote Sensing Symposium, Cape Town, South Africa, 12–17 July 2009; Volume 5, pp. V-112–V-114. [Google Scholar]
  9. Chini, M.; Cinti, F.R.; Stramondo, S. Co-seismic surface effects from very high-resolution panchromatic images: The case of the 2005 Kashmir (Pakistan) earthquake. Nat. Hazards Earth Syst. Sci. 2011, 11, 931–943. [Google Scholar] [CrossRef] [Green Version]
  10. Vu, T.; Matsuoka, M.; Yamazaki, F. Shadow analysis in assisting damage detection due to earthquakes from Quick bird imagery. In Proceedings of the 10th International Society for Photogrammetry and Remote Sensing Congress, Istanbul, Turkey, 12–23 July 2004; pp. 607–611. [Google Scholar]
  11. Iwasaki, Y.; Yamazaki, F. Detection of building collapse from the shadow lengths in optical satellite images. In Proceedings of the 32nd Asian Conference on Remote Sensing, Tapei, Taiwan, 3–7 October 2011; pp. 550–555. [Google Scholar]
  12. Chesnel, A.L.; Binet, R.; Wald, L. Object oriented assessment of damage due to natural disaster using very high-resolution images. In Proceedings of the 2007 IEEE International Geoscience and Remote Sensing Symposium, Barcelona, Spain, 23–28 July 2007; pp. 3736–3739. [Google Scholar]
  13. Turker, M.; Cetinkaya, B. Automatic detection of earthquake-damaged buildings using DEMs created from pre- and post-earthquake stereo aerial photographs. Int. J. Remote Sens. 2005, 26, 823–832. [Google Scholar] [CrossRef]
  14. Yamazaki, F.; Vu, T.; Matsuoka, M. Context-based detection of post-disaster damaged buildings in urban areas from satellite images. In Proceedings of the 2007 Urban Remote Sensing Joint Event, Paris, France, 11–13 April 2007; pp. 1–5. [Google Scholar]
  15. Liu, J.; Shan, X.; Yin, J. Automatic recognition of damaged town buildings caused by earthquake using remote sensing information: Taking the 2001 Bhuj, India, earthquake and the 1976 Tangshan, China, earthquake as examples. Acta Seismol. Sin. 2004, 17, 686–696. [Google Scholar] [CrossRef]
  16. Ye, X.; Qin, Q.; Liu, M.; Wang, J.; Wang, J. Building damage detection from post-quake remote sensing image based on fuzzy reasoning. In Proceedings of the 2014 IEEE Geoscience and Remote Sensing Symposium, Quebec City, QC, Canada, 13–18 July 2014; pp. 529–532. [Google Scholar]
  17. Li, L.; Zhang, B.; Wu, Y. Fusing spectral and texture information for collapsed buildings detection in airborne image. In Proceedings of the 2012 IEEE International Geoscience and Remote Sensing Symposium, Munich, Germany, 22–27 July 2012; pp. 186–189. [Google Scholar]
  18. Wu, C.; Zhang, F.; Xia, J.; Xu, Y.; Li, G.; Xie, J.; Du, Z.; Liu, R. Building Damage Detection Using U-Net with Attention Mechanism from Pre-and Post-Disaster Remote Sensing Datasets. Remote Sens. 2021, 13, 905. [Google Scholar] [CrossRef]
  19. Zhu, X.X.; Tuia, D.; Mou, L.; Xia, G.S.; Zhang, L.; Xu, F.; Fraundorfer, F. Deep learning in remote sensing: A comprehensive review and list of resources. IEEE Geosci. Remote Sens. Mag. 2017, 5, 8–36. [Google Scholar] [CrossRef] [Green Version]
  20. Pacifici, F.; Chini, M.; Emery, W.J. A neural network approach using multi-scale textural metrics from very high-resolution panchromatic imagery for urban land-use classification. Remote Sens. Environ. 2009, 113, 1276–1292. [Google Scholar] [CrossRef]
  21. Han, X.; Jiang, T.; Zhao, Z.; Lei, Z. Research on remote sensing image target recognition based on deep convolution neural network. Int. J. Pattern Recognit. Artif. Intell. 2020, 34, 2054015. [Google Scholar] [CrossRef]
  22. Ren, S.; He, K.; Girshick, R.; Sun, J. Faster R-CNN: Towards real-time object detection with region proposal networks. IEEE Trans. Pattern Anal. Mach. Intell. 2016, 39, 1137–1149. [Google Scholar] [CrossRef] [PubMed] [Green Version]
  23. Zhang, W.; Shen, L.; Qiao, W. Building Damage Detection in Vhr Satellite Images Via Multi-Scale Scene Change Detection. In Proceedings of the 2021 IEEE International Geoscience and Remote Sensing Symposium IGARSS, Brussels, Belgium, 11–16 July 2021; pp. 8570–8573. [Google Scholar]
  24. Duarte, D.; Nex, F.; Kerle, N.; Vosselman, G. Satellite Image Classification of Building Damages Using Airborne and Satellite Image Samples in a Deep Learning Approach. ISPRS Ann. Photogramm. Remote Sens. Spat. Inf. Sci. 2018, 4, 89–96. [Google Scholar] [CrossRef] [Green Version]
  25. Ji, M.; Liu, L.; Buchroithner, M. Identifying collapsed buildings using post-earthquake satellite imagery and convolutional neural networks: A case study of the 2010 Haiti earthquake. Remote Sens. 2018, 10, 1689. [Google Scholar] [CrossRef] [Green Version]
  26. Vetrivel, A.; Gerke, M.; Kerle, N.; Nex, F.; Vosselman, G. Disaster damage detection through synergistic use of deep learning and 3D point cloud features derived from very high-resolution oblique aerial images, and multiple-kernel-learning. ISPRS J. Photogramm. Remote Sens. 2018, 140, 45–59. [Google Scholar] [CrossRef]
  27. Xiong, C.; Li, Q.; Lu, X. Automated regional seismic damage assessment of buildings using an unmanned aerial vehicle and a convolutional neural network. Autom. Constr. 2020, 109, 102994. [Google Scholar] [CrossRef]
  28. Miura, H.; Aridome, T.; Matsuoka, M. Deep learning-based identification of collapsed, non-collapsed and blue tarp-covered buildings from post-disaster aerial images. Remote Sens. 2020, 12, 1924. [Google Scholar] [CrossRef]
  29. Rudner, T.; Ruwurm, M.; Fil, J. Multi3Net: Segmenting Flooded Buildings via Fusion of Multiresolution, Multisensor, and Multitemporal Satellite Imagery. In Proceedings of the AAAI Conference on Artificial Intelligence, Palo Alto, CA, USA, 8–12 October 2019; pp. 702–709. [Google Scholar]
  30. Shen, Y.; Zhu, S.; Yang, T.; Chen, C. Cross-directional Feature Fusion Network for Building Damage Assessment from Satellite Imagery. arXiv 2020, arXiv:2010.14014. [Google Scholar]
  31. Adriano, B.; Yokoya, N.; Xia, J.; Miura, H.; Liu, W. Learning from multimodal and multitemporal earth observation data for building damage mapping. ISPRS J. Photogramm. Remote Sens. 2021, 175, 132–143. [Google Scholar] [CrossRef]
  32. Ma, H.; Liu, Y.; Ren, Y.; Yu, J. Detection of collapsed buildings in post-earthquake remote sensing images based on the improved YOLOv3. Remote Sens. 2020, 12, 44. [Google Scholar] [CrossRef] [Green Version]
  33. Dai, J.; Qi, H.; Xiong, Y.; Li, Y.; Zhang, G.; Hu, H.; Wei, Y. Deformable convolutional networks. In Proceedings of the IEEE International Conference on Computer Vision, Venice, Italy, 22–29 October 2017; pp. 764–773. [Google Scholar]
  34. Zhu, X.; Hu, H.; Lin, S.; Dai, J. Deformable convnets v2: More deformable, better results. In Proceedings of the IEEE/CVF Conference on Computer Vision and Pattern Recognition, Long Beach, CA, USA, 15–20 June 2019; pp. 9308–9316. [Google Scholar]
  35. Everingham, M.; Van Gool, L.; Williams, C.K.I.; Winn, J.; Zisserman, A. The pascal visual object classes (voc) challenge. Int. J. Comput. Vis. 2010, 88, 303–338. [Google Scholar] [CrossRef] [Green Version]
  36. Perez, L.; Wang, J. The effectiveness of data augmentation in image classification using deep learning. arXiv 2017, arXiv:1712.04621. [Google Scholar]
  37. He, K.; Zhang, X.; Ren, S.; Sun, J. Deep residual learning for image recognition. In Proceedings of the IEEE Conference on Computer Vision and Pattern Recognition, Las Vegas, NV, USA, 27–30 June 2016; pp. 770–778. [Google Scholar]
  38. Lin, T.Y.; Goyal, P.; Girshick, R.; He, K.; Dollár, P. Focal loss for dense object detection. In Proceedings of the IEEE International Conference on Computer Vision, Venice, Italy, 22–29 October 2017; pp. 2980–2988. [Google Scholar]
  39. Zhu, C.; He, Y.; Savvides, M. Feature selective anchor-free module for single-shot object detection. In Proceedings of the IEEE/CVF Conference on Computer Vision and Pattern Recognition, Long Beach, CA, USA, 15–20 June 2019; pp. 840–849. [Google Scholar]
  40. Redmon, J.; Farhadi, A. Yolov3: An incremental improvement. arXiv 2018, arXiv:1804.02767. [Google Scholar]
Figure 1. Traditional object detection scenario. (a) Dog detection, (b) vehicle detection.
Remotesensing 14 00663 g001
Figure 2. Comparison of various labeled and detected bounding boxes of the same collapsed buildings. (a) Small-scale label, (b) middle-scale label, (c) large-scale label, (d) test result.
Remotesensing 14 00663 g002
Figure 3. Annotation interface and examples.
Remotesensing 14 00663 g003
Figure 4. Image enhancement methods. (a) Original image, (b) flipped horizontally, (c) translation, (d) clipping, (e) rotated 90 degrees, (f) contrast enhancement, (g) added noise, (h) cutout.
Remotesensing 14 00663 g004
Figure 5. The network architecture for collapsed building detection based on Faster R-CNN.
Remotesensing 14 00663 g005
Figure 6. Comparison of 3 × 3 convolution operations. (a) Traditional 3 × 3 convolution kernel, (b) 3 × 3 deformable convolution kernel.
Remotesensing 14 00663 g006
Figure 7. Diagram of IPO calculation.
Remotesensing 14 00663 g007
Figure 8. Working flow of the IPO-NMS algorithm.
Remotesensing 14 00663 g008
Figure 9. Toy examples for the evaluation strategy based on the IPO (recall = 66.7%, precision = 75%). (a) A toy example of ground truth bounding boxes, (b) a toy example of detected bounding boxes, (c) a toy example for recall, (d) a toy example for precision.
Remotesensing 14 00663 g009
Figure 10. Comparison of the detection results and manual labels of the sample images. (a) Schematic diagram of the detection results, (b) schematic diagram of the manual label.
Remotesensing 14 00663 g010
Figure 11. Detection results without IPO-NMS (red arrows denote completely overlapping bounding boxes which should be eliminated). (a) Sichuan, (b) Yunnan, (c) Qinghai.
Remotesensing 14 00663 g011
Figure 12. Detection results with IPO-NMS (these abovementioned overlapping bounding boxes disappear). (a) Sichuan, (b) Yunnan, (c) Qinghai.
Remotesensing 14 00663 g012
Figure 13. Original image and manually labeled graph. (a) Manual label, (b) original image.
Remotesensing 14 00663 g013
Figure 14. Comparison of the detection results before and after adding DCNv2. (a) Result of Faster R-CNN, (b) result of Faster R-CNN+DCNv2.
Remotesensing 14 00663 g014
Figure 15. Qualitative comparison of the detected results from different models. (a) YOLOv3, (b) RetinaNet, (c) FSAF, (d) Faster R-CNN+DCNv2.
Remotesensing 14 00663 g015
Figure 16. Comparison of IPO-NMS with various Nt values. (a) Without IPO-NMS, (b) with IPO-NMS (Nt = 0.5), (c) with IPO-NMS (Nt = 0.6), (d) with IPO-NMS (Nt = 0.7).
Remotesensing 14 00663 g016
Figure 17. Analysis of the results of image-01. See the main content for the explanation of the areas indicated by various colors. (a) Ground truth pixelwise labelling, (b) the detection result of the proposed method, (c) comparison based on the IoU, (d) comparison based on the IPO.
Remotesensing 14 00663 g017
Figure 18. Analysis of the results of image-02. See the main content for the explanation of the areas indicated by various colors. (a) Ground truth pixelwise labeling, (b) the detection result of the proposed method, (c) comparison based on the IoU, (d) comparison based on the IPO.
Remotesensing 14 00663 g018
Table 1. Original image information of DED-1.
RegionTimeImage SizeNumberSample Image
Sichuan17 May 2008
18 May 2008
22 July 2008
4368 × 2912842 Remotesensing 14 00663 i001
Qinghai19 April 20105616 × 3744112 Remotesensing 14 00663 i002
Yunnan22 December 2015
3 January 2016
7 January 2016
5616 × 3744108 Remotesensing 14 00663 i003
Table 2. Division of DED-1 after enhancement.
DatasetNumber of ImagesNumber of Labels on Collapsed Buildings
Training set135914,522
Validation set3403585
Test set4254569
Table 3. Evaluations using the IoU and IPO with and without IPO-NMS.
EvaluationIoUIPO
Model PRF1PRF1
Faster R-CNN +DCNv20.5350.5650.5490.7920.7970.794
Faster R-CNN +DCNv2+IPO-NMS0.5570.5320.5440.7840.7910.787
Table 4. P, R and F1 scores calculated by the IoU and IPO with and without DCNv2.
EvaluationIoUIPO
Model PRF1PRF1
Faster R-CNN+IPO-NMS0.5540.5210.5370.7760.7740.775
Faster R-CNN+DCNv2+IPO-NMS0.5570.5320.5440.7840.7910.787
Table 5. The quantitative results of the introduced four object detection models.
IoUIPO
PRF1PRF1
YOLOv30.6480.4910.5590.8510.6760.753
RetinaNet0.5010.5400.5190.7390.7810.759
FSAF0.6510.5110.5730.8300.7060.763
Faster R-CNN+DCNv20.5570.5320.5440.7840.7910.787
Table 6. Detection result of image-01.
IoUIPO
PRF1PRF1
Faster R-CNN+DCNv20.1980.3300.2470.5280.8800.660
Faster R-CNN+DCNv2+IPO-NMS0.1990.3300.2480.5270.8740.658
Table 7. Detection result of image-02.
EvaluationIoUIPO
Model PRF1PRF1
Faster R-CNN+DCNv20.4820.7480.5860.6040.9370.735
Faster R-CNN+DCNv2+IPO-NMS0.4640.7180.5640.6050.9370.735
Publisher’s Note: MDPI stays neutral with regard to jurisdictional claims in published maps and institutional affiliations.

