Article

Dolines and Cats: Remote Detection of Karst Depressions and Their Application to Study Wild Felid Ecology

1
Research Centre of the Slovenian Academy of Sciences and Arts, Anton Melik Geographical Institute, Novi trg 2, 1000 Ljubljana, Slovenia
2
Department of Forestry, Biotechnical Faculty, University of Ljubljana, Večna pot 83, 1000 Ljubljana, Slovenia
3
Department of Evolutionary Ecology, Leibniz Institute for Zoo and Wildlife Research, Alfred-Kowalke-Straße 17, 10315 Berlin, Germany
4
Slovenia Forest Service, Večna pot 2, 1000 Ljubljana, Slovenia
*
Author to whom correspondence should be addressed.
Remote Sens. 2022, 14(3), 656; https://doi.org/10.3390/rs14030656
Submission received: 27 December 2021 / Revised: 21 January 2022 / Accepted: 27 January 2022 / Published: 29 January 2022
(This article belongs to the Special Issue Use of Remote Sensing Techniques for Wildlife Habitat Assessment)

Abstract

:
Automatic methods for detecting and delineating relief features allow remote and low-cost mapping, which has an outstanding potential for wildlife ecology and similar research. We applied a filled-DEM (digital elevation model) method using LiDAR (Light Detection and Ranging) data to automatically detect dolines and other karst depressions in a rugged terrain of the Dinaric Mountains, Slovenia. Using this approach, we detected 9711 karst depressions in a 137 km2 study area and provided their basic morphometric characteristics, such as perimeter length, area, diameter, depth, and slope. We performed visual validation based on shaded relief, which indicated 83.5% accordance in detecting depressions. Although the method has some drawbacks, it proved suitable for detection, general spatial analysis, and calculation of morphometric characteristics of depressions over a large scale in remote and forested areas. To demonstrate its applicability for wildlife research, we applied it in a preliminary study in combination with GPS-telemetry data to assess the selection of these features by two wild felids, the Eurasian lynx (Lynx lynx) and the European wildcat (Felis silvestris). Both species selected for vicinity of karst depressions, among which they selected for larger karst depressions. Lynx also regularly killed ungulate prey near these features, as we found more than half of lynx prey remains inside or in close vicinity of karst depressions. These results illustrate that karstic features could play an important role in the ecology of wild felids and warrant further research, which could be considerably assisted with the use of remote detection of relief features.

1. Introduction

Recent advances in accurate satellite and aerial imagery, as well as laser scanning data, enable increasingly detailed analyses of the earth’s surface [1]. Geographic information systems (GIS) allow the creation of various thematic maps from satellite and aerial imagery, most commonly for land use or land cover [2]. However, field mapping and digitizing relief features and other landscape elements is often inaccurate, time-consuming, and costly [3]. Therefore, various methods, such as visual interpretations of relief and semi-automatic or automatic methods for detecting and delineating features are being developed in the field of remote sensing for non-contact and low-cost mapping (e.g., [4,5,6,7,8,9,10]).
LiDAR (Light Detection and Ranging) is a remote sensing method which uses electromagnetic energy to detect an object and determine its distance to the instrument, as well as ascribe its physical properties based on the radiation [11]. LiDAR is widely used for high-resolution data processing and analysis in scientific, engineering, and natural hazard management fields, among others [11,12]. LiDAR can also be applied to ecological research, as it provides insights into the 3D physical structure of ecosystems, from relief to vertical vegetation structures [13] and allows the study of relief features even under vegetation [11,14]. High-resolution LiDAR data and automatic or semi-automatic methods for relief features detection are especially useful for relief analysis in large, remote, and hard-to-access areas [3,13,15].
Karst landscape is known as one of the most rugged terrains on our planet and exhibits high density of various geomorphological features [16]. It differs from many other geomorphological systems by dissolution and removal of material in solution, negligible accumulation, and predominant vertical water flow are predominant processes, resulting in the formation of surface and subsurface geomorphological features [17,18,19,20]. These features include karst depressions, which are primarily understood as concave relief forms on an ideally levelled or smooth surface where the material at the surface is more exposed to erosion or corrosion due to discontinuity, cracks, or porosity [17,18,19,20,21,22].
Dolines (also known as sinkholes, e.g., [23]) are the most common and characteristic feature of karst depressions and are therefore considered as a diagnostic karst form. Dolines are defined as circular or elliptical depressions of different sizes and are generally wider than deeper. Their diameter and depth range varies from a few meters to more than a hundred meters [17,21,24,25]. Due to their importance and abundance, karst depressions have been subject of various scientific studies for decades. Besides geomorphology and karstology, which are mainly focused on morphometric, morphological, and morphogenetic studies, dolines are also subject of other research fields, such as geology, biogeography, forestry, botany, animal ecology, and nature conservation (e.g., [26,27,28,29,30,31,32]). Until the advanced development of remote sensing technology and the availability of remote sensing data, tasks such as mapping, morphometric and morphogenetic analyses of karst depressions were mostly done in the field or based on topographic maps. However, these approaches were often time-consuming and resulted in low accuracy, poor data quality and were affected by the subjectivity of the perception of the size of depressions [22], which limited their use for further research. Several authors have recently initiated development and application of methods for automatic detection of karst depressions (e.g., [15,22,23,25,27,28,31,33,34,35,36,37]). The methods are based on various approaches, generally divided into three groups: delineation of depressions based on the outermost closed contour line, watershed-based depressions delineation, and filled-DEM (digital elevation model) based depressions delineation [34].
Relief characteristics are often included in studies of animal spatial ecology, but they are usually limited to general terrain characteristics, such as elevation, terrain ruggedness, or slope (e.g., [38,39,40,41,42,43]). On the other hand, the influence of micro- and meso-relief features, such as karst depressions, are rarely considered in these studies, despite their potential importance (e.g., [44]). This was partially connected to the lack of methodology developed for remote detection of specific relief features on a larger scale, which is needed for many large-bodied species with large home ranges, as well as to limited availability of high-resolution LiDAR DEM. In the previous studies on micro-habitat use, the focus was mainly on the evaluation of land-cover (e.g., [45]) and other biotic elements of studied micro-habitats. Less attention was given to geomorphology, specific relief features, geomorphic processes, and LiDAR DEM analyses, which require specific skills and interdisciplinary cooperation between bio- and geo-scientists is often necessary to take full advantage of high-resolution LiDAR DEM data use in animal ecology. On the other hand, many recent studies exist on detailed geomorphometric characteristics derived from high-resolution LiDAR DEM, and diverse methods were developed for automated extraction of micro- and meso-relief features, including dolines (e.g., [7,8,9,10,15,22,23,25,27,28,31,33,34,35,36,37]). Therefore, combining automatized identification of relief features with GPS-telemetry data could provide novel insights into ecology of elusive and wide-roaming animals, such as carnivores.
The main goal of this study was to remotely detect karst depressions based on LiDAR data and to demonstrate the applicability of remote detection of relief features for further ecological research by investigating potential importance of karst depressions for two native carnivores. Specifically, we aimed to (1) detect dolines and other karst depressions larger than 10 m in diameter and 2 m in depth, (2) calculate their geomorphometric characteristics, (3) compare our model with visually detected karst depressions based on a shaded relief, and (4) assess the selection of these features by two wild felids: the Eurasian lynx (Lynx lynx; hereafter lynx) and the European wildcat (Felis silvestris; hereafter wildcat). Additionally, we conducted a preliminary case study on importance of karst depressions for lynx hunting behavior. We selected felids as a model group due to their general attraction to rugged and rocky terrain, as well as previous studies documenting the importance of micro-habitat characteristics for their ecology (e.g., [26,40,44,45,46,47,48,49,50,51,52]). Previous studies on these felids almost exclusively relied on assessing micro-habitat characteristics in the field, which demanded considerable effort to obtain a relatively limited amount of data. Our study on wild felids in Dinaric Mountains is one of the first that primarily relies on remote sensing data to detect micro-habitat characteristics on a large scale. We used GPS-telemetry data of both felids, as well as distribution of lynx kill sites, to understand whether felids select for karst depressions in their habitat use and, in case of the lynx, hunting behavior. We also tested whether lynx or wildcats select for certain karst depressions in respect to their morphometric characteristics. Finally, we discuss the suitability and applicability of remote detection of specific relief features for further large-scale ecological studies.

2. Material and Methods
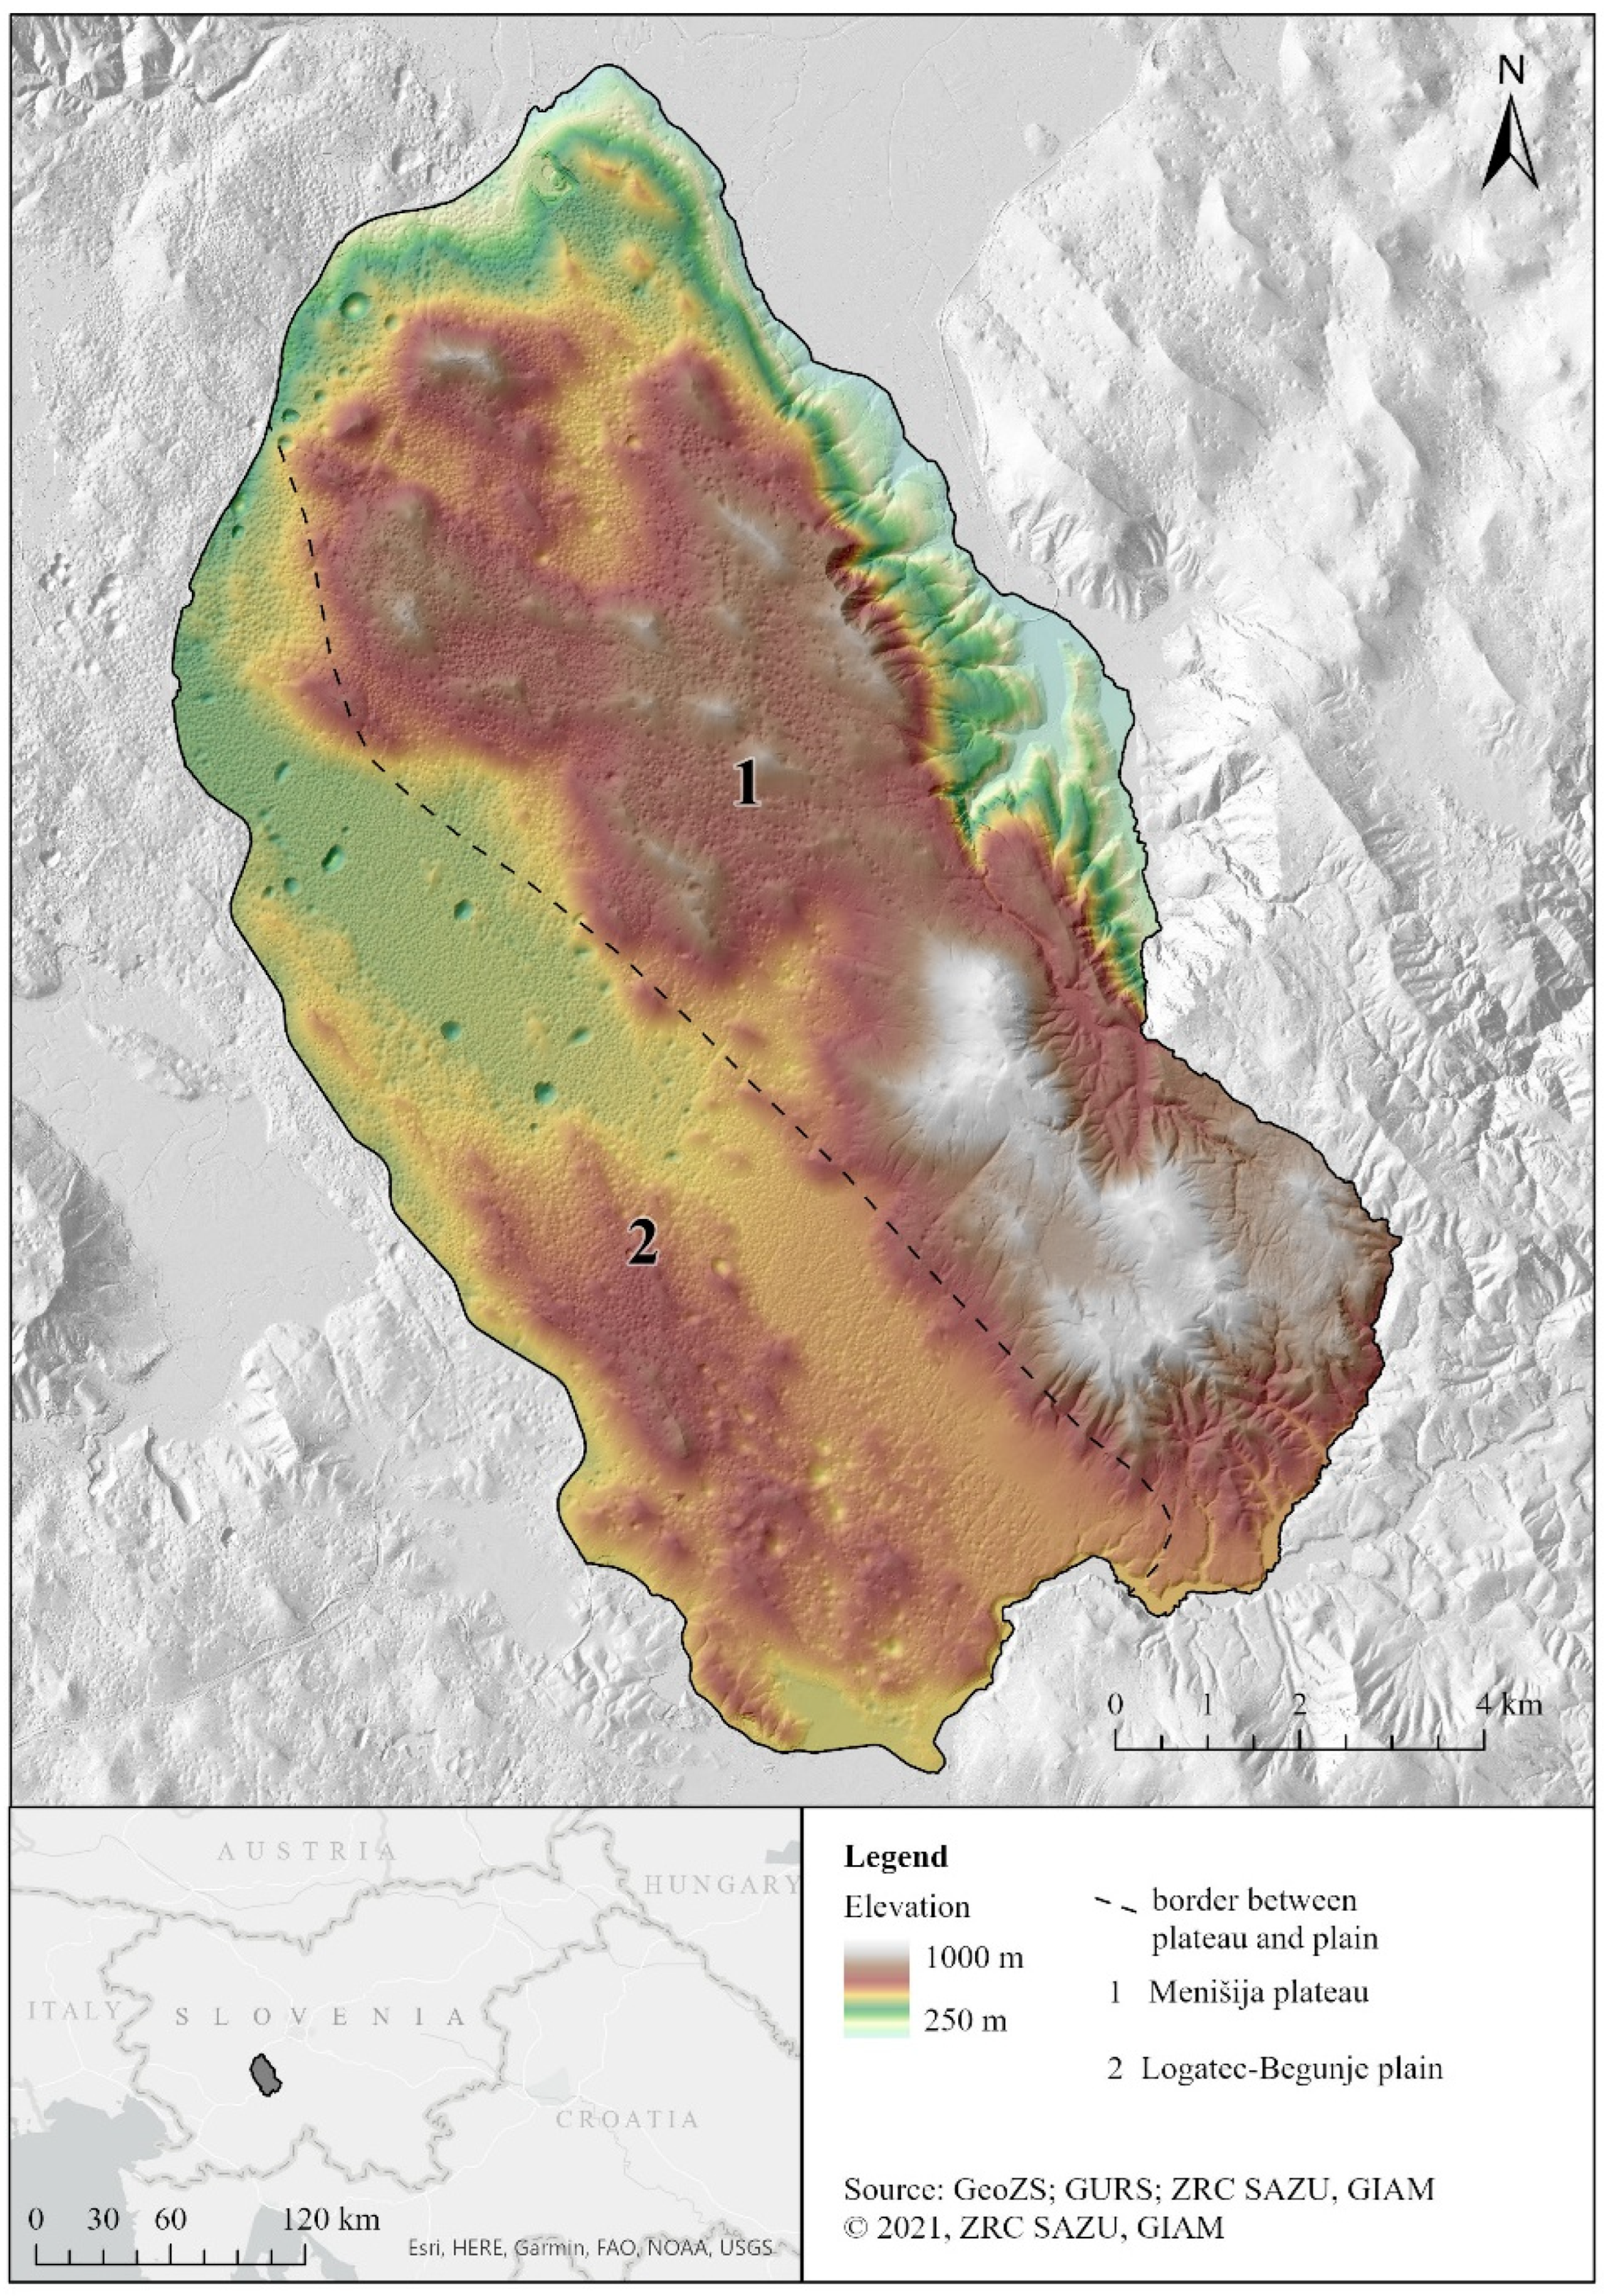
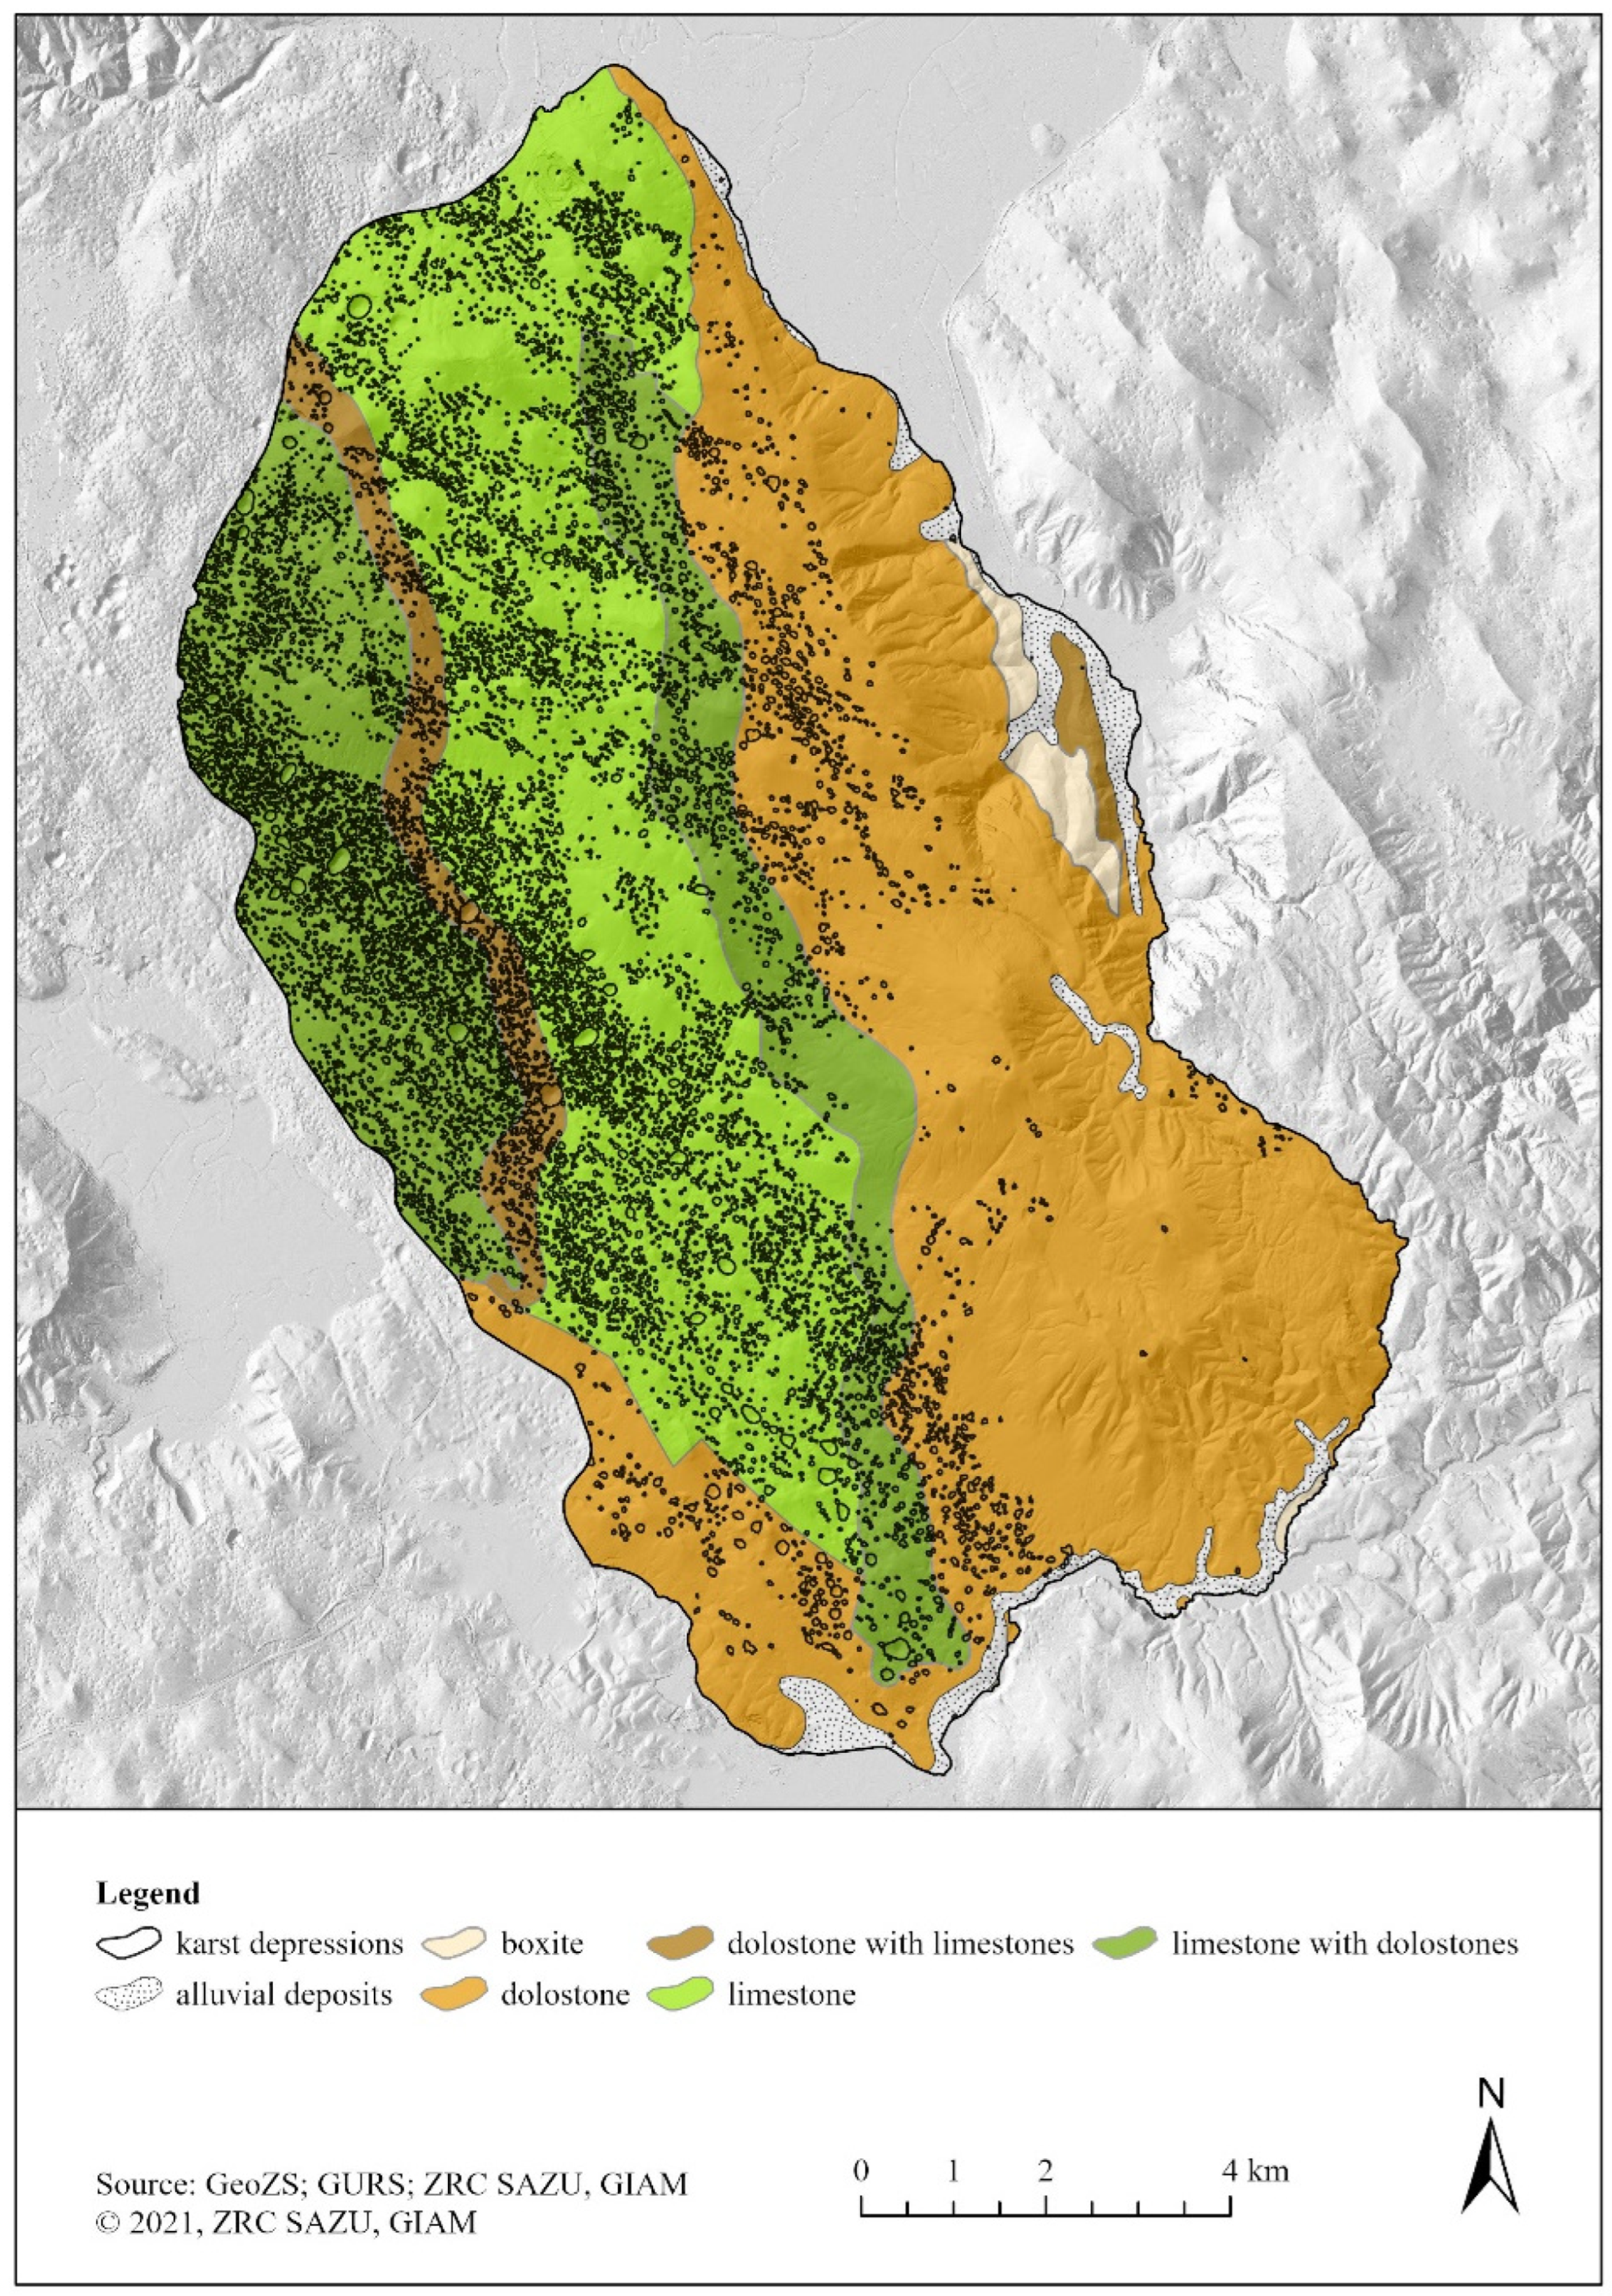
2.1. Study Area

The Menišija plateau (hereafter Menišija) and the Logatec-Begunje plain (hereafter Ravnik) are located in the northern part of the Dinaric Mountains, Slovenia (Figure 1). The study area covers 137.0 km2, where the average elevation is 627 m, and the highest peak is 998 m. The area is dominated by the karst relief type, numerous karst relief features, and underground water flow. Menišija is defined as a high karst plateau and Ravnik as a karst plain, on which the deep karst has developed [19]. Carbonate rocks predominate in the area and follow in belts from west to east: Cretaceous limestones, Jurassic dolostone with Jurassic limestones, Triassic dolostone, and Holocene deposits of rivers and streams [53,54]. Due to the bedrock types and karstification, the relief is very rugged. The most common of many karst features are caves, karrens and karst depressions, which include dolines, collapse dolines, denuded caves, uvalas, karst poljes, and dells [17,19,33]. The rock layers are approximately 10 km deep and therefore relatively resistant to tectonic deformation. The piezometric level of groundwater is at depths between 300 and 400 m below the surface. Since the deepest karst depressions do not reach the groundwater level, the area is defined as deep karst [17,33,55,56]. The area lies at the junction of two climate subtypes, the temperate continental climate of western and southern Slovenia and the temperate continental climate of central Slovenia with average annual precipitation of 1587 mm [57,58]. The study area is characterized by dense forest cover, along with extensive livestock farming, logging, and scattered small human settlements on the periphery of the study area [59]. Most of the area is covered by forest, mainly of Dinaric fir–beech associations (Omphalodo-Fagetum) [60]. It is also known for its high biodiversity and, besides the two species of felids, the local carnivore guild includes grey wolves (Canis lupus), brown bears (Ursus arctos), and several species of small carnivores [59]. The main prey of lynx in the study area are wild ungulates, which together represent 88% of biomass consumed by lynx, with roe deer (Capreolus capreolus) being the main prey species (79% of consumed biomass) [61].

2.2. Detection of Karst Depressions

We used the filled-DEM method for karst depression detection [33,62]. Similar to previous authors who used this method (e.g., [15,28,34]), we used its adapted phases (Figure 2). We used a data cloud of ground points from aerial laser scanning conducted in 2011, 2014, and 2015 to create a raster layer of DEM with a cell resolution of 1 × 1 m; the estimated density of ground points in forested areas is 0.5 per m2 [63,64]. To detect karst depressions and calculate of their geomorphometric characteristics, we used ESRI software ArcGIS Pro 2.8.2. Based on LiDAR-derived DEM, we first calculated the watersheds and delineated the karst depressions. Next, we calculated the morphometric characteristics of the karst depressions and eliminated depressions that were smaller according to the size criteria (see Section 2.2.2) or had non-karst origin.

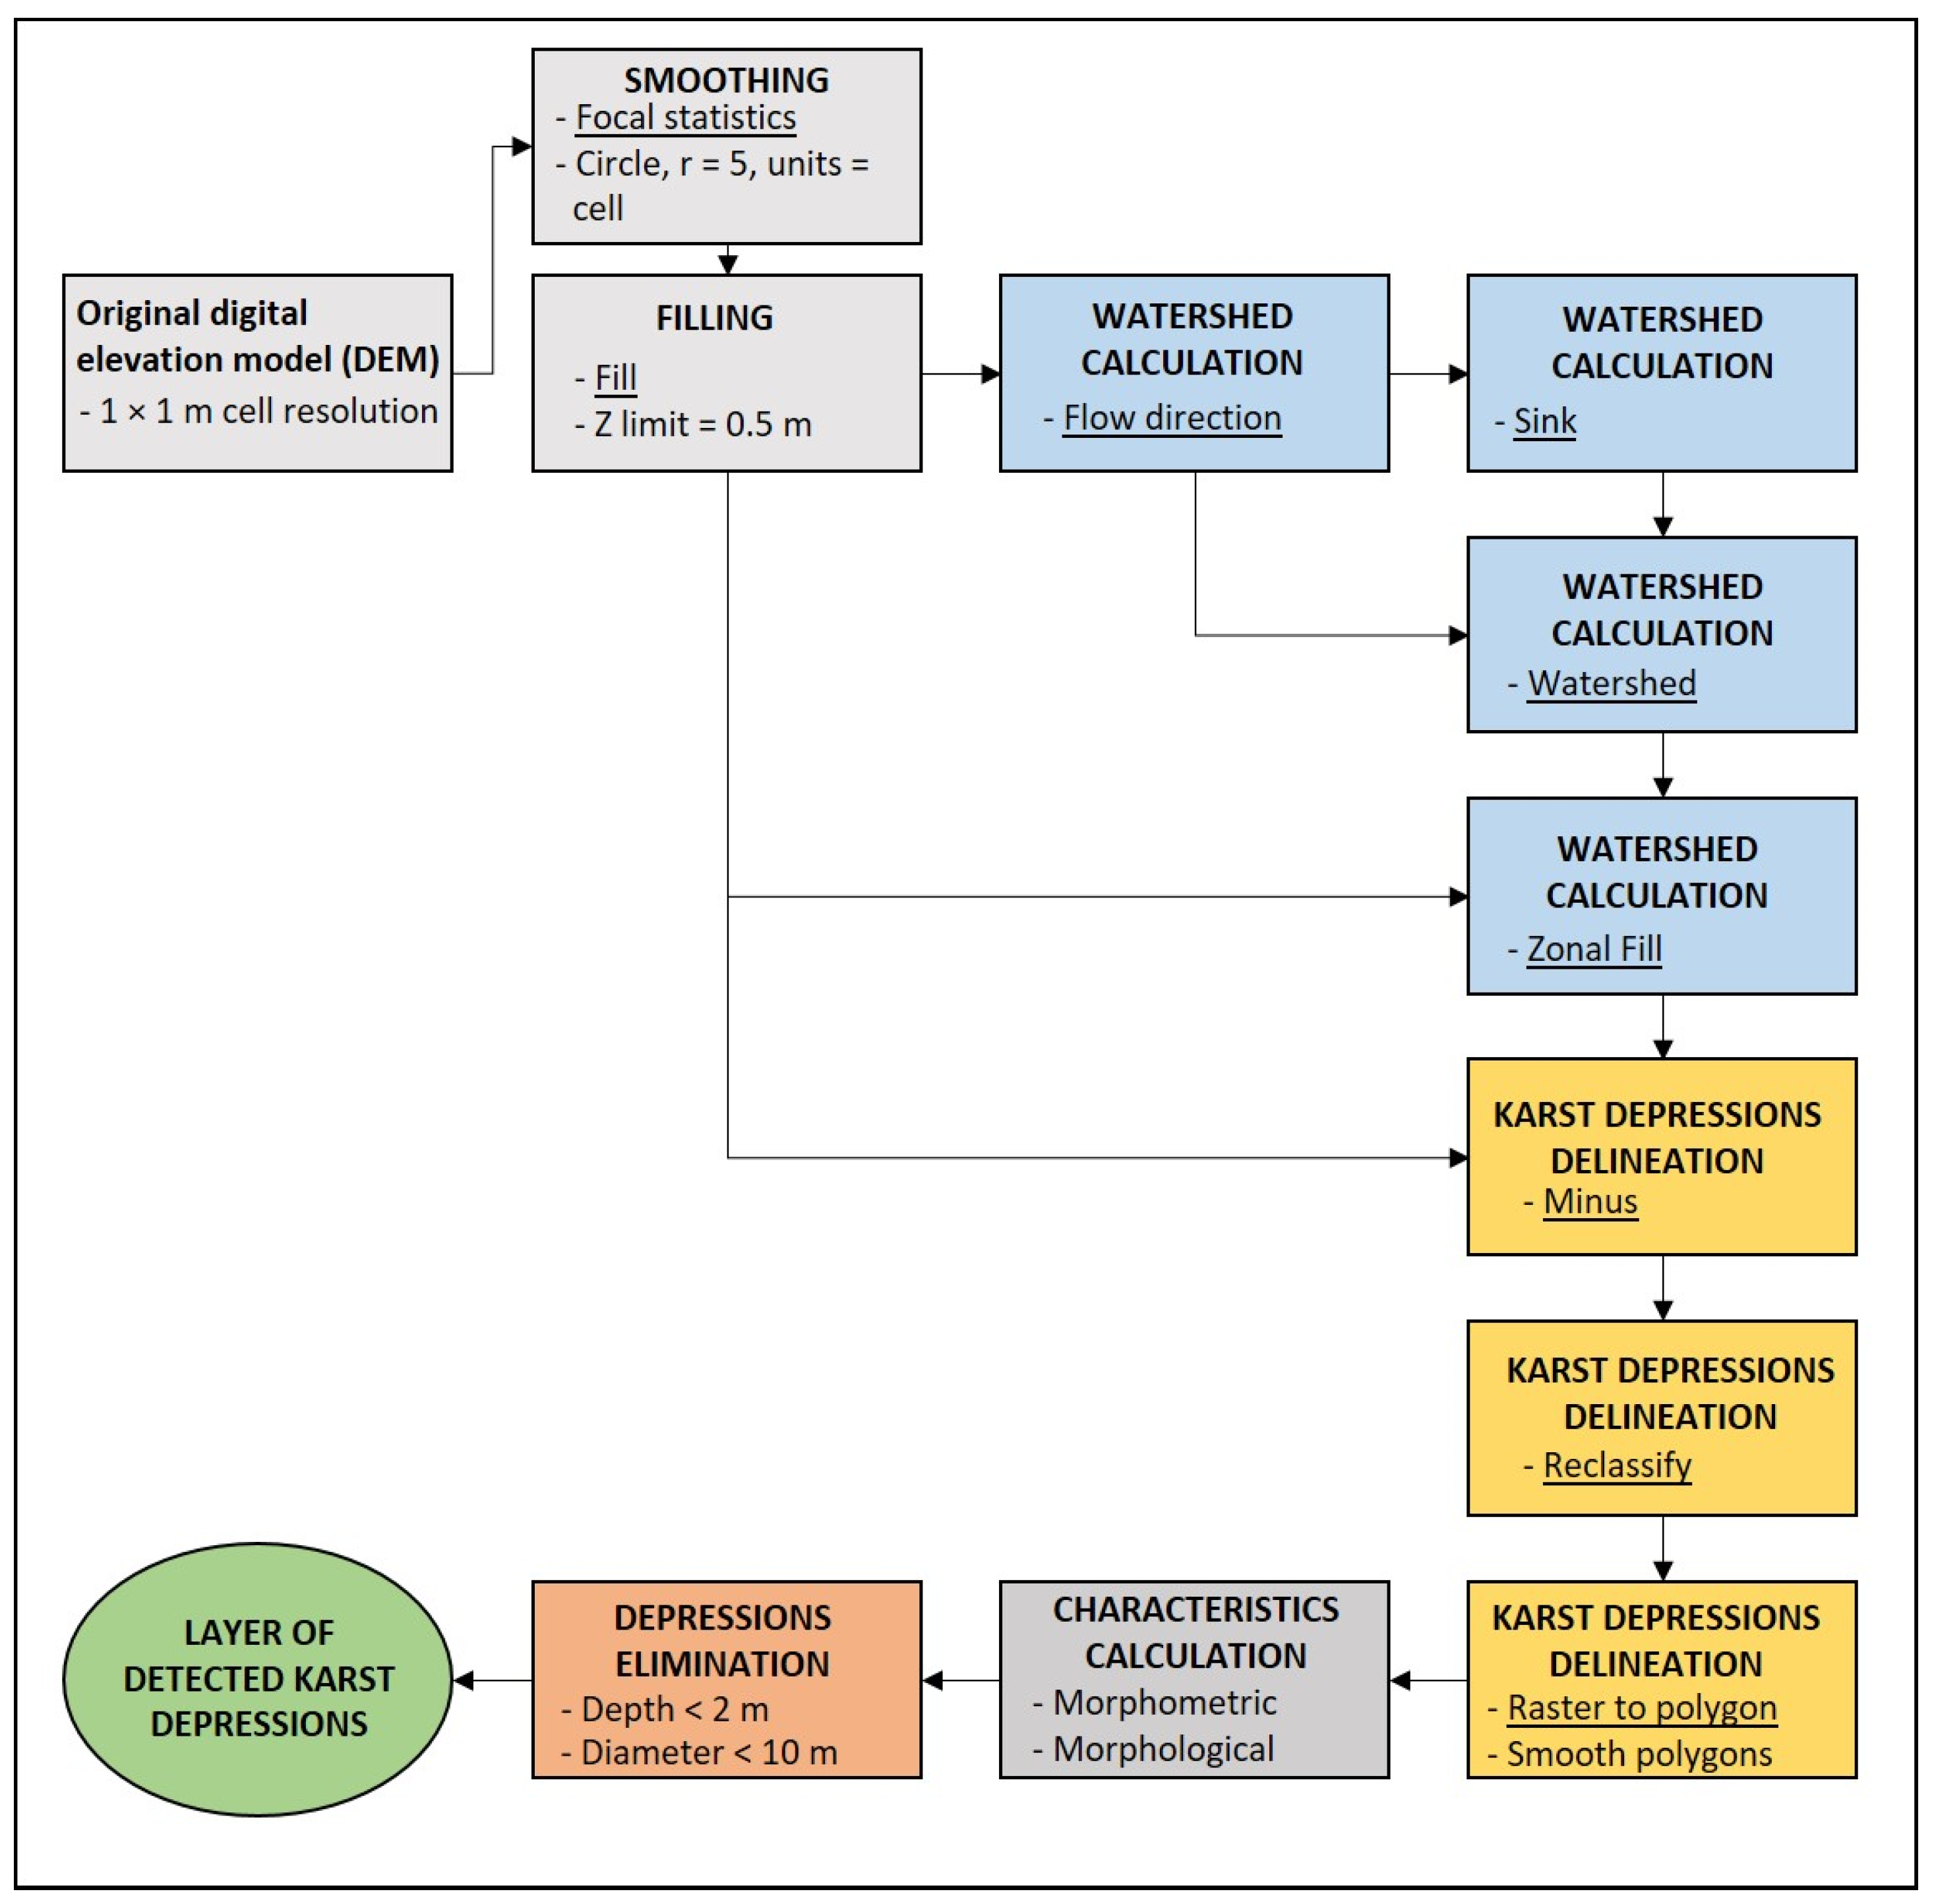
2.2.1. Calculation of Watersheds and Karst Depressions Delineation

Apparent depressions may occur as errors or noise in the input data due to DEM creation and laser scanning over areas with dense vegetation [15,33]. The input raster data layer of the DEM was pre-processed in two ways following Telbisz et al. [15] in order to remove any potential noise in the data. The following tools were used: (1) Focal statistics—smoothing using a 5-cell circular radius filter; (2) Fill—filling the depressions that were shallower than 0.5 m. The Focal statistics tool undertakes a calculation for each cell and ascribes to it an average value of all the surrounding cells in a certain radius. Following Telbisz et al. [15], we also used a 5-cell radius for relief smoothing. The Fill tool detects the cells that are encircled by cells with a higher elevation on all sides and therefore represent a theoretical sink. This kind of depression is filled up to the depth of the z-limit parameter. In our case, the depressions were filled further up to 0.5 m.
The smoothed and filled input DEM was used to simulate the flow direction for individual cells using the D8 method, which calculates the direction of the steepest fall in the local 3 × 3 window (for 8 surrounding cells). Based on the flow direction, we used the Sink tool to identify sinks, which occur when all adjacent cells are higher than the mean or when two adjacent cells merge. Next, we used the Watershed tool to calculate watersheds based on the flow direction and sink raster layers, which resulted in a layer with the entire drainage area flow for a given sink. We delineated the karst depressions by determining the lowest rim cell in the karst depression where water would theoretically overflow from depression, using the Zonal Fill tool based on the watersheds and the input DEM. The Minus tool was used to subtract the input DEM from the Zonal Fill layer. Using the Raster Calculator, we determined the karst depressions as all areas with a subtraction value greater than 0. We vectorized the detected karst depressions and used the Simplify Polygons option during vectorization, which generalizes the vector representation of polygons from a cell representation to a smoothed line. We used the tools available in ArcGIS Pro [65] to perform these calculations.

2.2.2. Morphometric Characteristics and Size Criteria

We calculated the basic morphometric characteristics: area, perimeter, diameter, depth, elongation, length, width, orientation, and slope of all the karst depressions, as well as elevation of the karst depression rims, using tools Zonal Statistics, Calculate Geometry Tool, Slope and Calculate Field Tool. For each characteristic, we present its minimum and maximum values, as well as the median along with the interquartile range (IQR), respectively. Values of orientation were converted to degrees between 0 and 180°, where a value of 0 ° represents east and a value of 180° represents west. We calculated the elongation of the depressions as the ratio between the length and the width of a depression [28]. Depending on the elongation values (Re: ratio between the length and the width), we classified the depressions into 4 groups: circular or sub-circular (Re ≤ 1.21), elliptical (1.21 < Re ≤ 1.65), sub-elliptical (1.65 < Re ≤ 1.8), or elongated (Re > 1.8) [28]. In the last phase, we calculated the slope using the Slope tool, and classified values into 5 classes based on the activity of slope processes following Obu [62] and Stepišnik [56]: 0–3° (plains), 3–10° (gentle slopes), 10–25° (balanced slopes), 25–60° (active slopes), and > 60° (cliffs).
In accordance with previous research, we defined dolines and other karst depressions as having at least 2 m depth and 10 m diameter [17,28,33,62]. We excluded all depressions that did not fit these criteria.

2.2.3. Comparison of Automatic-Detection Method with Visual Recognition

We created a 500 × 500 m grid, which comprised a total of 372 polygons including at least 1 detected karst depression, and randomly selected 10% (n = 37) to compare results of the automatic-detection method with visual recognition. We created shaded relief from a LiDAR-based DEM for visualization of a surface and marked with a single point each karst depression we visually recognized from shaded relief (example shown in Figure S1). Then, we overlapped manually marked karst depressions recognized visually with the layer of automatically detected karst depressions (including those eliminated according to size criteria) and determined (1) the proportion of manually marked karst depressions, but that were missed by the automatic method (i.e., false negatives), and (2) the proportion of karst depressions automatically detected but not manually marked (i.e., false positives).
Karst depressions are of various sizes and shapes and, despite occurring mostly as independent relief units, sometimes two dolines become connected, which is called a compound doline. When a series of dolines is connected, it is called a series of dolines [19]. When a compound doline or a series of dolines were automatically detected as one feature, we manually marked more than one point and counted each point as a successfully recognized karst depression.

2.3. Felid Space Use and Lynx Kill-Site Distribution in Respect to Karst Depressions

We used GPS-telemetry data (n = 2143 GPS fixes) from 2 lynx (both males) and 2 wildcats (1 male, 1 female) inhabiting the study area to understand the influence of karst depressions on their space use. We used standard protocols for capturing, collaring, and tracking of lynx and wildcats [41,66]. Wildcats were captured within the study area, while lynx were released in Dinaric Mountains as part of a reinforcement project [67]. We used GPS-GSM collars (Vectronic Aerospace GmbH, Germany) for lynx and remote-download GPS collars (e-obs GmbH, Germany) for wildcats. Lynx collars were scheduled to obtain 2 fixes/night, and wildcat collars 3 fixes/night, both with an interval of 4 h between fixes
We investigated the selection of karst depressions at the 3rd order of selection [68] under a use–availability approach, by comparing GPS locations within the 95% minimum convex polygons of tracked animals (use) with an equal number of random points sampled within each home range (availability). As the home ranges for both lynx included areas outside the study area, we considered only the locations within the study area where data of distribution of karst depressions was available. Because felids are known to regularly use local gravel forestry roads [69], we also considered the effects of forestry roads on lynx and wildcat movement. We estimated the Euclidean distance from each used and random point to the nearest karst depressions and forestry road, and then used generalized linear models (GLMs) to understand the patterns of selection of these features, for each species separately. Prior to this step, we checked for a correlation between the two covariates using Spearman rank correlation. Since the two variables showed low correlation (0.22), we kept both covariates in the model. Additionally, we ran two species-specific null models and compared the Akaike’s information criteria (AIC) with the respective full model [70]. We used k-fold cross-validation to assess model fit, using the same approach as presented in Hočevar et al. [52]. We also tested if lynx or wildcats select for certain karst depressions in respect to their morphometric characteristics, namely the area and depth. We used the Wilcoxon rank sum test with continuity correction to compare the sizes of karst depressions used by lynx and wildcats with those available within their home-ranges.
Because lynx in our study area are known to often kill their prey near or inside dolines and other karst depressions [44], we also estimated the proportion of kill sites located inside or in the vicinity of karst depressions, and compared it with randomly distributed points within the home range of each animal. Because of a smaller sample size, and due to potential underrepresentation of the available resources, we generated random points 10 times the number of kill sites [71]. To test the selection of karst depressions for lynx kill sites, we ran a GLM for this dataset using the same procedure as described above. Lynx kill sites were identified with the use of GPS-locations cluster analysis [66] and then confirmed in the field, when we also noted whether the kill site was located inside or on the edge of a karst depression. This also enabled us to compare accordance of identifying karst depressions based on automatic method described above (see Section 2.2) with field-checking during the kill site location surveys. We calculated the proportion of GPS locations of kill sites that would be considered located in or near karst depression identified with automatic method in respect to the field-checked kill sites that were found in or at the edge of a karst depression. To account for the kills located at the edge of a karst depression, as well as for potential error of hand-held GPS [72] when noting position of the kill site in the field, we created a buffer of 15 m around each karst depression.
All analyses were conducted using R version 4.1.0 (R Core Team 2021). GLMs and respective k-fold cross validation were developed using lme4 v1.1–21 R-package [73].

3. Results

3.1. Detection of Karst Depressions and Their Morphometric Characteristics

We identified 9711 karst depressions within the study area (area size: 137.0 km2) with an average density of 70.9 karst depressions/km2. In Ravnik, we detected a total of 5720 (58.9%) karst depressions, with average density of 110.0 karst depressions/km2 and in Menišija 3911 (41.1%) with average density 46.0 karst depressions/km2 (Figure 3). Most karst depressions were located in the western and north-western part of study area, which is consistent with the bedrock types. The highest number (n = 8016) and average density of karst depressions (117.0 depressions/km2) was recorded in the limestone area (68.5 km2, 50.0% of the study area), compared to parts with predominate dolostones (63.4 km2, 46.2% of the study area) where number (n = 1686) and average density (26.6 depressions/km2) of karst depressions was considerably lower. Only nine karst depressions were detected in parts with alluvial deposits (3.7 km2, 2.7% of the study area) and no karst depressions were detected in the areas with boxite (1.4 km2, 1.1% of the study area).
The measurements of morphometric characteristics obtained from automatically detected karst depressions are presented in Table 1. The median value ± IQR for the area of the karst depressions was 765.6 ± 713.6 m2 and total area of all detected karst depressions was estimated to be 10.7 km2, which corresponds to 7.8% of the entire study area. We observed that the depressions in Ravnik are slightly larger than in Menišija (Table 1). Most of the karst depressions had similar morphometric characteristics, however, some of these features displayed very large areas and depths (see maximum values in Table 1). The average orientation of depressions was 98.9°, which coincides with the bedrock inclination (northwest to southeast). Most depressions (59%, n = 5733) had an axis orientated between 90° and 180° (northwest), followed by 0° to 90° orientation (northwest; 41%, n = 3976), while depressions with other orientations were almost non-existent (n = 2). The most common shapes were circular or sub-circular depressions (48.5%, n = 4715), followed by elliptical depressions (47.3%, n = 4598), while sub-elliptical and elongated ones were rare (2.1%, n = 199 each) (Figure S2). The majority (73.4%) of the detected karst depressions had balanced slopes, followed by gentle slopes (13.4%) and active slopes (11.9%), while plains and cliffs were rare (less than 1.5%; Figure S3).

3.2. Comparison of Automatic-Detection Method with Visual Recognition

Within the 37 polygons randomly selected to compare our model with visually recognized karst depressions, we marked 2186 karst depressions based on shaded relief, while the automatic method detected 1988 karst depressions. A total of 1826 (83.5%) manually marked karst depressions matched with automatically detected karst depressions. The model identified 162 (8.2%) of karst depressions that were not manually detected (false positives), while 360 (16.5%) of the manually marked karst depressions were not automatically detected (false negatives) (example shown in Figure S1).

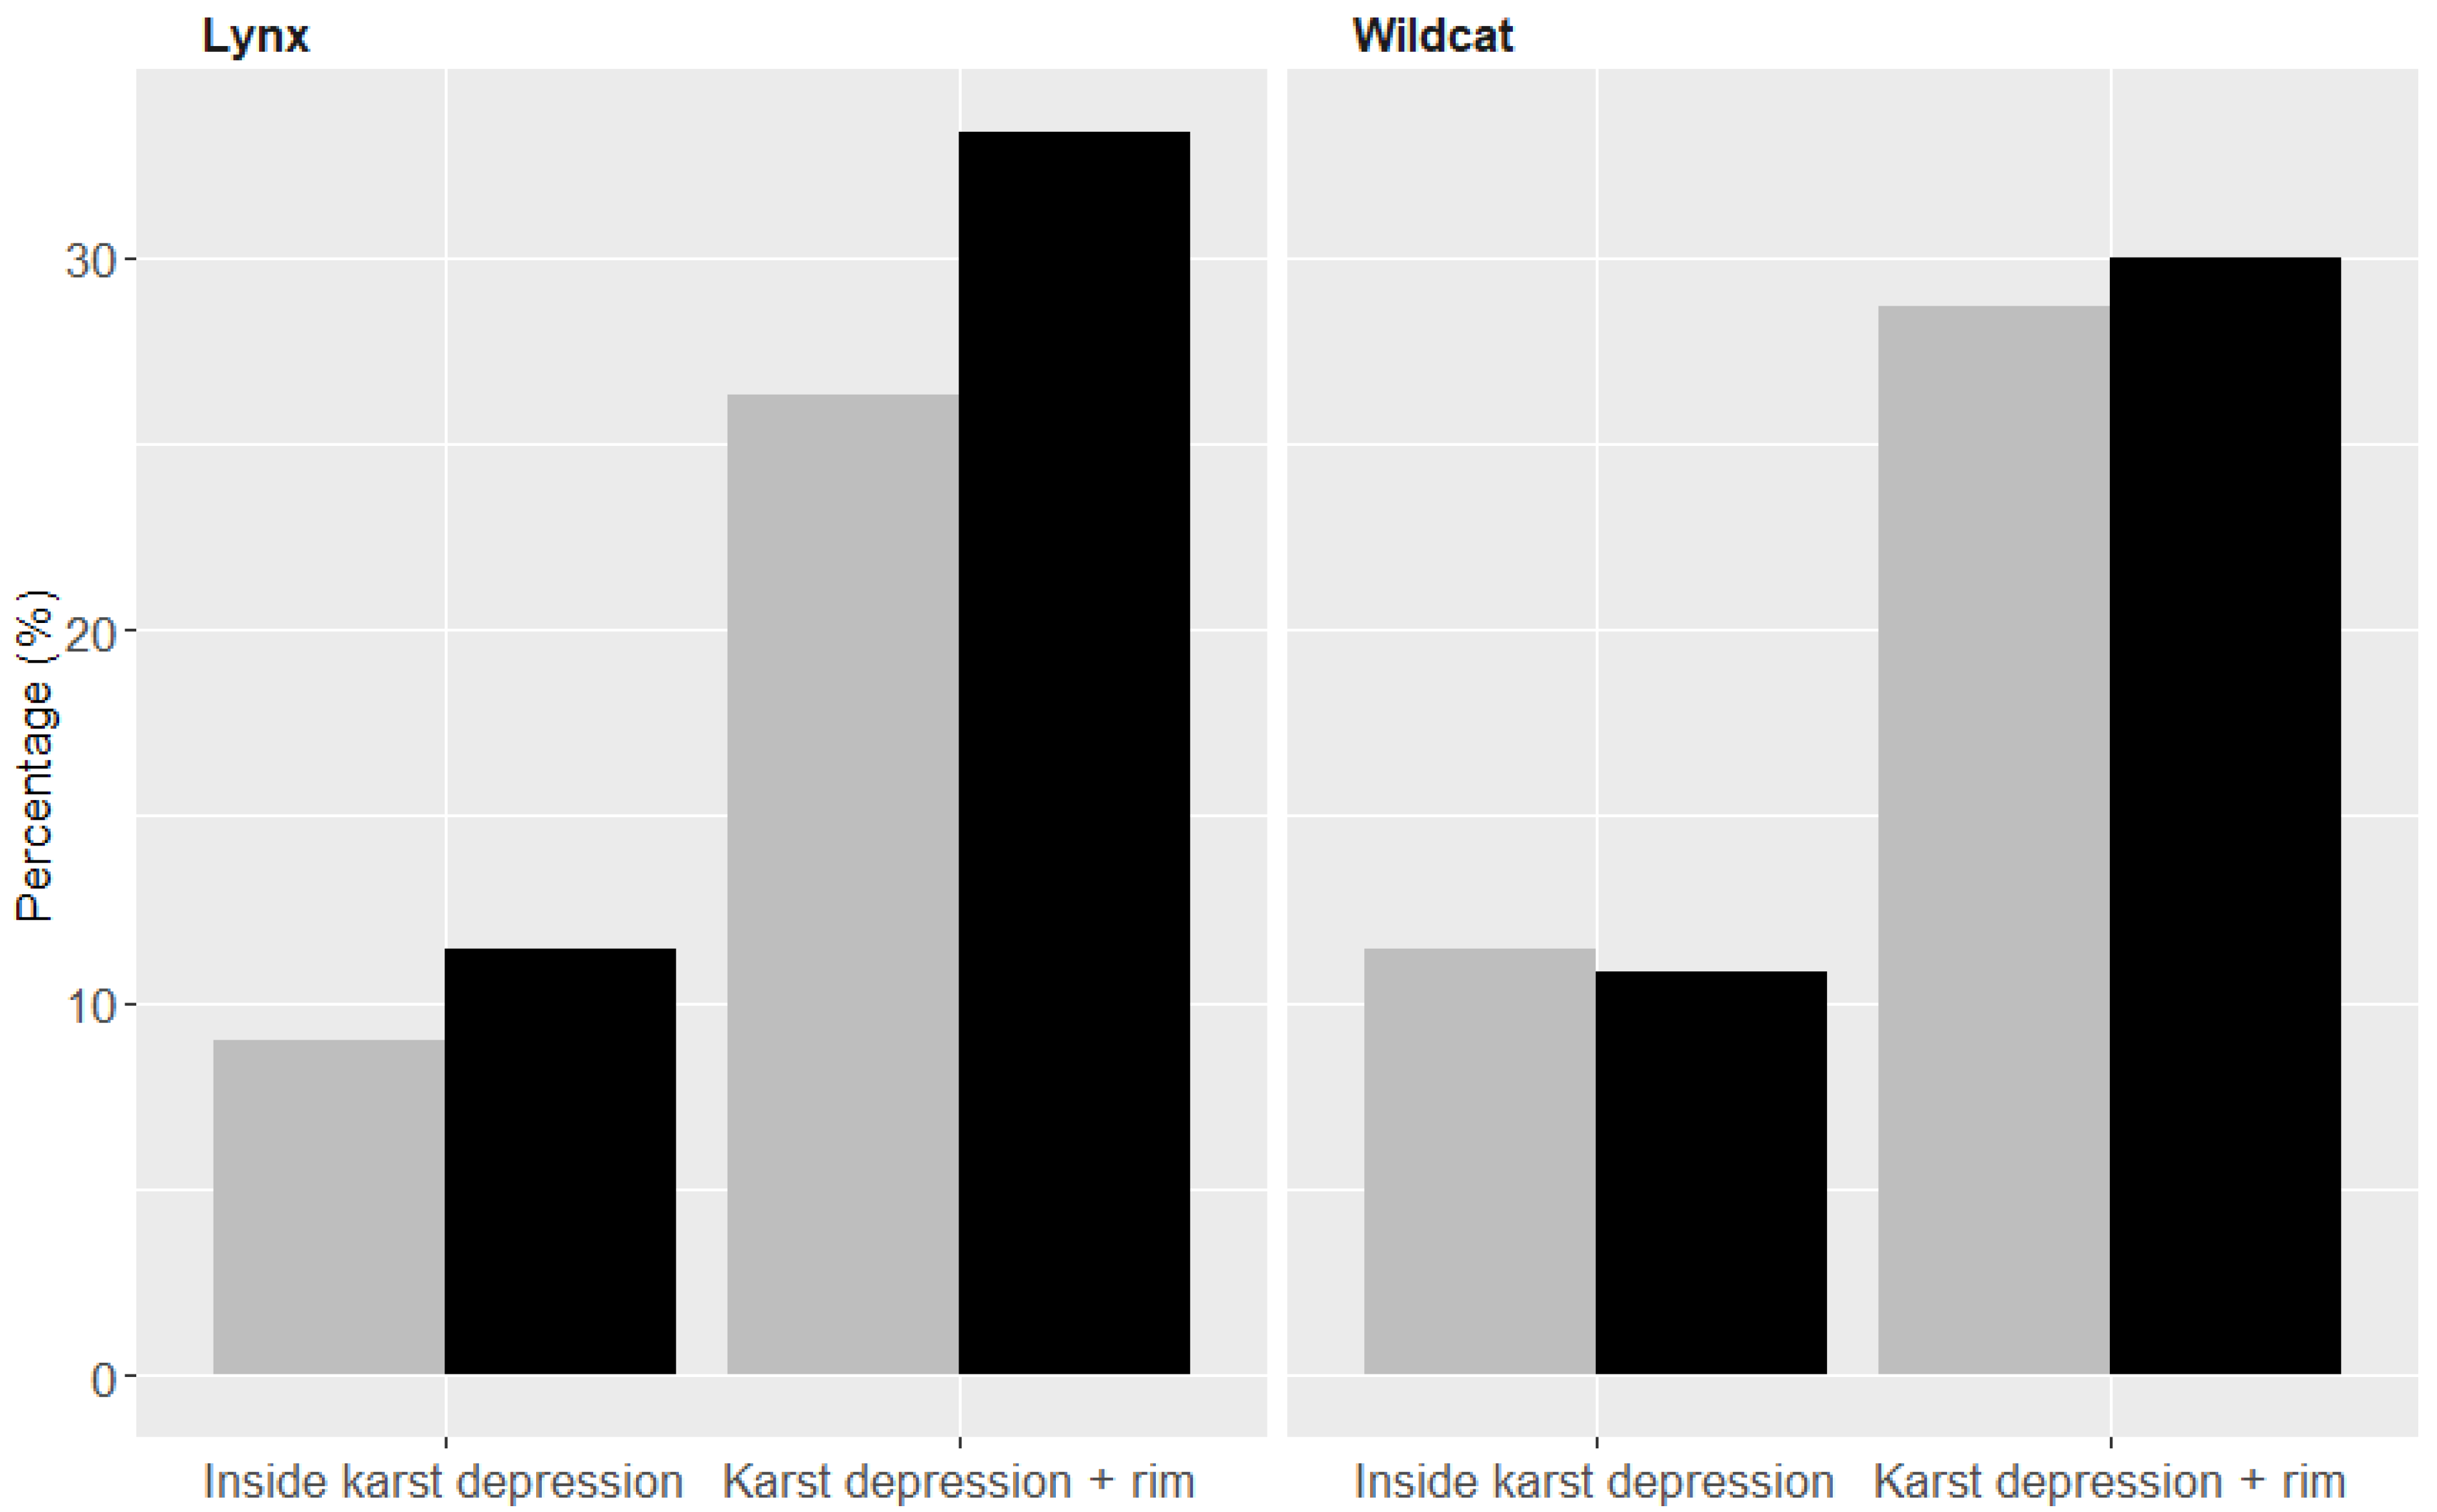
3.3. Felid Space Use and Lynx Kill-Site Distribution

We used lynx (n = 1161) and wildcat (n = 982) GPS fixes to assess felid selection for karst depressions and forestry roads within their home ranges. When compared to random points within the tracked animals’ home ranges, we observed a selection for karst depressions by the lynx, especially when rims of karst depressions are also considered, while for the wildcats only slight selection for karst depressions with rims was observed (Figure 4, Table 2). In respect to distances to the closest feature, both species selected vicinity of karst depressions, while vicinity of roads was selected by lynx but avoided by wildcats (Table 2 and Table S1). Among the karst depressions available within their home ranges, both lynx and wildcats selected those with larger areas (medianarea_lynx = 852.7 ± 799.2, Wlynx = 3,246,031.0, Plynx = 0.0002; medianarea_wildcat = 1315.1 ± 1584.8, Wwildcat = 139,528.0, Pwildcat < 0.0001) and greater depth (mediandepth_lynx = 3.9 ± 2.8, Wlynx = 3,254,652, Plynx = 0.0001; mediandepth_wildcat = 4.9 ± 3.8, Wwildcat = 138,131.0, Pwildcat < 0.0001), when compared to karst depressions available within their respective home ranges (medianarea_avail_lynx = 746.9 ± 679.1, mediandepth_avail_lynx = 3.5 ± 2.2; medianarea_avail_wildcat = 902.3 ± 947.0, mediandepth_avail_wildcat = 3.9 ± 3.1).
We found 40 lynx kill sites in the study area, among which 58% (n = 23) were noted during the field survey as being located within or nearby a karst depression. When compared to automatically detected karst depressions, 35% (n = 14) of kills were located inside or on the rim of a karst depression (mediandist = 29.1 ± 72.1). In respect to availability, this is higher compared to the proportion of random points located inside or on the rim of the automatically detected karst depressions (27%, n = 111), although model coefficients do not indicate significant selection of these features (Table 2). We did not observe selection nor avoidance towards roads (Table 2).

4. Discussion

4.1. Remote Large-Scale Detection of Geomorphic Features

Use of an automatic method to analyze remote sensing high-resolution topography data (LiDAR) enabled us to efficiently detect and measure a very large number (almost 10,000) of studied relief features (karst depressions) in a rugged karstic landscape of the Dinaric Mountains. This highlights the potential of such methodology for large-scale ecological research, which we applied to study habitat selection by wild felids. Such task would be nearly impossible or would require enormous effort, if done using traditional methods to detect landscape features and obtain their morphometric and morphological characteristics in the field or visually using topography maps with much lower resolution.
Nevertheless, the method also had some drawbacks. When compared to manually marked karst depressions recognized visually from shaded relief, 16.5% of the karst depressions were not detected by the automatic method. Comparison between the automatically generated layer and visually recognized karst depressions from the shaded relief suggests that discrepancy is largest on sloped surfaces. This causes larger areas of some depressions to be missed (i.e., not defined as part of depressions), because the rim of a karst depression is assigned to the entire depression at the same elevation of the lowest rim cell where theoretical water would overflow from the karst depression. This is particularly noticeable in karst depressions with a pronounced rim, such as collapse dolines. This problem has been recognized before and is also connected to a lack of clear consensus in karstological and geomorphological literature on what represents the rim of a karst depression, particularly when located on a slope [74]. Until this issue is resolved, it may be difficult to better approximate the state of nature using existing methods for detecting and delineating karst depressions. Nevertheless, the method has shown its usefulness and the data obtained for density of karst depressions and their morphometric and morphological characteristics are comparable to previously reported estimates [25]. The medians of the diameter and depth of karst depressions in the study area are slightly lower than the Slovenian average (42 and 9 m, respectively; [25]). The average elevation where karst depressions occur is 592.7 m, which is consistent with the average elevation of Ravnik and the majority of the karst depressions occur in this area [25] The orientation of the karst depressions, as expected, coincides with the bedrock inclination and has northwest–southeast direction typical for Dinaric mountains.

4.2. Selection of Karst Depressions by the Wild Felids

We used the layer of karst depressions together with their morphometric and morphological characteristics to perform the first large-scale analysis of felid habitat selection in respect to these relief features. Felids are known to be attracted to rugged terrain, rocky areas, and conspicuous relief features, for example for resting, scent-marking, and hunting [26,44,46,49,51,52], but lack of detailed GIS layers containing information on such features over larger scales had so far often prevented more advanced studies, because the amount of data was often limited by logistic and economic constraints to conduct fieldwork. Our study demonstrates the potential of combining GPS-telemetry data and methods involving automatic detection of relief features for wildlife research. This approach enabled us to confirm attraction of wildcat and, especially, lynx to karst depressions. While GPS-error inherent to GPS-telemetry data limits our ability to discern which parts of the depressions are most attractive to felids, our results suggest that rims of karst depressions might be especially interesting. This is not unexpected given that lynx and other felids are known to use elevated vantage points that provide them with a good overview of the surroundings to easily detect incoming prey or potential danger [52]. Cave entrances are often found in karst depressions [75], which are used by felids for foraging and scent-marking [26].
In the interpretation of results, we need to consider that our study area is characterized by a very high density of karst depressions (on average over 70 depressions/km2), which could reduce their attractiveness to felids in respect to availability. In the future, it would be therefore interesting to extend research also to areas with lower availability of these relief features to test for potential functional response (i.e., variation in habitat selection as a function of habitat availability; [76]) in selection of karst depressions by both felids. Our results also need to be treated with caution, since telemetry data was obtained from only four individuals. Felids like lynx are known for their relatively stereotypical behavior, universal habitat use, and homogeneous responses between sexes, especially when it comes to habitat selection at finer scales [77], which was also the focus of this study. Although this allows for certain generalizing, we recommend further studies using larger number of tracked individuals.
Incorporation of data on morphometric characteristics of karst depressions suggests that felids might be especially attracted to larger features, which could again be connected with better vantage points and presence of caves. Furthermore, large collapse dolines with vertical cliffs can be very conspicuous in the landscape, which could make them attractive as scent-marking sites [49] or hunting of certain prey, like chamois (Rupicapra rupicapra) [26]. A large proportion of lynx prey remains found at the bottom or near the rim of karst depressions (58% of all kills) suggest that these landscape features could have an important role in hunting behavior of this predator. This confirms previous anecdotal observations [44], which suggested that dolines with rocky terrain can make hunting more successful because of easier stalking for lynx and escape impediments to ungulates. In contrast to previous research, use of automatic detection of karst depressions across the entire study area enabled us to generate data on availability of karst depressions in the landscape, which indicates that lynx may be actively selecting karst depressions for hunting. However, the relatively small sample of field-checked kill sites at present limits the reliability of our conclusions (95% confidence interval of model coefficients slightly overlapped with zero) and more data on distribution of predator kill sites is needed to better understand role of karst depressions in foraging behavior of lynx and other large carnivores.
These findings improve our understanding of wildcat and lynx microhabitat characteristics and in the case of lynx also hunting behavior. They can contribute to the improvement of management and conservation of both protected species, for example, for implementation of monitoring. Our results indicate that rims of karst depressions might be especially suitable for deploying camera-traps for estimating population densities or box-traps for capturing and collaring the animals [67]. Overall, our results provide further evidence of the importance to protect geomorphological features (geodiversity) for biodiversity conservation [29,30,32,51,78,79].

5. Conclusions

We showed that method of karst depressions detection based on the filled-DEM approach is suitable for detection, general spatial analysis, and calculation of morphometric and morphological properties of depressions. The process is partially automated and allows easy and inexpensive application to other areas, including over large scales. The method thus provides several advantages over manual mapping, especially when time investment and field costs are considered, as well as when study areas are difficult to access and forested. However, the method also has some drawbacks, such as difficulties in assigning the rim of the karst depression on sloped surfaces and consequent failure to detect part of depressions in such areas. Nevertheless, we believe the method has considerable potential for application in large-scale analyses in many fields besides geomorphology and karstology, including geology, botany, zoology, tourism, spatial planning, nature conservation, creation of new geoparks, and development of national or local action plans for the protection of geodiversity. Our study case on habitat selection of wild felids in karstic landscapes demonstrates such potential application. Results suggest that both, lynx and wildcats, are attracted to karst depressions, especially those of larger dimensions, and that lynx often capture their prey inside such depressions or in their vicinity. This suggests that relief features could play an important role in the ecology of wild felids and warrants further research.

Supplementary Materials

The following supporting information can be downloaded at: https://www.mdpi.com/article/10.3390/rs14030656/s1, Figure S1: Comparison of automatic-detection method with visual recognition based on shaded relief. Eliminated karst depressions did not fit to size criteria, i.e., depth was <2 m and diameter < 10 m; Figure S2: Shape of depressions according to elongation values: circular or sub-circular (A), elliptical (B), sub-elliptical (C), elongated (D); Figure S3: Map of geomorphological characteristics of karst depressions based on slope; Table S1: Range of values [Min-Max] and associated median [median ± IQR] for each covariate per species, for both used and available points.

Author Contributions

Conceptualization, Š.Č., T.O. and M.K.; methodology, Š.Č. and T.O.; validation, Š.Č., T.O., R.P., R.Č., M.B.V. and M.K.; formal analysis, Š.Č. and T.O.; investigation, Š.Č., T.O., R.P., R.Č. and M.K.; data curation, Š.Č., T.O., and M.K.; writing—original draft preparation, Š.Č., T.O. and M.K.; writing—review and editing, Š.Č., T.O., R.P., R.Č., M.B.V. and M.K.; visualization, Š.Č. and T.O.; supervision, M.B.V. and M.K.; project administration, R.Č., M.B.V. and M.K; funding acquisition, T.O., R.Č., M.B.V. and M.K. All authors have read and agreed to the published version of the manuscript.

Funding

This study was financed by the Slovenian Research Agency (project InterMuc N1-0163 and project Connectivity concept in karst J6-2592) and the European Commission (project LIFE Lynx LIFE16 NAT/SL/000634). Š.Č. and M.B.V. were supported by the Slovenian Research Agency (program Geography of Slovenia, grants no. P6-0101 and MR-54767). T.O. was supported by the Portu-guese Foundation for Science and Technology (FCT, grant no. SFRH/BD/144110/2019). M.K. was additionally supported by the Slovenian Research Agency (grant no. P4-0059).

Institutional Review Board Statement

All animal capture and handling followed the national and E.U. legislation and were permitted by the Slovenian Environmental Agency (permit no. 35601-76-2020-6).

Informed Consent Statement

Not applicable.

Data Availability Statement

Data available on request due to restrictions (nature conservation).

Acknowledgments

We would like to thank Matic Centa, Urša Fležar, Lan Hočevar, Pavel Kvapil, and Janez Tarman, as well as members of Association for the Biological Diversity Conservation (ACDB, Romania) and Technical University in Zvolen (Slovakia) for their help with the fieldwork.

Conflicts of Interest

The authors declare no conflict of interest.

References

  1. Tarolli, P.; Mudd, S.M. Introduction to Remote Sensing of Geomorphology. Dev. Earth Surf. Processes 2020, 23, xiii–xv. [Google Scholar] [CrossRef]
  2. Jensen, J.R. Remote Sensing of the Environment: An Earth Resource Perspective; Prentice-Hall International: Upper Saddle River, NJ, USA, 2000. [Google Scholar]
  3. Breg Valjavec, M.; Ciglič, R.; Oštir, K.; Ribeiro, D. Modelling habitats in karst landscape by integrating remote sensing and topography data. Open Geosci. 2018, 29, 137–156. [Google Scholar] [CrossRef]
  4. Weiss, A.D. Topographic position and landforms analysis; Poster Presentation. In Proceedings of the ESRI Users Conference, San Diego, CA, USA, 9–13 July 2001. [Google Scholar]
  5. Yokoyama, R.; Shirasawa, M.; Pike, R.J. Visualizing topography by openness: A new application of image processing to digital elevation models. Photogramm. Eng. Remote Sens. 2002, 68, 251–266. [Google Scholar]
  6. Zakšek, K.; Oštir, K.; Kokalj, Ž. Sky-View Factor as a Relief Visualization Technique. Remote Sens. 2011, 3, 398–415. [Google Scholar] [CrossRef] [Green Version]
  7. Drăguţ, L.; Eisank, C. Automated Object-Based Classification of Topography from SRTM Data. Geomorphology 2012, 141–142, 21–33. [Google Scholar] [CrossRef] [Green Version]
  8. Jasiewicz, J.; Stepinski, T.F. Geomorphons—A pattern recognition approach to classification and mapping of landforms. Geomorphology 2013, 182, 147–156. [Google Scholar] [CrossRef]
  9. Zhou, X.; Li, W.; Arundel, S.T. A spatio-contextual probabilistic model for extracting linear features in hilly terrains from high-resolution DEM data. Int. J. Geogr. Inf. Sci. 2018, 33, 666–686. [Google Scholar] [CrossRef]
  10. Syzdykbayev, M.; Karimi, B.; Karimi, H.A. A Method for Extracting Some Key Terrain Features from Shaded Relief of Digital Terrain Models. Remote Sens. 2020, 12, 2809. [Google Scholar] [CrossRef]
  11. Fernandez Diaz, J.C.; Carter, W.E.; Shrestha, R.L.; Glennie, C.L. Lidar Remote Sensing. In Handbook of Satellite Applications; Pelton, J.N., Madry, S., Camacho-Lara, S., Eds.; Springer: New York, NY, USA, 2013; pp. 757–808. [Google Scholar] [CrossRef]
  12. Höfle, B.; Rutzinger, M. Topographic Airborne Lidar in Geomorphology: A Technological Perspective. Z. Geomorphol. Suppl. Issues 2011, 55, 1–29. [Google Scholar] [CrossRef]
  13. Davis, B.A.; Asner, P.G. Advances in animal ecology from 3d-LiDAR ecosystem mapping. Trends Ecol. Evol. 2014, 29, 681–691. [Google Scholar] [CrossRef]
  14. Triglav Čekada, M. Možnost uporabe zračnega laserskega skeniranja (LIDAR) za geomorfološke študije. Geogr. Vestn. 2011, 83, 81–93. [Google Scholar]
  15. Telbisz, T.; Látos, T.; Deák, M.; Székely, B.; Koma, Z.; Standovár, T. The advantage of lidar digital terrain models in doline morphometry compared to topographic map based datasets—Aggtelek karst (Hungary) as an example. Acta Carsologica 2016, 45, 5–18. [Google Scholar] [CrossRef]
  16. Day, M.; Chenoweth, S. Surface Roughness of Karst Landscapes. In Treatise on Geomorphology; Shroder, F.J., Ed.; Academic Press: London, UK, 2013; pp. 157–163. [Google Scholar] [CrossRef]
  17. Gams, I. Kras v Sloveniji v Prostoru in Času, 2nd ed.; Založba ZRC: Ljubljana, Slovenija, 2004. [Google Scholar]
  18. Goldscheider, N.; Chen, Z.; Auler, A.S.; Bakalowicz, M.; Broda, S.; Drew, D.; Hartmann, J.; Jiang, G.; Moosdorf, N.; Stevanovic, Z.; et al. Global Distribution of Carbonate Rocks and Karst Water Resources. Hydrogeol. J. 2020, 28, 1661–1677. [Google Scholar] [CrossRef] [Green Version]
  19. Stepišnik, U. Fizična Geografija Krasa, 2nd ed.; Znanstvena založba Filozofske fakultete Univerze v Ljubljani: Ljubljana, Slovenia, 2020. [Google Scholar]
  20. Lipar, M.; Szymczak, P.; White, S.Q.; Webb, J.A. Solution Pipes and Focused Vertical Water Flow: Geomorphology and Modelling. Earth-Sci. Rev. 2021, 218, 103635. [Google Scholar] [CrossRef]
  21. Ford, D.C.; Williams, P.W. Karst Hydrogeology and Geomorphology, 1st ed.; John Wiley & Sons: Chichester, UK, 2008. [Google Scholar]
  22. Grlj, A. Omejevanje kraških kotanj z analizo polrezov. Dela 2020, 53, 5–22. [Google Scholar] [CrossRef]
  23. Doctor, D.; Young, J. An Evaluation of Automated GIS Tools for Delineating Karst Sinkholes and Closed Depressions from 1-Meter Lidar-Derived Digital Elevation Data. In Proceedings of the Thirteenth Multidisciplinary Conference on Sinkholes and the Engineering and Environmental Impacts of Karst, Carlsbad, NM, USA, 6–10 May 2013; pp. 449–458. [Google Scholar] [CrossRef] [Green Version]
  24. Veress, M. Karst Types and Their Karstification. J. Earth Sci. 2020, 31, 621–634. [Google Scholar] [CrossRef]
  25. Mihevc, A.; Mihevc, R. Morphological Characteristics and Distribution of Dolines in Slovenia, a Study of a Lidar-Based Doline Map of Slovenia. Acta Carsologica 2021, 50, 11–36. [Google Scholar] [CrossRef]
  26. Krofel, M. Winter observations of Eurasian Lynx (Lynx lynx) inspecting karst caves and dolines in the Northern Dinaric Mountains, Slovenia. Nat. Slov. Rev. Za Teren. Biol. 2010, 12, 65–67. [Google Scholar]
  27. Grlj, A.; Grigillo, D. Uporaba digitalnega modela višin in satelitskega posnetka RapidEye za zaznavanje kraških kotanj in brezstropih jam Podgorskega krasa. Dela 2014, 42, 129–147. [Google Scholar] [CrossRef]
  28. Kobal, M.; Bertoncelj, I.; Pirotti, F.; Dakskobler, I.; Kutnar, L. Using Lidar Data to Analyse Sinkhole Characteristics Relevant for Understory Vegetation under Forest Cover—Case Study of a High Karst Area in the Dinaric Mountains. PLoS ONE 2015, 10, e0122070. [Google Scholar] [CrossRef] [Green Version]
  29. Luo, Z.; Tang, S.; Jiang, Z.; Chen, J.; Fang, H.; Li, C. Conservation of Terrestrial Vertebrates in a Global Hotspot of Karst Area in Southwestern China. Sci. Rep. 2016, 6, 25717. [Google Scholar] [CrossRef] [PubMed] [Green Version]
  30. Breg Valjavec, M.; Zorn, M.; Čarni, A. Human-induced land degradation and biodiversity of Classical Karst landscape: On the example of enclosed karst depressions (dolines). Land Degrad. Dev. 2018, 29, 3823–3835. [Google Scholar] [CrossRef] [Green Version]
  31. Verbovšek, T.; Gabor, L. Morphometric properties of dolines in Matarsko podolje, SW Slovenia. Environ. Earth Sci. 2019, 78, 396. [Google Scholar] [CrossRef]
  32. Bátori, Z.; Vojtkó, A.; Keppel, G.; Tölgyesi, C.; Čarni, A.; Zorn, M.; Farkas, T.; Erdős, L.; Kiss, P.J.; Módra, G.; et al. Anthropogenic disturbances alter the conservation value of karst dolines. Biodivers. Conserv. 2020, 29, 503–525. [Google Scholar] [CrossRef] [Green Version]
  33. Obu, J.; Podobnikar, T. Algorithm for karst depression recognition using digital terrain models. Geod. Vestn. 2013, 57, 260–270. [Google Scholar] [CrossRef]
  34. Bauer, C. Analysis of dolines using multiple methods applied to airborne laser scanning data. Geomorphology 2015, 250, 78–88. [Google Scholar] [CrossRef]
  35. Wu, Q.; Deng, C.; Chen, Z. Automated delineation of karst sinkholes from LiDAR-derived digital elevation models. Geomorphology 2016, 266, 1–10. [Google Scholar] [CrossRef]
  36. Hofierka, J.; Gallay, M.; Bandura, P.; Šašak, J. Identification of Karst Sinkholes in a Forested Karst Landscape Using Airborne Laser Scanning Data and Water Flow Analysis. Geomorphology 2018, 308, 265–277. [Google Scholar] [CrossRef]
  37. Kim, Y.J.; Nam, B.H.; Youn, H. Sinkhole Detection and Characterization Using Lidar-Derived Dem with Logistic Regression. Remote Sens. 2019, 11, 1592. [Google Scholar] [CrossRef] [Green Version]
  38. Sappington, J.M.; Longshore, K.M.; Thompson, D.B. Quantifying Landscape Ruggedness for Animal Habitat Analysis: A Case Study Using Bighorn Sheep in the Mojave Desert. J. Wildl. Manag. 2007, 71, 1419–1426. [Google Scholar] [CrossRef]
  39. Bouchet, P.J.; Meeuwig, J.J.; Salgado Kent, C.P.; Letessier, T.B.; Jenner, C.K. Topographic Determinants of Mobile Vertebrate Predator Hotspots: Current Knowledge and Future Directions. Biol. Rev. 2014, 90, 699–728. [Google Scholar] [CrossRef] [PubMed]
  40. Ironside, K.E.; Mattson, D.J.; Arundel, T.; Theimer, T.; Holton, B.; Peters, M.; Edwards, C.T., Jr.; Hansen, J. Geomorphometry in Landscape Ecology: Issues of Scale, Physiography, and Application. Environ. Ecol. Res. 2018, 6, 397–412. [Google Scholar] [CrossRef]
  41. Oliveira, T.; Urra, F.; López-Martín, J.M.; Ballesteros-Duperón, E.; Barea-Azcón, J.M.; Moléon, M.; Gil-Sánchez, J.M.; Alves, P.C.; Díaz-Ruíz, F.; Ferreras, P.; et al. Females Know Better: Sex-Biased Habitat Selection by the European Wildcat. Ecol. Evol. 2018, 8, 9464–9477. [Google Scholar] [CrossRef] [PubMed]
  42. Cristescu, B.; Domokos, C.; Teichman, K.J.; Nielsen, S.E. Large Carnivore Habitat Suitability Modelling for Romania and Associated Predictions for Protected Areas. PeerJ 2019, 7, e6549. [Google Scholar] [CrossRef]
  43. Farhadinia, M.S.; Heit, D.R.; Montgomery, R.A.; Johnson, P.J.; Hobeali, K.; Hunter, L.T.; Macdonald, D.W. Vertical Relief Facilitates Spatial Segregation of a High Density Large Carnivore Population. Oikos 2019, 129, 346–355. [Google Scholar] [CrossRef]
  44. Krofel, M.; Potočnik, H.; Kos, I. Topographical and vegetational characteristics of lynx kill sites in Slovenian Dinaric mountains. Nat. Slov. Rev. Za Teren. Biol. 2007, 9, 25–36. [Google Scholar]
  45. Podgórski, T.; Schmidt, K.; Kowalczyk, R.; Gulczyńska, A. Microhabitat Selection by Eurasian Lynx and Its Implications for Species Conservation. Acta Theriol. 2008, 53, 97–110. [Google Scholar] [CrossRef]
  46. Dickson, B.G.; Beier, P. Quantifying the Influence of Topographic Position on Cougar (Puma Concolor) Movement in Southern California, USA. J. Zool. 2006, 271, 270–277. [Google Scholar] [CrossRef]
  47. Jerosch, S.; Götz, M.; Klar, N.; Roth, M. Characteristics of diurnal resting sites of the endangered European wildcat (Felis silvestris silvestris): Implications for its conservation. J. Nat. Conserv. 2010, 18, 45–54. [Google Scholar] [CrossRef]
  48. Belotti, E.; Červený, J.; Šustr, P.; Kreisinger, J.; Gaibani, G.; Bufka, L. Foraging Sites of Eurasian Lynxlynx Lynx: Relative Importance of Microhabitat and Prey Occurrence. Wildl. Biol. 2013, 19, 188–201. [Google Scholar] [CrossRef] [Green Version]
  49. Allen, M.L.; Hočevar, L.; de Groot, M.; Krofel, M. Where to Leave a Message? The Selection and Adaptive Significance of Scent-Marking Sites for Eurasian Lynx. Behav. Ecol. Sociobiol. 2017, 71, 136. [Google Scholar] [CrossRef]
  50. Jerosch, S.; Kramer-Schadt, S.; Götz, M.; Roth, M. The Importance of Small-Scale Structures in an Agriculturally Dominated Landscape for the European Wildcat (Felis Silvestris Silvestris) in Central Europe and Implications for Its Conservation. J. Nat. Conserv. 2018, 41, 88–96. [Google Scholar] [CrossRef]
  51. Signer, J.; Filla, M.; Schoneberg, S.; Kneib, T.; Bufka, L.; Belotti, E.; Heurich, M. Rocks Rock: The Importance of Rock Formations as Resting Sites of the Eurasian Lynx Lynx Lynx. Wildl. Biol. 2019, 2019, 1–5. [Google Scholar] [CrossRef] [Green Version]
  52. Hočevar, L.; Oliveira, T.; Krofel, M. Felid Bedrooms with a Panoramic View: Selection of Resting Sites by Eurasian Lynx (Lynx Lynx) in a Karstic Landscape. Behav. Ecol. Sociobiol. 2021, 75, 34. [Google Scholar] [CrossRef]
  53. Buser, S. Osnovna Geološka Karta SFRJ 1: 100.000, List Postojna; Zvezni Geološki Zavod: Beograd, Serbia, 1967. [Google Scholar]
  54. Pleničar, M. Osnovna Geološka Karta SFRJ 1: 100.000, Tolmač List Postojna; Zvezni Geološki Zavod: Beograd, Serbia, 1970. [Google Scholar]
  55. Habič, P. Vodna gladina v notranjskem in primorskem krasu Slovenije. Acta Carsologica 1985, 13, 37–78. [Google Scholar]
  56. Stepišnik, U. Udornice v Sloveniji; Znanstvena založba Filozofske fakultete: Ljubljana, Slovenia, 2010; 118p. [Google Scholar]
  57. Ogrin, D. Podnebni tipi v Sloveniji. Geogr. Vestn. 1996, 68, 39–56. [Google Scholar]
  58. Nadbath, M. Meteorološka postaja na Pokojišču. Naše Okolje Bilt. Agencije RS Za Okolje 2002, 19, 29–30. [Google Scholar]
  59. Perko, D.; Orožen Adamič, M. Slovenija—Pokrajine in Ljudje; Mladinska knjiga: Ljubljana, Slovenija, 2001. [Google Scholar]
  60. Kordiš, F. Dinarski Jelovo Bukovi Gozdovi v Sloveniji, 1st ed.; Univerza v Ljubljani, Biotehniška fakulteta, Oddelek za gozdarstvo in gozdna gospodarstva: Ljubljana, Slovenija, 1993. [Google Scholar]
  61. Krofel, M.; Huber, D.; Kos, I. Diet of Eurasian Lynx Lynx Lynx in the Northern Dinaric Mountains (Slovenia and Croatia). Acta Theriol. 2011, 56, 315–322. [Google Scholar] [CrossRef]
  62. Obu, J. Prepoznavanje Kraških Kotanj na Podlagi Digitalnega Modela Višin. Bachelor’s Thesis, Filozofska fakulteta Univerze v Ljubljani, Ljubljana, Slovenija, 2011. [Google Scholar]
  63. Triglav Čekada, M.; Bric, V. 2015: Končan je projekt laserskega skeniranja Slovenije/The project of laser scanning of Slovenia is completed. Geod. Vestn. 2015, 59, 586–592. [Google Scholar]
  64. LiDAR. Agencija RS za Okolje, Ministrstvo za Okolje in Prostor. 2015. Available online: http://gis.arso.gov.si/evode/profile.aspx?id=atlas_voda_Lidar@Arso (accessed on 23 December 2020).
  65. ArcGIS Pro. ESRI. 2021. Available online: https://www.esri.com/en-us/arcgis/products/arcgis-pro/overview (accessed on 4 August 2021).
  66. Krofel, M.; Skrbinšek, T.; Kos, I. Use of GPS Location Clusters Analysis to Study Predation, Feeding, and Maternal Behavior of the Eurasian Lynx. Ecol. Res. 2013, 28, 103–116. [Google Scholar] [CrossRef]
  67. Krofel, M.; Fležar, U.; Hočevar, L.; Sindičić, M.; Gomerčić, T.; Konec, M.; Slijepčević, V.; Bartol, M.; Boljte, B.; Črtalič, J.; et al. Surveillance of the Reinforcement Process of the Dinaric—SE Alpine Lynx Population in the Lynx-Monitoring Year 2019–2020; Technical Report; Biotechnical Faculty, University of Ljubljana: Ljubljana, Slovenia, 2021; p. 45. [Google Scholar]
  68. Johnson, D.H. The comparison of usage and availability measurements for evaluating resource preference. Ecology 1980, 61, 65–71. [Google Scholar] [CrossRef]
  69. Krofel, M.; Hočevar, L.; Allen, M.L. Does Human Infrastructure Shape Scent Marking in a Solitary Felid? Mamm. Biol. 2017, 87, 36–39. [Google Scholar] [CrossRef]
  70. Burnham, K.P.; Anderson, D.R. Advanced Issues and Deeper Insights. In Model Selection and Multimodel Inference; Burnham, K.P., Anderson, D.R., Eds.; Springer: New York, NY, USA, 2002. [Google Scholar] [CrossRef]
  71. Northrup, J.M.; Hooten, M.B.; Anderson, C.R.; Wittemyer, G. Practical Guidance on Characterizing Availability in Resource Selection Functions under a Use–Availability Design. Ecology 2013, 94, 1456–1463. [Google Scholar] [CrossRef] [PubMed]
  72. GPS Accuracy. Garmin. Available online: https://support.garmin.com/en-US/?faq=aZc8RezeAb9LjCDpJplTY7 (accessed on 6 December 2021).
  73. Bates, D.; Mächler, M.; Bolker, B.; Walker, S. Fitting Linear Mixed-Effects Models USINGLME4. J. Stat. Softw. 2015, 67, 1–48. [Google Scholar] [CrossRef]
  74. Šegina, E.; Benac, Č.; Rubinić, J.; Knez, M. Morphometric Analyses of Dolines—The Problem of Delineation and Calculation of Basic Parameters. Acta Carsologica 2018, 47, 23–33. [Google Scholar] [CrossRef]
  75. Petram, W.; Knauer, F.; Kaczensky, P. Human Influence on the Choice of Winter Dens by European Brown Bears in Slovenia. Biol. Conserv. 2004, 119, 129–136. [Google Scholar] [CrossRef]
  76. Mysterud, A.; Ims, R.A. Functional responses in habitat use: Availability influences relative use in trade-off situations. Ecology 1998, 79, 1125–1477. [Google Scholar] [CrossRef]
  77. Ripari, L.; Premier, J.; Belotti, E.; Bluhm, H.; Breitenmoser-Würsten, C.; Bufka, L.; Červený, J.; Drouet-Hoguet, N.; Fuxjäger, C.; Jędrzejewski, W.; et al. Human disturbance is the most limiting factor driving habitat selection of a large carnivore throughout Continental Europe. Biol. Conserv. 2022, 266, 109446. [Google Scholar] [CrossRef]
  78. Čonč, Š. Pomen varovanja vročih točk geodiverzitete za ohranitev biotske pestrosti na območju Nature 2000 v dolini reke Dragonje. Geogr. Vestn. 2020, 92, 9–28. [Google Scholar] [CrossRef]
  79. Gordon, J.E.; Bailey, J.J.; Larwood, J.G. Conserving nature’s stage provides a foundation for safeguarding both geodiversity and biodiversity in protected and conserved areas. Parks Steward. Forum 2022, 38, 46–55. [Google Scholar] [CrossRef]
Figure 1. Map of the study area and location of the two regions considered (1—Menišija plateau; 2—Logatec-Begunje plain/Ravnik).
Remotesensing 14 00656 g001
Figure 2. Flowchart of karst depressions detection.
Remotesensing 14 00656 g002
Figure 3. Detected karst depressions and geological map of the study area.
Remotesensing 14 00656 g003
Figure 4. Selection of karst depressions by lynx (left) and wildcats (right), indicated by comparison of random points inside the tracked animals’ home ranges (availability; grey) and felid GPS points (use; black). ‘Inside karst depression’ refers to areas inside karst depressions, while ‘Karst depression + rim’ includes also a 15 m buffer to account for the rims of these depressions, as well as GPS-error of telemetry collars.
Remotesensing 14 00656 g004
Table 1. Estimated minimum (Min) and maximum (Max) values for each morphometric characteristic considered, as well as median and interquartile range (Median ± IQR). Values are presented for the entire study area, and then separately for Ravnik and Menišija.
Area (m2)Perimeter (m)Diameter (m)Depth (m)Length (m)Width (m)Elevation (m)
Study area (area = 137 km2, ndepressions = 9711)
Min102.437.811.42.06.25.0299.9
Max54,965.8907.2264.680.9168.5127.6942.3
Median ± IQR765.6 ± 713.6102.6 ± 46.131.2 ± 14.03.6 ± 2.317.4 ± 8.014.0 ± 6.3587.6 ± 98.8
Ravnik (area = 52 km2, ndepressions = 5720, %depressions = 58.9%)
Min102.438.111.42.06.65.0482.8
Max54,965.8907.2264.680.9168.5127.6697.6
Median ± IQR788.8 ± 699.1104.2 ± 44.731.7 ± 13.53.5 ± 2.217.6 ± 7.714.3 ± 6.2554.8 ± 65.8
Menišija (area = 85 km2, ndepressions = 3991, %depressions = 41.1%)
Min102.737.811.42.06.25.3299.9
Max48,146.5794.8247.668.0132.4115.8942.3
Median ± IQR722.9 ± 725.4100.5 ± 47.730.3 ± 14.53.6 ± 2.417.1 ± 8.313.4 ± 6.6642.1 ± 112.3
Table 2. Generalized linear models for habitat selection of Eurasian lynx and European wildcats in respect to their GPS locations, as well as locations of lynx kill sites. Covariate depressions and roads represent the distance to the nearest karst depression and forestry road, respectively. k—number of model variables; AIC—Akaike’s information criterion; ρ—Spearman rank correlation; CI—confidence interval.
DatasetModelkAICΔAICρModel Coefficients
Dist_Depressions [95% CI]Dist_Roads [95% CI]
Lynx_GPSUse ~ depressions + roads43241.60.00.9−0.8 [−0.9; −0.7]−0.2 [−0.3; −0.1]
Null23374.6133.00.5--
Wildcat_GPSUse ~ depressions + roads42818.20.00.4−0.7 [−1.2; −0.1]0.5 [0.34; 0.7]
Null22854.936.70.5--
Lynx_killsUse ~ depressions + roads4155.50.00.3−0.1 [−0.3; 0.0]−0.0 [−0.2; 0.1]
Null2155.70.10.5--
Publisher’s Note: MDPI stays neutral with regard to jurisdictional claims in published maps and institutional affiliations.

