
Research on Comfort Evaluation Model of Urban Residents’ Public Space Lighting Integrating Public Perception and Nighttime Light Remote Sensing Data

 ,
,  , ,
, ,
Abstract
:1. Introduction
2. Materials and Methods
2.1. Research Areas and Data Sources
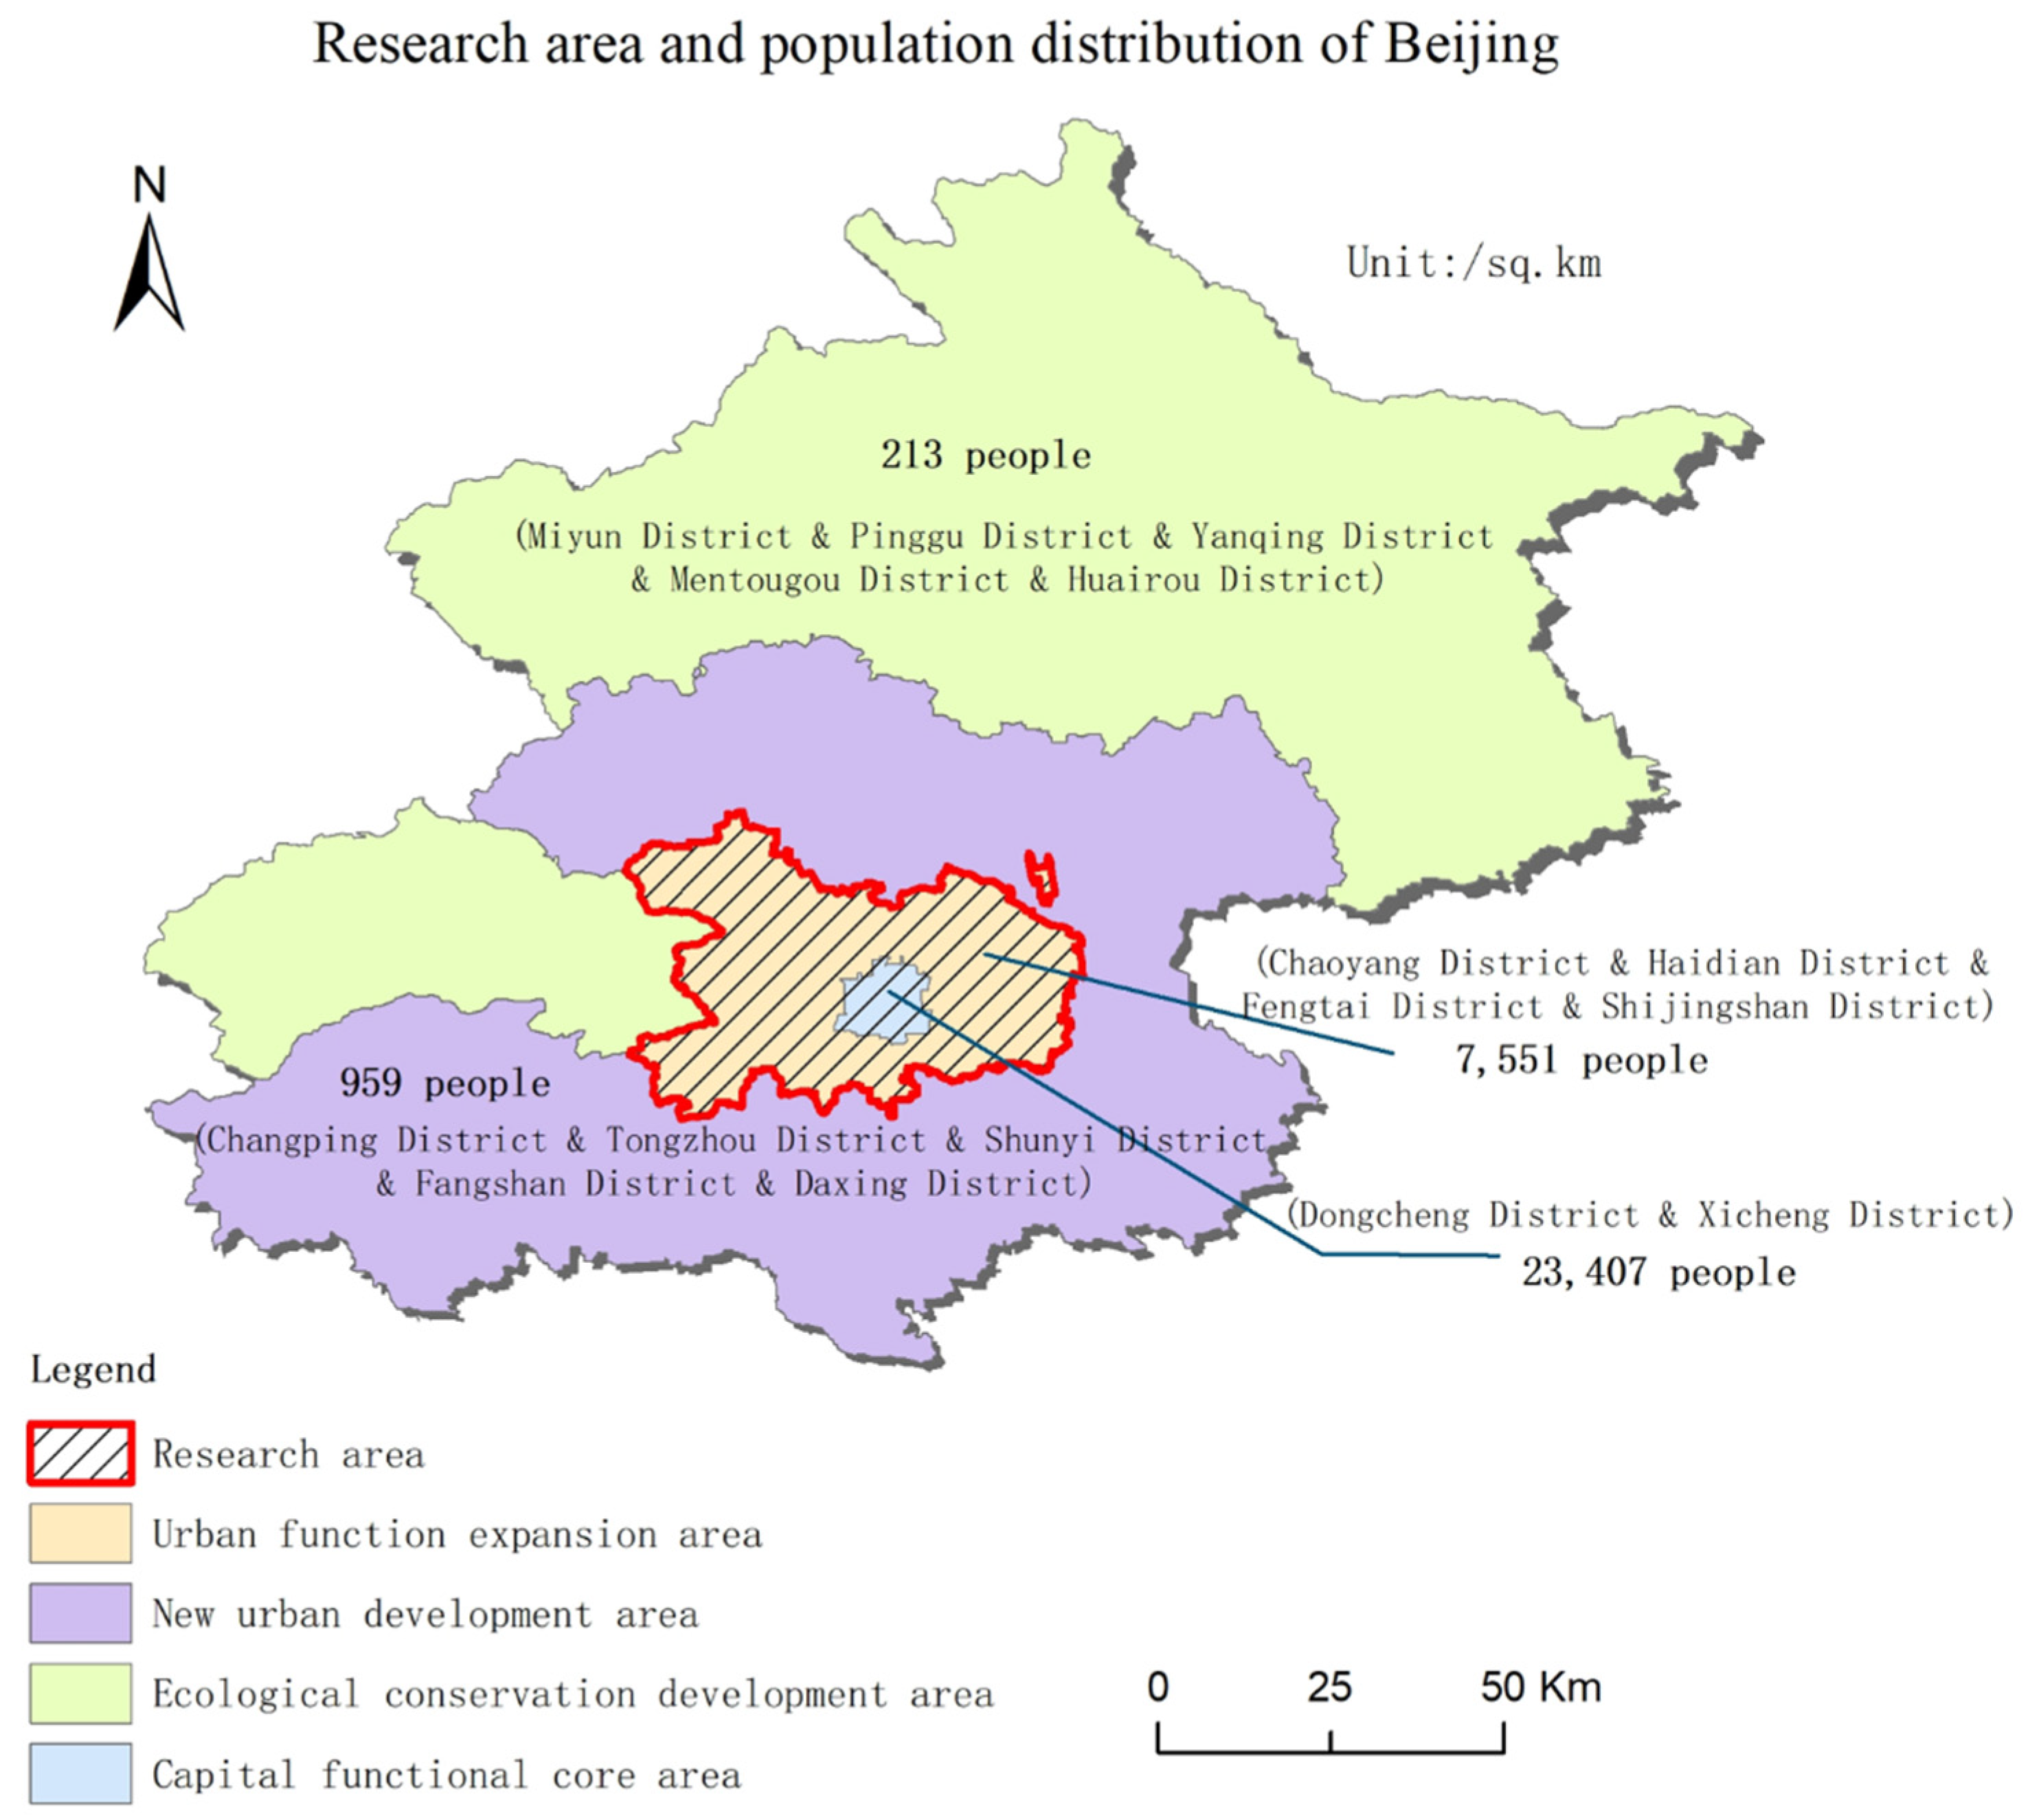
2.1.1. Research Areas
2.1.2. Nighttime Light Remote Sensing Data
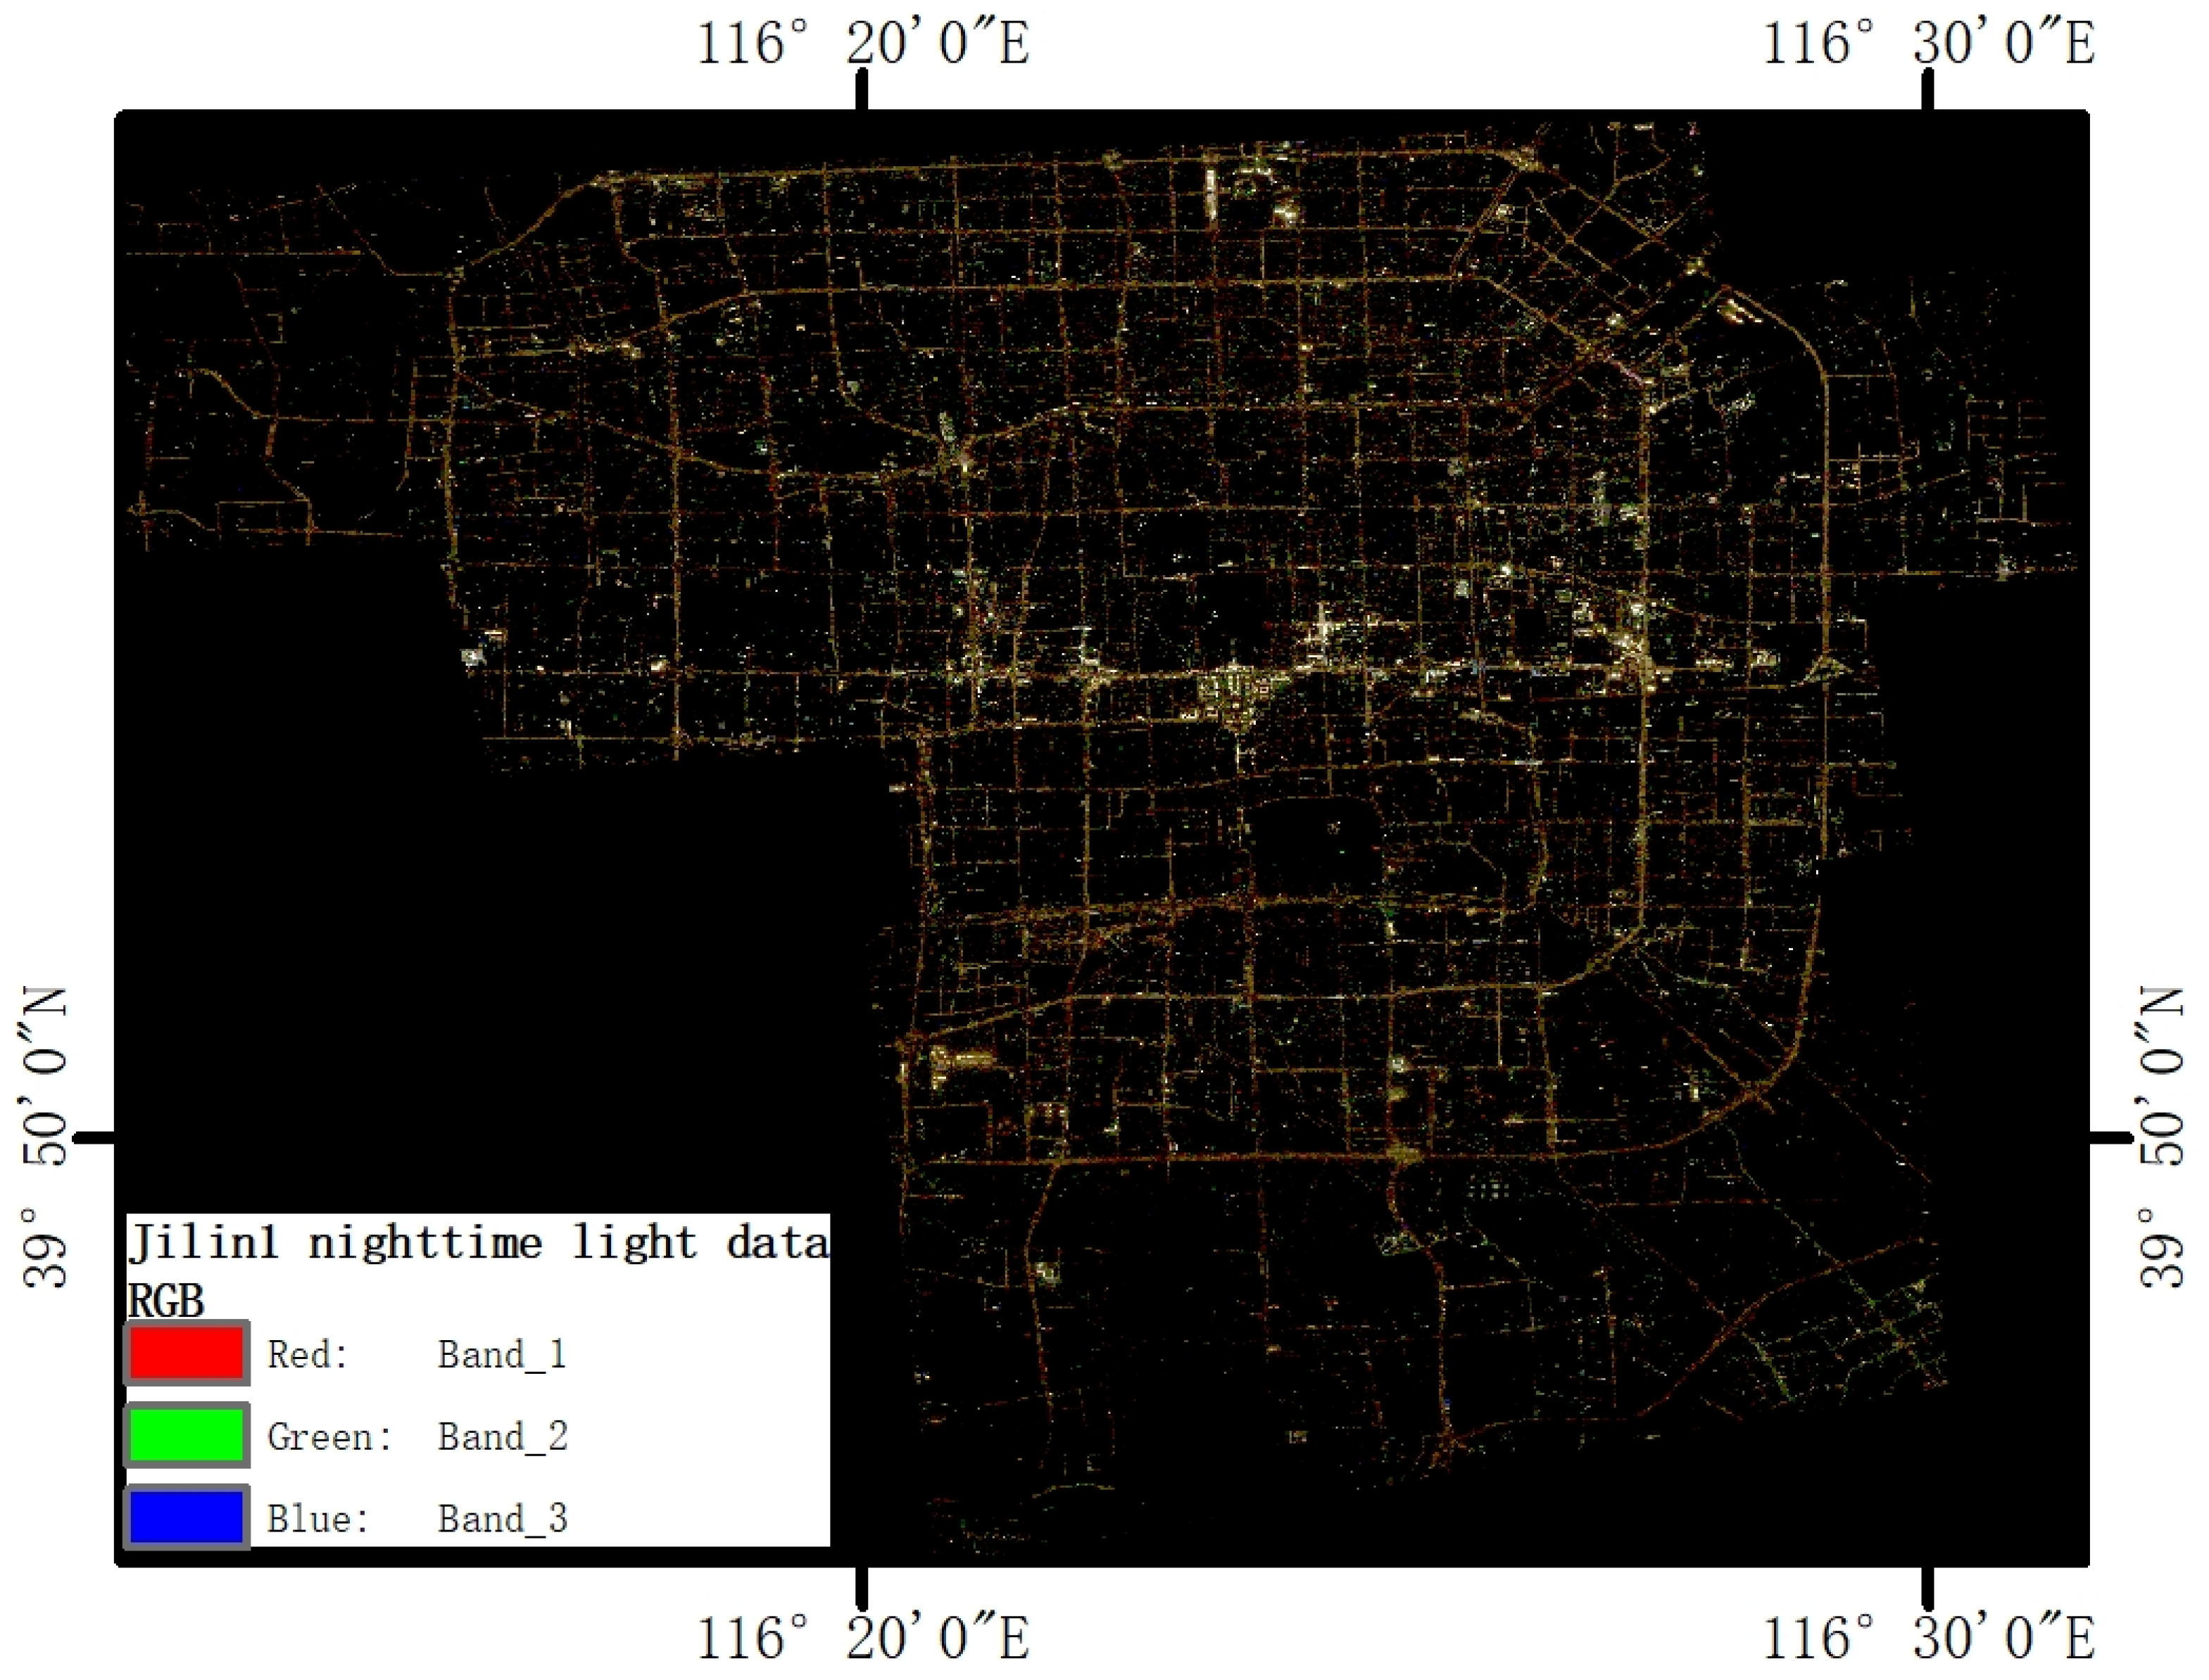
- Firstly, the optical remote sensing image with 2 m resolution of research area was used for geometric registration for each scene of Jilin-1 nighttime light remote sensing image [34]. The matching points of Jilin-1 nighttime light image and optical remote sensing image were identified by locating road intersections, overpass hubs, landscape boundaries, street lights, building shapes, etc., so as to realize the geometric registration of Jilin-1 images.
- Secondly, the overlapping areas between the 7 scene images were used to perform relative radiation correction. One scene Jilin-1 nighttime light image was taken as the reference image, and other images adjacent to it with overlapping areas as the target image for relative radiation correction. The method of relative radiation correction [31] was as follows: the overlapping areas of nighttime light remote sensing data were extracted, and the radiation correction models of the three bands of red, green and blue in the overlapping areas were constructed, and then the obtained models were used, respectively, for the radiation correction of the corresponding images.
- Finally, 7 Jilin-1 nighttime light remote sensing images after the completion of geographic registration and radiometric correction were mosaicked into a scene nighttime light remote sensing image of Beijing area (Figure 3). This image has a spatial resolution of 1 m, a pixel depth of 8 bits, and three bands of red, green and blue information.
2.1.3. Vector Data
2.1.4. Socioeconomic Data
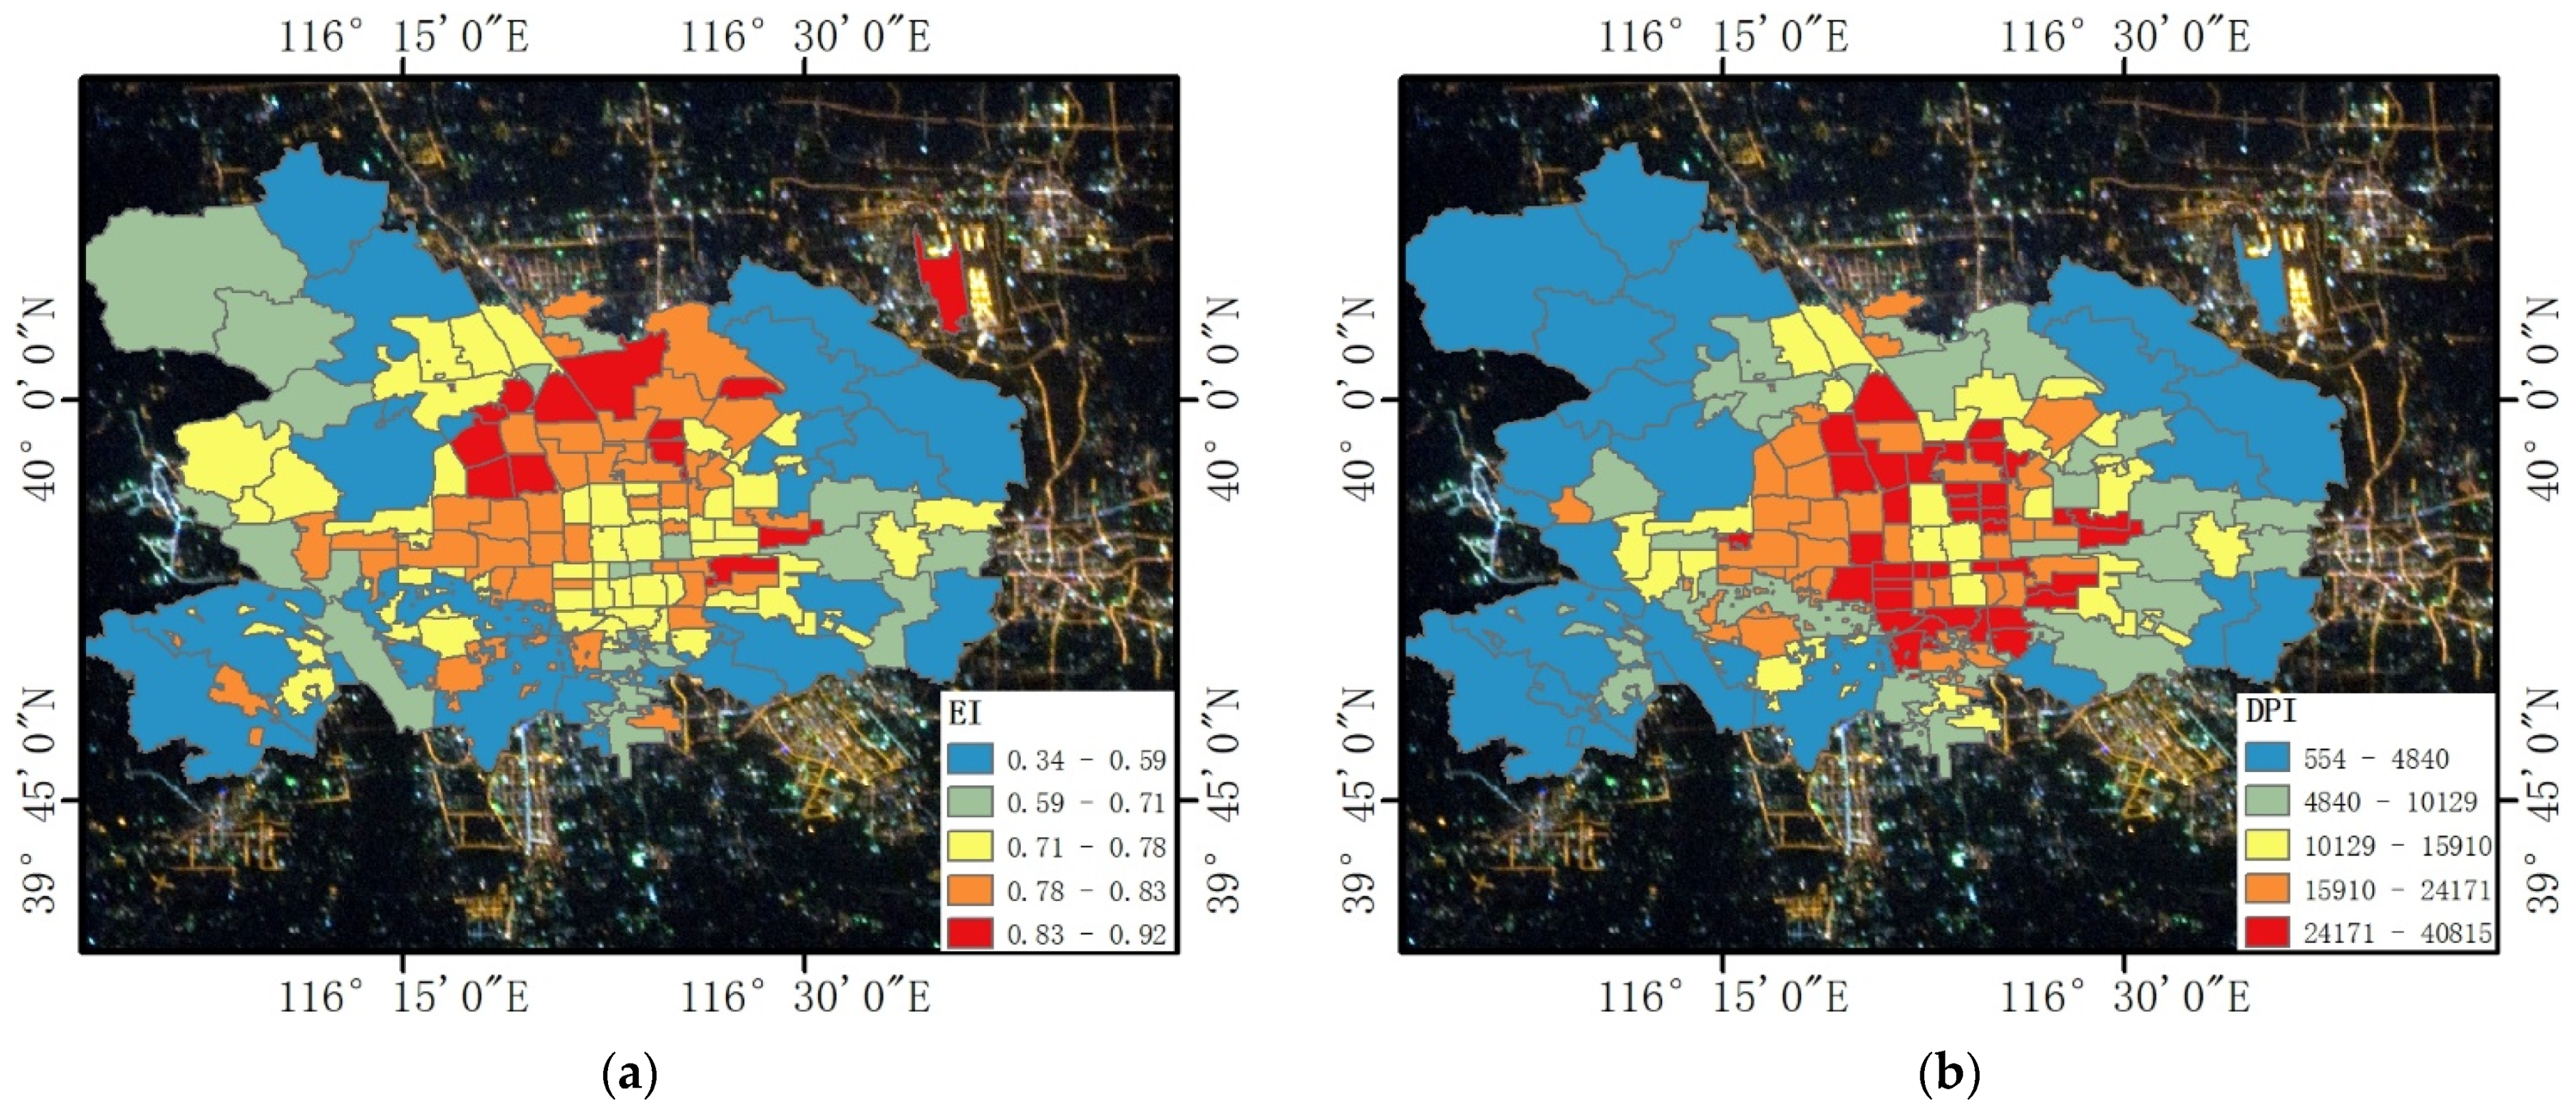
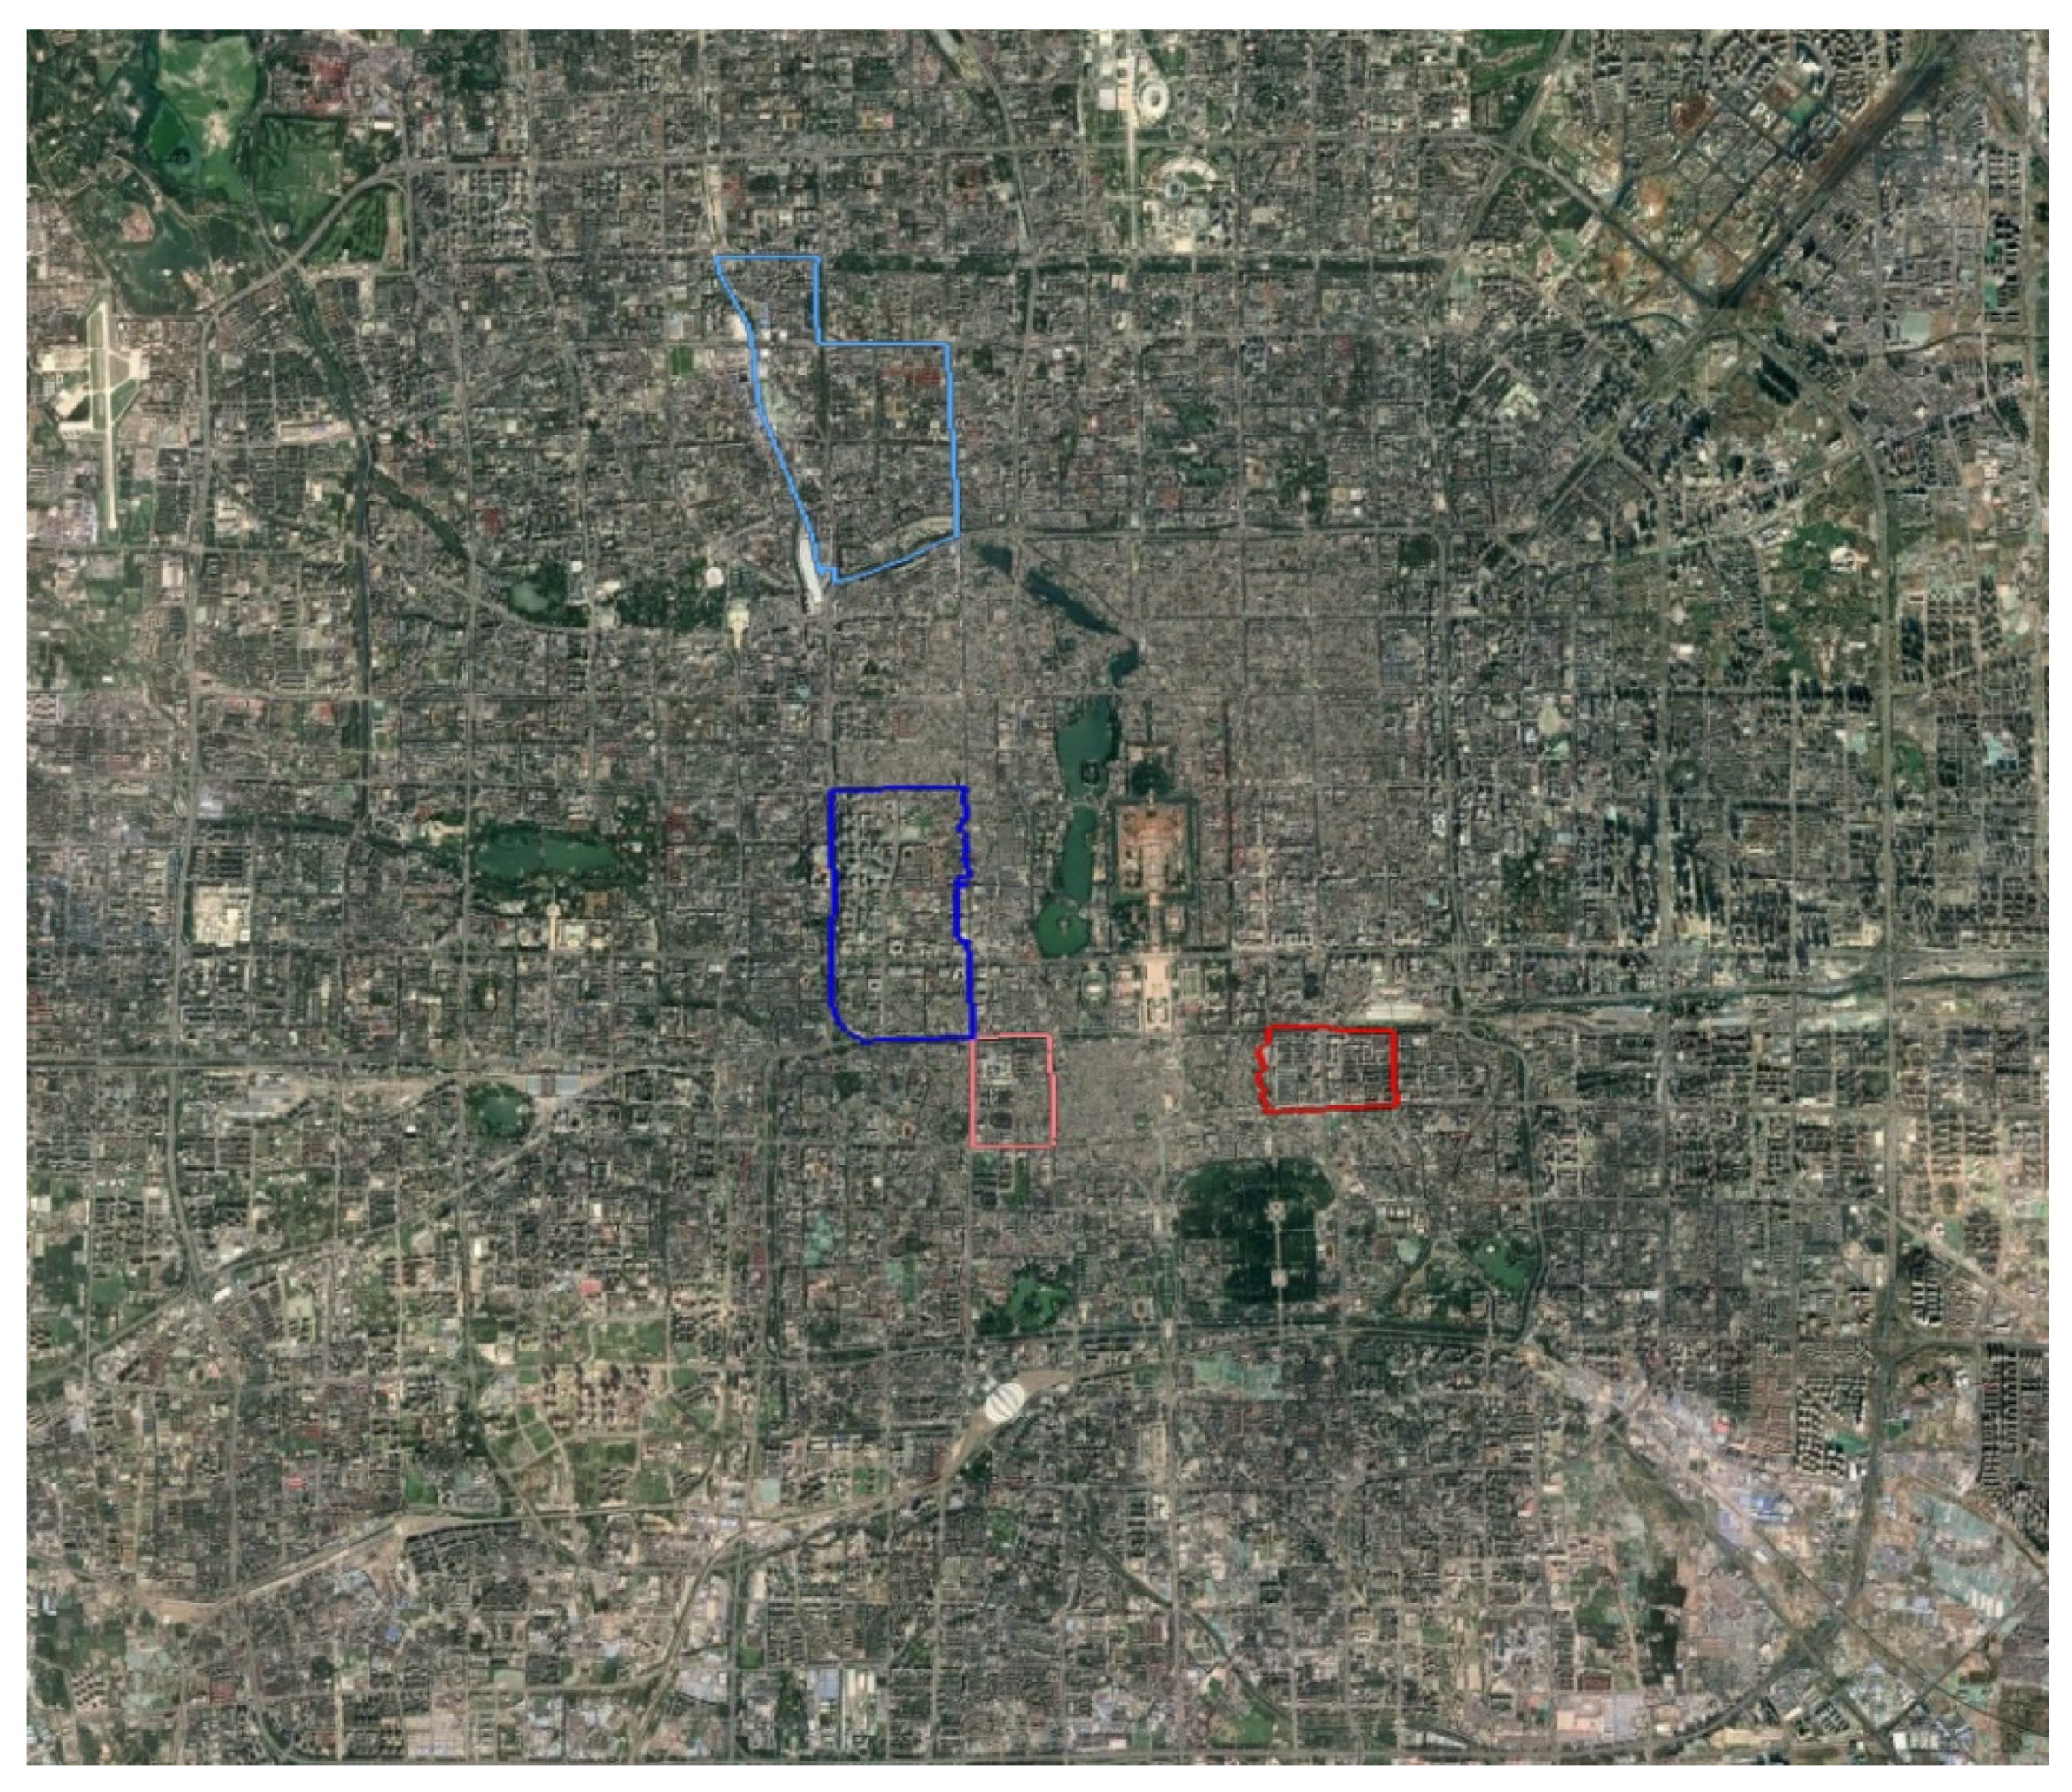
2.2. The Selection Method of Typical Residential Areas in Beijing
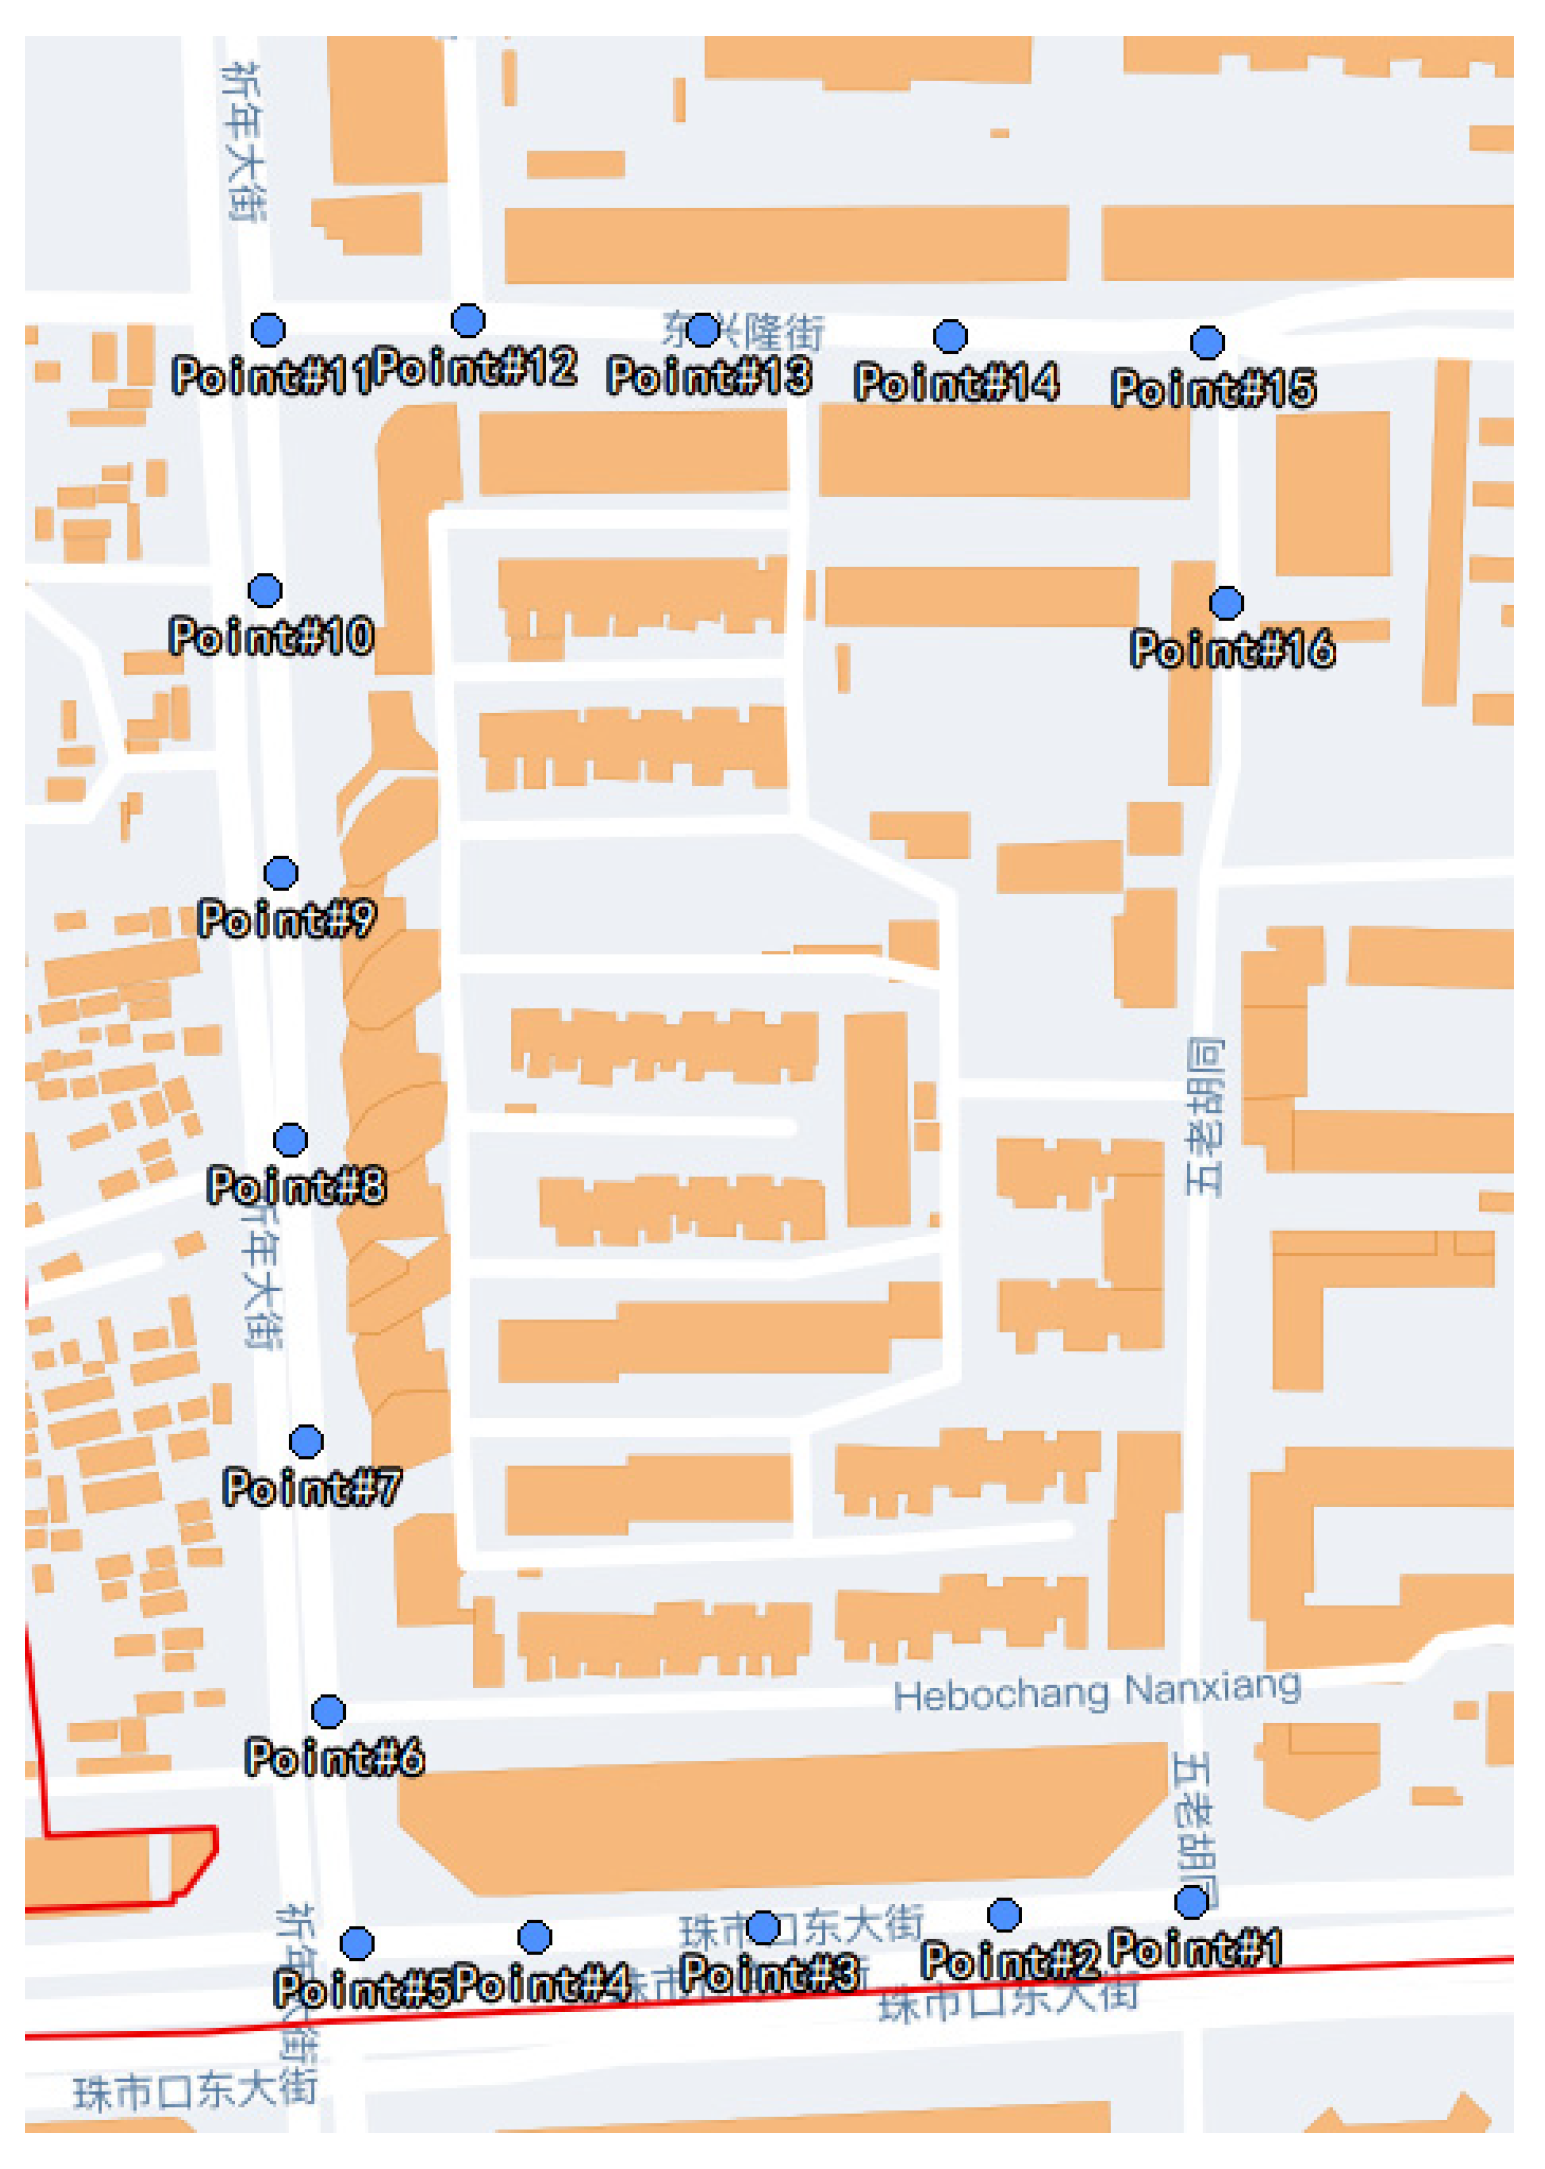
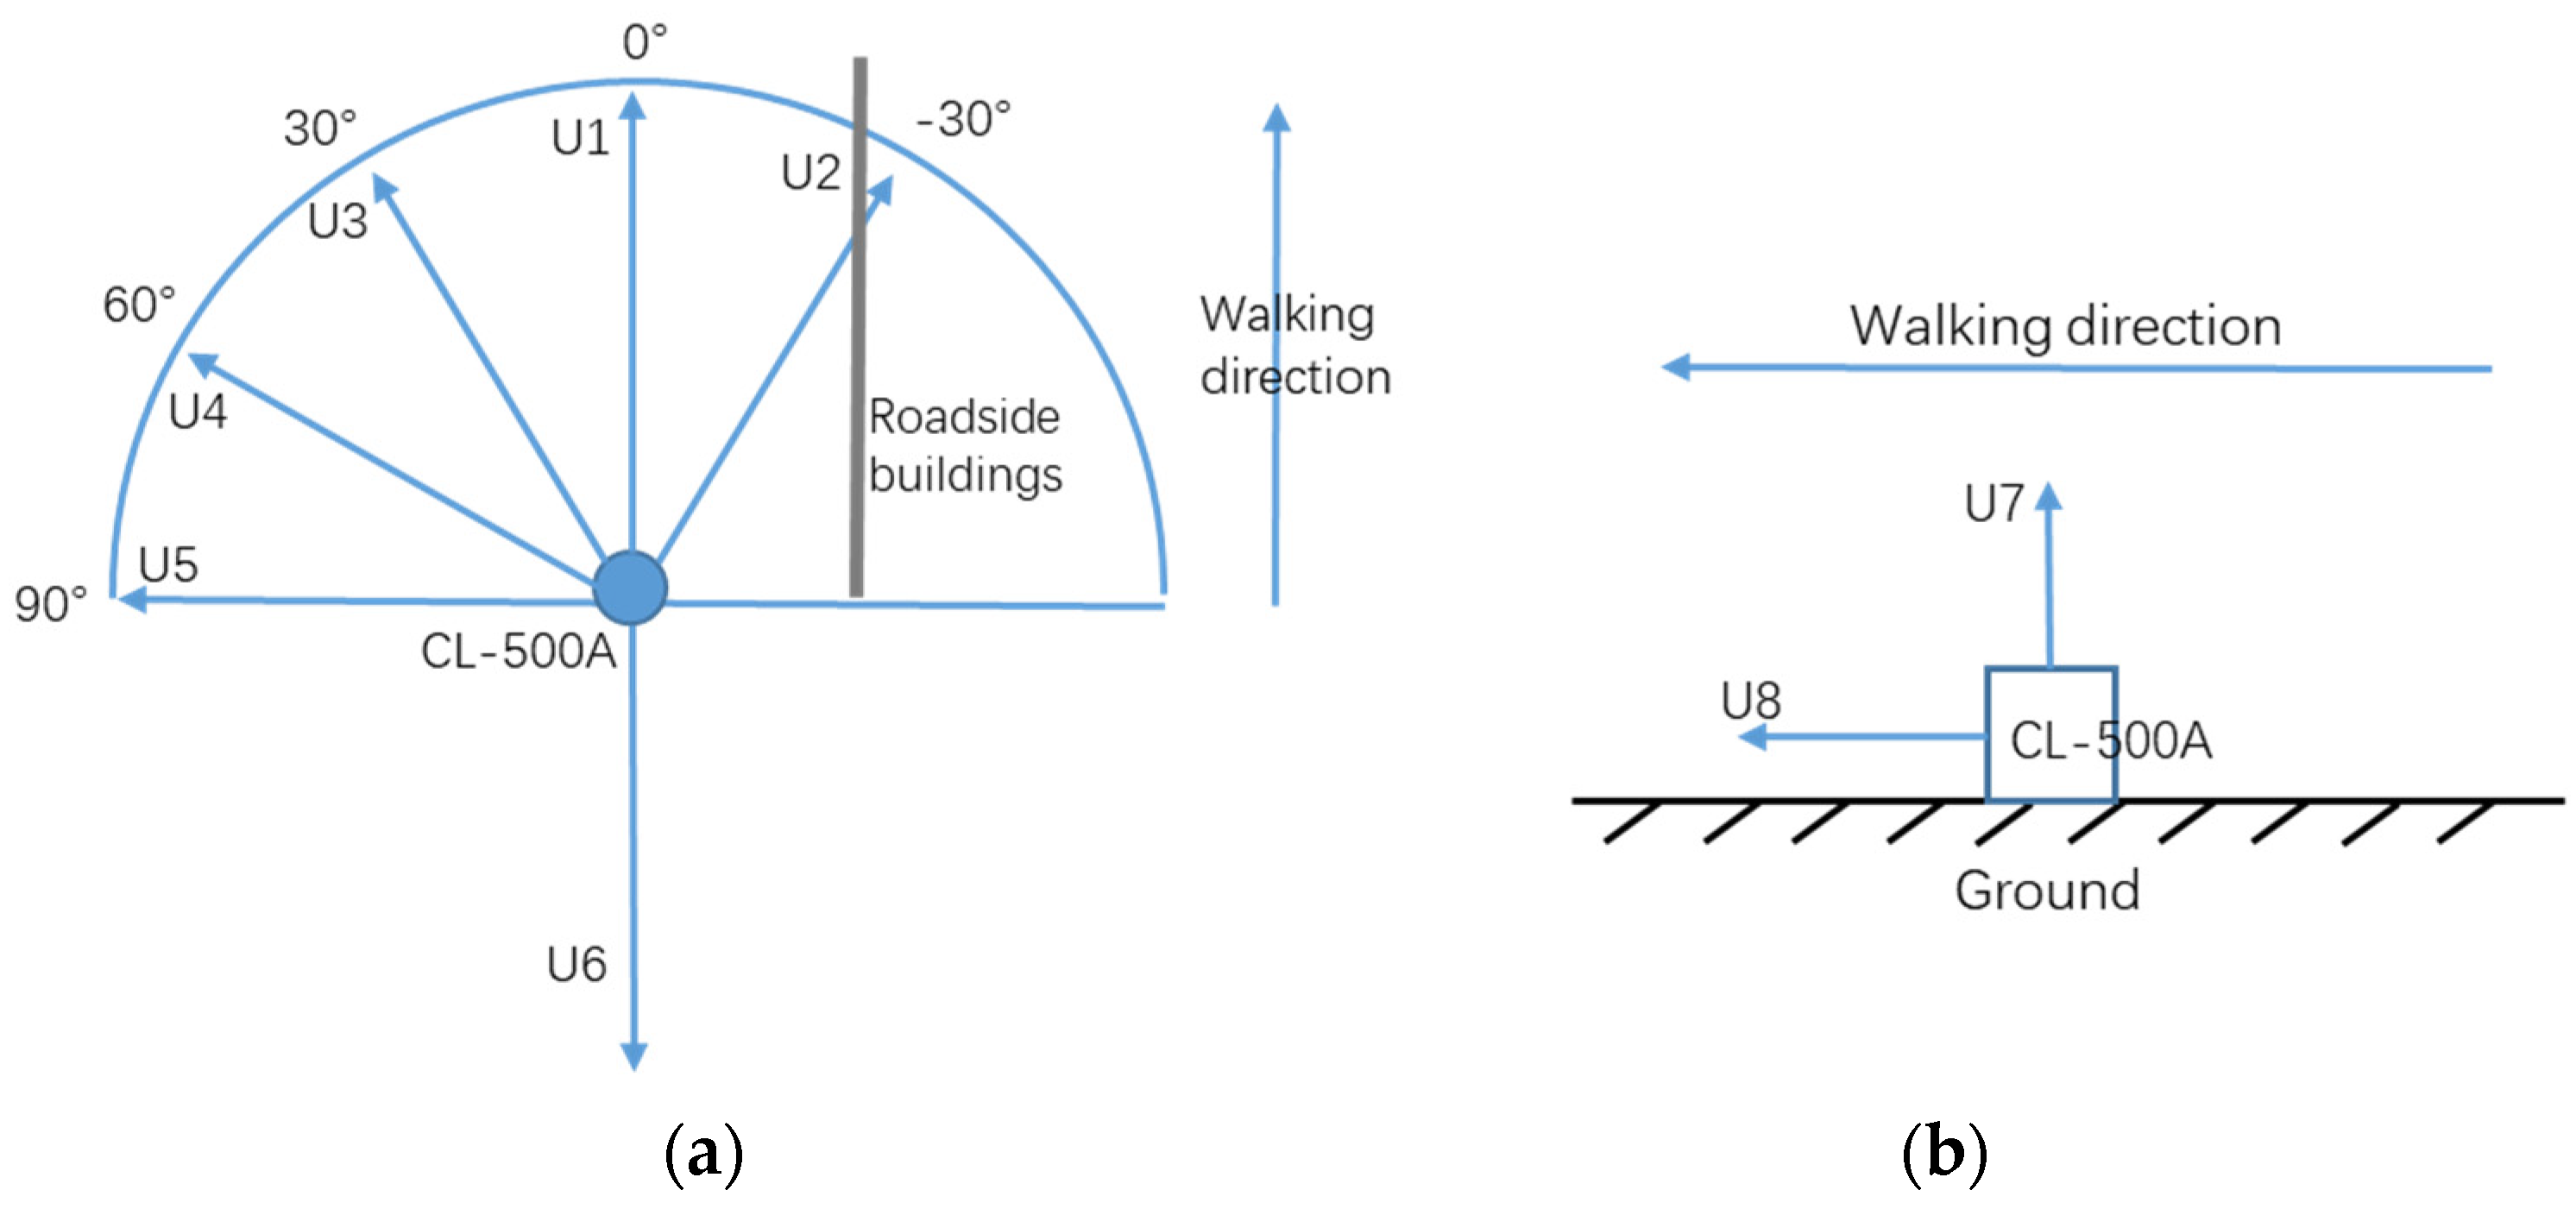
2.3. Field Measurement Method
- Illumination (Lux);
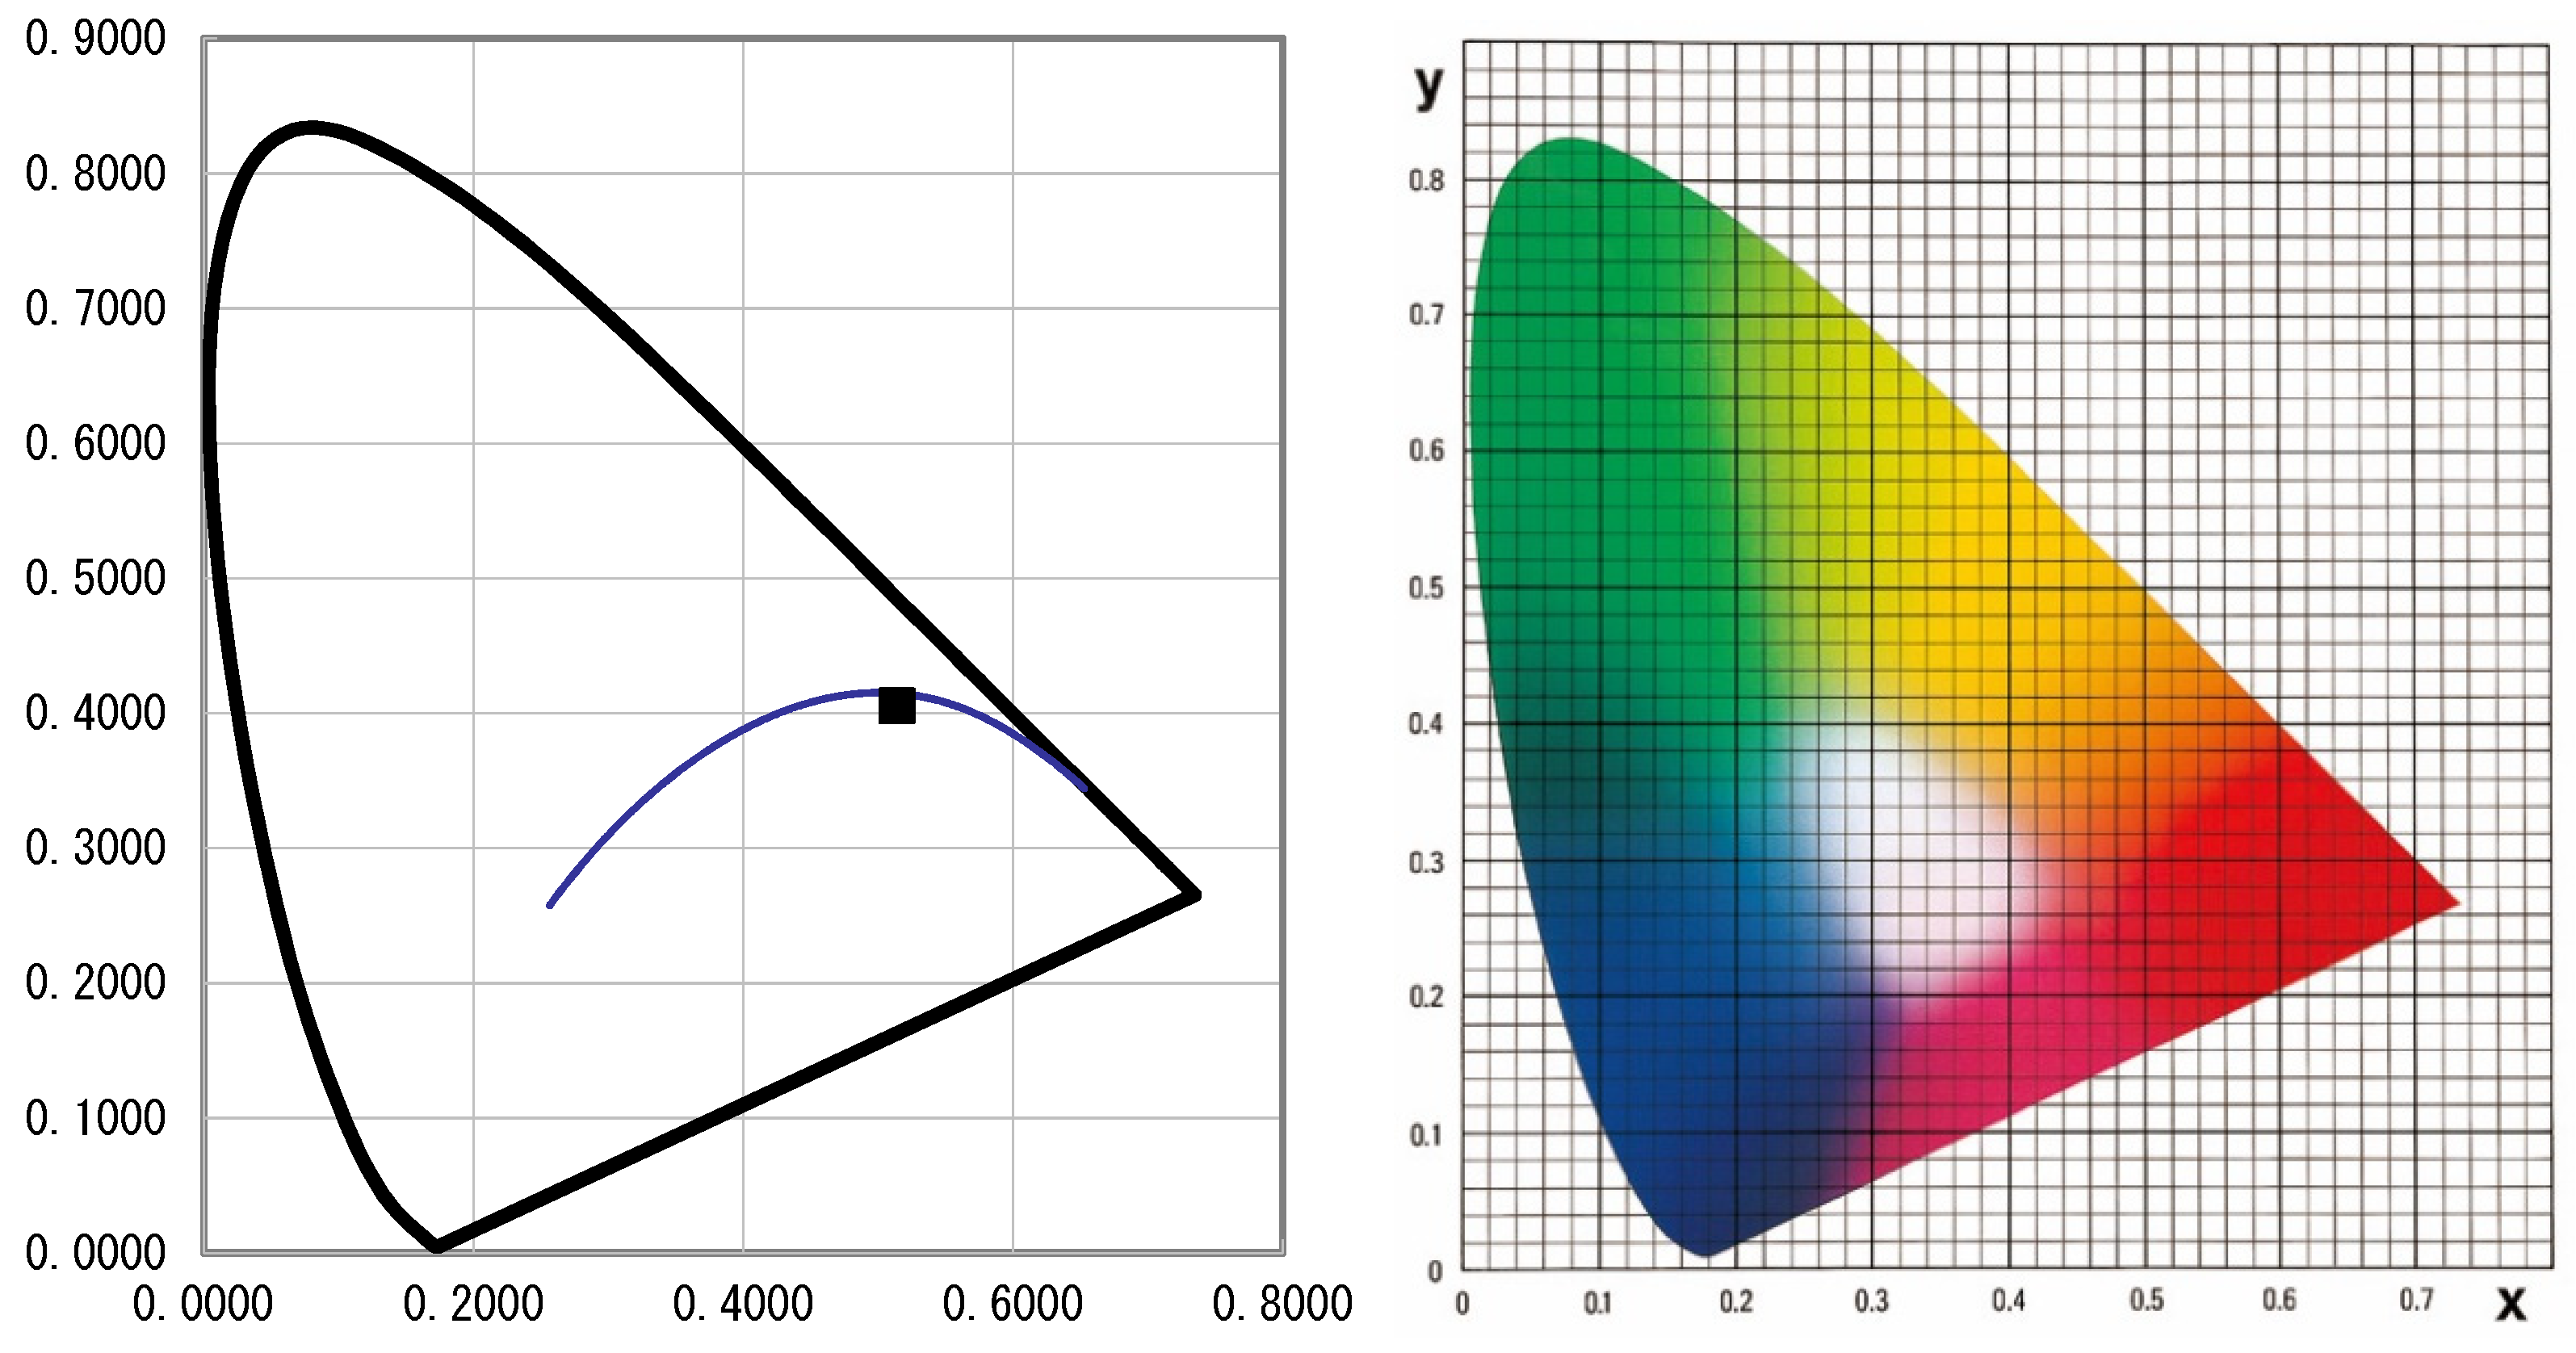
- Color temperature (Kelvins, K);
2.4. Public Perception Data Collection Method Based on WeChat Applet
- light intensity (0—very weak; 1—the weaker; 2—the stronger; 3—very strong);
- color temperature (0—too cold; 1—slants cold; 2—warm; 3—too warm);
- uniformity (0—completely non-uniformity; 1—slightly uneven; 2—slightly uniform; 3—very even);
- glare (0—no glare; 1—glare is not obvious; 2—glare is slightly obvious; 3—glare is very obvious);
- feeling of security (0—feeling very insecure; 1—feeling slightly insecure; 2—feeling a little safe; 3—feeling very safe);
- feeling of comfort (0—very uncomfortable; 1—slightly uncomfortable; 2—slightly comfortable; 3—very comfortable).
2.5. Data Management and Statistics Method
- Total score of 6 attributes of each survey points on each route (consistent with the number of survey points on this route).
- The sum of illuminance scores, color temperature scores, uniformity scores, glare scores, safety scores, and comfort scores (six items) of all survey points on the route for each respondent. These are used to evaluate the overall route.
- The average value of all the respondents’ evaluation of each light attribute of each survey point. (The number is calculated as the number of points of this route multiplied by 6).
3. Experiments and Results
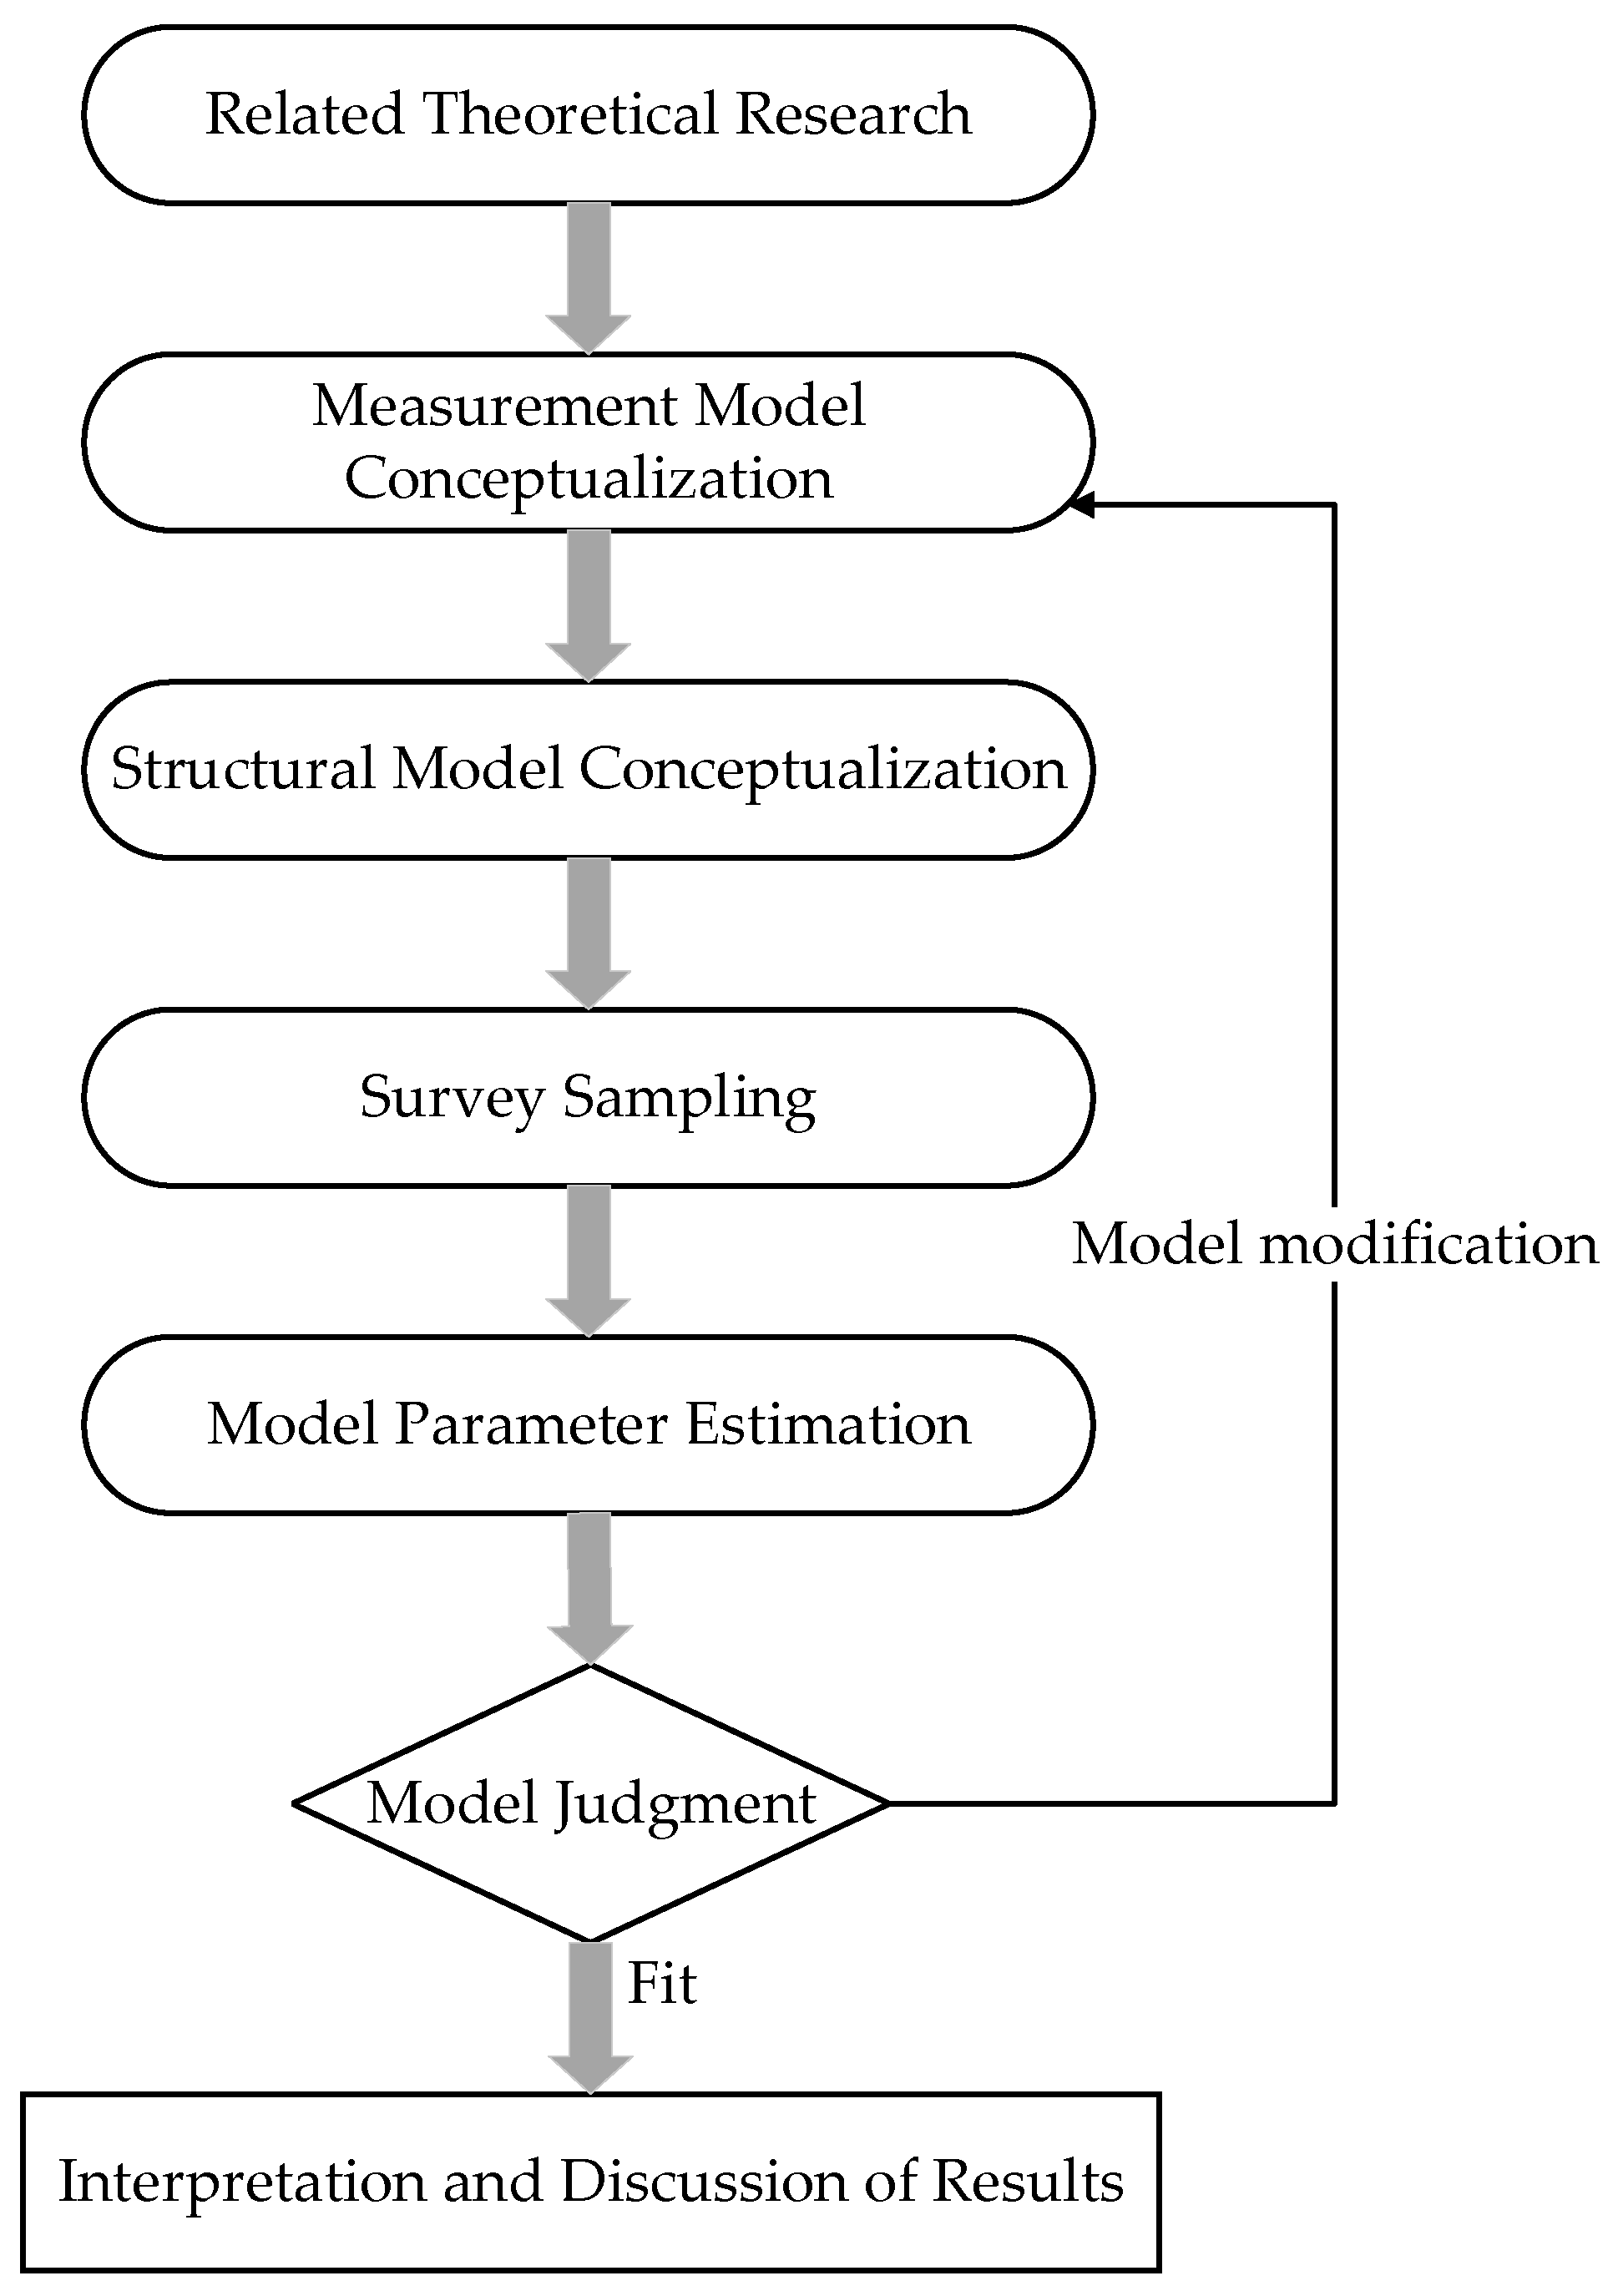
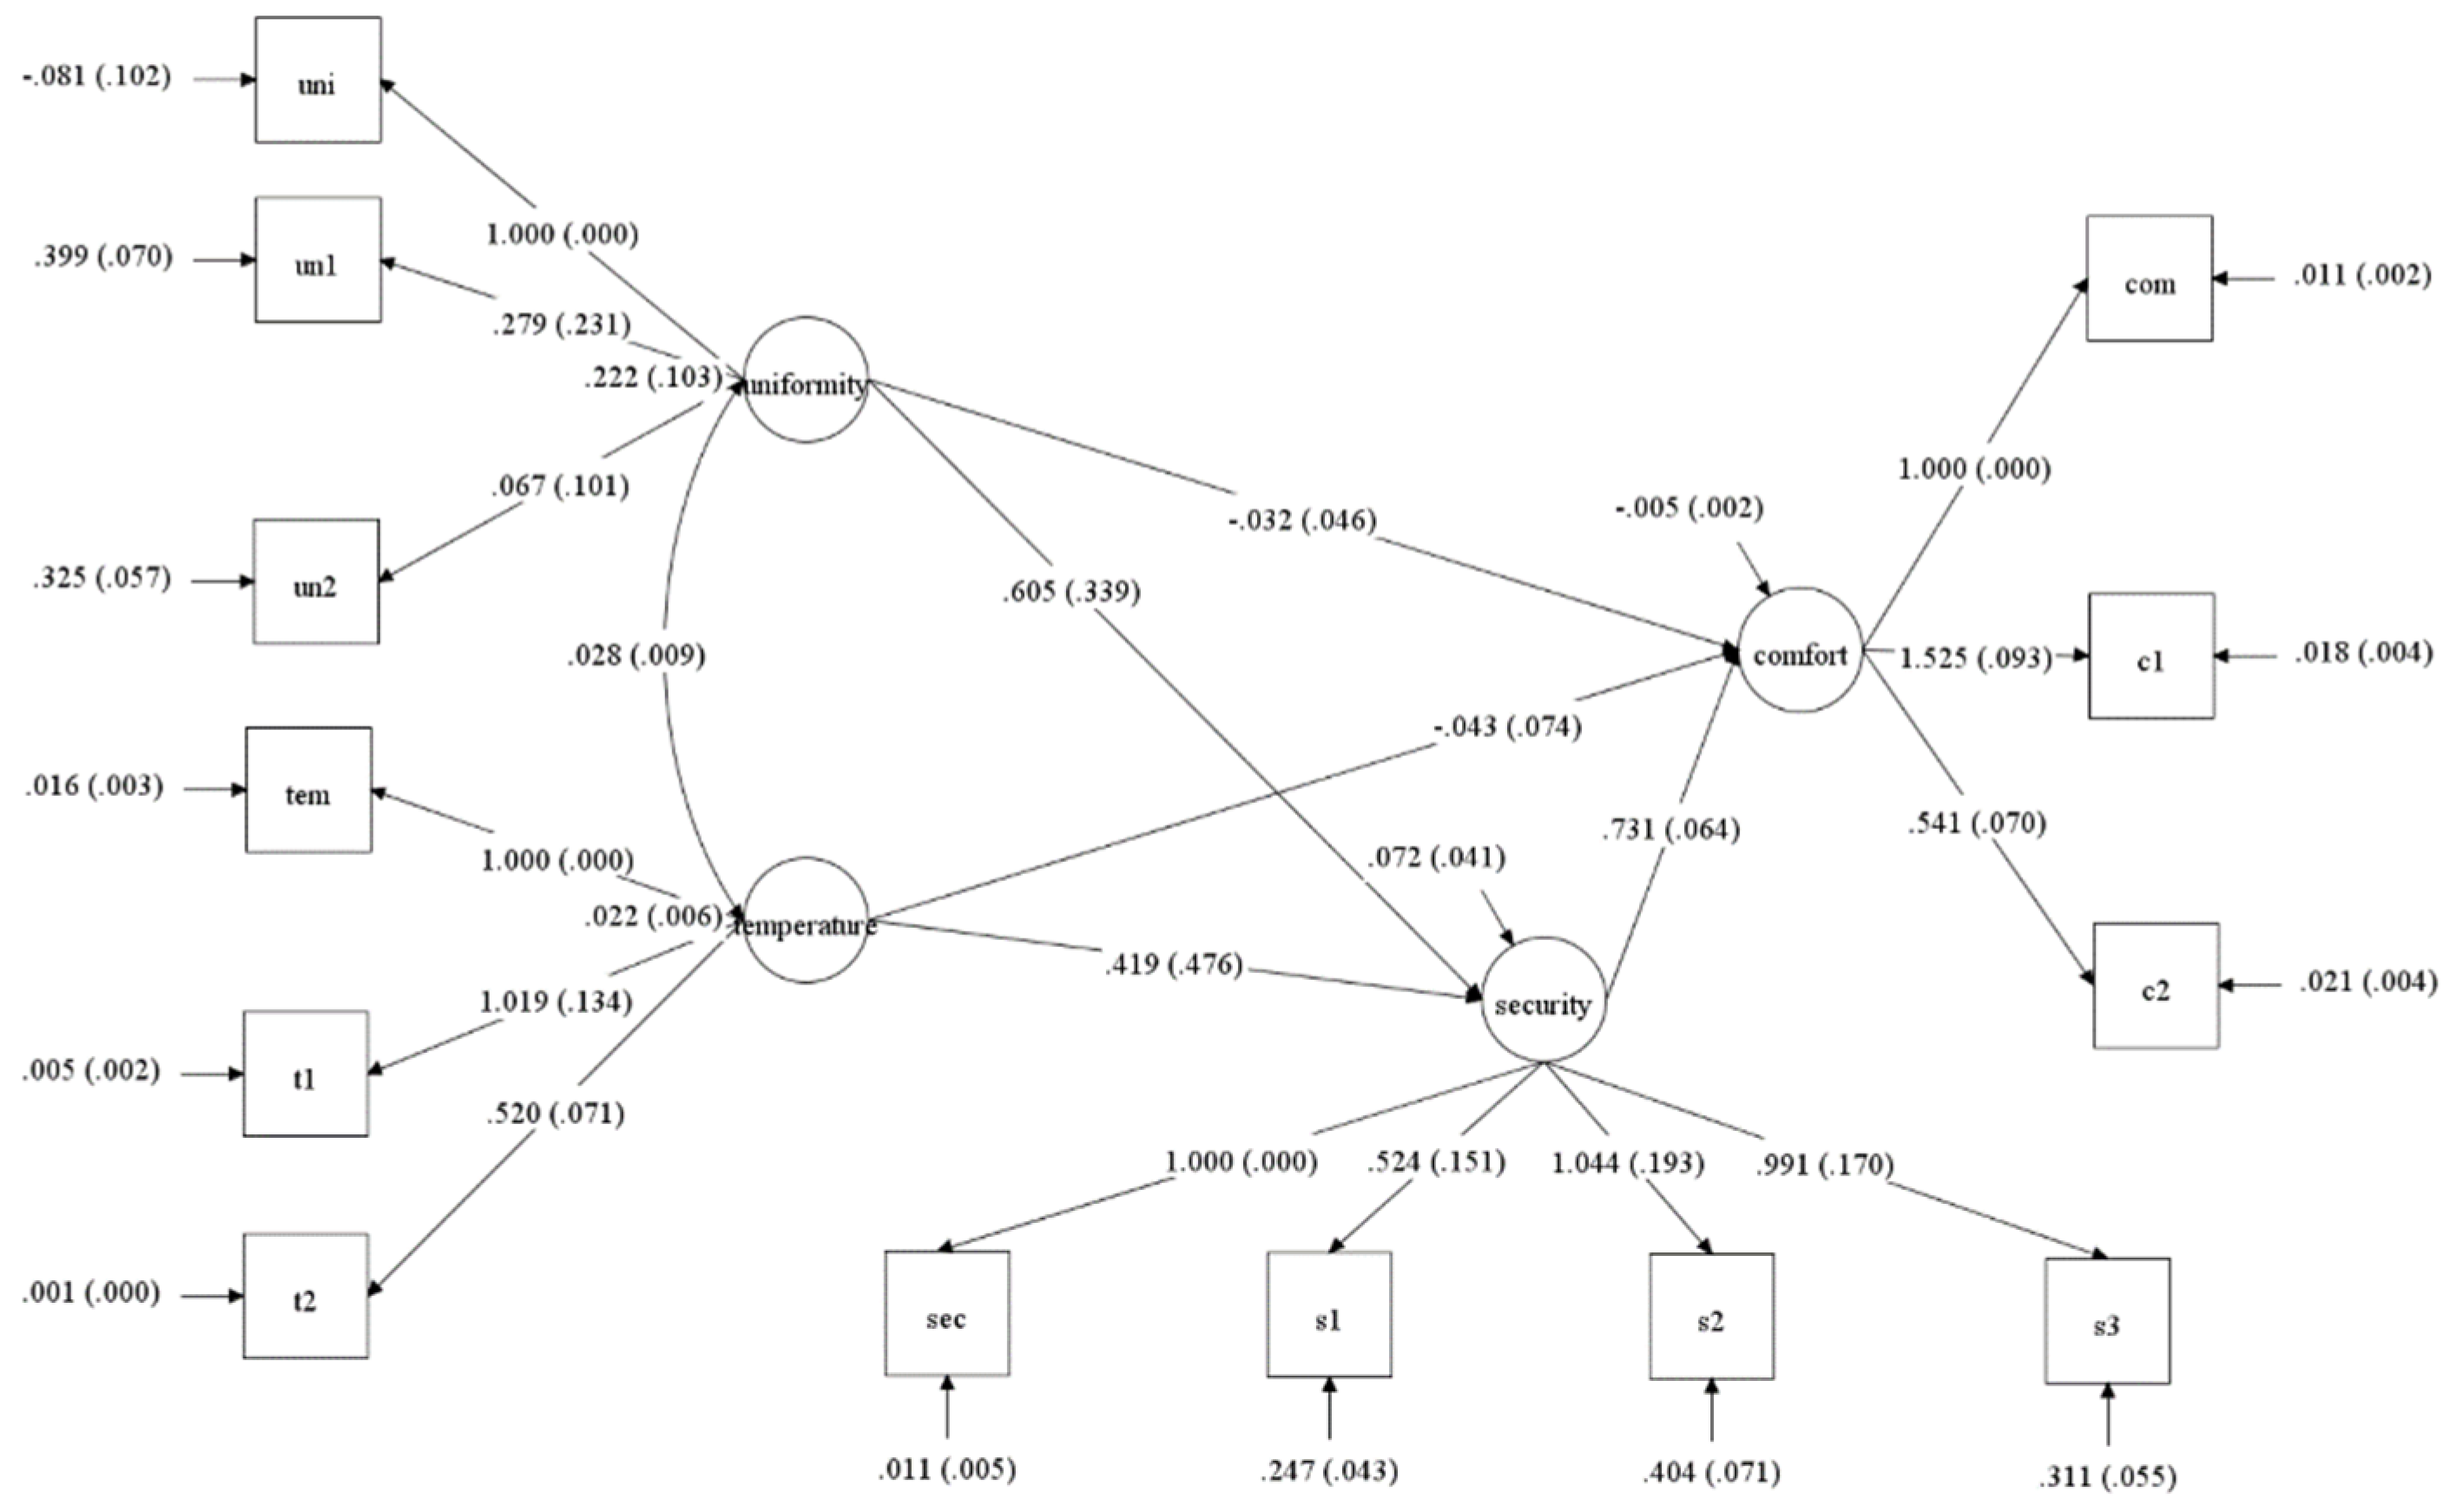
3.1. Structural Equation Model
3.2. Comfort Evaluation Model Results
4. Discussion
- Strengthen the collection and management of intelligent information based on the construction of smart city;
- From the perspective of sustainable development, reduce the blue light pollution in the public space lighting, so as to reduce the harm to human health;
- In terms of energy allocation, lighting energy shall be reasonably distributed according to the characteristics of different residential areas to promote sustainable economic development.
- Due to the impact of the COVID-19 pneumonia epidemic, the survey questionnaires for collecting public perception data in this research are limited, which may have an impact on the results of the comfort evaluation model.
- The time of image acquisition is inconsistent with the time of field survey and measurement, which makes the quantitative study of nighttime light data difficult.
- The results of this study are limited, and application to other cities, such as cities with lower population densities and GDP levels, requires more experimental studies.
5. Conclusions
Supplementary Materials
Author Contributions
Funding
Data Availability Statement
Acknowledgments
Conflicts of Interest
References
- García-Fuentes, M.Á.; Antolín, J.; de Torre, C.; Pérez, A.; Tomé, I.; Mirantes, M.L.; López, F.; Martín, J.; Gómez, J. Evaluation of Results of City Sustainable Transformation Projects in the Fields of Mobility and Energy Efficiency with Real Application in a District in Valladolid (Spain). Sustainability 2021, 13, 9683. [Google Scholar] [CrossRef]
- Parent, M.E.; El-Zein, M.; Rousseau, M.C.; Pintos, J.; Siemiatycki, J. Night work and the risk of cancer among men. Am. J. Epidemiol. 2012, 176, 751–759. [Google Scholar] [CrossRef] [PubMed]
- Kloog, I.; Haim, A.; Stevens, R.G.; Barchana, M.; Portnov, B.A. Light at Night Co-distributes with Incident Breast but not Lung Cancer in the Female Population of Israel. Chronobiol. Int. 2008, 25, 65–81. [Google Scholar] [CrossRef]
- Bauer, S.E.; Wagner, S.E.; Burch, J.; Bayakly, R.; Vena, J.E. A case-referent study: Light at night and breast cancer risk in Georgia. Int. J. Health Geogr. 2013, 12, 23. [Google Scholar] [CrossRef] [PubMed] [Green Version]
- Rybnikova, N.; Portnov, B.A. Population-level study links short-wavelength nighttime illumination with breast cancer incidence in a major metropolitan area. Chronobiol. Int. 2018, 35, 1198–1208. [Google Scholar] [CrossRef] [PubMed]
- Peña-García, A.; Hurtado, A.; Aguilar-Luzón, M.C. Impact of public lighting on pedestrians’ perception of safety and well-being. Saf. Sci. 2015, 78, 142–148. [Google Scholar] [CrossRef]
- Liu, M.; Liu, Y.; Liu, Y.; Jiao, W.; Liu, X.; Liu, H. Safety Percection Evaluation and Simulation Optimization of Road Lighting in Residentiai Areas. Zhaoming Gongcheng Xueba 2021, 32, 106–111, 152. [Google Scholar]
- Portnov, B.A.; Saad, R.; Trop, T.; Kliger, D.; Svechkina, A. Linking nighttime outdoor lighting attributes to pedestrians’ feeling of safety: An interactive survey approach. PLoS ONE 2020, 15, e0242172. [Google Scholar] [CrossRef]
- Levin, N.; Kyba, C.C.M.; Zhang, Q.; Sánchez de Miguel, A.; Román, M.O.; Li, X.; Portnov, B.A.; Molthan, A.L.; Jechow, A.; Miller, S.D.; et al. Remote sensing of night lights: A review and an outlook for the future. Remote Sens. Environ. 2020, 237, 111443. [Google Scholar] [CrossRef]
- Zhao, M.; Zhou, Y.; Li, X.; Cao, W.; He, C.; Yu, B.; Li, X.; Elvidge, C.D.; Cheng, W.; Zhou, C. Applications of Satellite Remote Sensing of Nighttime Light Observations: Advances, Challenges, and Perspectives. Remote Sens. 2019, 11, 1971. [Google Scholar] [CrossRef] [Green Version]
- Elvidge, C.D.; Baugh, K.E.; Kihn, E.A.; Kroehl, H.W.; Davis, E.R.; Davis, C.W. Relation between satellite observed visible-near infrared emissions, population, economic activity and electric power consumption. Int. J. Remote Sens. 1997, 18, 1373–1379. [Google Scholar] [CrossRef]
- Forbes, D.J. Multi-scale analysis of the relationship between economic statistics and DMSP-OLS night light images. GISci. Remote Sens. 2013, 50, 483–499. [Google Scholar] [CrossRef]
- Li, X.; Li, D. Can night-time light images play a role in evaluating the Syrian Crisis? Int. J. Remote Sens. 2014, 35, 6648–6661. [Google Scholar] [CrossRef]
- Yin, R.; He, G.; Jiang, W.; Peng, Y.; Zhang, Z.; Li, M.; Gong, C. Night-time Light Imagery Reveals Chinas City Activity during the COVID-19 Pandemic Period in Early 2020. IEEE J. Sel. Top. Appl. Earth Obs. Remote Sens. 2021, 14, 5111–5122. [Google Scholar] [CrossRef]
- Marchant, P. What Works? A Critical Note on the Evaluation of Crime Reduction Initiatives. Crime Prev. Community Saf. 2005, 7, 7–13. [Google Scholar] [CrossRef]
- Marchant, P.R. A Demonstration That the Claim That Brighter Lighting Reduces Crime Is Unfounded. Br. J. Criminol. 2004, 44, 441–447. [Google Scholar] [CrossRef]
- Steinbach, R.; Perkins, C.; Tompson, L.; Johnson, S.; Armstrong, B.; Green, J.; Grundy, C.; Wilkinson, P.; Edwards, P. The effect of reduced street lighting on road casualties and crime in England and Wales: Controlled interrupted time series analysis. J. Epidemiol. Community Health 2015, 69, 1118–1124. [Google Scholar] [CrossRef]
- Chalfin, A.; Kaplan, J.; LaForest, M. Street Light Outages, Public Safety and Crime Attraction. J. Quant. Criminol. 2021, 1–29. [Google Scholar] [CrossRef]
- Christopher, N.H.D.; Jan-Peter, M.; Christopher, D.E. Night-time Imagery as a Tool for Global Mapping of Socioeconomic Parameters and Greenhouse Gas Emissions. AMBIO A J. Hum. Environ. 2000, 29, 157–162. [Google Scholar]
- Deren, L. Towards the Development of Remote Sensing and GIS in the 21st Century. Geomat. Inf. Sci. Wuhan Univ. 2003, 28, 127–131. [Google Scholar]
- Jiang, W.; He, G.; Long, T.; Wang, C.; Ni, Y.; Ma, R. Assessing Light Pollution in China Based on Nighttime Light Imagery. Remote Sens. 2017, 9, 135. [Google Scholar] [CrossRef] [Green Version]
- Pauwels, J.; Le Viol, I.; Azam, C.; Valet, N.; Julien, J.F.; Bas, Y.; Lemarchand, C.; Sanchez de Miguel, A.; Kerbiriou, C. Accounting for artificial light impact on bat activity for a biodiversity-friendly urban planning. Landsc. Urban Plan. 2019, 183, 12–25. [Google Scholar] [CrossRef]
- Firebaugh, A.; Haynes, K.J. Light pollution may create demographic traps for nocturnal insects. Basic Appl. Ecol. 2019, 34, 118–125. [Google Scholar] [CrossRef]
- Jiang, W.; He, G.; Long, T.; Guo, H.; Yin, R.; Leng, W.; Liu, H.; Wang, G. Potentiality of Using Luojia 1-01 Nighttime Light Imagery to Investigate Artificial Light Pollution. Sensors 2018, 18, 2900. [Google Scholar] [CrossRef] [PubMed] [Green Version]
- Li, Z.; Zhu, J.; Huang, C. Comparison of Outdoor Light Environment Quality Evaluation Metliods. Zhaoming Gongcheng Xuebao 2018, 29, 113–118. [Google Scholar]
- Deng, Y.; Liu, S.; Cai, J.; Lu, X.; Nielsen, C.P. Spatial pattern and its evolution of Chinese provincial population: Methods and empirical study. J. Geogr. Sci. 2015, 25, 1507–1520. [Google Scholar] [CrossRef] [Green Version]
- Qi, Y.; Yang, Y.; Jin, F. China’s economic development stage and its spatio-temporal evolution: A prefectural-level analysis. J. Geogr. Sci. 2013, 23, 297–314. [Google Scholar] [CrossRef]
- Sánchez de Miguel, A.; Kyba, C.C.M.; Aubé, M.; Zamorano, J.; Cardiel, N.; Tapia, C.; Bennie, J.; Gaston, K.J. Colour remote sensing of the impact of artificial light at night (I): The potential of the International Space Station and other DSLR-based platforms. Remote Sens. Environ. 2019, 224, 92–103. [Google Scholar] [CrossRef]
- Sánchez de Miguel, A.; Zamorano, J.; Aubé, M.; Bennie, J.; Gallego, J.; Ocaña, F.; Pettit, D.R.; Stefanov, W.L.; Gaston, K.J. Colour remote sensing of the impact of artificial light at night (II): Calibration of DSLR-based images from the International Space Station. Remote Sens. Environ. 2021, 264, 112611. [Google Scholar] [CrossRef]
- Zheng, Q.; Weng, Q.; Huang, L.; Wang, K.; Deng, J.; Jiang, R.; Ye, Z.; Gan, M. A new source of multi-spectral high spatial resolution night-time light imagery—JL1-3B. Remote Sens. Environ. 2018, 215, 300–312. [Google Scholar] [CrossRef]
- Wei, S.; Jiao, W.; Long, T.; Liu, H.; Bi, L.; Jiang, W.; Portnov, B.A.; Liu, M. A Relative Radiation Normalization Method of ISS Nighttime Light Images Based on Pseudo Invariant Features. Remote Sens. 2020, 12, 3349. [Google Scholar] [CrossRef]
- Sánchez de Miguel, A. Variación Espacial, Temporal y Espectral de la Contaminación Lumínica y Sus Fuentes: Metodología y Resultados. Ph.D. Thesis, Universidad Complutense de Madrid, Madrid, Spain, 2016. [Google Scholar]
- Cheng, B.; Chen, Z.; Yu, B.; Li, Q.; Wang, C.; Li, B.; Wu, B.; Li, W.; Wu, J. Automated Extraction of Street Lights from JL1-3B Nighttime Light Data and Assessment of Their Solar Energy Potential. IEEE J. Sel. Top. Appl. Earth Obs. Remote Sens. 2020, 13, 675–684. [Google Scholar] [CrossRef]
- Jiao, W.; Long, T.; Ling, S.; He, G. Study on Modeling and Visualizing the Positional Uncertainty of Remote Sensing Image. ISPRS—Int. Arch. Photogramm. Remote Sens. Spat. Inf. Sci. 2016, XLI-B2, 305–312. [Google Scholar] [CrossRef] [Green Version]
- Portnov, B.A.; Saad, R.; Trop, T. Interactive Scenario-Based Assessment Approach of Urban Street Lighting and Its Application to Estimating Energy Saving Benefits. Energies 2021, 14, 378. [Google Scholar] [CrossRef]
- Kline, R.B. Principles and Practice of Structural Equation Modeling, 4th ed.; Guilford Press: New York, NY, USA, 2016. [Google Scholar]
- Davis, F.D.; Bagozzi, R.P.; Warshaw, P.R. User Acceptance of Computer Technology: A Comparison of Two Theoretical Models. Manag. Sci. 1989, 35, 982–1003. [Google Scholar] [CrossRef] [Green Version]
- Gunzler, D.D.; Perzynski, A.T.; Carle, A.C. Structural Equation Modeling for Health and Medicine, 1st ed.; CRC Press: New York, NY, USA, 2021. [Google Scholar]
- Guo, B.; Perron, B.E.; Gillespie, D.F. A Systematic Review of Structural Equation Modelling in Social Work Research. Br. J. Soc. Work 2009, 39, 1556. [Google Scholar] [CrossRef] [Green Version]
- Little, T.D.; Card, N.A.; Slegers, D.W.; Ledford, E.C. Representing Contextual Effects in Multiple-Group MACS Models; Modeling Contextual Effects in Longitudinal Studies: New York, NY, USA, 2007. [Google Scholar]
- Rigdon, E.E. Advanced Structural Equation Modeling: Issues and Techniques, 1st ed.; Psychology Press: New York, NY, USA, 1996. [Google Scholar]
- Jason, T.N. Longitudinal Structural Equation Modeling: A Comprehensive Introduction, 1st ed.; CRC Press: New York, NY, USA, 2015. [Google Scholar]
- Brown, T.A. Confirmatory Factor Analysis for Applied Research; The Guilford Press: New York, NY, USA; London, UK, 2006. [Google Scholar]
- Kelloway, E.K. Using Mplus for Structural Equation Modeling; Sage: Thousand Oaks, CA, USA, 2015. [Google Scholar]


| Items | Category | Frequency | Percentage |
|---|---|---|---|
| Gender | Male | 51 | 54.3 |
| Female | 43 | 45.7 | |
| Education | Doctor | 20 | 21.3 |
| Master | 54 | 57.4 | |
| Bachelor | 11 | 11.7 | |
| Junior College | 1 | 1.1 | |
| High School or Below | 8 | 8.5 | |
| Age | 18–30 | 68 | 72.3 |
| 31–40 | 12 | 12.8 | |
| 41–50 | 6 | 6.4 | |
| Over 51 | 8 | 8.5 | |
| Total | 94 | 100.0 |
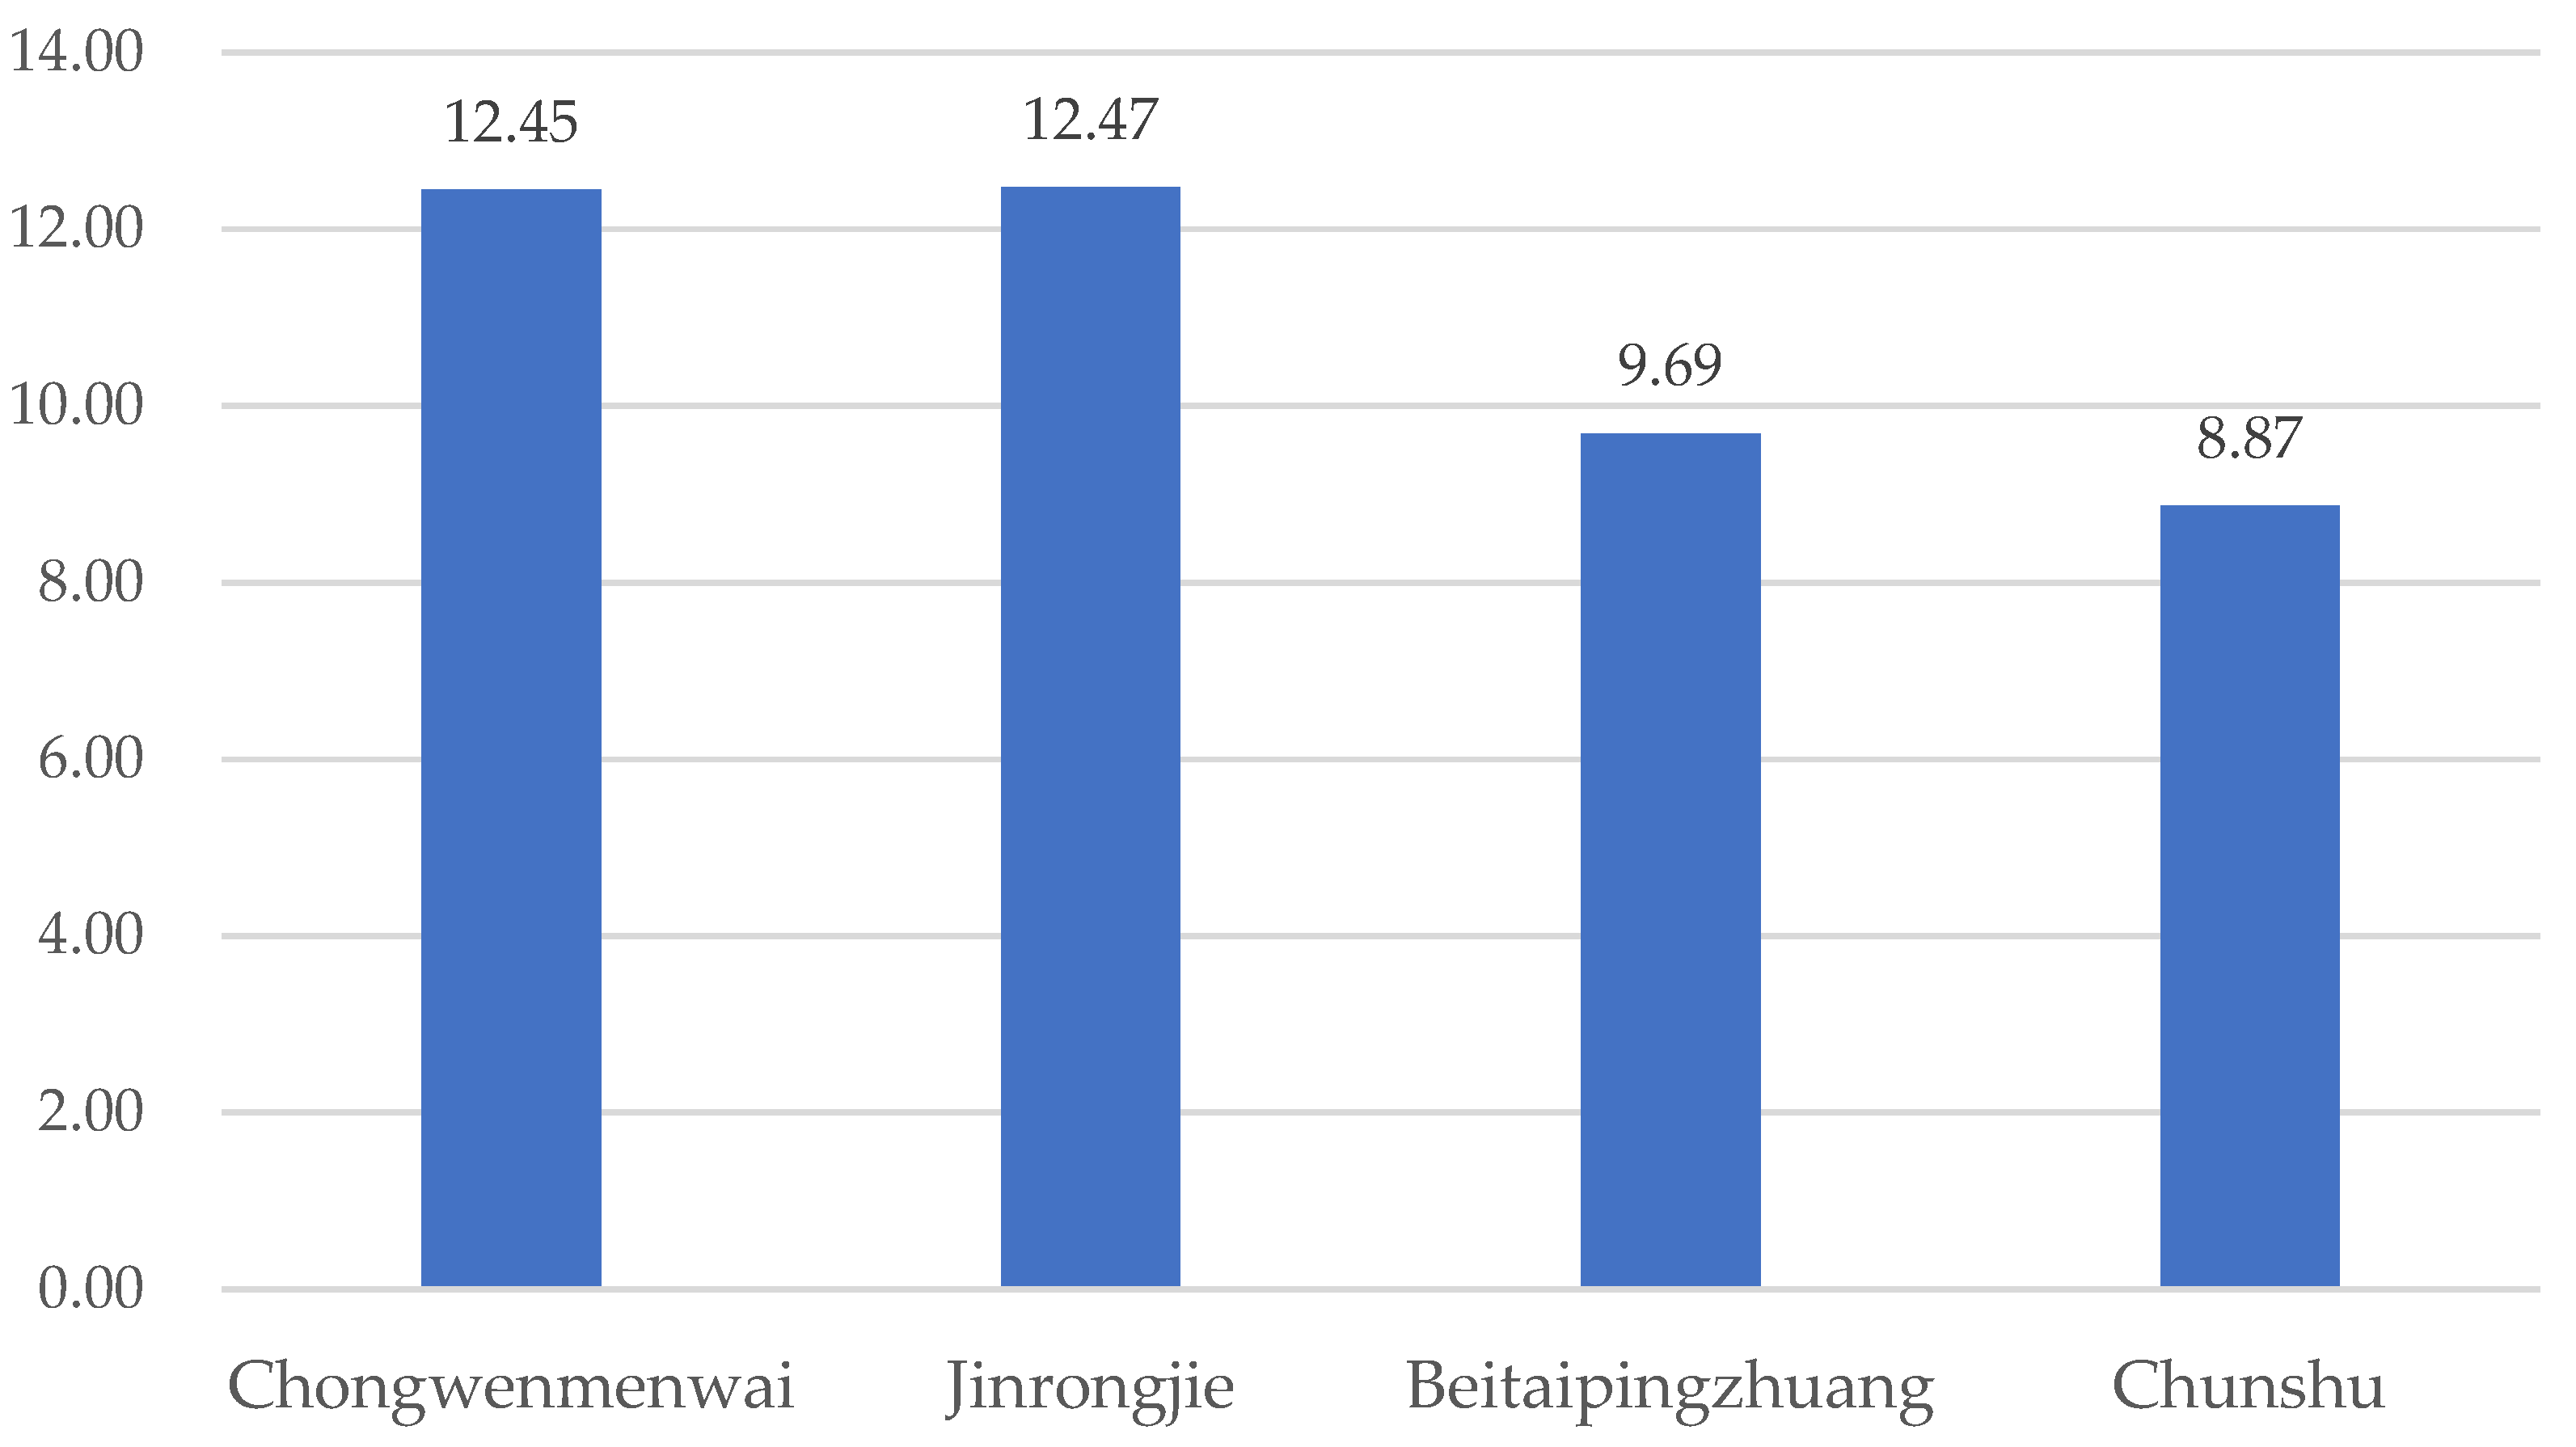
| Items | Chongwenmenwai | Jinrongjie Street | Beitaipingzhuang | Chunshu | |
|---|---|---|---|---|---|
| Total feeling of security | 2.18 | 2.15 | 1.36 | 1.07 | |
| Influence degree of parameter to feelings of comfort | Light Intensity | 1.95 | 2.08 | 2.00 | 2.11 |
| Color temperature | 1.45 | 1.08 | 1.24 | 1.22 | |
| Uniform | 1.77 | 1.50 | 1.48 | 1.48 | |
| Glare | 1.41 | 1.31 | 1.24 | 1.41 | |
| Influence degree of parameter to feelings of security | Light Intensity | 2.32 | 2.08 | 2.28 | 2.30 |
| Color temperature | 1.27 | 1.27 | 1.28 | 1.11 | |
| Uniform | 1.73 | 1.58 | 1.56 | 1.70 | |
| Glare | 1.00 | 1.15 | 1.16 | 1.22 | |
| Estimate | Standard Error (S.E.) | Est./S.E. | p-Value | |
|---|---|---|---|---|
| Uniformity BY | ||||
| Uni | 1.000 | 0.000 | 999.000 | 999.000 |
| Un1 | 0.279 | 0.231 | 1.207 | 0.227 |
| Un2 | 0.067 | 0.101 | 0.662 | 0.508 |
| Security BY | ||||
| Sec | 1.000 | 0.000 | 999.000 | 999.000 |
| S1 | 0.524 | 0.151 | 3.473 | 0.001 |
| S2 | 1.044 | 0.193 | 5.405 | 0.000 |
| S3 | 0.991 | 0.170 | 5.822 | 0.000 |
| Temperature BY | ||||
| Tem | 1.000 | 0.000 | 999.000 | 999.000 |
| T1 | 1.019 | 0.134 | 7.577 | 0.000 |
| T2 | 0.520 | 0.071 | 7.350 | 0.000 |
| Comfort BY | ||||
| Com | 1.000 | 0.000 | 999.000 | 999.000 |
| C1 | 1.525 | 0.093 | 16.477 | 0.000 |
| C2 | 0.541 | 0.070 | 7.772 | 0.000 |
| Security ON | ||||
| Uniformity | 0.605 | 0.339 | 1.785 | 0.074 |
| Temperature | 0.419 | 0.476 | 0.881 | 0.379 |
| Comfort ON | ||||
| Uniformity | −0.032 | 0.046 | −0.693 | 0.489 |
| Temperature | −0.043 | 0.074 | −0.576 | 0.565 |
| Security | 0.731 | 0.064 | 11.385 | 0.000 |
| Temperature WITH | ||||
| Uniformity | 0.028 | 0.009 | 3.190 | 0.001 |
| Estimate | Standard Error (S.E.) | Est./S.E. | p-Value | |
|---|---|---|---|---|
| Security BY | ||||
| Sec | 1.000 | 0.000 | 999.000 | 999.000 |
| S1 | 0.499 | 0.150 | 3.327 | 0.001 |
| S2 | 1.031 | 0.191 | 5.399 | 0.000 |
| S3 | 0.999 | 0.166 | 6.021 | 0.000 |
| Uni | 0.831 | 0.047 | 17.672 | 0.000 |
| Temperature BY | ||||
| Tem | 1.000 | 0.000 | 999.000 | 999.000 |
| T1 | 1.019 | 0.134 | 7.582 | 0.000 |
| T2 | 0.518 | 0.071 | 7.327 | 0.000 |
| Comfort BY | ||||
| Com | 1.000 | 0.000 | 999.000 | 999.000 |
| C1 | 1.515 | 0.092 | 16.512 | 0.000 |
| C2 | 0.537 | 0.069 | 7.750 | 0.000 |
| Security ON | ||||
| Temperature | 1.197 | 0.366 | 3.265 | 0.001 |
| Comfort ON | ||||
| Security | 0.683 | 0.032 | 21.372 | 0.000 |
| Route | Component Variance Contribution Rate | ||
|---|---|---|---|
| 1 | 2 | 3 | |
| Chongwenmenwai street | 49.135 | 34.520 | -- |
| Jinrongjie street | 44.646 | 23.091 | 18.841 |
| Beitaipingzhuang street | 40.074 | 29.451 | 16.590 |
| Chunshu street | 42.470 | 27.287 | 13.527 |
| Items | Chongwenmenwai | Jinrongjie Street | Beitaipingzhuang | Chunshu | ||||||||
|---|---|---|---|---|---|---|---|---|---|---|---|---|
| 1 | 2 | 1 | 2 | 3 | 1 | 2 | 3 | 1 | 2 | 3 | ||
| Measurement data | Ev | 0.118 | −0.267 | −0.053 | −0.097 | 0.486 | 0.147 | −0.451 | 0.236 | 0.004 | −0.197 | 0.508 |
| x | −0.020 | 0.287 | −0.152 | 0.460 | 0.077 | −0.123 | 0.339 | 0.131 | −0.082 | 0.356 | 0.087 | |
| y | −0.005 | 0.276 | 0.115 | 0.308 | −0.204 | −0.062 | 0.290 | 0.133 | 0.010 | 0.314 | −0.098 | |
| glare index | 0.156 | 0.022 | −0.214 | 0.001 | 0.679 | 0.044 | −0.135 | 0.620 | −0.117 | 0.115 | 0.679 | |
| Public perception survey data | Illumination | 0.199 | −0.034 | 0.179 | 0.002 | 0.046 | 0.229 | −0.013 | −0.032 | 0.208 | −0.041 | 0.105 |
| Color temperature | 0.031 | 0.250 | −0.037 | 0.381 | −0.031 | 0.302 | −0.256 | 0.258 | 0.003 | 0.296 | 0.086 | |
| Uniformity | 0.201 | −0.028 | 0.226 | −0.007 | −0.072 | 0.260 | −0.095 | 0.103 | 0.223 | 0.065 | −0.173 | |
| Glare perception | 0.123 | 0.045 | 0.320 | −0.110 | −0.238 | 0.214 | −0.120 | −0.276 | 0.237 | −0.080 | −0.157 | |
| Feeling of security | 0.201 | −0.024 | 0.207 | −0.035 | −0.002 | 0.152 | 0.116 | −0.138 | 0.232 | −0.031 | 0.013 | |
| Feeling of comfort | 0.197 | −0.081 | 0.192 | 0.052 | −0.022 | 0.182 | 0.074 | −0.157 | 0.207 | 0.022 | 0.005 | |
Publisher’s Note: MDPI stays neutral with regard to jurisdictional claims in published maps and institutional affiliations. |
© 2022 by the authors. Licensee MDPI, Basel, Switzerland. This article is an open access article distributed under the terms and conditions of the Creative Commons Attribution (CC BY) license (https://creativecommons.org/licenses/by/4.0/).
Share and Cite
Wei, S.; Jiao, W.; Liu, H.; Long, T.; Liu, Y.; Ji, P.; Hou, R.; Zhang, N.; Xiao, Y. Research on Comfort Evaluation Model of Urban Residents’ Public Space Lighting Integrating Public Perception and Nighttime Light Remote Sensing Data. Remote Sens. 2022, 14, 655. https://doi.org/10.3390/rs14030655
Wei S, Jiao W, Liu H, Long T, Liu Y, Ji P, Hou R, Zhang N, Xiao Y. Research on Comfort Evaluation Model of Urban Residents’ Public Space Lighting Integrating Public Perception and Nighttime Light Remote Sensing Data. Remote Sensing. 2022; 14(3):655. https://doi.org/10.3390/rs14030655
Chicago/Turabian StyleWei, Shengrong, Weili Jiao, Huichan Liu, Tengfei Long, Yongkun Liu, Ping Ji, Ruixia Hou, Naijing Zhang, and Yundan Xiao. 2022. "Research on Comfort Evaluation Model of Urban Residents’ Public Space Lighting Integrating Public Perception and Nighttime Light Remote Sensing Data" Remote Sensing 14, no. 3: 655. https://doi.org/10.3390/rs14030655
APA StyleWei, S., Jiao, W., Liu, H., Long, T., Liu, Y., Ji, P., Hou, R., Zhang, N., & Xiao, Y. (2022). Research on Comfort Evaluation Model of Urban Residents’ Public Space Lighting Integrating Public Perception and Nighttime Light Remote Sensing Data. Remote Sensing, 14(3), 655. https://doi.org/10.3390/rs14030655