
3D Sensor Based Pedestrian Detection by Integrating Improved HHA Encoding and Two-Branch Feature Fusion


Abstract
:1. Introduction
- We design an RGB-D data based pedestrian detection network which achieves the state-of-the-art detection performance on KITTI and EPFL datasets.
- We improve the HHA encoding method, which is twice as fast and can extract the full ground parameters. Moreover, the detection performance outperforms other encoding methods.
- We propose two new modules, i.e., TFFEM and ACCF, in the deep network, which can learn rich multimodal features.
2. Related Work
2.1. Single Modal Based Pedestrian Detection
2.1.1. Depth Image Based Approaches
2.1.2. RGB Image Based Approaches
2.2. Multi-Modal Based Pedestrian Detection
3. Proposed Method
3.1. Improved HHA Encoding
3.1.1. Vanilla HHA
3.1.2. Shortcoming Analysis of Vanilla HHA
3.1.3. Improved Gravity Direction Estimation
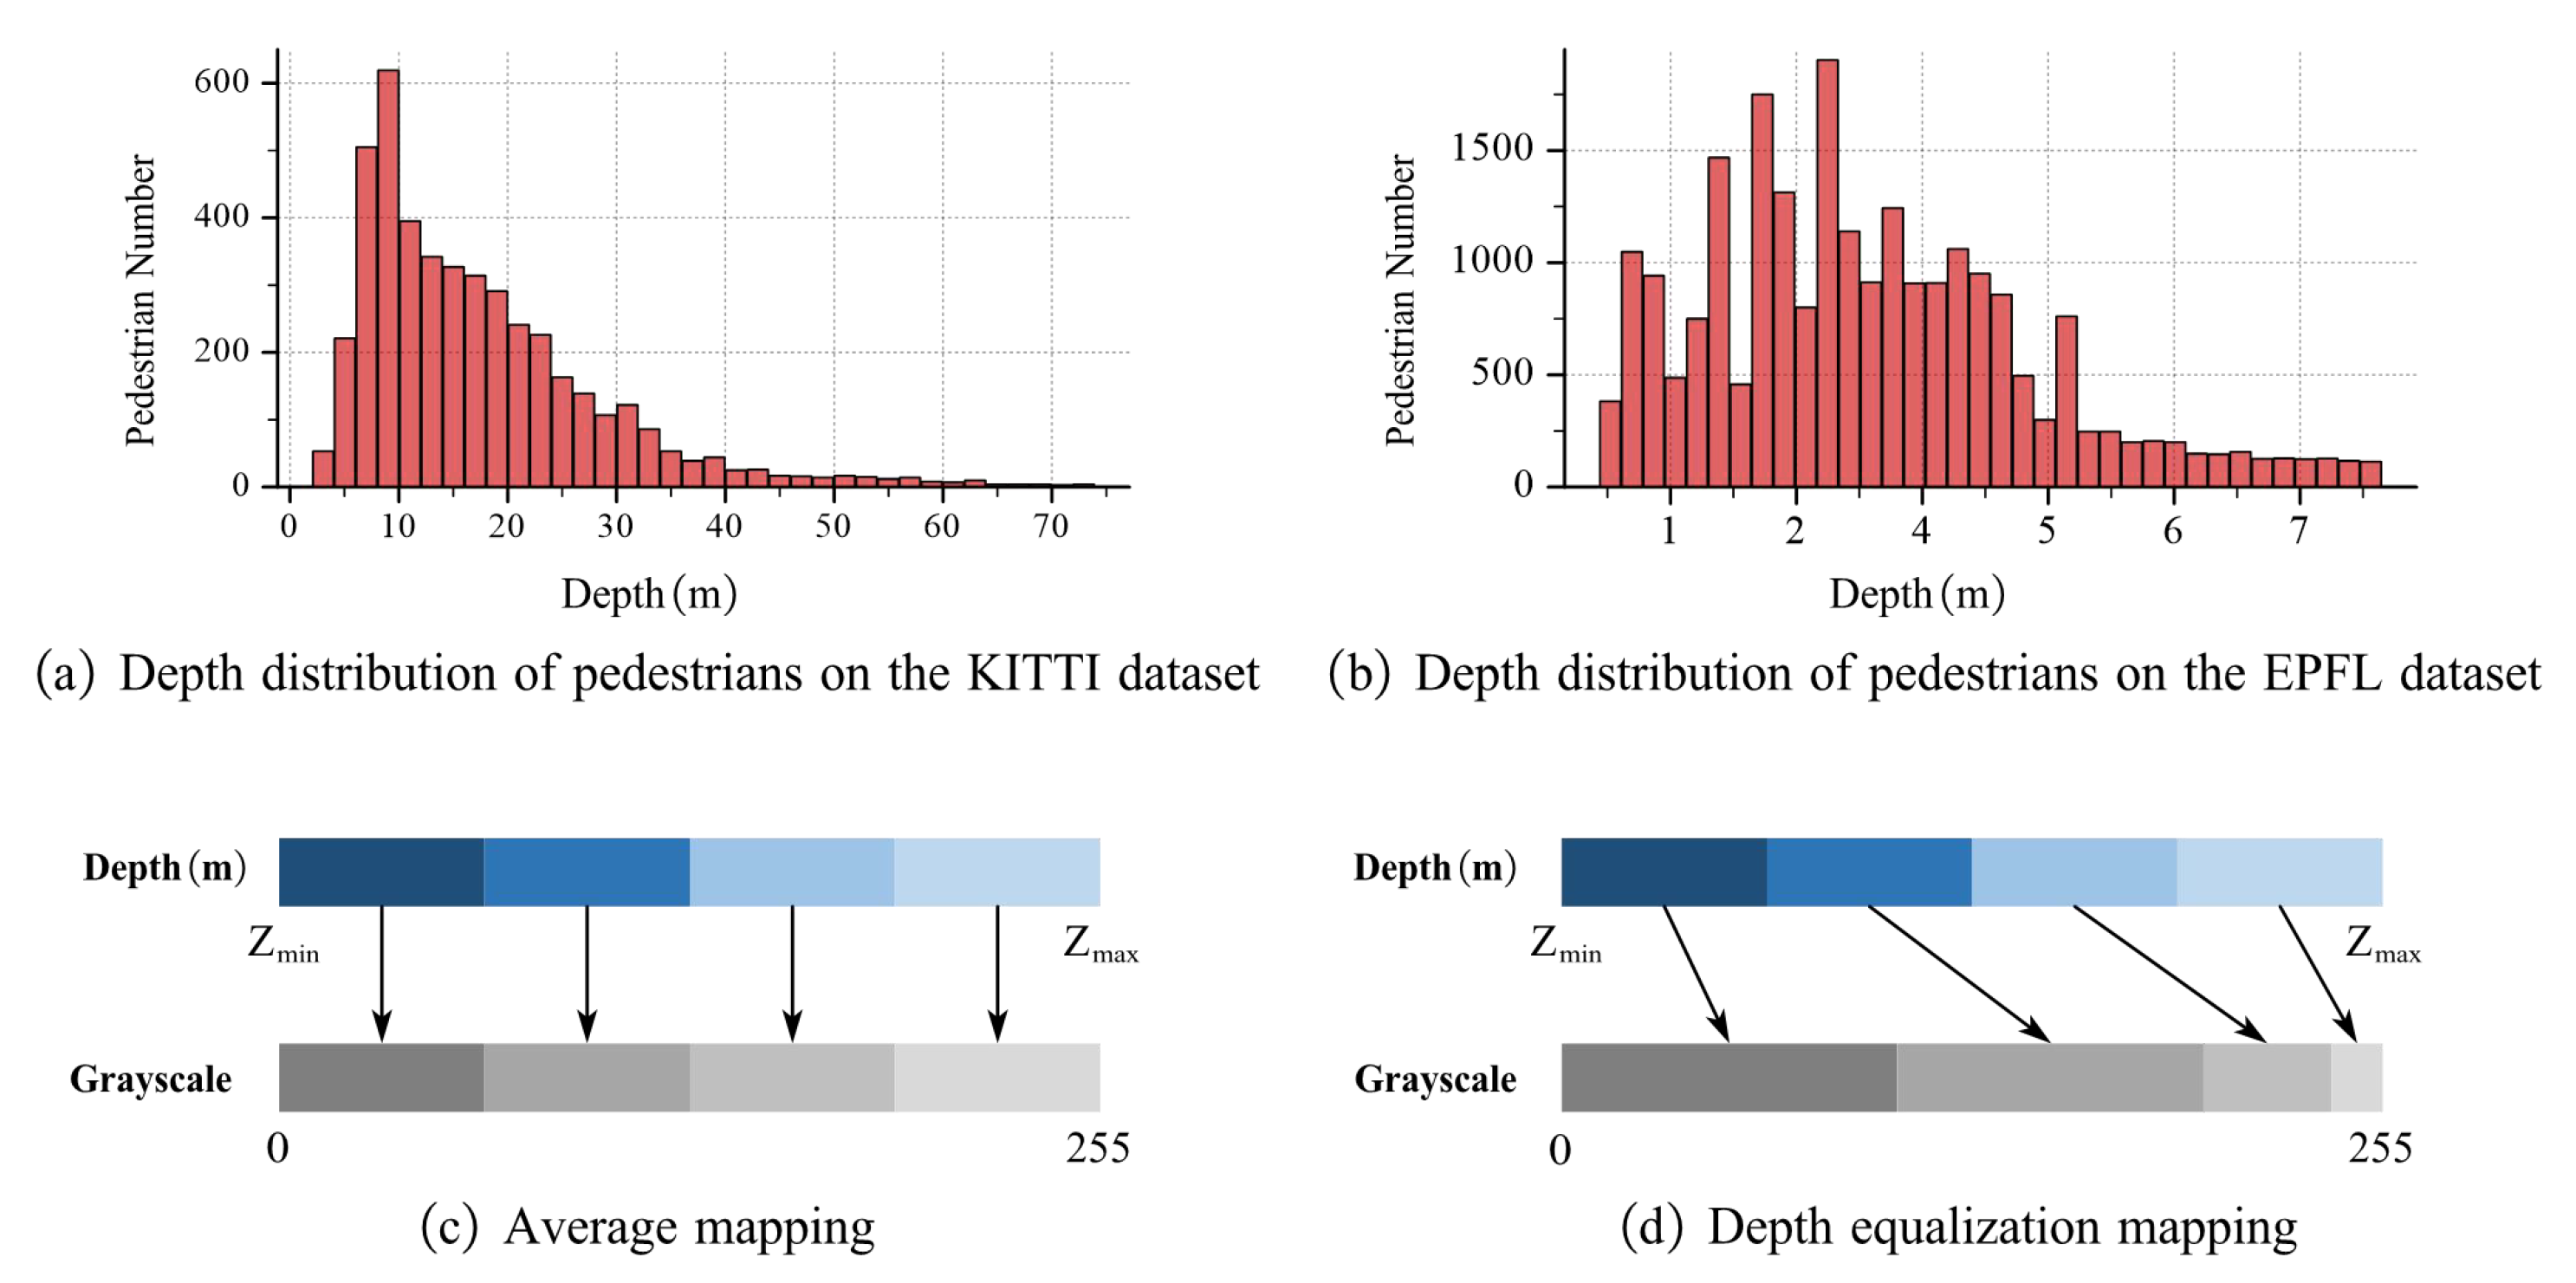
3.1.4. Improved Depth Value Mapping
3.2. Two-Branch Pedestrian Detection Network
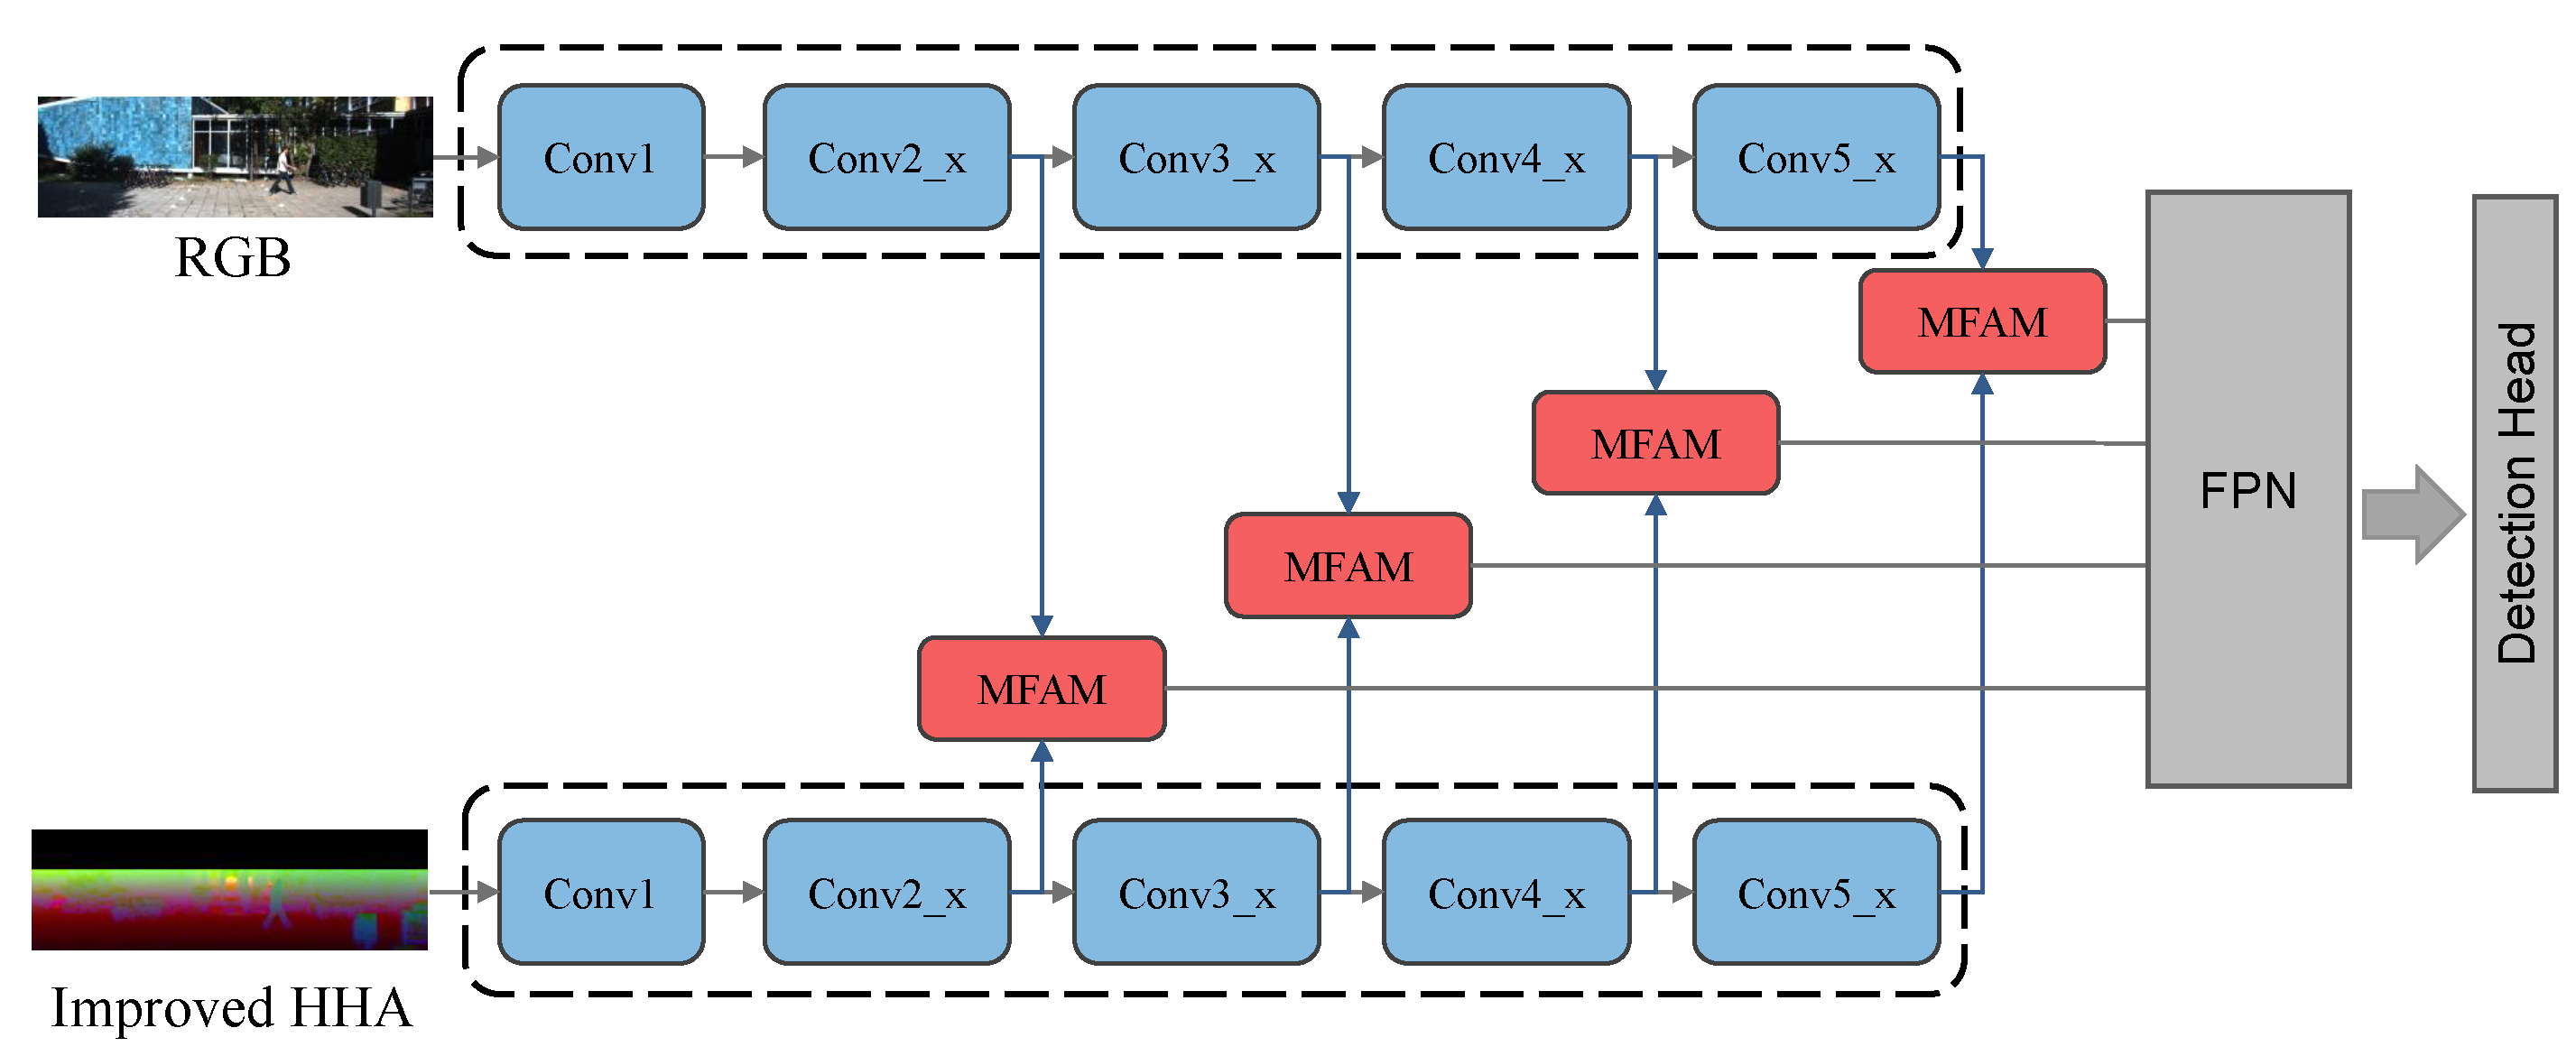
3.2.1. Network Overview
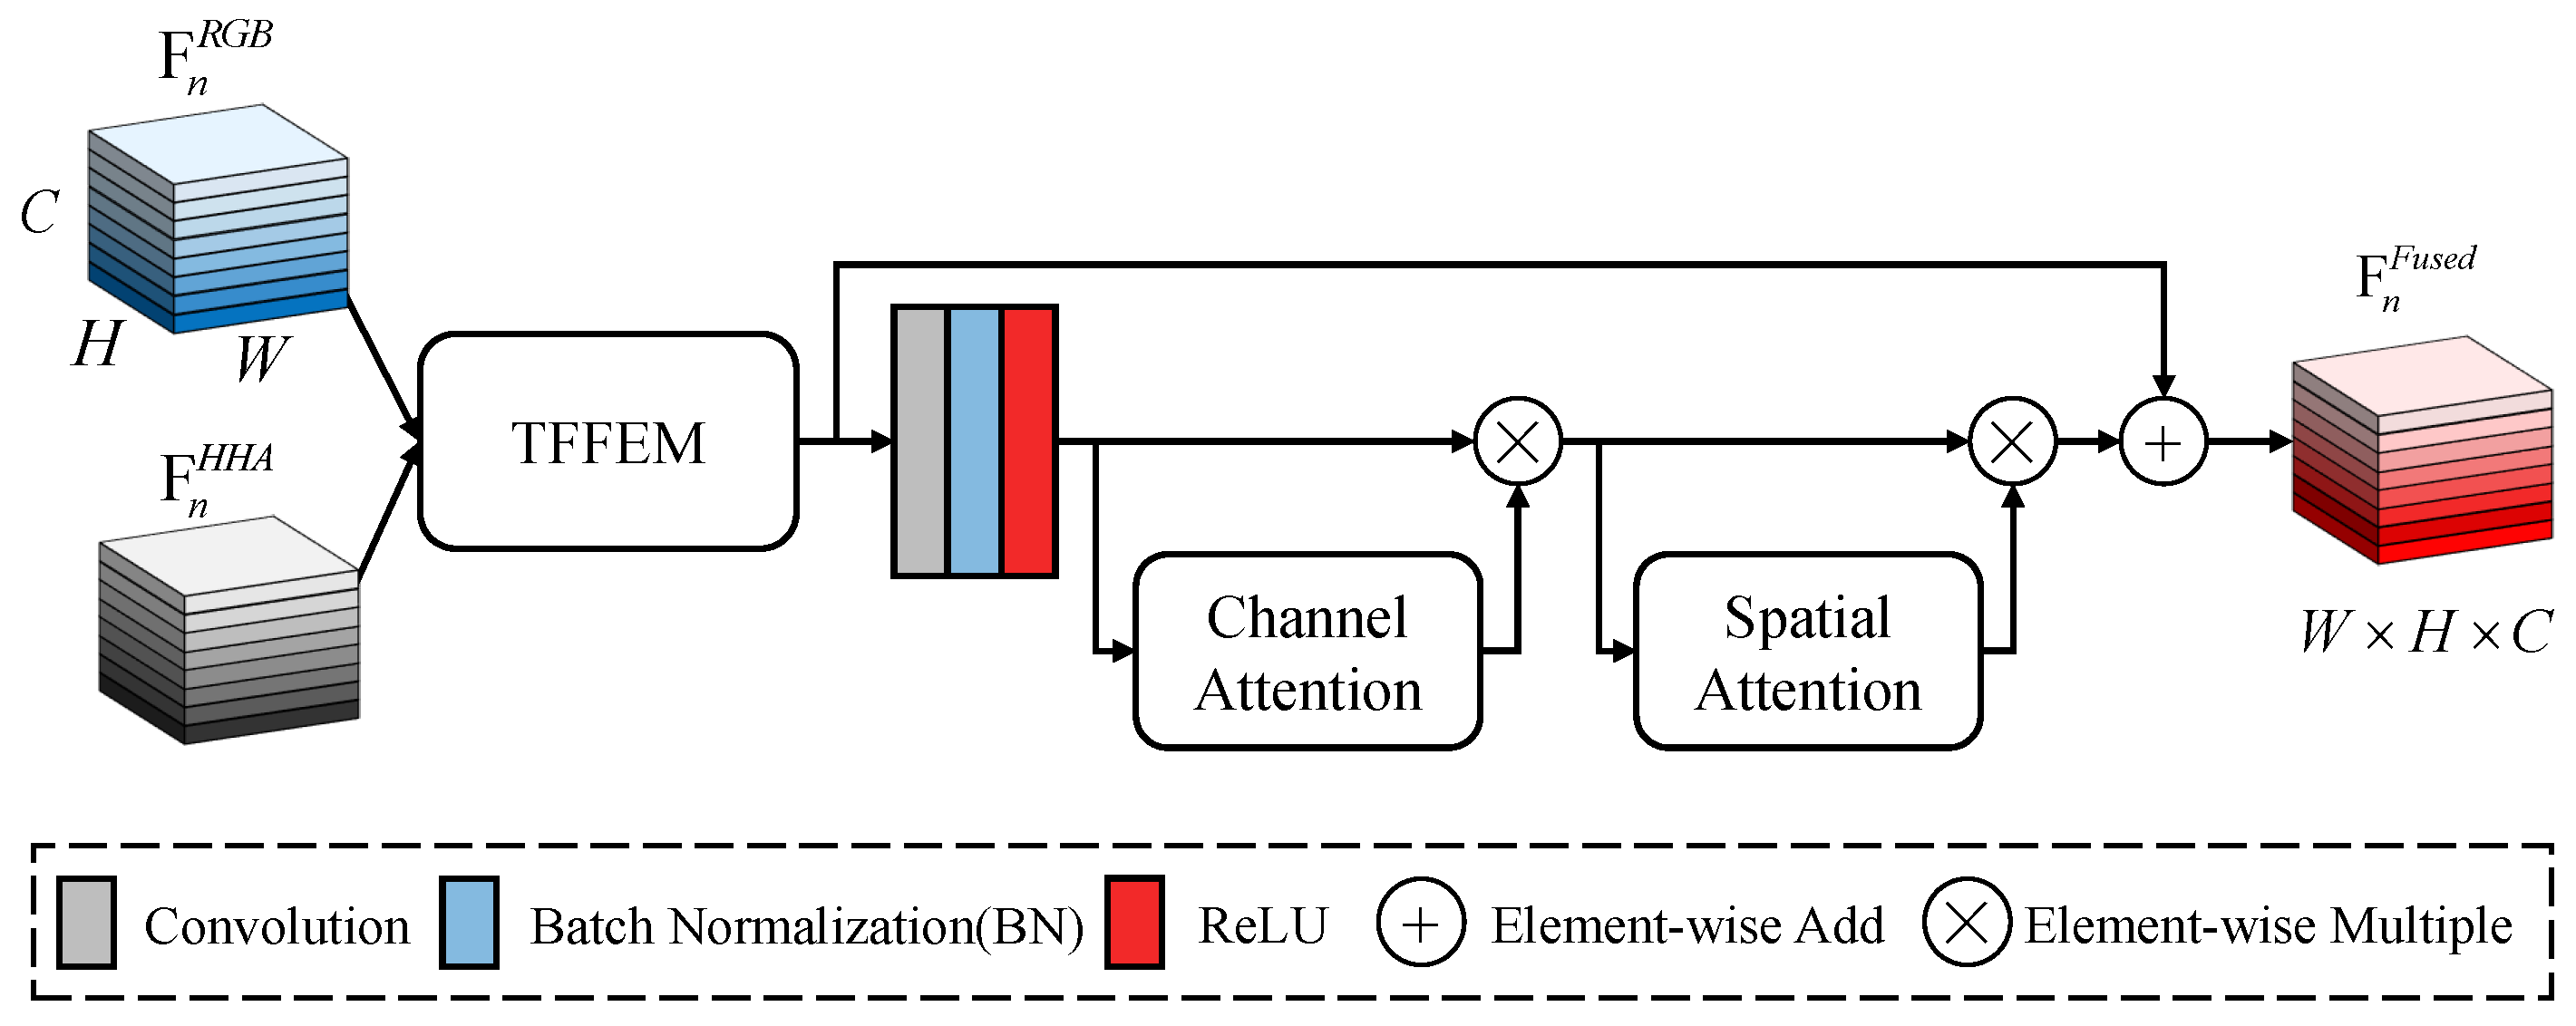
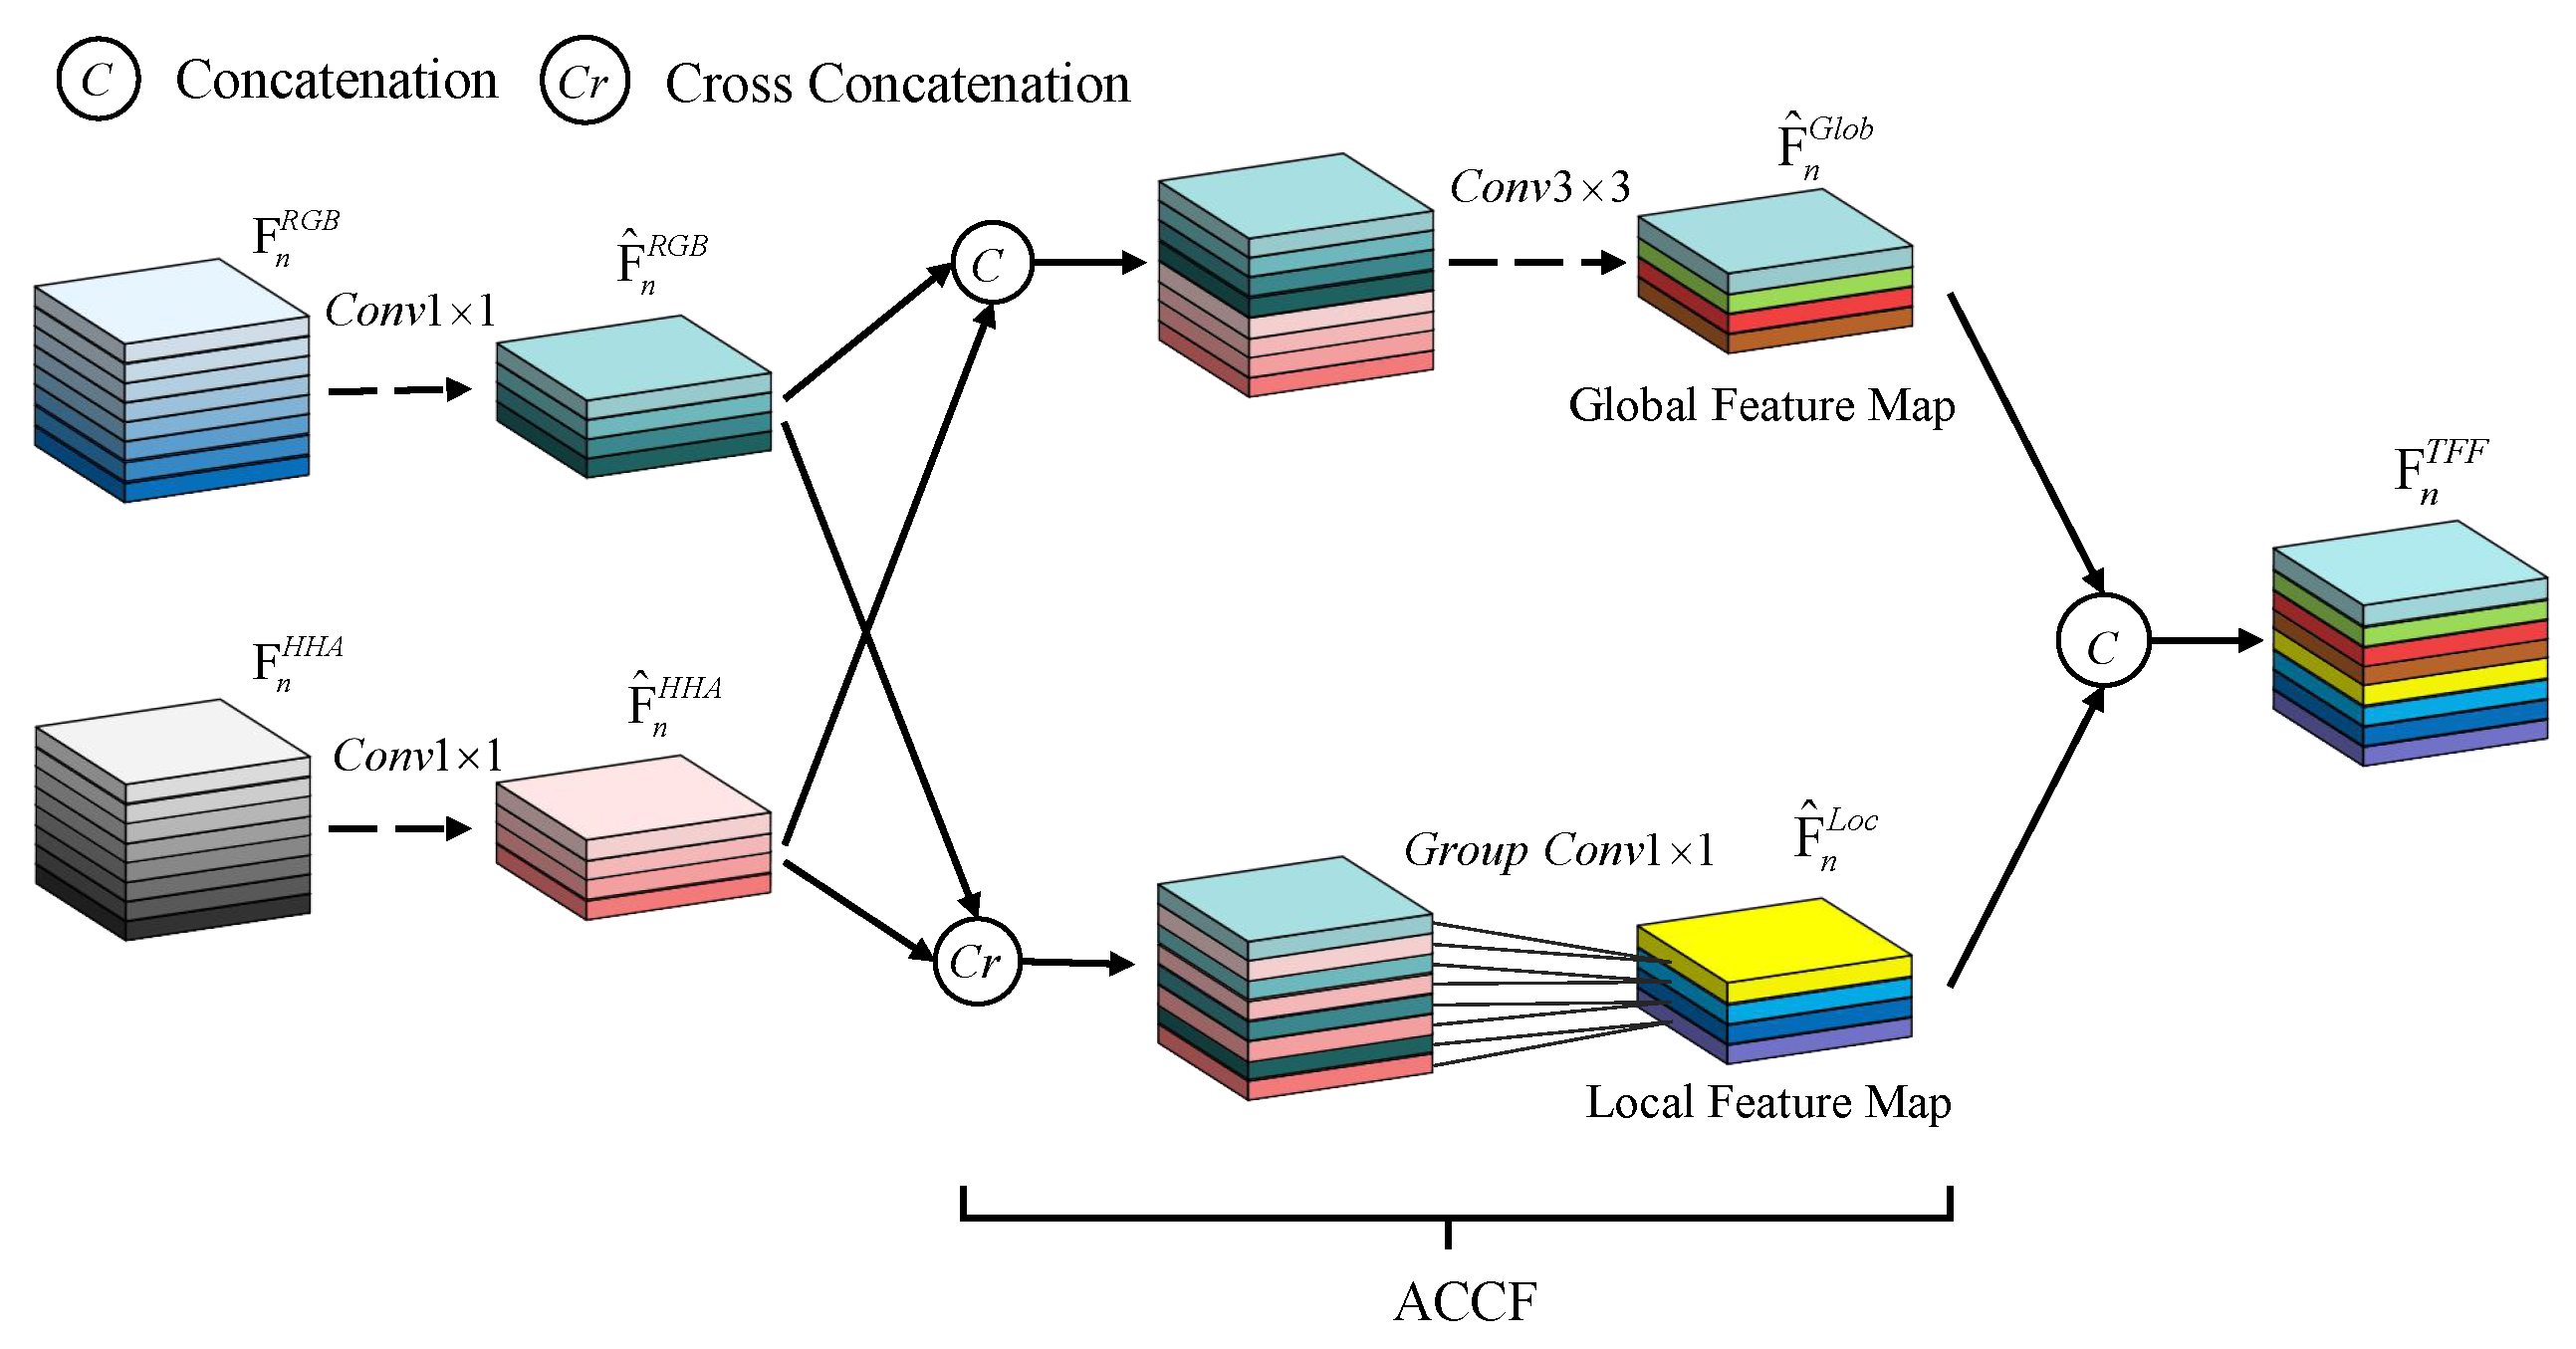
3.2.2. Two-Branch Feature Fusion Extraction Module
3.2.3. Attention Module
4. Experiments
4.1. Evaluation of Pedestrian Detection on KITTI Dataset
4.1.1. The Dataset and Evaluation Metrics
4.1.2. Implementation Detail
4.1.3. Comparison with State-of-the-Art Approaches
4.2. Evaluation of Pedestrian Detection on the EPFL Dataset
4.2.1. The Dataset and Evaluation Metrics
4.2.2. Comparison with State-of-the-Art Approaches
4.3. Evaluation of Improved HHA Encoding
4.3.1. Datasets and Evaluation Metrics
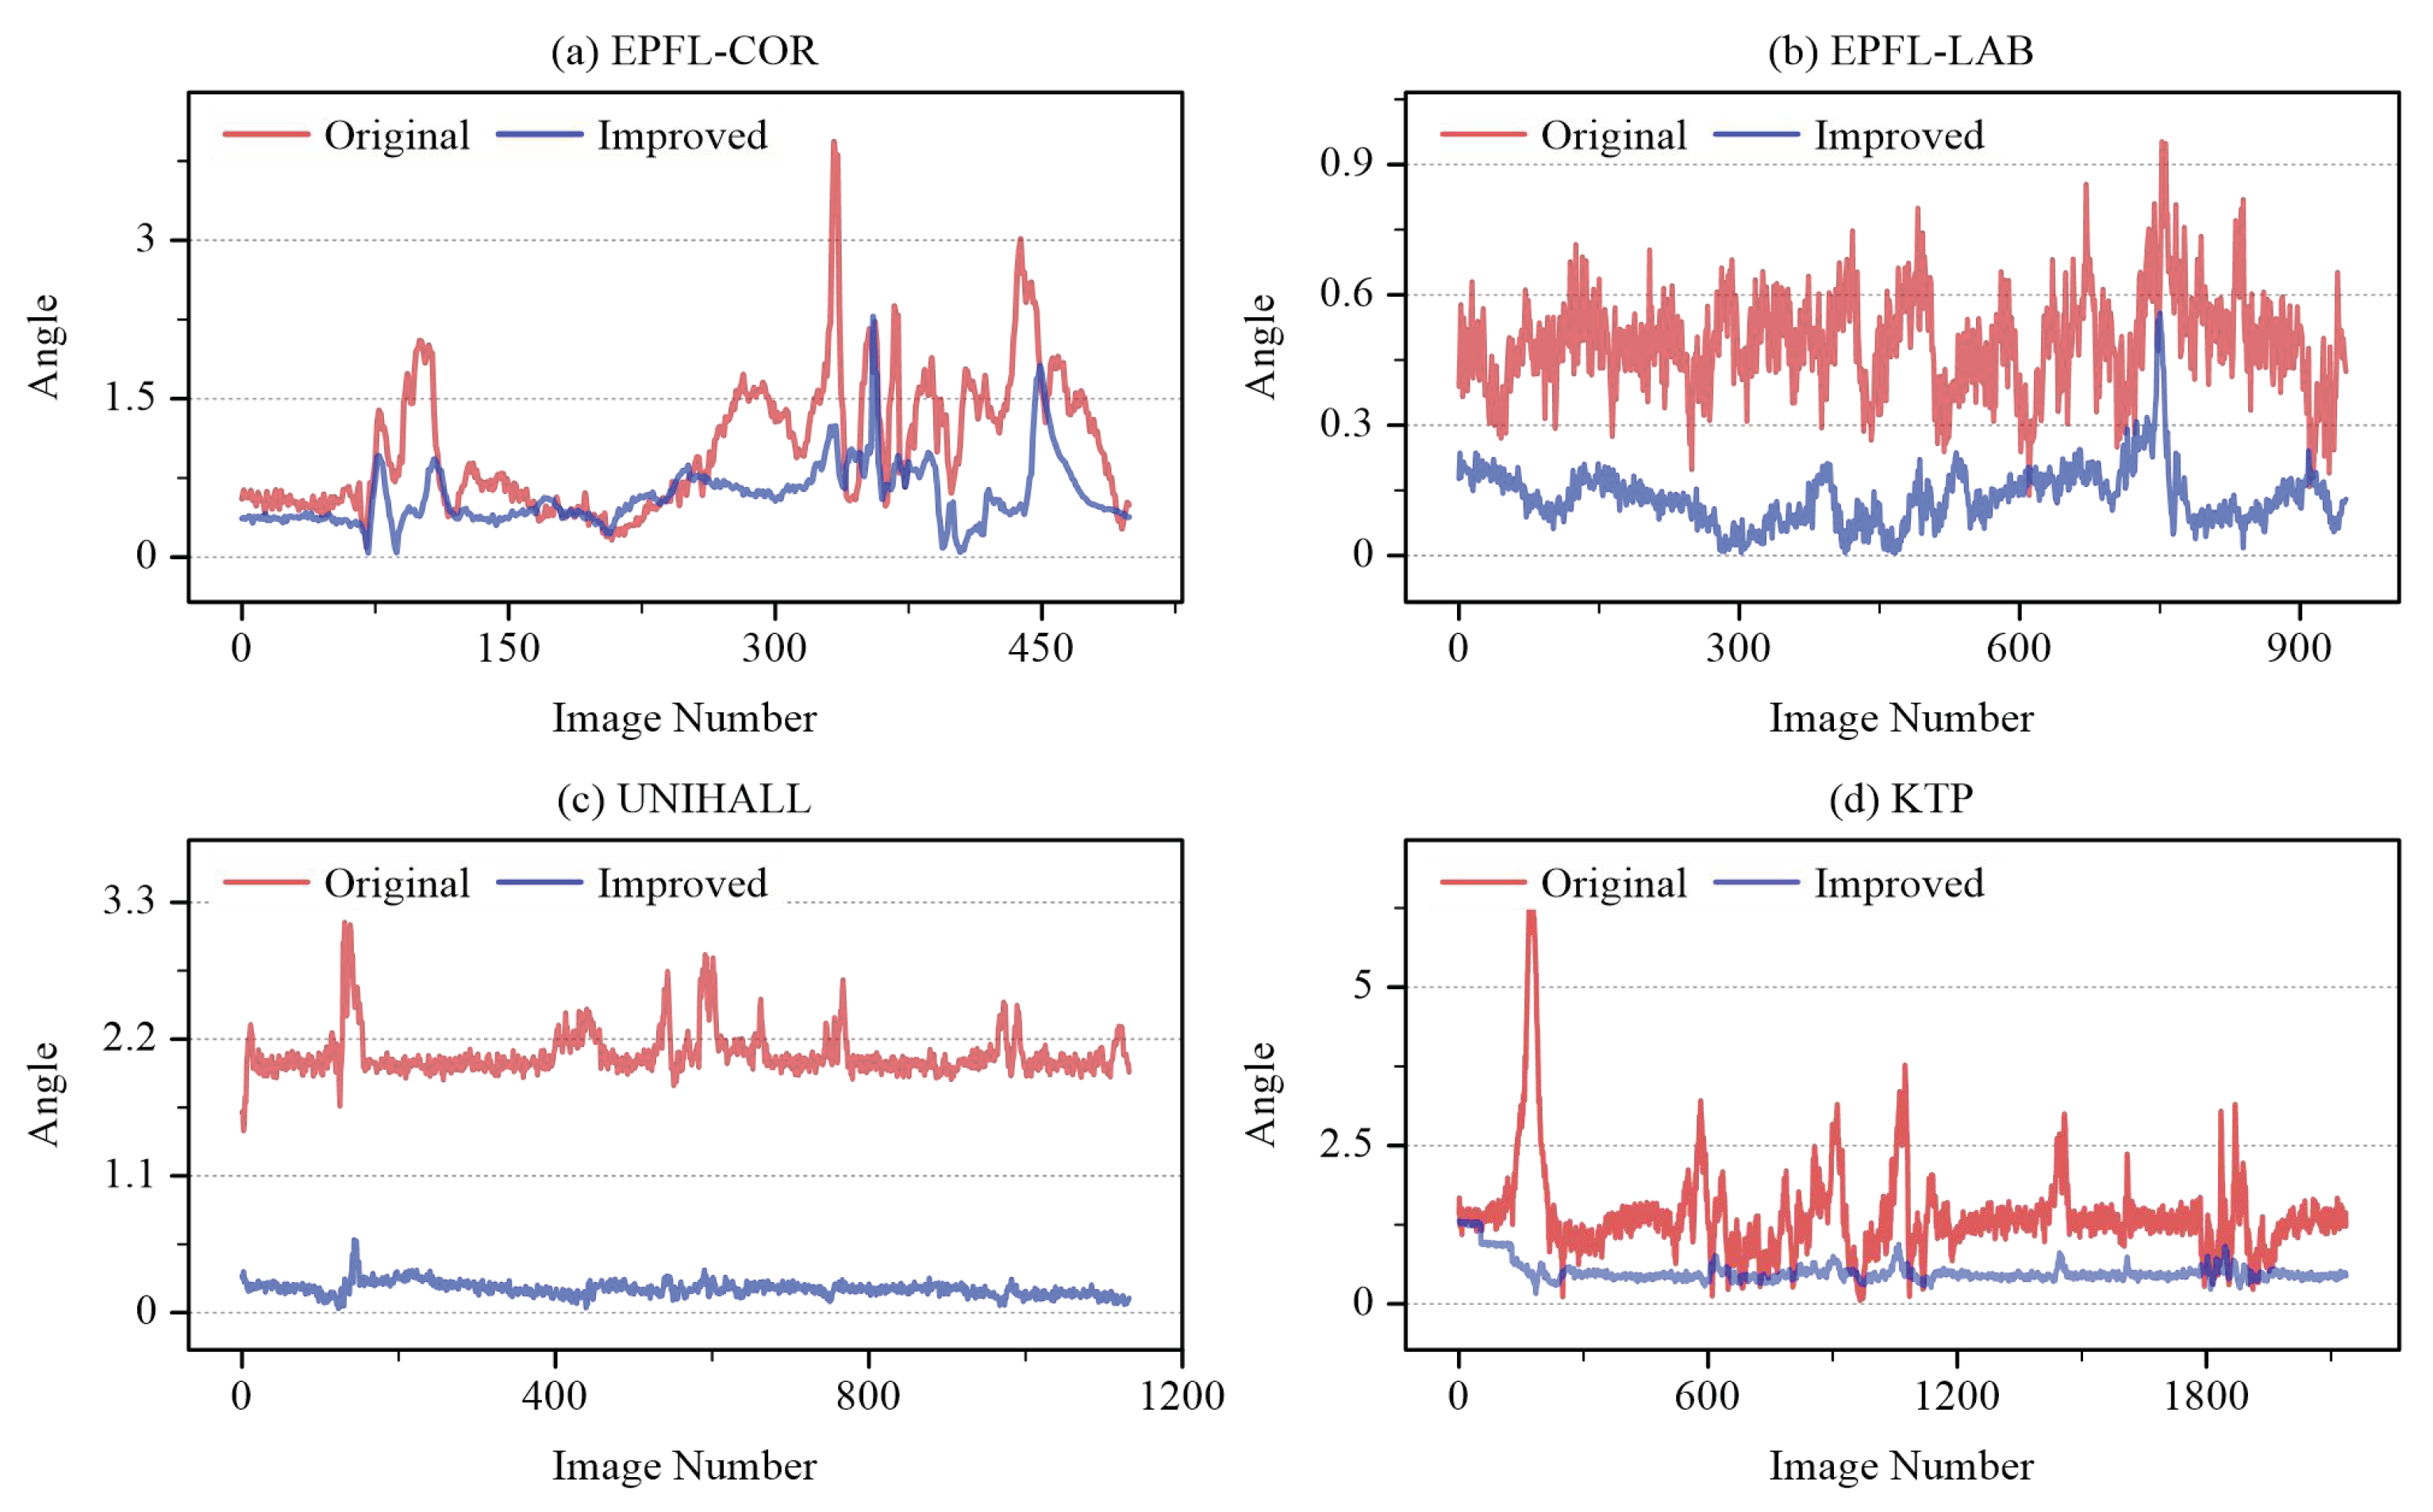
4.3.2. Comparison of Gravity Direction Estimation
4.3.3. Comparison of Encoding Speed
4.4. Ablation Study
4.4.1. Study on Different Depth Encoding Methods
4.4.2. Study on Different Fusion Methods
5. Discussion
6. Conclusions
Author Contributions
Funding
Institutional Review Board Statement
Informed Consent Statement
Data Availability Statement
Conflicts of Interest
References
- Ophoff, T.; Van Beeck, K.; Goedemé, T. Exploring RGB+ Depth fusion for real-time object detection. Sensors 2019, 19, 866. [Google Scholar] [CrossRef] [Green Version]
- Zhang, W.; Wang, J.; Guo, X.; Chen, K.; Wang, N. Two-Stream RGB-D Human Detection Algorithm Based on RFB Network. IEEE Access 2020, 8, 123175–123181. [Google Scholar] [CrossRef]
- Linder, T.; Pfeiffer, K.Y.; Vaskevicius, N.; Schirmer, R.; Arras, K.O. Accurate detection and 3D localization of humans using a novel YOLO-based RGB-D fusion approach and synthetic training data. In Proceedings of the 2020 IEEE International Conference on Robotics and Automation (ICRA), Paris, France, 31 May–31 August 2020; IEEE: Piscataway, NJ, USA, 2020; pp. 1000–1006. [Google Scholar]
- Zhang, W.; Guo, X.; Wang, J.; Wang, N.; Chen, K. Asymmetric Adaptive Fusion in a Two-Stream Network for RGB-D Human Detection. Sensors 2021, 21, 916. [Google Scholar] [CrossRef] [PubMed]
- Guo, Z.; Liao, W.; Xiao, Y.; Veelaert, P.; Philips, W. Weak Segmentation Supervised Deep Neural Networks for Pedestrian Detection. Pattern Recognit. 2021, 119, 108063. [Google Scholar] [CrossRef]
- Nebiker, S.; Meyer, J.; Blaser, S.; Ammann, M.; Rhyner, S. Outdoor Mobile Mapping and AI-Based 3D Object Detection with Low-Cost RGB-D Cameras: The Use Case of On-Street Parking Statistics. Remote Sens. 2021, 13, 3099. [Google Scholar] [CrossRef]
- Gupta, S.; Girshick, R.; Arbeláez, P.; Malik, J. Learning rich features from RGB-D images for object detection and segmentation. In Proceedings of the European Conference on Computer Vision, Zurich, Switzerland, 6–12 September 2014; Springer: Berlin/Heidelberg, Germany, 2014; pp. 345–360. [Google Scholar]
- Cao, J.; Leng, H.; Lischinski, D.; Cohen-Or, D.; Tu, C.; Li, Y. ShapeConv: Shape-aware Convolutional Layer for Indoor RGB-D Semantic Segmentation. In Proceedings of the IEEE/CVF International Conference on Computer Vision, Nashville, TN, USA, 20–25 June 2021; pp. 7088–7097. [Google Scholar]
- Ferreri, A.; Bucci, S.; Tommasi, T. Multi-Modal RGB-D Scene Recognition across Domains. In Proceedings of the IEEE/CVF International Conference on Computer Vision, Nashville, TN, USA, 20–25 June 2021; pp. 2199–2208. [Google Scholar]
- Huang, Z.; Chen, H.X.; Zhou, T.; Yang, Y.Z.; Liu, B.Y. Multi-level cross-modal interaction network for RGB-D salient object detection. Neurocomputing 2021, 452, 200–211. [Google Scholar] [CrossRef]
- Eitel, A.; Springenberg, J.T.; Spinello, L.; Riedmiller, M.; Burgard, W. Multimodal deep learning for robust RGB-D object recognition. In Proceedings of the 2015 IEEE/RSJ International Conference on Intelligent Robots and Systems (IROS), Hamburg, Germany, 28 September–3 October 2015; pp. 681–687. [Google Scholar] [CrossRef] [Green Version]
- Ren, X.; Du, S.; Zheng, Y. Parallel RCNN: A deep learning method for people detection using RGB-D images. In Proceedings of the 2017 10th International Congress on Image and Signal Processing, BioMedical Engineering and Informatics (CISP-BMEI), Shanghai, China, 14–16 October 2017; IEEE: Piscataway, NJ, USA, 2017; pp. 1–6. [Google Scholar]
- Zhang, Q.; Xiao, T.; Huang, N.; Zhang, D.; Han, J. Revisiting feature fusion for rgb-t salient object detection. IEEE Trans. Circuits Syst. Video Technol. 2020, 31, 1804–1818. [Google Scholar] [CrossRef]
- Zhang, Q.; Zhao, S.; Luo, Y.; Zhang, D.; Huang, N.; Han, J. ABMDRNet: Adaptive-weighted Bi-directional Modality Difference Reduction Network for RGB-T Semantic Segmentation. In Proceedings of the IEEE/CVF Conference on Computer Vision and Pattern Recognition, Nashville, TN, USA, 20–25 June 2021; pp. 2633–2642. [Google Scholar]
- Geiger, A.; Lenz, P.; Urtasun, R. Are we ready for Autonomous Driving? The KITTI Vision Benchmark Suite. In Proceedings of the Conference on Computer Vision and Pattern Recognition (CVPR), Providence, RI, USA, 16–21 June 2012. [Google Scholar]
- Bagautdinov, T.; Fleuret, F.; Fua, P. Probability occupancy maps for occluded depth images. In Proceedings of the IEEE Conference on Computer Vision and Pattern Recognition, Boston, MA, USA, 7–12 June 2015; pp. 2829–2837. [Google Scholar]
- Hu, T.; Zhang, H.; Zhu, X.; Clunis, J.; Yang, G. Depth sensor based human detection for indoor surveillance. Future Gener. Comput. Syst. 2018, 88, 540–551. [Google Scholar] [CrossRef]
- Luna, C.A.; Losada-Gutiérrez, C.; Fuentes-Jiménez, D.; Mazo, M. Fast heuristic method to detect people in frontal depth images. Expert Syst. Appl. 2021, 168, 114483. [Google Scholar] [CrossRef]
- Tian, L.; Li, M.; Hao, Y.; Liu, J.; Zhang, G.; Chen, Y.Q. Robust 3-d human detection in complex environments with a depth camera. IEEE Trans. Multimed. 2018, 20, 2249–2261. [Google Scholar] [CrossRef]
- Xia, L.; Chen, C.C.; Aggarwal, J.K. Human detection using depth information by kinect. In Proceedings of the CVPR 2011 Workshops, Colorado Springs, CO, USA, 20–25 June 2011; IEEE: Piscataway, NJ, USA, 2011; pp. 15–22. [Google Scholar]
- Hacinecipoglu, A.; Konukseven, E.I.; Koku, A.B. Fast head detection in arbitrary poses using depth information. Sens. Rev. 2020, 40, 175–182. [Google Scholar] [CrossRef]
- Fuentes-Jimenez, D.; Martin-Lopez, R.; Losada-Gutierrez, C.; Casillas-Perez, D.; Macias-Guarasa, J.; Luna, C.A.; Pizarro, D. DPDnet: A robust people detector using deep learning with an overhead depth camera. Expert Syst. Appl. 2020, 146, 113168. [Google Scholar] [CrossRef]
- Fuentes-Jimenez, D.; Losada-Gutierrez, C.; Casillas-Perez, D.; Macias-Guarasa, J.; Pizarro, D.; Martin-Lopez, R.; Luna, C.A. Towards dense people detection with deep learning and depth images. Eng. Appl. Artif. Intell. 2021, 106, 104484. [Google Scholar] [CrossRef]
- Ren, S.; He, K.; Girshick, R.; Sun, J. Faster r-cnn: Towards real-time object detection with region proposal networks. Adv. Neural Inf. Process. Syst. 2015, 28, 91–99. [Google Scholar] [CrossRef] [PubMed] [Green Version]
- Xie, J.; Pang, Y.; Cholakkal, H.; Anwer, R.; Khan, F.; Shao, L. PSC-net: Learning part spatial co-occurrence for occluded pedestrian detection. Sci. China Inf. Sci. 2021, 64, 1–13. [Google Scholar] [CrossRef]
- Wang, C.C.R.; Lien, J.J.J. AdaBoost learning for human detection based on histograms of oriented gradients. In Proceedings of the Asian Conference on Computer Vision, Venice, Italy, 22–29 October 2007; Springer: Berlin/Heidelberg, Germany, 2007; pp. 885–895. [Google Scholar]
- Mu, Y.; Yan, S.; Liu, Y.; Huang, T.; Zhou, B. Discriminative local binary patterns for human detection in personal album. In Proceedings of the 2008 IEEE Conference on Computer Vision and Pattern Recognition, Anchorage, Alaska, 23–28 June 2008; IEEE: Piscataway, NJ, USA, 2008; pp. 1–8. [Google Scholar]
- Huang, S.S.; Tsai, H.M.; Hsiao, P.Y.; Tu, M.Q.; Jian, E.L. Combining histograms of oriented gradients with global feature for human detection. In Proceedings of the International Conference on Multimedia Modeling, Taipei, Taiwan, 5–7 January 2011; Springer: Berlin/Heidelberg, Germany, 2011; pp. 208–218. [Google Scholar]
- Redmon, J.; Farhadi, A. YOLO9000: Better, faster, stronger. In Proceedings of the IEEE Conference on Computer Vision and Pattern Recognition, Honolulu, HI, USA, 21–26 July 2017; pp. 7263–7271. [Google Scholar]
- Farhadi, A.; Redmon, J. Yolov3: An incremental improvement. In Proceedings of the Computer Vision and Pattern Recognition, Salt Lake City, UT, USA, 18–23 June 2018; Springer: Berlin/Heidelberg, Germany, 2018; pp. 1804–2767. [Google Scholar]
- Liu, W.; Anguelov, D.; Erhan, D.; Szegedy, C.; Reed, S.; Fu, C.Y.; Berg, A.C. Ssd: Single shot multibox detector. In Proceedings of the European Conference on Computer Vision, Amsterdam, The Netherlands, 11–14 October 2016; Springer: Berlin/Heidelberg, Germany, 2016; pp. 21–37. [Google Scholar]
- Tan, M.; Pang, R.; Le, Q.V. Efficientdet: Scalable and efficient object detection. In Proceedings of the IEEE/CVF Conference on Computer Vision and Pattern Recognition, Seattle, WA, USA, 14–19 June 2020; pp. 10781–10790. [Google Scholar]
- Zhou, X.; Wang, D.; Krähenbühl, P. Objects as points. arXiv 2019, arXiv:1904.07850. [Google Scholar]
- Tian, Z.; Shen, C.; Chen, H.; He, T. Fcos: Fully convolutional one-stage object detection. In Proceedings of the IEEE/CVF International Conference on Computer Vision, Seoul, Korea, 27 October–2 November 2019; pp. 9627–9636. [Google Scholar]
- Liu, W.; Liao, S.; Ren, W.; Hu, W.; Yu, Y. High-level semantic feature detection: A new perspective for pedestrian detection. In Proceedings of the IEEE/CVF Conference on Computer Vision and Pattern Recognition, Long Beach, CA, USA, 15–20 June 2019; pp. 5187–5196. [Google Scholar]
- Shen, J.; Zuo, X.; Yang, W.; Prokhorov, D.; Mei, X.; Ling, H. Differential features for pedestrian detection: A Taylor series perspective. IEEE Trans. Intell. Transp. Syst. 2018, 20, 2913–2922. [Google Scholar] [CrossRef]
- Luo, Y.; Zhang, C.; Zhao, M.; Zhou, H.; Sun, J. Where, What, Whether: Multi-modal learning meets pedestrian detection. In Proceedings of the IEEE/CVF Conference on Computer Vision and Pattern Recognition, Seattle, WA, USA, 14–19 June 2020; pp. 14065–14073. [Google Scholar]
- Spinello, L.; Arras, K.O. People detection in RGB-D data. In Proceedings of the 2011 IEEE/RSJ International Conference on Intelligent Robots and Systems, San Francisco, CA, USA, 25–30 September 2011; IEEE: Piscataway, NJ, USA, 2011; pp. 3838–3843. [Google Scholar]
- Mees, O.; Eitel, A.; Burgard, W. Choosing smartly: Adaptive multimodal fusion for object detection in changing environments. In Proceedings of the 2016 IEEE/RSJ International Conference on Intelligent Robots and Systems (IROS), Daejeon, Korea, 9–14 October 2016; IEEE: Piscataway, NJ, USA, 2016; pp. 151–156. [Google Scholar]
- Zhou, K.; Paiement, A.; Mirmehdi, M. Detecting humans in RGB-D data with CNNs. In Proceedings of the 2017 Fifteenth IAPR International Conference on Machine Vision Applications (MVA), Nagoya, Japan, 8–12 May 2017; IEEE: Piscataway, NJ, USA, 2017; pp. 306–309. [Google Scholar]
- Chen, X.; Kundu, K.; Zhu, Y.; Ma, H.; Fidler, S.; Urtasun, R. 3d object proposals using stereo imagery for accurate object class detection. IEEE Trans. Pattern Anal. Mach. Intell. 2017, 40, 1259–1272. [Google Scholar] [CrossRef] [Green Version]
- Ophoff, T.; Van Beeck, K.; Goedemé, T. Improving Real-Time Pedestrian Detectors with RGB+ Depth Fusion. In Proceedings of the 2018 15th IEEE International Conference on Advanced Video and Signal Based Surveillance (AVSS), Auckland, New Zealand, 27–30 November 2018; IEEE: Piscataway, NJ, USA, 2018; pp. 1–6. [Google Scholar]
- Hu, J.; Shen, L.; Sun, G. Squeeze-and-excitation networks. In Proceedings of the IEEE Conference on Computer Vision and Pattern Recognition, Salt Lake City, UT, USA, 18–22 June 2018; pp. 7132–7141. [Google Scholar]
- Kollmitz, M.; Eitel, A.; Vasquez, A.; Burgard, W. Deep 3D perception of people and their mobility aids. Robot. Auton. Syst. 2019, 114, 29–40. [Google Scholar] [CrossRef]
- Seichter, D.; Lewandowski, B.; Höchemer, D.; Wengefeld, T.; Gross, H.M. Multi-task deep learning for depth-based person perception in mobile robotics. In Proceedings of the 2020 IEEE/RSJ International Conference on Intelligent Robots and Systems (IROS), Las Vegas, NV, USA, 25–29 October 2020; IEEE: Piscataway, NJ, USA, 2020; pp. 10497–10504. [Google Scholar]
- Gupta, S.; Arbelaez, P.; Malik, J. Perceptual organization and recognition of indoor scenes from RGB-D images. In Proceedings of the IEEE Conference on Computer Vision and Pattern Recognition, Portland, OR, USA, 23–28 June 2013; pp. 564–571. [Google Scholar]
- He, K.; Zhang, X.; Ren, S.; Sun, J. Deep residual learning for image recognition. In Proceedings of the IEEE conference on computer vision and pattern recognition, Las Vegas, NV, USA, 26 June–1 July 2016; pp. 770–778. [Google Scholar]
- Guan, D.; Cao, Y.; Yang, J.; Cao, Y.; Yang, M.Y. Fusion of multispectral data through illumination-aware deep neural networks for pedestrian detection. Inf. Fusion 2019, 50, 148–157. [Google Scholar] [CrossRef] [Green Version]
- Woo, S.; Park, J.; Lee, J.Y.; Kweon, I.S. Cbam: Convolutional block attention module. In Proceedings of the European Conference on Computer Vision (ECCV), Munich, Germany, 8–14 September 2018; pp. 3–19. [Google Scholar]
- Yan, Y.; Mao, Y.; Li, B. Second: Sparsely embedded convolutional detection. Sensors 2018, 18, 3337. [Google Scholar] [CrossRef] [PubMed] [Green Version]
- Park, J.; Joo, K.; Hu, Z.; Liu, C.K.; Kweon, I.S. Non-Local Spatial Propagation Network for Depth Completion. In Proceedings of the European Conference on Computer Vision (ECCV), Glasgow, UK, 23–28 August 2020. [Google Scholar]
- He, K.; Gkioxari, G.; Dollár, P.; Girshick, R. Mask r-cnn. In Proceedings of the IEEE International Conference on Computer Vision, Venice, Italy, 22–29 October 2017; pp. 2961–2969. [Google Scholar]
- Shao, S.; Zhao, Z.; Li, B.; Xiao, T.; Yu, G.; Zhang, X.; Sun, J. Crowdhuman: A benchmark for detecting human in a crowd. arXiv 2018, arXiv:1805.00123. [Google Scholar]
- Zhang, S.; Benenson, R.; Schiele, B. Citypersons: A diverse dataset for pedestrian detection. In Proceedings of the IEEE Conference on Computer Vision and Pattern Recognition, Honolulu, HI, USA, 21–26 July 2017; pp. 3213–3221. [Google Scholar]
- He, K.; Zhang, X.; Ren, S.; Sun, J. Delving deep into rectifiers: Surpassing human-level performance on imagenet classification. In Proceedings of the IEEE International Conference on Computer Vision, Santiago, Chile, 7–13 December 2015; pp. 1026–1034. [Google Scholar]
- Daniel Costea, A.; Varga, R.; Nedevschi, S. Fast boosting based detection using scale invariant multimodal multiresolution filtered features. In Proceedings of the IEEE Conference on Computer Vision and Pattern Recognition, Honolulu, HI, USA, 21–26 July 2017; pp. 6674–6683. [Google Scholar]
- Xiang, Y.; Choi, W.; Lin, Y.; Savarese, S. Subcategory-aware convolutional neural networks for object proposals and detection. In Proceedings of the 2017 IEEE Winter Conference on Applications of Computer Vision (WACV), Santa Rosa, CA, USA, 24–31 March 2017; IEEE: Piscataway, NJ, USA, 2017; pp. 924–933. [Google Scholar]
- Ren, J.; Chen, X.; Liu, J.; Sun, W.; Pang, J.; Yan, Q.; Tai, Y.W.; Xu, L. Accurate single stage detector using recurrent rolling convolution. In Proceedings of the IEEE Conference on Computer Vision and Pattern Recognition, Honolulu, HI, USA, 21–26 July 2017; pp. 5420–5428. [Google Scholar]
- Braun, M.; Krebs, S.; Flohr, F.; Gavrila, D.M. The eurocity persons dataset: A novel benchmark for object detection. arXiv 2018, arXiv:1805.07193. [Google Scholar]
- Guindel, C.; Martin, D.; Armingol, J.M. Fast joint object detection and viewpoint estimation for traffic scene understanding. IEEE Intell. Transp. Syst. Mag. 2018, 10, 74–86. [Google Scholar] [CrossRef]
- Wang, Z.; Jia, K. Frustum convnet: Sliding frustums to aggregate local point-wise features for amodal 3d object detection. In Proceedings of the 2019 IEEE/RSJ International Conference on Intelligent Robots and Systems (IROS), Macau, China, 3–8 November 2019; IEEE: Piscataway, NJ, USA, 2019; pp. 1742–1749. [Google Scholar]
- Ku, J.; Pon, A.D.; Walsh, S.; Waslander, S.L. Improving 3d object detection for pedestrians with virtual multi-view synthesis orientation estimation. In Proceedings of the 2019 IEEE/RSJ International Conference on Intelligent Robots and Systems (IROS), Macau, China, 3–8 November 2019; IEEE: Piscataway, NJ, USA, 2019; pp. 3459–3466. [Google Scholar]
- Chen, Q.; Sun, L.; Wang, Z.; Jia, K.; Yuille, A. object as hotspots. In Proceedings of the European Conference on Computer Vision (ECCV), Glasgow, UK, 23–28 August 2020. [Google Scholar]
- Fan, S.; Zhu, F.; Chen, S.; Zhang, H.; Tian, B.; Lv, Y.; Wang, F.Y. FII-CenterNet: An Anchor-Free Detector With Foreground Attention for Traffic Object Detection. IEEE Trans. Veh. Technol. 2021, 70, 121–132. [Google Scholar] [CrossRef]
- Lin, T.Y.; Maire, M.; Belongie, S.; Hays, J.; Perona, P.; Ramanan, D.; Dollár, P.; Zitnick, C.L. Microsoft coco: Common objects in context. In Proceedings of the European Conference on Computer Vision, Zurich, Switzerland, 6–12 September 2014; Springer: Berlin/Heidelberg, Germany, 2014; pp. 740–755. [Google Scholar]
- Jocher, G.; Kwon, Y.; guigarfr; perry0418; Veitch-Michaelis, J.; Ttayu; Suess, D.; Baltacı, F.; Bianconi, G.; IlyaOvodov; et al. Ultralytics/yolov3: v9.5.0—YOLOv5 v5.0 Release Compatibility Update for YOLOv3.2021. Available online: https://zenodo.org/record/4681234#.YfP42OrMKUk (accessed on 18 December 2021). [CrossRef]
- Chen, K.; Wang, J.; Pang, J.; Cao, Y.; Xiong, Y.; Li, X.; Sun, S.; Feng, W.; Liu, Z.; Xu, J.; et al. MMDetection: Open MMLab Detection Toolbox and Benchmark. arXiv 2019, arXiv:1906.07155. [Google Scholar]
- Luber, M.; Spinello, L.; Arras, K.O. People tracking in rgb-d data with on-line boosted target models. In Proceedings of the 2011 IEEE/RSJ International Conference on Intelligent Robots and Systems, San Francisco, CA, USA, 25–30 September 2011; IEEE: Piscataway, NJ, USA, 2011; pp. 3844–3849. [Google Scholar]
- Munaro, M.; Basso, F.; Menegatti, E. Tracking people within groups with RGB-D data. In Proceedings of the 2012 IEEE/RSJ International Conference on Intelligent Robots and Systems, Vilamoura, Portugal, 7–12 October 2012; IEEE: Piscataway, NJ, USA, 2012; pp. 2101–2107. [Google Scholar]
- Munaro, M.; Menegatti, E. Fast RGB-D people tracking for service robots. Auton. Robot. 2014, 37, 227–242. [Google Scholar] [CrossRef]

| Method | Easy | Moderate | Hard | Input | Time (s) |
|---|---|---|---|---|---|
| MM-MRFC (2017, [56]) | 83.79 | 70.76 | 64.81 | RGB-D-F | 0.05 |
| SubCNN (2017, [57]) | 84.88 | 72.27 | 66.82 | RGB | 2 |
| RRC (2017, [58]) | 85.98 | 76.61 | 71.47 | RGB | 3.6 |
| ECP (2018, [59]) | 85.96 | 76.25 | 70.55 | RGB | 0.25 |
| FRCNN+Or (2018, [60]) | 71.64 | 56.68 | 51.53 | RGB | 0.09 |
| TAFT (2018, [36]) | 67.62 | 53.15 | 47.08 | RGB | 0.2 |
| F-ConvNet (2019, [61]) | 83.63 | 72.91 | 67.18 | RGB-P | 0.47 |
| VMVS (2019, [62]) | 82.80 | 71.82 | 66.85 | RGB-P | 0.25 |
| HotSpotNet (2020, [63]) | 71.43 | 62.31 | 59.24 | RGB | 0.04 |
| FII-CenterNet (2021, [64]) | 81.32 | 67.31 | 61.29 | RGB | 0.09 |
| WSSN (2021, [5]) | 84.91 | 76.42 | 71.86 | RGB-D | 0.37 |
| HHA-TFFEM (Proposed) | 85.32 | 77.12 | 72.69 | RGB-D | 0.14 |
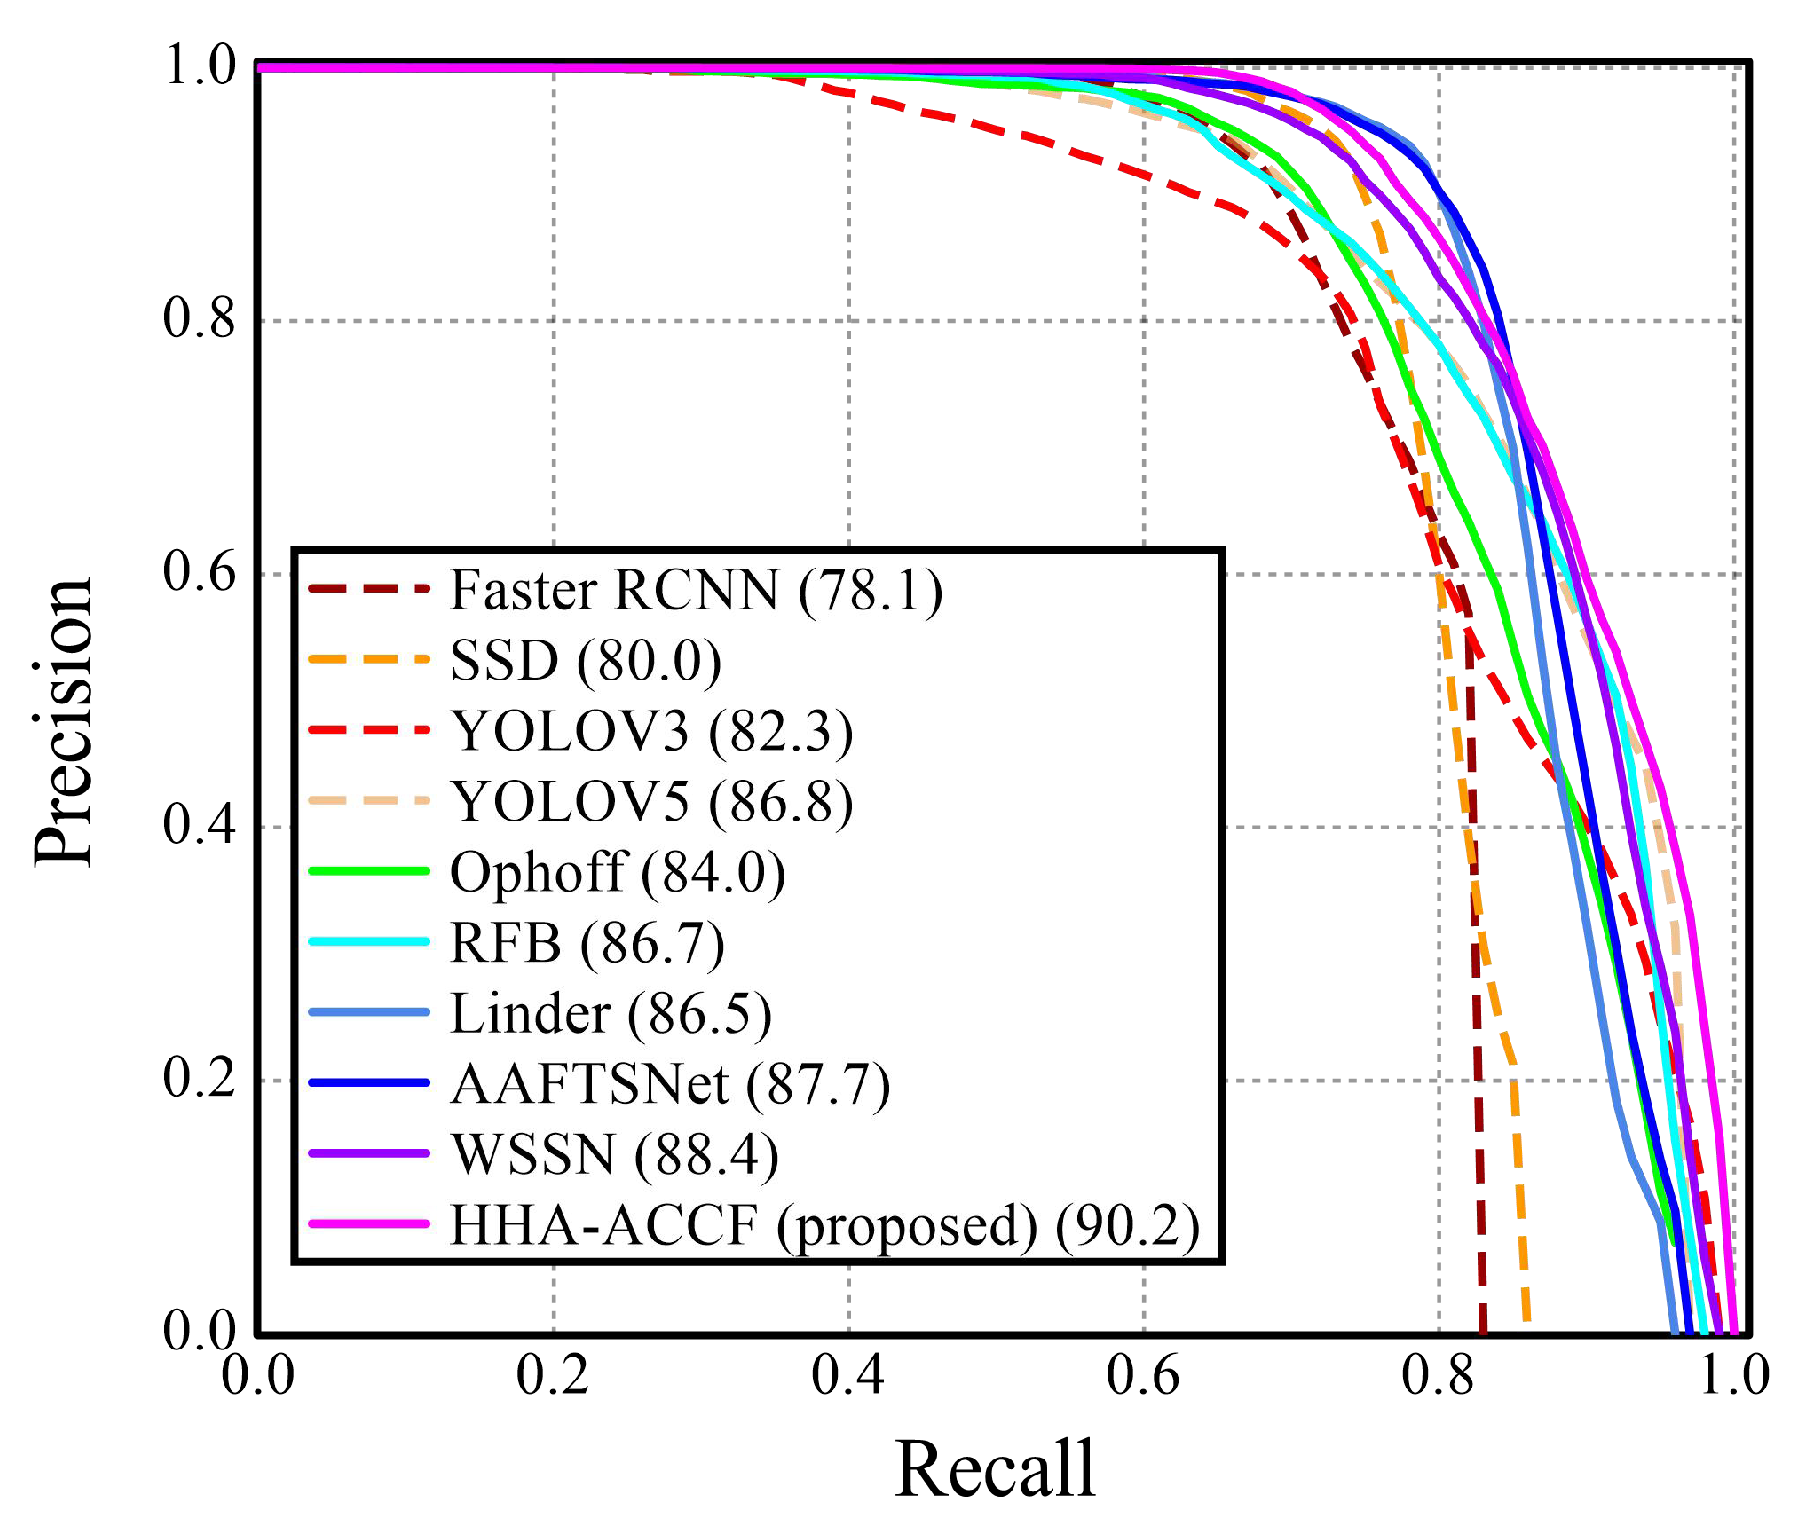
| Method | AP50 | AP75 | APCOCO | Input |
|---|---|---|---|---|
| FasterRCNN (2015, [24]) | 78.1 | 59.1 | 50.2 | RGB |
| SSD (2016, [31]) | 80.0 | 45.8 | 44.6 | |
| YOLOV3 (2018, [30]) | 82.3 | 52.7 | 47.8 | |
| YOLOV5 (2021, [66]) | 86.8 | 55.5 | 51.5 | |
| Ophoff (2019, [1]) | 84.0 | 51.6 | 49.0 | RGB-D |
| Zhang (2020, [2]) | 86.7 | 54.2 | 51.2 | |
| Linder (2020, [3]) | 86.5 | 65.4 | 57.2 | |
| AAFTSNet (2021, [4]) | 87.7 | 61.4 | 55.3 | |
| WSSN (2021, [5]) | 88.4 | 64.1 | 55.8 | |
| HHA-TFFEM (Proposed) | 90.2 | 66.0 | 57.4 |
| KTP [70] | UNIHALL [38] | EPFL-LAB [16] | EPFL-COR [16] | KITTI [15] | Avg. | ||
|---|---|---|---|---|---|---|---|
| Runtimes (s) | Original | 0.630 | 0.618 | 0.438 | 0.433 | 1.102 | 0.644 |
| Improved | 0.267 | 0.263 | 0.182 | 0.172 | 0.471 | 0.271 | |
| Image Resolution | |||||||
| Depth Encoding Method | Easy | Moderate | Hard | AP50 | APCOCO | Input |
|---|---|---|---|---|---|---|
| Grayscale | 85.78 | 78.41 | 71.39 | 66.9 | 31.7 | RGB-D |
| Surface Normals | 87.86 | 79.42 | 72.53 | 69.7 | 34.4 | |
| Colormap Jet | 87.58 | 79.72 | 73.05 | 68.5 | 33.4 | |
| HHA Orginal | 87.26 | 80.25 | 72.96 | 68.9 | 32.9 | |
| HHA + GE (Proposed) | 87.44 | 80.84 | 74.00 | 70.6 | 33.5 | |
| HHA + GE + DEM (Proposed) | 88.90 | 82.14 | 75.33 | 71.5 | 34.5 |
| Fusion Method | Easy | Moderate | Hard | AP50 | APCOCO | Input |
|---|---|---|---|---|---|---|
| Summation | 86.76 | 79.02 | 72.83 | 68.4 | 31.6 | RGB-D |
| Concatenation | 87.79 | 80.33 | 73.19 | 69.5 | 33.7 | |
| TFFEM (proposed) | 88.00 | 80.76 | 74.58 | 70.1 | 34.0 | |
| Summation + CBAM | 87.42 | 79.86 | 73.83 | 70.3 | 33.9 | |
| Concatenation + CBAM | 87.74 | 80.62 | 73.74 | 71.1 | 33.4 | |
| TFFEM + CBAM (proposed) | 88.90 | 82.14 | 75.33 | 71.5 | 34.5 |
Publisher’s Note: MDPI stays neutral with regard to jurisdictional claims in published maps and institutional affiliations. |
© 2022 by the authors. Licensee MDPI, Basel, Switzerland. This article is an open access article distributed under the terms and conditions of the Creative Commons Attribution (CC BY) license (https://creativecommons.org/licenses/by/4.0/).
Share and Cite
Tan, F.; Xia, Z.; Ma, Y.; Feng, X. 3D Sensor Based Pedestrian Detection by Integrating Improved HHA Encoding and Two-Branch Feature Fusion. Remote Sens. 2022, 14, 645. https://doi.org/10.3390/rs14030645
Tan F, Xia Z, Ma Y, Feng X. 3D Sensor Based Pedestrian Detection by Integrating Improved HHA Encoding and Two-Branch Feature Fusion. Remote Sensing. 2022; 14(3):645. https://doi.org/10.3390/rs14030645
Chicago/Turabian StyleTan, Fang, Zhaoqiang Xia, Yupeng Ma, and Xiaoyi Feng. 2022. "3D Sensor Based Pedestrian Detection by Integrating Improved HHA Encoding and Two-Branch Feature Fusion" Remote Sensing 14, no. 3: 645. https://doi.org/10.3390/rs14030645
APA StyleTan, F., Xia, Z., Ma, Y., & Feng, X. (2022). 3D Sensor Based Pedestrian Detection by Integrating Improved HHA Encoding and Two-Branch Feature Fusion. Remote Sensing, 14(3), 645. https://doi.org/10.3390/rs14030645