Abstract
For remote sensing object detection, fusing the optimal feature information automatically and overcoming the sensitivity to adapt multi-scale objects remains a significant challenge for the existing convolutional neural networks. Given this, we develop a convolutional network model with an adaptive attention fusion mechanism (AAFM). The model is proposed based on the backbone network of EfficientDet. Firstly, according to the characteristics of object distribution in datasets, the stitcher is applied to make one image containing objects of various scales. Such a process can effectively balance the proportion of multi-scale objects and handle the scale-variable properties. In addition, inspired by channel attention, a spatial attention model is also introduced in the construction of the adaptive attention fusion mechanism. In this mechanism, the semantic information of the different feature maps is obtained via convolution and different pooling operations. Then, the parallel spatial and channel attention are fused in the optimal proportions by the fusion factors to get the further representative feature information. Finally, the Complete Intersection over Union (CIoU) loss is used to make the bounding box better cover the ground truth. The experimental results of the optical image dataset DIOR demonstrate that, compared with state-of-the-art detectors such as the Single Shot multibox Detector (SSD), You Only Look Once (YOLO) v4, and EfficientDet, the proposed module improves accuracy and has stronger robustness.
1. Introduction
Object detection determines whether an image contains one or more objects and aims to locate the position of each object. It has been widely applied in many fields, such as military reconnaissance and surveillance [1], traffic scene perception [2], and disaster response and recovery [3]. In recent years, the rapid development of high-resolution remote sensing satellites has greatly facilitated the research on remote sensing image object detection. Limited by data and hardware conditions, traditional methods often focus on the extraction and description of handcrafted features. For example, Dalal et al. [4] used the locally normalized histogram of gradient orientations features in a dense overlapping grid to perform human detection. Aytekin et al. [5] conducted airport runway detection using texture features; Weber and Lefevre [6] proposed a multivariate hit-or-miss operator for morphological template matching in multivalued images with an application in coastline extracting. Although these methods achieved considerable performance in certain scenarios, they always have disadvantages, namely complex feature design, weak migration, and a cumbersome manual design [7]; moreover, they often do not work well for massive high-resolution remote sensing imagery. Further still, traditional detection methods often require the designing of different detection schemes for different datasets because of a lack in learning ability. For the past few years, deep learning has achieved remarkable results in the fields of image matching [8,9], image fusion [10], and object detection [11]. Recently, deep-learning-based object detection methods have made a huge breakthrough. Differing from traditional methods, which require the manual designing of feature descriptors, deep-learning-based detectors rely on the advanced semantic information that is learned automatically to make the abstract expression of the objects. At present, the existing object detection models in deep learning can be generally divided into two categories: two-stage models and one-stage models. In the former detectors, many region proposals available to the detector must be generated by a certain method to localize and segment objects. For example, R-CNN (Region-based Convolutional Network method) [12] generates region proposals via Selective Search (SS) [13] and uses AlexNet as a feature extractor to extract a fixed-length feature vector from each proposal. Then, R-CNN classifies each region with category-specific linear support vector machines (SVMs). Unlike R-CNN, Fast R-CNN [14] utilizes the entire image to produce a convolutional feature map. A region of interest (RoI) pooling layer follows to extract sets of fixed-length feature maps corresponding to each proposal. Subsequently, each feature map is fed into fully connected (FC) layers to get bounding box positions and softmax probability of object classification. Faster R-CNN [11] introduces a Region Proposal Network (RPN), which is trained end-to-end to generate high-quality region proposals with a wide range of scales and aspect ratios. An RPN is a deep, fully convolutional network that simultaneously predicts object bounds and objectness scores at each position, which significantly improves both efficiency and accuracy. Ren et al. [15] improve Faster-RCNN by fusing low-level features with high-level features and then feeding them to a 1 × 1 convolutional layer. In this way, they achieve great success in small object detection. In contrast to region-based detectors, one-stage detectors treat the detection task as a single detection, in which convolutional neural works (CNNs) can directly obtain the category probability and position coordinate. Classical one-stage detectors are represented by SSD [16] and the series of YOLO [17,18,19]. To detect objects at different scales, Xu et al. [20] proposed an improved YOLO-V3 based model by adopting DenseNet and extending the detection scales of YOLO-V3, which achieved higher accuracy and considered real-time performance simultaneously. Furthermore, anchor-free methods have also received wide attention after the CornerNet [21] was proposed. In contrast to prior one-stage detectors, CornerNet eliminates the requirement for designing anchor boxes. Instead, it detects objects as paired keypoints (the top-left corner and the bottom-right corner) and extends them to the bounding box. However, CornerNet often suffers plenty of incorrect bounding boxes as it mainly focuses on the boundary of objects. CenterNet [22] successfully rectifies this weakness by adding center points as an additional assessment inside cropped regions, leading to the improvement of both recall and precision. Compared with two-stage detectors, one-stage detectors remove the proposal generation process which significantly improves speed but usually sacrifices accuracy. It is worth thinking about how to build a detector achieving both great accuracy and efficiency. Accordingly, Google proposed a weighted bi-directional feature pyramid network (BiFPN) and a customized compound scaling method based on the one-stage detector. BiFPN allows for easy and fast multi-scale feature fusion. Additionally, the compound scaling method can uniformly scale the resolution, depth, and width for all backbone, feature networks, and box/class prediction networks at the same time, which is critical when taking into account both accuracy and efficiency [23]. By combining the EfficientNet [23] backbones with BiFPN and compound scaling, Google developed a new module called EfficientDet [24], which consistently achieves better accuracy with far fewer parameters and Floating Point of Operations (FLOPs).
Although the emergence of EfficientDet consistently achieves both higher accuracy and better efficiency, some limitations still exist in object detection. The mainly considered points are as follows: ① A remote sensing dataset is always a collection of multi-scale objects. Due to the significant difference in the number of different categories and the fact that some small objects always have the characteristic of clustering distribution, even if the number of small objects is huge, the image containing small objects usually only accounts for a small number; ② for existing CNN-based one-stage detectors, pixel-by-pixel addition or multiplication and dimensional splicing are always adopted when aggregating features at different layers or combining low-level image features with high-level context. It is obvious that such methods miss realizing the optimal feature fusion; ③ in the bounding box regression, while the Smooth L1 loss is widely adopted, it is not tailored to the evaluation metric, i.e., Intersection over Union (IoU). Nevertheless, the most popular metric IoU loss does not reflect whether the predicted box and ground truth are in the vicinity of or far from each other [25], and it would not provide any optimization for non-overlapping cases.
To address the problems mentioned above, we develop a convolutional network model with an adaptive attention fusion mechanism (AAFM). Firstly, the stitcher [26] strategy is applied to improve the unbalanced distribution of multi-scale objects to optimize the detection performance, especially of small objects. Then, an AAFM module is proposed based on the EfficientDet backbone, which uses convolution and different pooling methods to extract the feature representations of different layers. The parallel spatial and channel attention models are fused in optimal proportions by the learnable fusion factors to obtain further targeted feature information. Finally, the CIoU loss [27] is used to address the weakness of IoU with faster convergence and better regression performance.
Our main contributions in this work are:
- (1)
- We propose an adaptive attention fusion mechanism. AAFM is constructed by channel attention and the introduced spatial attention, combining in a parallel manner. Specifically, the learnable fusion factors are adopted in AAFM for fusing features adaptively both intra-module and inter-module. AAFM can be widely incorporated into the existing detectors to boost the representation power.
- (2)
- We design an AAFM-Enhanced EfficientDet network of object detection, which employs several advanced techniques, including the stitcher scheme, the AAFM-integrated architecture, and the CIoU loss. These techniques are applied together to improve the accuracy and robustness of the network.
2. Related Work
In this section, we provide a brief review of the work closely related to our one-stage AAFM-Enhanced network architecture, including the studies on the one-stage object detection network and the attention mechanism.
2.1. One-Stage Object Detection Network of Remote Sensing Imagery
At the first stage of object detection, much effort has been made for accuracy improvement so that the detectors can meet the application requirements in various scenarios. Nowadays, more and more attention has been paid to the speed of detection for the real-time requirement. One-stage detectors remove the step of proposal generation, which significantly contributes to speed improvement.
In remote sensing image analysis and application, one-stage detectors have attracted much attention over the last few years. YOLO divides an image into multiple grid cells as the basic unit for classification and regression. It is characterized by simple design, high speed, and strong generalization ability. Liu et al. [28] developed a YOLOv3-based detector by making several optimizations at early layers to enlarge receptive fields. They obtained a distinct performance improvement in small object detection for unmanned aerial vehicle images. Ju et al. [29] redesigned the backbone of YOLOv3 to find suitable scales for small vehicle detection in aerial images. SSD combines the regression idea of YOLO with the Anchor mechanism in Faster-RCNN. Wang et al. [30] proposed a spatial enhanced SSD for multiclass object detection. They added an oriented-gradients features map and a context module to enhance the feature representation. The proposed method can detect multi-class objects at a higher accuracy. Retina-Net [31] addresses the serious class imbalance between foreground and background. Faina et al. [32] employed Retina-Net architecture for crop detection and managed to obtain an effective yield estimator.
The keypoint-based method is a novel path which does not require a large number of parameters about anchors. Typical representatives are CornerNet and CenterNet. He et al. [33] managed to find the approximate locations and rough sizes of the sunspot groups on the solar full images based on Cornnet-Saccade. Liu et al. [34] and Lin et al. [35] achieved high accuracy with a real-time detection speed based on CenterNet.
Some novel models are also emerging. Qin et al. [36] proposed a Specially Optimized One-stage Network (SOON). SOON emphasizes extraction and understanding of the combination of feature and semantic information about small objects. The method had a reasonably good performance on densely arranged small object detection in large-scale remote sensing images.
In this work, we make optimizations on the structure of EfficientDet, which is a well-known one-stage detector achieving both high accuracy and efficiency.
2.2. Attention Mechanism
The attention mechanism is inspired by the human vision, which tends to selectively focus on parts of information. It sets high weights to highlight the important part and ignores irrelevant parts with low weights; at the same time, the weights can be adjusted in different situations. Therefore, the attention mechanism allows the processing of important information precisely and efficiently with scalability and strong robustness. It was initially used in natural language processing [37], and has later been widely applied in image recognition [38] and speech recognition [39].
In deep learning, attention mechanisms have been widely used in conjunction with the existing neural network models to assign different weights to the different parts of the model by which more critical feature representations can be obtained to optimize the model. Spatial Transformer Networks [40] allow the neural networks to actively spatially transform feature maps to extract critical spatial information. Squeeze-and-Excitation Networks (SENet) [41] compute the channel-wise attention by a global average pooling operation, which focuses on the importance of different channels. The Convolutional Block Attention Module (CBAM) [42] is the combination of those two ideas in the mixed domain. It exploits both the spatial and channel-wise attention to determine ‘what’ and ‘where’, a focus which further boosts the representation power of CNNs. In contrast to the methods mentioned above, which are dedicated to developing more complicated attention modules for performance improvement, efficient channel attention networks (ECANet) [43] are a lightweight block. In ECANet, a local cross-channel interaction strategy and a method to adaptively select the kernel size of the convolution are proposed, leading to a clear performance gain while significantly decreasing model complexity. Inspired by CBAM, in this paper we integrate a spatial attention model within the existing channel attention model in the backbone feature extraction network. When guided with an attention mechanism, the deep learning-based remote sensing object detection can pay more attention to the objects and suppress image noise to better handle small objects and complex background properties of remote sensing imagery.
3. Materials and Methods
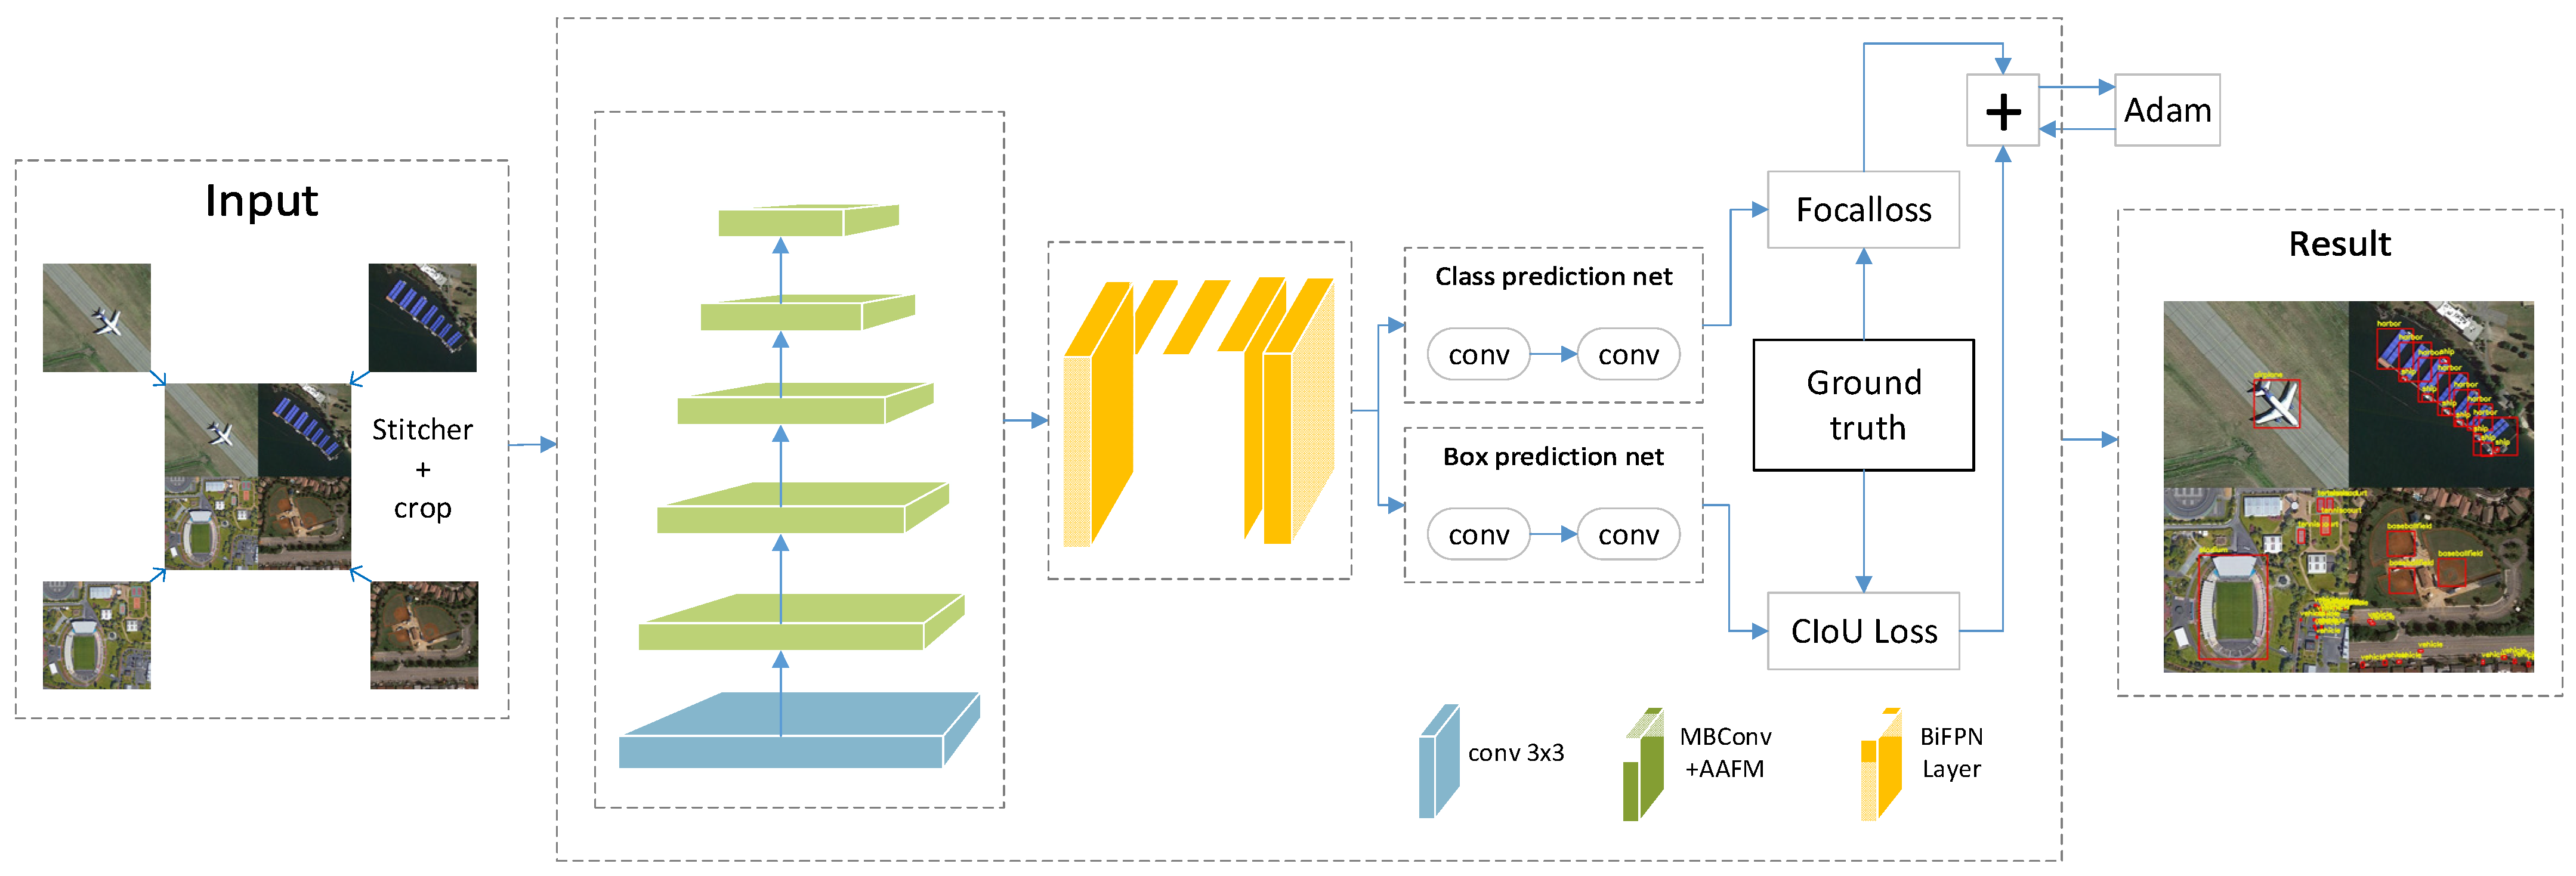
Figure 1 shows the overall architecture of our model; the technical route is as follows: First of all, four images selected randomly from the original dataset will be sent to the stitcher with a fixed extent image putting out. Such an image stitching operation realizes the data augmentation and significantly increases the proportion of small objects. Then, a spatial attention mechanism is introduced, referring to the existing channel attention mechanism of the EfficientDet. The two attention mechanisms are connected in parallel to construct an AAFM, in which convolution and different pooling operations are applied to concentrate the spatial and channel information of the feature layers. Then, the adaptive fusion factors lead to the optimal fusion of the different features, which significantly improves the network performance. Lastly, the CIoU loss introduces three critical geometric factors the overlap area, the center point distance, and the aspect ratio to further optimize the accuracy of the bounding box regression.

Figure 1.
Proposed network architecture.
3.1. Image Stitching Method
In the CNN-based remote sensing object detection, there is an obvious performance distinction according to scales; it tends to perform much better with large objects than with small ones. On the one hand, this is because the down-sampling process of CNN causes more serious information loss for small objects. On the other hand, the unbalanced distribution of multi-scale objects impacts the results. This can be seen from Table 1: in the remote sensing image dataset DIOR, small objects account for 68.3%, which is far more than medium and large-scale objects. In theory, this is beneficial for the performance of small objects. However, only 46.3% of images contain small objects; that is to say, most objects are small while more than half of the images do not contain small objects. Such a scale imbalance poses great challenges for model training.

Table 1.
Scale distribution on DIOR.
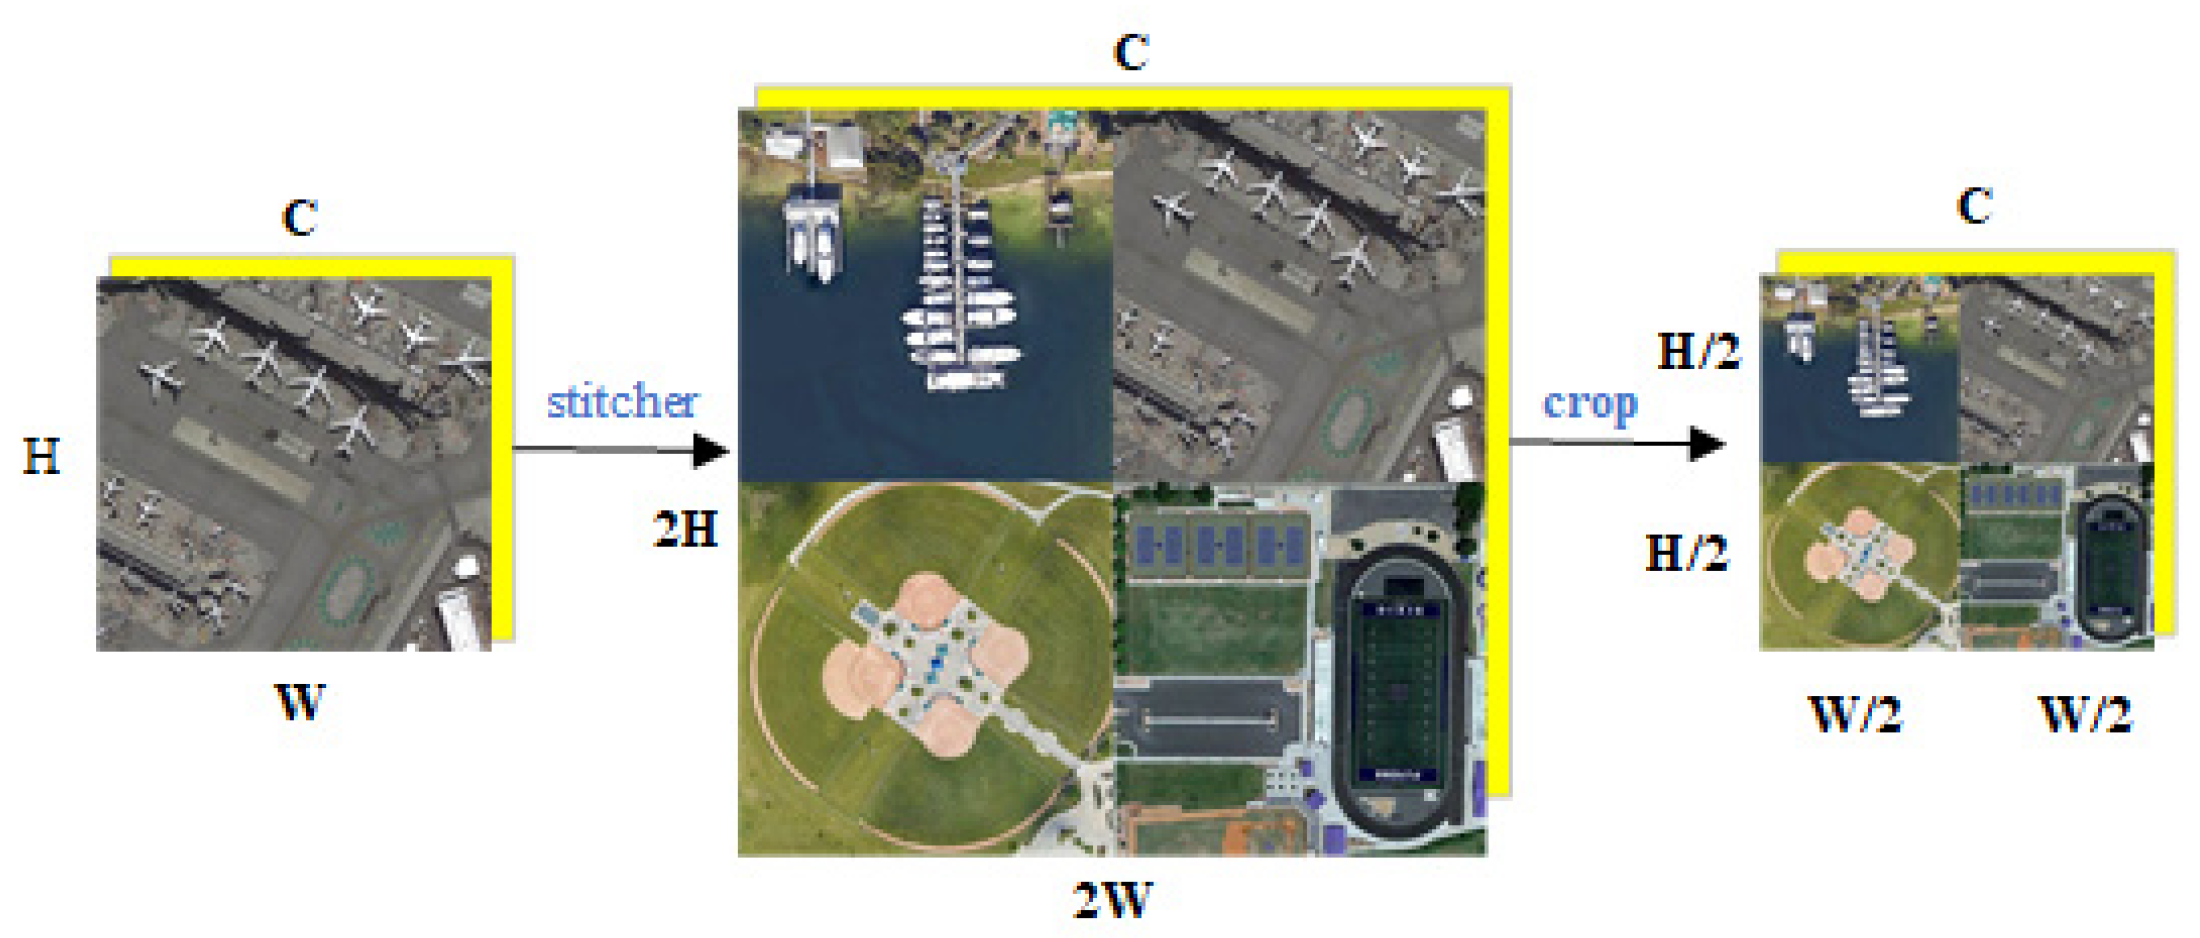
For the above problems, we introduce a data augmentation method named ‘stitcher’ (Figure 2, C, H, and W are channels, height, and width of the image respectively) to optimize the distribution of the multi-scale objects. By stitching and scaling original images, a stitched image is constructed. The medium and large objects are resized to smaller ones with richer details or border information compared with the real small objects. The image stitching generates more small objects whose original aspect ratio is preserved for retaining properties. Additionally, no more computation is introduced, as the image size does not change.

Figure 2.
Flowchart of image stitching.
It can be seen from Table 2 that the proportion of small objects in the augmented dataset reaches 96.5%, which means a significant number increase of the images that contain small objects. In this way, the augmented dataset which integrates with the stitched image achieves data augmentation among different scales.
Table 2.
Percentage of object scale distribution in the augmented dataset.
3.2. AAFM-Enhanced EfficientDet
Considering both accuracy and efficiency, we employ EfficientDet as the baseline network for object detection. In the backbone of EfficientDet, we find that the mobile inverted bottleneck Convolution (MBConv) [44,45] module introduces an attention idea of Squeeze-and-Excitation (SE) which adopts the average-pooling to automatically exploit the importance of each channel. However, the average-pooled features are suboptimal to the max-pooled features when inferring fine channel attention [42]. Additionally, it only focuses on the relationship between channels, ignoring the spatial attention which is critical to highlight the informative area. Moreover, when aggregating different features, it is worth thinking about how we can combine them to obtain a richer representation. Accordingly, we propose an AAFM, which adopts both channel and spatial attention and introduces adaptive factors to realize the optimal feature fusion. To clearly illustrate how an AAFM enhances the EfficientDet network, we will provide a brief introduction to EfficientDet at first.
3.2.1. EfficientDet
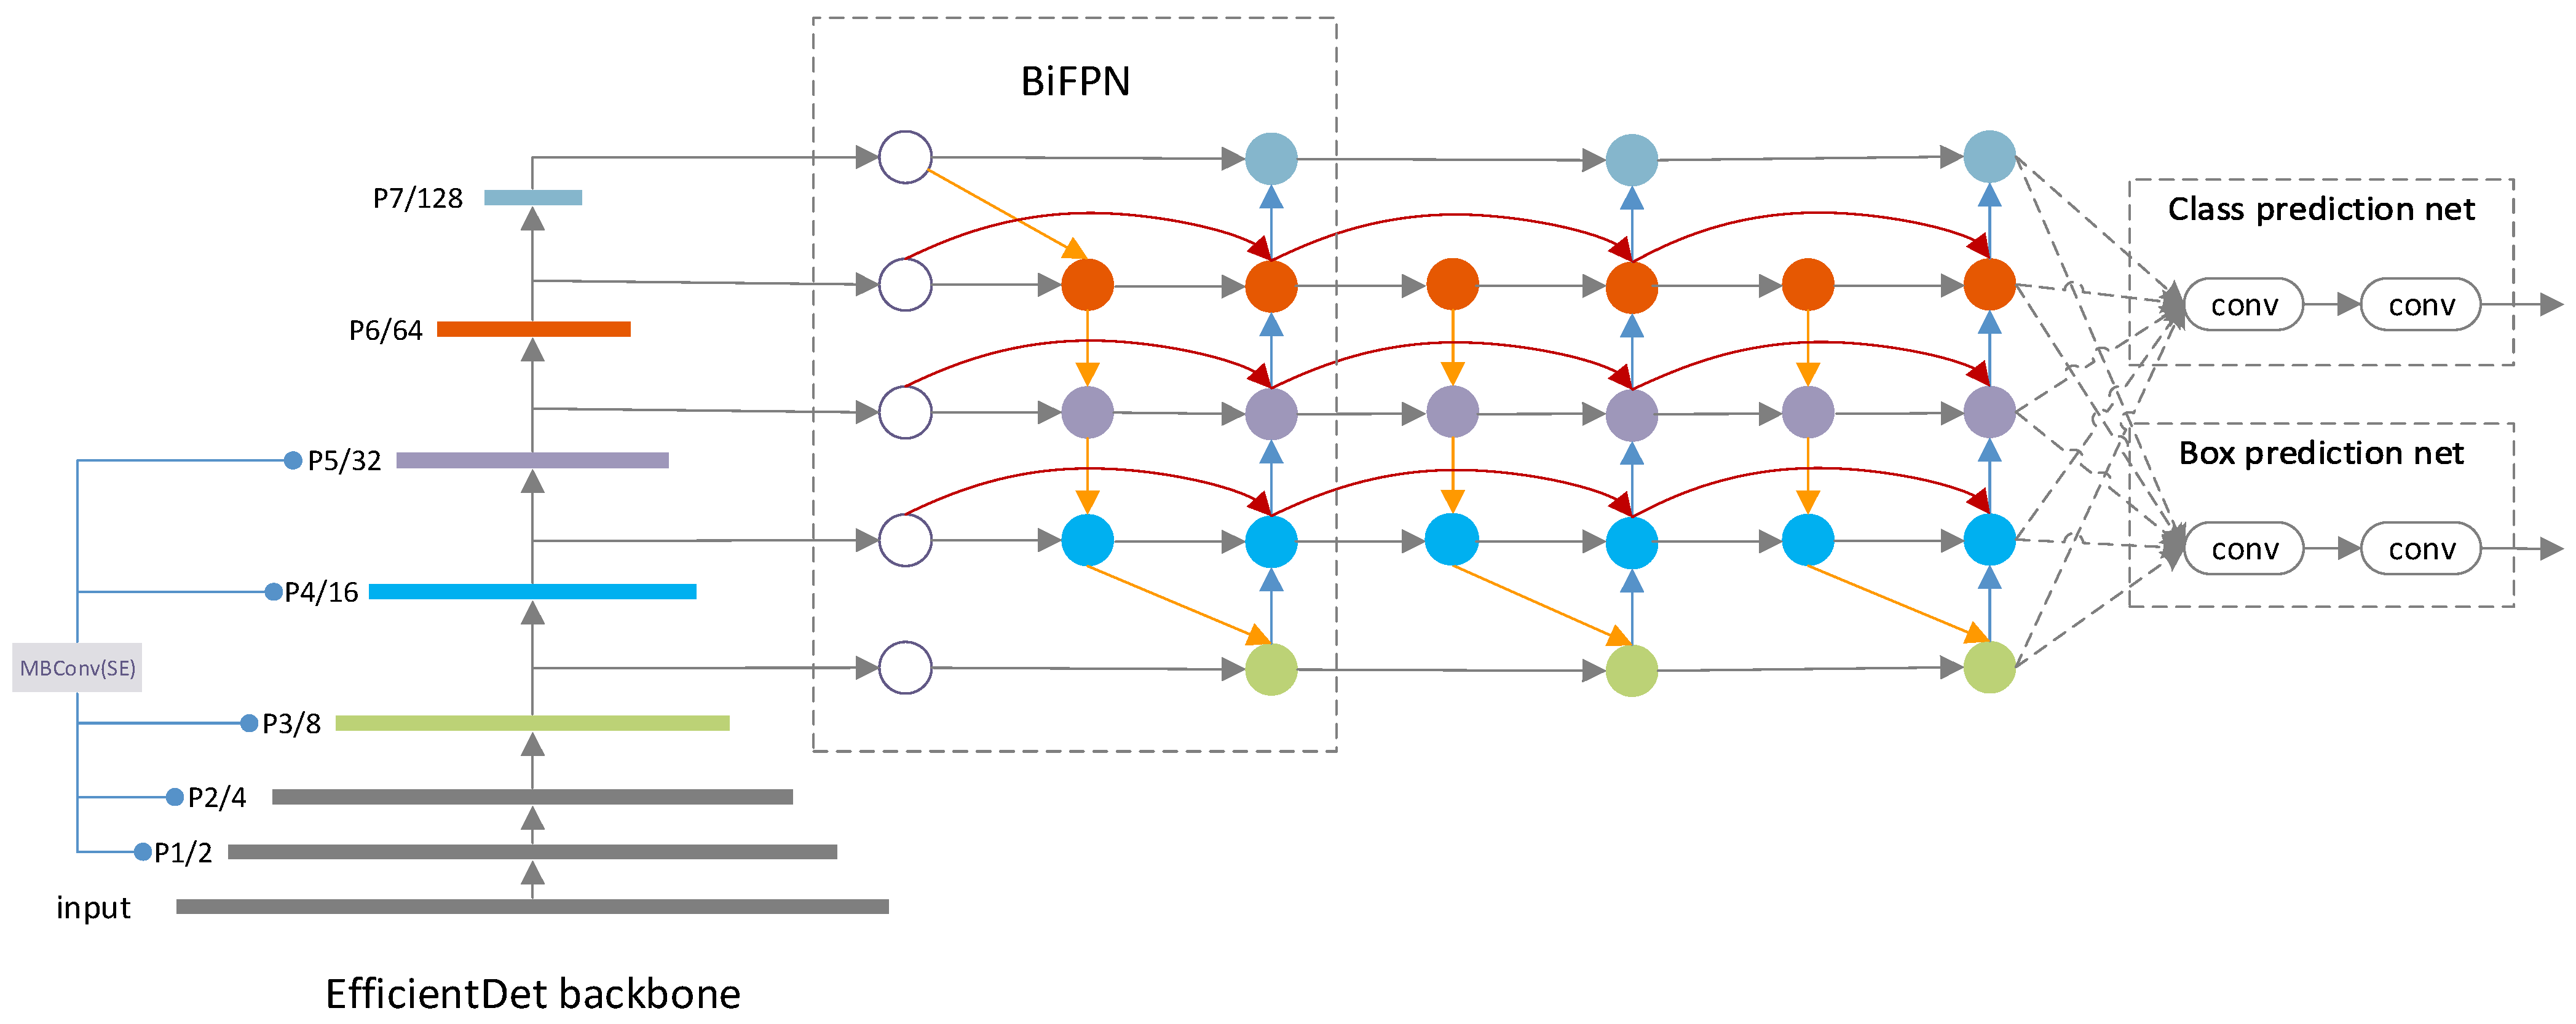
The EfficientDet first employs the EfficientNet as the backbone network, then the repeated BiFPN serves as the feature extraction network to make multi-scale feature fusion of third to seventh level features (P3–P7) from EfficientNet. Finally, the fused features are fed into the class and box prediction net for classification and bounding box prediction. Figure 3 shows the overall architecture of EfficientDet.
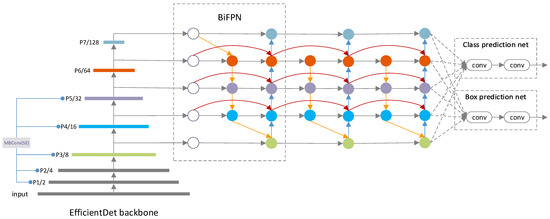
Figure 3.
Architecture of EfficientDet-D0.
The main architecture of EfficientNet (P1–P5) is built by repeated MBConv blocks, which introduce the squeeze-and-excitation optimization. This block takes a low-dimensional compressed representation as the input, which is expanded to high dimension by a 1 × 1 convolution. The features will be filtered with a depthwise separable convolution for spatial information encoding. Notably, a SE block is introduced, which applies global average pooling to squeeze the spatial information along the channel axis. Then, the aggregated features are set to an excitation operator to fully capture channel-wise dependencies. Projected back to the low-dimensional representation by another 1 × 1 convolution, the output features are considered as weights of each channel. Finally, the features are connected with the original input with an inverted residual structure for channel weighting. Several features from different levels of EfficientNet are then sent to BiFPN for feature fusion.
BiFPN makes several optimizations on PANet (Path Aggregation Network) to fuse more high-level features in a simplified bi-directional network. Moreover, each input is added with an additional weight so that the network can learn the contribution of features at different resolution scales. By integrating both bidirectional cross-scale connections and the weighted feature fusion, the final BiFPN allows efficient multi-scale feature fusion.
In consideration of both accuracy and efficiency, a compound scaling method is proposed. The width, depth, and image resolution are jointly scaled up by the introduced coefficient Φ, by which how much resources are used can be computed.
3.2.2. AAFM
In the backbone of EfficientDet, MBConv adds a channel attention mechanism of SE block which explicits channel-wise information via global average pooling, ignoring the max-pooled features and the spatial attention. Given this, we suggest using max-pooling for gathering features about distinctive objects as well. As the essence of the attention mechanism is to selectively focus on the contribution of specific features by redistributing the original features and weaken the effect of features that provide little attribution at the same time [46], we suggest letting the network learn which information to emphasize or suppress along the channel and spatial dimensions, respectively.
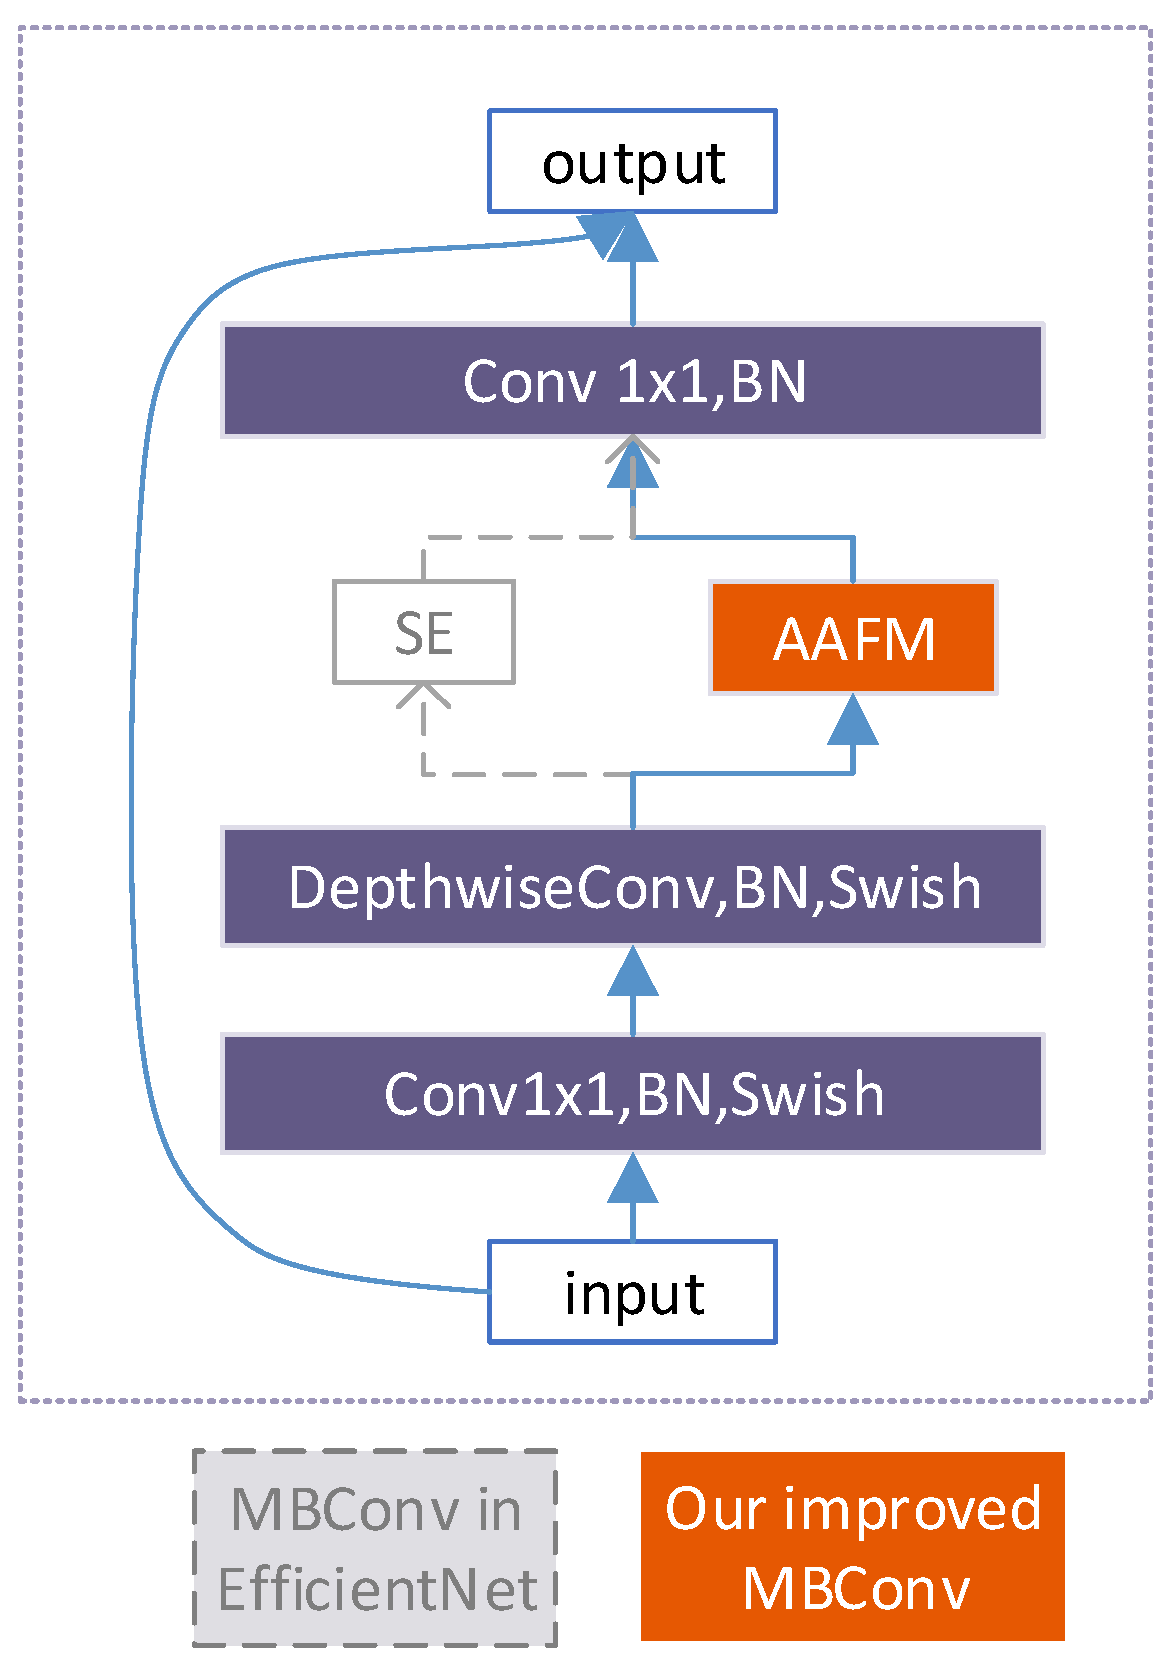
Inspired by the CBAM, a lightweight and effective attention module, we have designed an AAFM as an alternative to SE in the MBConv block of EffcicentDet backbone (Figure 4). The AAFM is composed of channel and spatial attention modules (Figure 5). In both modules, the max-pooled features and average-pooled features are adopted simultaneously for aggregating channel and spatial information. Moreover, a 1 × 1 convolution is added in the spatial attention module as compensation for learning ability when aggregating spatial information via pooling operations. Different from the form in which CBAM combines the two attention mechanisms in sequential, the AAFM combines two modules in parallel, which is proved to be the most effective manner. Specifically, the learnable adaptive fusion factors are introduced to adaptively fuse the feature information in the optimal proportion both inside the attention mechanism () and between the attention mechanism ().

Figure 4.
Basic block of EfficientNet.
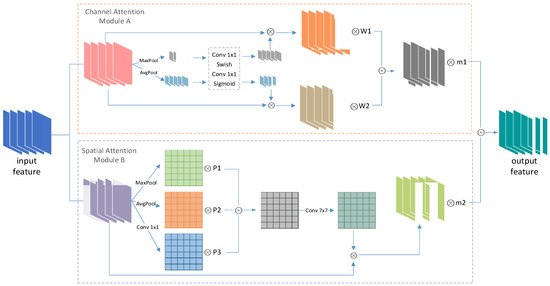
Figure 5.
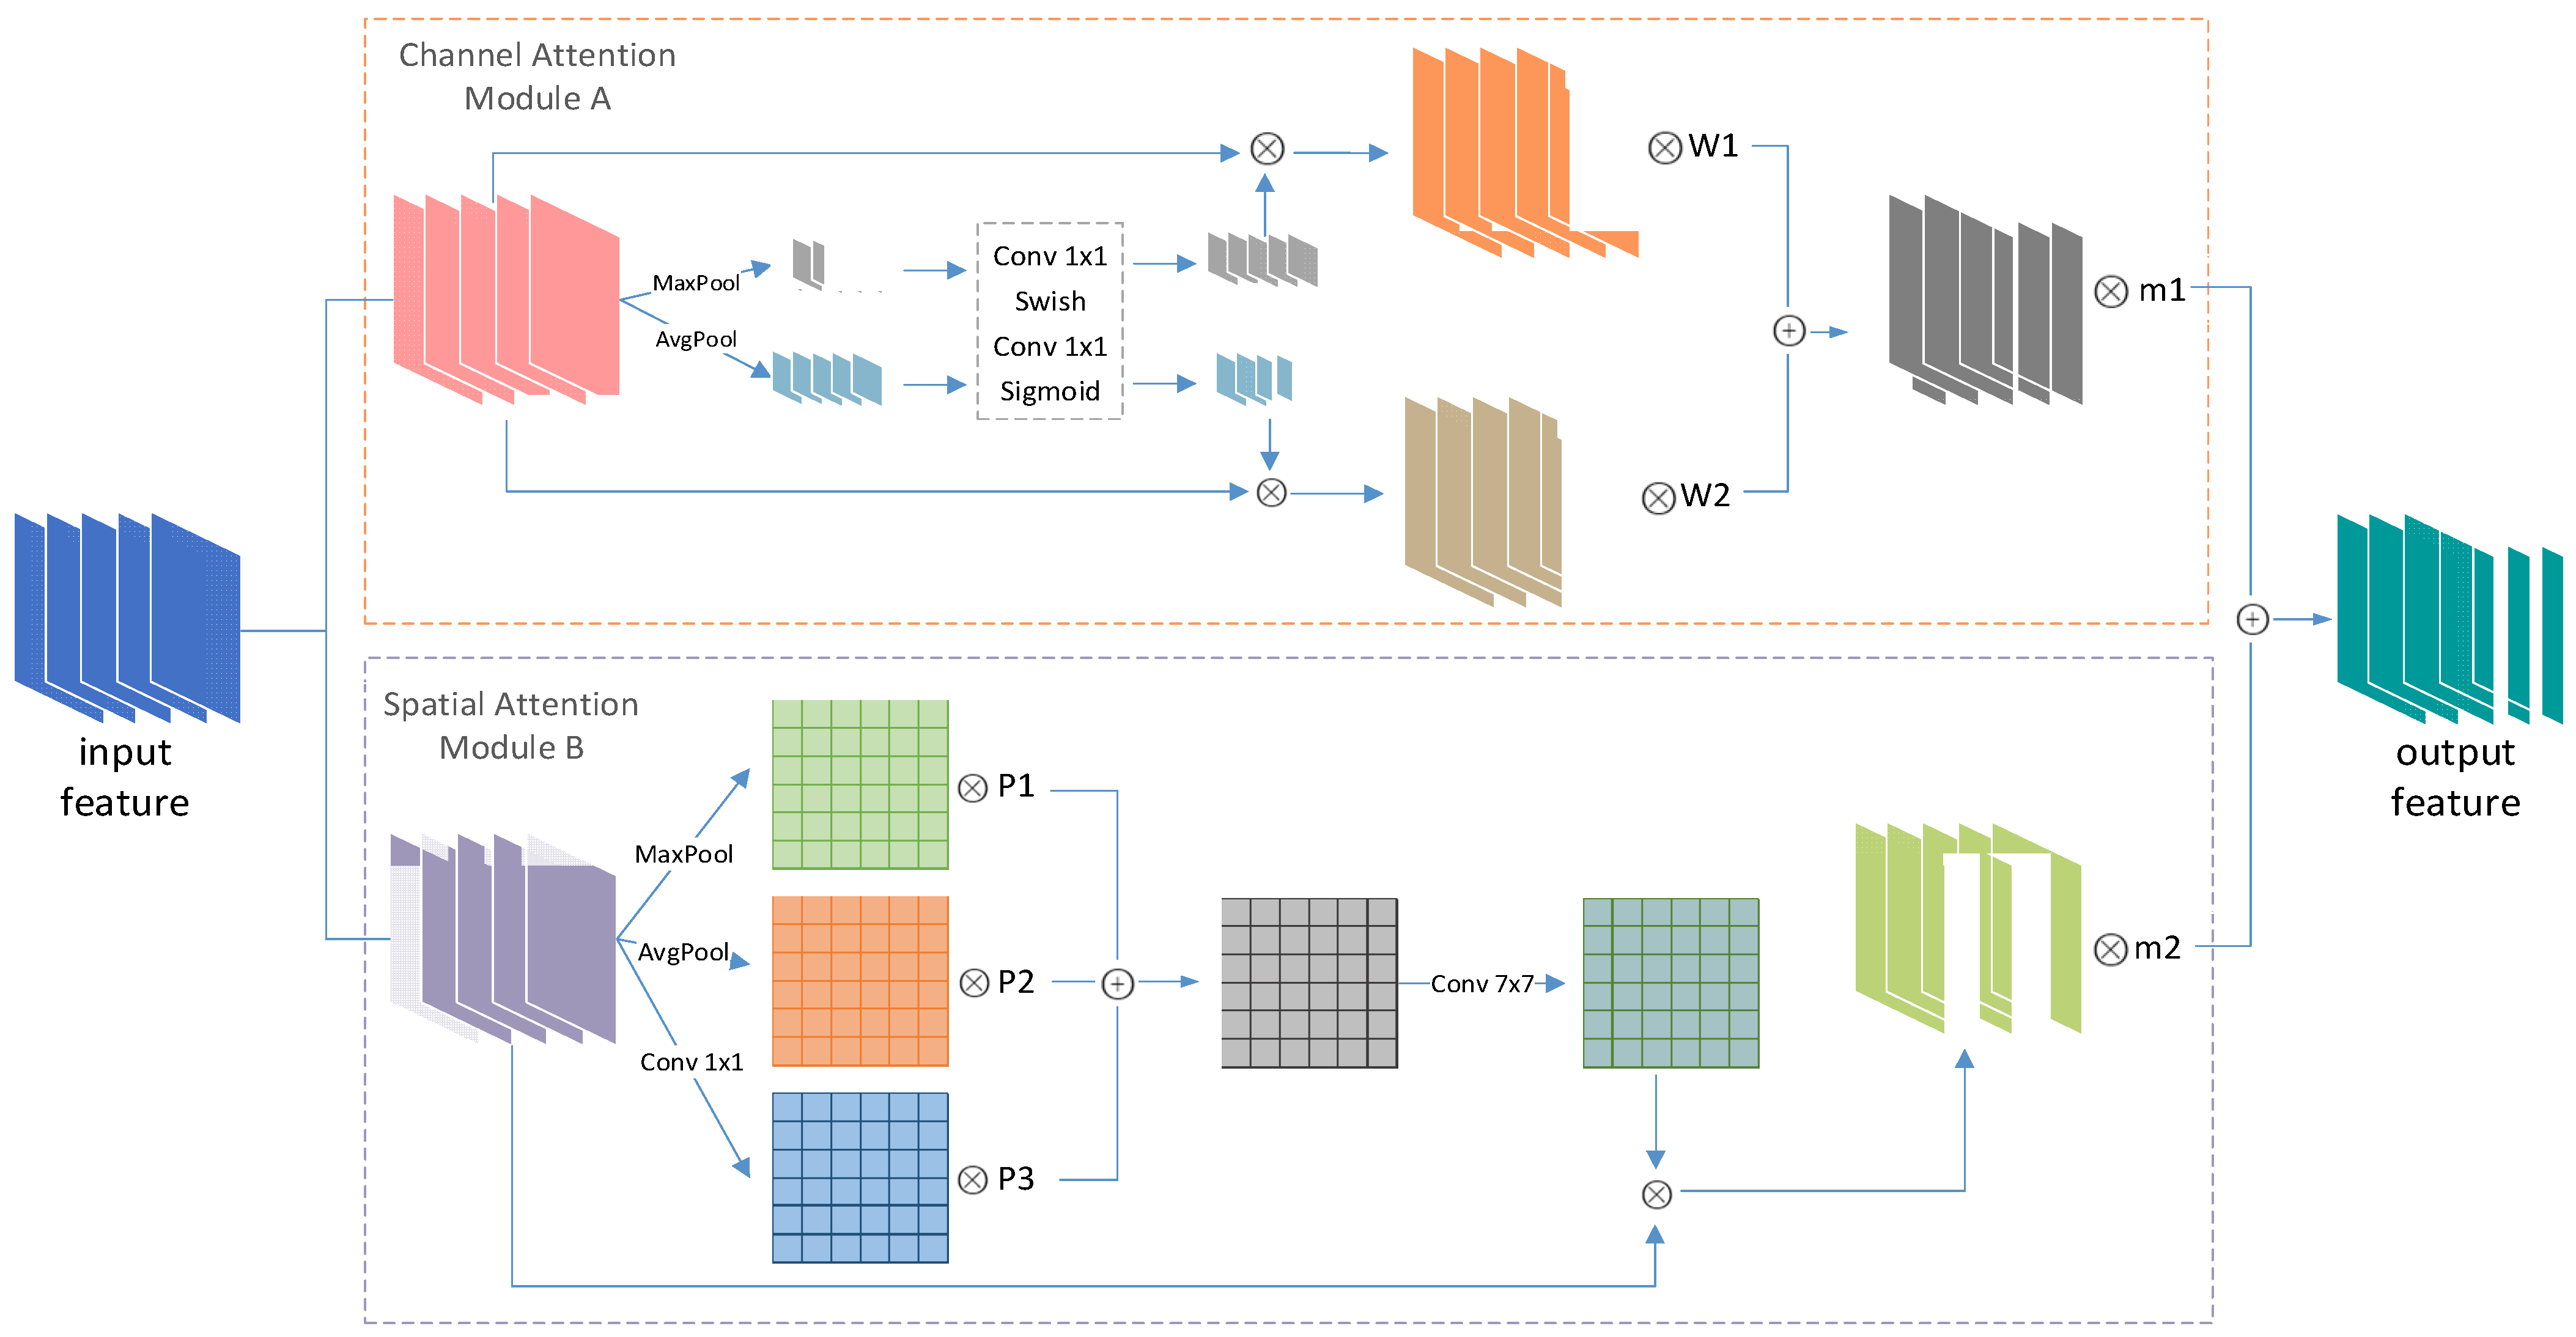
AAFM architecture.
The entire AAFM module is composed of the channel attention (A) and the spatial attention (B). The model A focuses on semantic information about what is useful for object detection, and the model B is designed to exploit the inter-spatial relationship of features to tell where the informative part is. The overall process is as Equation (1).
where is the output feature map, is the output feature of module A, B, and and are the adaptive fusion factors. In this paper, all of the learning factors are normalized.
For the channel attention model A, the first step is to perform max-pooling and average-pooling, respectively, for the input feature map (, where W, D, C are width, depth, and channels of the input feature map, respectively) to keep the textural features and the overall digital features. The channel attention weights are obtained via a non-linear mapping operation in which the features are aggregated. The non-linear mapping operation adopts the fully connected convolution to share the network parameters. Then, the normalized channel attention weights are multiplied channel by channel with the original input. Finally, we use the adaptive fusion factors W1 and W2 to aggregate the information from the max-pooling and average-pooling operations by an element-wise summation. The channel attention is computed as:
where is the output feature of the module A, is the input feature, Fc is the fully connected operation applying a non-linear mapping, and and are adaptive fusion factors. and .
For the spatial attention B, in addition to pooling, we add a 1 × 1 convolution layer to the input. Such an operation not only reduces the channel dimension but also encodes the representative information at each pixel over a channel, which compensates for the insufficiency of the fixed pooling method. Then, the three feature layers are concatenated by the element-wise summation with the learnable fusion factors (i.e., P1, P2, P3). Considering that the convolution with a larger kernel size has a wider receptive field, the concatenated layer is convolved by a 7 × 7 convolution kernel to produce the spatial attention weights. In this process, the context information is incorporated to further boost the feature discrimination. Finally, the normalized spatial attention weights multiply with the original input channel by channel to obtain a representative output feature. The spatial attention is computed as:
where is the output feature of module B, represents a convolution operation with the filter size of i × i, and are the learnable fusion factors. After the pooling and convolution operation, .
It is worth noting that the AAFM module does not change the size of the input feature, therefore it can be a good alternative to the channel attention mechanism in MBConv without any change of the network.
3.3. CIoU Loss
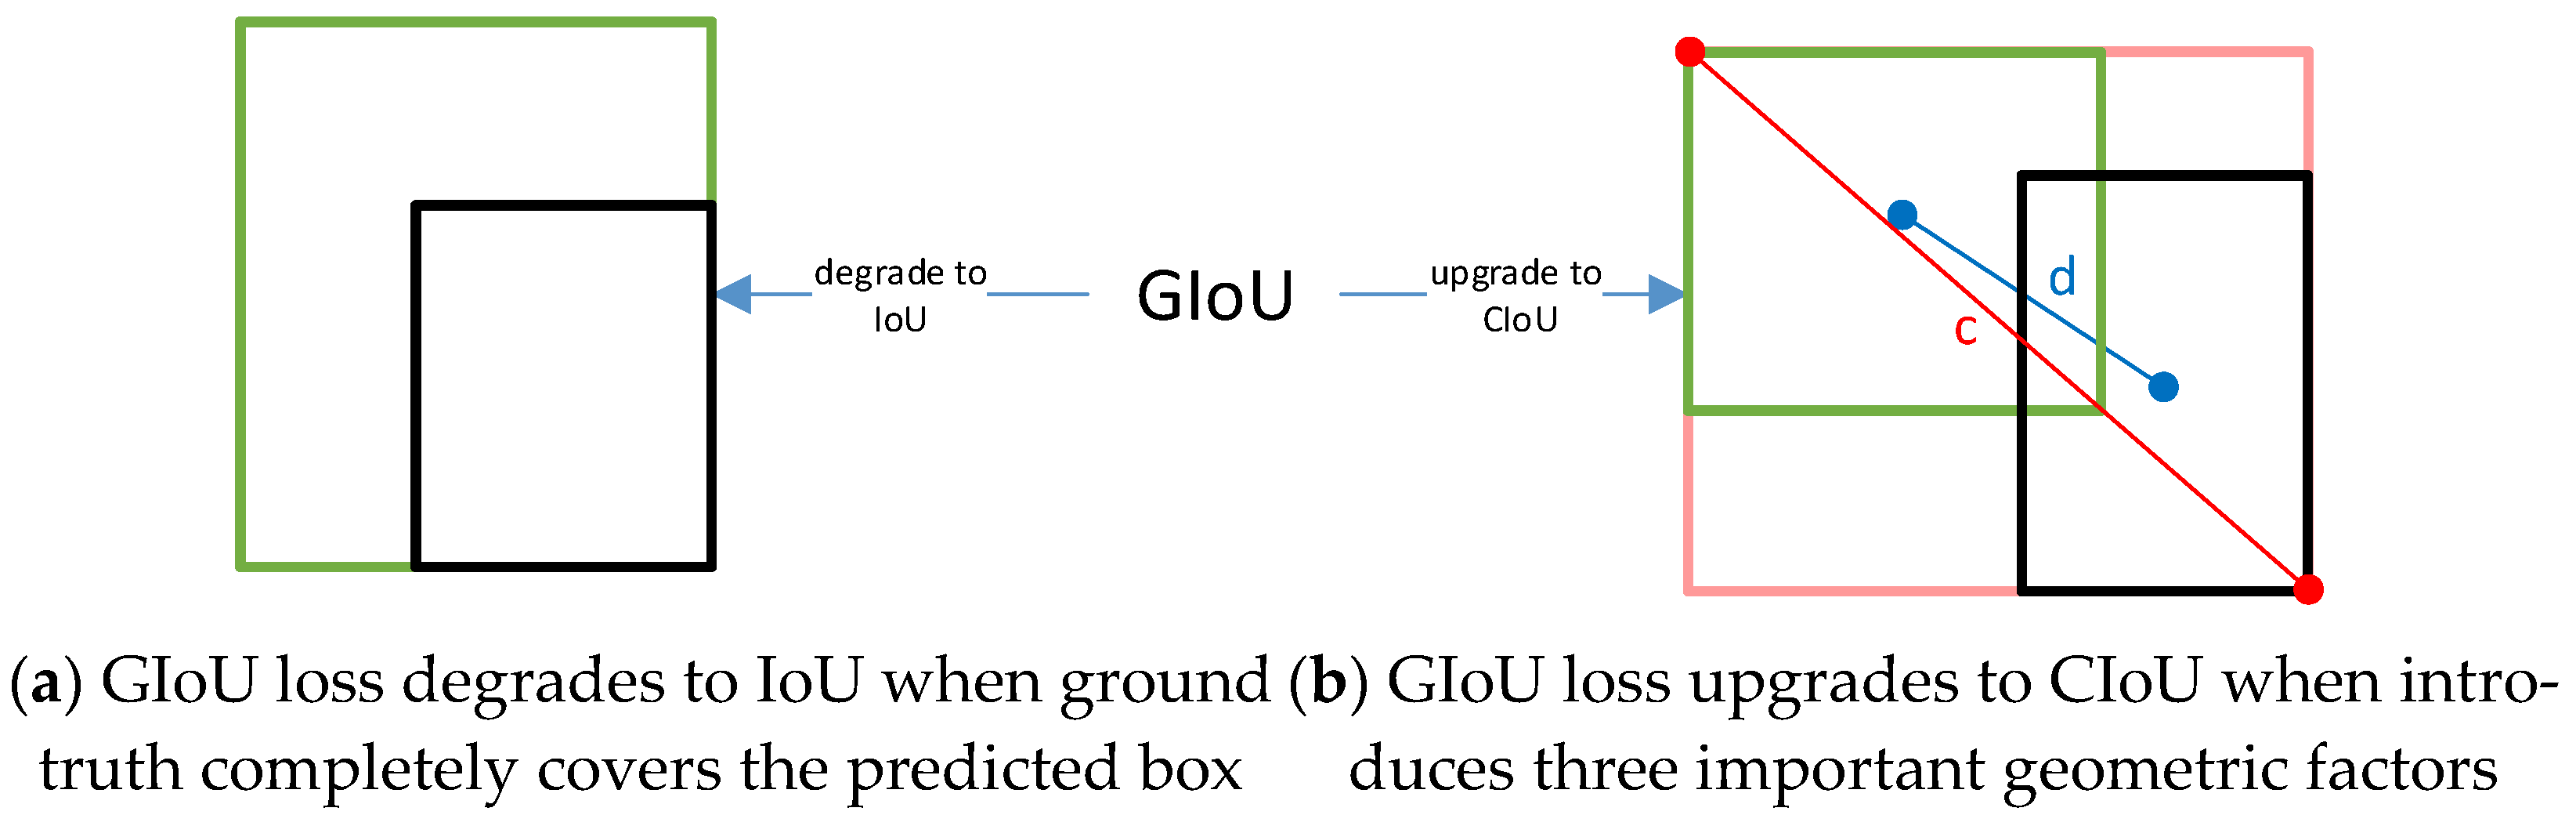
IoU is the most popular evaluation metric in bounding box regression. However, it cannot work in non-overlapping cases. The Generalized Intersection over Union (GIoU) loss can address this weakness by adding a penalty term of the smallest convex box, covering both the predicted box and the ground truth and maintaining the property of scale-invariant at the same time [25]. However, the GIoU loss tends to maximize the overlap area of bounding boxes; as shown in Figure 6a, the GIoU loss will totally degrade to the IoU loss when the ground truth encloses the predicted box. Given this, we adopt the CIoU loss. The CIoU loss introduces three important geometric factors: the center point distance, the overlap area, and the aspect ratio (Figure 6b), where c is the diagonal length of the smallest enclosing box covering the predicted box and the ground truth and d is the distance between the centers of two bounding boxes. The loss function can be defined as Equations (4)–(6). The full consideration of the position relationship between the two boxes makes the CIoU loss more robust for the cases with occlusions and leads to faster convergence and better regression performance.
where, b and denote the center points of the predicted box and the ground truth, respectively, ρ(∙) is the Euclidean distance, c is the diagonal length of the minimum enclosing boxes covering the two boxes, h; w is the width and height of the box, v is a measurement to the aspect ratio, and α is a positive trade-off parameter.
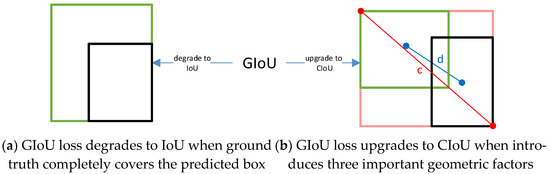
Figure 6.
IoU change (black and green denote predicted box and ground truth).
4. Dataset
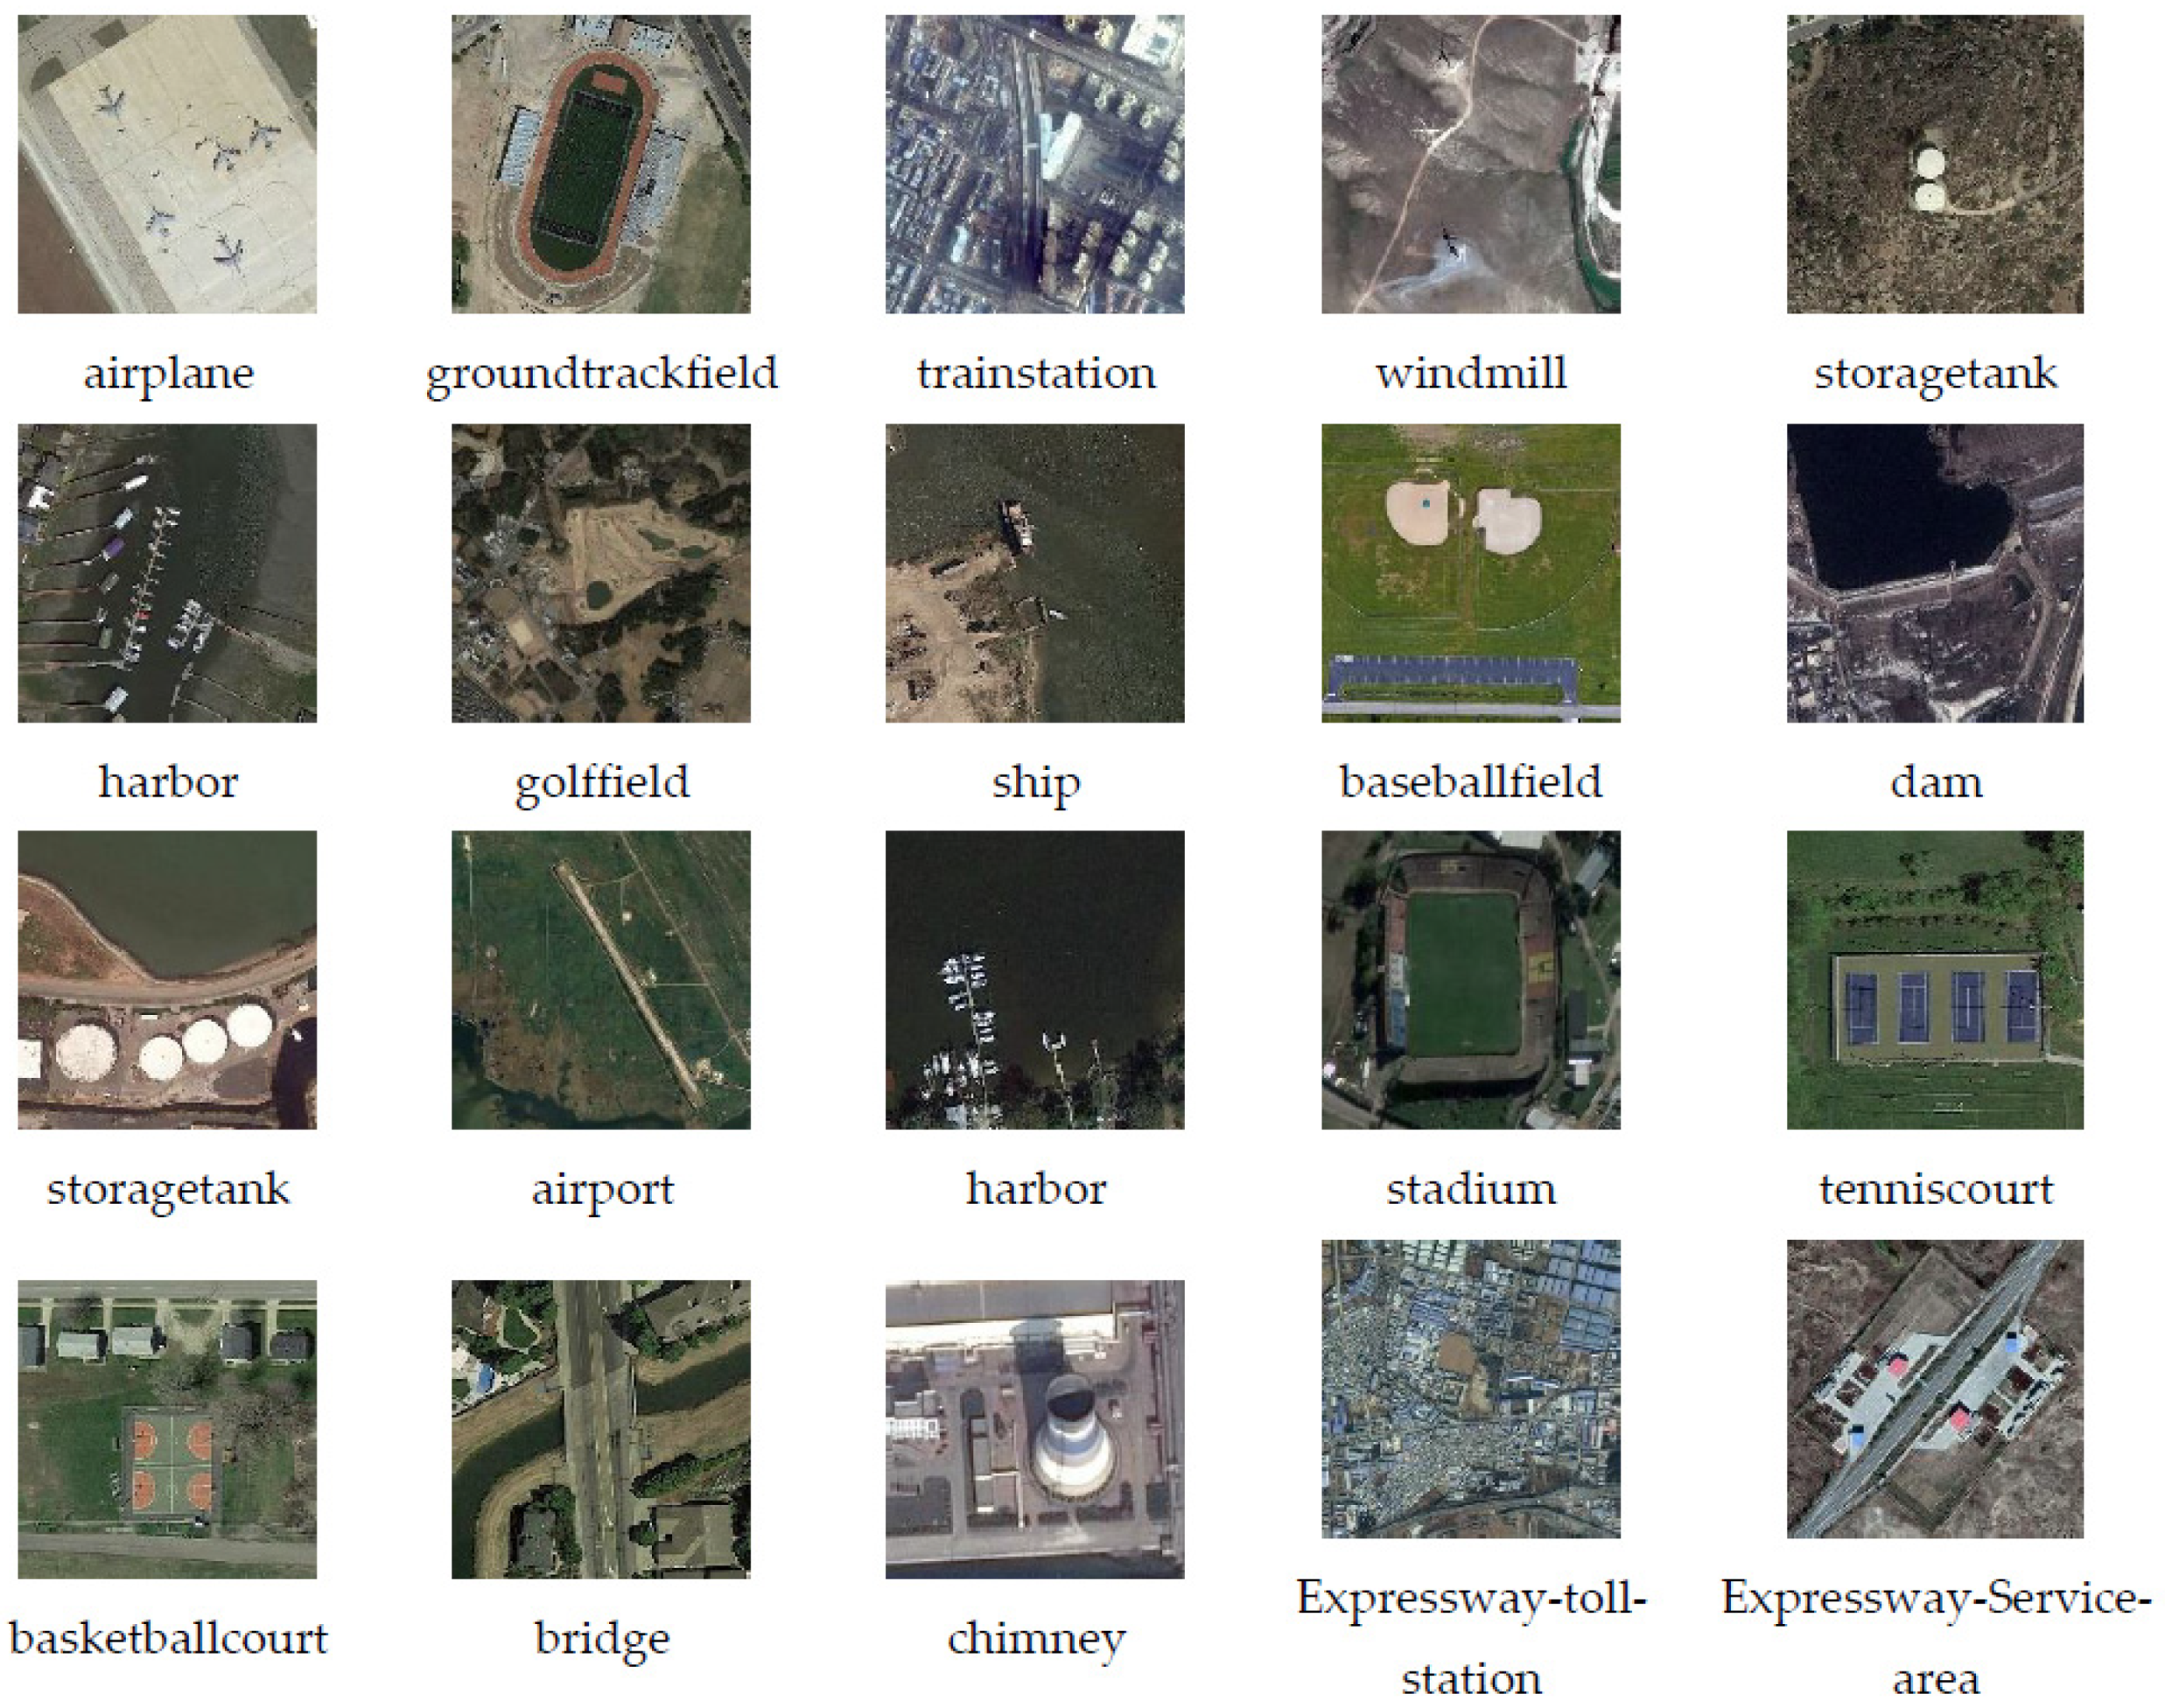
The DIOR dataset consists of 23,463 images with 192,472 object instances from 20 categories such as airports, dams, ships, bridges. etc. The size of each image is 800 × 800 pixels, with a 0.5–30 m spatial resolution. The main reasons for choosing it for object detection are as follows: (1) DIOR is characterized by multi-category, multi-image, and multiple-instance. (2) Both the spatial resolution of the images and the object scales are variable. (3) As the images are collected in different imaging conditions, weather, seasons, and from different sensors, the samples are rich and diverse enough. (4) The high intra-class diversity and the low inter-class difference increase the difficulty of detection, making the training model more versatile. Figure 7 shows some samples of each category in DIOR.
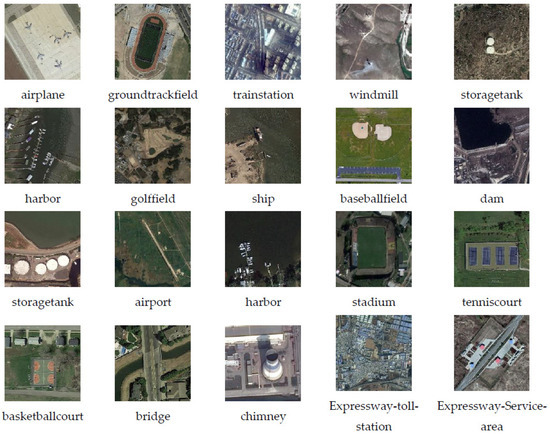
Figure 7.
Data samples in DIOR.
Since the stitcher is applied in the experiment, both the number of images and the instances of each category increase. A comparison of the number of objects in the original dataset and the stitched dataset is shown in Figure 8. In the following experiments, there are 18,462 training images and 7001 validation images separated by a ratio of 2:8, while the validation set does not contain the stitched images.
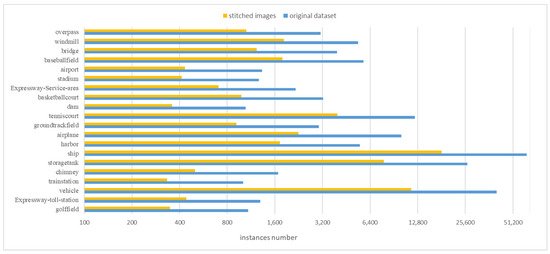
Figure 8.
Comparison of the instance objects number.
5. Results and Analysis
All the above experiments are implemented on Ubuntu 9.3.0-17ubuntu1~20.04 system, Intel(R) Xeon(R) CPU E5-2640 v4 @ 2.40 GHz CPU, Tesla P40 graphics cards, and 24 G video memory. The overall configuration is relatively high. The experimental software is configured with PyTorch, cuda11.0, and cuDNN v8.0.5.
The Average recall Precision (AP) and mean Average Precision (mAP) are adopted as the evaluation criteria. The main indicator AP refers to the average recall rate of the detection in the range of 0 to 1, computed according to the area under the precision-recall curve. The precision P (Equation (7)) and the recall R (Equation (8)) are defined as:
where TP, FP and FN are the numbers of true positive cases, false positive cases and false negative cases, respectively.
A detection map will be considered to be a TP when the IoU exceeds the given threshold (e.g., 0.5). The IoU is the overlap ratio between the predicted box and the ground truth, defined as:
where A and B are the ground truth and the predicted box.
In the training stage, there is a total of 26,463 images of 800 × 800 pixels after data augmentation. The Stochastic Gradient Descent (SGD) optimizer is used in training. The weight decay and momentum are set to 0.0004 and 0.9, and the initial learning rate is 0.0005. In each iteration, 16 images selected from the training set are input into the network for training. Training stops as the loss function converges.
In order to evaluate the performance of our model, we compare it with previous state-of-art models, including SSD, YOLOv4, and EfficientDet. Since the stitcher is an image preprocessing operation, all of the four models have adopted it for data augmentation to ensure a fair comparison.
Table 3 lists the details of the accuracy comparison. It can be seen that the AP of the proposed model is slightly lower compared with YOLOv4 for the chimney. This may be due to YOLOv4 adopting Self-Adversarial Training and Multi-input weighted residual connections that benefit the performance of this category. Besides, compared with all detectors, we achieve better performance in terms of not only AP metric but also mAP.
Table 3.
Accuracy comparison of different algorithms.
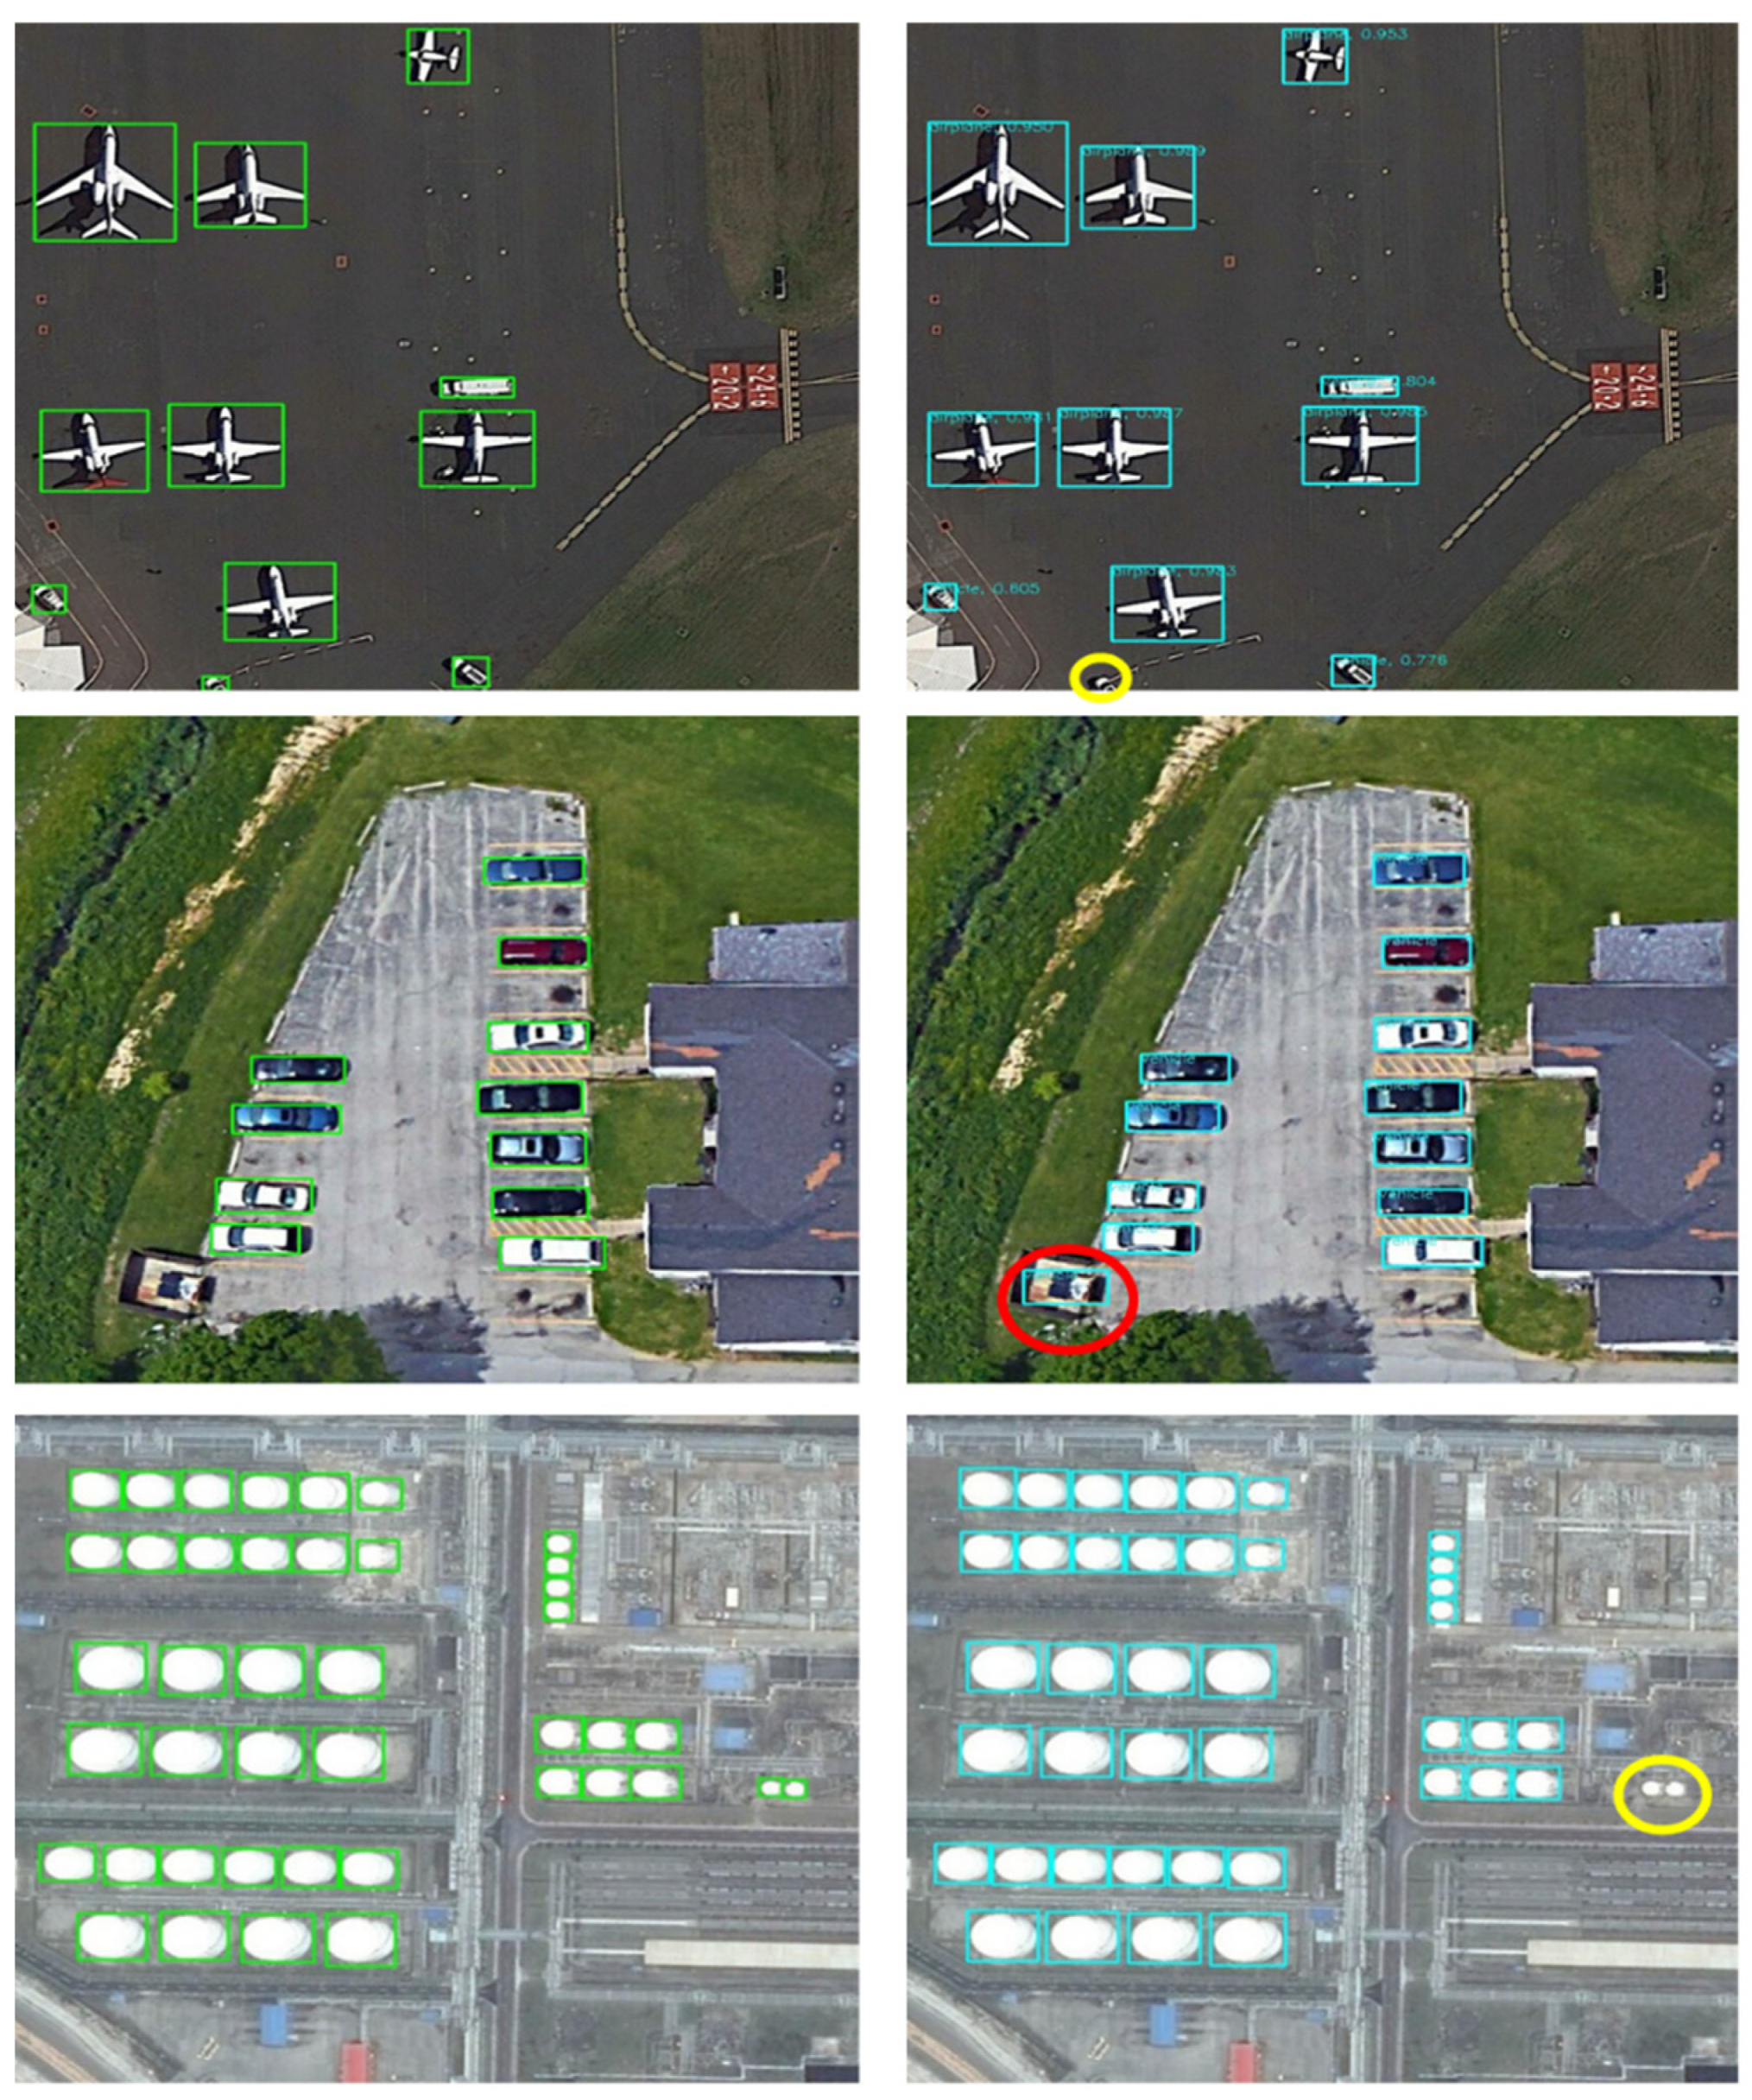
In Figure 9, several typical objects (aircraft, vehicles, storage tanks) are selected to make a visual display of the detection results of the proposed method. The yellow and red donate misdetection and false detection, and the green and blue rectangles are the ground truth and the detection box, respectively. Due to the proposed AAFM, which can extract richer and more targeted features, as well as the CIoU loss achieving superior box regression results, our model can efficiently tackle multi-scale object recognition and location, with the predicted box closer to the ground truth, while misdetection and false detection mostly occur in small scales and fuzzy boundaries.
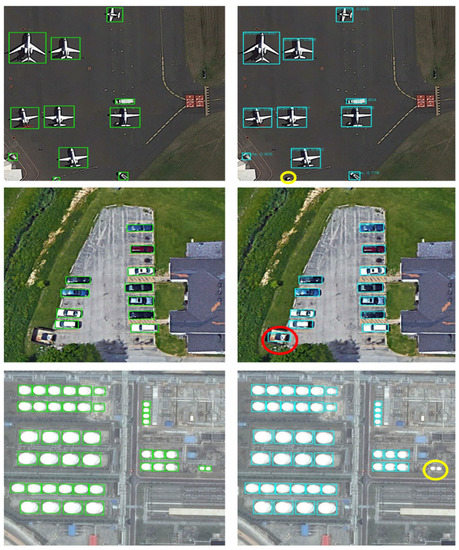
Figure 9.
Typical object detection results (left) ground truth; (right) bounding box.
To evaluate the effectiveness of the stitcher, we carry out a comparative experiment between the original DIOR dataset and the augmented dataset in four models. The results are shown in Table 4. We also compare the accuracy between different scales in our model based on two datasets. The test results are shown in Table 5. As Table 4 shows, the stitcher can certainly improve the accuracy of all four models. For the SSD model with lower accuracy, the mAP improvement is more obvious. As for YOLOv4, since it has already applied a similar data augmentation operation, the accuracy is only slightly improved. In addition, it can be clearly found from Table 5 that there is a consistent mAP improvement among all scales of the augmented dataset. This is mainly due to the stitcher, which balances the distribution of multi-scale objects. Moreover, the image augmentation has expanded the sample size, so that the proposed model has higher robustness.
Table 4.
Accuracy comparison of different datasets.
Table 5.
Accuracy results at different scales of our model.
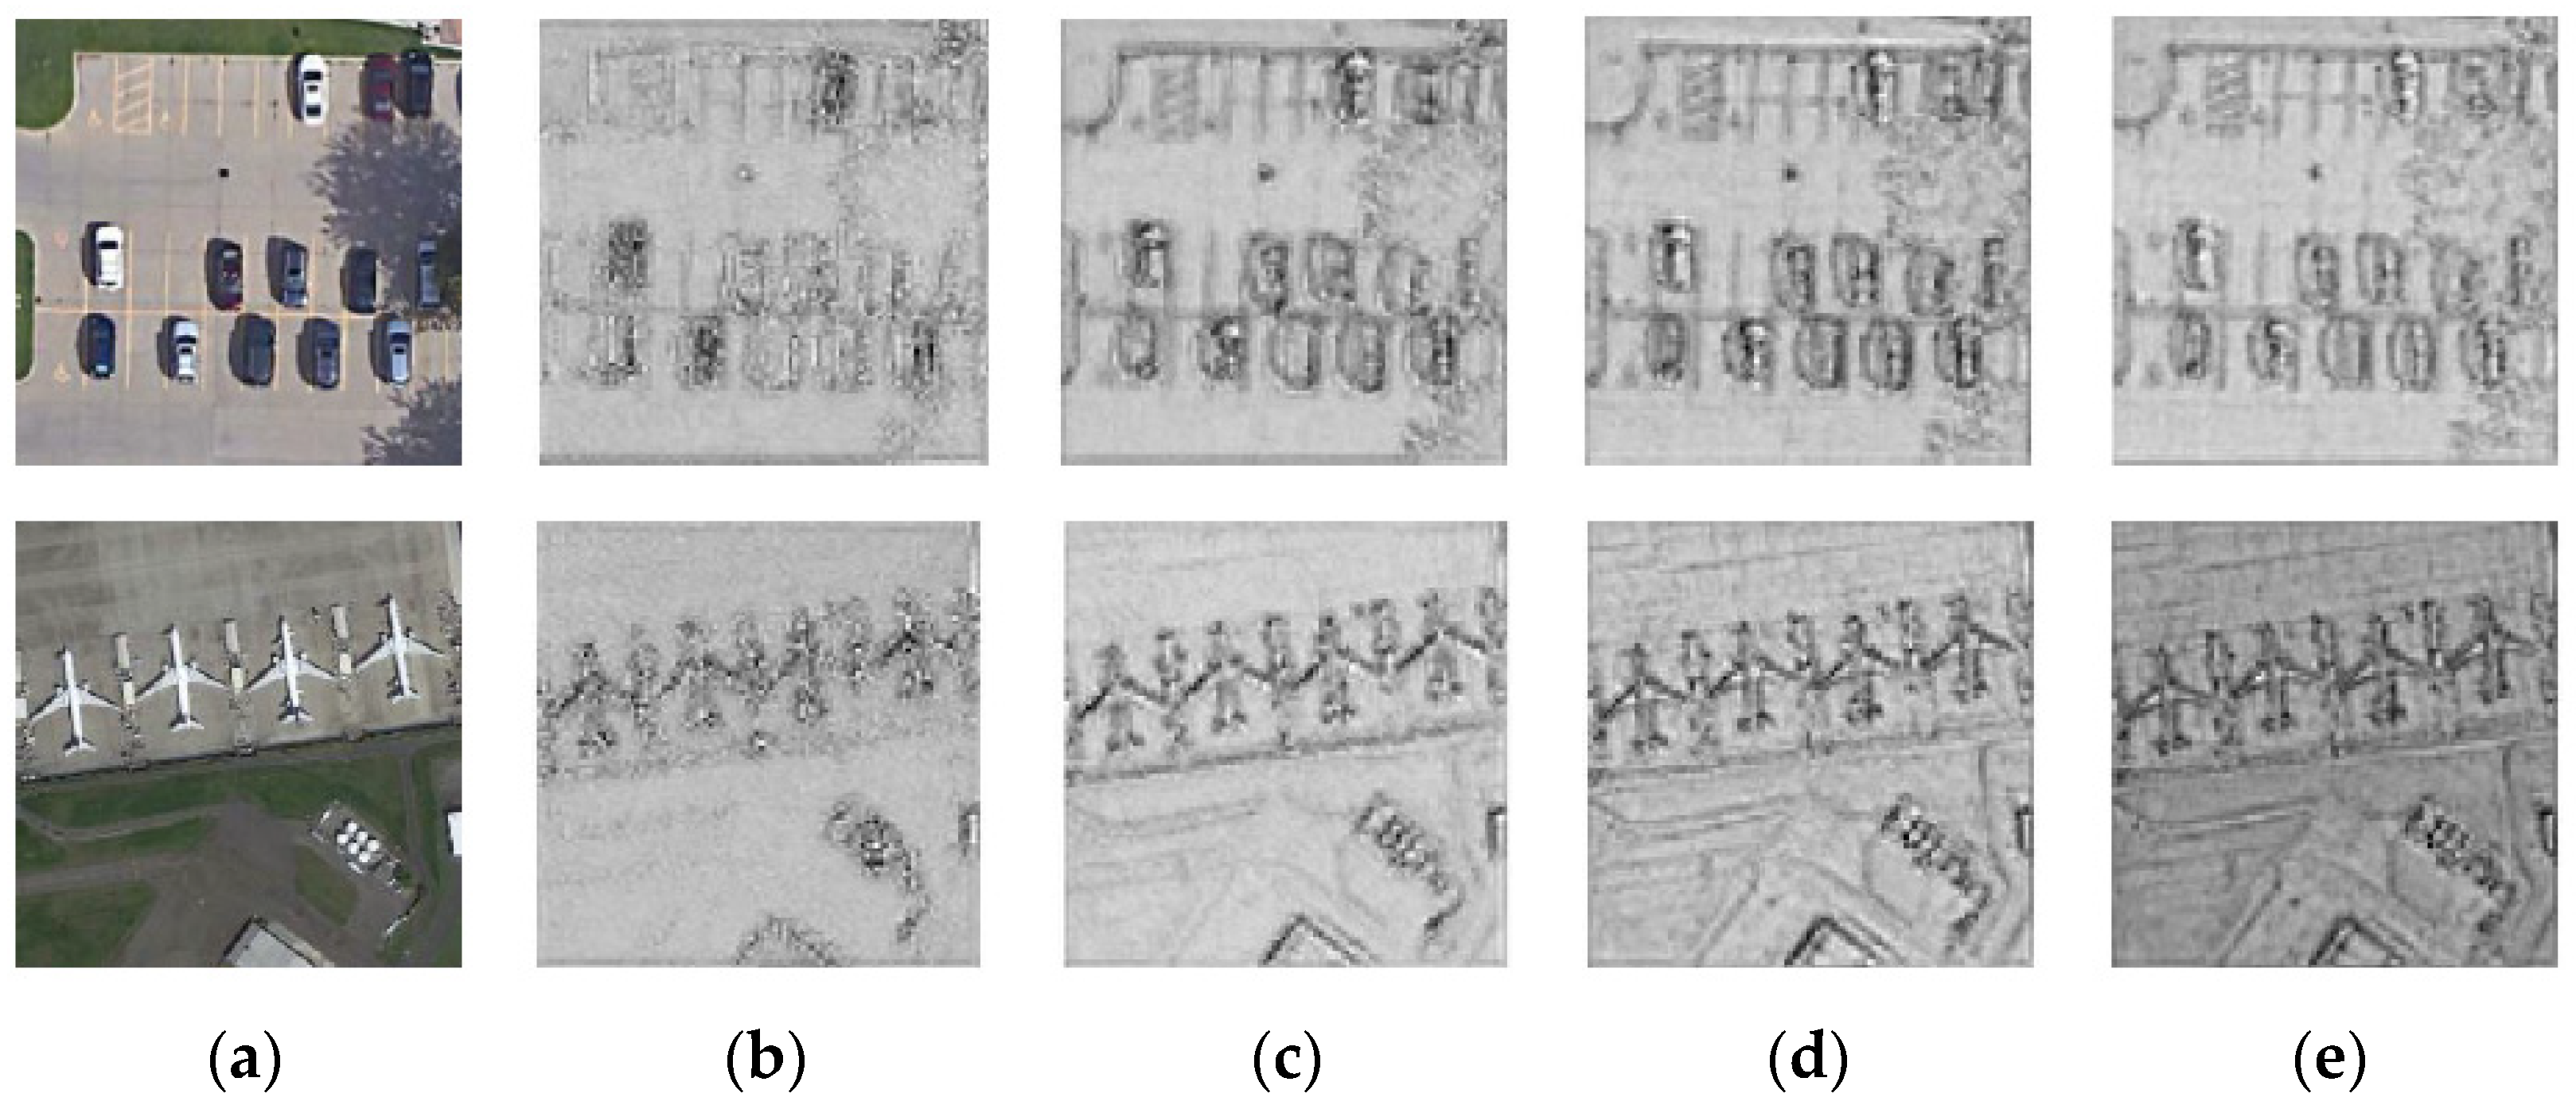
AAFM plays an important role in the feature extraction of the entire network. It continuously optimizes the output representation of the spatial and the channel attention through the learnable weights, which is ultimately conducive to accuracy improvement. To confirm the effectiveness of AAFM, we made extensive ablation studies. Table 6 gives the experimental results with various attention approaches, and Figure 9 shows the feature maps that present the effect of these attention methods directly.
Table 6.
Results of different attention methods.
As Table 6 shows, using learnable factors to fuse features after pooling and convolution can produce better accuracy for both channel attention and spatial attention. Moreover, the mAP in parallel connection is increased by 0.86 and 1.21 percent compared with putting each model, respectively. It is confirmed that exploiting two attention models in parallel greatly improves the representation performance of networks. In addition, we can observe that the module B achieves higher accuracy when adding a 1 × 1 convolution layer for learnable weighted channel pooling. Additionally, the better accuracy with a larger kernel size indicates that a larger receptive field is needed to decide where to focus on. The visualization of the third feature map (Figure 10c) demonstrates that the performance of the channel attention model is significantly better than the spatial attention model (Figure 10b). Thus, we use the spatial attention model as an auxiliary to make the target representation more distinguishable (Figure 10e). Moreover, the parallel fusion strategy with the adaptive factors obtains the best mAP of 69.83%. These results show that the spatial attention model and the channel attention model can be optimally connected in parallel through the adaptive fusion factors, thereby achieving the best network performance in the end.
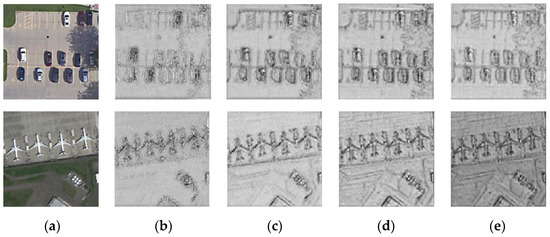
Figure 10.
Visualization of feature maps. (a) original image. (b) model B. (c) model A. (d) model A + model B in parallel. (e) model A + model B with adaptive factors.
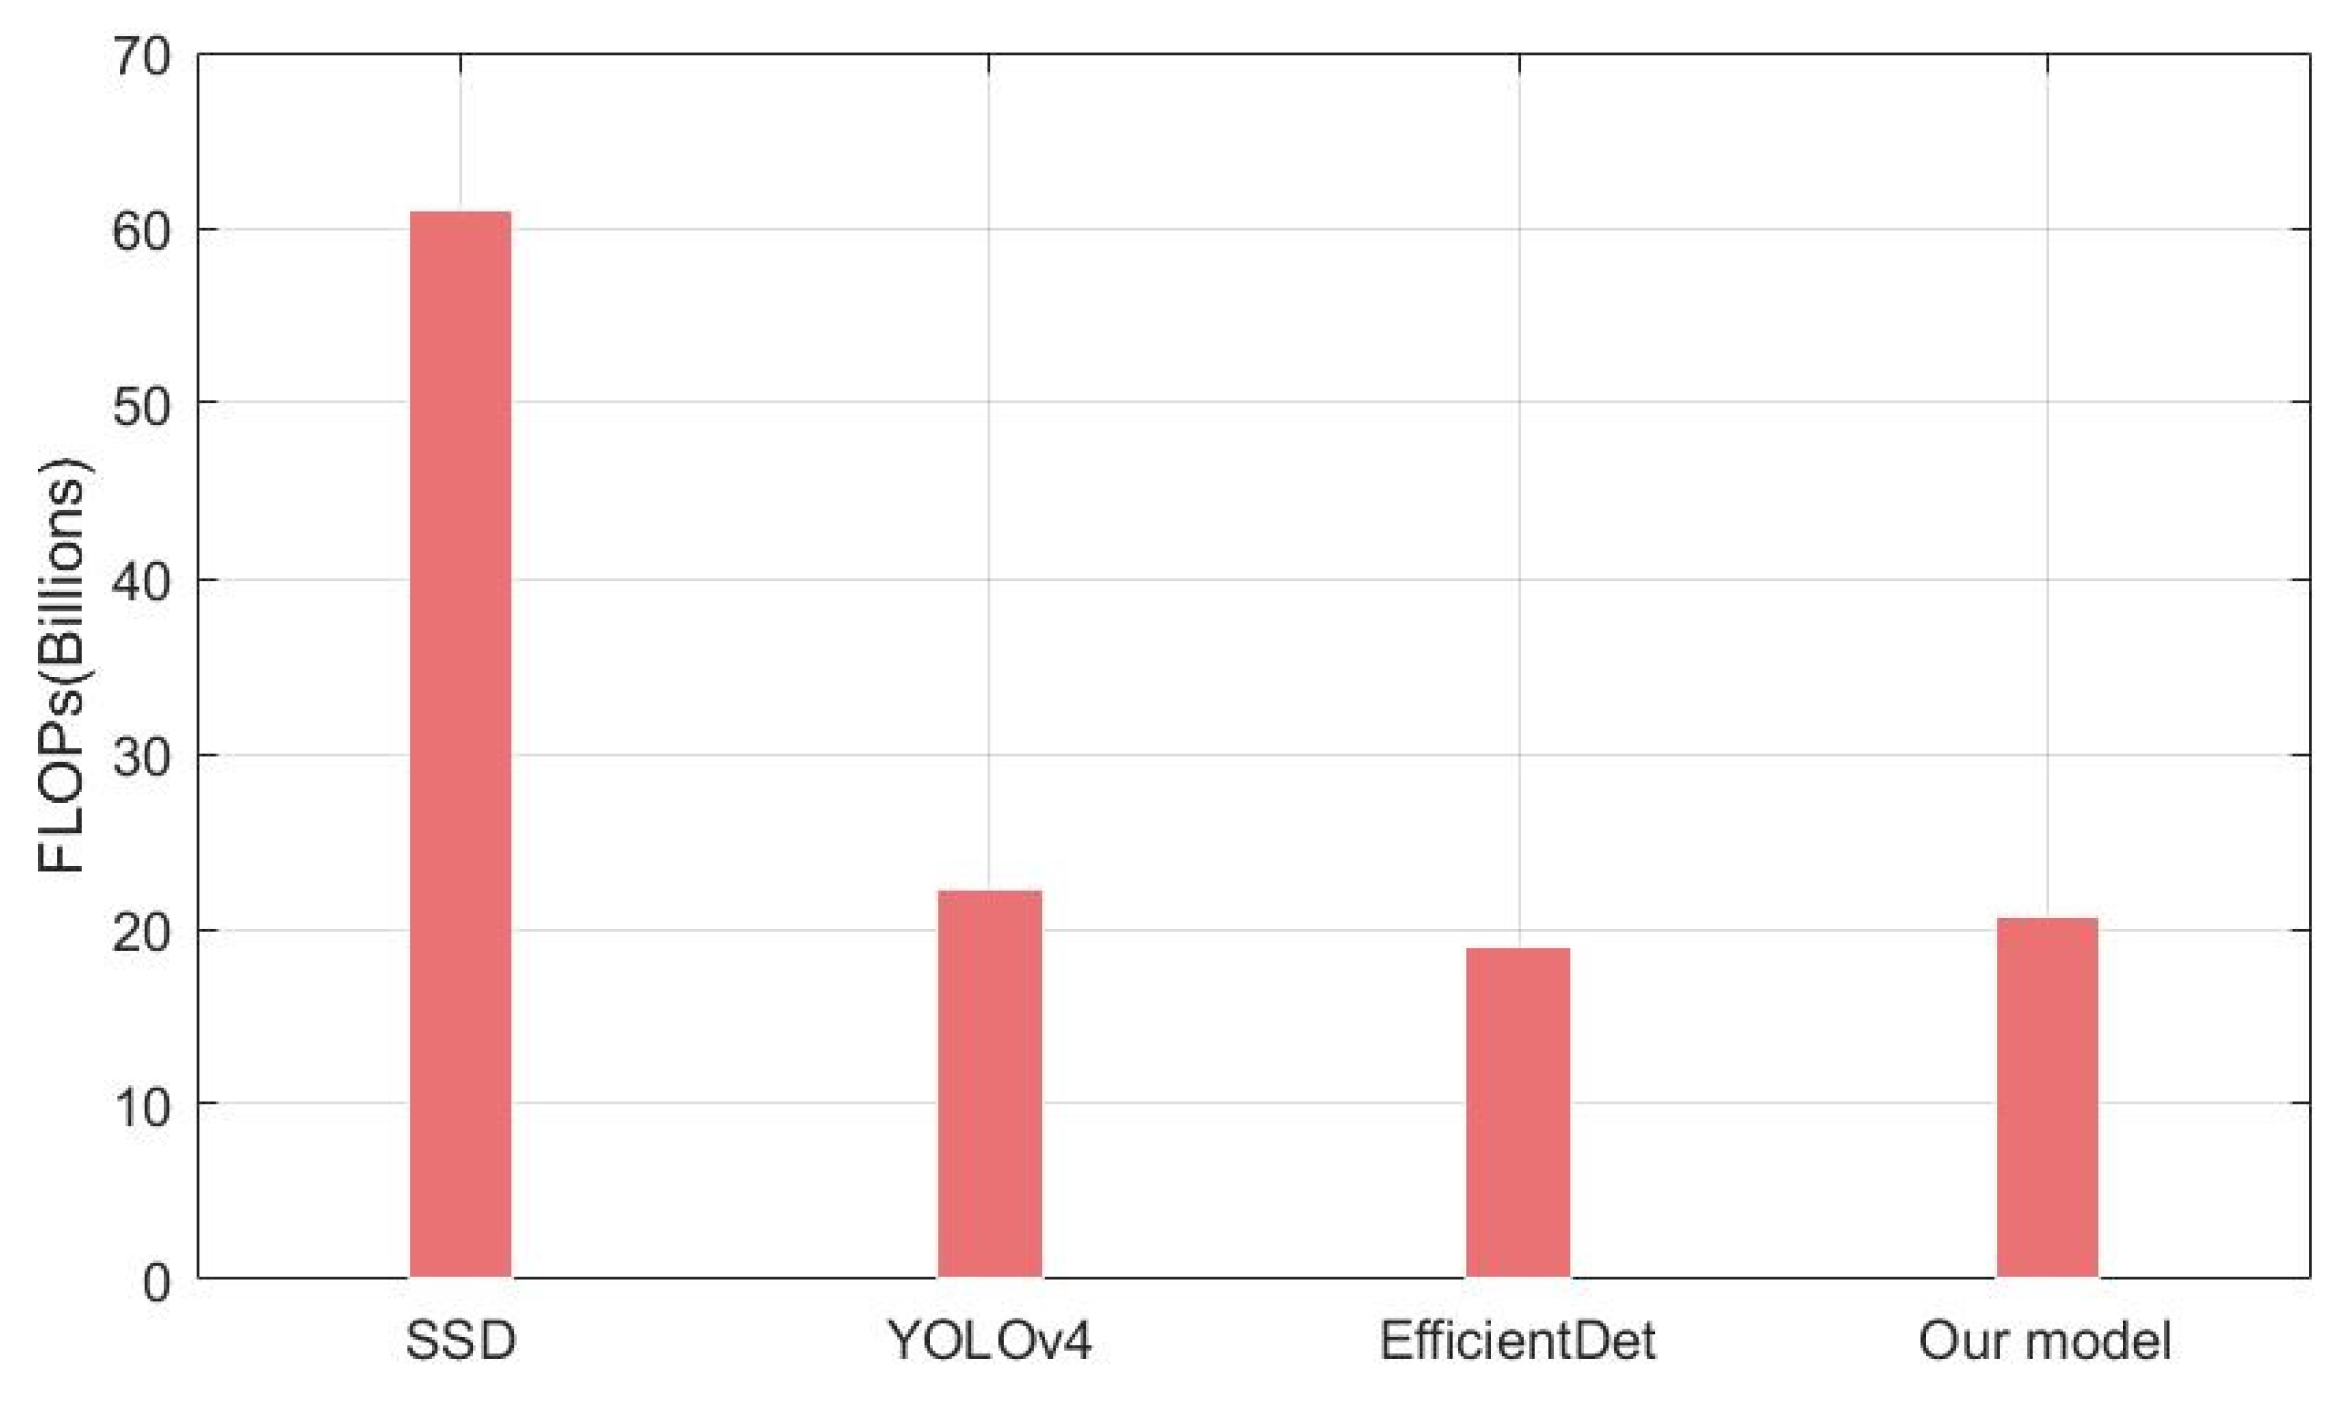
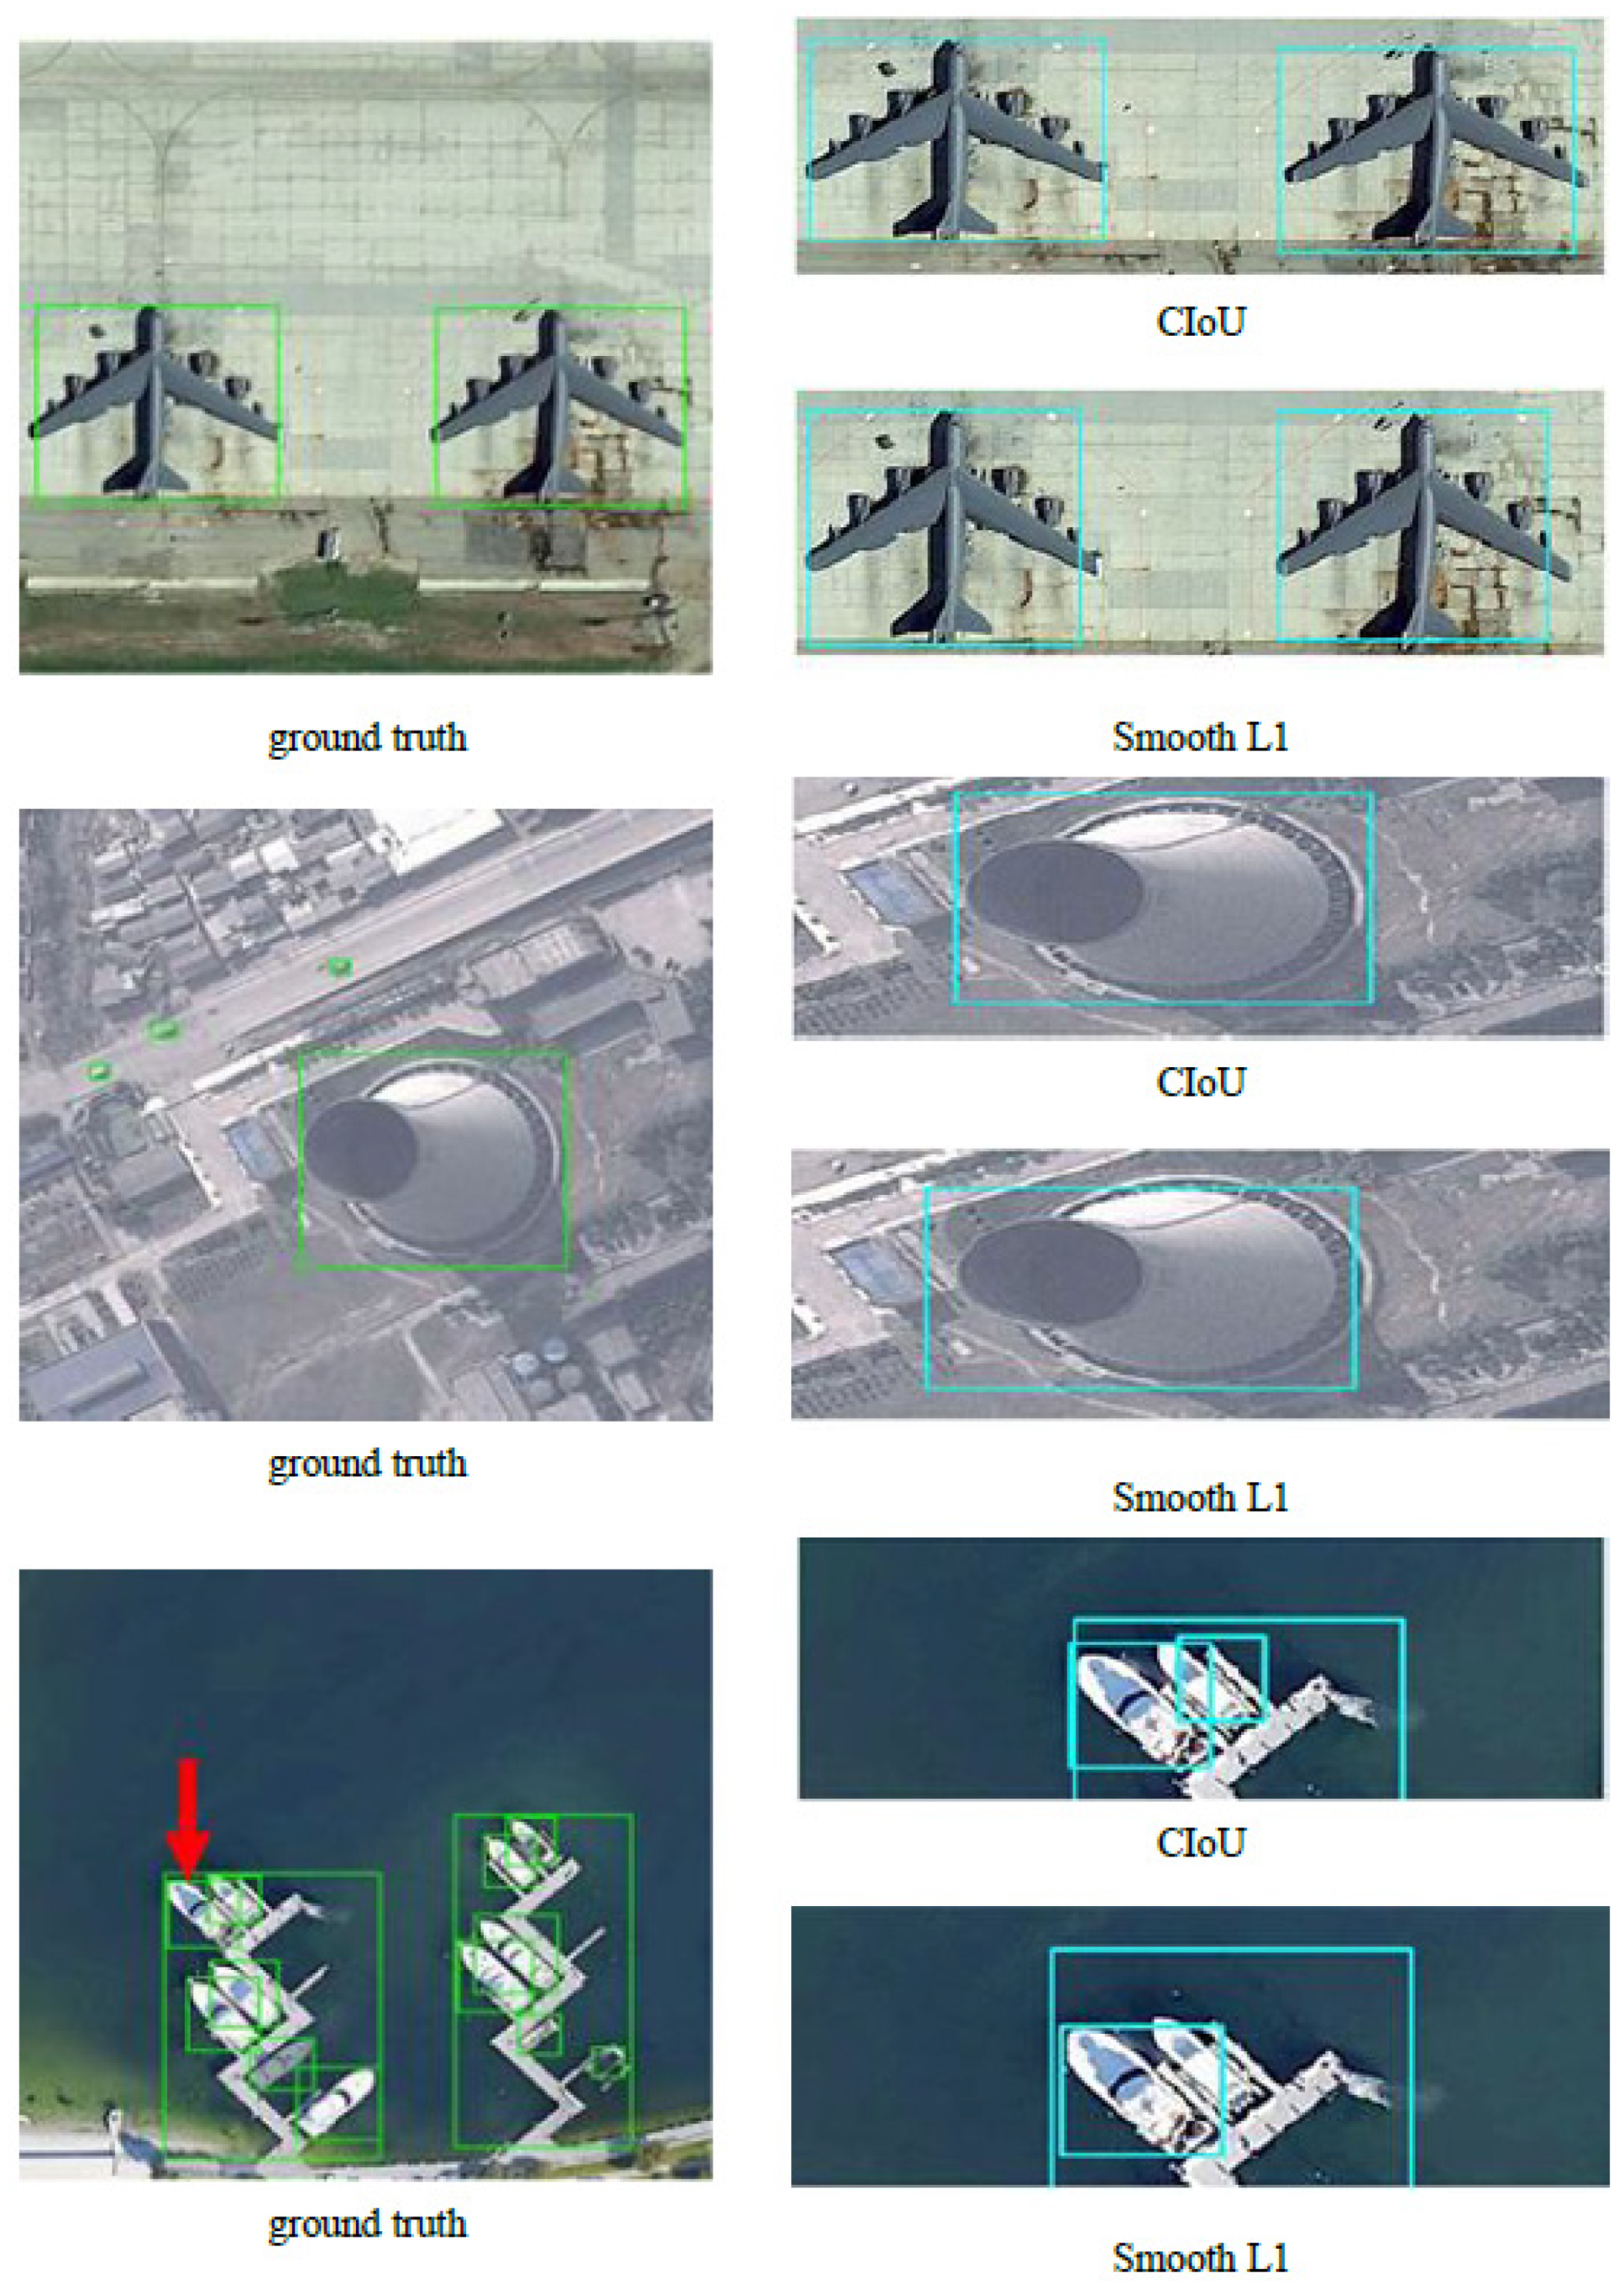
The CIoU loss comprehensively considers the three important geometric factors in bounding box regression: the normalized center point distance, the overlap area, and the aspect ratio. The mAP value has been improved (Figure 11) when using the CIoU loss instead of the Smooth L1 in all different object detectors. It is noteworthy that our model outperforms EfficientDet on accuracy with slightly higher FLOPs (Figure 12). In general, however, the accuracy improvement can compensate for the speed insufficiency. Moreover, it can be intuitively seen from Figure 13 that the predicted box is closer to the ground truth when using the CIoU loss. That is to say, the position of the ground objects is located more precisely. In addition, from the ship detection corresponding to the red arrow, it can be found that the CIoU loss can better handle the high overlap cases.
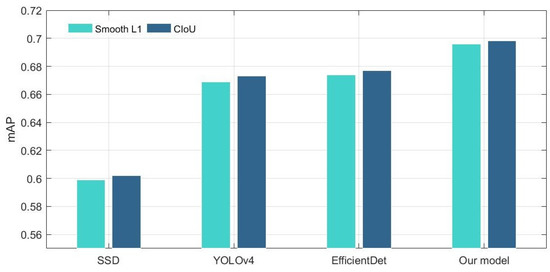
Figure 11.
mAP comparison of the different loss function.

Figure 12.
FLOPs comparison of different models.

Figure 13.
Visual detection results comparison of different loss functions.
6. Conclusions
In this paper, we propose an AAFM-enhanced one-stage model for object detection. The proposed model employs various techniques, including the stitcher, AAFM, and CIoU. Firstly, we adopt the stitcher, a feedback-driven data provider for training sets, to handle the difficulty caused by multi-scale objects and small objects. Four images selected randomly from DIOR are combined and scaled into a fixed size image for data augmentation and multi-scale proportion balance. Then, we innovatively build AAFM for the network. In this module, the parallel channels and spatial attention model realize the optimal feature fusion by the learnable fusion factors. Finally, the CIoU loss is used to optimize the detection performance of the predicted box, making it precisely cover the ground truth. A series of experiments are performed to make a quantitative comparison of accuracy and efficiency with SSD, YOLOv4, and EfficientDet, where we respectively carried out quantitative evaluation or qualitative effectiveness comparisons of the stitcher, AAFM, and CIoU loss. The results demonstrate that each part greatly contributes to performance improvement. Based on those optimizations, our model significantly achieves higher accuracy compared with the other models. Moreover, we reduce the rate of misdetection with the predicted box covering the ground truth more precisely. Since the stitcher increases the complexity of data preprocessing and the AAFM module adds a few learning parameters, we found that the proposed method increases the computational load. In the future, we plan to further optimize the network model to reduce the training time as well as improve the detection accuracy.
Author Contributions
Y.Y. and X.R. developed the method and wrote the manuscript. B.Z., T.T. and X.T. designed and carried out the experiments. Y.G. and Q.Y. reviewed and edited the manuscript. All authors have read and agreed to the published version of the manuscript.
Funding
This research was funded by the National Natural Science Foundation of China (No.41971281 and No. 41961053) and the Sichuan Science and Technology Program (No. 2020JDTD0003).
Institutional Review Board Statement
Not applicable.
Informed Consent Statement
Not applicable.
Data Availability Statement
Publicly available datasets were analyzed in this study. This data can be found here: http://www.escience.cn/people/gongcheng/DIOR.html, accessed on 17 December 2021.
Conflicts of Interest
The authors declare no conflict of interest.
References
- Janakiramaiah, B.; Kalyani, G.; Karuna, A.; Prasad, L.V.N.; Krishna, M. Military object detection in defense using multi-level capsule networks. Soft Comput. 2021, 1–15. [Google Scholar] [CrossRef]
- Hu, Q.; Paisitkriangkrai, S.; Shen, C.; Hengel, A.V.D.; Porikli, F. Fast Detection of Multiple Objects in Traffic Scenes With a Common Detection Framework. IEEE Trans. Intell. Transp. Syst. 2015, 17, 1002–1014. [Google Scholar] [CrossRef] [Green Version]
- Pi, Y.; Nath, N.D.; Behzadan, A.H. Convolutional neural networks for object detection in aerial imagery for disaster response and recovery. Adv. Eng. Inform. 2020, 43, 101009. [Google Scholar] [CrossRef]
- Histograms of Oriented Gradients for Human Detection. In Proceedings of the IEEE Computer Society Conference on Computer Vision & Pattern Recognition, San Diego, CA, USA, 20–25 June 2005.
- Aytekin, Ö.; Zongur, U.; Halici, U. Texture-Based Airport Runway Detection. IEEE Geosci. Remote. Sens. Lett. 2012, 10, 471–475. [Google Scholar] [CrossRef]
- Weber, J.; Lefevre, S. A Multivariate Hit-or-Miss Transform for Conjoint Spatial and Spectral Template Matching; Springer: Berlin/Heidelberg, Germany, 2008. [Google Scholar]
- Kamilaris, A.; Prenafeta-Boldú, F.X. Deep learning in agriculture: A survey. Comput. Electron. Agric. 2018, 147, 70–90. [Google Scholar] [CrossRef] [Green Version]
- Ye, Y.; Bruzzone, L.; Shan, J.; Bovolo, F.; Zhu, Q. Fast and Robust Matching for Multimodal Remote Sensing Image Registration. IEEE Trans. Geosci. Remote Sens. 2019, 57, 9059–9070. [Google Scholar] [CrossRef] [Green Version]
- Zhou, L.; Ye, Y.; Tang, T.; Nan, K.; Qin, Y. Robust Matching for SAR and Optical Images Using Multiscale Convolutional Gradient Features. IEEE Geosci. Remote Sens. Lett. 2021, 19, 1–5. [Google Scholar] [CrossRef]
- Shen, H.; Jiang, M.; Li, J.; Yuan, Q.; Wei, Y.; Zhang, L. Spatial–Spectral Fusion by Combining Deep Learning and Variational Model. In IEEE Transactions on Geoscience and Remote Sensing; Institute of Electrical and Electronics Engineers (IEEE): Manhattan, NY, USA, 2019. [Google Scholar]
- Ren, S.; He, K.; Girshick, R.; Sun, J. Faster R-CNN: Towards Real-Time Object Detection with Region Proposal Networks. IEEE Trans. Pattern Anal. Mach. Intell. 2017, 39, 1137–1149. [Google Scholar] [CrossRef] [Green Version]
- Girshick, R.; Donahue, J.; Darrell, T.; Malik, J. Rich Feature Hierarchies for Accurate Object Detection and Semantic Seg-mentation. In Proceedings of the IEEE Conference on Computer Vision and Pattern Recognition, Portland, OR, USA, 23–28 June 2013. [Google Scholar]
- Uijlings, J.R.; Van De Sande, K.E.; Gevers, T.; Smeulders, A.W. Selective search for object recognition. Int. J. Comput. Vis. 2013, 104, 154–171. [Google Scholar] [CrossRef] [Green Version]
- Girshick, R. Fast R-CNN. arXiv 2015, arXiv:1504.08083. [Google Scholar]
- Yun, R.; Changren, Z.; Shunping, X. Small Object Detection in Optical Remote Sensing Images via Modified Faster R-CNN. Appl. Sci. 2018, 8, 813. [Google Scholar]
- Liu, W.; Anguelov, D.; Erhan, D.; Szegedy, C.; Reed, S.; Fu, C.Y.; Berg, A.C. SSD: Single Shot MultiBox Detector. In Proceedings of the European Conference on Computer Vision, Amsterdam, The Netherlands, 11–14 October 2016. [Google Scholar]
- Redmon, J.; Divvala, S.; Girshick, R.; Farhadi, A. You Only Look Once: Unified, Real-Time Object Detection. In Proceedings of the 2016 IEEE Conference on Computer Vision and Pattern Recognition (CVPR), Las Vegas, NV, USA, 27–30 June 2016; pp. 779–788. [Google Scholar] [CrossRef] [Green Version]
- Redmon, J.; Farhadi, A. YOLOv3: An Incremental Improvement. arXiv 2018, arXiv:1804.02767. [Google Scholar]
- Bochkovskiy, A.; Wang, C.-Y.; Liao, H.-J.M. YOLOv4 Optimal Speed and Accuracy of Object Detection. In Proceedings of the Computer Vision and Pattern Recognition. arxiv 2020, arXiv:2004.10934. [Google Scholar]
- Xu, D.; Wu, Y. Improved YOLO-V3 with DenseNet for Multi-Scale Remote Sensing Target Detection. Sensors 2020, 20, 4276. [Google Scholar] [CrossRef] [PubMed]
- Law, H.; Deng, J. CornerNet: Detecting Objects as Paired Keypoints. arXiv 2018, arXiv:1808.01244. [Google Scholar]
- Duan, K.; Bai, S.; Xie, L.; Qi, H.; Huang, Q.; Tian, Q. CenterNet: Keypoint Triplets for Object Detection. In Proceedings of the 2019 IEEE/CVF International Conference on Computer Vision (ICCV), Seoul, Korea, 27–28 October 2019. [Google Scholar]
- Tan, M.; Le, Q.V. Efficientnet: Rethinking model scaling for convolutional neural networks. arXiv 2019, arXiv:1905.11946. [Google Scholar]
- Tan, M.; Pang, R.; Le, Q.V. Efficientdet: Scalable and Efficient Object Detection. arXiv 2019, arXiv:1911.09070. [Google Scholar]
- Rezatofighi, H.; Tsoi, N.; Gwak, J.; Sadeghian, A.; Reid, I.; Savarese, S. Generalized Intersection Over union: A metric and a Loss for Bounding Box Regression. In Proceedings of the IEEE Conference on Computer Vision and Pattern Recognition 2019, Long Beach, CA, USA, 15–20 June 2019. [Google Scholar] [CrossRef] [Green Version]
- Chen, Y.; Zhang, P.; Li, Z.; Li, Y.; Zhang, X.; Meng, G.; Xiang, S.; Sun, J.; Jia, J. Stitcher: Feedback-driven Data Provider for Object Detection. arXiv 2020, arXiv:2004.12432. [Google Scholar]
- Zheng, Z.; Wang, P.; Liu, W.; Li, J.; Ye, R.; Ren, D. Distance-IoU Loss: Faster and Better Learning for Bounding Box Regression. In Proceedings of the AAAI Conference on Artificial Intelligence. arXiv 2020, arXiv:2004.12432. [Google Scholar]
- Liu, M.; Wang, X.; Zhou, A.; Fu, X.; Ma, Y.; Piao, C. UAV-YOLO: Small Object Detection on Unmanned Aerial Vehicle Perspective. Sensors 2020, 20, 2238. [Google Scholar] [CrossRef] [PubMed] [Green Version]
- Ju, M.; Luo, H.; Wang, Z. An improved YOLO V3 for small vehicles detection in aerial images. In Proceedings of the 3rd International Conference on Algorithms, Computing and Artificial Intelligence, Sanya, China, 24–26 December 2020. [Google Scholar]
- Wang, G.; Zhuang, Y.; Wang, Z.; Chen, H.; Shi, H.; Chen, L. Spatial Enhanced-SSD For Multiclass Object Detection in Remote Sensing Images. In Proceedings of the IGARSS 2019–2019 IEEE International Geoscience and Remote Sensing Symposium, Yokohama, Japan, 28 July–2 August 2019; pp. 318–321. [Google Scholar]
- Lin, T.; Goyal, P.; Girshick, R.; He, K.; Dollár, P. Focal loss for dense object detection. In Proceedings of the IEEE Transactions on Pattern Analysis & Machine Intelligence, Venice, Italy; 2017; pp. 2999–3007. [Google Scholar]
- Khoroshevsky, F.; Khoroshevsky, S.; Bar-Hillel, A. Parts-per-Object Count in Agricultural Images: Solving Phenotyping Problems via a Single Deep Neural Network. Remote. Sens. 2021, 13, 2496. [Google Scholar] [CrossRef]
- He, Y.; Yang, Y.; Bai, X.; Feng, S.; Liang, B.; Dai, W. Research on Mount Wilson Magnetic Classification Based on Deep Learning. Adv. Astron. 2021, 2021, 5529383. [Google Scholar] [CrossRef]
- Liu, Y.; Yang, J.; Cui, W. Simple, Fast, Accurate Object Detection based on Anchor-Free Method for High Resolution Remote Sensing Images. In Proceedings of the IGARSS 2020–2020 IEEE International Geoscience and Remote Sensing Symposium, Waikoloa, HI, USA, 26 September–2 October 2020. [Google Scholar]
- Lin, Z.; Guo, W. Cotton Stand Counting from Unmanned Aerial System Imagery Using MobileNet and CenterNet Deep Learning Models. Remote Sens. 2021, 13, 2822. [Google Scholar] [CrossRef]
- Qin, H.; Li, Y.; Lei, J.; Xie, W.; Wang, Z. A Specially Optimized One-Stage Network for Object Detection in Remote Sensing Images. IEEE Geosci. Remote. Sens. Lett. 2021, 18, 401–405. [Google Scholar] [CrossRef]
- Bahdanau, D.; Cho, K.; Bengio, Y. Neural Machine Translation by Jointly Learning to Align and Translate. arXiv 2014, arXiv:1409.0473. [Google Scholar]
- Mnih, V.; Heess, N.; Graves, A.; Kavukcuoglu, K. Recurrent Models of Visual Attention. Adv. Neural Inf. Processing Syst. 2014, 2, 2204–2212. [Google Scholar]
- Chorowski, J.; Bahdanau, D.; Serdyuk, D.; Cho, K.; Bengio, Y. Attention-based models for speech recognition. arXiv 2015, arXiv:1506.07503. [Google Scholar]
- Max, J.; Karen, S.; Andrew, Z.; Koray, K. Spatial Transformer Network. Adv. Neural Inf. Processing Syst. 2015, 28, 2017–2025. [Google Scholar]
- Hu, J.; Shen, L.; Albanie, S.; Sun, G.; Wu, E. Squeeze-and-Excitation Networks. IEEE Trans. Pattern Anal. Mach. Intell. 2020, 42, 2011–2023. [Google Scholar] [CrossRef] [PubMed] [Green Version]
- Woo, S.; Park, J.; Lee, J.; Kweon, I.S. CBAM: Convolutional Block Attention Module. In Proceedings of the 2018 European Conference on Computer Vision, Munich, Germany, 8–14 September 2018. [Google Scholar] [CrossRef] [Green Version]
- Wang, Q.; Wu, B.; Zhu, P.; Li, P.; Zuo, W.; Hu, Q. ECA-Net: Efficient Channel Attention for Deep Convolutional Neural Networks. In Proceedings of the 2020 IEEE/CVF Conference on Computer Vision and Pattern Recognition (CVPR), Seattle, WA, USA, 14–19 June 2020; pp. 11531–11539. [Google Scholar] [CrossRef]
- Tan, M.; Chen, B.; Pang, R.; Vasudevan, V.; Sandler, M.; Howard, A.; Le, Q.V. MnasNet: Platform-Aware Neural Architecture Search for Mobile. arXiv 2019, arXiv:1807.11626. [Google Scholar]
- Sandler, M.; Howard, A.; Zhu, M.; Zhmoginov, A.; Chen, L. MobileNetV2: Inverted residuals and linear bottlenecks. In Proceedings of the IEEE/CVF Conference on Computer Vision and Pattern Recognition (CVPR), Salt Lake City, UT, USA, 18–23 June 2018; pp. 4510–4520. [Google Scholar] [CrossRef] [Green Version]
- Luong, M.; Pham, H.; Manning, C.D. Effective Approaches to Attention-based Neural Machine Translation. arXiv 2015, arXiv:1508.04025. [Google Scholar]


Publisher’s Note: MDPI stays neutral with regard to jurisdictional claims in published maps and institutional affiliations. |
© 2022 by the authors. Licensee MDPI, Basel, Switzerland. This article is an open access article distributed under the terms and conditions of the Creative Commons Attribution (CC BY) license (https://creativecommons.org/licenses/by/4.0/).