1. Introduction
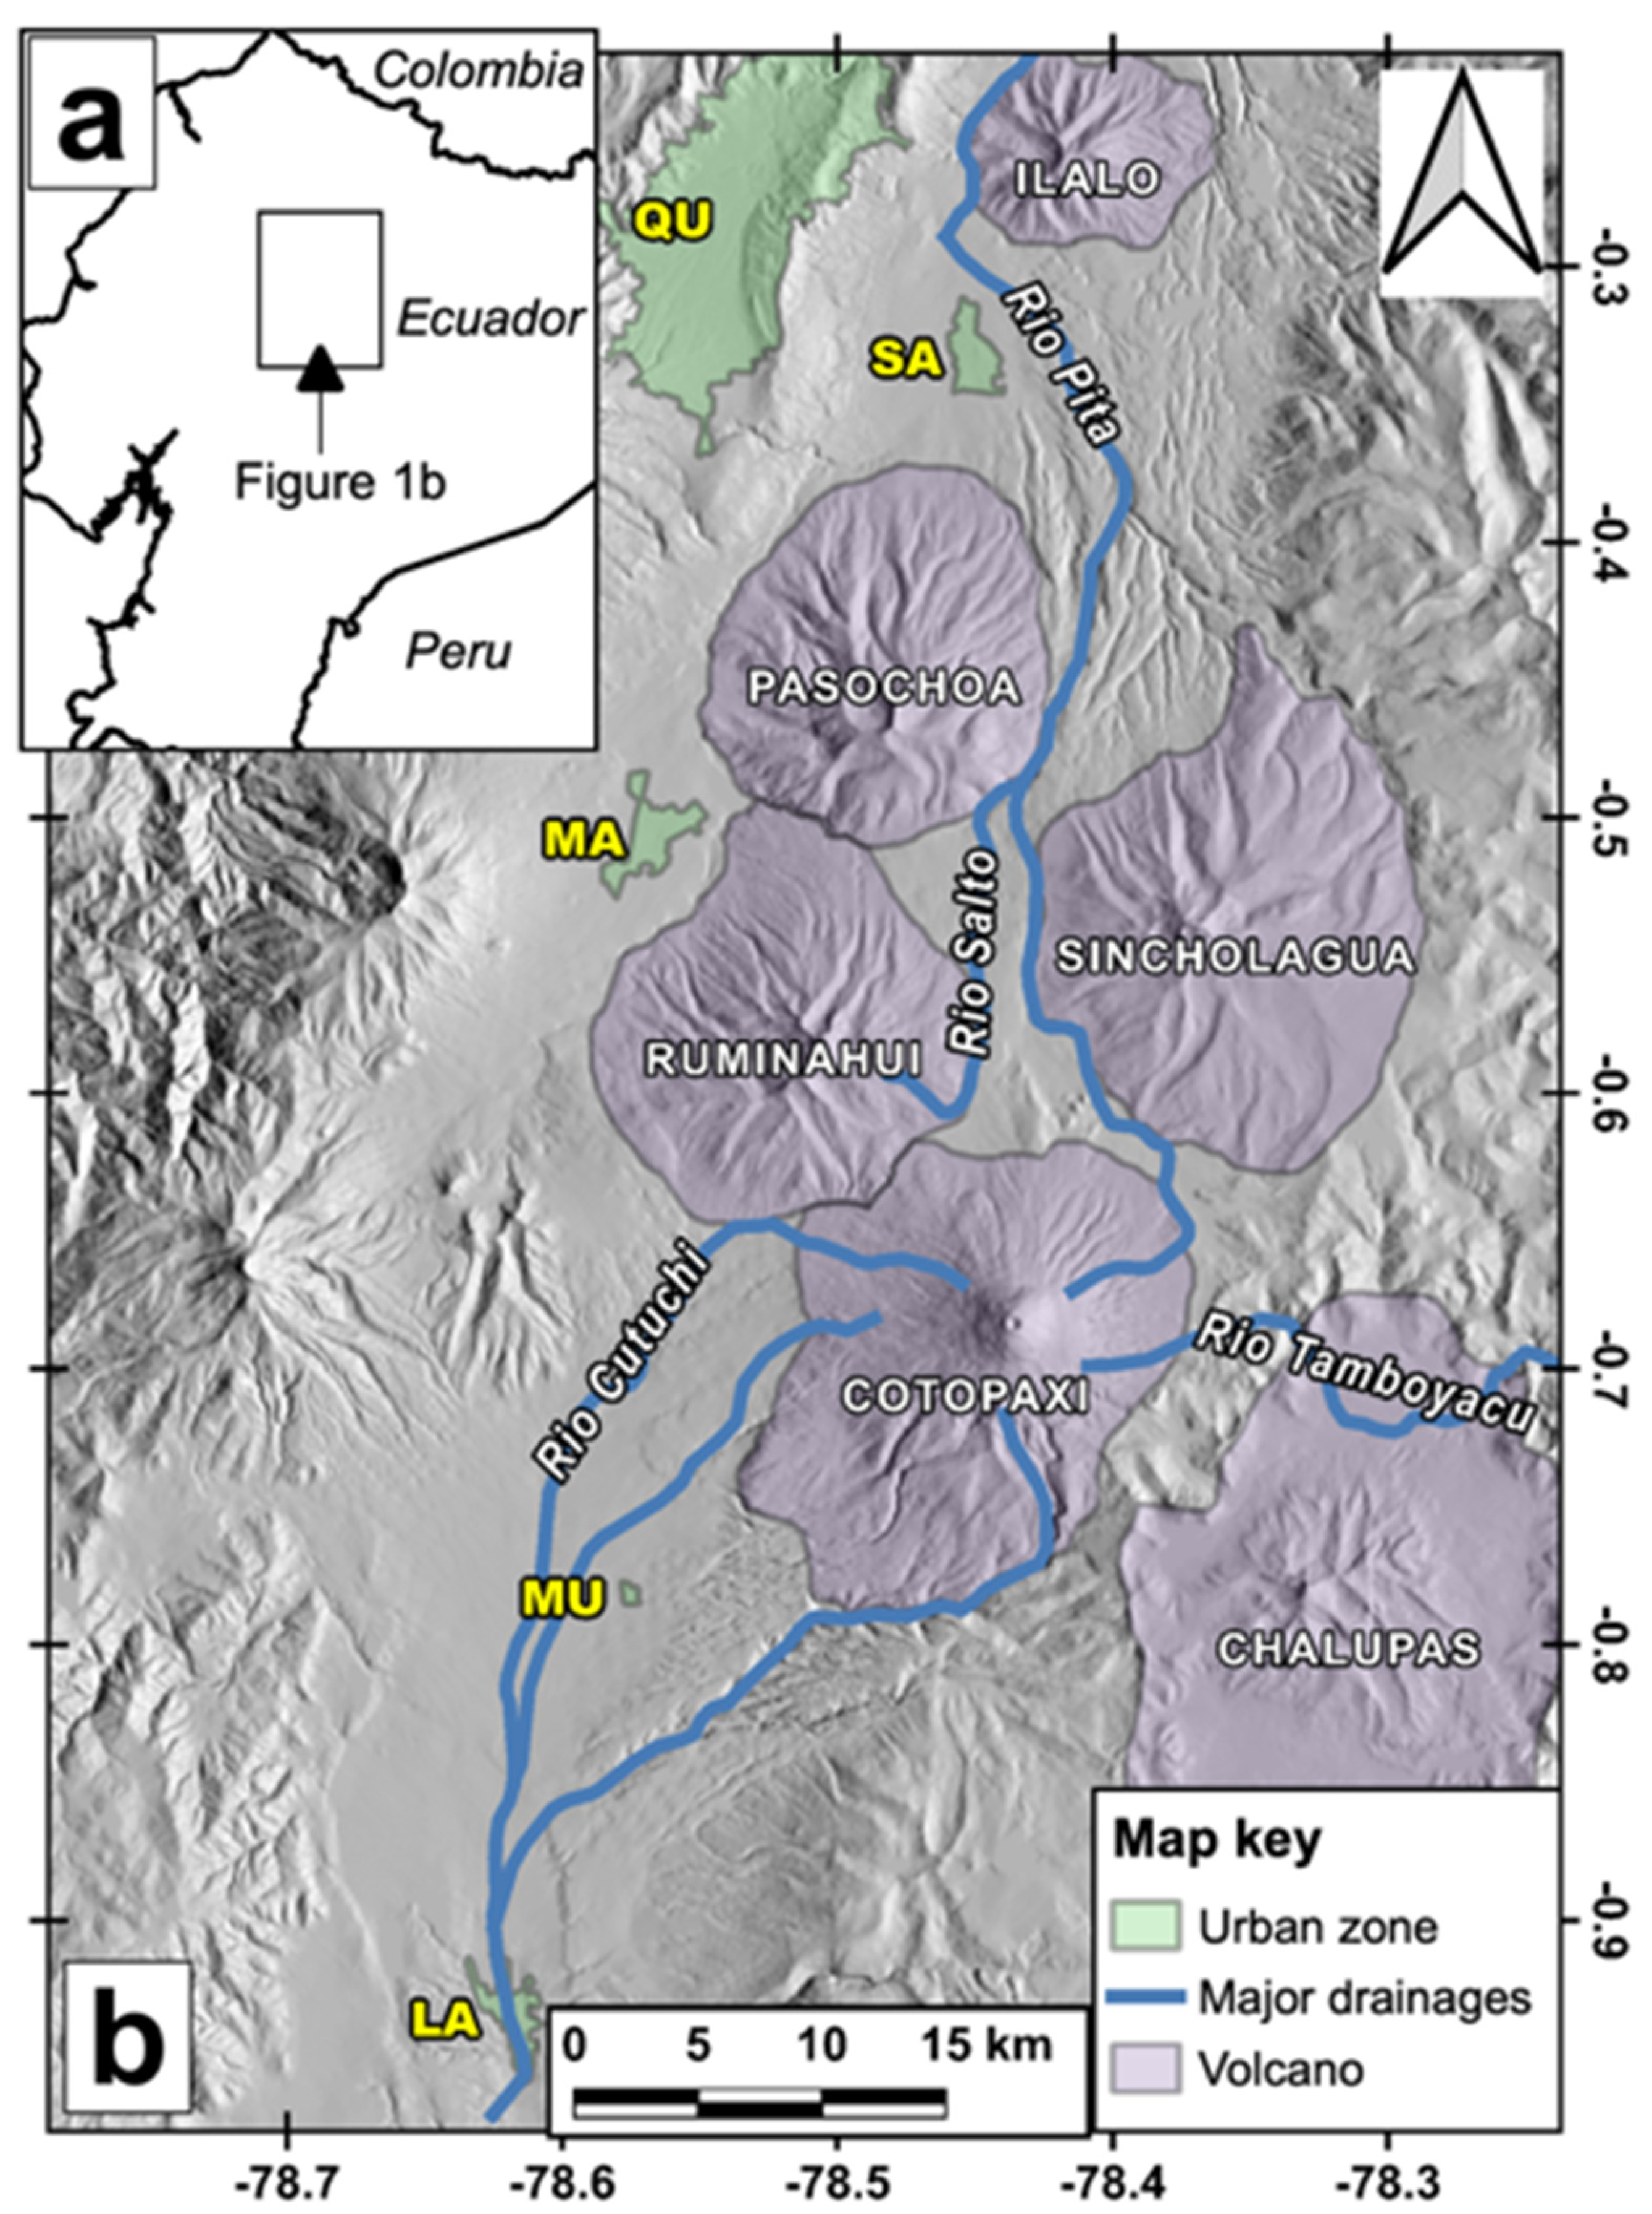
Cotopaxi is an ice-capped active volcano located 50 km south of Quito, the capital city of Ecuador (
Figure 1). It has long been recognized as a highly hazardous volcano, especially for its capacity to produce primary lahars, which are mixtures of water and volcanic debris formed as large portions of the glacier instantaneously melt by contact with pyroclastic density currents (PDCs) during highly explosive eruptions [
1,
2,
3,
4,
5]. Primary lahars formed in this way are characterized by volumes reaching 10
6–10
7 m
3, and peak discharges of up to 10
3–10
4 m
3/s [
6,
7], with the capacity to produce widespread destruction tens of kilometers away from their source, as occurred with Armero town (Colombia), during the eruption of Nevado del Ruiz volcano in 1985 [
8].
In the case of Cotopaxi, such lahars have been channelized by three main drainage systems: the Pita river to the north, the Cutuchi river to the south, and the Tamboyacu river to the east, where they have historically produced extensive damage in the neighboring inhabited areas, such as Valle de los Chillos around Sangolqui town, and many Quito suburbs to the north, or Mulalo and Latacunga, to the south (
Figure 1) [
1,
2,
6].
Given the regional-scale destructive potential of Cotopaxi’s primary lahars, the Instituto Geofísico of Escuela Politécnica Nacional (IG-EPN) has elaborated several hazard maps during the last five decades, with the aim of providing information for land-use planning and policymaking, as part of their official mandate to assess volcanic hazard in Ecuador [
3,
9,
10,
11,
12,
13,
14,
15]. Those maps have been partially or totally based on research results produced by various scientific teams (i.e., [
4,
6,
16,
17,
18,
19,
20,
21]). They have also served as the basis for vulnerability [
22,
23] and risk [
7,
24] assessments, as well as being tools for emergency response during volcanic crises [
25,
26].
Because of their origin during highly explosive events, primary lahars at Cotopaxi are a relatively infrequent phenomena, averaging less than one event per century over the past 800 years [
6,
17]. Thus, the lahar hazard at Cotopaxi has always been assessed by deterministic approaches, which have used different numerical models calibrated with field data and corresponding lahar scenarios. Numerical models tested at Cotopaxi include 1-D hydrological [
7,
16,
27,
28], statistical [
18], and more developed flow-dynamics-based codes which consider deposition, bulking and erosive processes [
29,
30]. Regardless of the numerical model, the field data or lahar scenario used as either entry data, boundary condition, or calibration, has been invariably derived from knowledge of the primary lahar that occurred on 26 June 1877, during the latest highly explosive eruption of the Cotopaxi volcano. Thus, lahar hazard assessments at the Cotopaxi volcano significantly rely on the knowledge related to this specific event.
It has been strongly suggested that the 1877 event may not represent the most likely nor the worst-case scenario for future eruptions of Cotopaxi [
6,
17]. However, it is the only one with some detailed and reliable historical accounts that help understanding the eruption evolution and its consequences [
1,
2]. Moreover, due to its stratigraphic position and a few facies characteristics, the lahar deposits from 1877 are the most suitable for detailed geological studies that could confidently feed and calibrate numerical models. This helps to understand why this deposit has been widely used as the standard for lahar hazard and risk assessments at Cotopaxi [
7,
13,
14,
15,
24].
During the last decade, the combination of imagery obtained by drones with the Structure from Motion (SfM) algorithms has been established as a useful tool for geological [
31,
32,
33,
34] and volcanological [
35,
36,
37] studies. Sub-decimeter resolution imagery and digital elevation models obtained with this technology have been used for the study or monitoring of lava flows [
38,
39], and morphological changes during eruptions [
40]. Moreover, surface processes occurring at volcanoes have been studied using similar methodologies and data, such as the short- and long-term deposition/erosion processes associated with rain-triggered lahars [
41,
42,
43]. In all those cases, the aim was mapping sub-metric features (scales < 1:1000) over relatively small surfaces (1–2 km
2), thus obtaining detailed measurements and assessments. A few examples also exist of this methodology being used for larger scale cartography and volcanic hazard assessments [
44,
45]. In many of the aforementioned cases, the combination of drone imagery with SfM is supported by complementary ground-based measurements.
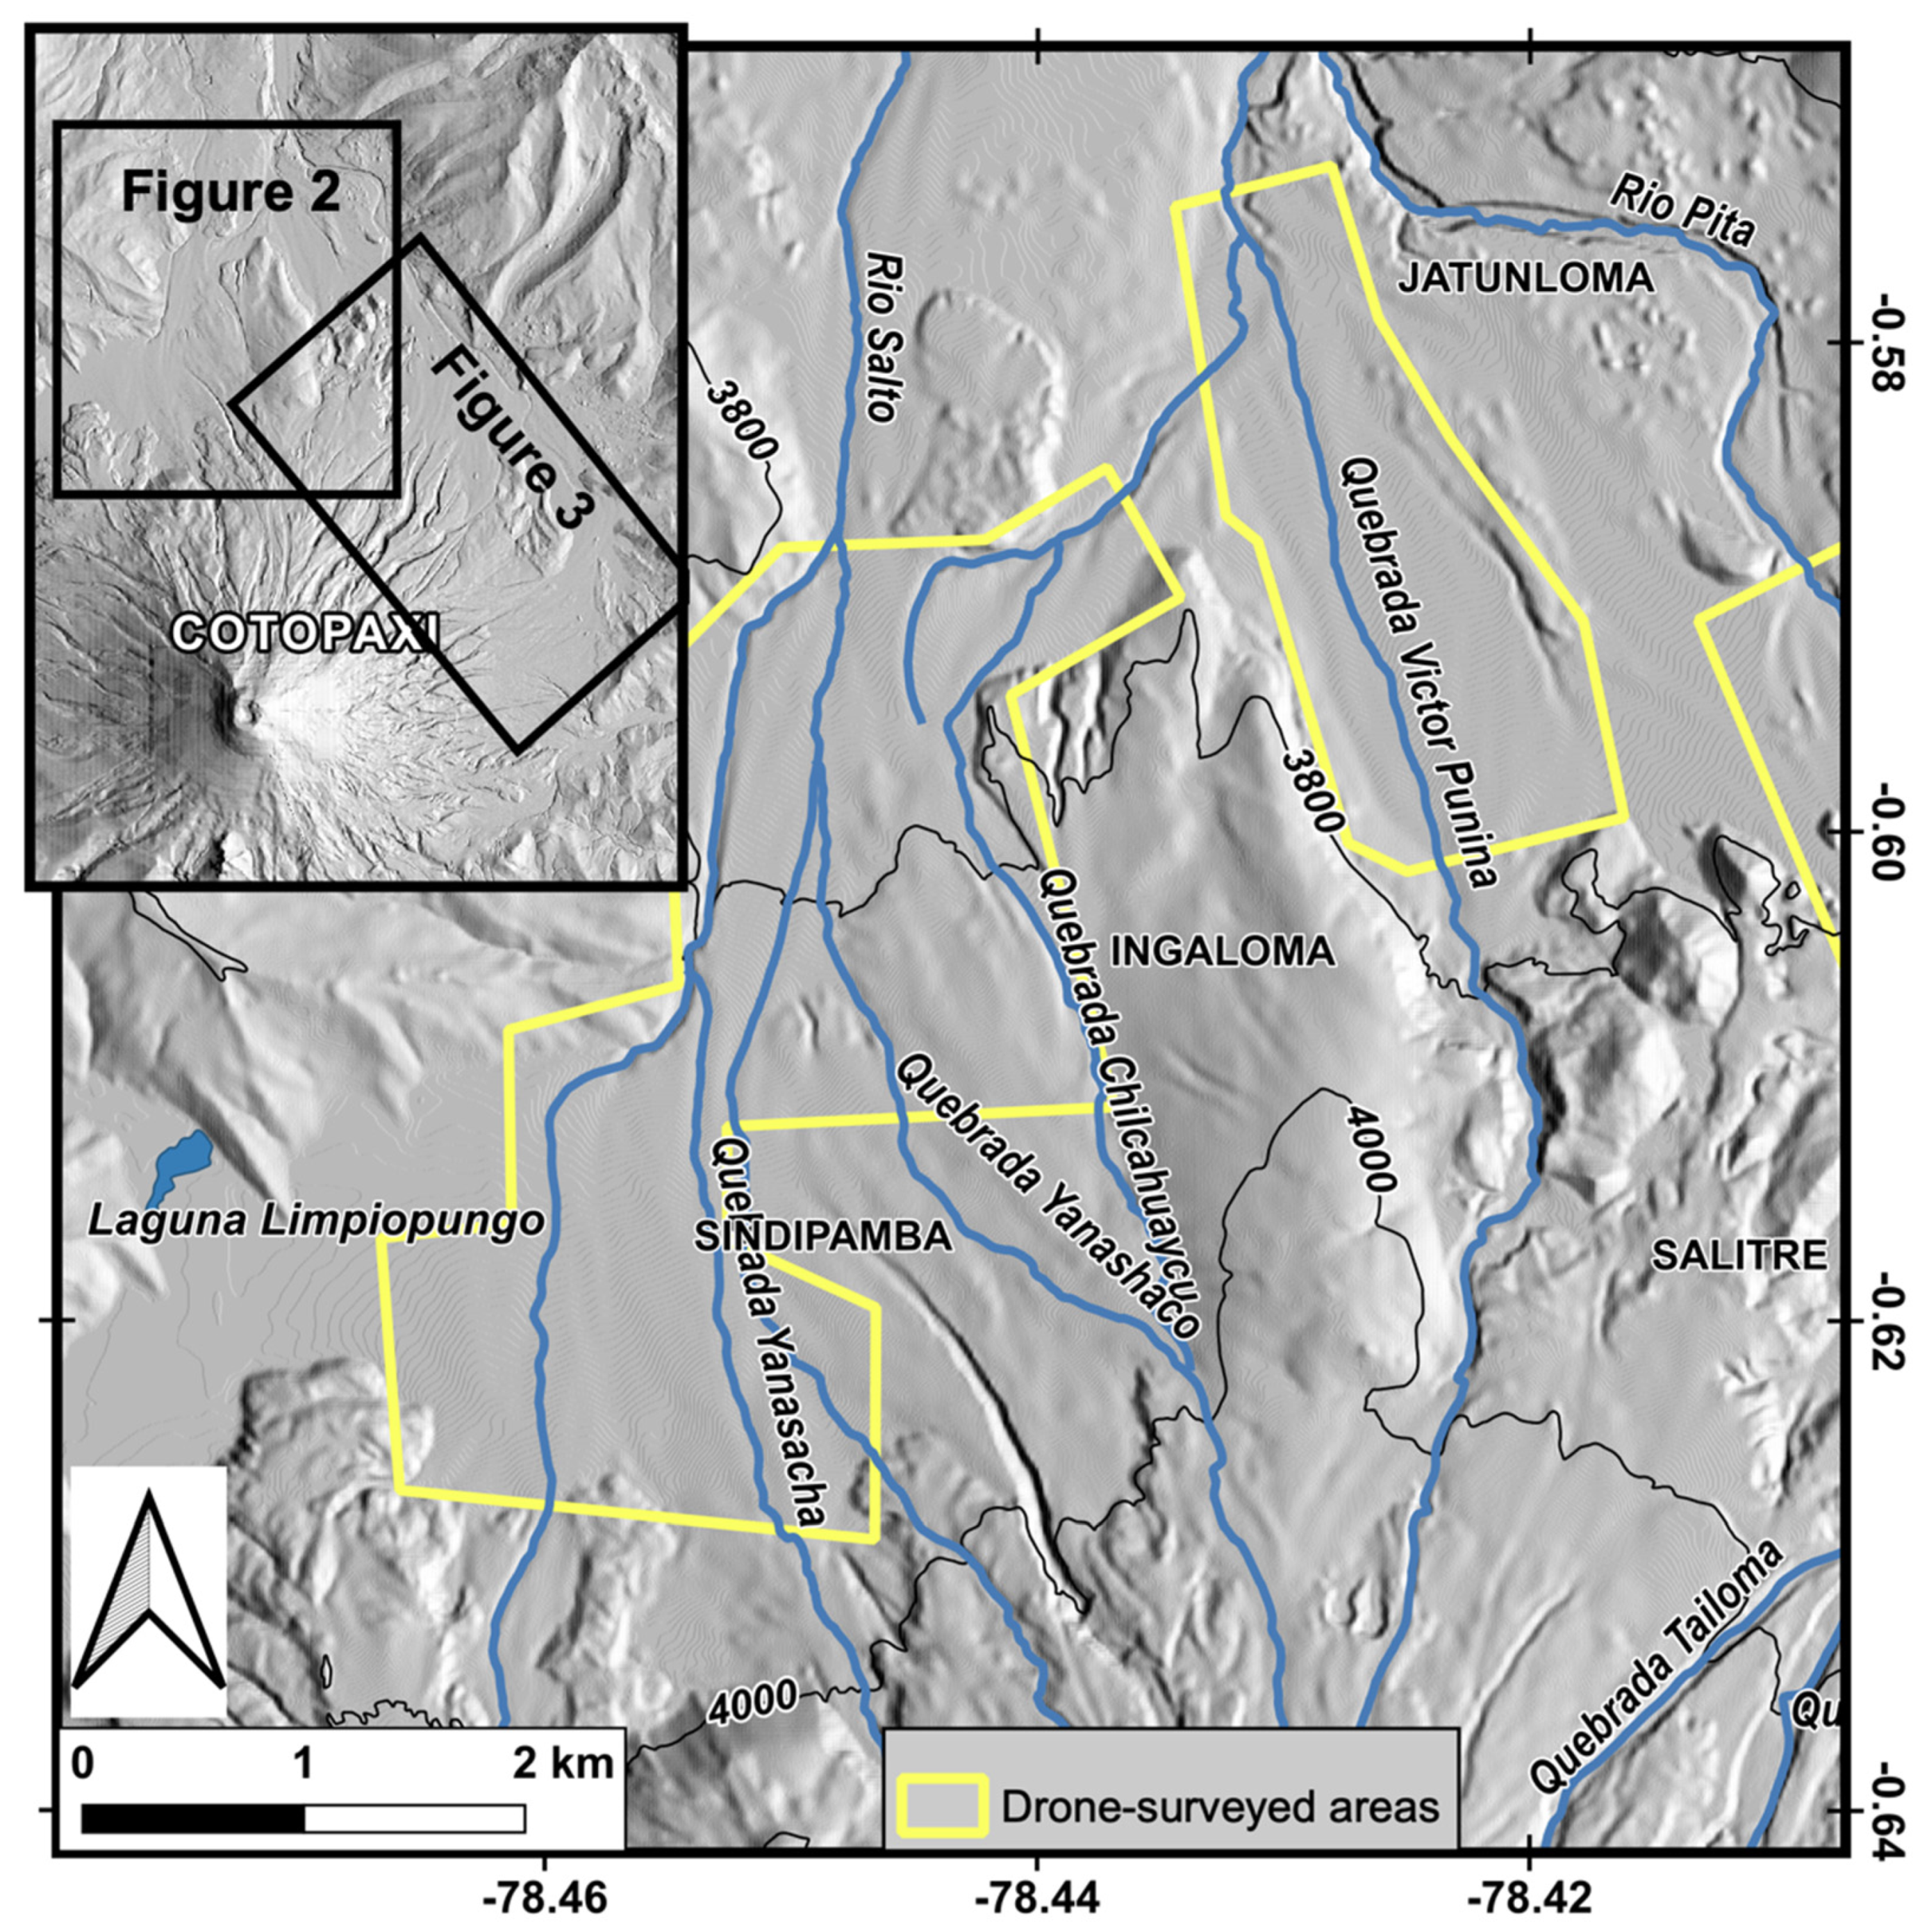
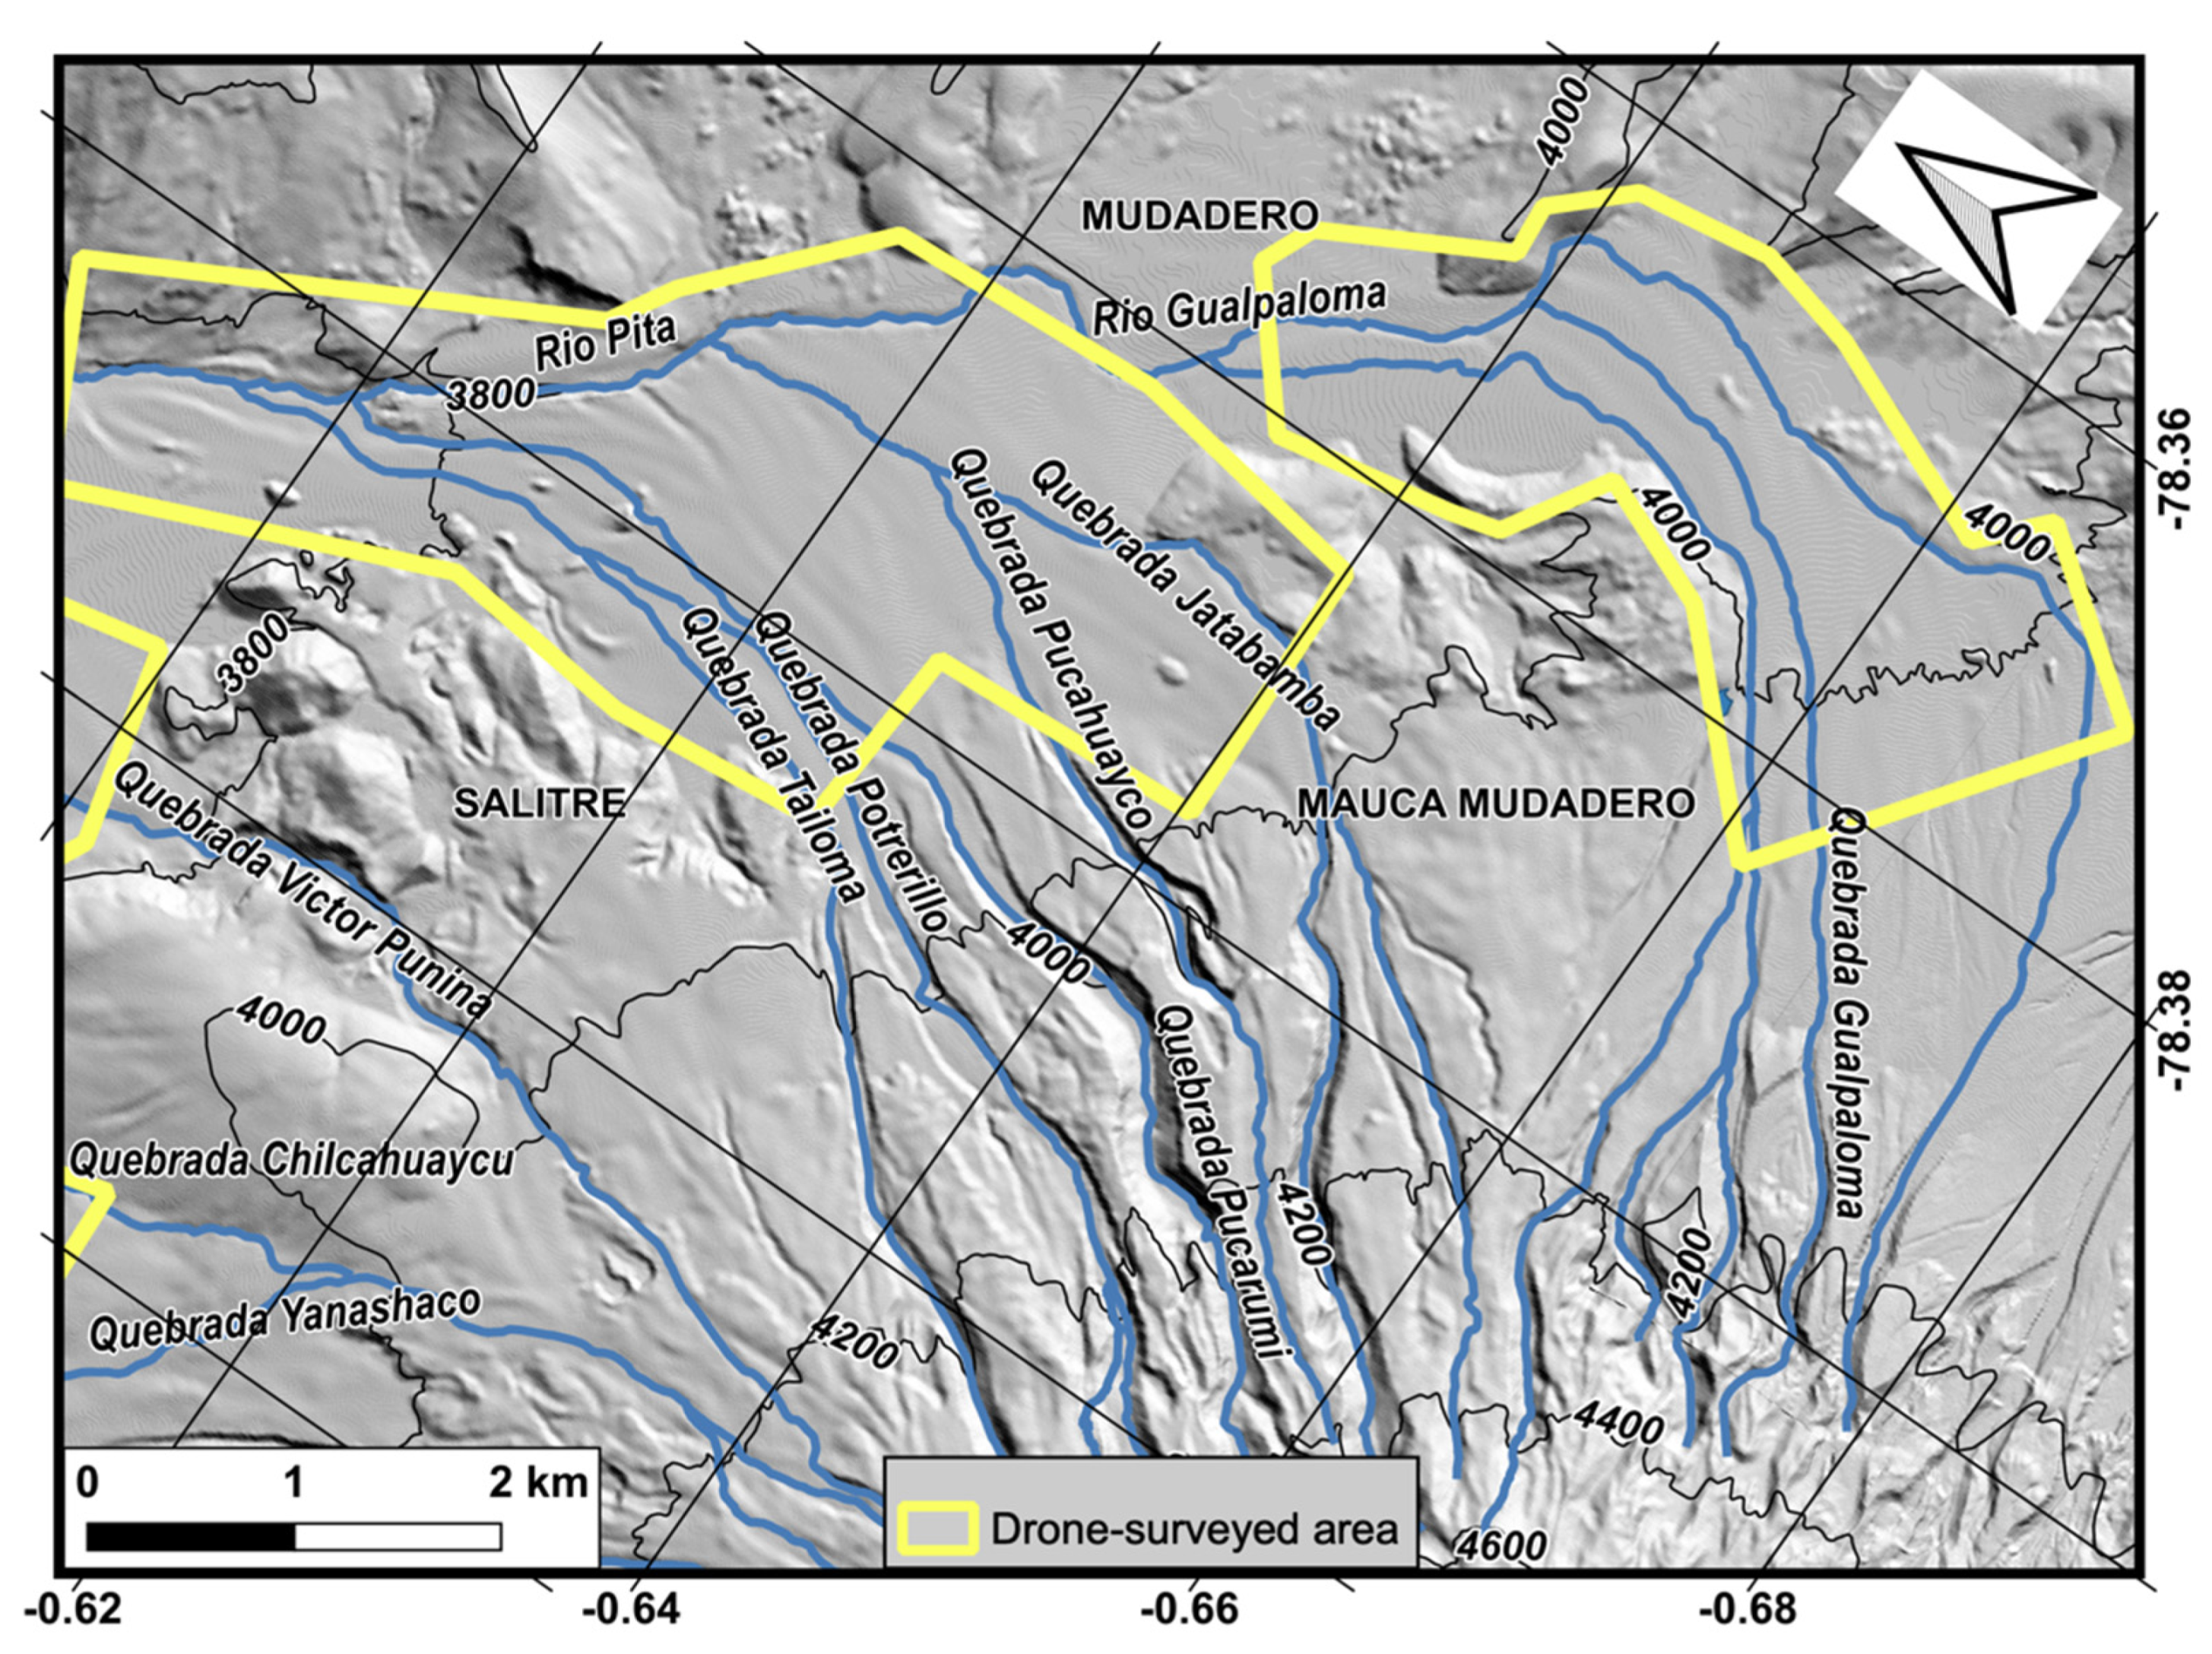
In the present work, detailed cartography of the 1877 primary lahar deposit is performed in the proximal northern drainage of Cotopaxi, by means of extensive geological fieldwork and drone surveys, also supported by freely available satellite imagery. The fieldwork included identifying outcrops and lateral contacts of the 1877 lahar deposit in 172 control points and along 47 track lines. The drone surveys produced 25 cm-pixel orthomosaics obtained by SfM, composed of red, green, and near-infra-red bands covering an area of 28.4 km2. These data were subsequently used to map the deposit contacts with the help of remote-sensing techniques (NDVI single-band images) and in correlation with field data. This survey aimed at obtaining new high-definition geological information to feed or calibrate next-generation numerical models of the 1877 primary lahar, which would allow an improved assessment of the hazards related to future eruptions of Cotopaxi volcano. The term “drone” will be preferred in this study, instead of “unmanned aerial vehicle—UAV” (or other similar), on the grounds of gender neutrality, simplicity and familiarity.
3. Methodologies
3.1. Geological Fieldwork
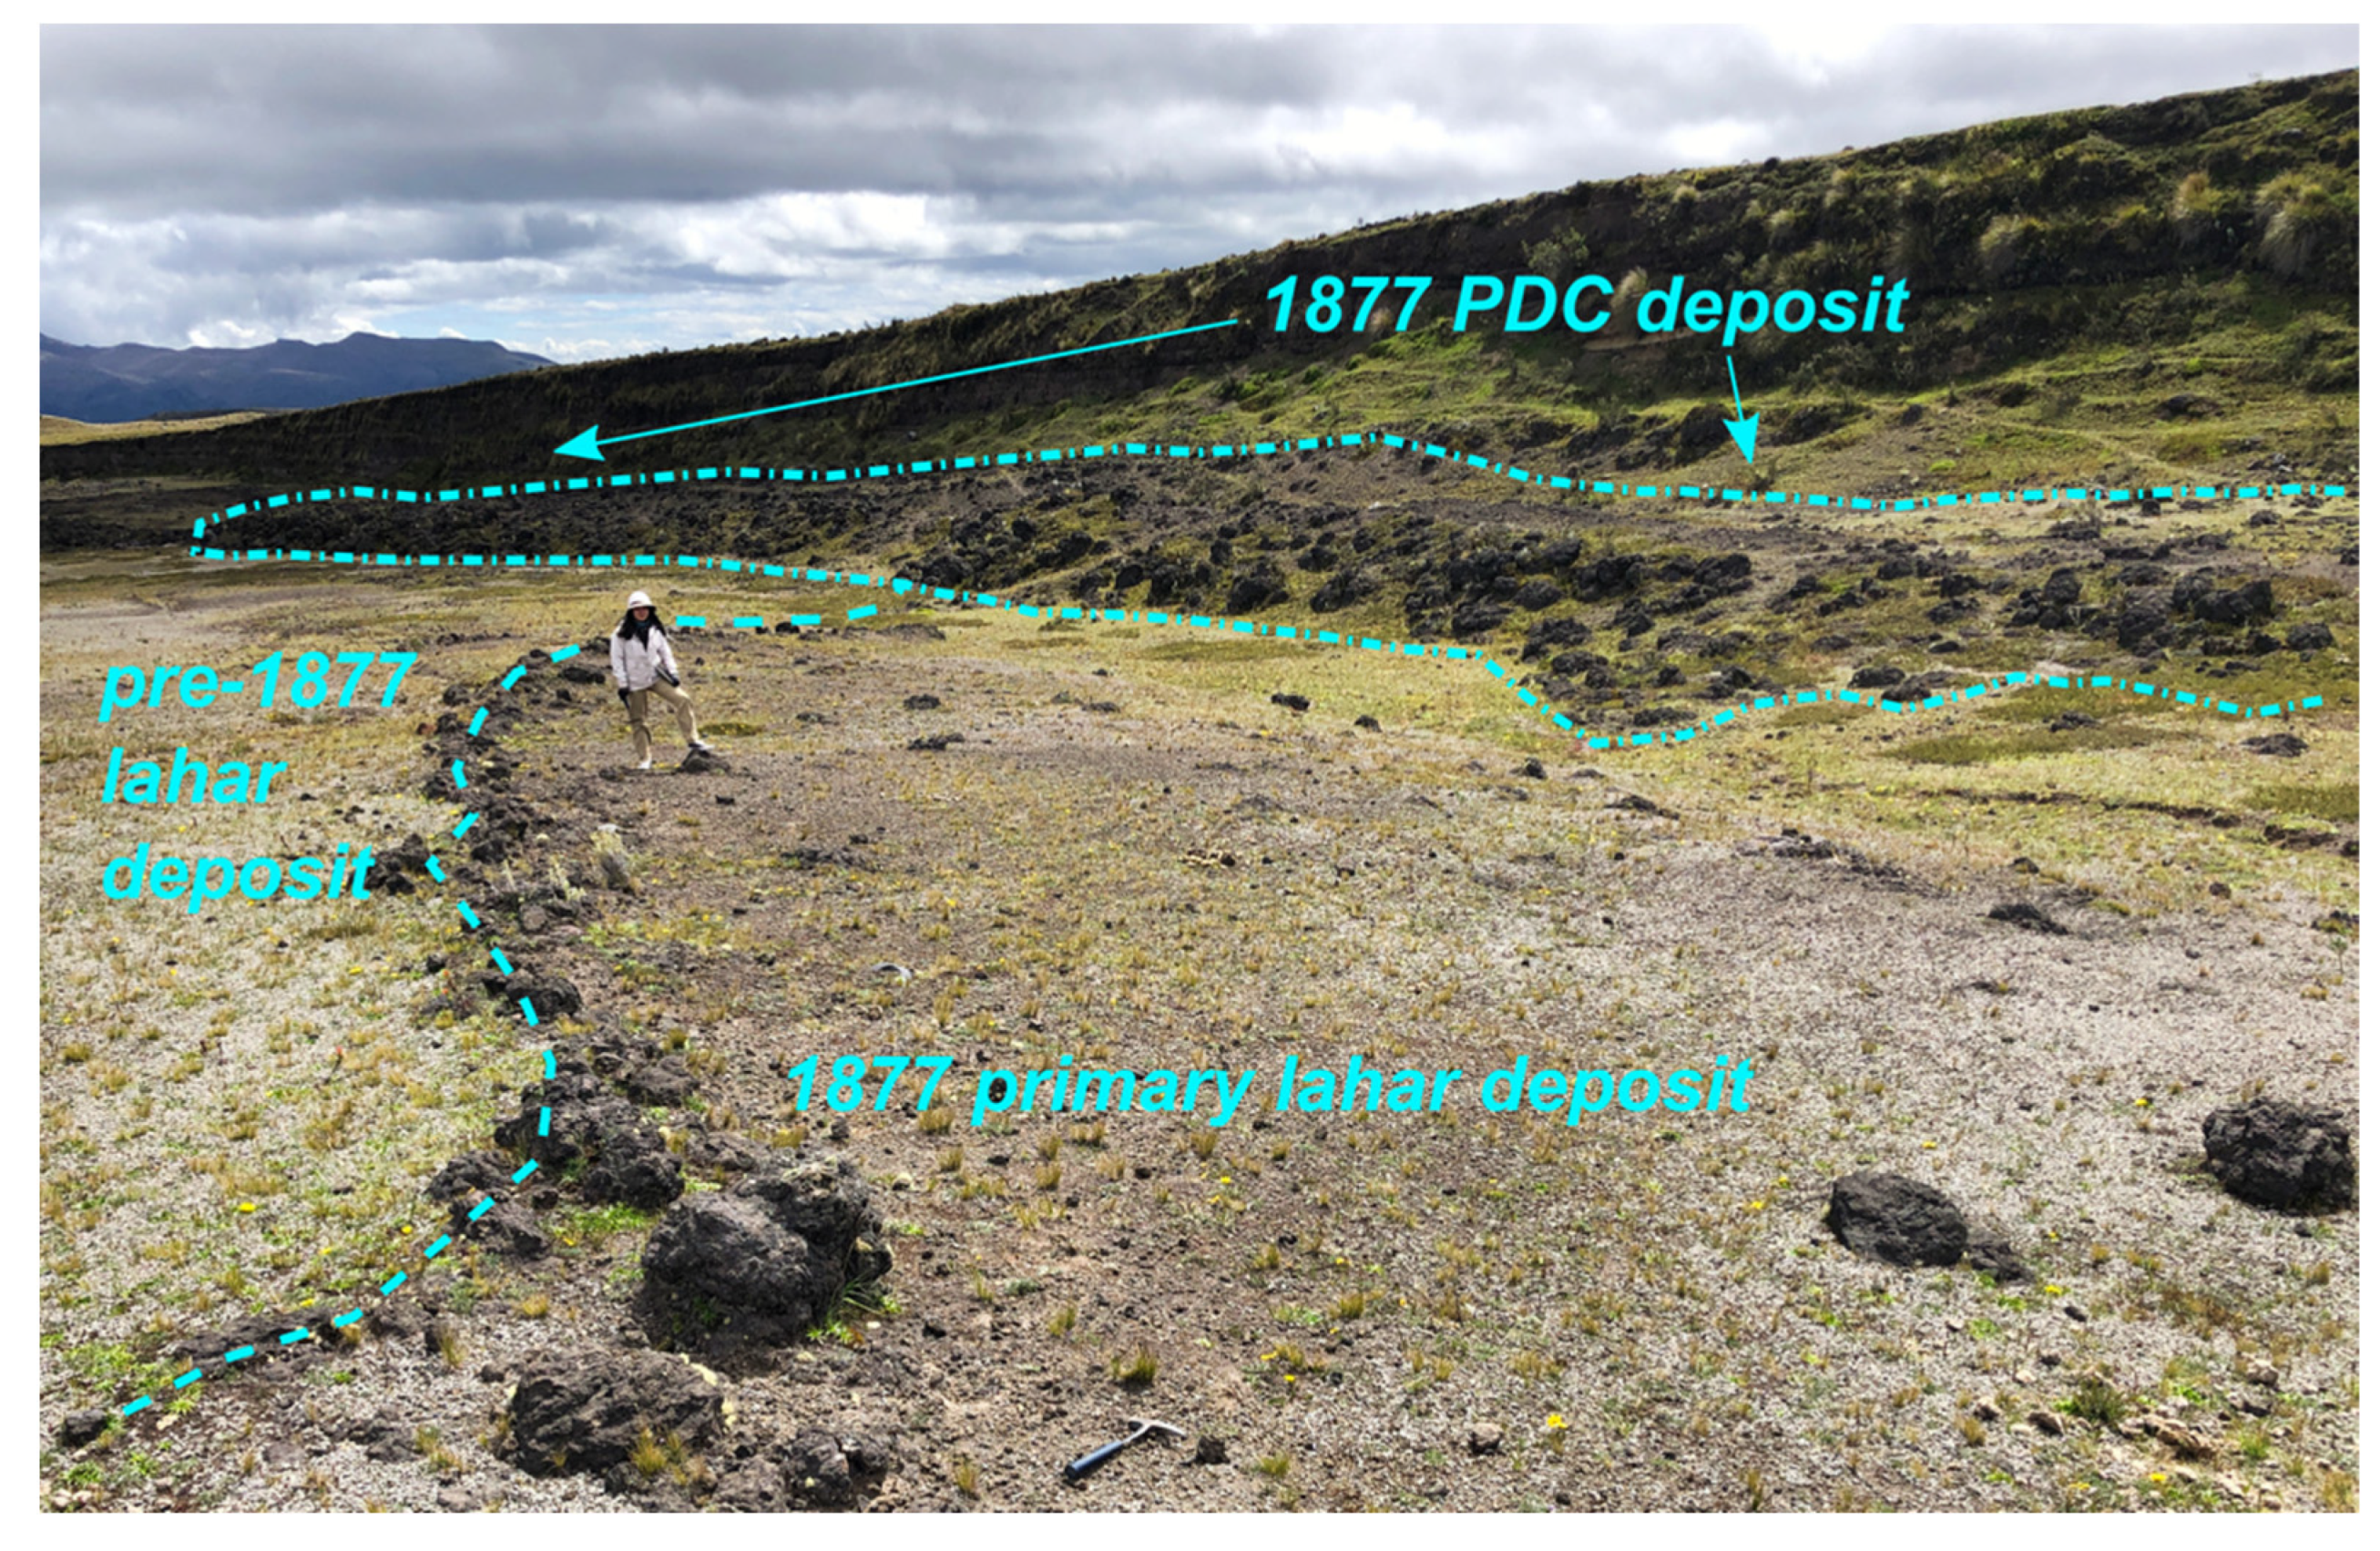
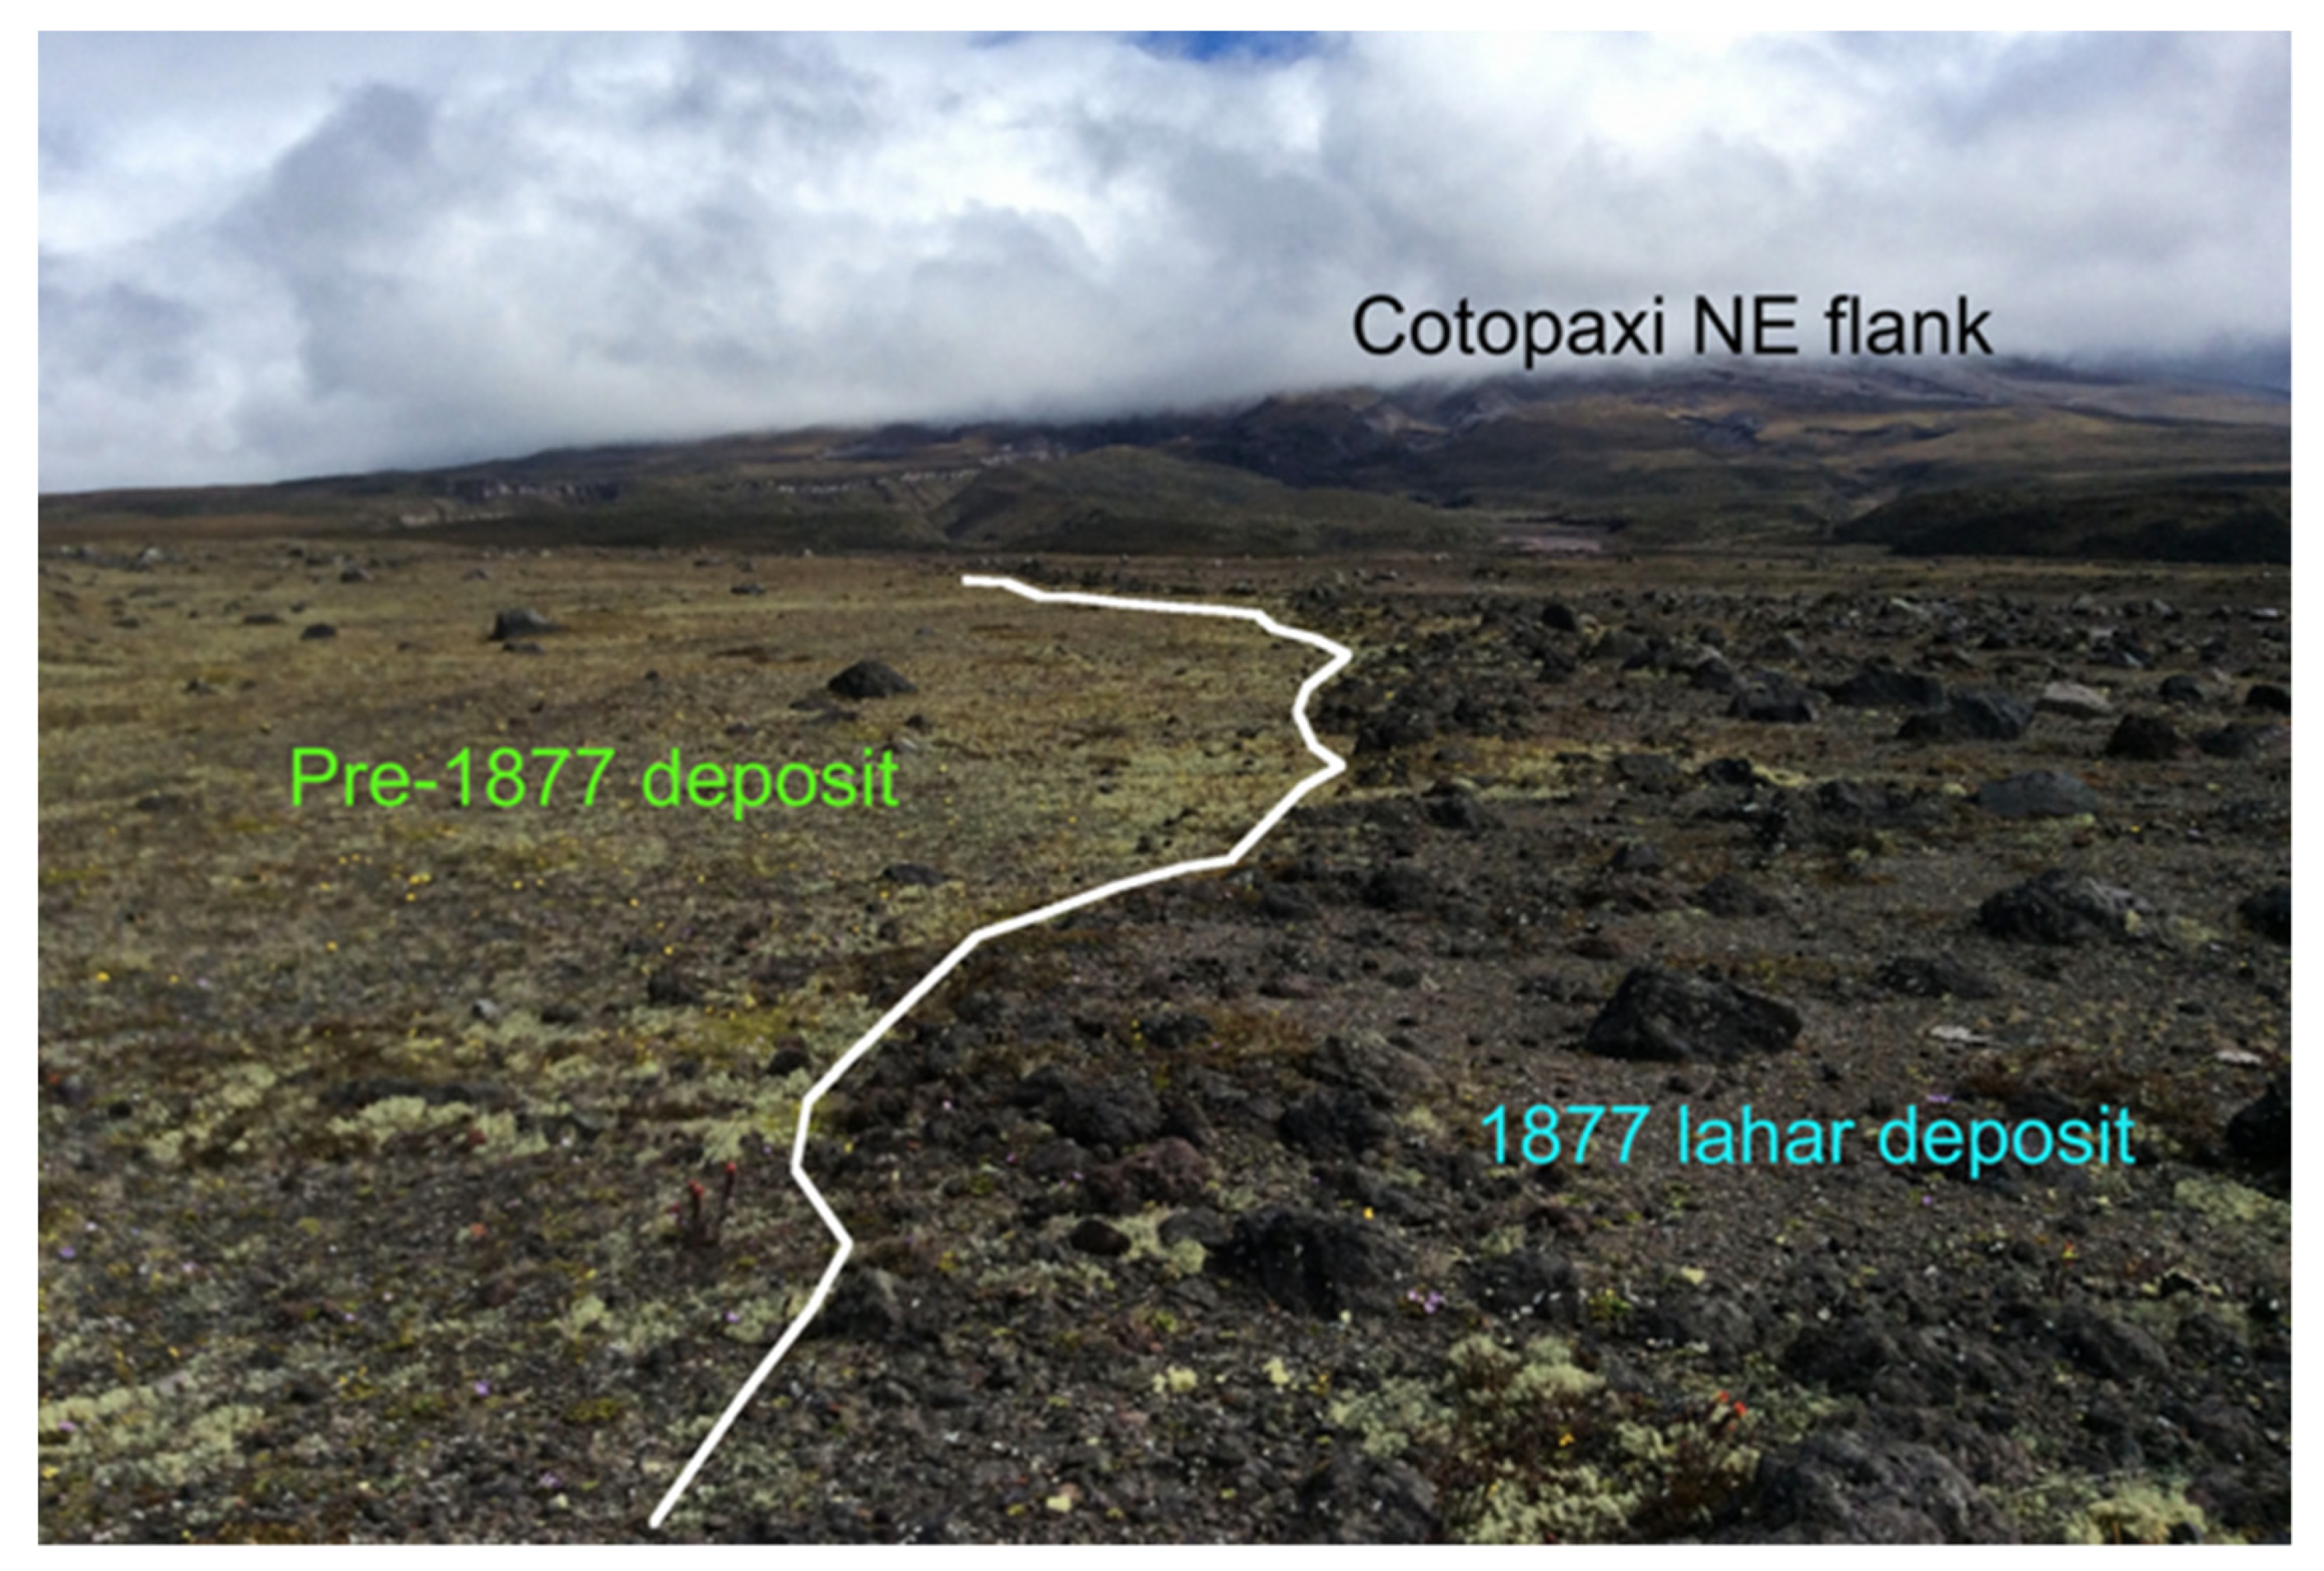
Field surveys aimed at identifying the lateral contacts and outcrops of the 1877 primary lahar and PDC deposits, were based on the criteria described above. For this, each plain of the study area was transected by foot along several paths, where two types of control points were recorded with a hand GPS-receiver: contacts and outcrops. Contact-control points were places where a clear distinction between two different deposits was possible, with one of those deposits belonging to the 1877 eruption. Most commonly, such contacts were characterized by displaying clear trim lines formed by accumulations of the black cauliflower-shaped bombs (
Figure 5 and
Figure 6). Additionally, in some cases when the contacts were clearly visible and when it was judged useful, track-lines were also recorded with the GPS receiver along lateral contacts of the 1877 deposits.
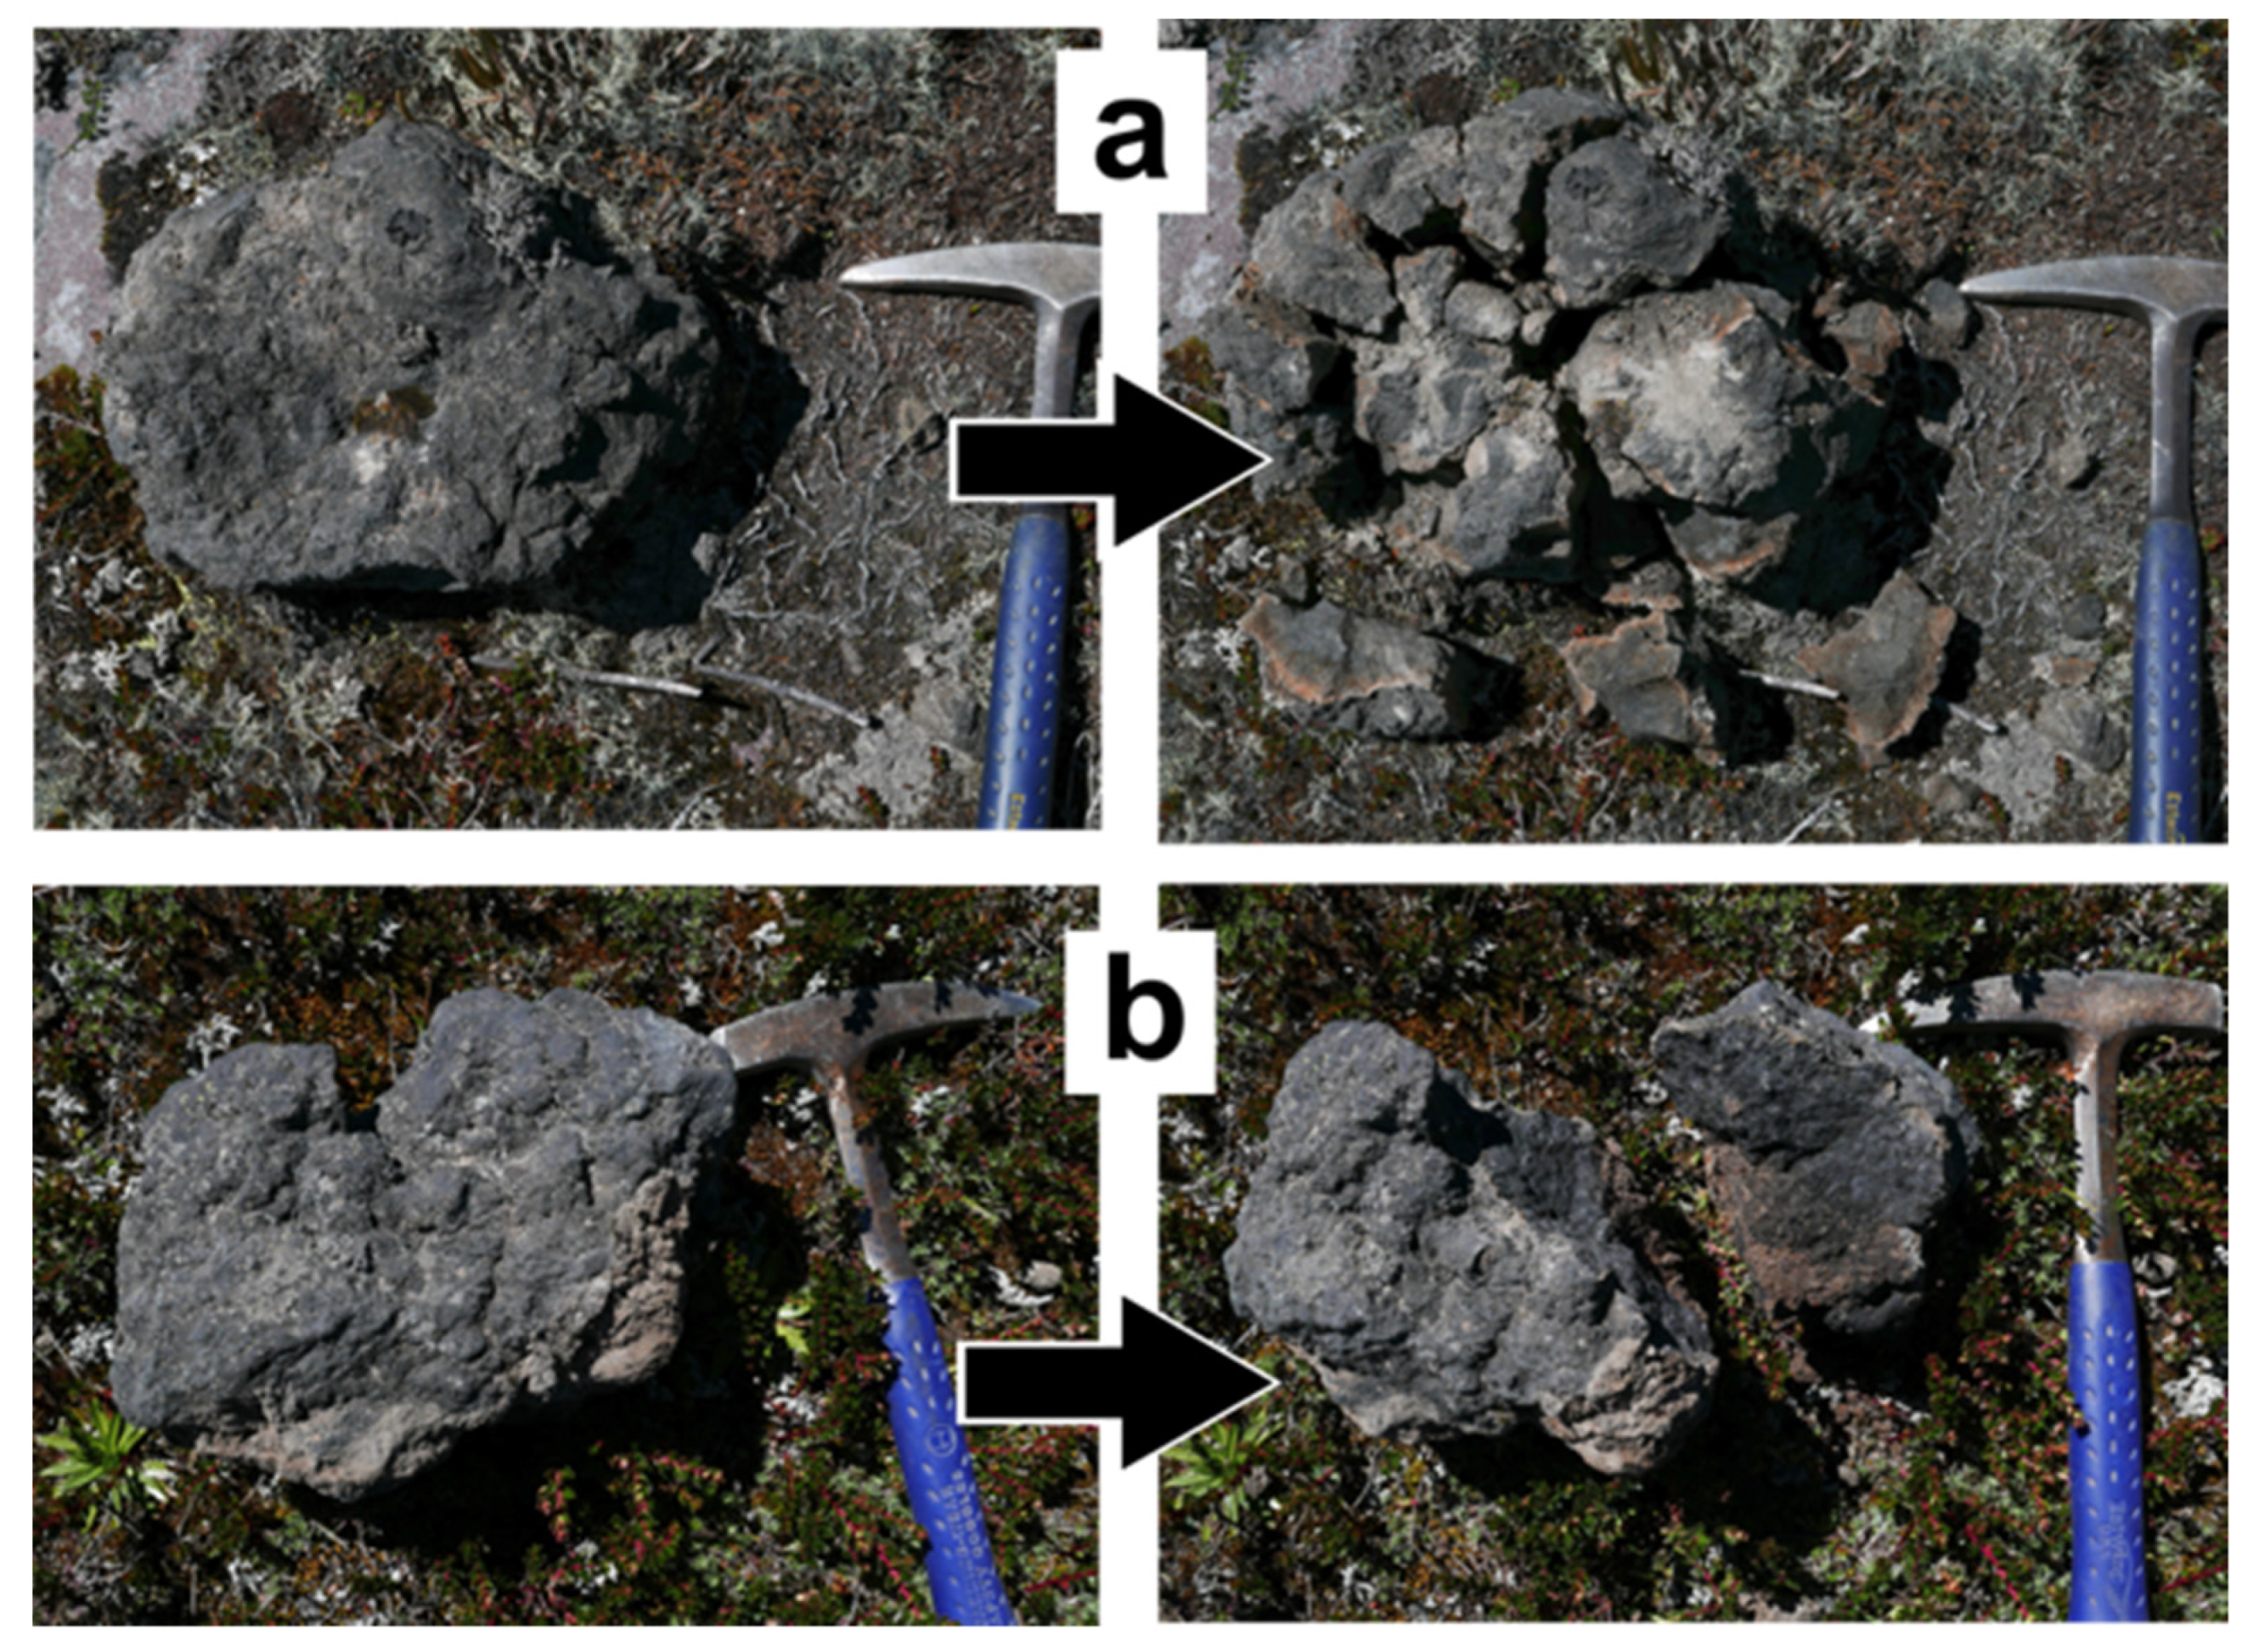
On the other hand, outcrop-control points were locations where the 1877-specific black bomb (
Figure 5) was found on the surface, but no contact could be identified in the field. These kind of locations were always characterized by displaying little vegetation and varying amounts of the 1877 black bombs. Most of the outcrop-control points were recorded in locations where such bombs were scarcely found in the surface.
3.2. Drone Surveying—Image Acquisition
The obtention of high-resolution imagery was central to the purpose of the present study. Given the size of the study area, this task was performed using a fixed-wing drone [
49]. The device employed was a SenseFly Classic eBee drone, equipped with a Canon S110 NIR camera producing 12 Mpix frames (
Table 1). The main characteristic of this sensor is the acquisition of a near-infrared (NIR) band, centered at 850 nm, in addition to the visible red and green bands. The use of this sensor was prioritized because the NIR band is known to be useful for identifying changes in the type and amount of vegetation in the surveyed areas [
50,
51,
52], which is one of the key surface features that differentiates the 1877 deposits from others, as mentioned above.
The drone also bears an internal GPS receiver which inputs a geotag to each of the frames obtained by the sensor during acquisition flights. This information is later used during image processing with SfM to provide a geoposition for the images. However, given the size of the study area and the target scale for the cartography (1:5000), no ground control points were used to produce an absolute georeferencing for the imagery. Instead, as described further below, an accuracy test was performed in the processed images before using them for cartography.
The drone surveys were planned using the proprietary software eMotion 3 (which also pilots the eBee drone while flying) by creating mission blocks covering the study area and establishing an overlap of 60–70% between the individual frames in the lateral and longitudinal direction. The flights were performed at an average altitude of 160 m above the ground level, from where the sensor obtained individual frames with an average ground-resolution of ~5 cm/pixel. More than one drone flight was usually required to complete a mission block. The weather conditions during the flights were very variable, with temperatures ranging from 5 °C to 20 °C, and average wind speeds from 2.1 m/s to 9.7 m/s (flying with average windspeeds higher than 10 m/s is not recommended by the drone manufacturer). As a result, reflectance measurements by the drone sensor were affected by variable sunlight conditions between and during flights.
3.3. Image Processing and Cartography
The groups of individual frames obtained for each mission block were processed to obtain orthomosaic images, by the use of commercial software based on the Structure from Motion (SfM) algorithms and methodologies [
31,
53]. Such orthomosaics had three spectral bands (i.e., NIR, red and green) and ground resolutions ranging from 5 to 7 cm/pixel, but all were resampled to a 25 cm/pixel ground resolution for additional processing prior to contact identification and mapping.
As mentioned above, one key feature of the 1877 deposits is their vegetation composition, which is usually different from other deposits outcropping in the study area (
Figure 4 and
Figure 6) [
48]. Then, the Normal Difference Vegetation Index (NDVI) was applied to the orthomosaics with the intent to highlight the regions covered with the 1877 deposits from others [
51,
52,
54]. The NDVI value was obtained with the following equation:
where
NIR is the pixel value of the near-infrared band and
R is the pixel value of the red band. The results are new single-band raster layers with pixel values between −1.0 and 1.0 which could be interpreted as a proxy for vegetation composition [
54]. The obtained imagery showed that in general the lower NDVI values represent zones dominated by rock or bare soil, while the higher values represent bushes, grassland, and thicker vegetation. For mapping purposes, the final screen displays of the NDVI images were enhanced with additional contrast and both the maximum and minimum values of the layers were sometimes cut off using their respective cumulative counts. The whole drone-NDVI imagery is provided as supplementary material to this study.
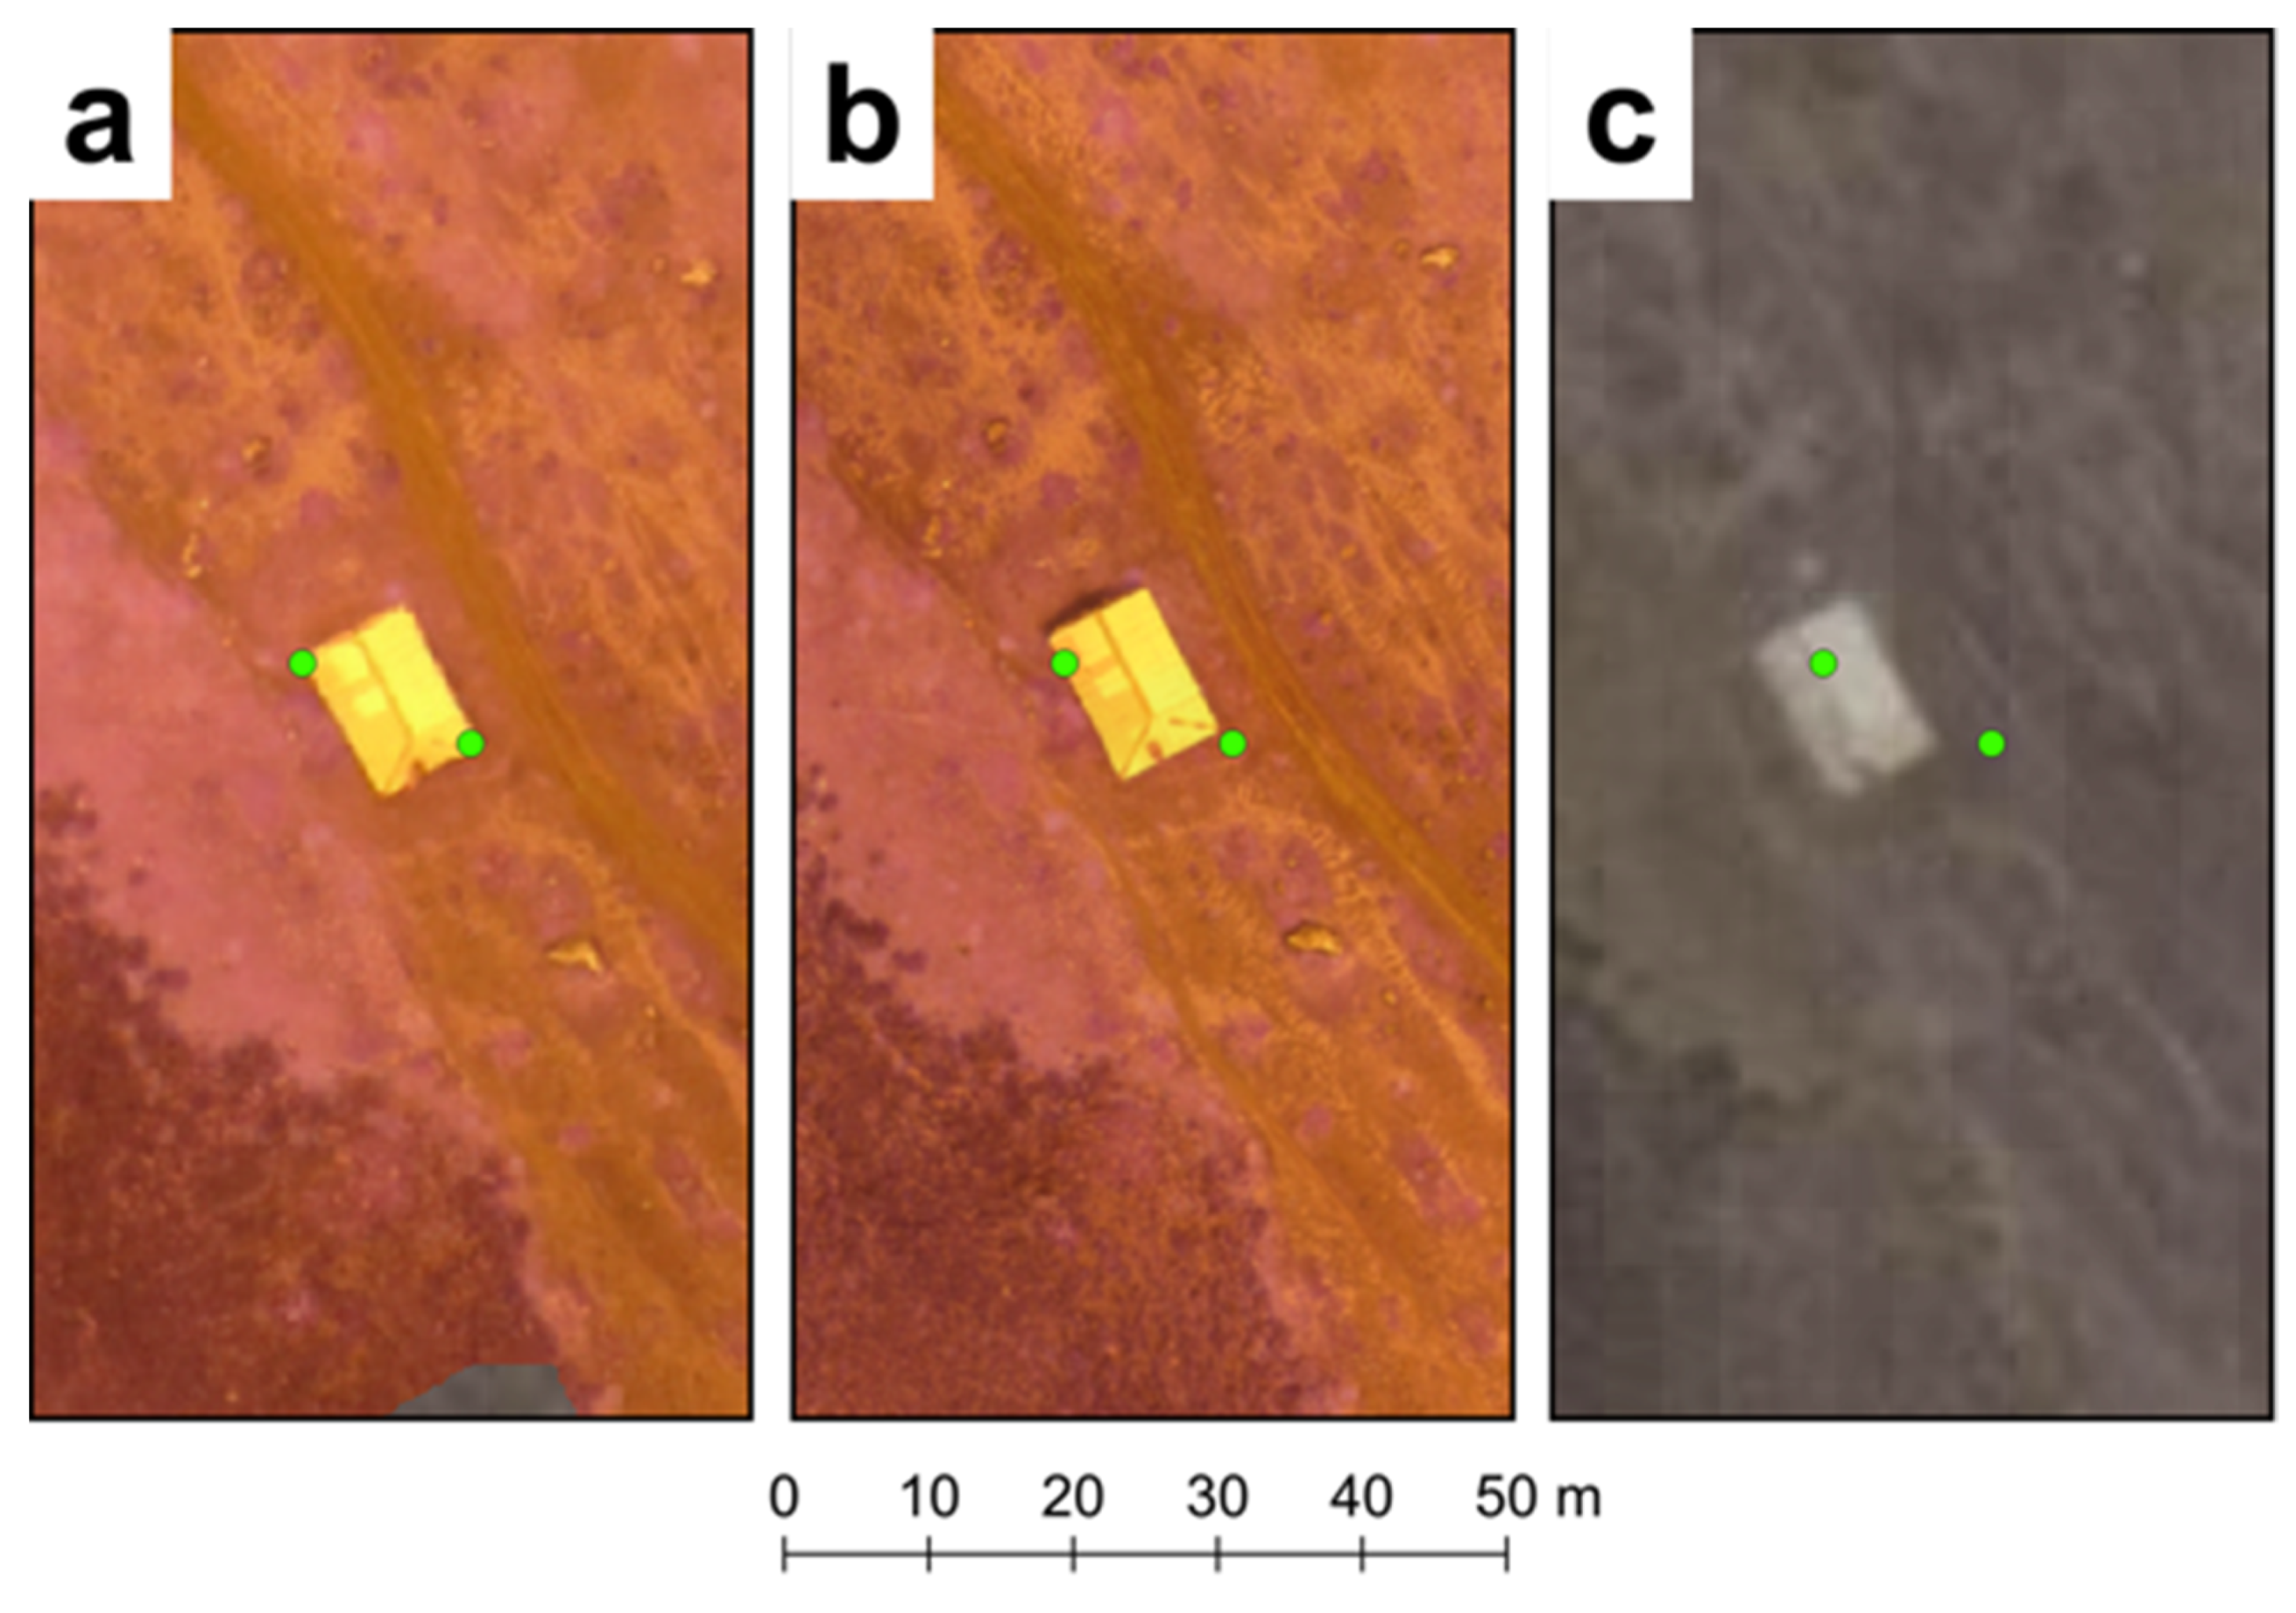
Most of the mission blocks were planned to cover juxtaposed areas in order to assess the effect of the lack of ground controlled georeferencing in the cartographic quality of the orthomosaic images. After comparing the apparent location of point objects present in two adjacent images, it was observed that the differences between the objects were consistently lower than 2 m (
Figure 7a,b). This means that the orthomosaic images may be used for cartography with relative georeferencing down to scales of ~1:2500. In addition, the orthomosaics were compared in the same way with freely available Google Earth imagery in order to assess the absolute georeferencing [
55]. In this case, the differences raised to up to 4.5 m, implying that cartography at 1:5000 scale was still possible without an absolute georeferencing from the orthomosaics (
Figure 7c).
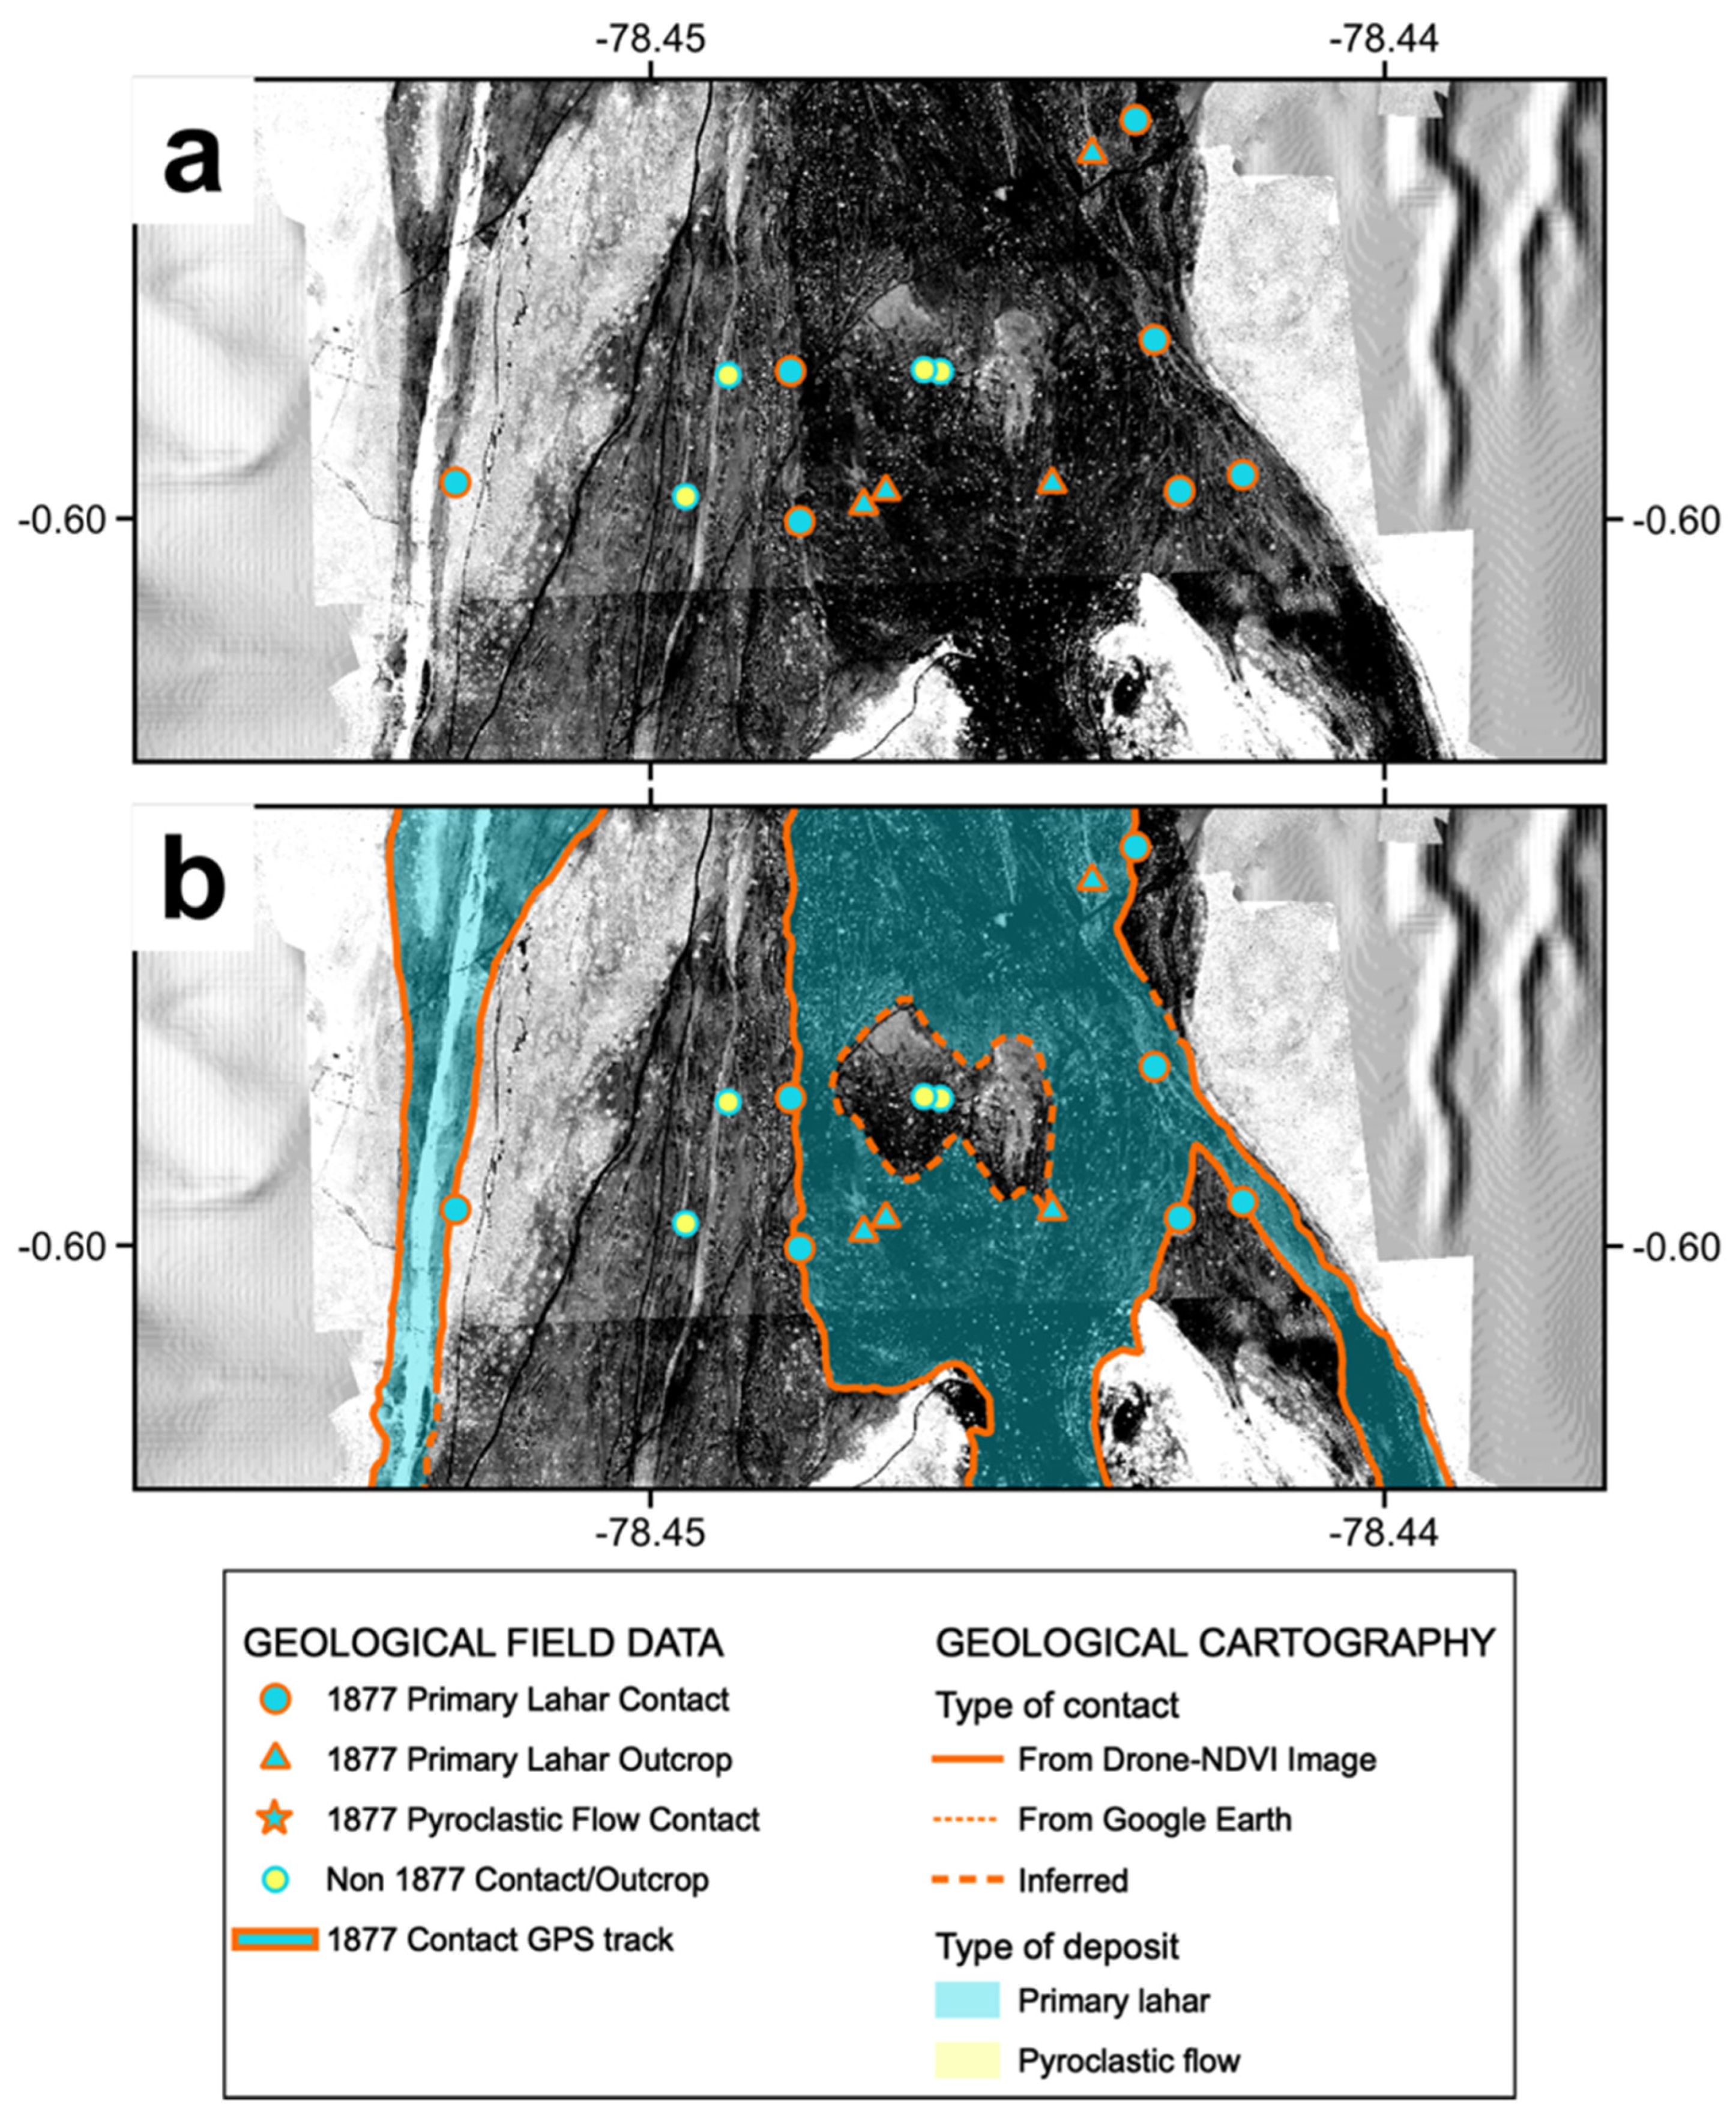
Given the constantly changing weather and sunlight conditions during image acquisition, the use of supervised classification approaches to extract the regions of interest from the imagery was impractical. Then, the final vector layers representing the 1877 deposits were elaborated by hand, through correlation and interpretation of the field data together with the drone-NDVI imagery. In some specific regions where drone imagery could not be obtained, the field data was interpreted using the freely available satellite images provided by the Google Earth server. Thus, the hand mapped contacts from the 1877 deposits were classified in four categories:
Identified in the image, when the contact was drawn from the NDVI imagery in correlation with field data;
Observed in the field, when the contact was obtained with a hand GPS track;
Identified in satellite, when the contact was drawn from Google Earth imagery in correlation with field data;
Inferred, when the contact was not identifiable in the images (NDVI or Google Earth) and was drawn by informally extrapolating and interpreting field data.
Consequently, the contacts belonging to the first three categories may be considered as most reliable, while those inferred are considered as less reliable. As a final product, two geospatial vector layers at 1:5000 scale were created from the mapped contacts. One layer contains line features, where information about the contact categories defined above was included as an attribute value. The second layer contains polygone-features, which represented a merger of the previous layer lines, with an attribute defining the deposit type (i.e., primary lahar or PDC) as a value. Both vector layers are provided as supplementary material to this study.
4. Results
During geological field surveys, a total of 165 control points were recorded in the whole study area, from which 105 corresponded to lateral contacts and 33 to outcrops of the 1877 deposits, while 27 corresponded to outcrops belonging to deposits from other eruptions (
Table 2). Additionally, a total of 38 GPS track lines representing lateral contacts of the 1877 deposits were also acquired, with a total length of 10.96 km.
For the drone surveys, the study area was divided into 21 mission blocks, covering a total surface of 28.4 km
2. To cover this area, 62 drone flights were required with a total flight time of 18 h 12 m, during which a total of 8973 individual frames were obtained (
Table 3).
The processing of the 21 mission blocks through SfM was performed by means of a commercial software and yielded RMS reprojection errors ranging between 0.54 and 1.21 pixels, for ground resolutions ranging from 5 to 7 cm/pixel. The number of tie points identified in the mission blocks for the initial image alignment varied from ~217 to ~697 thousand, and the processed dense clouds contained between ~88 and 473 million points. Thus, 21 orthomosaic images were created from the mission blocks covered by the drone surveys, containing NIR, red and green bands, and were all resampled to ground resolutions of 25 cm/pixel. Consequently, 21 single-band images with NDVI values were also obtained and were the main supply to perform the cartography together with the geological field data. Following, the cartographic results are presented for each plain.
4.1. Sindipamba Plain
Geological fieldwork in this plain was characterized by a relative difficulty in differentiating the 1877 deposits from those belonging to other preceding eruptions of Cotopaxi. Firstly, the 1877 lahar deposits in the Sindipamba plain contained few of the characteristic black cauliflower-shaped bombs, and consequently the field survey required special care for their identification (
Figure 5). Secondly, deposits from other primary lahars with scarce vegetation covering, that occurred shortly before the 1877 eruption (i.e., 1854), were widespread in the plain, as already noticed by Pistolesi et al. [
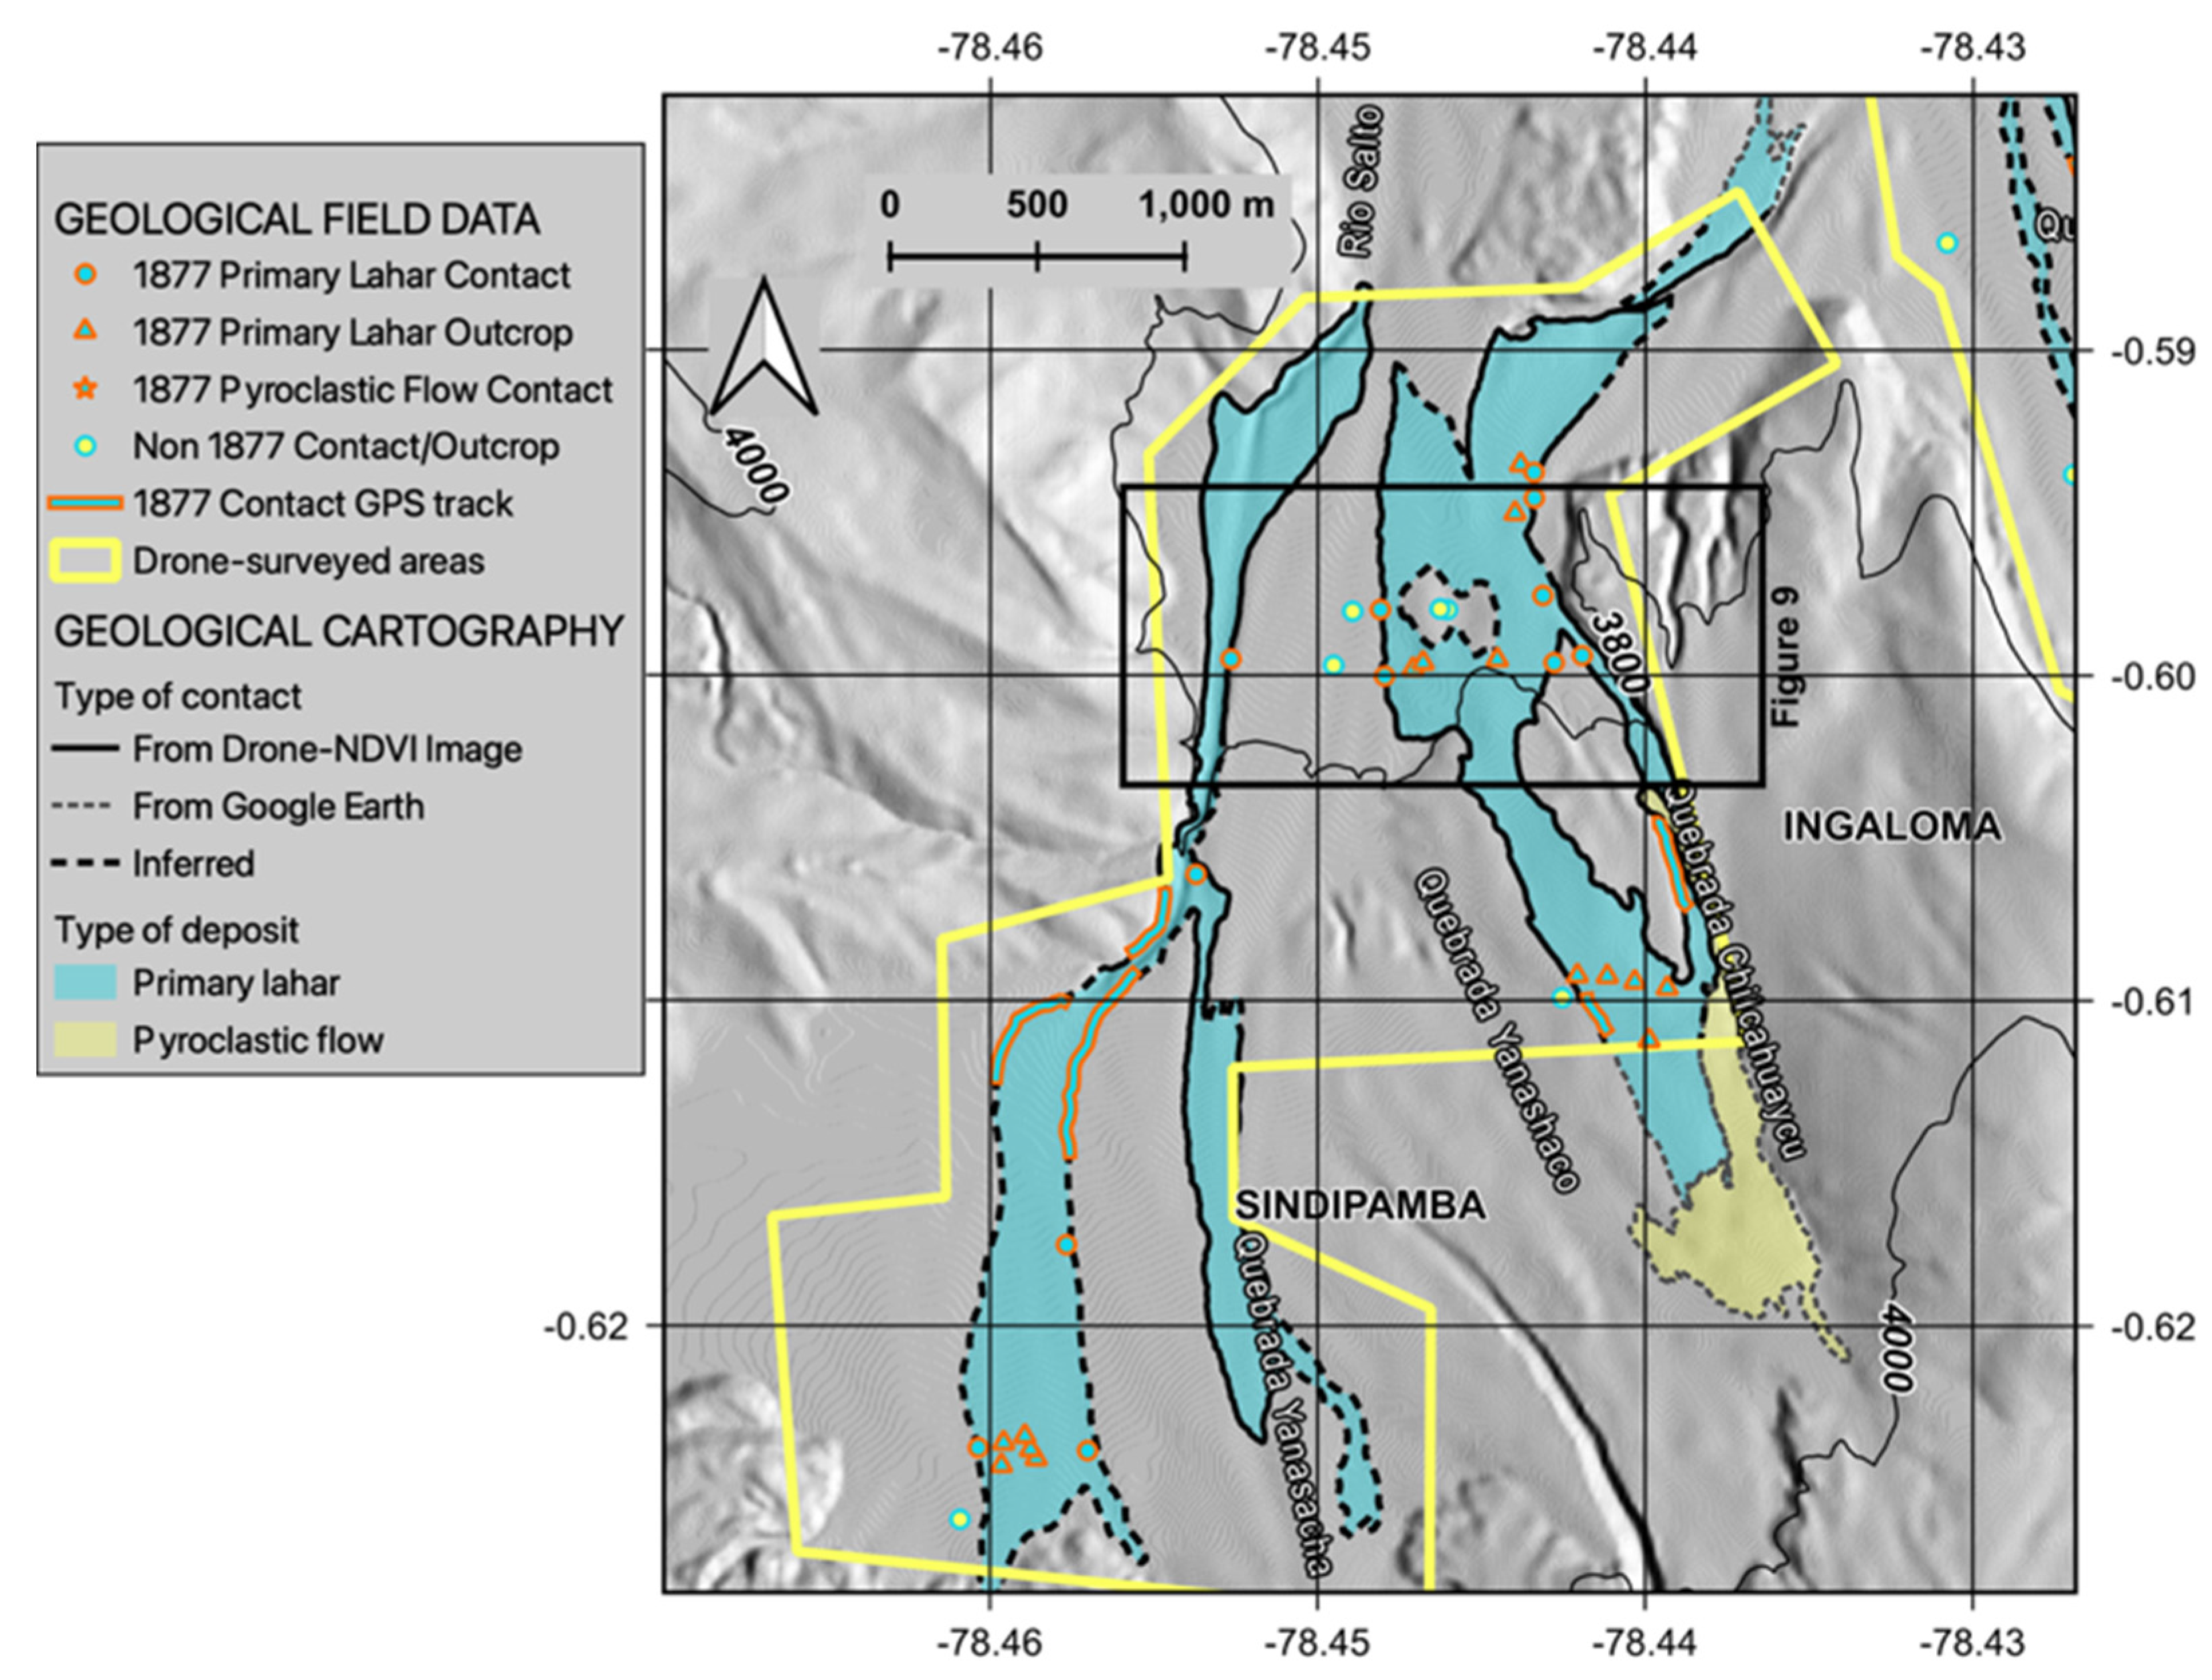
17]. Thus, from 33 control points obtained in this plain, 15 corresponded to the 1877 outcrops (i.e., locations where the 1877 black bomb was found in the surface) and only 12 to 1877 contacts (i.e., locations where the 1877 lateral limit could be identified), while 5 tracks of lateral contacts covering 2.3 km could be recorded (
Figure 8).
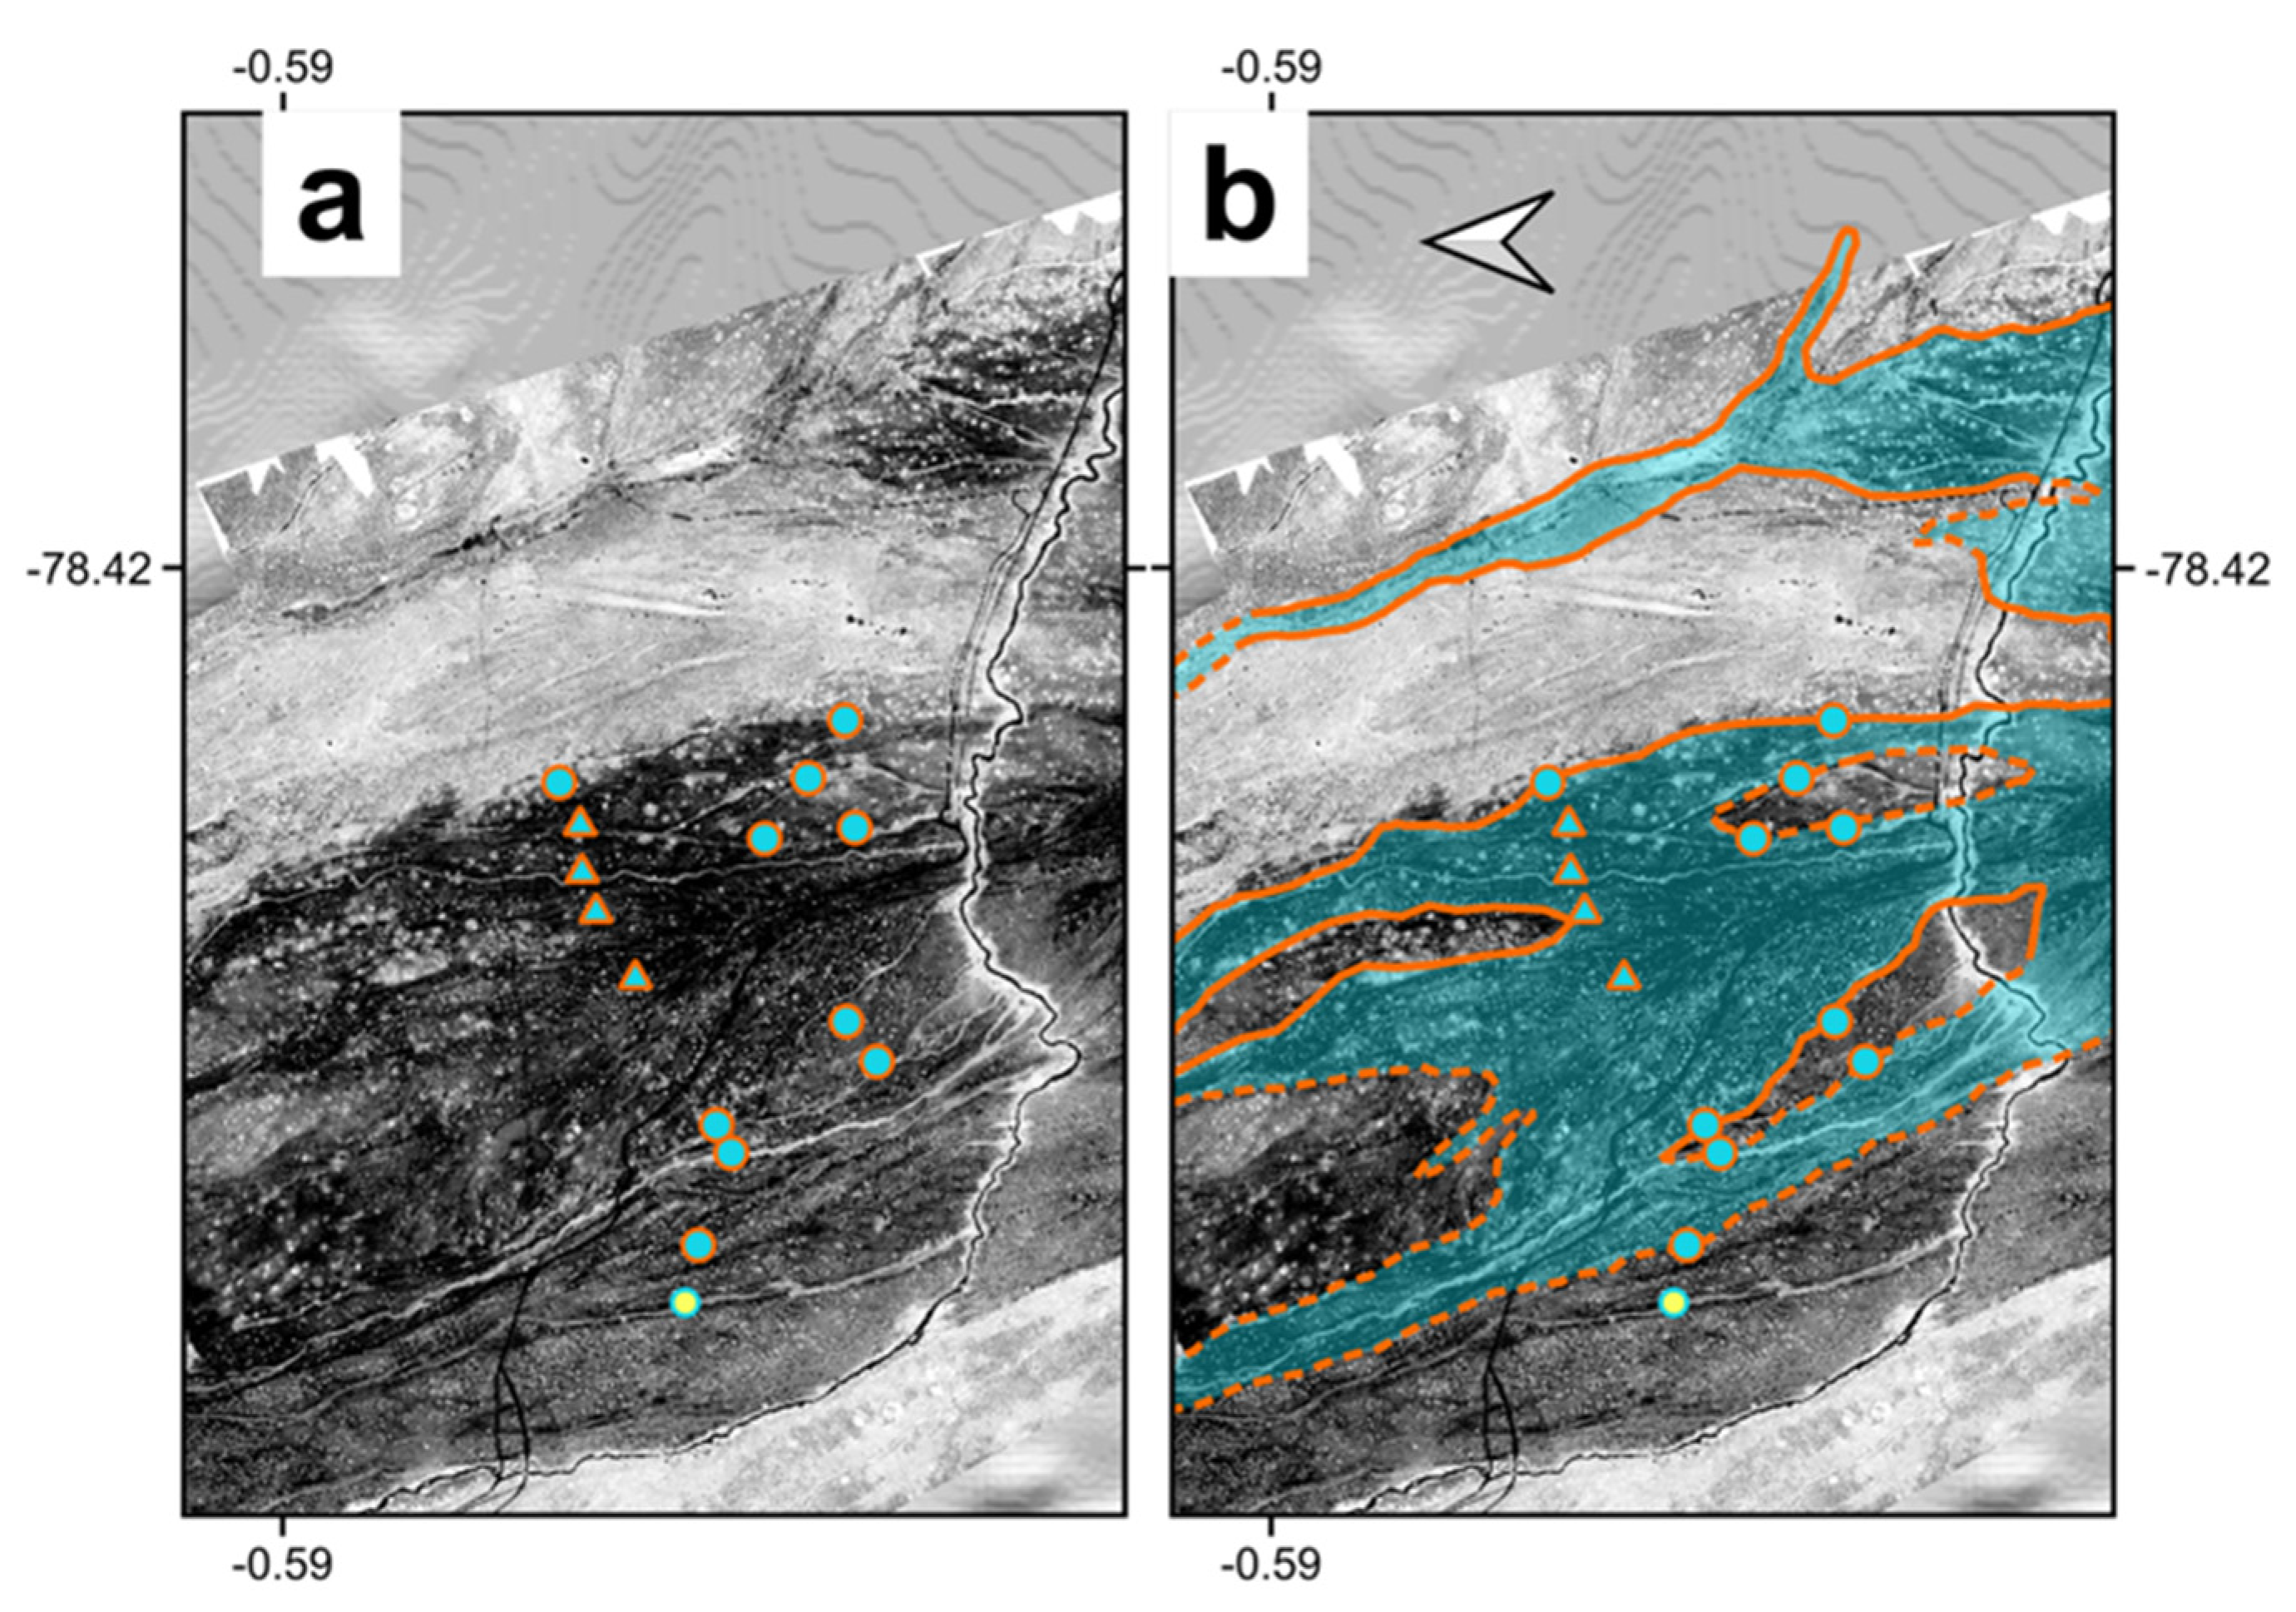
The difficulty in identifying lateral contacts of the 1877 deposits persisted in the NDVI images, given the presence of other deposits with similar vegetation covering, which produced reduced contrast in the images. Thus, significant interpretation and inference was necessary during contact drawing (
Figure 8 and
Figure 9). A total of 39.84 km of 1877 lateral contacts were mapped in this plain, from which 10.72 km (27%) were inferred and 26.8 km (67.3%) were identified either in the NDVI or in the Google Earth images (
Table 4).
The results of carthography show that the 1877 primary lahar flowed through three of the four main drainages of the Sindipamba plain. The eastern Chilcahuaycu drainage perhaps channelized the largest volumes and discharge rates, and fed flows into both the Rio Salto northwards and the Rio Pita northeastwards (
Figure 8). Conversely, the Yanasacha and the unnamed (to the west) drainages diverted apparent smaller volumes directly to the Rio Salto. A pyroclastic fow deposit has been mapped in the upper Chilcahuaycu drainage, from both drone-NDVI and Google Earth imagery (
Figure 6 and
Figure 8). The field observations show that the PDC deposit overlies the primary lahar deposit.
4.2. Victor Punina Plain
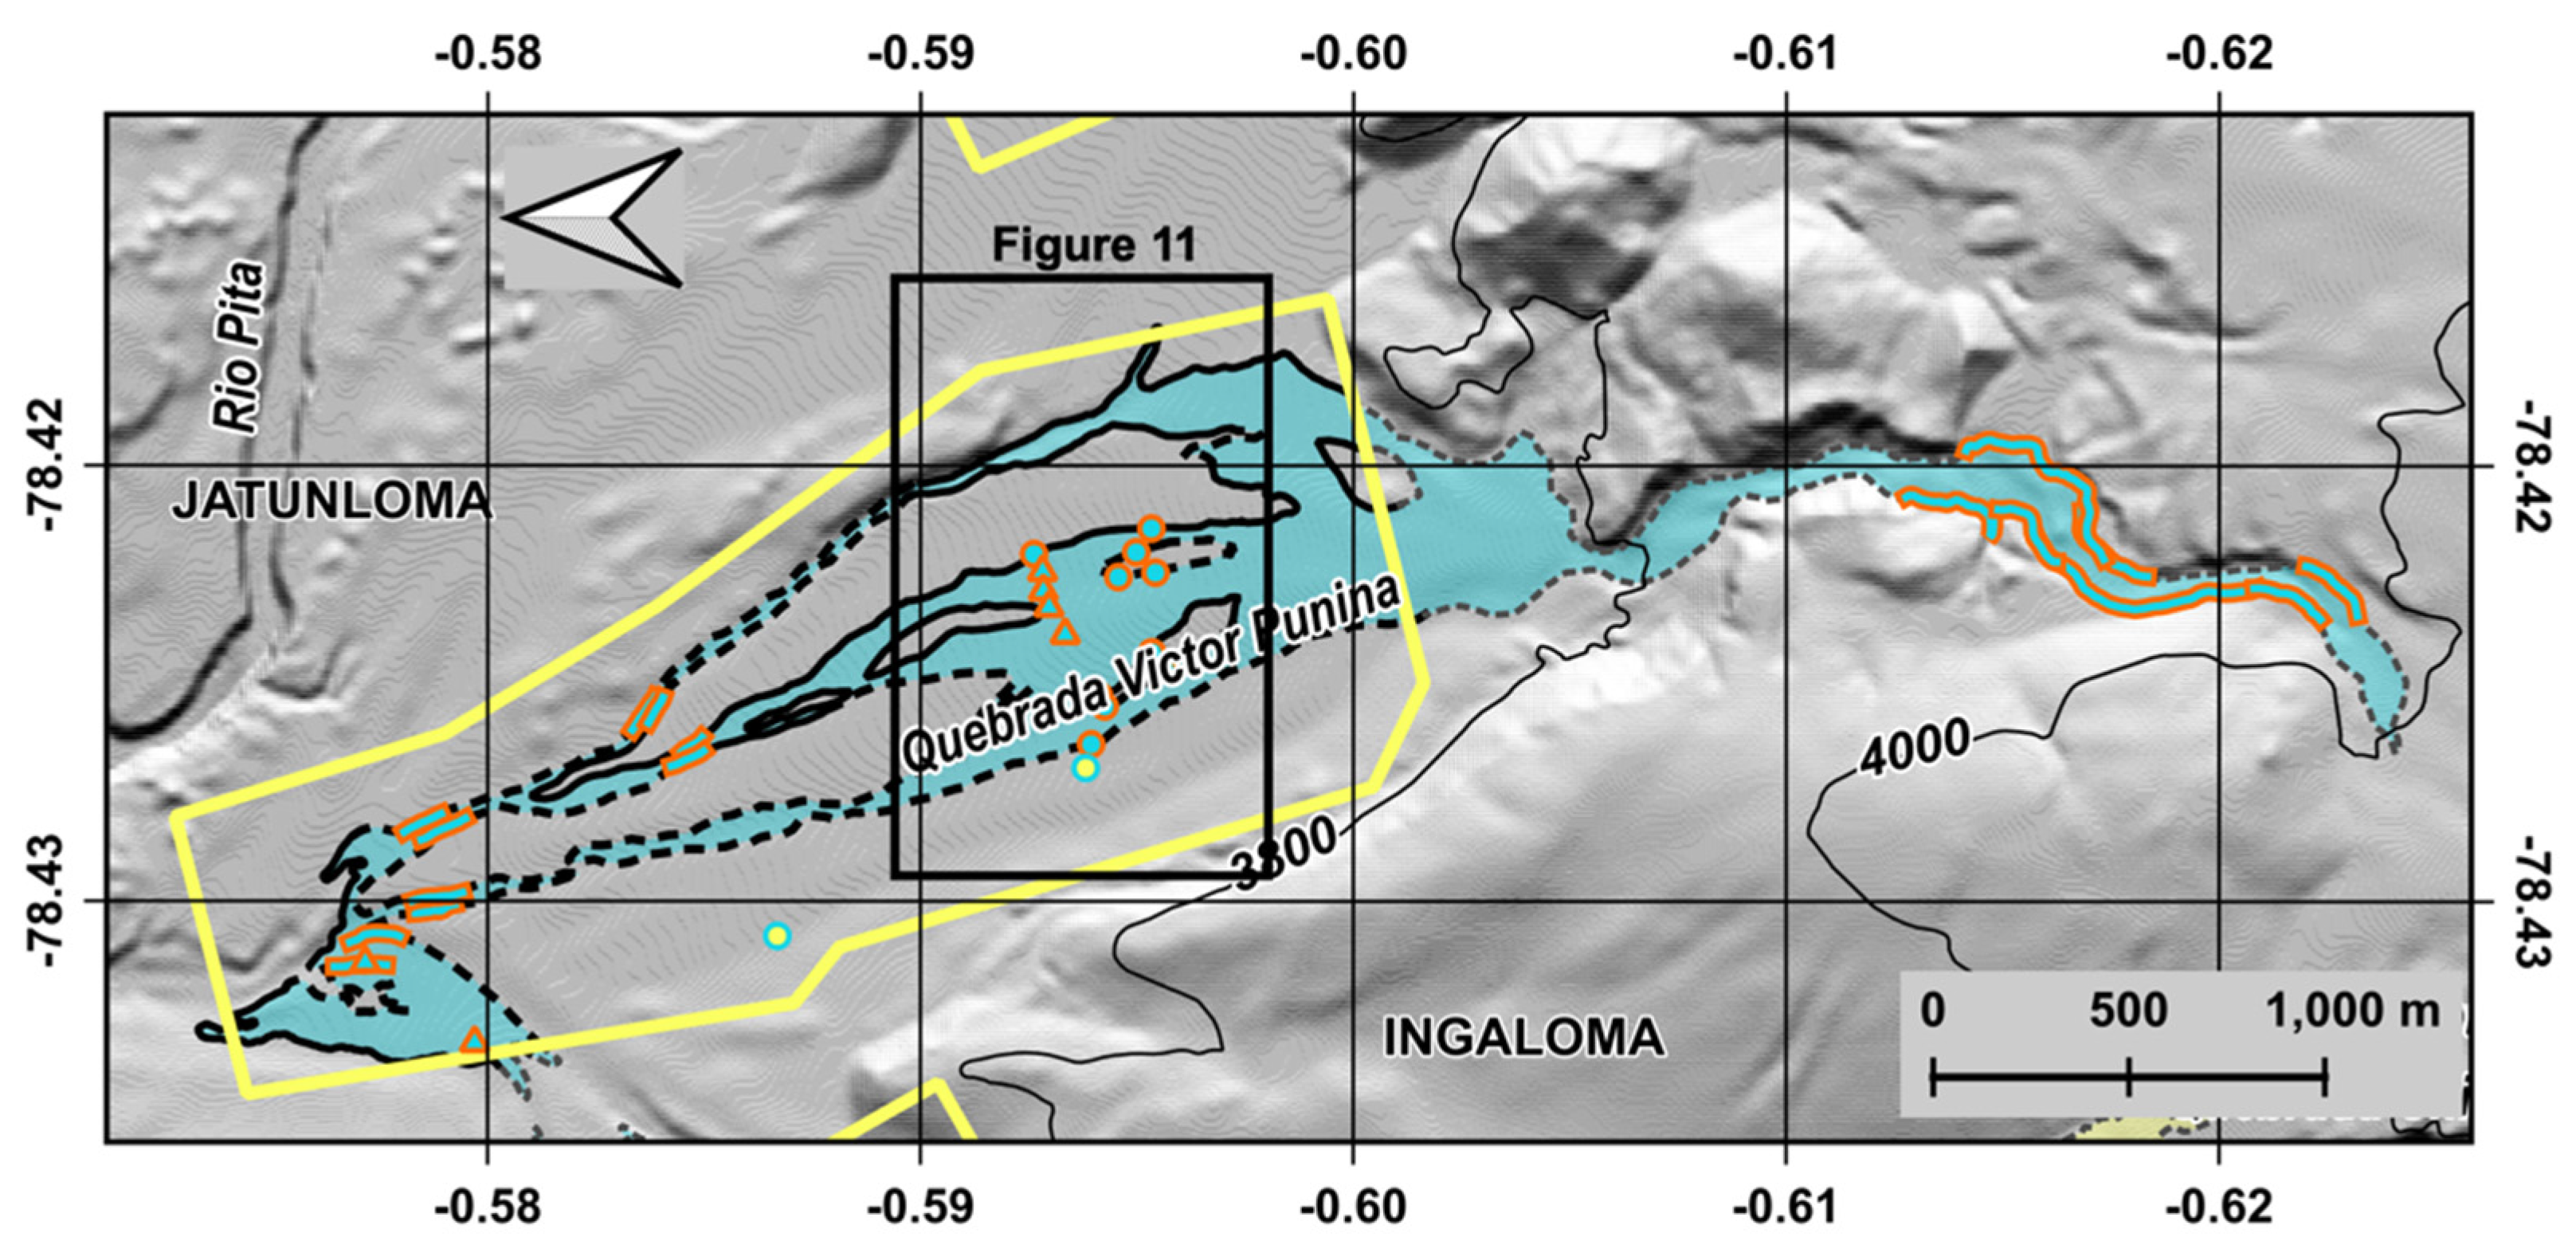
Similarly to the Sindipamba, the geological field survey in the Victor Punina plain was complicated due to the low abundance of the specific black bombs in the 1877 deposits and to the presence of other recent deposits with poor vegetation covering. Only 10 contact and 6 outcrop-control points could be obtained in the plain, although 17 tracks covering 2.96 km of 1877 lateral contacts could be recorded, most of them outside the drone-surveyed area, in the upper stream above the 3800 m level (
Table 2,
Figure 10).
Contact cartography thus also required significant interpretation in the Victor Punina plain where differences between deposits in the drone-NDVI images were slight due to the lack of contrast (
Figure 11). A total of 29.91 km length of contacts were mapped, from which 11.6 km (38.8%) were inferred and 10.07 km (33.7%) were considered as identifiable from the drone-NDVI images (
Table 4). Moreover, this plain is characterized by a significant amount of contacts mapped from the Google Earth imagery, with a total of 5.29 km (17.7%) (
Figure 10). In this plain it was evident that even in close locations, there might be significant changes in the vegetal covering of the 1877 deposits, as is observed in the eastern zone of the Victor Punina plain where the drone-NDVI imagery shows lighter gray hues (
Figure 11).
The cartography obtained in the Victor Punina plain shows that the 1877 flow was channelized in the deep valley of the upper drainage, between the 3800 and the 4000 m level (
Figure 10). Upon arrival to the flatter and wider valley floor, the lahar experienced significant deposition and formed a fan, after which three narrow ravines contained the remaining flow towards the conjunction with the Rio Pita northwards (
Figure 10). Given the amount of field data acquired and the difficulty in identifying contacts in the imagery, the cartography in the Victor Punina plain is considered to have the most uncertainty.
Similar to the case of the Sindipamba plain (
Figure 9), other poorly vegetated deposits can be observed around the 1877 deposits in the Victor Punina plain (
Figure 11) in the field and in the NDVI imagery. These deposits were probably emplaced shortly before 1877 and belong to the 1854 eruption of Cotopaxi volcano, as also suggested in [
17].
4.3. North-Eastern Plain
The North-eastern plain was generally characterized by the occurrence of clearly distinguishable 1877 deposits. Throughout the plain, the deposits abundantly contained the specific 1877 black bombs, while displaying the least amount of vegetation covering with respect to the neighboring deposits, facilitating the identification of lateral contacts (
Figure 4 and
Figure 12). Thus, a total of 57 contact and only 1 outcrop control points were recorded for the 1877 deposits, while 14 outcrops of other deposits were also identified (
Table 2,
Figure 12). Additionally, nine GPS tracks were recorded covering a total 2.81 km of lateral contacts.
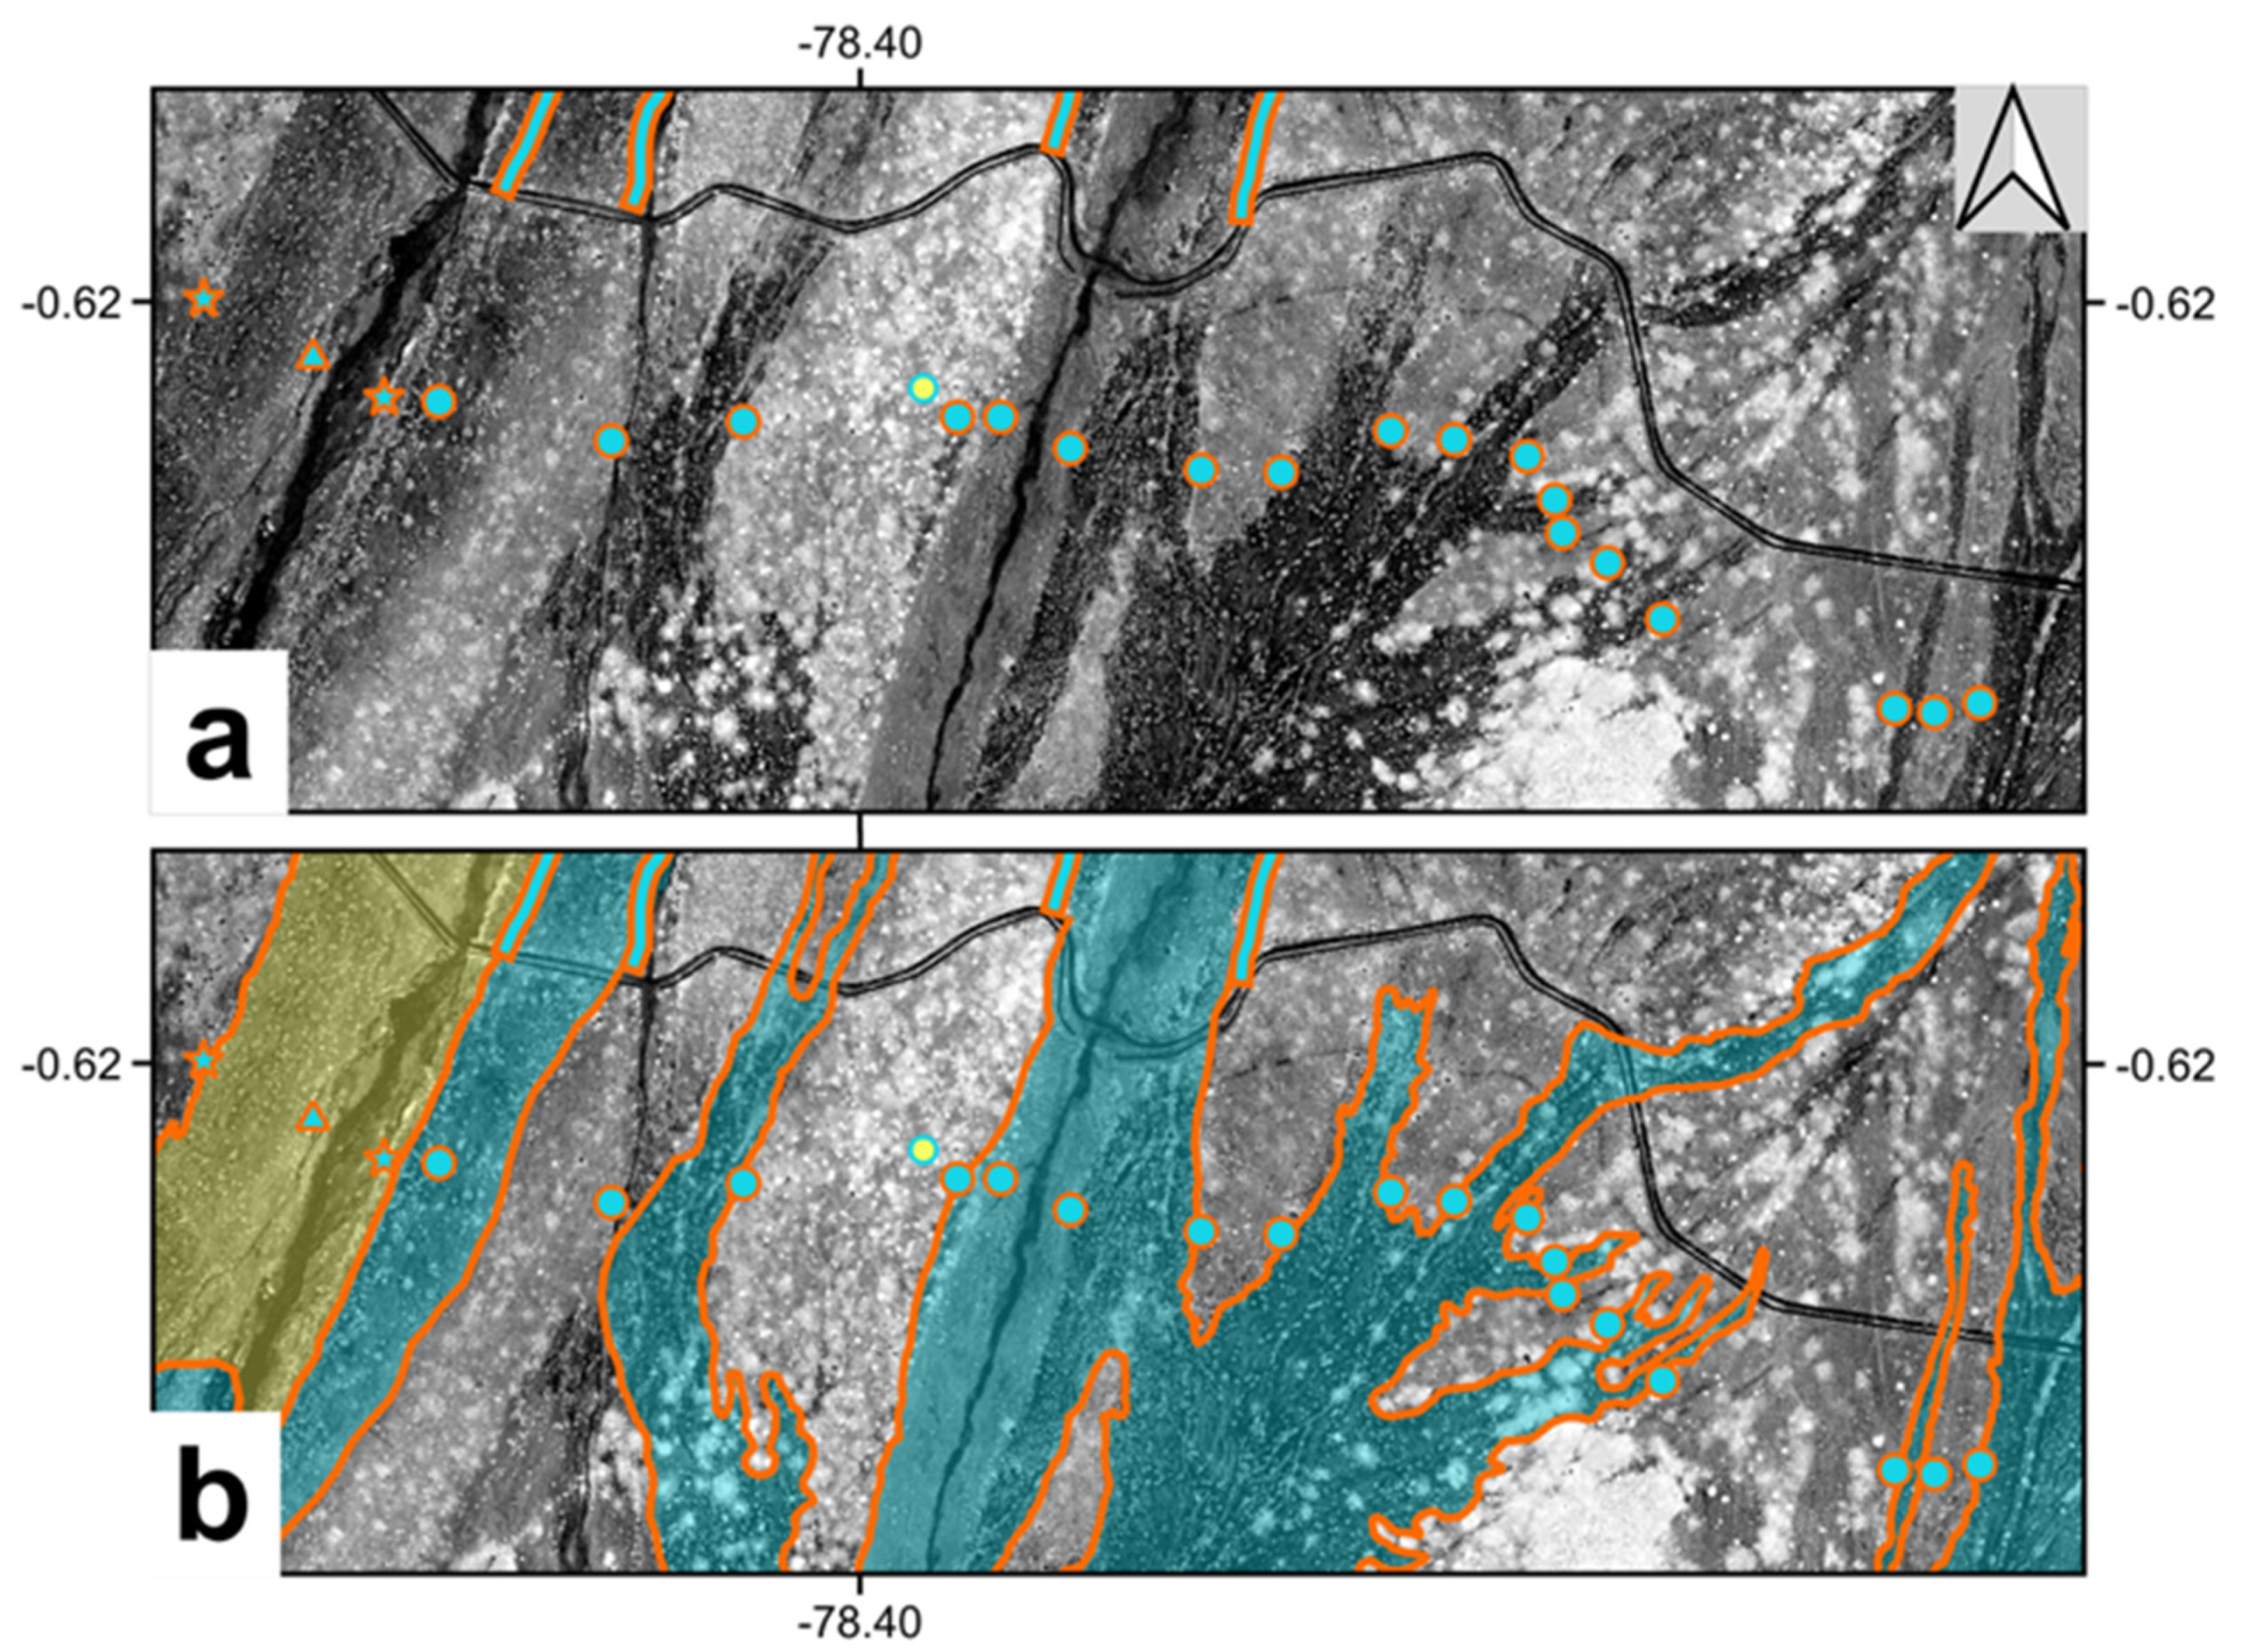
Identification and cartography of the 1877 deposits present in the North-eastern plain was also relatively simple in the drone-NDVI images, given their significant contrast and the clear correlations with the geological field data (
Figure 13). A total of 93.86 km length contacts were mapped in the plain, from which 81.98 km (87.3%) were considered as identifiable and only 0.4 km (0.4%) were inferred in the NDVI imagery (
Table 4). Additionally, 8.68 km were obtained from the Google Earth imagery, mainly in the upper flanks, close to the 4000 m level (
Figure 12).
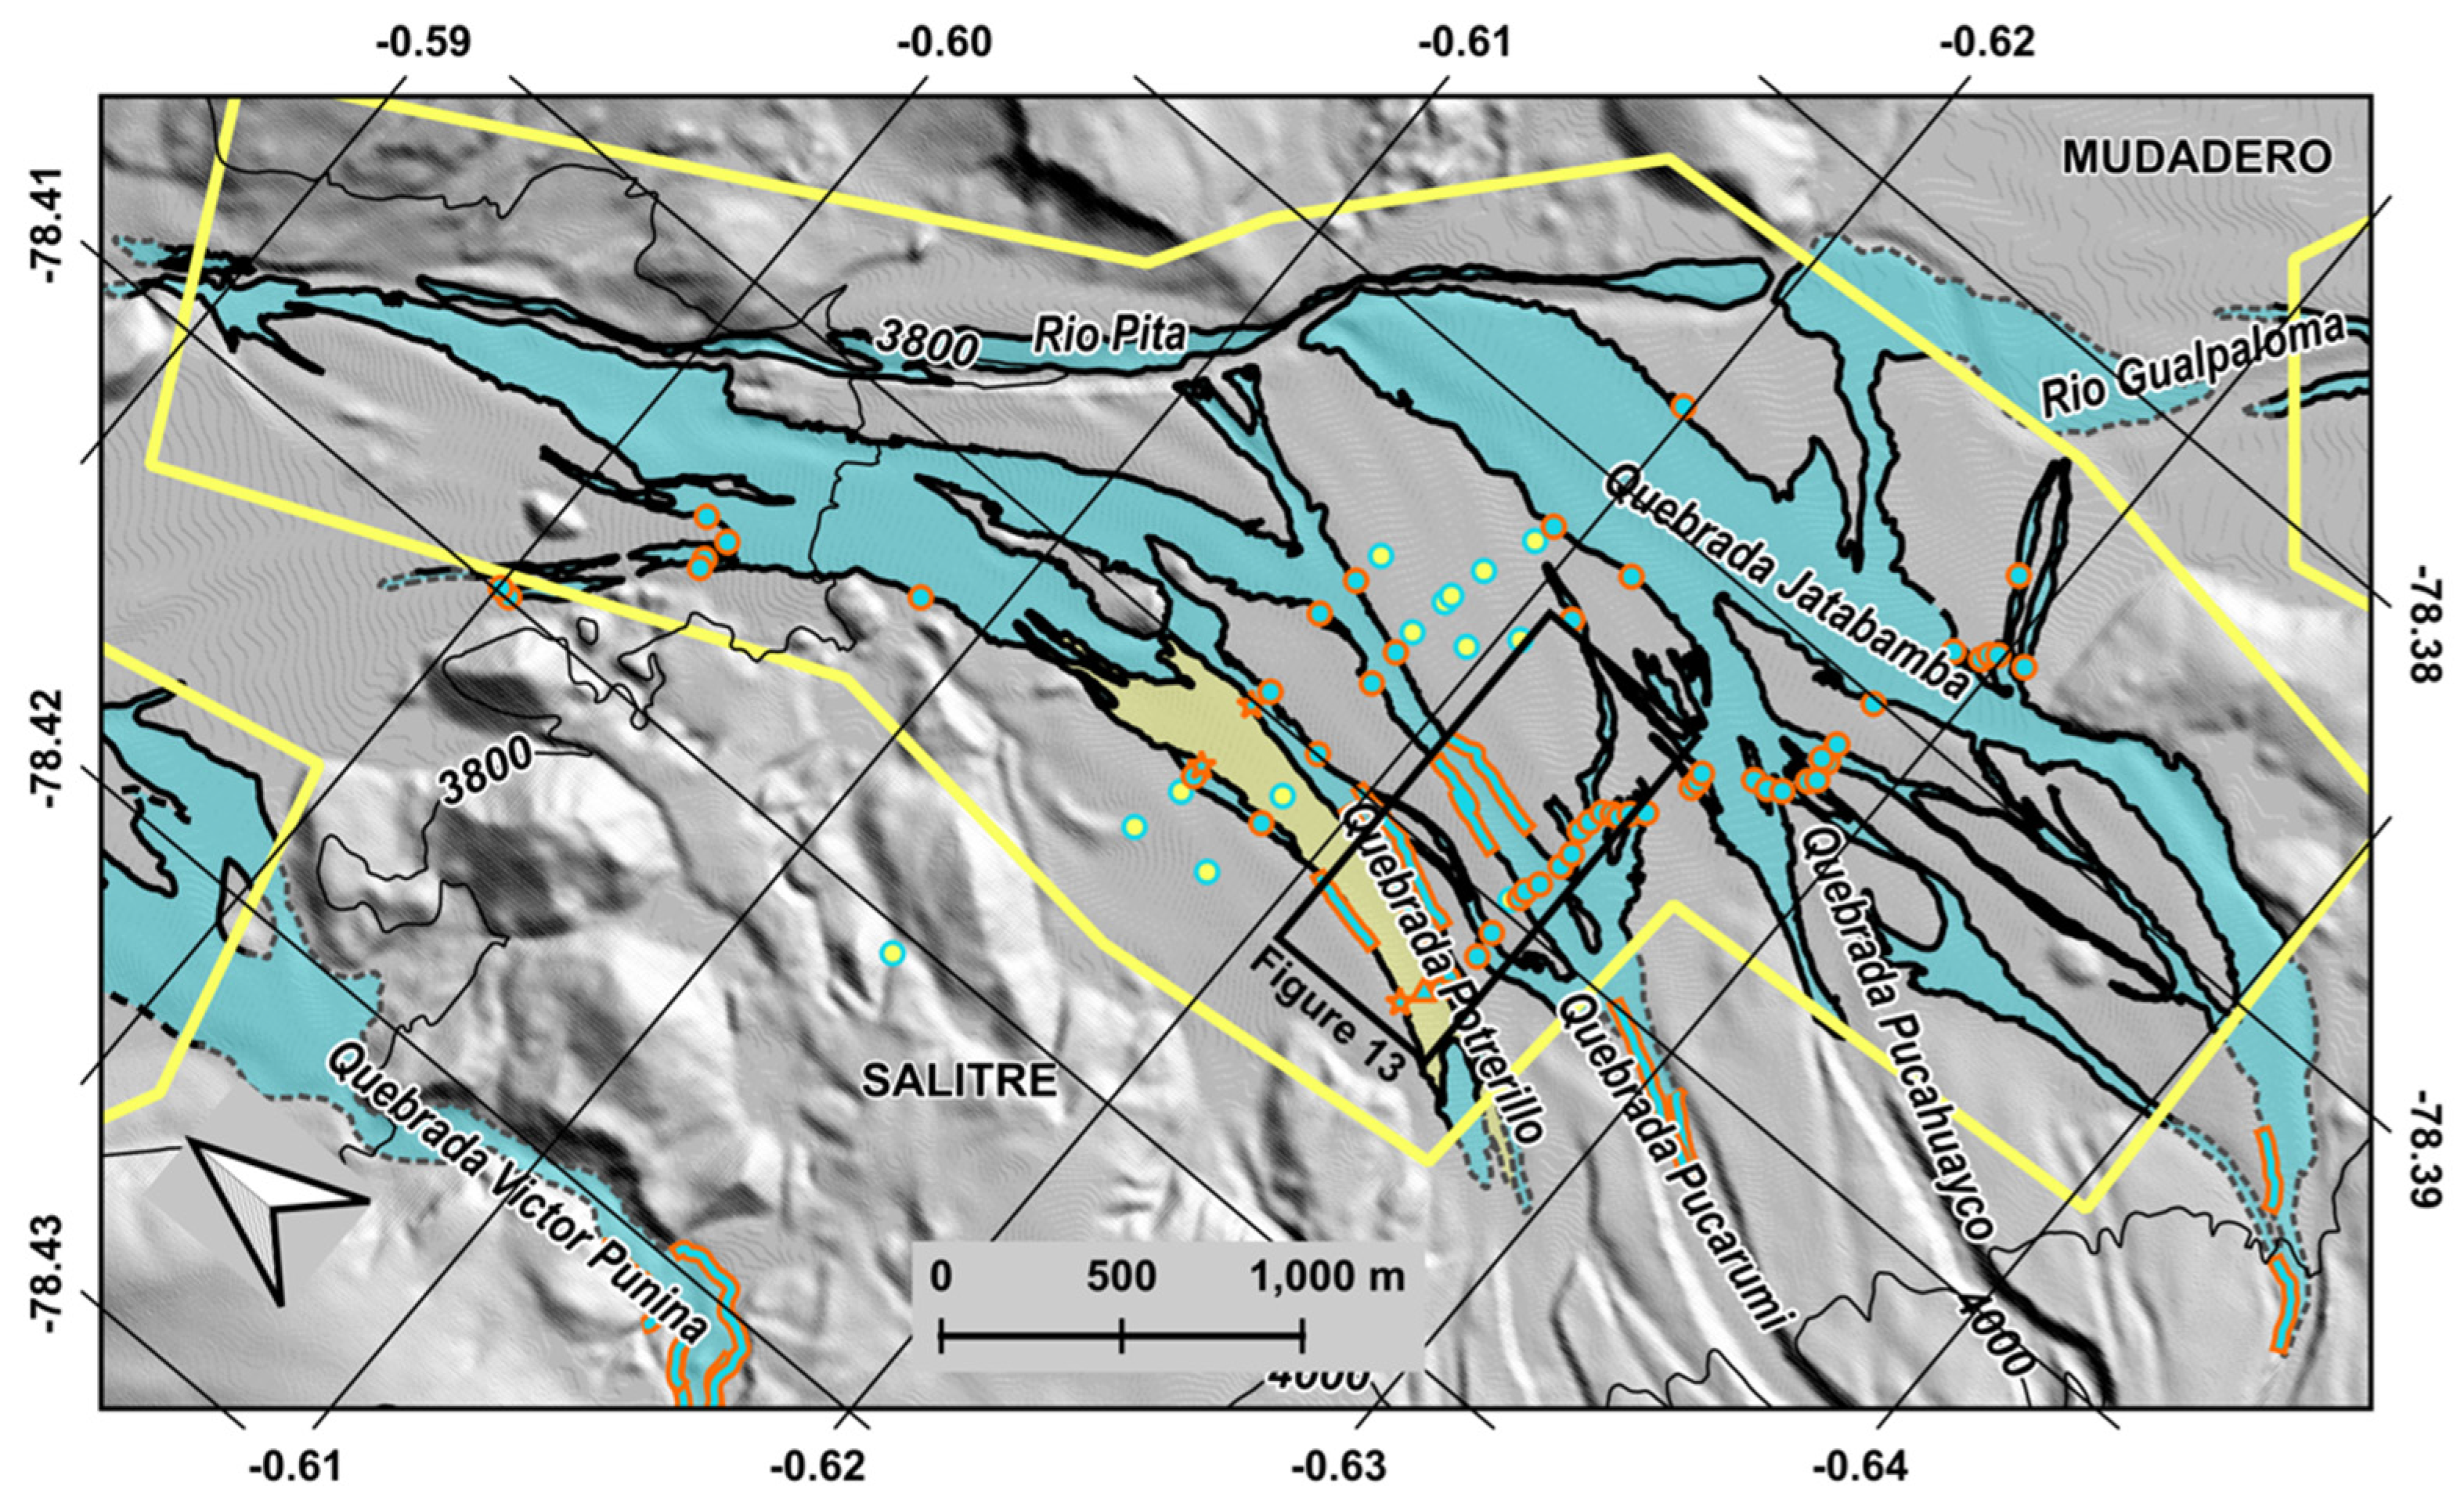
The cartography in the North-eastern plain suggests that the total volume of 1877 primary lahars was significantly larger than in the previous plains, and certainly richer in juvenile clasts (specific black bombs). They descended through the Potrerillo, Pucarumi, Pucahuayco and Jatabamba drainages, all of which display wide and deep canyons in the middle and upper NE flanks of Cotopaxi. Once in the flatter zones, the flows displayed a complex behavior, producing an intricate network of contacts, specially between the Potrerillo and the Jatabamba drainages (
Figure 10 and
Figure 11). Though significant deposition must have occurred in the plain, large volumes of the flows seem to have reached the Rio Pita, given the long intersections between the mapped deposits and the river course. The NDVI images also show the presence of other lahar deposits with changing amounts of vegetation (pale gray shades) surrounding the 1877 deposits (
Figure 13).
Finally, a PDC deposit which descended the Potrerillo drainage was also observed in the plain, which was composed almost exclusively of the specific 1877 black bombs. From field observations, this deposit is unequivocally overlying the 1877 primary lahar deposit, which implies explosive activity at Cotopaxi after the June 26 eruption. This is in agreement with the report by Wolf [
1], who mentions that the volcano produced loud explosions for several weeks after the main event.
4.4. Eastern Plain
Similarly to the North-eastern plain, the Eastern plain was characterized by the widespread occurrence of the 1877 deposits, with abundant presence of the specific black bombs and clear differences in vegetation covering with respect to the neighboring deposits. Therefore, also in this case the identification of lateral contacts was relatively simple in the field. A total of 26 contact- and 11 outcrop-control points for the 1877 deposits were obtained, together with 5 outcrops of older deposits in the plain (
Figure 14,
Table 2). Additionally, seven GPS tracks recorded lateral contacts in the Eastern plain for a total distance of 2.55 km.
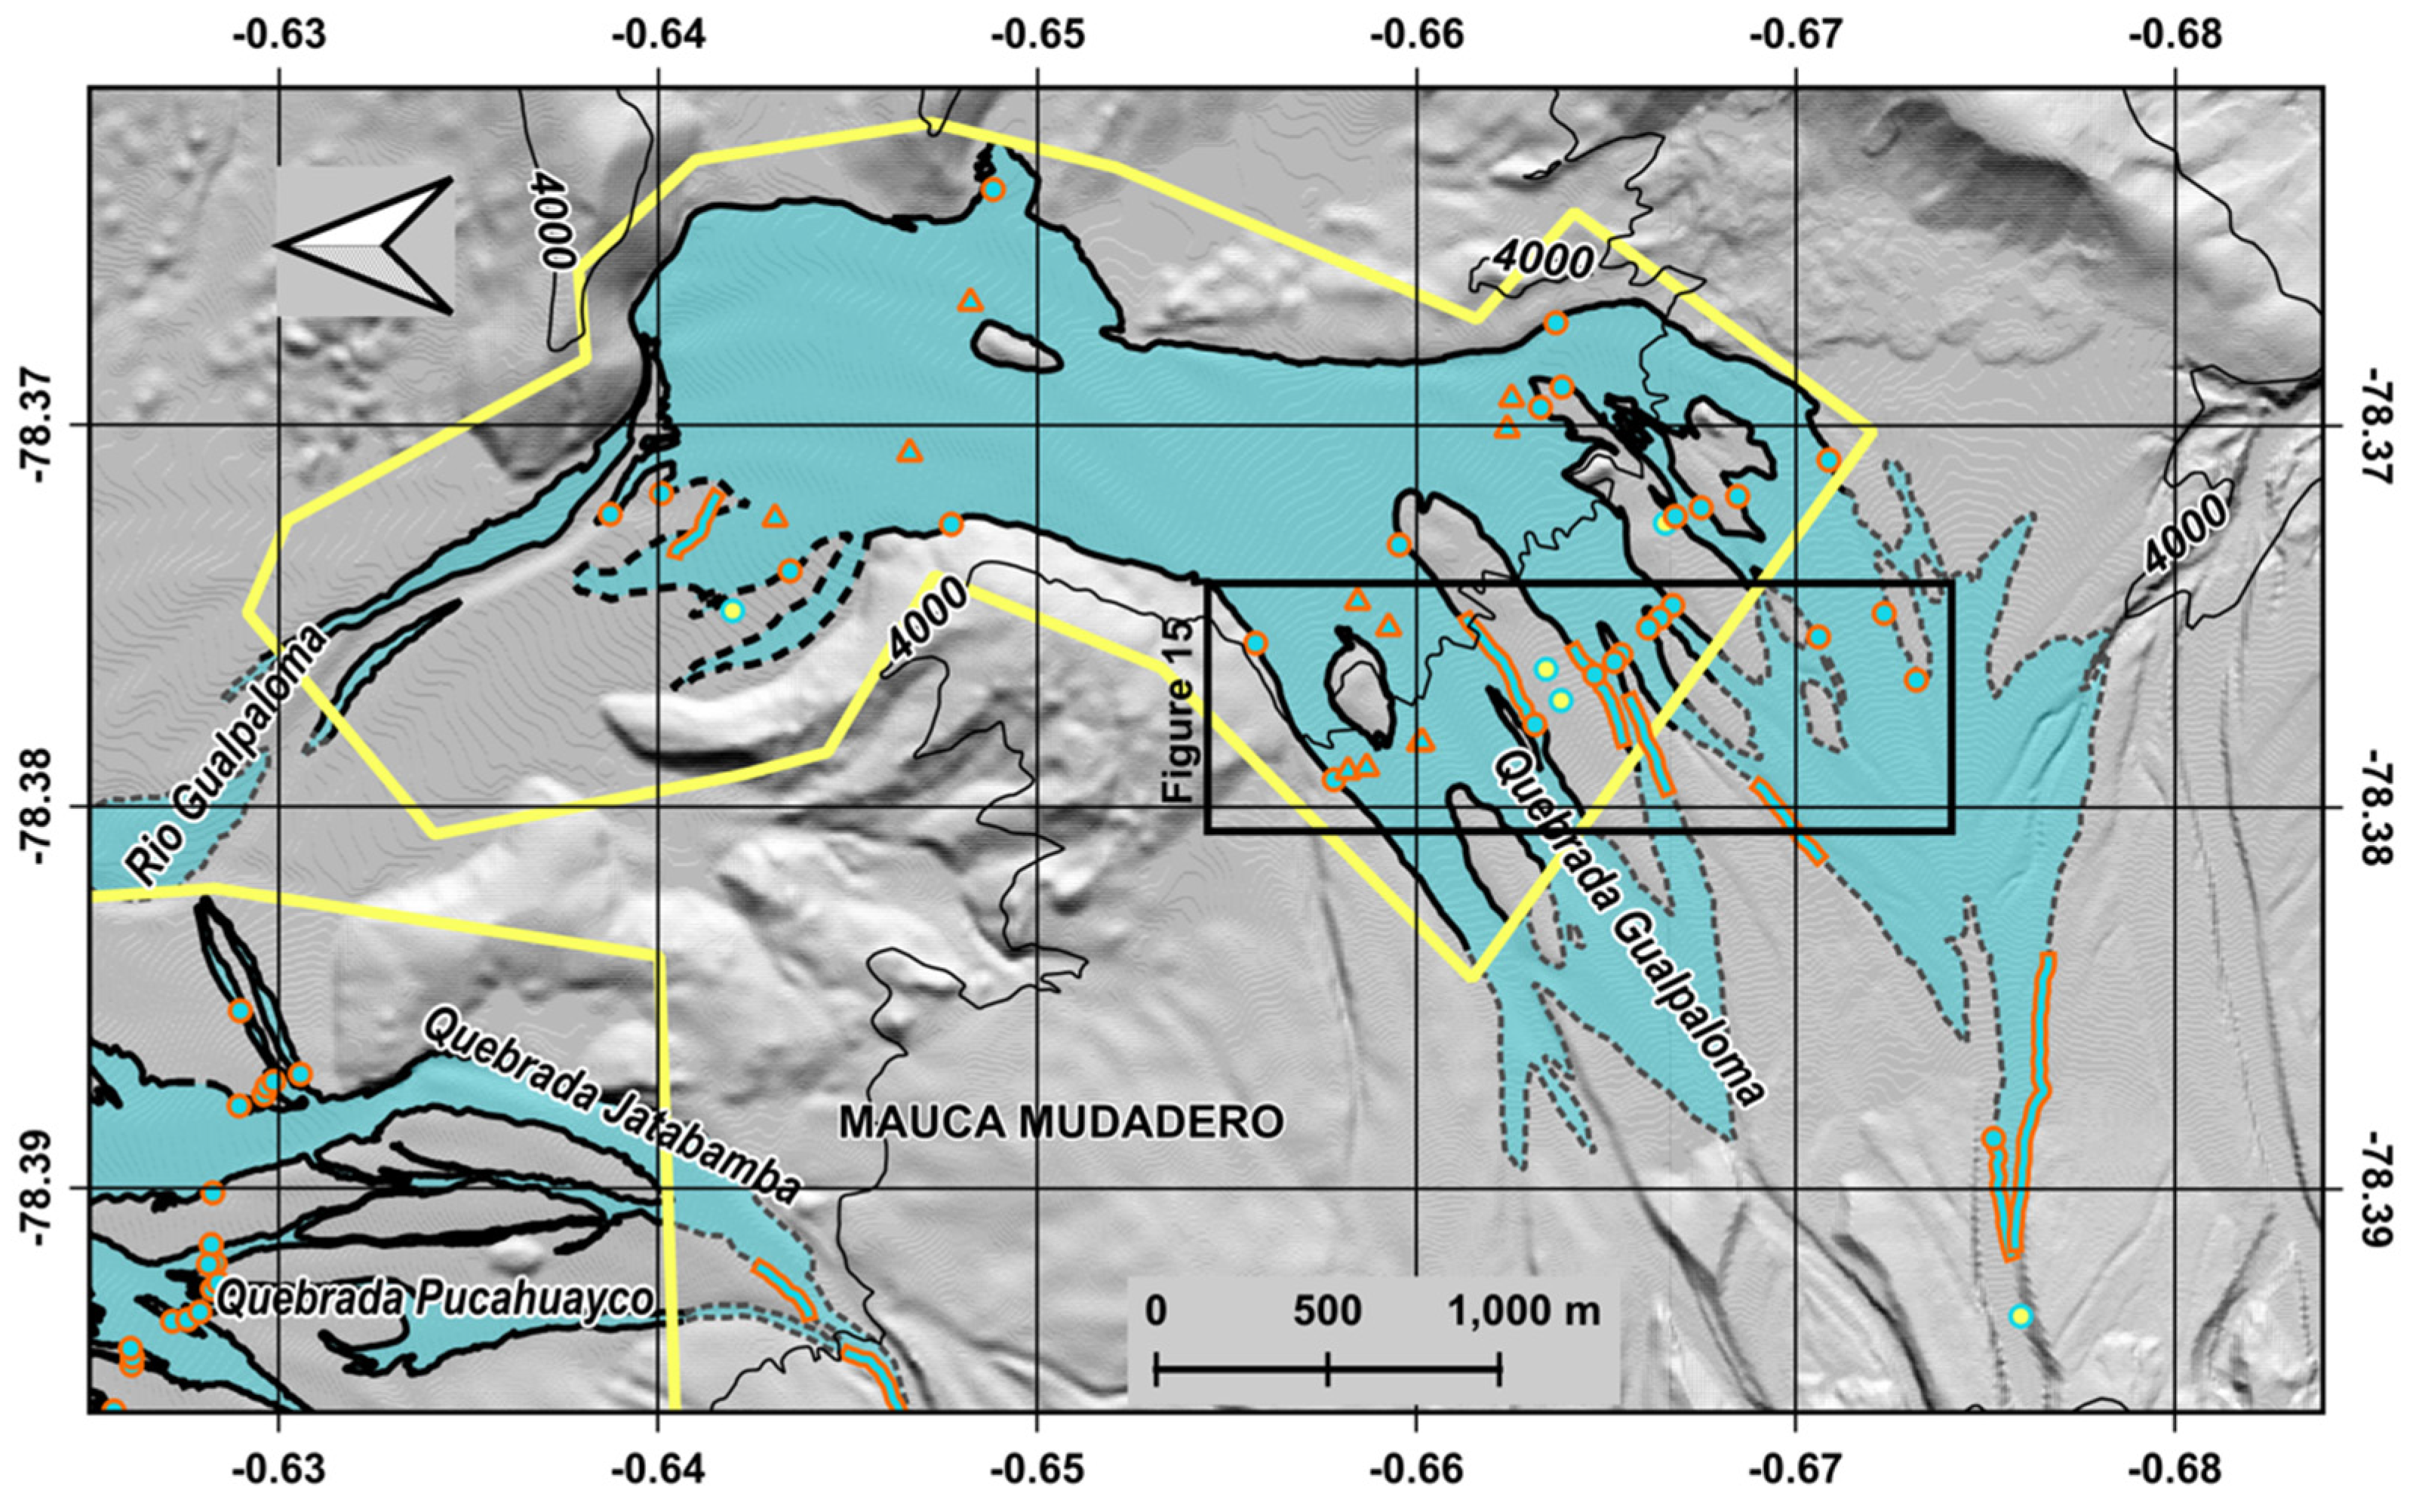
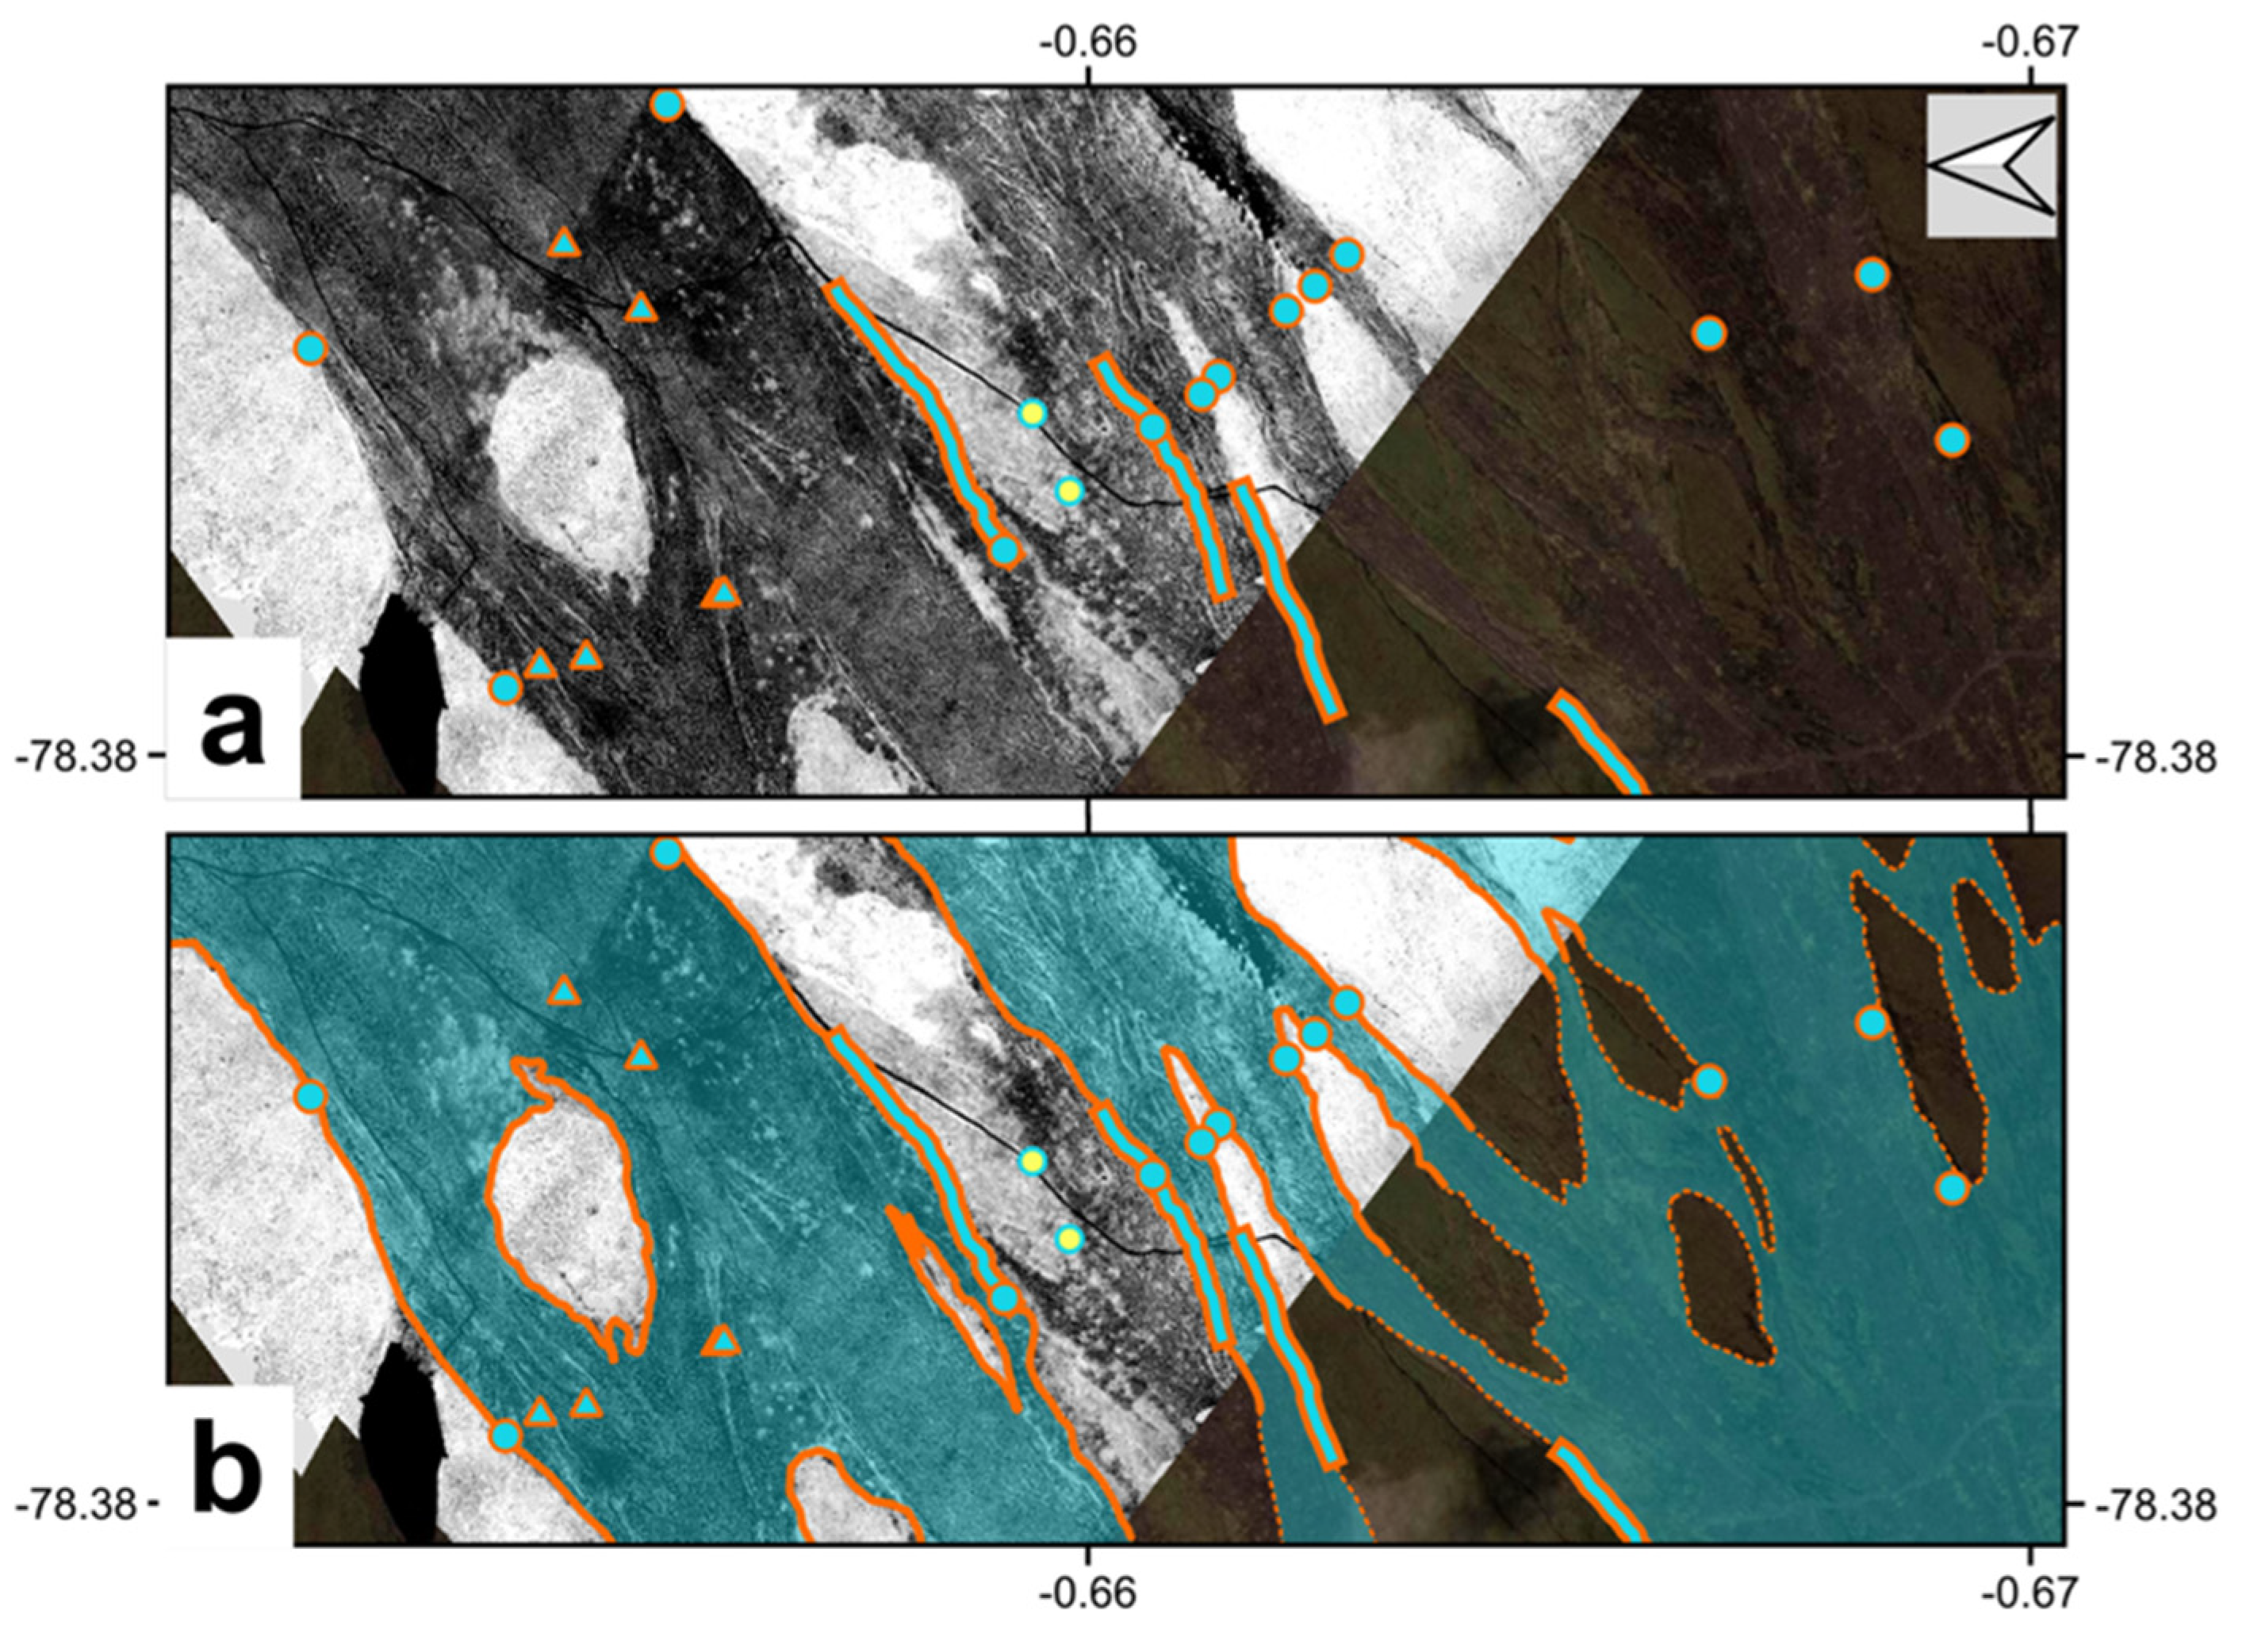
The identification of the 1877 contacts in the drone-NDVI images was facilitated by the clear contrasts produced with other deposits and sharp correlations with the field data (
Figure 15). A total of 47.1 km of contacts were cartographed in the Eastern plain, from which 25.65 km (54.5%) were considered identifiable and 3.41 km (7.2%) inferred from the NDVI imagery, while 15.49 km (32.9%) were obtained from Google Earth, mainly corresponding to the upper zones of the plain (
Figure 14 and
Figure 15).
The results show that the 1877 primary lahar flows in the Eastern plain were possibly the largest of all in the study area and contained abundant specific black bombs. This suggests that, similar to the North-Eastern plain, the process of glacier melting by contact with PDCs during the eruption was somehow more widespread or more efficient than in the Sindipamba and Victor Punina plains to the north. Five deep and wide drainages channelized the flows descending the eastern higher flank of Cotopaxi, which eventually coalesced and flooded nearly the whole Eastern plain, before diverting most of the released volume into the Rio Gualpaloma which are the headwaters of Rio Pita (
Figure 14). In the southernmost Eastern plain, a part of the primary lahar’s discharge indeed flowed into the Rio Tamboyacu drainage, which runs towards the Amazonian basin (
Figure 1 and
Figure 14). No evidence of PDC deposits belonging to the 1877 eruption were identified in this plain.
5. Discussion
5.1. Level of Detail and Inference during Contact Cartography
The present work has been an attempt to produce a detailed geological mapping of the primary lahars that occurred in the 26 June 1877 eruption of the Cotopaxi volcano. This means that the mapped contacts represent the zones where those deposits can currently be found in surface, at 1:5000 scale. However, it is important to recognize the various limitations and constraints of the cartography performed here.
One of the main flaws of the cartography presented here is that it ignores the actual existence of relatively extensive alluvial deposits corresponding to the erosion that has occurred at Cotopaxi since 1877, which partially cover the primary lahar. These alluvial deposits outcrop extensively in the study area, usually displaying light reddish hues and forming either fans or intricate branch systems, with sizes ranging from a few to tens of meters wide. In some places, deposition is actively going on, while in others it seems to be paused or have stopped completely. The identification of these deposits is easy in the field, but may be very challenging in the drone-imagery in the case of the thinner branches. Due to these difficulties, an initial attempt to map these deposits and extract them from the 1877 deposits was abandoned.
It is important to consider that the cartography presented here only partially represents the original deposits. Specially for the case of the primary lahars, the mapped contacts should not be considered as the originally flooded regions, but only the places where enough deposits have remained in place. For lahar flows, it is well known that the inundation extension is always larger than the observable deposits, even if the study area is relatively flat. Additionally, as mentioned above, the post-1877 deposition and erosion have modified the original deposit. Finally, during fieldwork it was evident that the 1877 deposits were always the least vegetated of any specific place, but the amount of vegetation was not constant all around the volcano. Thus, in some places, vegetation can be expected to have completely covered an originally thinner or finer grained lahar deposit.
5.2. Comparison with Previous Works
Though several investigations have been published about the 1877 primary lahars of Cotopaxi, only a few have presented geological maps of the deposits. The earliest of those is the report prepared by Theodore Wolf [
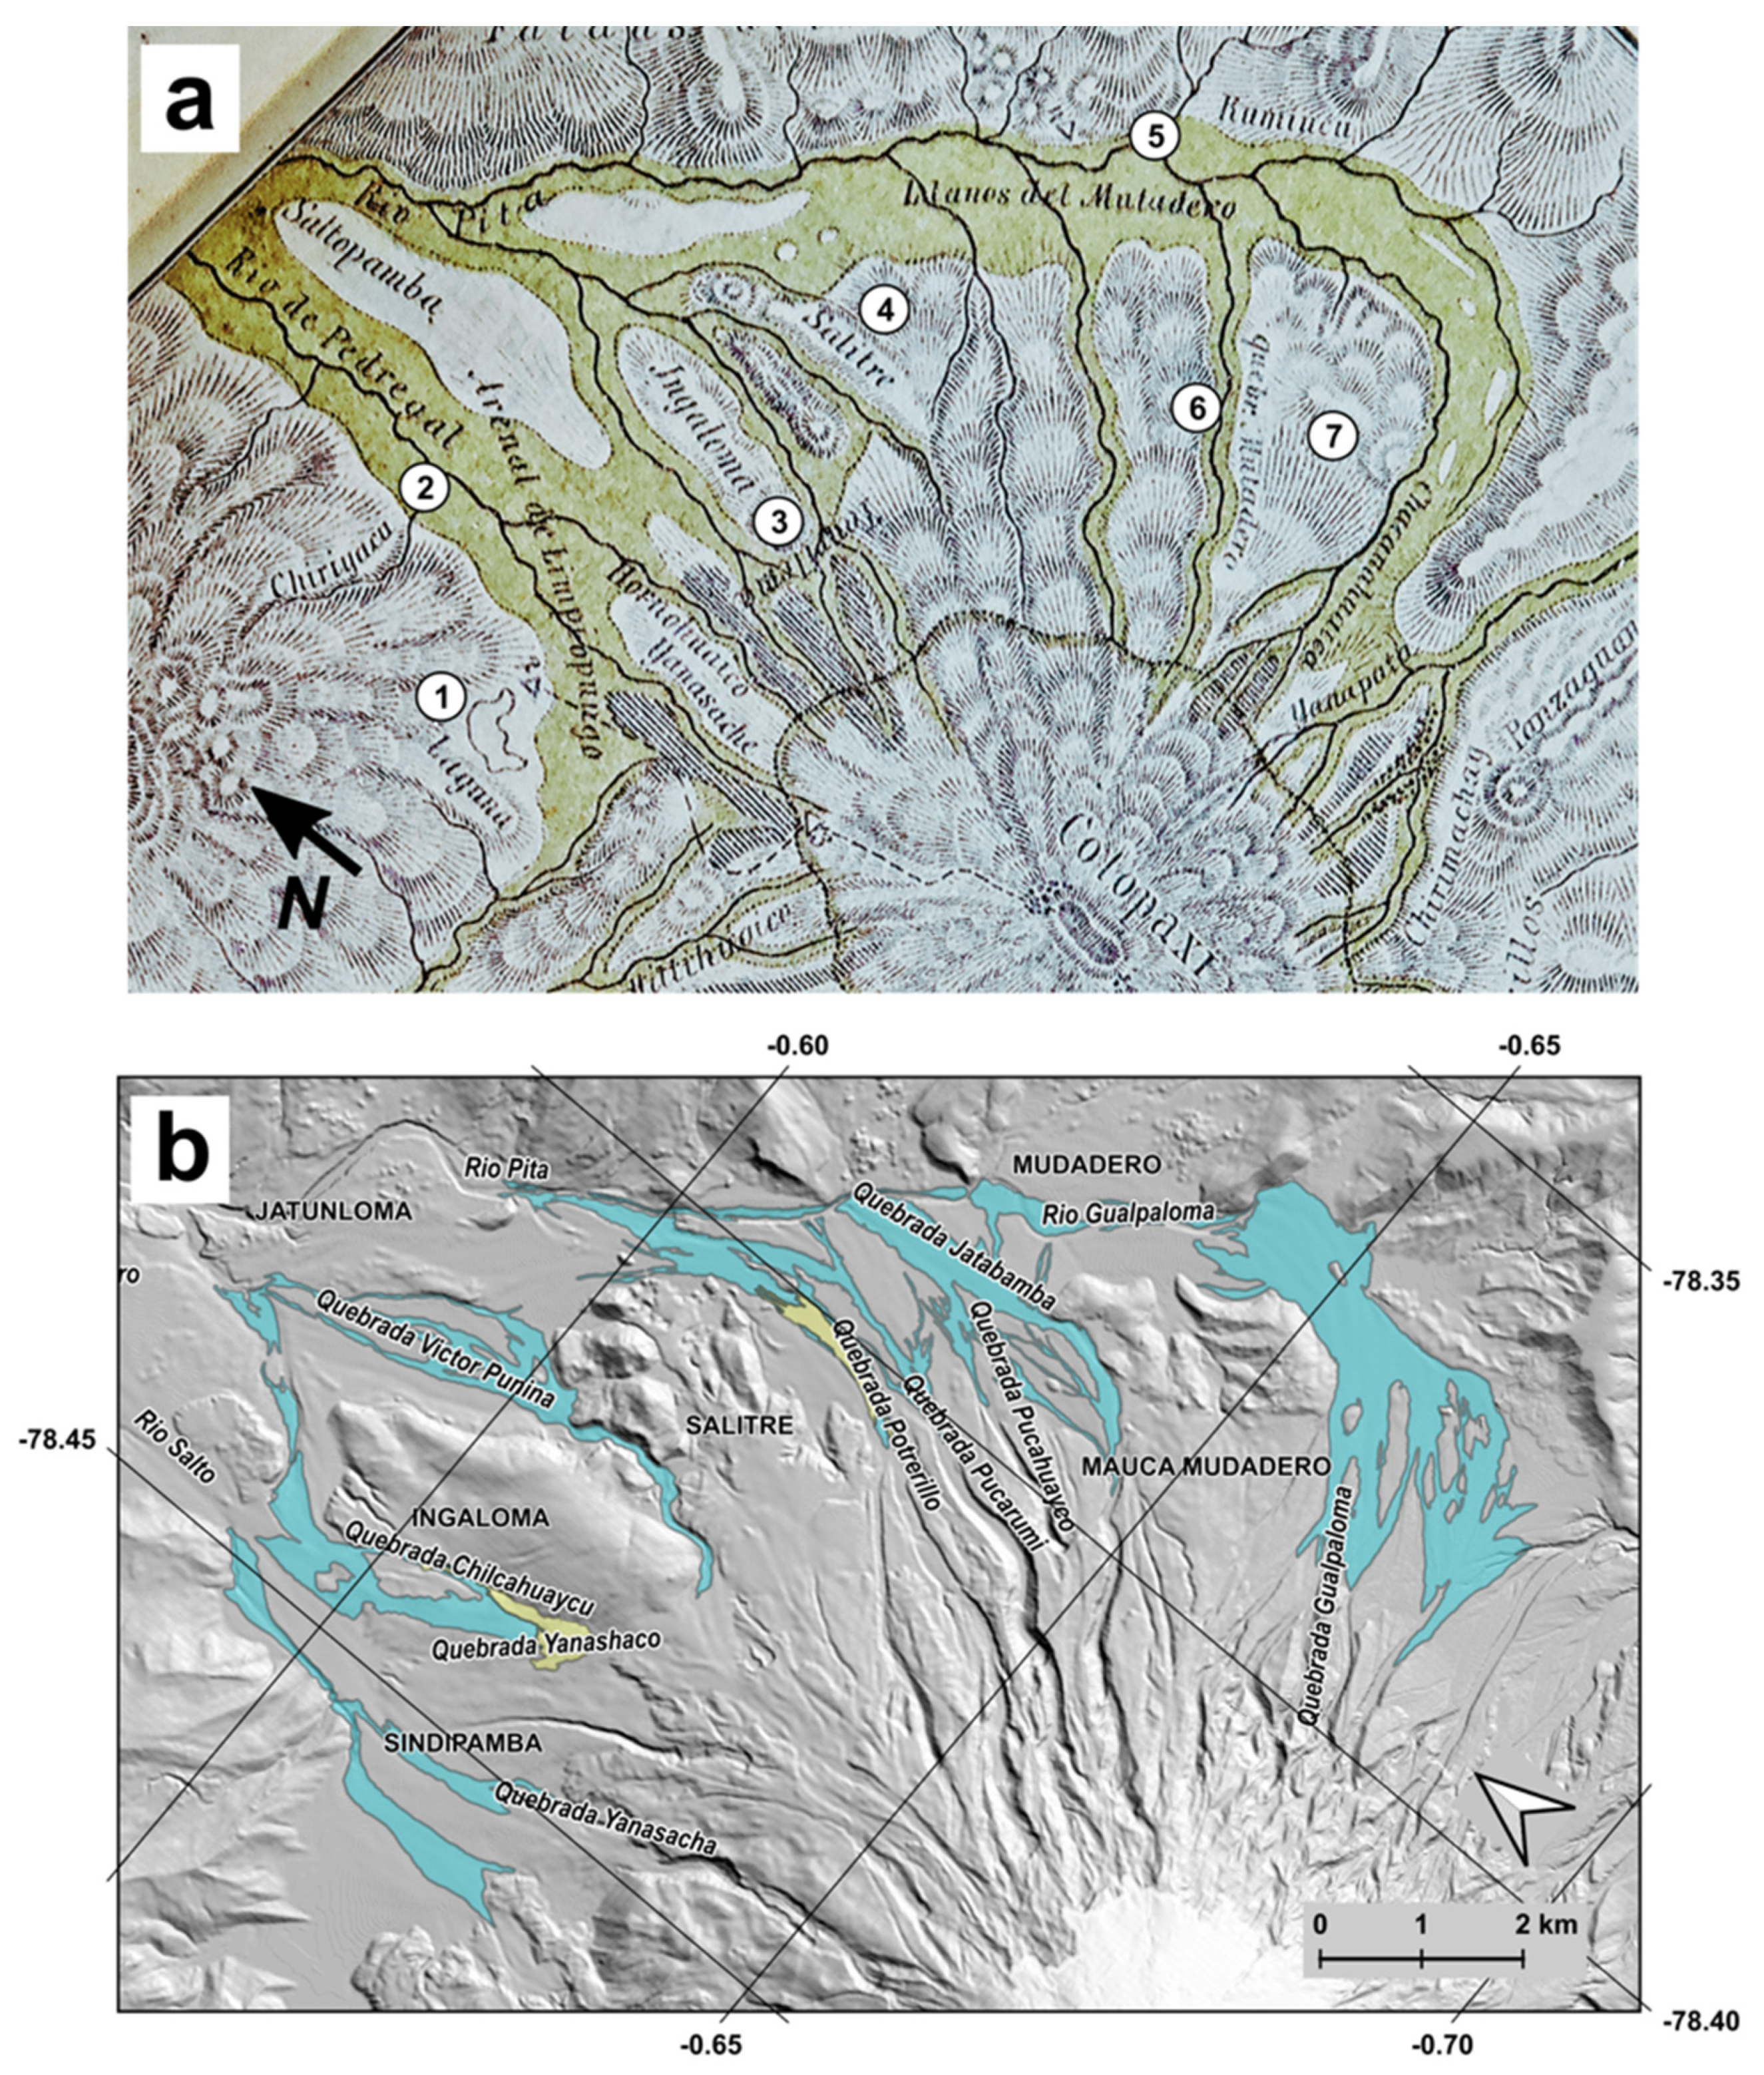
1], who extensively visited the volcano shortly after the eruption, in early September, 1877. This report includes a detailed recount of the events that occurred right before and during the June 26 eruption, a description of the observations he made during the field visit, which included an ascension to the volcano summit, and surprisingly wise interpretations about the eruption and the processes that led to the formation of the primary lahars. A map of Cotopaxi is presented at the end of the report, where the main geomorphologic features of the volcano are displayed together with a cartography of the “water and mud avenues” which is indeed the way the author refers to the primary lahars in the text. The segment of that map covering the proximal northern drainage of Cotopaxi is shown in
Figure 16a, together with the results of the present study in
Figure 16b.
The cartography obtained in the present study is in significant agreement with Wolf’s map, and although several location and drainage names are different, it is still possible to make a direct comparison between both maps. From Limpiopungo lake, eastwards until Ingaloma, both maps show three main lahar branches joining into the Rio Salto (
Rio de Pedregal in Wolf’s map). Just east of Ingaloma, both maps show the Victor Punina drainage and plain, but Wolf’s map includes an additional lahar branch at Salitre where the present study could not find deposit evidence. East and South from Salitre, Wolf’s map shows the whole North-eastern plain as covered by lahar deposits descending from only two drainages, the southernmost corresponding to the Quebrada Jatabamba (
Quebrada Mutadero in Wolf’s map) and the other most probably to Pucarumi. Interestingly, Wolf’s map shows an unnamed drainage equivalent to Quebrada Potrerillo as not channeling the 1877 deposits, although most modern studies coincide to show primary lahar and/or PDC in that drainage [
6,
17,
20,
48]. Finally, south and east from Mauca Mudadero, Wolf’s map shows a fully flooded valley corresponding to the Eastern plain in the present study.
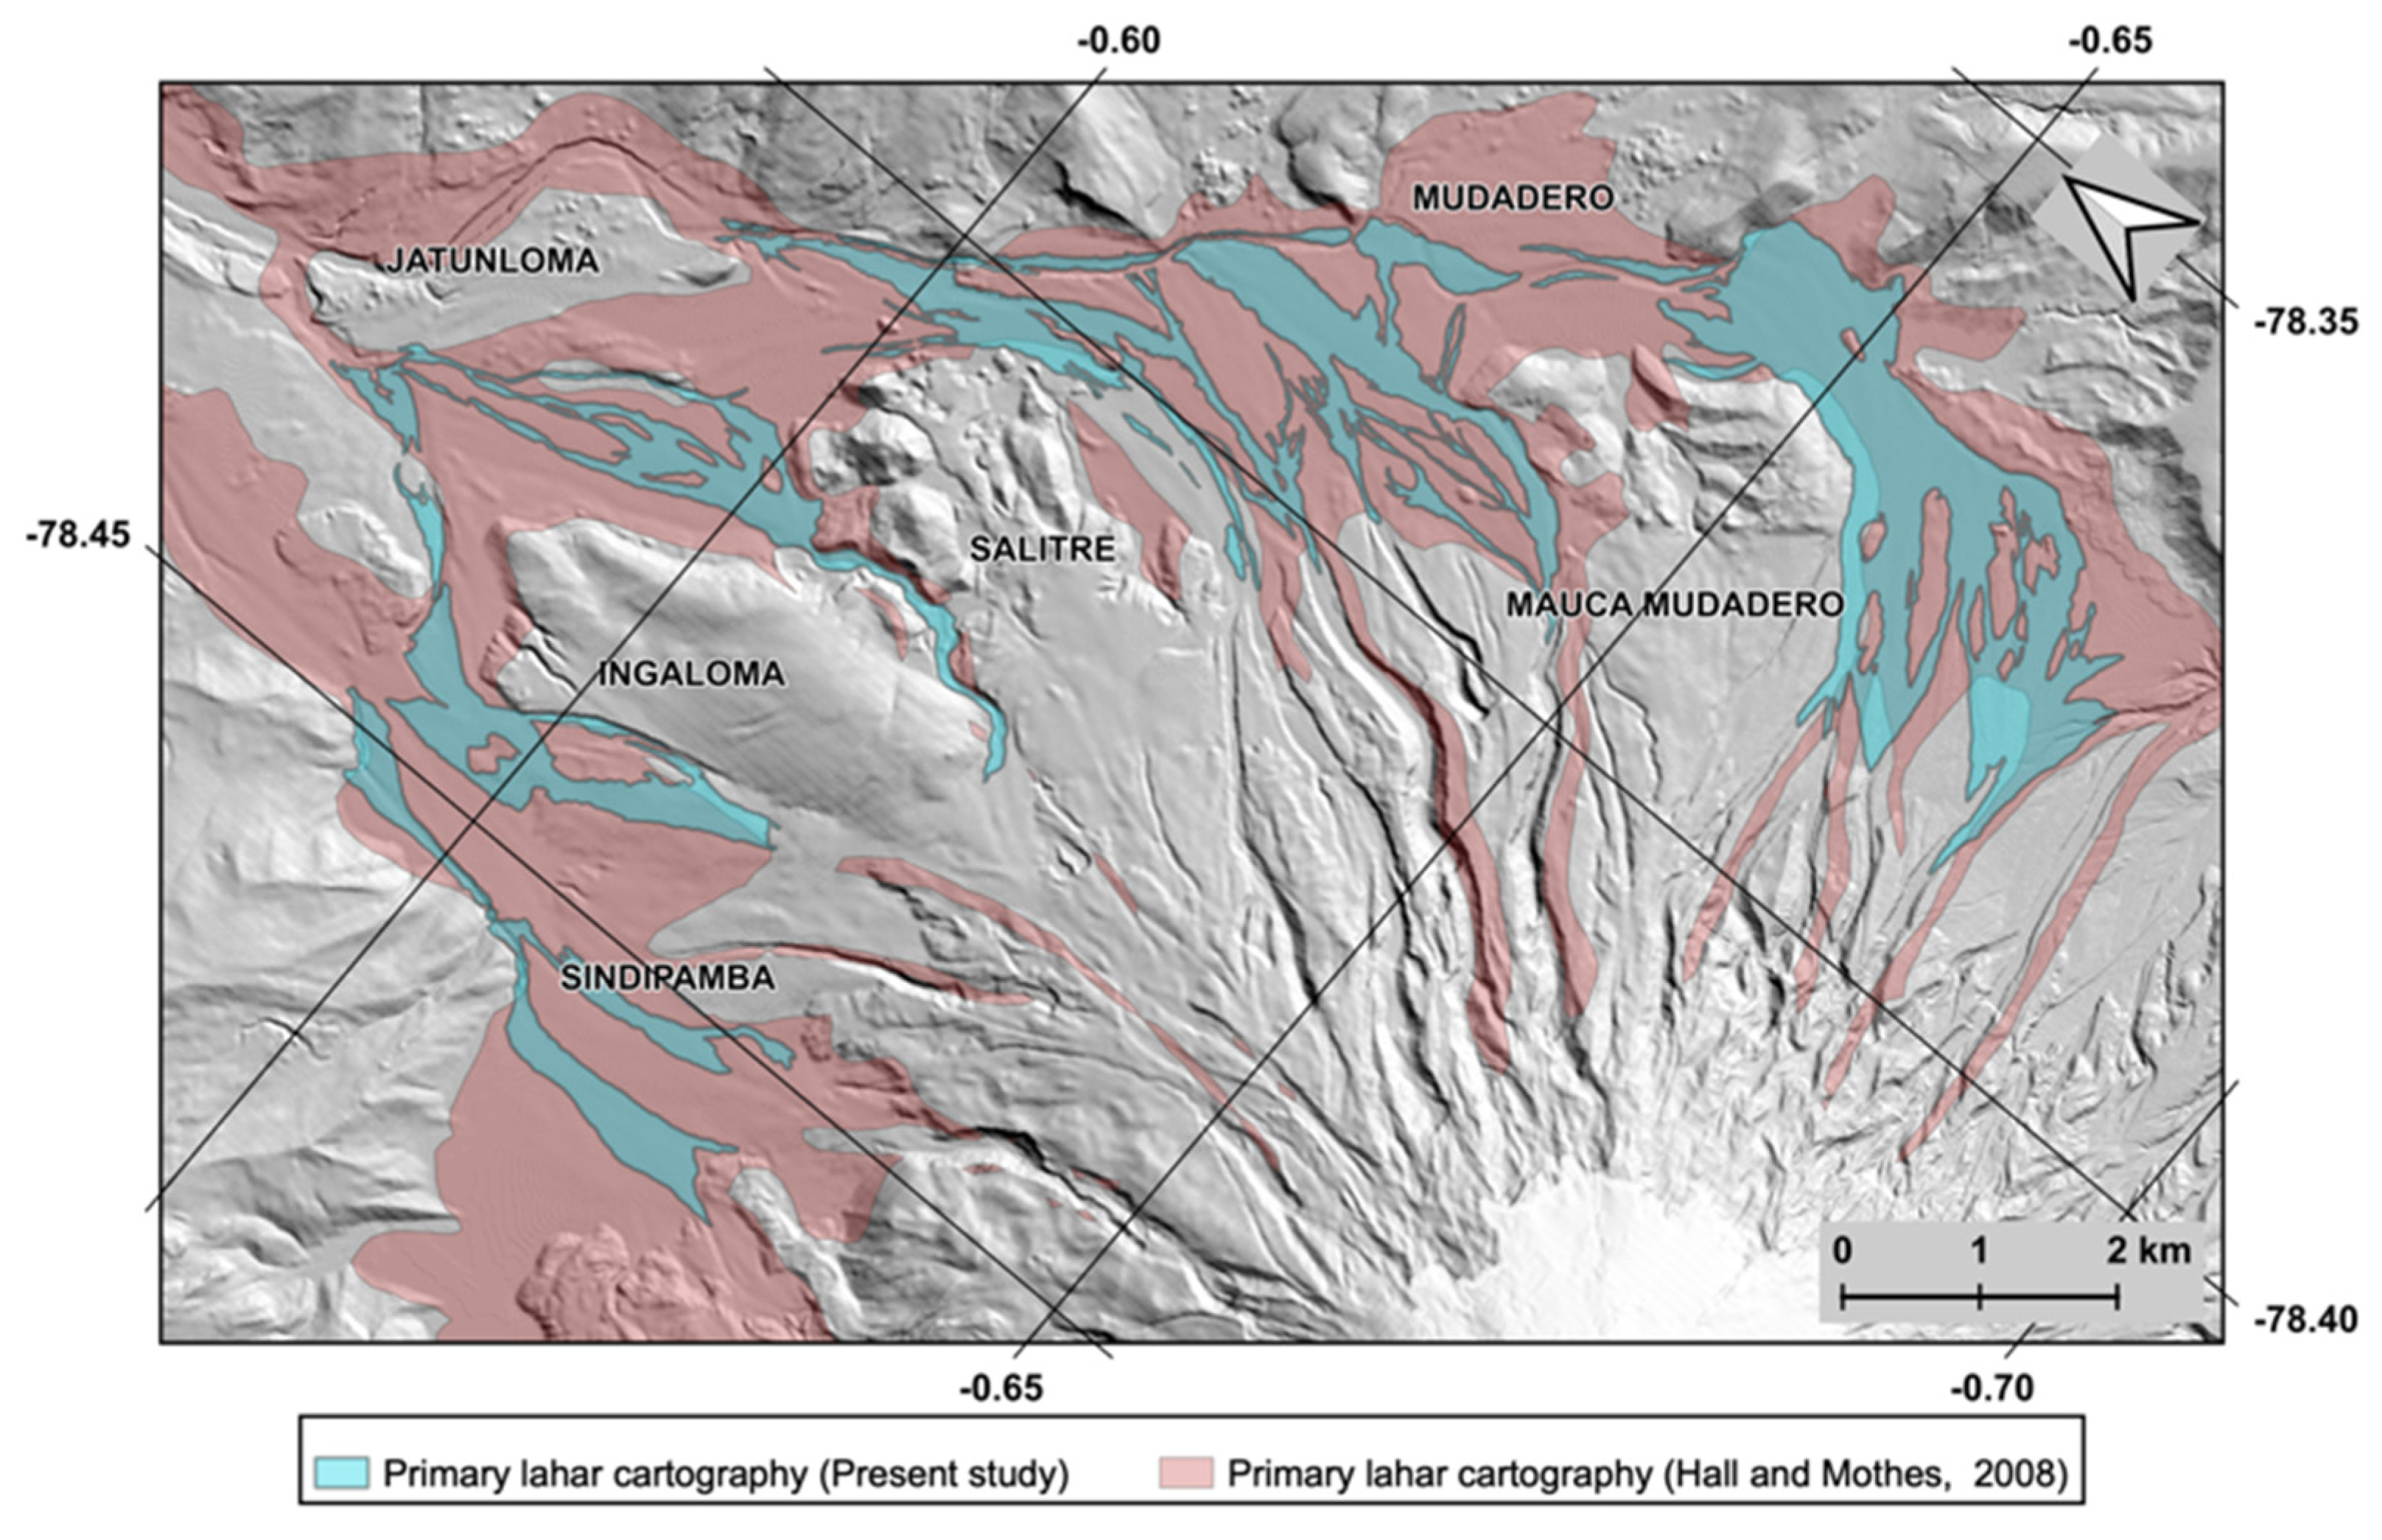
A more recent cartographic effort has been performed by Hall and Mothes [
20]. This survey was performed at a 1:50,000 scale, covering the whole volcano spatially and stratigraphically, and displays a map of the 1877 deposits.
Figure 17 shows an overlying of the lahar deposits in that map with the results here, only for the purpose to highlight the level of improvement achieved. Indeed, it is difficult to compare both maps, given the differences in scale and base information used to obtain each one; i.e., it can be noticed that the topographic base used by Hall and Mothes [
20] does not match the one available for the present study.
Finally, Pistolesi et al. [
17] present a detailed geological map coincident with the area of the present study, based on an extensive stratigraphic study of the Cotopaxi primary lahars that have occurred during the last eight centuries. Unfortunately, the cartographical data (geospatial layers) are not available from the paper publisher, and a digitalization of the published map was unpractical due to the figure size and the lack of a coordinates grid in the map. Nonetheless, significant coincidences and differences may be highlighted with respect to the present results.
In general, the Pistolesi et al. [
17] map displays the 1877 deposits outcropping in all the same four plains as the results here. The contacts mapped in the Sindipamba and Victor Punina plain seem generally coincident in distribution and size with respect to
Figure 8 and
Figure 10, although the lahar branch of the Quebrada Chilcahuaycu is lacking in the former. However, clear differences arise in the North-eastern and Eastern plains. In both cases, the 1877 outcrops mapped by Pistolesi et al. [
17] appear in much smaller zones with respect to
Figure 12 and
Figure 14. In the North-eastern zone, only the PDC deposits at Quebrada Poterillo and a very small primary lahar branch of the Quebrada Jatabamba are mapped, while in the Eastern plain only the western half of the valley appears to contain the 1877 primary lahar deposits. This lack of deposits in the North-eastern and Eastern plains in the Pistolesi et al. [
17] map, and is also in contradiction with the direct observations made by Wolf shortly after the eruption (
Figure 16a).
The Pistolesi et al. map also shows that all the plains are largely covered by deposits belonging to older Cotopaxi eruptions. This agrees with observations made in the present study even if the cartography is not coincident. Older deposits could be observed both in the field and in the drone-NDVI imagery, some of them with apparent lateral extensions suggesting much larger volumes than the 1877 deposit, especially in the Sindipamba, Victor Punina and North-eastern plains. A detailed cartography of those deposits using the drone-NDVI imagery could also be possible if specific facies criteria were available to constrain them in the field, i.e., the case of the fragile cauliflower-shaped black-bombs present in the 1877 deposits.
5.3. Future Lahar Hazard Assessment and Modelling
The main findings of the present study should be taken into account when lahar hazard at Cotopaxi is re-assessed with improved numerical models in the future. Two of the most recent and developed numerical approaches tested for lahar hazard assessment at Cotopaxi are based on: the numerical solution of fluid-dynamics partial differential equations that represent lahars by a Voellmy-Salm reology (RAMMS software) [
29]; and, the use of a multicomponent Cellular Automata of semiempirical models of surface flows (LLUMPIY model) [
30]. Both are 3D models capable of simulating phenomena such as erosion and deposition of the moving flow, as well as providing fundamental quantitative information (i.e., for further risk assessment) such as basal, lateral and impact pressure, or flow height and average velocity at any point of a high-resolution drainage topography. In those studies, RAMMS and LLUMPIY have produced simulations starting in the higher Cotopaxi flanks, with the latter being even capable of simulating contrasting rates of water release from the glacier during the eruption. Finally, and as usual, in both studies the models were calibrated using geological information related to the 1877 eruption and primary lahars.
Thus, in the simplest approach, the results of the present study could be useful to improve the calibration of new generation models such as RAMMS or LLUMPIY [
29,
30]. This means that the adjustment of parameters governing any 1877 model should be such that the produced simulations are at least somewhat similar to the cartography presented here, considering that the current day topography might be significantly different from that prior to 1877 and, as already discussed, the cartography presented here only represents the current day lithic deposit left since the original event. In this comparative approach, the calibration simulations produced by RAMMS [
29] seem closer to the results obtained here, although they ignore a significant part of the flows that descended the Eastern plain, which certainly has an impact on the final results.
Conversely, the 1877 calibration simulations obtained with LLUMPIY [
30] are significantly different from the cartography of this study. One of the main reasons for such differences may be related to another finding highlighted here. The present survey has shown that the 1877 primary lahar deposits observed in the Sindipamba and Victor Punina plains were clearly depleted in the 1877-specific black bombs and were, in general, smaller in size with respect to those observed in the North-Eastern and Eastern plains. This suggests that important differences existed between the PDCs that melted the glacier in the North flank with respect to those in the East flank of Cotopaxi. Such differences are explained by the topography of the summit crater, whose northern rim is ~120 m higher than its eastern rim, which produced that only the more diluted bomb-depleted PDCs descended northwards, while the denser bomb-rich PDCs descended towards the East. However, one of the main assumptions made in [
30] during LLUMPIY calibrations, is that PDCs (and consequently primary lahars) are evenly distributed all around the crater rim, which ultimately produces the differences between the calibration simulations and the cartography obtained here.
6. Conclusions
A detailed (1:5000 scale) geological cartography has been performed for the deposits belonging to primary lahars occurred at Cotopaxi volcano on 26 June 1877, as observed in the Sindipamba, Victor Punina, North-Eastern and Eastern plains, which compose the northern proximal drainage. The final cartography was possible through a combination of geological fieldwork with the analysis and interpretation of high-definition imagery obtained by drone surveys. During fieldwork, contacts and outcrops of the 1877 deposits were recorded in locations where a very specific cauliflower-shaped black bomb was identified. On the other hand, the drone imagery included near-infrared, red and green bands, which allowed obtaining 25 cm/pixel NDVI imagery with the help of SfM procedure, covering a total surface of 28.4 km2, where the 1877 deposits were identified and cartographed at 1:5000 scale. Additionally, Google Earth imagery was used in some regions where the drone surveys could not be performed.
From those data, a total of 210.63 km length of contacts was drawn for the 1877 deposits, from which 136.84 km were obtained from the drone-NDVI imagery, 37.02 km from the Google Earth imagery, 10.64 km were GPS field tracks and 26.13 km were classed as inferred. The results show that the primary lahars that occurred in the Sindipamba and Victor Punina plains were clearly depleted in the specific 1877 black bomb and smaller in size with respect to those that flooded the North-Eastern and Eastern plains. This suggests that significant differences existed between the PDCs that melted the glacier in the North flank with respect to the East flank, during the formation of primary lahars which, in turn, might be a consequence of Cotopaxi’s summit crater topography.
The obtained cartography is in general agreement with respect to previous studies, but it represents a significant advance in the level of detail achieved and in the methodological approach, which can be applied in other volcanic areas. However, it is important to mention that the cartography represents the currently identifiable outcrops, which are expected to be different from the originally flooded areas, due to the action of erosion/deposition processes and vegetation development that have occurred at Cotopaxi since 1877.
Finally, next generation lahar hazard assessments at Cotopaxi volcano might benefit from the results from this study. Specifically, the calibration of developed numerical models could be improved by either comparative approaches to the cartography presented here, or by the new insight obtained with respect to the 1877 eruption.


 ,
, 


