1. Introduction
Earth Observation (EO) data based on information received from remote sensing (RS) satellites provide an excellent opportunity to better understand the blue planet on which we live. Such data make a linear and non-linear analysis possible to monitor the global environmental changes using predictive models [
1] and provide information products that can inform the social decision and policy making by governments of human society services [
2]. RS satellite data becomes essential when examining global, regional and national issues, especially when addressing various issues, such as technical, economic and social issues of a large scale [
3]. There are plenty of EO sources and coordination between social and governments’ stakeholders in examining issues that are addressed on a regional to a global scale. Given the magnitude of the Earth Observation Networks (EONs) issue at hand, this collaboration requires cross-border collaboration and updated data and knowledge transfer.
EO data received based on RS satellites play a more prominent role than other data types in international cooperation. Such data can potentially be used in various applications, including energy, environment [
4] and the marine protection sector [
5]. This data can facilitate identifying parameters by researchers/analysts to address a specific or general issue of the issue status or the data process over the long or/to short-term. EO data can be used to successfully evaluate applied solutions. This can help human societies generate environmental health and safety warnings and respond to various Earth issues, such as natural disasters [
6]. EO data based on RS satellite information have dramatically reduced the time and manpower required to perform manual feasibility studies. EONs provide an excellent opportunity to deliver the required derivative marine information by increasing environmental parameter estimates and a combined accuracy assessment using geographic and demographic data [
7]. Spatial planning information that can fulfil the parameters required by marine studies collected and the collection of spatial planning information have been facilitated by the analysis of free data (open-source and unlimited policy) obtained through an analysis of land and ocean observation tools [
8,
9].
The use of EO platforms has led to a wide range of regional and global efforts by (developed and developing) countries to help them reach their potential in various sectors [
9], such as renewable energies [
10]. Given the different regulatory frameworks in many countries of various environmental, social, economic and health fields, the EO platform’s success is understandable. They can lead to a clear view of the region’s capabilities and notion in question, which is the first factor in attracting an internal and external investment. This interactive EO platform’s data collection mechanism between stakeholders can take many forms in which people can influence and search the decision-making process as local and regional actors. This mechanism can contribute to a sense of ownership in the project process and increase the public confidence in meeting the new public and academic end-users’ approaches [
3].
EO tools can demonstrate public awareness of opportunities, which means that these tools can facilitate public awareness by allowing a graphical visualisation of complex data. EO tools of the EO platforms can increase a society’s knowledge about its living environment and reduce general resistance to the new projects and technology due to the lack of knowledge. In addition, EO platforms’ increasing of society’s knowledge level can increase the opportunity for work and research for end-users. Furthermore, the products presented can affect future satellite missions with a better understanding of what users’ needs are for the future [
11]. This causes a deeper understanding of society’s need to design new satellites, potentially strengthening the relationship between the scientific community and end-users.
High-resolution mapping can provide vital information to address the different aspects of problems relating to the sea and oceans, especially in areas where terrestrial data is inaccessible or scattered. EO platforms combine and compare based on satellite and in-situ data can provide a time series (long- to short-term) with high-resolution maps on the marine project potential analysis or the network infrastructure expansion using ground observation data sources. Furthermore, providing high-resolution data with valuable information to identify forgotten gaps provides an ideal solution for expanding knowledge of sea and ocean areas [
12].
There are currently a limited number of real-world online applications using EO satellite RS data in developing countries. Online web observation programs with local and national stakeholders that assess the local and regional source’s potential of different geographical areas can help develop many of the specific features of the focused areas with a minimal risk of upgrading existing infrastructure [
13]. For the implementation of marine projects to be successful in developed countries, experience has shown that online web surveillance programs developed by governments (with all private and public stakeholders) can play a crucial role in advancing and positioning various projects. The utility/success of these online surveillance programs can be enhanced by increased joint decision-making, community participation, public education and counselling and increased trust between stakeholders, provided the participation process is fair, for example, by the use of questionnaires and surveys [
14].
Gaining public trust is an essential factor in the acceptance of a project by the community, especially in the case of projects involving new technology in maritime and tourist areas. EO online programs can facilitate the sharing of knowledge and experience between policymakers, researchers, developers and the public. This can significantly reduce many societies’ pessimism about national governments in informing infrastructure information by employing part of the community manpower as end-users. Community participation in EO online program projects first requires free access to the internet [
15]. On the other hand, presenting end products that can be seen freely, such as maps, atlases and a product category that is bigger than ‘products’ that includes both ‘maps’ and ‘how they are analysed’ can encourage learning through public participation and the scientific advancement of society [
16,
17]. In this regard, the lack of specialised knowledge by specific development departments can be a problem. The transfer of academic researchers during the project can be a solution to overcome the lack of specialised knowledge problem by cooperation and knowledge.
This information can significantly help a wide range of public and private end-users to gain a better understanding and inform decision-making in universities, companies and governments, for example, in the development of renewable technologies, aquaculture, commercial and tourist shipping, oil and gas and related pollutants, tourist activities, maritime surveillance in large and small areas and sustainable environmental development. Such core services that depend on operational numerical data can be seen as resulting from the growing demand of developing countries and the central policies of the European Union (EU) for sustainability and the creation of new job opportunities in various maritime sectors [
18].
In the first stage, preparing and presenting data and products to the end-users requires common and standard data transfer formats that are compatible with other formats and standards. Several initiatives have been considered in European countries to manage and present marine data [
19]. Most of these data and products presented under the EuroGOOS [
20] umbrella are standardised. EuroGOOS is a network committed to developing and enhancing the operational oceanographic capacity of European countries using a global intergovernmental system framework for the Global Ocean Observing System (GOOS) [
21,
22]. In addition, many widespread needs have been largely met by the ongoing development of Copernicus, SeaDataNet [
23] and other EU initiatives. Given the above, supporting decision-making and opening up new economic opportunities in Europe’s maritime sectors is in the interest of European citizens and the international community, which is possible by improving the quantity, quality and access to maritime information.
In this regard, GOOS provides easy and fast access to data through standardised public end-user tools. Furthermore, this means “easy and fast” and direct marine data in the offshore sector without worrying about the data processing quality. Strong and serious steps must also be taken to combine in-situ observational data with other information (such as satellite imagery or model outputs) to extract new products, build new services or make better and more complete information decisions available to different segments of society [
9,
24].
In this regard, EuroGOOS has increased its efforts to reduce costs and time by managing ocean data and the inter-agency exchange process. This effort can improve the quality and reduce the spatial information cost of oceanographic data available to the public. In addition, it can help build crucial and constructive partnerships to increase access to oceanographic data. The EuroGOOS data management system intends to fully meet the needs of European countries by enforcing standards and respecting the structure of participating organisations and shareholders [
25].
In this regard, the main goal of the ODYSSEA (Operating a Network of Integrated Observatory Systems in the Mediterranean Sea) project can be considered to help improve the availability of data and standard products throughout the Mediterranean basin. The ODYSSEA project ensures that the data of various in-situ and on-site network observations and forecasting models are readily available and usable to end-users. The strategy is to move towards an integrated data system that coordinates the workflow, data processing and distribution of data across in-situ observation network systems. Existing international combinations are used and in-situ observations in European international data infrastructures [
26]. Providing and preparing an integrated targeted system deals with the data and product management challenges, which must be prepared to estimate its primary goal of providing efficient and reliable data services to end-users. This preparation can include quality control over heterogeneous and real-time data, standardised metadata for efficient data exchange with other centres and end-users, networks and data management systems that must be usable in an integrated collaboration [
26].
In this case, the following six steps have been used to develop a better understanding of the essential data structure that is commensurate with the efficiency of the end-user’s service: (1) steps and challenges of collecting different data, (2) stakeholder engagement to identify, detect and assess the specific needs of end-users, (3) design, develop and launch the products offered to meet the specific needs of users, (4) achieve sustainable development in the continuous provision of these products to end-users, (5) identify future needs and challenges, and (6) online platform architecture style related to providing these products to end-users. Then, the innovation of the ODYSSEA (Operating a Network of Integrated Observatory Systems in the Mediterranean Sea) platform project has been evaluated and reviewed as a successful project on marine online platforms to better understand how marine online platforms are being used, designed, developed and launched. The project aims to develop a fully integrated and cost-effective cross-platform, multi-platform network of observation and forecasting systems across the Mediterranean Sea. This paper is organised as follows:
Section 2 explains the integrated methodology of the end-user services,
Section 3 describes the ODYSSEA project results,
Section 4 describes the discussion of our paper and, finally,
Section 5 presents research conclusions.
2. Integrated Methodology of the End-User Services
The main purpose of creating online platforms can be considered as a tool to manage supply and demand among users and achieve social goals for the use of maritime space, which can help increase the decision-making power and knowledge of the marine environment in the shortest possible time and cost by providing an environment [
27].
These six steps can enhance marine product information services, increasing the volume of available knowledge to decision-makers. This provision of information may significantly improve decision-making concerning planning and operation in marine areas, coastal environments, maritime safety and climate forecasts, all due to increasing productivity.
2.1. Steps and Challenges in Collecting Data
Government agencies, service providers and marine research centres need to work together to provide accurate management for all sectors [
28]. The level of human knowledge concerning the seas depends on access to various research and government departments. The marine activities support, plan, and manage data provided by so-called service communities, such as research and active communities in the ocean and oceanographic centres [
29]. These centres can provide users with a wide range of different parameters needed to understand the seas and oceans to better understand and predict their behaviour in the future.
Government and international centres should support decisions based on ocean and sea observations to achieve a comprehensive set of physical, chemical and biological factors related to these areas through in-situ data and EO-based satellite RS technologies [
30,
31]. The end products of the information provided by these observations can effectively predict the oceans and their related services to generate effective knowledge of management and policy decisions. In addition, relevant information and decision support tools are critical to the sustainable management of oceans and seas and the sustainable development of the water economy. However, significant technological advances (including spatial and temporal advances) have created complex datasets, exacerbating data transfer issues. Furthermore, depending on the technical knowledge user’s level, analysing raw data for practical applications can be difficult and time-consuming, even though many data sources relating to the oceans and seas are displayed as images, maps and atlases.
The marine and oceanic observations chain can be divided into three parts: EO-based satellite monitoring [
32,
33], data management [
17], big data [
34] and data use. The new EO-based satellite missions are made by creating cost-effective observations that fit the macro and micro goals, such as observing climate change in all regions of the earth [
35]. These observations are very effective in covering large marine areas and gathering information about forgotten and gap areas. Furthermore, a set of data that includes RS satellite data and local geographic data can provide a good opportunity for stakeholders with different study objectives to analyse and model environmental sources, such as renewable energy sources assessment and monitoring [
3].
The output of this information can be in the map and atlas forms, and numerically simulated results from different regions can bring the end-user closer to a realistic visualisation and being on time about the conditions under consideration. These products include identifying the data needed to address one or more issues simultaneously, monitoring the status of different issues or reviewing data trends over a short or long time and evaluating the success of applied solutions by considering all parameters. These can help end-users make informed decisions to find the information they need for different purposes [
3]. Most of the input data in marine online platforms are satellite data and reanalysis datasets. Satellite data combined with terrestrial data and regionally designed models provide a unique opportunity to enhance the efficiency of online platforms.
One of the EON data management tasks can be considered to provide end-users products that can be welcomed for users’ global and regional data access. The ultimate goal of the EON platforms is to create a sustainable, integrated and cost-effective observation system that can be used for a variety of climatic, commercial and environmental applications. These marine platforms can use observations made by other departments to provide essential information about gaps and forgotten areas. Some of these gaps involve a lack of real (near)-time data, geographical coverage, modern tools and sensors, such as SOnic Detection And Ranging (SODAR) and Light Detection and Ranging (LIDAR), a lack of accurate monitoring of parameters (such as waves and sediment transport), data homogenisation and management [
36].
The EON marine platforms approach makes it easier for providers to identify which existing sampling designs and technologies can be used. It is consistent with the intended purpose if new studies are conducted to save time and reduce the strategic error of projects [
37]. Additionally, the marine platforms approach will provide a low-cost solution to fill information gaps. This becomes even more understandable when we know that there are still many gaps that the integrated operating service needs to close. It should be noted that most research observations are not close to real-time.
2.2. Stakeholder Engagement to the Specific Needs of End-Users
In recent years, new technologies have emerged to monitor, model, observe and predict oceans and seas at regional and local scales [
38]. These new technologies are at the heart of an integrated monitoring and forecasting system designed to understand oceanographic platforms better [
39]. Regional efforts to gain political support for managing and conserving the oceans and seas are significant. This is even though the government’s capacity in oceanic and marine sciences is limited to regional and national oceanographic centres, which are almost exclusively available at the regional level [
40]. Improving oceanographic conditions requires scientific capacity, analytical capacity and sustainable management. It improves oceanographic conditions for warning systems [
41], sea-level rise monitoring [
42], adaptation planning and smart climate development [
43].
Given political support for the management and conservation of oceans and seas, the user’s feedback can lead to better management of platforms and change the use of the datasets [
40]. Oceanographic platforms provide an interactive website for visualising and accessing historical, real-time and forecasting data through the integration of user-friendly platforms [
44]. In this regard, marine platforms’ continuous cooperation with regional educational institutions is essential for discovering and developing basic parameters. These collaborations can increase users’ knowledge through online courses and workshops to provide training portals and accessibility [
40]. RS satellite technology has revolutionised oceanographic observations with the appropriate high-resolution data and imagery and provides real-time information to different target users with large ocean datasets of various parameters, which was previously impossible.
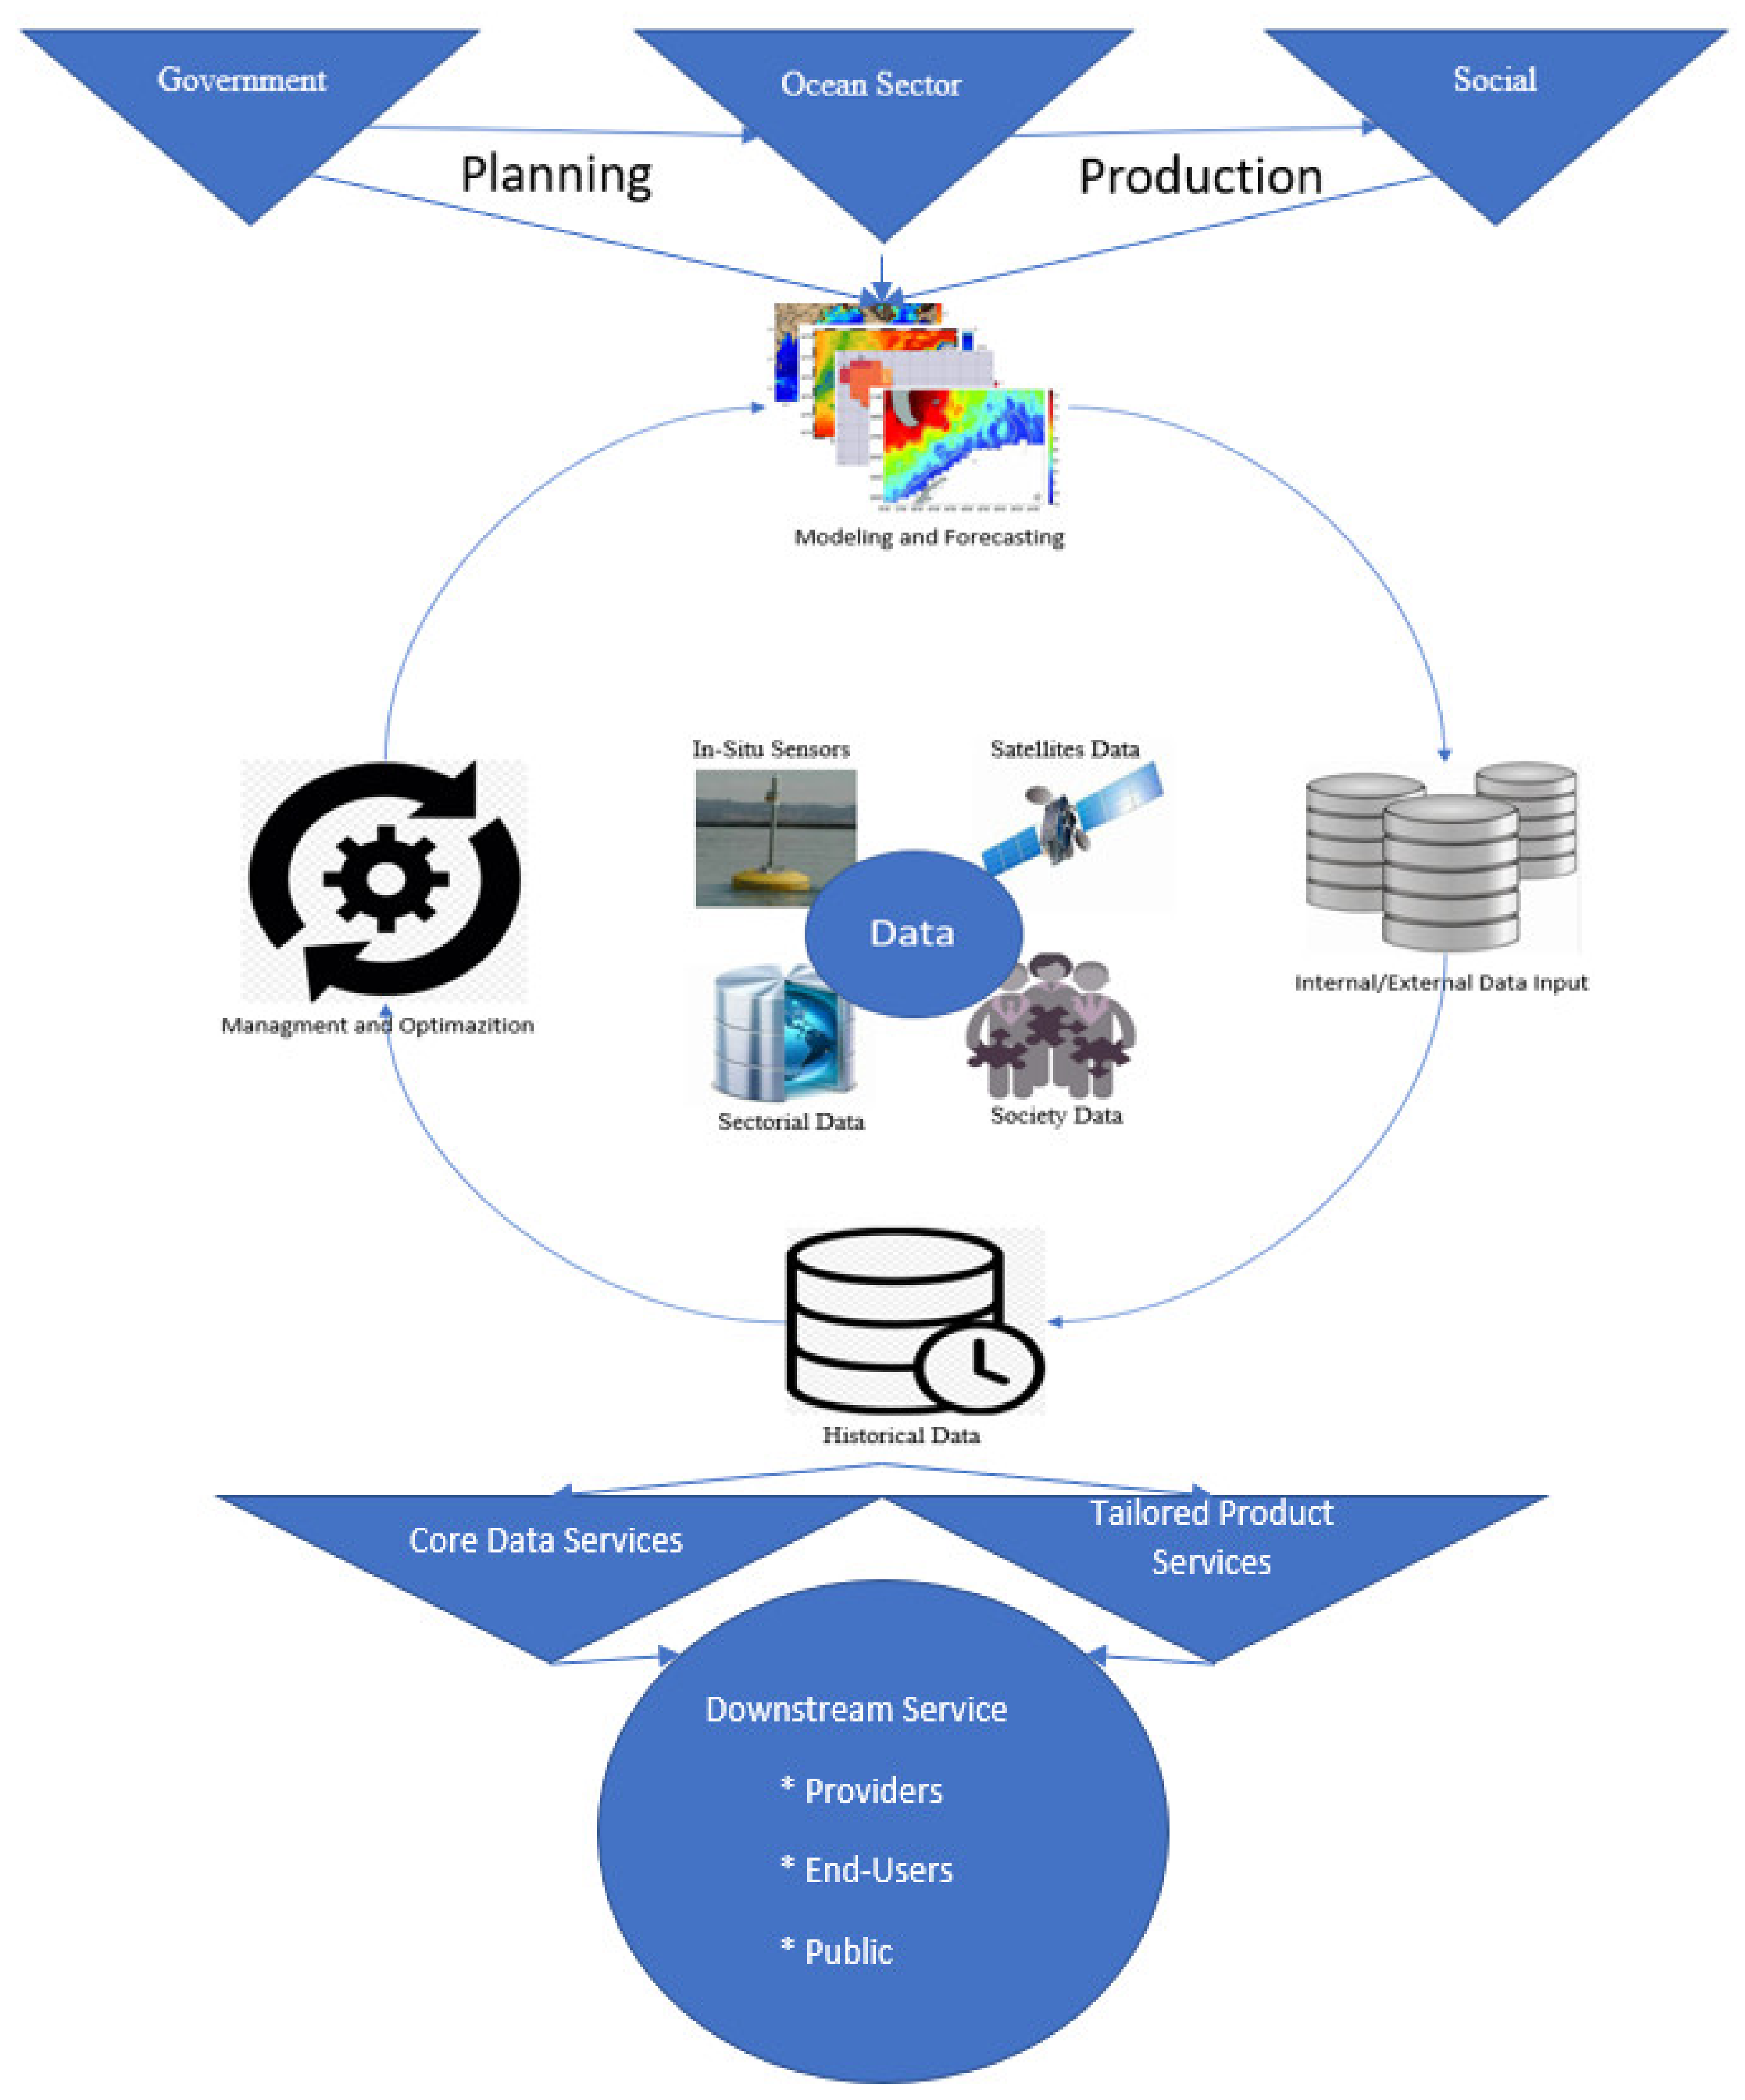
Figure 1 shows a schematic diagram of the value chain of maritime services. This diagram shows a schematic flow and the importance of different government and maritime sectors and their close cooperation to collect data to provide better services to different communities.
In this context, it is essential for the purposeful use of RS satellite data to achieve knowledge transfer and interdisciplinary understanding. An international standard for improving RS satellite data sharing can easily be upgraded and share providers’ diverse set of data. The human capacity to interpret and analyse existing information from these systems to facilitate the conversion of data into information, information into knowledge and knowledge into policy and practice is a fundamental key step for oceanographic observations around the world [
40]. This requires a proper understanding of the various sciences and technological advances and a proper understanding of how science, social science, user-centred design and policymaking can best be integrated.
2.3. Products Offered to Meet the Specific Needs of Users
A deeper understanding of the diversity of the sea and ocean ecosystem and its human impacts and vulnerabilities requires the integration of sea and ocean science and the coordination of a stable system of observations at different scales to cover the whole ocean. RS satellite observations have made valuable data available on a wide range of less studied variables. Satellite data can be considered a huge asset. Today, many scientific communities are working to identify how to make better use of this wealth of multi-platform data that promote the interests of communities.
This can be why many aspects of new satellite data are not recognised by users [
45]. Hence, the major challenge for the next decade is fully integrating multi-platform, multidisciplinary observations with ocean forecasting systems to monitor diversity [
45]. The major challenge is a seasonal and inter-annual variety on a small scale.
In addition, it is challenging to develop products that can meet all the goals of end-users and users’ target groups of final projects. The essential product that can be provided to users by marine and oceanographic platforms is numerical modelling. Numerical modelling plays a key role in operational oceanography, which is designed as a set of products and services to provide practical information on marine and coastal environments to meet the needs of science and communities [
22].
Numerical models are pivotal in improving the performance [
46] and accuracy of the activities re-analysed from a set of in-situ data and close-to (near)-real-time data and ocean condition forecasting. Extensive operational models are based on code and various computer parameters used in different spaces and time scales [
31,
47]. Heterogeneous operational models are currently used in the European maritime and ocean regions, indicating that Europe has a high modelling capacity [
48]. The proposed models have an average spatial resolution of 1 km, but higher spatial resolution models will be valuable for marine studies [
22].
2.4. Achieving Sustainable Development in the Continuous Provision
In the EU, economic activities at sea are summarised in Directorate-General for Maritime Affairs and Fisheries (DG-MARE) [
29]. The sustainability of marine renewable sources helps combat climate change and pollution and reduces human pressures in this area. Government-run centres can ensure of marine ecosystems effectiveness by monitoring industries and companies [
49]. In the EU, policies such as the Marine Strategy Framework Directive (MSFD) and the Marine Spatial Planning Directive (MSPD) have been pursued in recent years. EU member states can use these policies (which are based on ecosystem management) to carry out more sustainable sea and ocean activities [
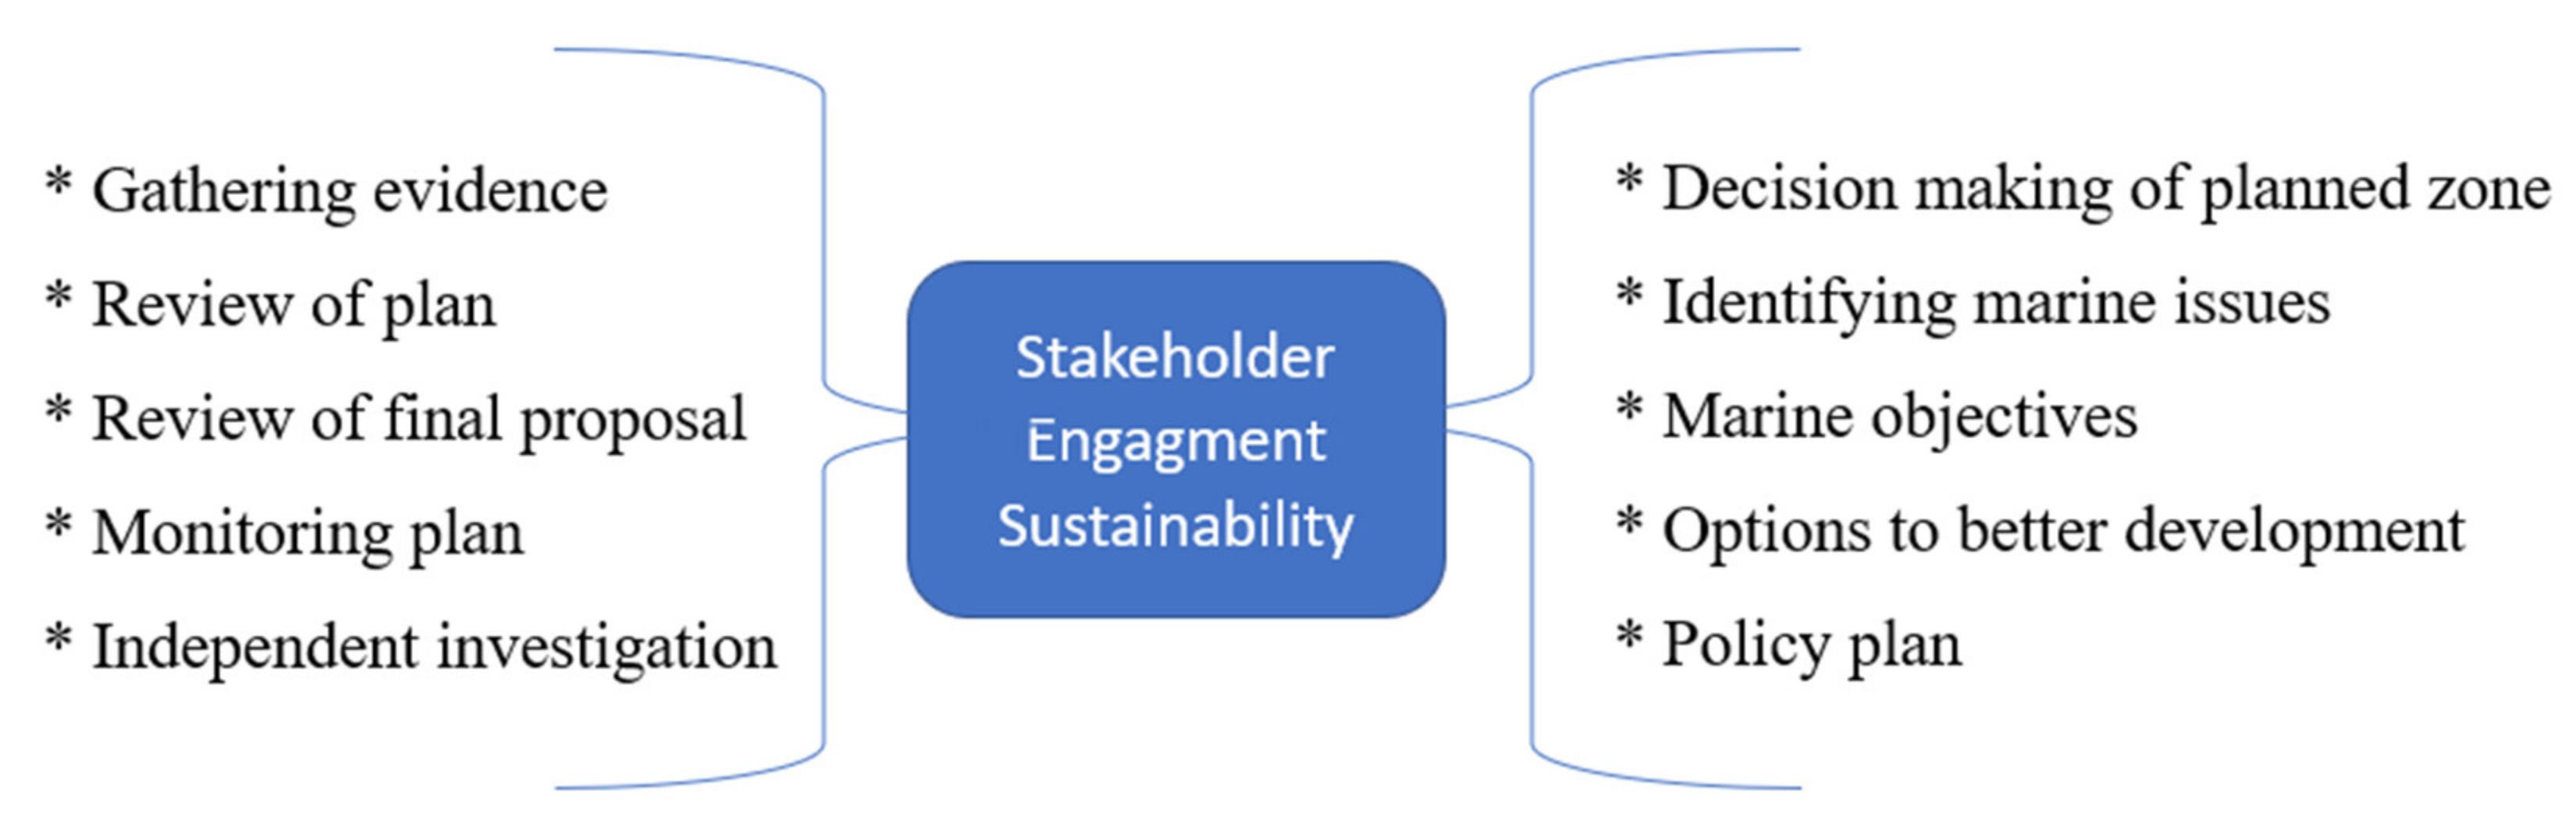
29].
Figure 2 shows a schematic of how a marine program is given according to stakeholder engagement sustainability.
In the EU, significant work has been done to develop community data services at the regional and European levels, such as the Copernicus Environmental Monitoring Services [
31] and the European Marine Observatory Data Network [
50], which was designed, developed and launched by the European Space Agency (ESA). This type of service significantly increases the efficiency of macro decision-making methods for planning and operation in marine areas and weather forecasts. It should be noted that marine data and products tailored to public community data services can be presented by integrating the observations made with accurate modelling tools.
These services are entirely open and free of charge by service providers and government departments. Users of such platforms can access a core data service that provides different types of raw data and an end marine product tailored to the community needs. Some of the maritime data service providers in Europe include Monitoring and Forecasting Centres (MFCs), Thematic Assembly Centres (TACs), In-Situ TACs, the European Marine Observation Data Network (EMODnet), the International Centre for Exploring the Seas (ICES), Pan-European infrastructure for ocean and marine data, national met-ocean agencies and the National Geological Survey and National Fishery Institutes.
2.5. Identify Future Needs and Challenges
Future platforms can play a more critical and active role in linking different research projects to various observational and operational oceanographic decisions. The most important step to improving marine platforms and information can be using high-precision measurements that not everyone looks at with confidence today due to insufficient information collected by gauges in-situ in remote areas and sometimes near the coast. In this regard, calibrating measuring devices is very time-consuming and expensive. Therefore, it is a priority to collect information quickly and at the lowest possible cost while maintaining high accuracy.
An increase in reliable databases can accompany an increase in inaccuracy. Reanalysis datasets designed to evaluate climate models are increasing in number. The factors that increase the number of data reanalysis types can be accurate. It is also worth considering the cost and time savings to compare with the in-situ measurement tools and their use on a regional and global scale in the long- and/or short-term run. Further use of reanalysis datasets can be used in different application infrastructures. The use of this data type and the evolution of new operational models can play an important role in the processes and development of new offshore marine platforms. Increasing the use of such datasets and more detailed studies using updated analysis data can help provide the most advanced measurements of the ocean climate and operational models in different online applications with short and long scales.
2.6. Online Platforms’ Architecture Style
In recent years, the large amount of EO-based satellite data obtained has become a problem for scientists and decision-makers. The large amount of EO-based satellite data challenge plays a key role in making the best use of EO data in environmental risk assessment areas [
51], which can help marine studies to identify large and small areas and establish an early warning system for rapid response end-user needs. In addition, there are now popular applications that employ RS satellite data, such as Google Maps and Google Earth [
1].
Ground stations connected to geographic data provide many services by using RS satellite data [
16]. Many numerical model predictions based on in-situ tools/sensors in early warning and evaluation systems have been operational such as marine areas. These numerical model predictions depend heavily on long-term observations with in-situ sensors monitoring systems to better detect different environmental parameters for the oceanic environment [
52,
53]. As a result of online platforms, scientific advances in measurement and monitoring techniques, numerical methods, information technology and the rapid use of operational models have accelerated. Hence, RS satellite data in marine areas is very popular.
The reason for this popularity can be sought in multiple sources, such as multivariate, multidimensional and heterogeneous [
54], as well as with complex spatial and temporal marine regimes. Of course, it should not be forgotten that all of these things make platform features difficult to understand, process, access and use, creating many challenges for the end-user trying to obtain useful and meaningful information. As a result, researchers and users may not have enough information to respond to an appropriate decision in the fastest possible time.
Due to the difficulty of obtaining meaningful information using online platforms, a complex and accurate information system that can process, integrate, visualise and analyse large volumes of RS satellite data in a simple way has become an important goal for the monitoring and predicting of marine phenomena studies. EO-based satellite data play a major role in predicting and observing study models of the seas and ocean areas. This can be attributed to the high ability of satellites to cover large areas at long intervals for many key area identification parameters of the sea and oceans.
EO-based satellite data need a spatial context to allow researchers/analysts to use different data types with the feature of integration, visualisation and analysis. A clear example of a spatial context for space technology data is Geographic Information System (GIS) software, which has gained a great reputation for spatial data visualisation in many scientific disciplines [
55,
56]. Online technology systems and GIS provide a great opportunity to build an online information system. They can improve web-based management, visualisation, analysis and sharing of isolated data and information and alert time. Online technology systems and GIS can be considered application scenarios that use monitoring sensors with important high performance.
This online technology system and GIS online technology systems can capture data in a time series using a high-resolution monitoring system for model execution, grading, validation and capture, thus improving forecast accuracy [
57]. Users can access the high-resolution monitoring system to analyse many long-lasting physical processes on the web. Physical processes monitored primarily include weather conditions, marine ambient waves, wind speed, wind direction, air pressure, temperature and humidity, speed and direction, sea level, waves and water temperature [
58].
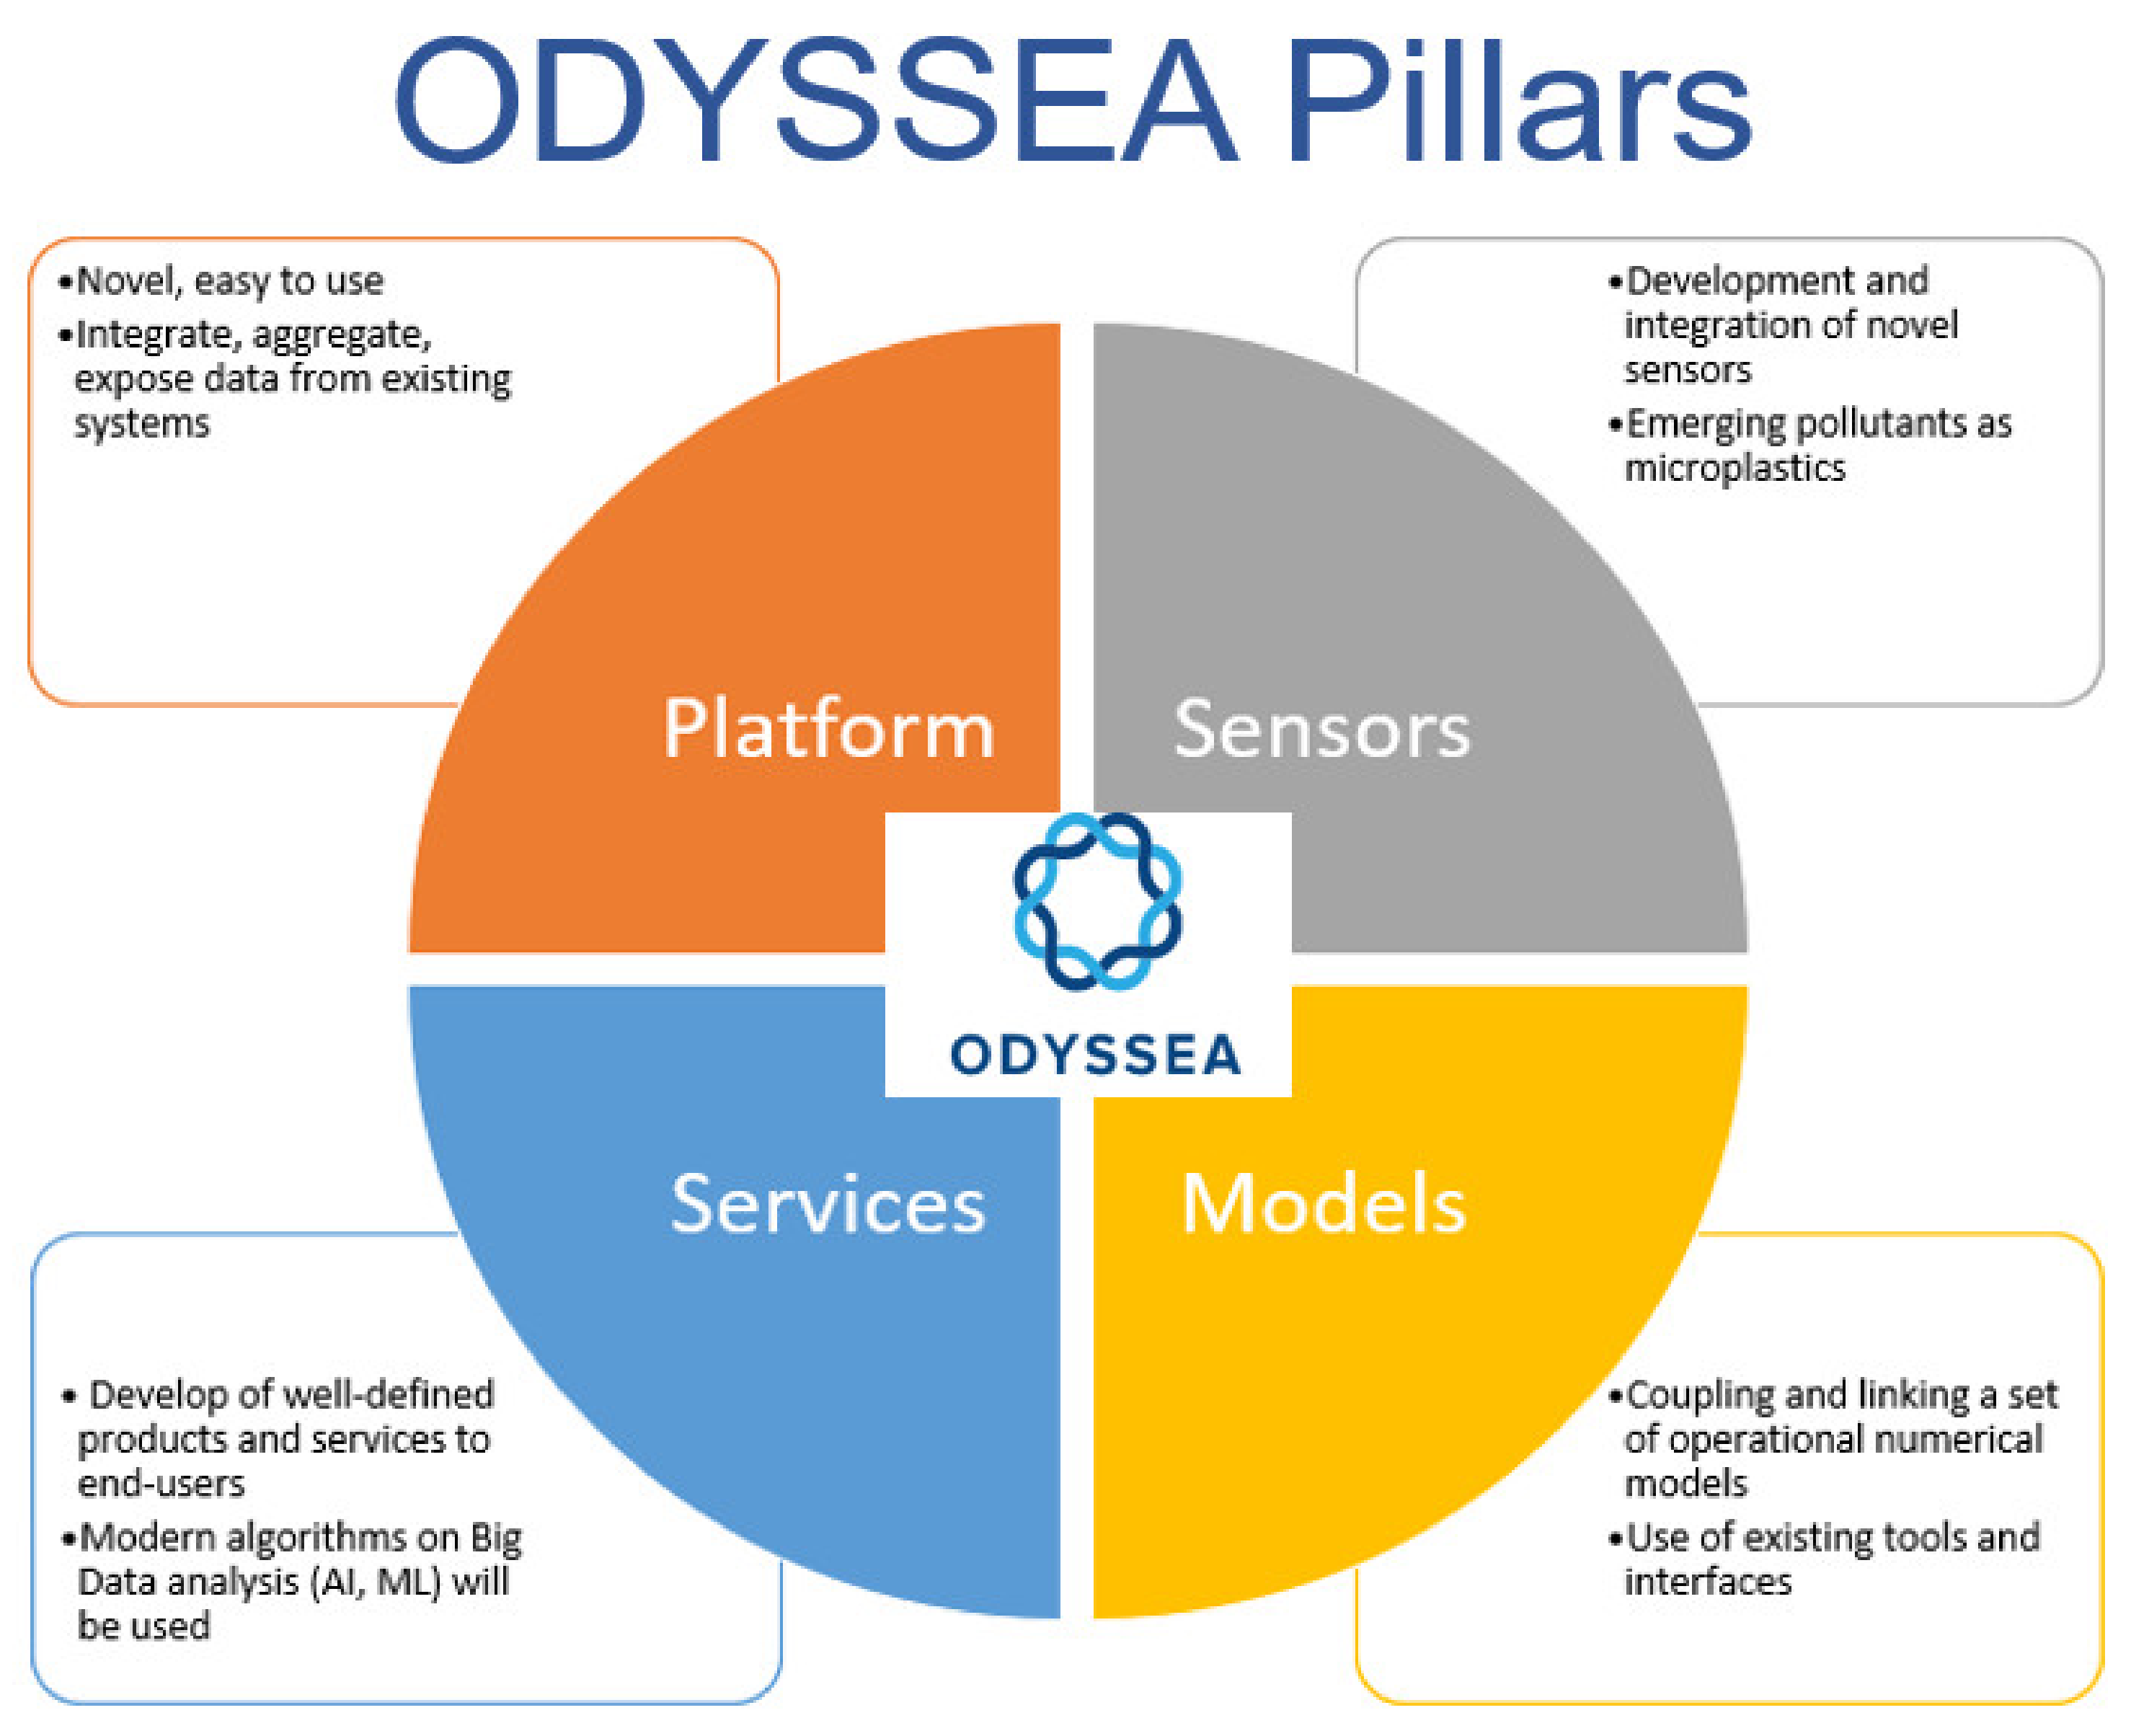
Figure 3 displays a schematic figure of an online platform chain model.
In short, the web system architecture style is a solution structure for pre-defined conditions on a large and real scale. The use of these architectural styles helps different sections of human societies build a system ahead of building and launching real steps. A variety of architectural styles are similar to build a system that can provide a clear solution to a larger challenge. Currently, several basic styles of web system architecture are commonly used to build information infrastructures: REST (REpresentational State Transfer), RPC (Remote Procedure Call) or SOAP (The Subjective, Objective, Assessment and Plan) and GraphQL (Graph Query Language) [
59,
60,
61].
The GIS web online is a design of a real operating system based on a REST (REpresentational State Transfer) architecture model [
57]. In addition to the key capability of automatic processing and the combination of different software layers, it also provides an interactive environment for step-by-step work with the flexibility that is necessary to generate subsequent simulation steps. Furthermore, an online GIS toolkit can provide end-users with a convenient opportunity to configure distribution parameters, with the ability to edit generated layers [
57].
REST can be considered a special architectural style for services that can implement architectural restrictions and agreements. The REST architecture style is designed and developed to optimise the Hypertext Transfer Protocol (HTTP)-based infrastructure. Due to the success of the internet, HTTP-based infrastructures such as servers, background and proxies are widely available to users. Web-based HTTP providers provide a document for architecture with an excellent and high durability scale. The architectural style for distribution systems includes PRCs, the most widely used RPC styles: JSON-RPC and XML-RPC. SOAP follows the RPC architecture style [
61,
62].
The basic concept in the RPC architecture style is how it works on a remote machine for distributed systems. This makes it easy to run a remote method on an RPC frame when using a call. The SOAP architecture style follows RPCs, and algorithms are the main elements in its structure. The SOAP architecture style is now widely used [
63]; however, the REST and SOAP architectural structures are thought to be the only tools suitable for building advanced APIs. However, when Facebook introduced its architecture structure within its Application Programming Interfaces (APIs) provider framework called GraphQL, another tool was added to the architectural structures [
64].
GraphQL architecture tools have been adopted rapidly, with programmers launching the GraphQL API alongside existing REST APIs, with some even replacing their previous architectural features. APIs are achievable and executable using basic web system architecture styles. However, appropriate APIs such as REST, SOAP or RPC or GraphQL must be selected to implement new APIs. Choosing which structure we use to implement and develop a new API is the most important problem to solve [
65].
Web platforms can be considered to have three basic structures: observation, models and warning information. By selecting the observation data with a specific time series, the maps will be displayed using the observation data of different locations on the earth, along with additional information about different sensors and operating systems in the window opened by the end-user. In addition to displaying the latest data from various sensors in (near) real-time, it enables end-users to search for information at their choice, view time series data by viewing and parsing web platform data and conduct data analysis.
The parameters will be available in various maps and graphs by the parameter information required running selected of the platform dashboard by the required time user. The x-axis on these charts represents date/time, and the y-axis can include any variable selected by the end-user. It should be noted that spatial data is available to users in a web browser according to the parameters selected, and there is no need for the end-user to install different models.
3. The ODYSSEA Project Results
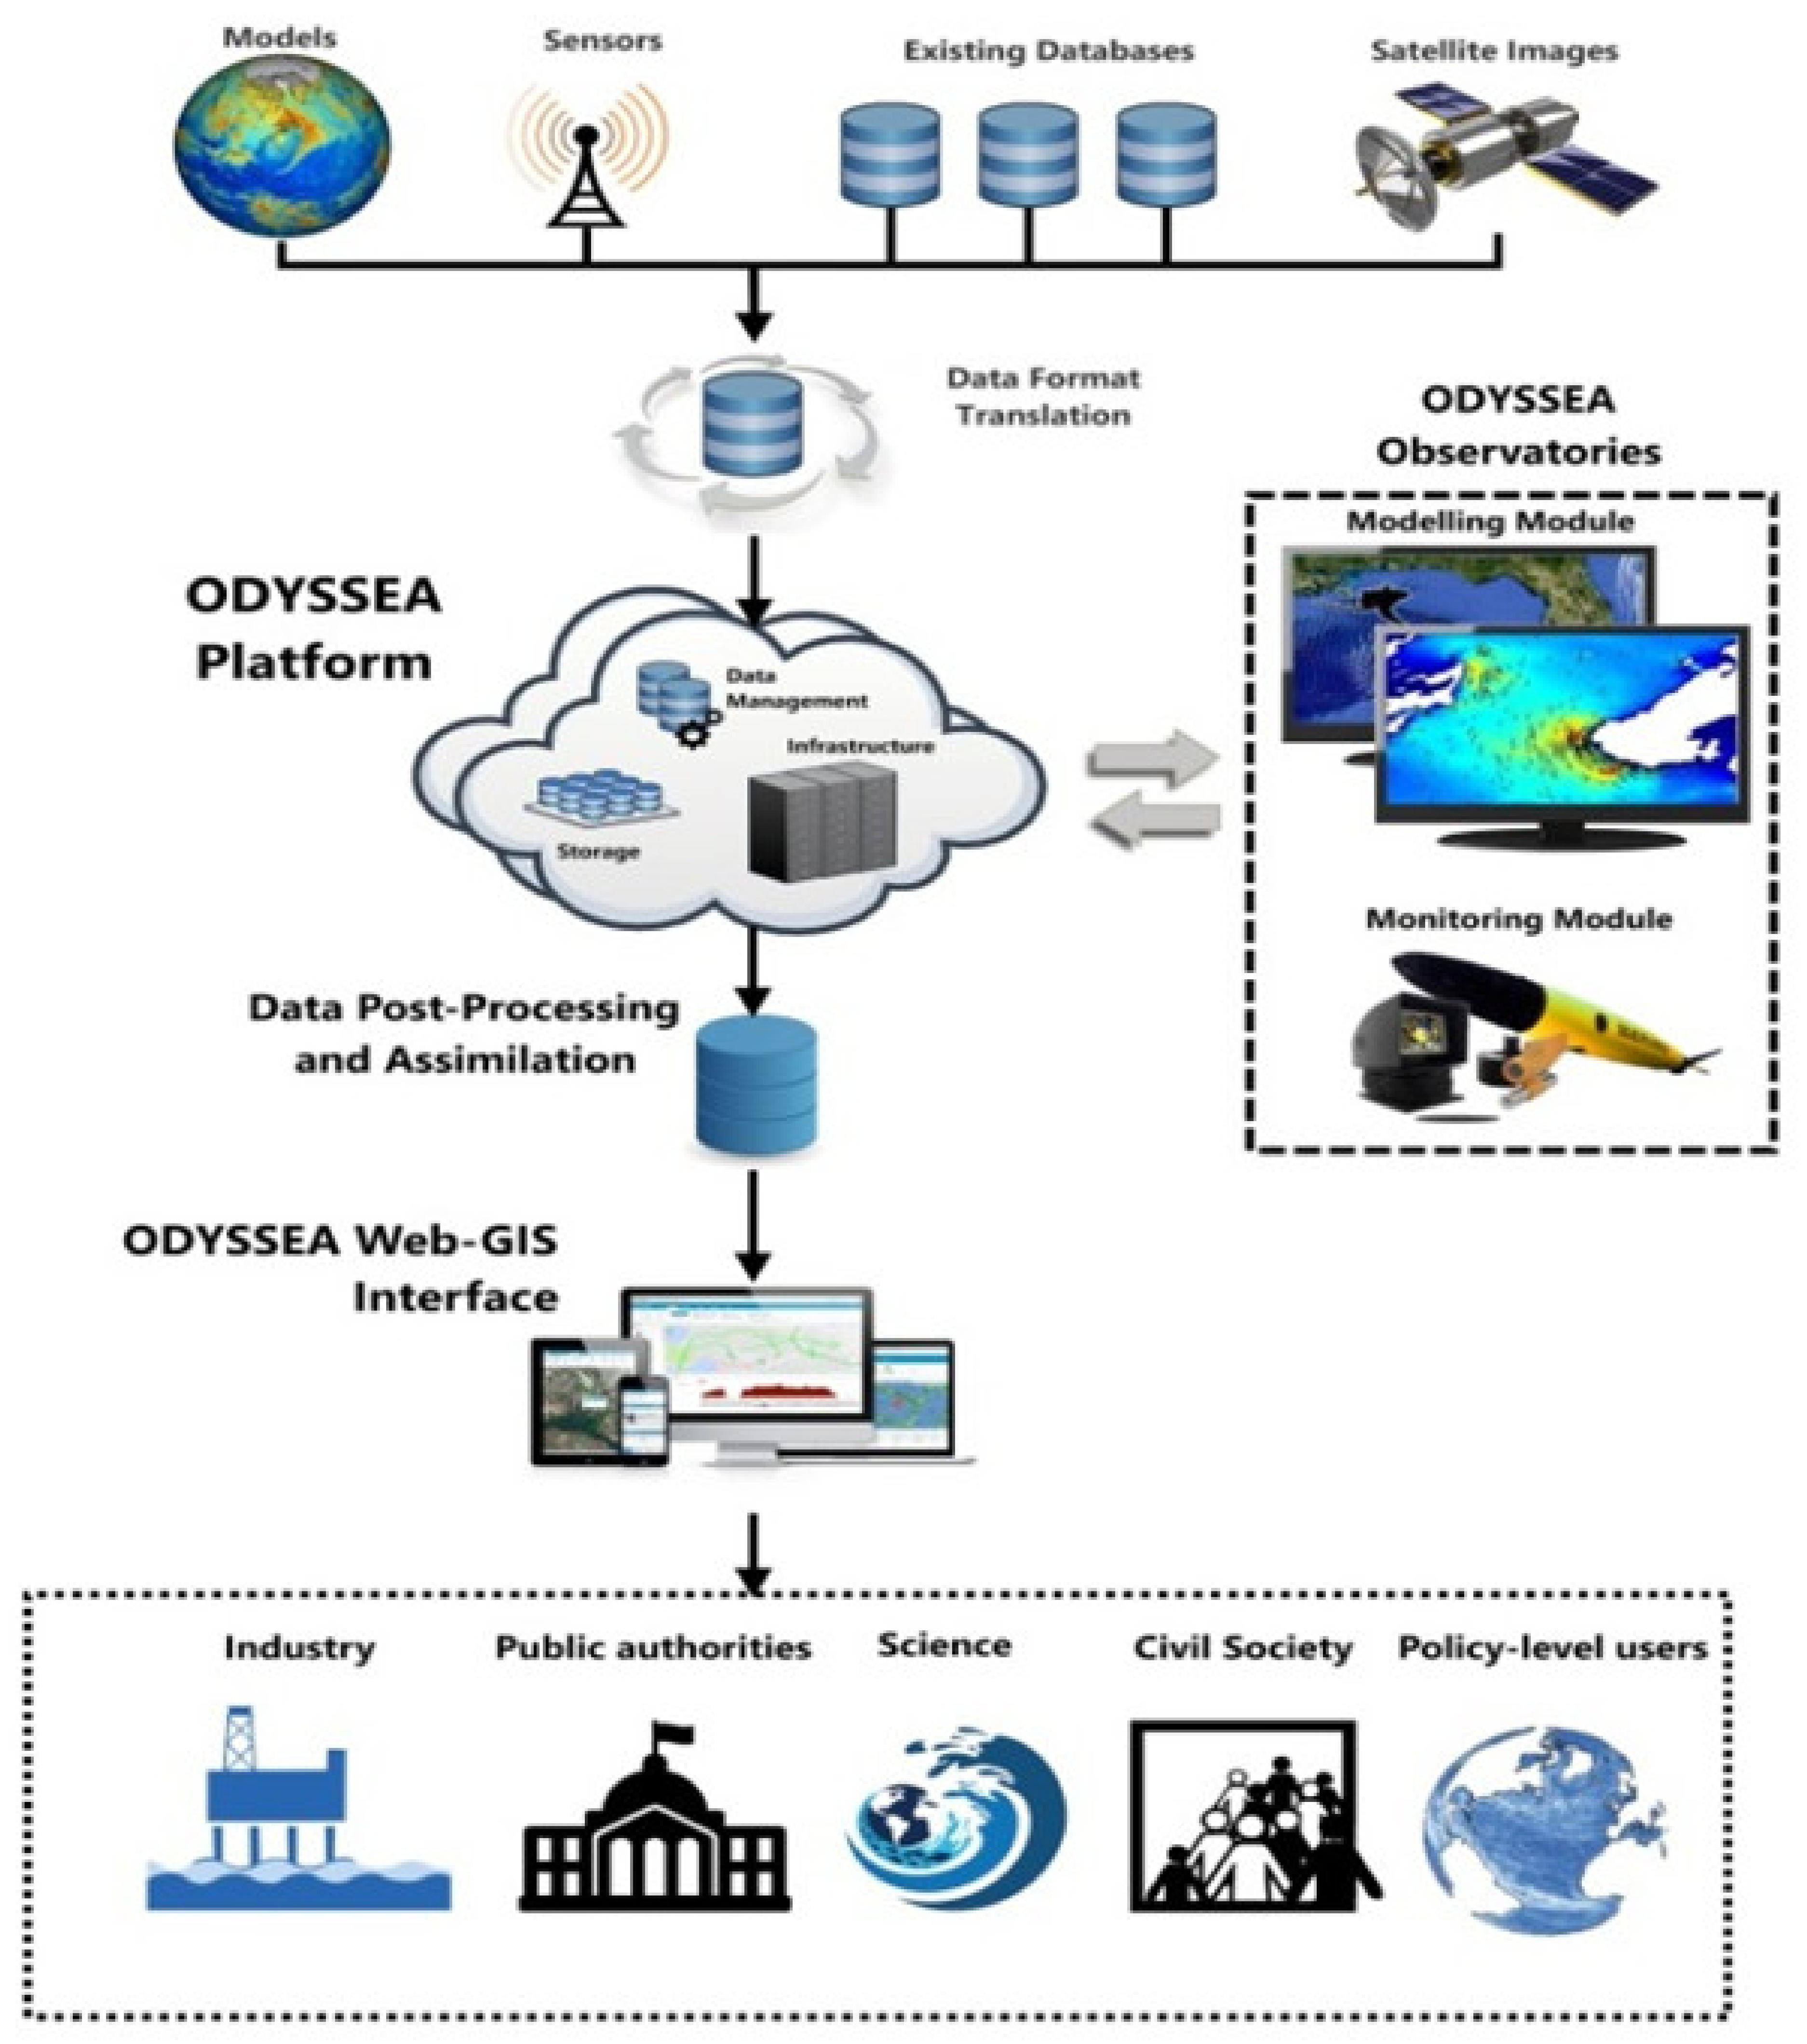
The ODYSSEA project develops and implements a cost-effective platform. The ODYSSEA project can fully integrate and demonstrate networks of observation and forecasting systems across the Mediterranean Sea. The project uses many databases to collect the project data from agencies, government officials and institutions of EU and non-EU countries [
66]. This data will be combined with the facilities and observation networks in the Mediterranean Sea, taking into account key initiatives such as Copernicus, GEOSS, GOOS, EMODNet, ESFRI, Lifewatch, Med-OBIS, GBIF, Aq-uaMaps, Marine IBA e-atlas and MAPAMED. They are considering the ODYSSEA project end-user approach, inside and outside the consortium of various groups of end-users and stakeholders, from the beginning of the project in designing, developing and operating the platform, including identifying gaps in the community. Data collection and free access to them are closely involved and interactive.
Different approaches can be used to fill critical data gaps in the area, such as developing a network of coastal observatories, the deployment of new sensors at sea, oceanographic modelling and the integration of mobile applications. In this regard, the platform must be designed and developed using advanced organisation homogenisation algorithms for a large combination of the standard format. The platform also offers other types of templates, raw data and demand-driven data services, including forecasts from the Mediterranean Sea.
This project dramatically increases data access and temporal and geographic coverage of observational data in the Mediterranean Sea. The project aims to produce marine data services that meet the needs of a wide range of end-users. These end-users can include representatives of the people, politics, industry, education and environmental protection, which has directly involved end-users in various stages of platform design, data collection and day-to-day operations and models. To achieve the main goals of the ODYSSEA platform project, the architecture has been designed, developed and launched in a consistent and cost-effective manner [
67,
68]:
Data collection from EU and non-EU Mediterranean Sea countries,
Integration of EO facilities and networks in the Mediterranean Sea,
Running model support in various simulation stages,
Data integration support with local measurement tools,
Provide search and download services with free access data support,
Provide downstream services focused on end-users.
The ODYSSEA consortium has set up observatories for data diversification and local and regional modelling to accurately measure various parameters in different parts of the Mediterranean Sea. Each observatory is responsible for transferring the collected data using the local measurement tool to the central ODYSSEA platform. In order to better achieve this goal, training activities have been carried out to increase the capacity of observatory operators and end-users of the platform and data services and products, which will continue in the coming years with a focus on capacity building in North African countries.
4. Discussion
Due to the online platform advantages points of the human community’s knowledge development and sustainability to understand better the Earth, efforts to design, develop, and launch various online platforms have increased [
9]. More profound knowledge and understanding of the seas is essential to improve social benefits, and sharing online platform observations and methodologies plays a crucial role in human societies. In this case, using EO satellite data to provide extensive area data with appropriate accuracy is increasing. Due to the EO increasing data volume, the EO satellite of extensive data analysis needs new methods. These methods can dramatically save time and human sources in analysing the EO satellite data required on online platforms with appropriate accuracy.
Therefore, it can be expected that with machine learning methods and further development in the EO satellite data field, many new challenges in the spatial data infrastructure will be well-covered. These learning methods can develop a new infrastructure suitable for better use of satellite data in online platforms based on the image processing, time series analysis, storage and transmission, access, visualisation and analysis. Therefore, it can be expected that the challenge of managing online platforms will be greatly improved by considering all the capabilities discussed [
9].
There is a significant difference between local, regional and global online platforms due to the considerable differences in approaches and access to data, collection times, human sources, and the platform monitoring programs support. As the size of the online platforms increases from local scale to the global scale, many new areas open to researchers and students in different fields. On the one hand, the responsibility of data management increases dramatically, which can ultimately increase the data missing risk [
19]. This is in contrast to the comparable collecting data online platforms in different contexts to interpret new observations over time, reduce costs and increase data collection. Therefore, the data used in online platforms should be available in defined formats with a specific standard and fully supported by complete metadata. Furthermore, the data source, including collecting observations, processing and quality control, should also be well-described and accessible to end-users [
19].
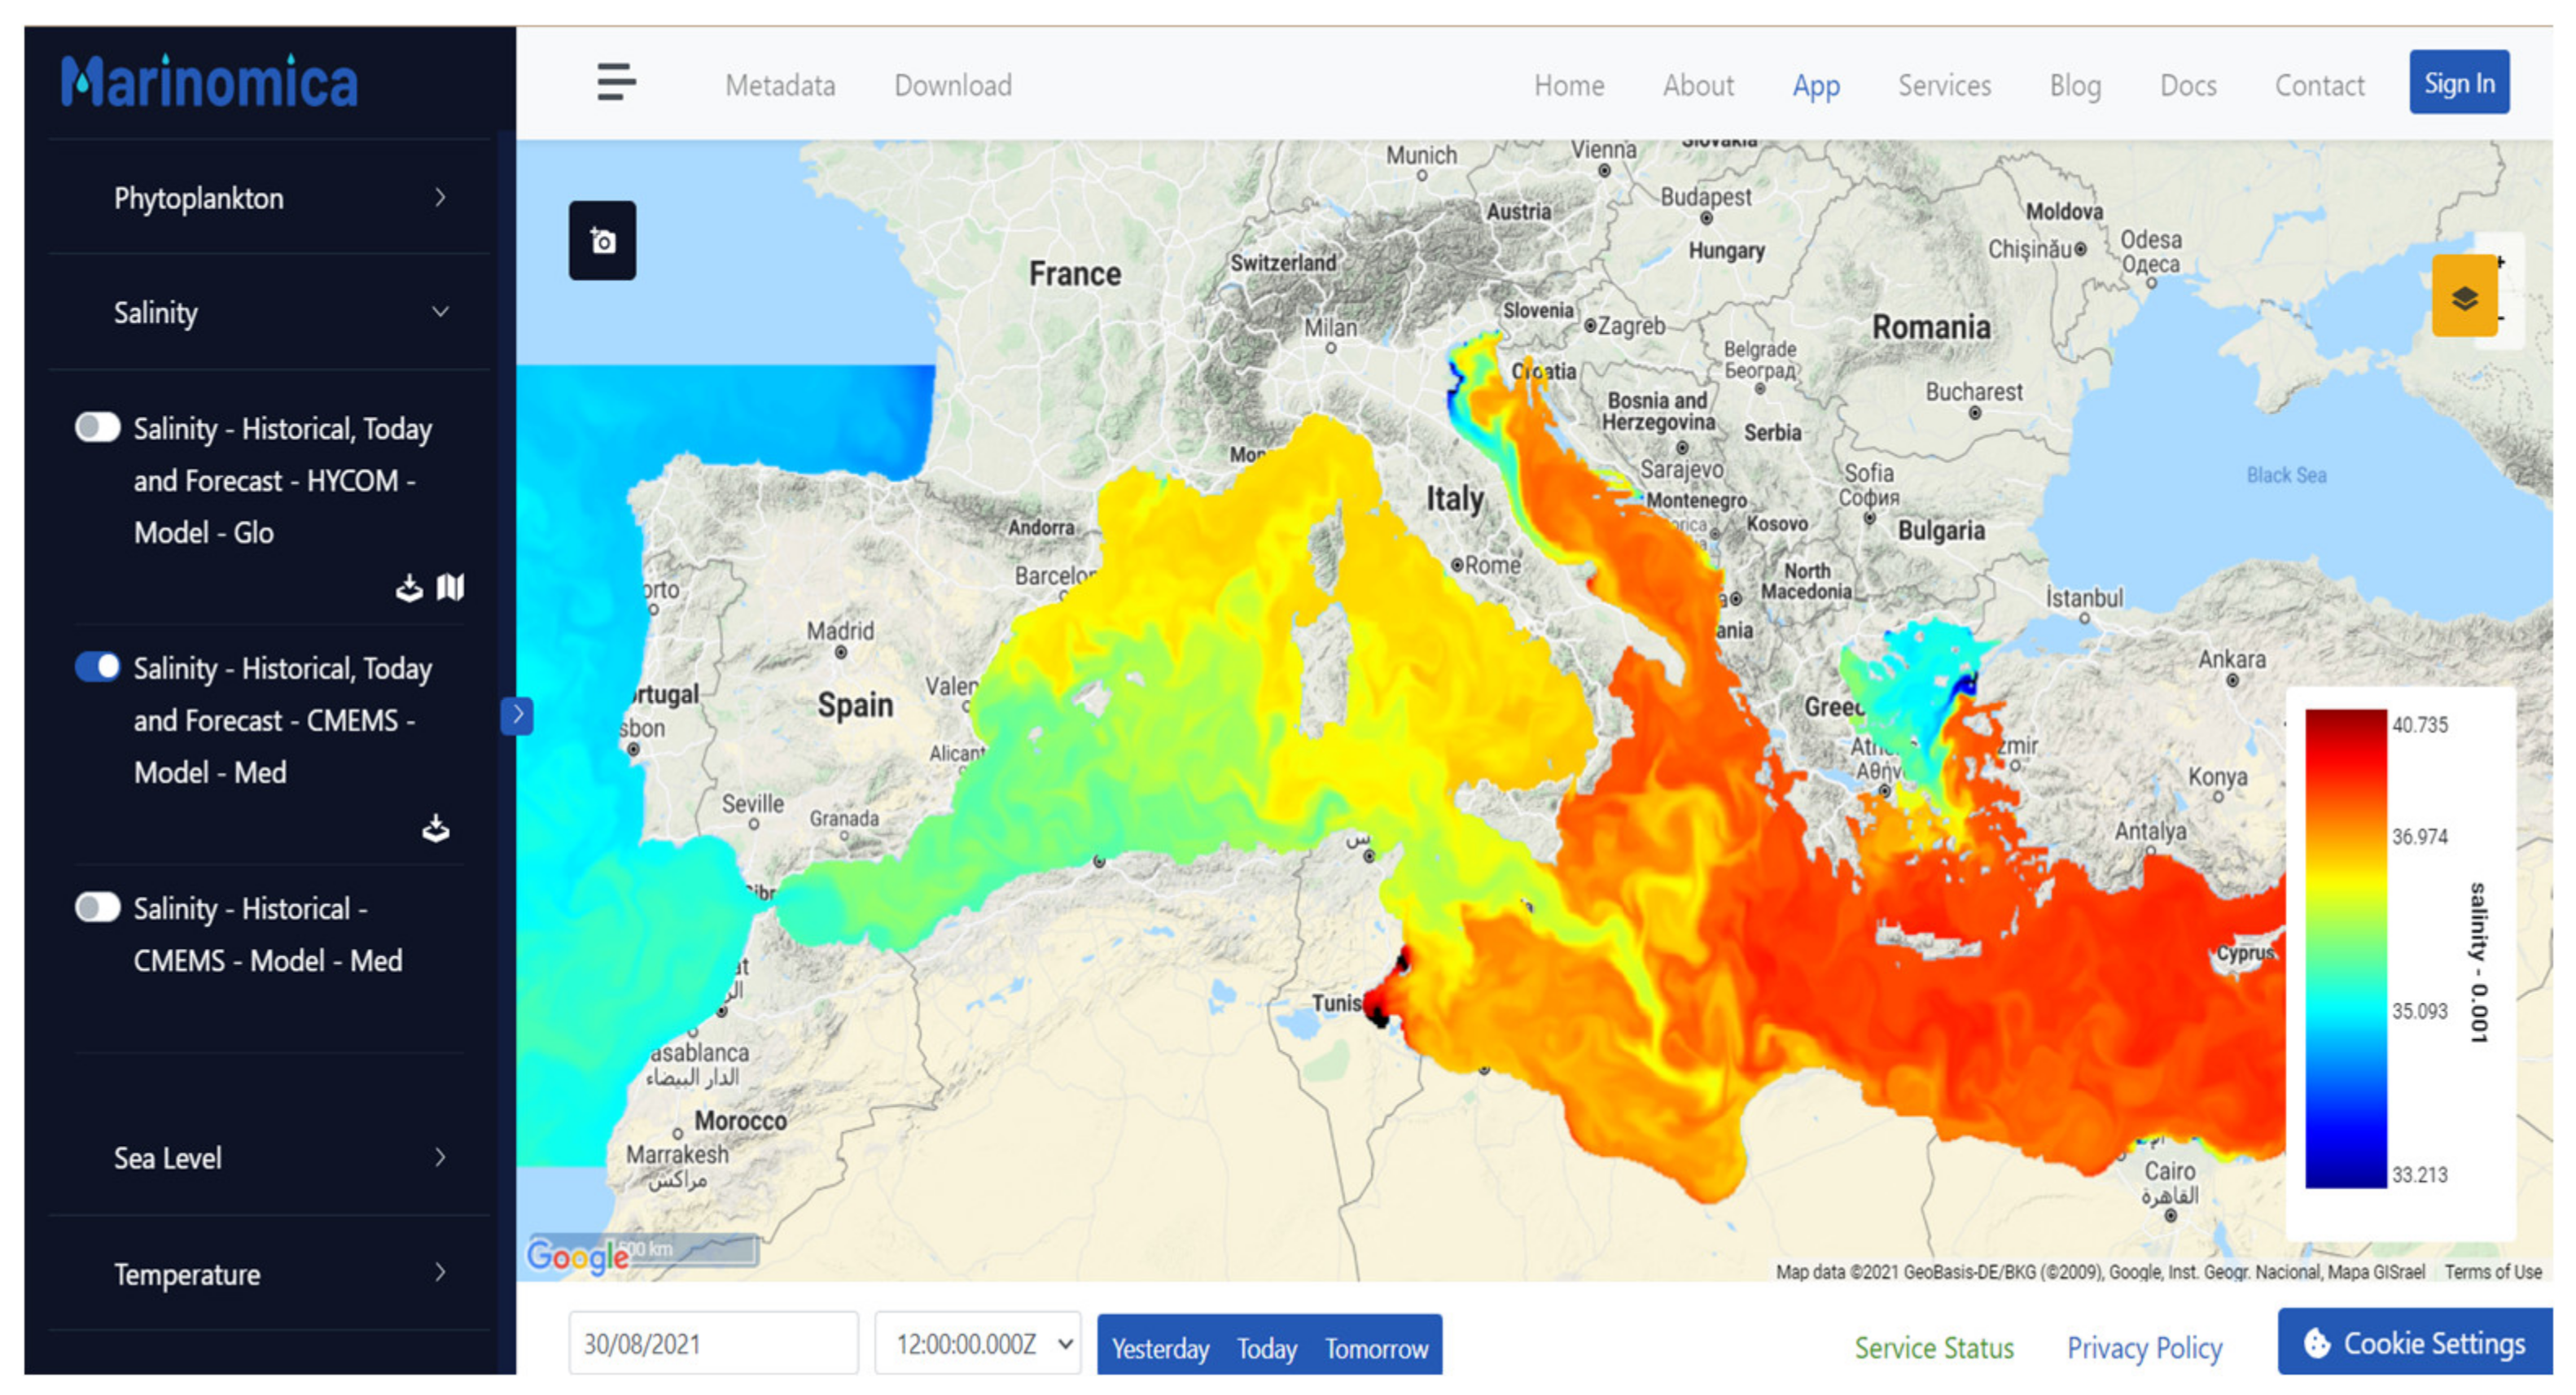
The ODYSSEA project, considering the data processing and analysis aspects, provides a flexible online platform as an “easy and fast” solution for academic researchers, companies, and public end-users. The ODYSSEA online platform, with different scenes, time series, cubes and windows, allows data to be processed in various data and dataset modes to end-users. The ODYSSEA online platform offers the best solution for end-users by increasing the ease of use and saving time. The ODYSSEA project should be considered an open platform that can ensure the reproducibility of the analysis of desired parameters.
5. Conclusions
Online platforms are a way to better and more quickly understand real-time viewing data that can be used to predict what will happen in the future. Ensuring sustainability and understanding the state of the oceans, seas and coastal communities (and residential islands) requires international cooperation and consensus. This requires monitoring and reporting by stakeholders, especially in cases where the ecosystems in question transcend national and regional boundaries. Online platforms can also bring together regional, national and global partners with in-situ measurement data networks focused on modelling and EO satellite-based data. Different sensor monitoring systems to capture observed data, validate models and reduce modelling errors are valuable. This can provide a good support platform for the development of services that require long-term planning for all shareholders and end-users. Online platforms enhance data access and collaboration exchange, especially for in-situ data on a regional and global scale. In this context, the combination of in-situ data with satellite data can be used to provide global and regional product models and datasets.
The data obtained from EO satellite-based data of the coastline, seas and oceans are precious for assessment, monitoring and modelling, which can play a crucial role in achieving a uniform and integrated view of marine case observation and monitoring of all stakeholder countries. This role becomes more colourful when it shares products with its end-users with free access to save time and labour and achieve a regional partnership. Achieving complete and widespread success for online platforms and their end products is directly related to how end-users feel welcome in different sectors of society. Online platforms and end products can provide rich services, programs and research with diverse and valuable social and economic benefits, especially for developing countries.
Marine platforms have been designed and launched to receive a deep understanding of the interactions between users and stakeholders that categorise their needs into different types based on the relevant scenario. Hence, online platforms can be considered a set of shared values and meanings for multiple uses in marine and ocean environments. Currently, the proposed platforms can be considered a very complex socio-ecological system of the area covered. This can lead to a better understanding of social, economic and environmental issues and pave the way for the composition and proposed decisions that are of great importance.
The key outputs of the ODYSSEA project can be listed below: (a) initial data and final services and products are available through a public portal based on user demand. (b) This platform has made it possible to search, collect, retrieve and integrate datasets through Mediterranean Sea marine observation systems. (c) Reduce costs and ensure the active participation of various users in the ODYSSEA platform, which uses the facilities available in multiple Mediterranean Sea areas, such as oil and gas terminals and ports. (d) Install marine microplastic and new sensors that perform integration operations in real-time. (e) Each of the observatories in the project provide models for forecasting and informing end-users of emergencies and weather hazards. (f) Various workshops and schools have been provided to enhance the knowledge and training of local, regional and national policymakers and end-users.
Next-generation operational service platforms require the capacity to regenerate and anticipate various ecosystem parameters in different coverage areas. Well-designed platforms should perform well in field experiments and sampling, using precision instruments that can generate new knowledge and transfer that knowledge to integrated operating model systems and product services.


 ,
, 


