Communication

Characteristics and Cause Analysis of the 1954 Yangtze Precipitation Anomalies

1
School of Geodesy and Geomatics, Collaborative Innovation Center for Geospatial Technology, Wuhan University, Wuhan 430079, China
2
Key Laboratory of Geospace Environment and Geodesy of the Ministry of Education, Wuhan University, Wuhan 430079, China
3
Wuhan Central Meteorological Observatory, Wuhan 430074, China
*
Author to whom correspondence should be addressed.
Remote Sens. 2022, 14(3), 555; https://doi.org/10.3390/rs14030555
Submission received: 28 October 2021 / Revised: 24 December 2021 / Accepted: 20 January 2022 / Published: 24 January 2022
(This article belongs to the Topic Water Management in the Era of Climatic Change)

Abstract

:
In 1954, the Yangtze River valley was hit by heavy precipitation anomalies, which caused large casualties and economic losses; however, systematic analyses of the causes are lacking. Adopting the latest national historical precipitation data collected by the China Meteorological Administration (CMA) and global sea surface temperature (SST) records, this retrospective study determined the spatial–temporal distribution characteristics of the precipitation in 1954 in Wuhan, a city situated in the Yangtze River valley. The results confirmed that the 1954 precipitation anomalies were characterized by a high volume and a long period of rainfall, plus numerous cloudbursts, with most of the precipitation concentrated during June and July at the mid- and low-Yangtze areas along the Yangtze. An El Niño event caused the West Pacific subtropical highs to continually move southward during the summer, creating a long-term rainband in the drainage basin. Moreover, the continued low SSTs in the Sea of Okhotsk generated an active blocking high that continuously brought high-latitude cold air into the south, boosting precipitation over the drainage basin. This study proposed a new causal model of summertime precipitation across the Yangtze River valley in 1954, whereby the unusual SST changes initially triggered atmospheric circulation anomalies, which caused the precipitation anomalies of 1954.

1. Introduction

The Yangtze River valley has observed several heavy rainfall and flooding events in the last century [1], which caused large casualties and economic losses. Extreme precipitation events are the primary causes of flooding disasters [2,3,4,5]. Understanding the characteristics of past extreme precipitation events—including the temporal and spatial distribution characteristics of precipitation anomalies and the formation mechanism—is important for future flood control and disaster reduction [6,7].
Effected by the geographical location, the factors causing precipitation anomalies in the Yangtze River valley are very intricate and including the intra-seasonal oscillation of West Pacific subtropical high cyclones over East Asia, cross-equatorial wind anomalies, the Asian polar vortex, Asian meridional circulation, as well as sea surface temperature(SST) anomalies due to ENSO(El Niño-Southern Oscillation) [8,9,10]. As the strongest interannual change signal of ocean–atmosphere interaction, the evolution of ENSO events largely affects the precipitation over the Yangtze River valley in China [11,12,13]. The abnormal convective activities over the Philippines caused by the SST anomalies provoke anticyclones at the bottom of the troposphere in the region [14]. Such circulation with anticyclonic anomalies tends to continue into the following summer, consequently causing anomalies regarding the location, intensity, and seasonal movements (north- and southbound) of the West Pacific subtropical high (WPSH) [15,16], affecting the East Asian monsoon, and resulting in increased rainfall in the Yangtze River valley. As the generation of ENSO is relatively slow, and the observation mode indicated by SST anomalies is intuitive, an ENSO event can be an important basis for predicting summer precipitation. In fact, the current prediction system in China depends—to a great extent—on the prediction of an ENSO signal [17,18], and it has achieved primary success in the prediction of summer precipitation in China [19]. Consequently, the analysis of historical precipitation anomalies related to SST anomalies in the Yangtze River valley is of great significance for reliable projections of future extreme precipitation events in this region.
In the summer of 1954, the most severe flood of the past century occurred in the Yangtze River valley. At the time, the flood level hit a historic high of 29.73 m at the Hankou weather station, with a peak discharge of 76,100 m3/s [20]. A solid conclusion regarding the mechanism of 1954’s heavy rain has not been reached.
Some research focused on the causes of this flood has been conducted. Feng et al., (2004) explored the superposition of multiple physical factors that were observed during the 1954 Yangtze floods [21], and proposed that the ENSO event in 1953 is an important factor causing the flood. Chen (1957) analyzed the atmospheric circulation (AC) features at the Yangtze River valley during the flood season in 1954 [22], indicating that the formation of the Okhotsk high and a cold trough above the Tibetan Plateau were closely related to the unusual precipitation over the drainage basin that year. Some studies demonstrated that AC anomalies are strongly correlated to SST anomalies, and that SST anomalies occur before AC anomalies [11,12,13], directly causing unusual precipitations. Lu Jiong (1954) proposed that the Pacific SST anomalies played a crucial role in summertime precipitation anomalies across China [23]. These studies indicate that the precipitation anomalies over the Yangtze River valley in 1954 should be closely related to the Pacific SST anomalies.
Previous studies on the 1954 flood were limited by the number of stations and data quality [22,24]. However, the current mass of data provides an opportunity for retrospective research. The China Meteorological Data Service Centre recently published high-quality surface climate and daily observation data [25]. In the construction of ground-basic meteorological data carried out by the China Meteorological Administration, the quality of the original data has been repeatedly checked and tested, bad data have been corrected, and missing data have been supplemented, which has significantly improved data quality. The National Weather Service of the United States also provided the global SSTs and geopotential data.
This study started with the spatiotemporal distribution characteristics of precipitation anomalies in 1954 over the Yangtze River valley. We explored the process of how the Pacific SST anomalies affected the circulation anomalies, and then induced the 1954 Yangtze precipitation anomalies. Based on the results of the analysis, we proposed a causal model relating the precipitation anomalies to the Pacific SST anomalies and the circulation anomalies, which can be used as a forecast tool for future severe flood disasters in the Yangtze River valley.

2. Meteorological Data

This study adopted the following datasets:
(1) Records of daily precipitation data collected from 328 weather stations since the establishment of each station. The China Meteorological Data Service Centre qualified the raw data once for the period 1951–2010, free from data errors and missing data, ensuring the data quality of historical precipitation for the present study. We converted the ground station data into contours based on the kriging method;
(2) The 2° × 2° grid size that recorded average monthly SSTs worldwide between 1930 and 2000 from NOAA Extended Reconstructed SST V5 dataset [26];
(3) The 2.5° × 2.5° grid size that recorded horizontal wind fields and geopotential height fields in 1954 (retrieved from the NCEP/NCAR Reanalysis dataset on the National Ocean and Atmospheric Administration website) [27].

3. Characteristics of the 1954 Precipitation Anomalies

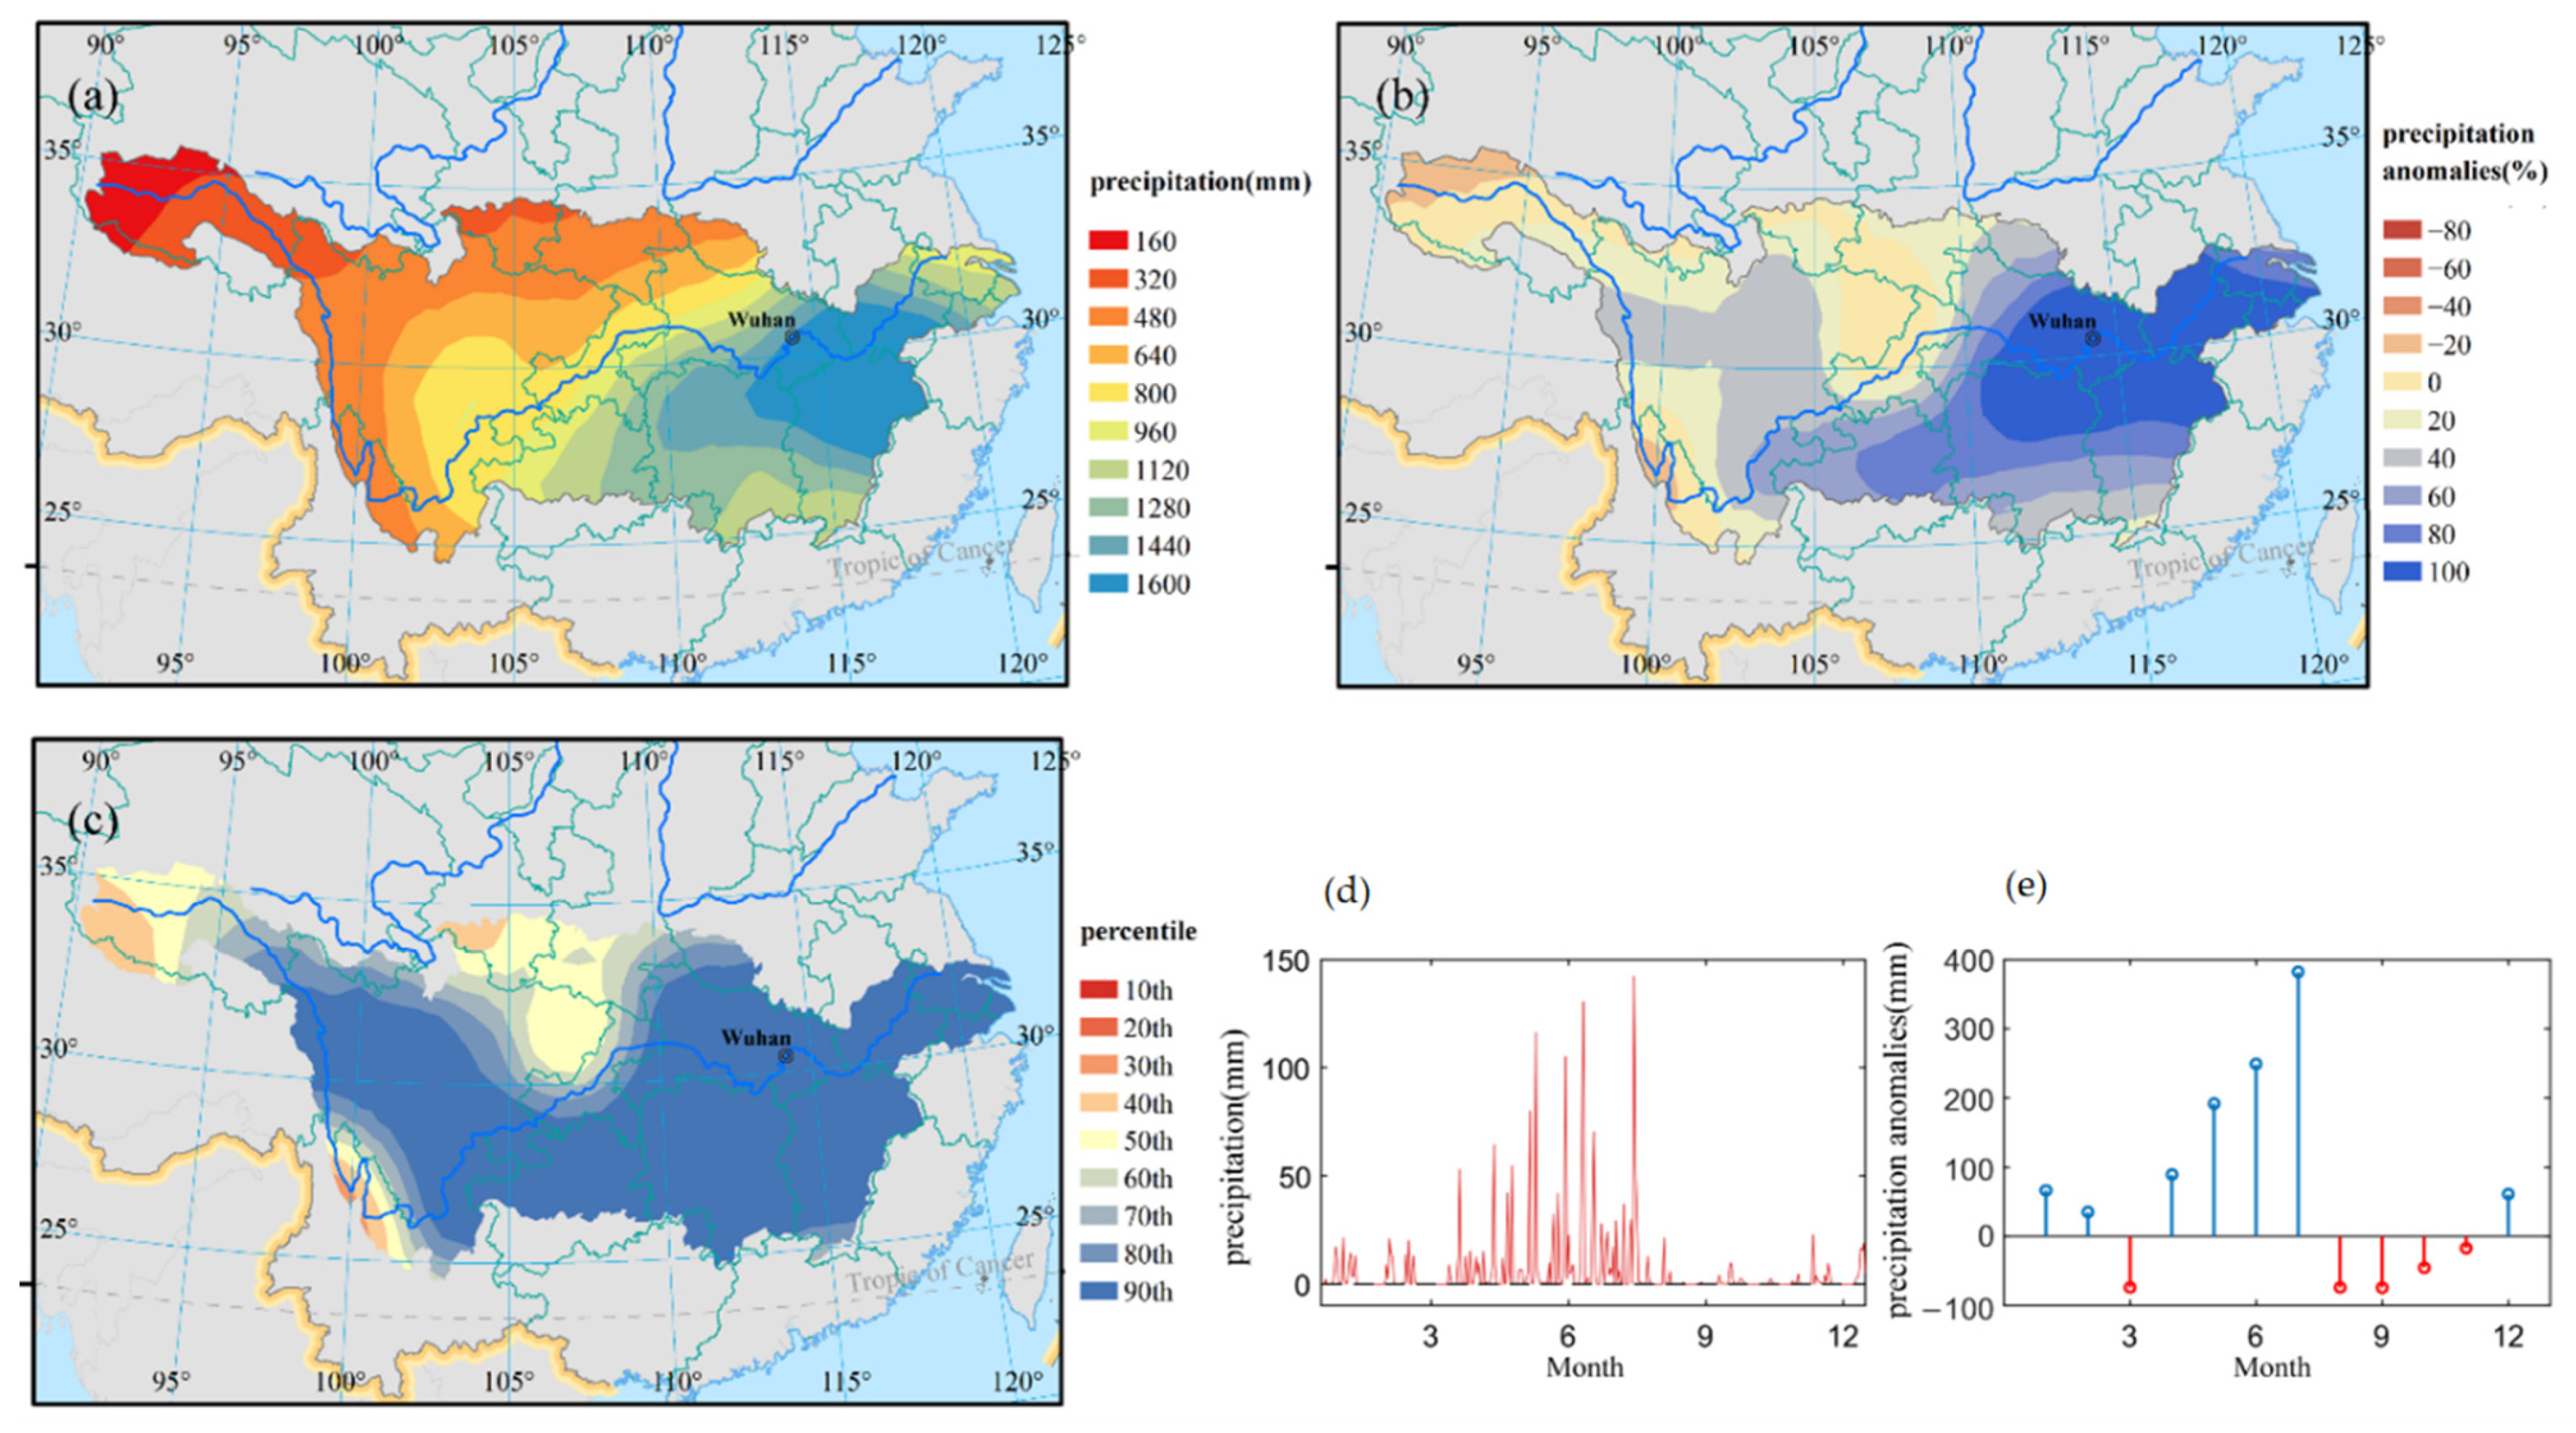
3.1. Characteristics of the Unusual Rainfall over the Yangtze River Valley

Figure 1 reveals the temporal and spatial distribution characteristics of the precipitation anomalies during the summer of 1954. Compared with the precipitable water data in the NCEP/NCAR Reanalysis dataset the ground station data is more accurate (Figures S1 and S2). Figure 1a depicts the national precipitation distribution during the flood period (April–July) in 1954, during which abundant rainfall was observed along the mid- and low-Yangtze River. In particular, the area at the juncture of the provinces of Hubei, Anhui, and Jiangxi received the highest precipitation. The mid- and low-Yangtze areas between 26°N and 32°N mostly had rainfall exceeding 1500 mm during April–July, signifying extremely widespread heavy rainbands. The maximum precipitation recorded by weather stations reached 2212.23 mm, whereas the rainy-season precipitation data collected by weather stations across the Yangtze mid- and low-Yangtze areas averaged 1044.4 mm. Severe floods affected the provinces of Hubei, Anhui, Jiangxi, and Jiangsu. The levees at Poyang Lake in Jiangxi Province broke and flooded most of the streets in Jiujiang City. The farmlands in Jiangsu Province alongside the Yangtze—with a total area of 10 million mu (equivalent to 666,666.67 hectares)—were flooded, and the Yangtze water level in Nanjing exceeded the warning limit for 117 days [28].
Figure 1b presents the rainfall anomalies that occurred during the 1954 rainy season. The figure indicates that the total precipitation between April and July in most of the mid- and low-Yangtze areas was twice the normal precipitation. The distribution of areas with high anomalies was mostly consistent with that of heavy rainbands. The rainfall anomaly rates in upstream areas ranged between 20% and 50% in 1954, and precipitation at most stations was greater than the 90th percentile (Figure 1c), suggesting a precipitation anomaly across the entire Yangtze River valley with large outliers centralized in the mid- and low-Yangtze areas.

3.2. Characteristics of Precipitation Anomalies in Wuhan

In 1954, the disaster of rainfall and flooding in Wuhan city reached the highest in history; typical damage hit by the 1954 floods was among the cities in the mid- and low-Yangtze areas. This study, using data compiled by the Wuhan weather station, reconstructed the precipitation anomaly process in chronological order. In 1954, most of the precipitation in Wuhan occurred between April and July, whereas the precipitation in other months was relatively low. As illustrated in Figure 1d, the precipitation surged after April with increased daily peak rainfall, and it peaked in July. Figure 1e indicates that the precipitation starting in April was higher compared with that of previous years (i.e., normal conditions). This anomaly continued for 4 months. In August, the continuous rainfall eventually ended, and the Yangtze River valley began to witness high temperatures along with low precipitation. In particular, the monthly total precipitation in Wuhan in August 1954 was only 46 mm, which was 61.28% less than normal conditions.
The cloudburst frequency in 1954 also exhibited a similar trend. Between April and July (122 days), Wuhan saw 58 days of rain, of which 11 days had rainfall, revealing a notable anomaly. Rainfall occurred mostly between mid-June and the end of July. During this period, 3 days had intense rainfall, namely: June 13 (105 mm), June 25 (130.3 mm), and July 29 (142.2 mm—the highest on record). The precipitation between mid-June and the end of July was continuous for most of the time, indicating an extended period of rainfall. The precipitation during April–July of 1954 totaled 1620.1 mm, which was more than twice the precipitation under normal conditions. The heavy rain prompted the water level and discharge of the Yangtze to sharply rise. In 1954, the water level and peak discharge measured at the Hankou (a district of Wuhan) weather station hit historic highs of 29.73 m, and 76,100 m3/s, respectively. During the flood period that year, the water level of the city’s levee exceeded its warning limit for more than 100 days, with a total of 21,523 major and minor events reported [29].

4. Causes of the Precipitation Anomalies

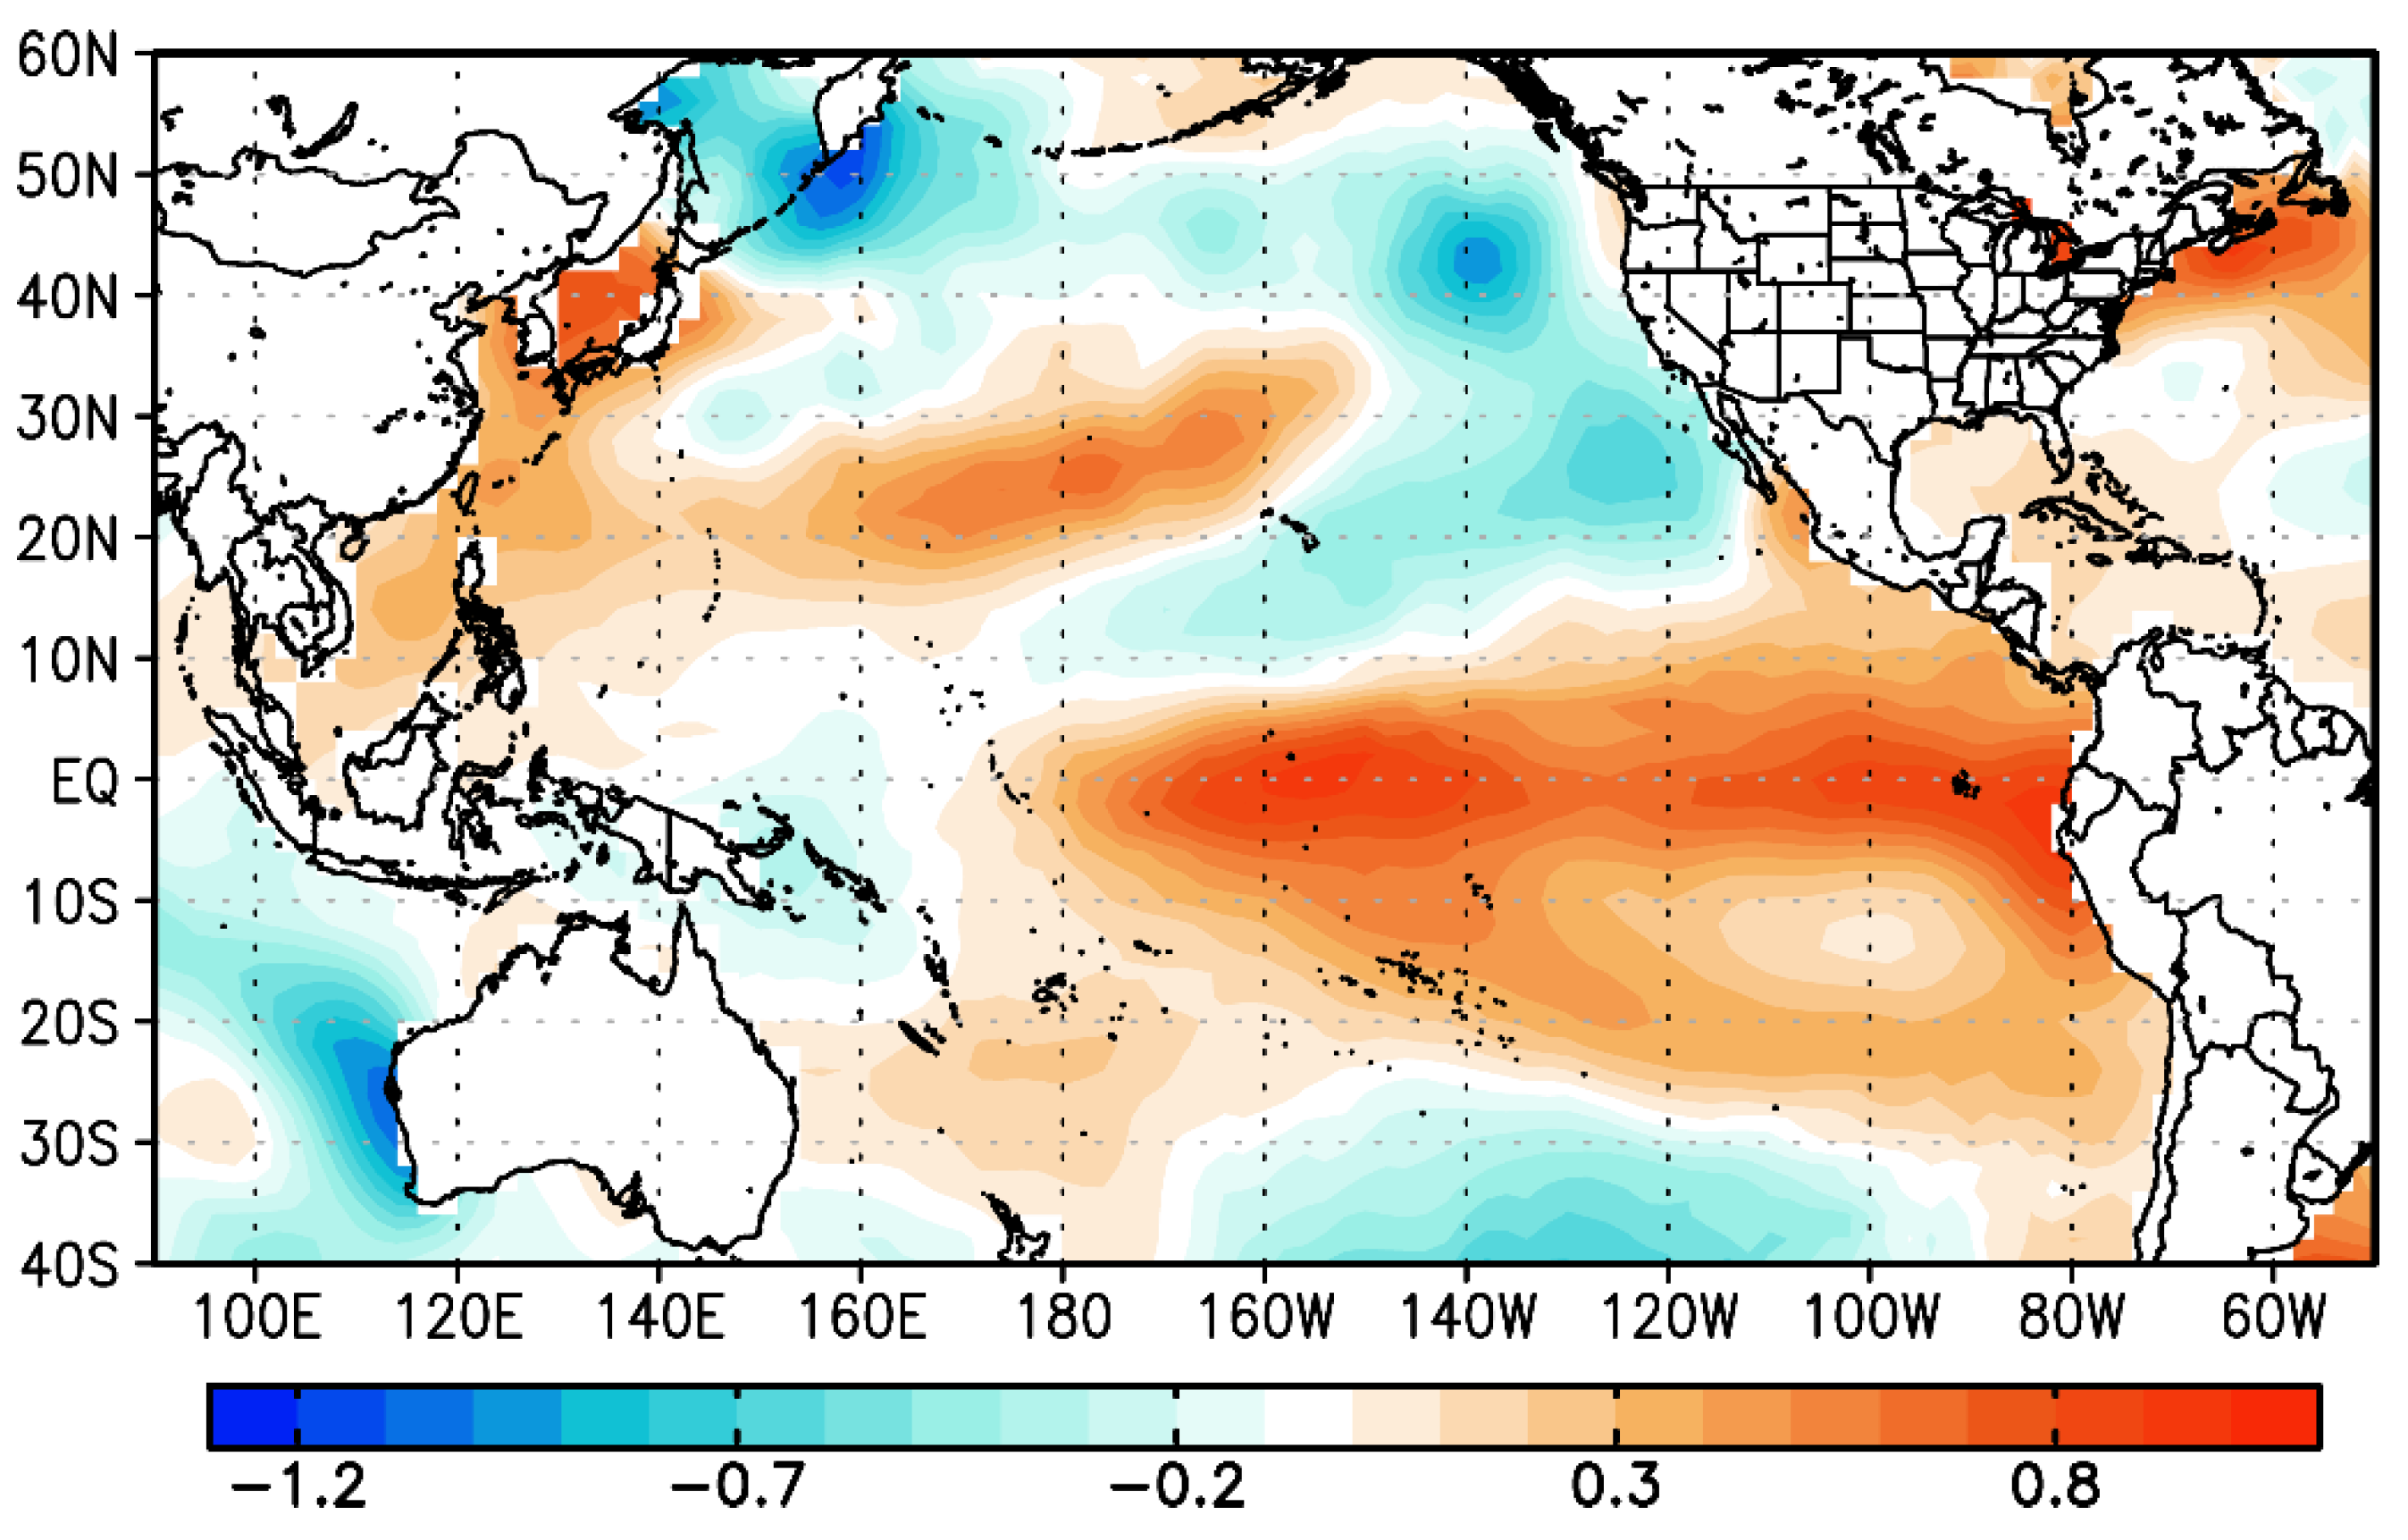
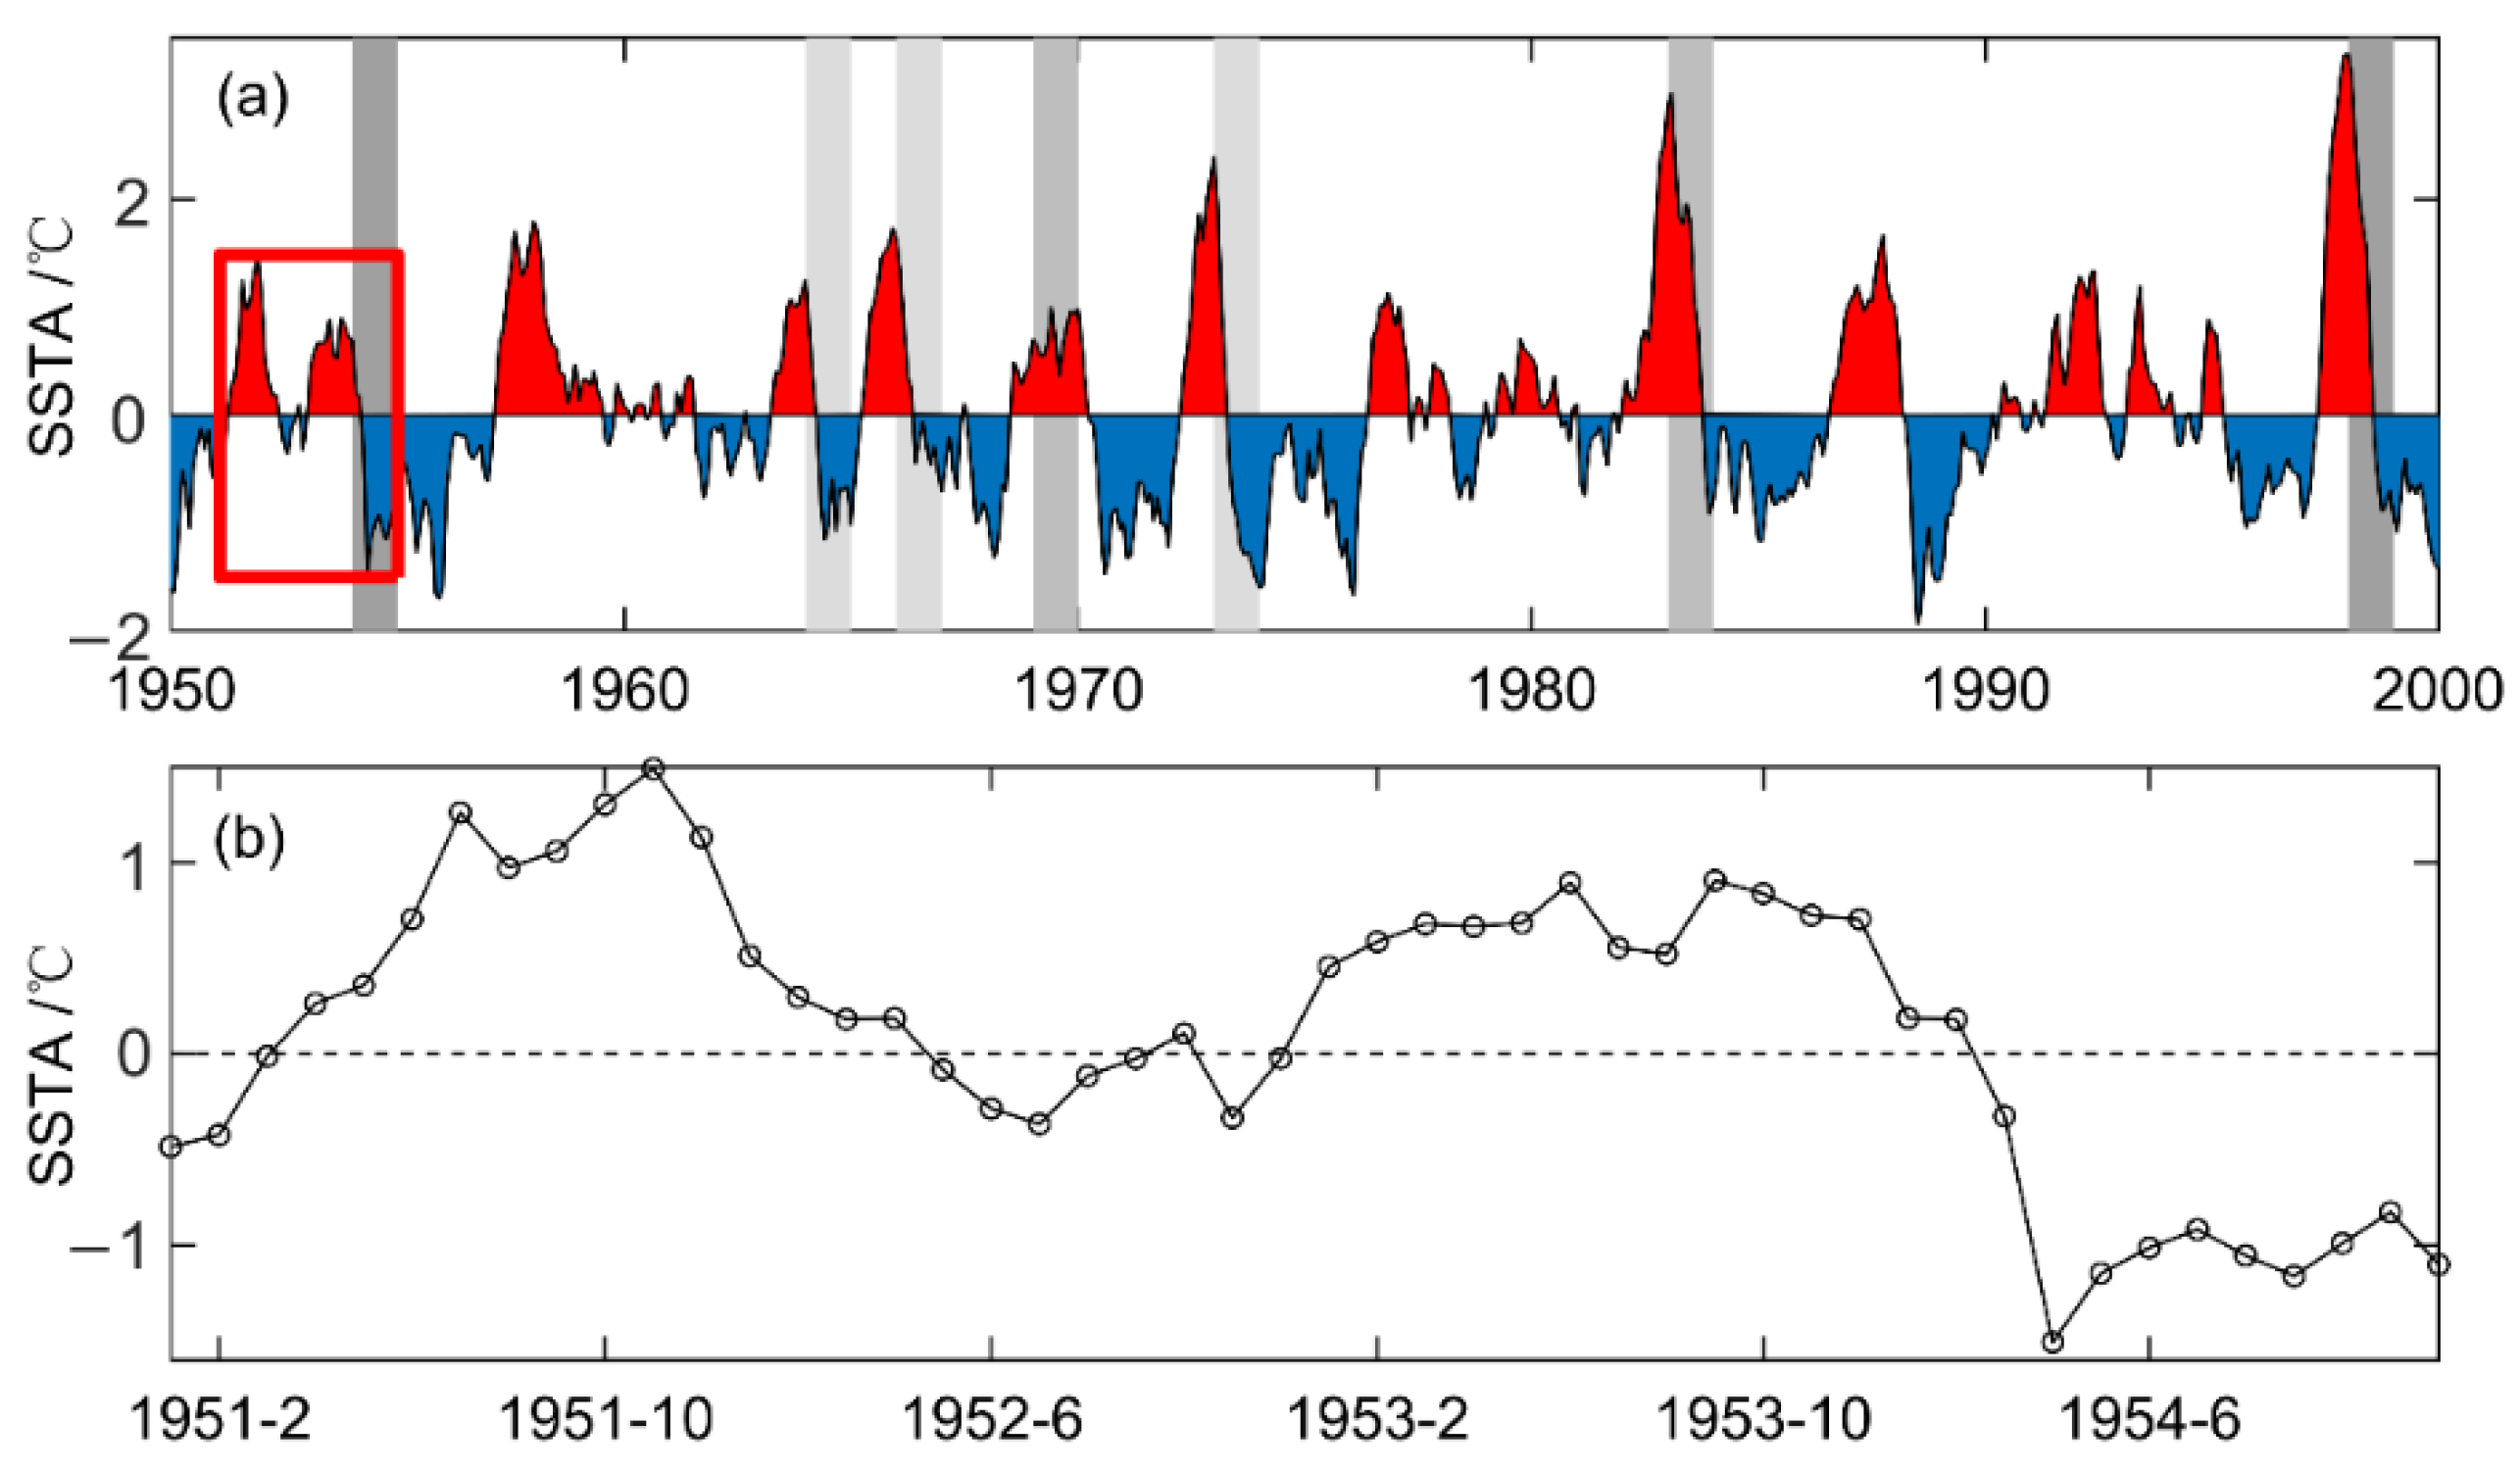
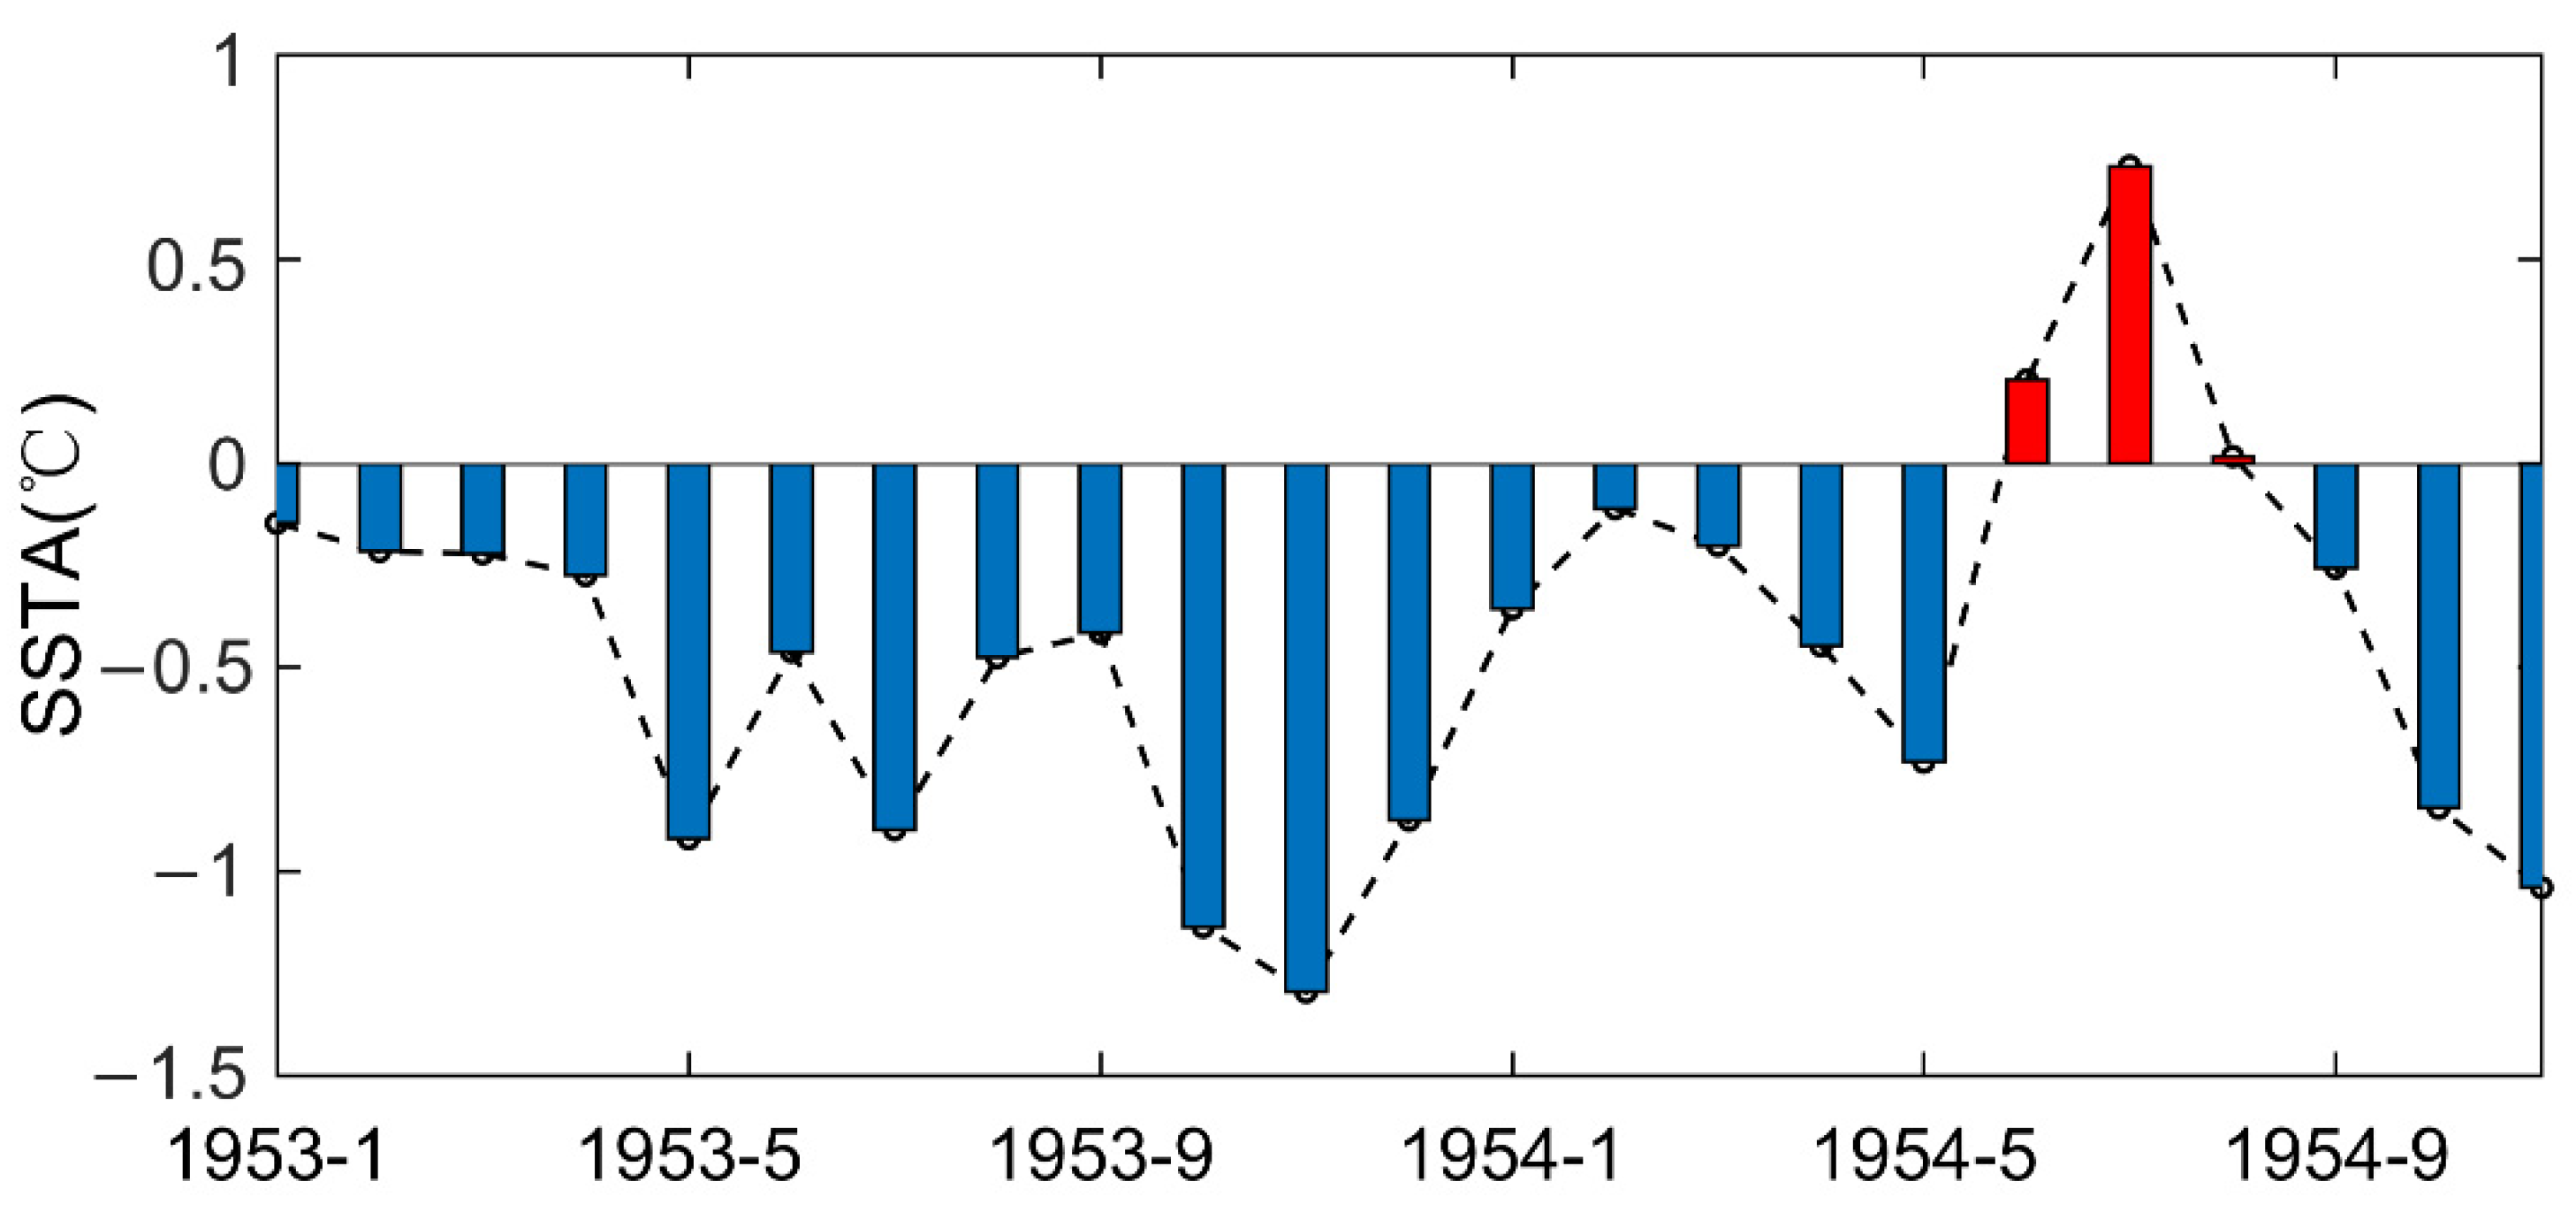
4.1. The 1953–1954 El Niño–Southern Oscillation

The El Niño–Southern Oscillation (ENSO) is a coupled climate phenomenon. El Niño refers to the unusual warming of surface waters on a large scale in the tropical Pacific Ocean; whereas, southern oscillation refers to the negatively correlated “seesaw” changes in tropical sea level pressure in the tropical region between the West and East Pacific Ocean, as well as the resulting phenomenon of strengthening or weakening of the easterly wind in the tropical Pacific. These two situations actually represent different phases of the same phenomenon, namely ENSO [30]. ENSO events have a great impact on the precipitation over the Yangtze River valley in China [11,12,13]. Some studies show that the floods in the Yangtze River valley are closely related to ENSO events [31,32,33].
Figure 2 displays the SSTA distribution over the Pacific Ocean in 1953. The SST rise extended from the equatorial Pacific region to areas near the coasts of Mexico in North America, and Peru in South America. Additionally, Southeast Asia, the eastern coast of China, Japan, and the mid-latitude Pacific region to the east of Japan witnessed an SST rise. Near the high-latitude Sea of Okhotsk, the SST level was low.
The intensity of El Niño is represented using the SSTA index and is monitored in various key regions, of which the NINO3 region has the closest relation to the precipitation in China [34]. Figure 3a reveals the SSTAs in the NINO3 region from 1950 to 2000. In 1953, the NINO3 index (Figure 3b) measured a maximum SSTA value of 1.5 °C, suggesting that 1953’s El Niño was less intense compared with those of other years. Nevertheless, Figure 3a reveals a rising trend of El Niño intensity since the 1960s [35]. The El Niño event of 1951–1953 is no less intense than its counterparts that occurred a decade beforehand and a decade later.
The 1951–1954 SSTA (higher than average conditions) continued for a long time. SSTs became higher than average starting in April 1951, peaked before temporarily dropping to the short-term slight negative anomaly, and quickly returned to increasing afterwards—such a double-peaked anomaly continued for 31 months. The SSTs in 1953 were relatively high, with a double-summit SSTA pattern (i.e., the later anomaly occurred immediately after the first), causing an extended period of El Niño-induced SSTAs.
An ENSO-induced SSTA often leads to anomalies of the West Pacific subtropical high (WPSH) [14,15,16]. Subtropical high anomalies played a critical role in 1954. In the 500-hPa geopotential height graph in the summer of 1954 (Figure 4a), the location of the 588-dagpm contour is that of the WPSH. The location of the subtropical high in 1954 was clearly further south than during average conditions, and the subtropical-high ridge line was stably located in the 20N–25N region. In 1954, the ridge line first moved north in May, which was earlier than in previous years. The second subtropical high northward jump did not appear until August, which was delayed by 20 days compared with previous data. The WPSH area index was relatively small in 1954 and even smaller than the multiyear average, yet the westernmost ridge point was further west than ever during that year. It is clearer in Figure 4b that the SSTAs in the equatorial Pacific induced positive geopotential height anomalies in the South China Sea, indicating anomalous anticyclonic circulation over this region. These characteristics were conducive to the transport of moist and warm airflows from the Indian Ocean in the southwest toward the mid- and low-Yangtze areas [22,24].
Between May and July, the WPSH stably moved between 20N and 25N, causing wet and warm air to move toward the Yangtze River valley and precipitation to be maintained around the mid- and low-Yangtze areas along the river.

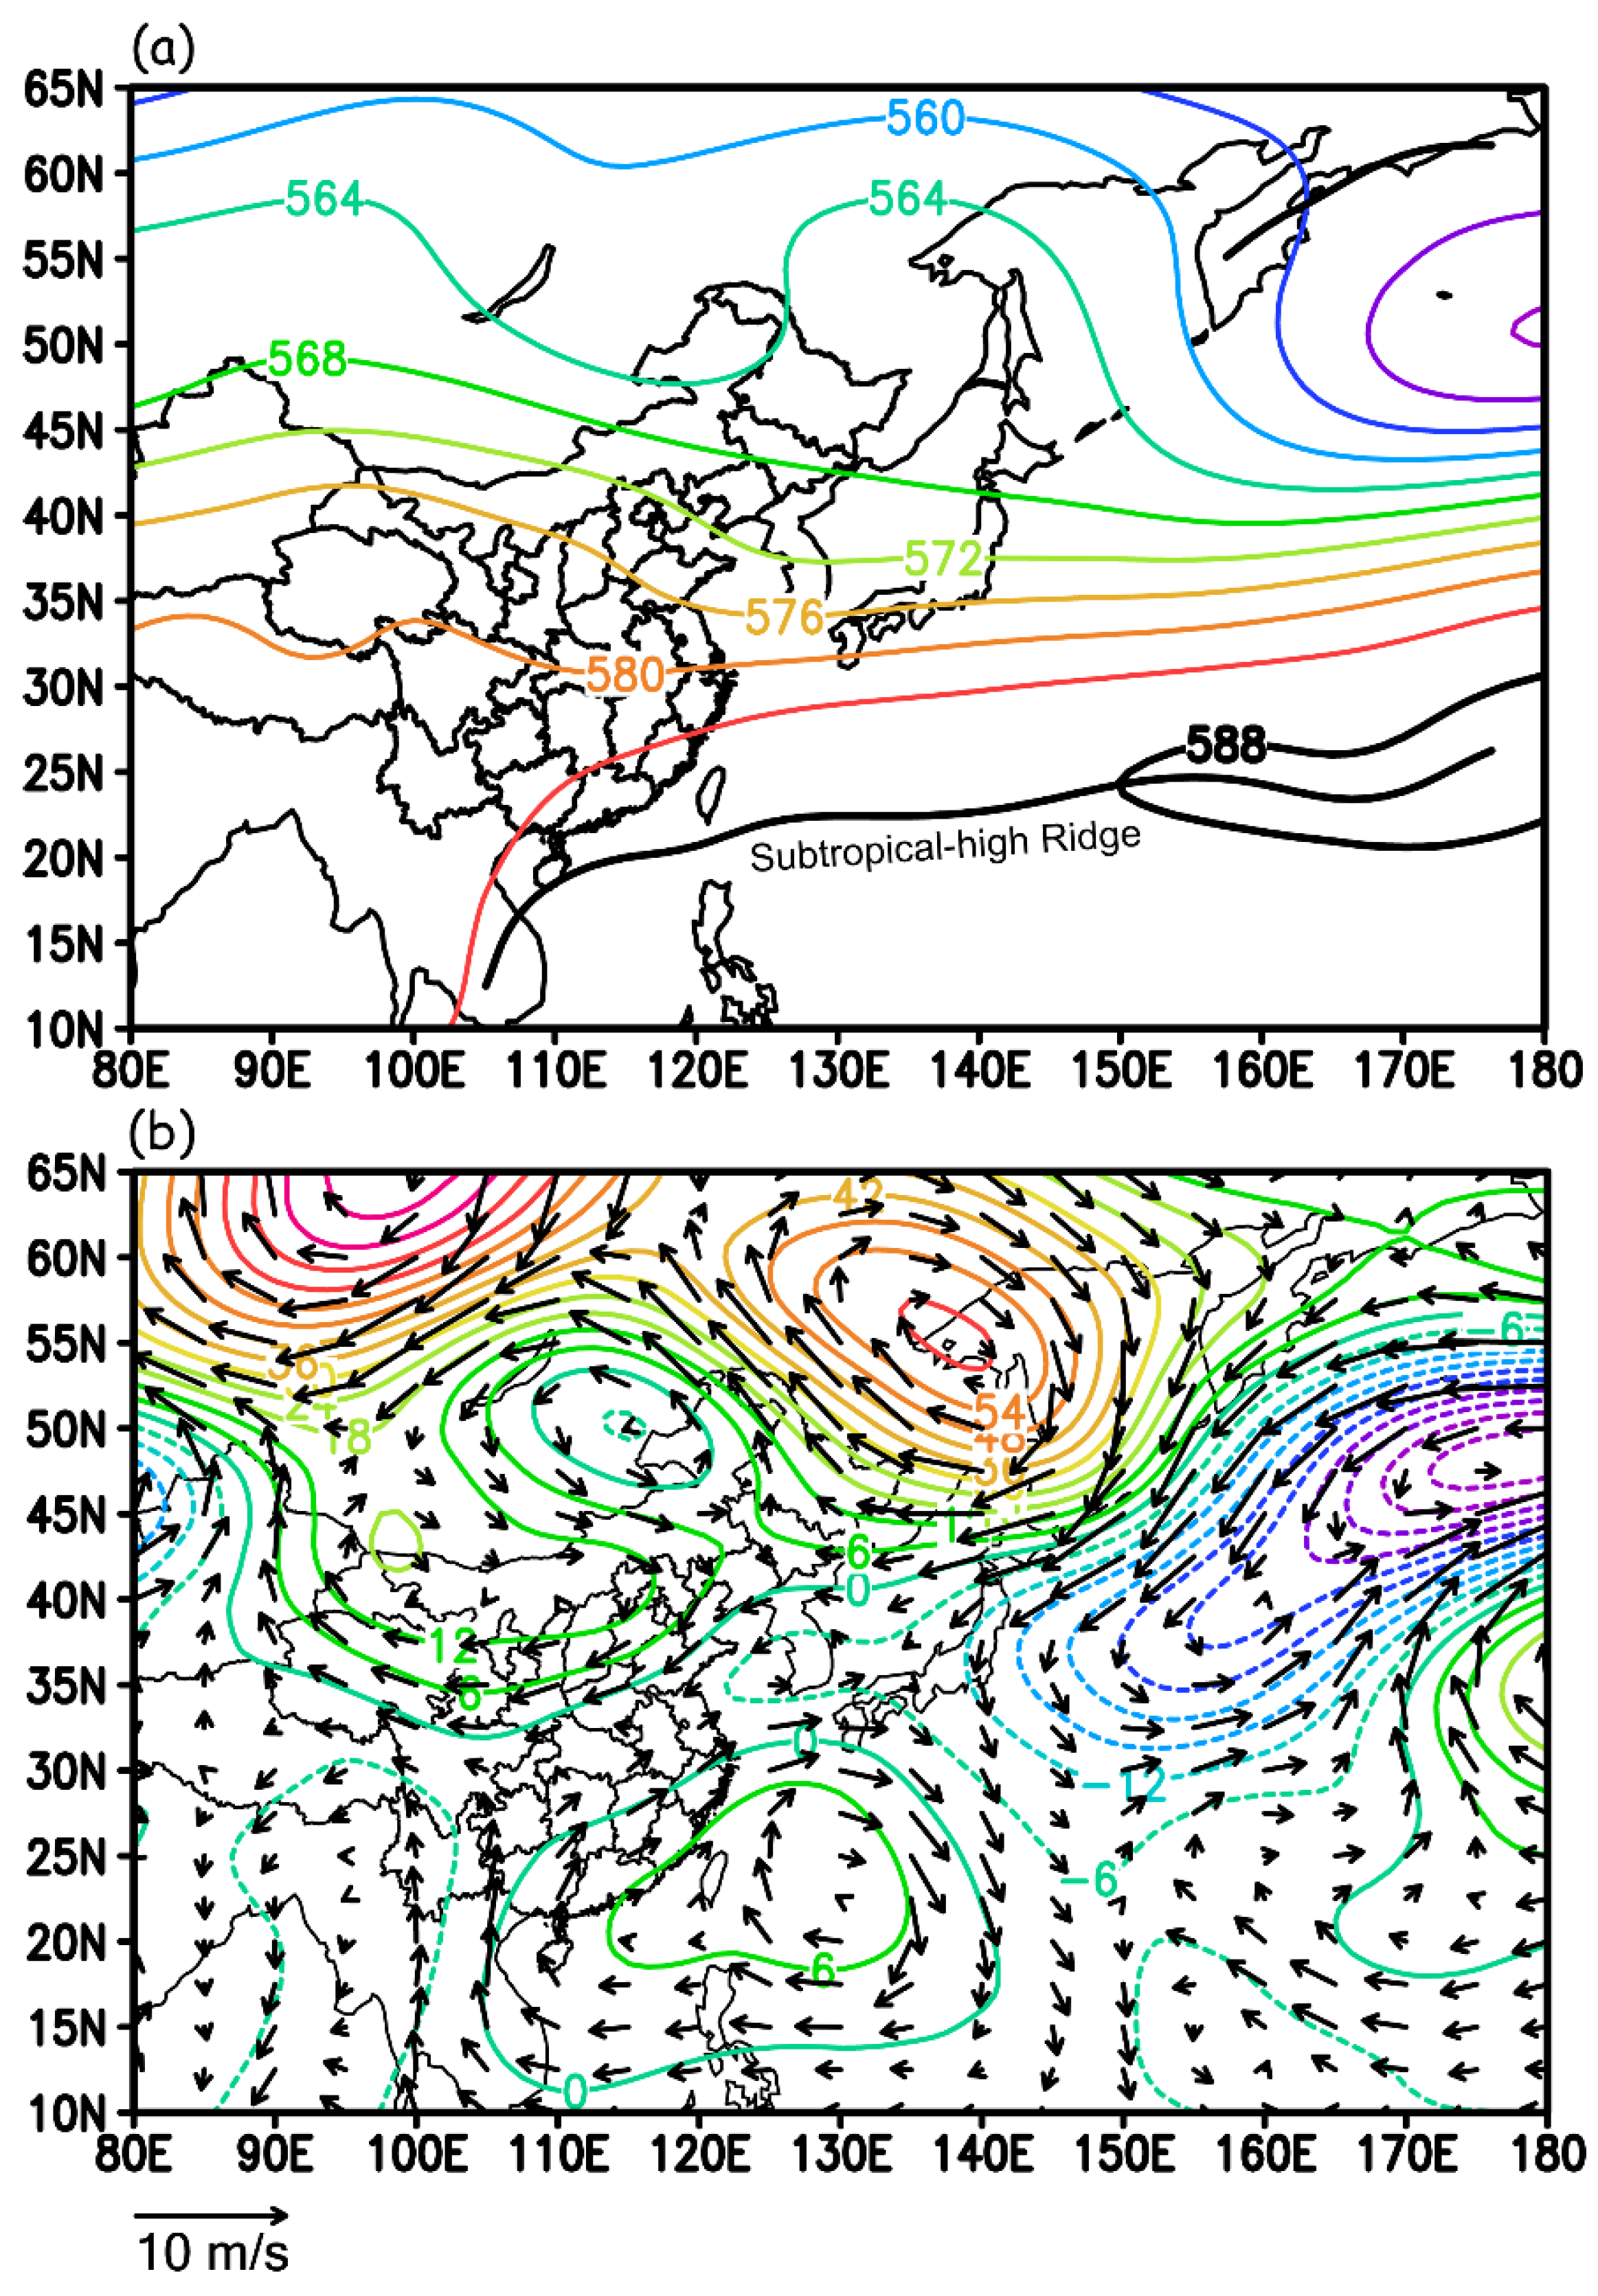
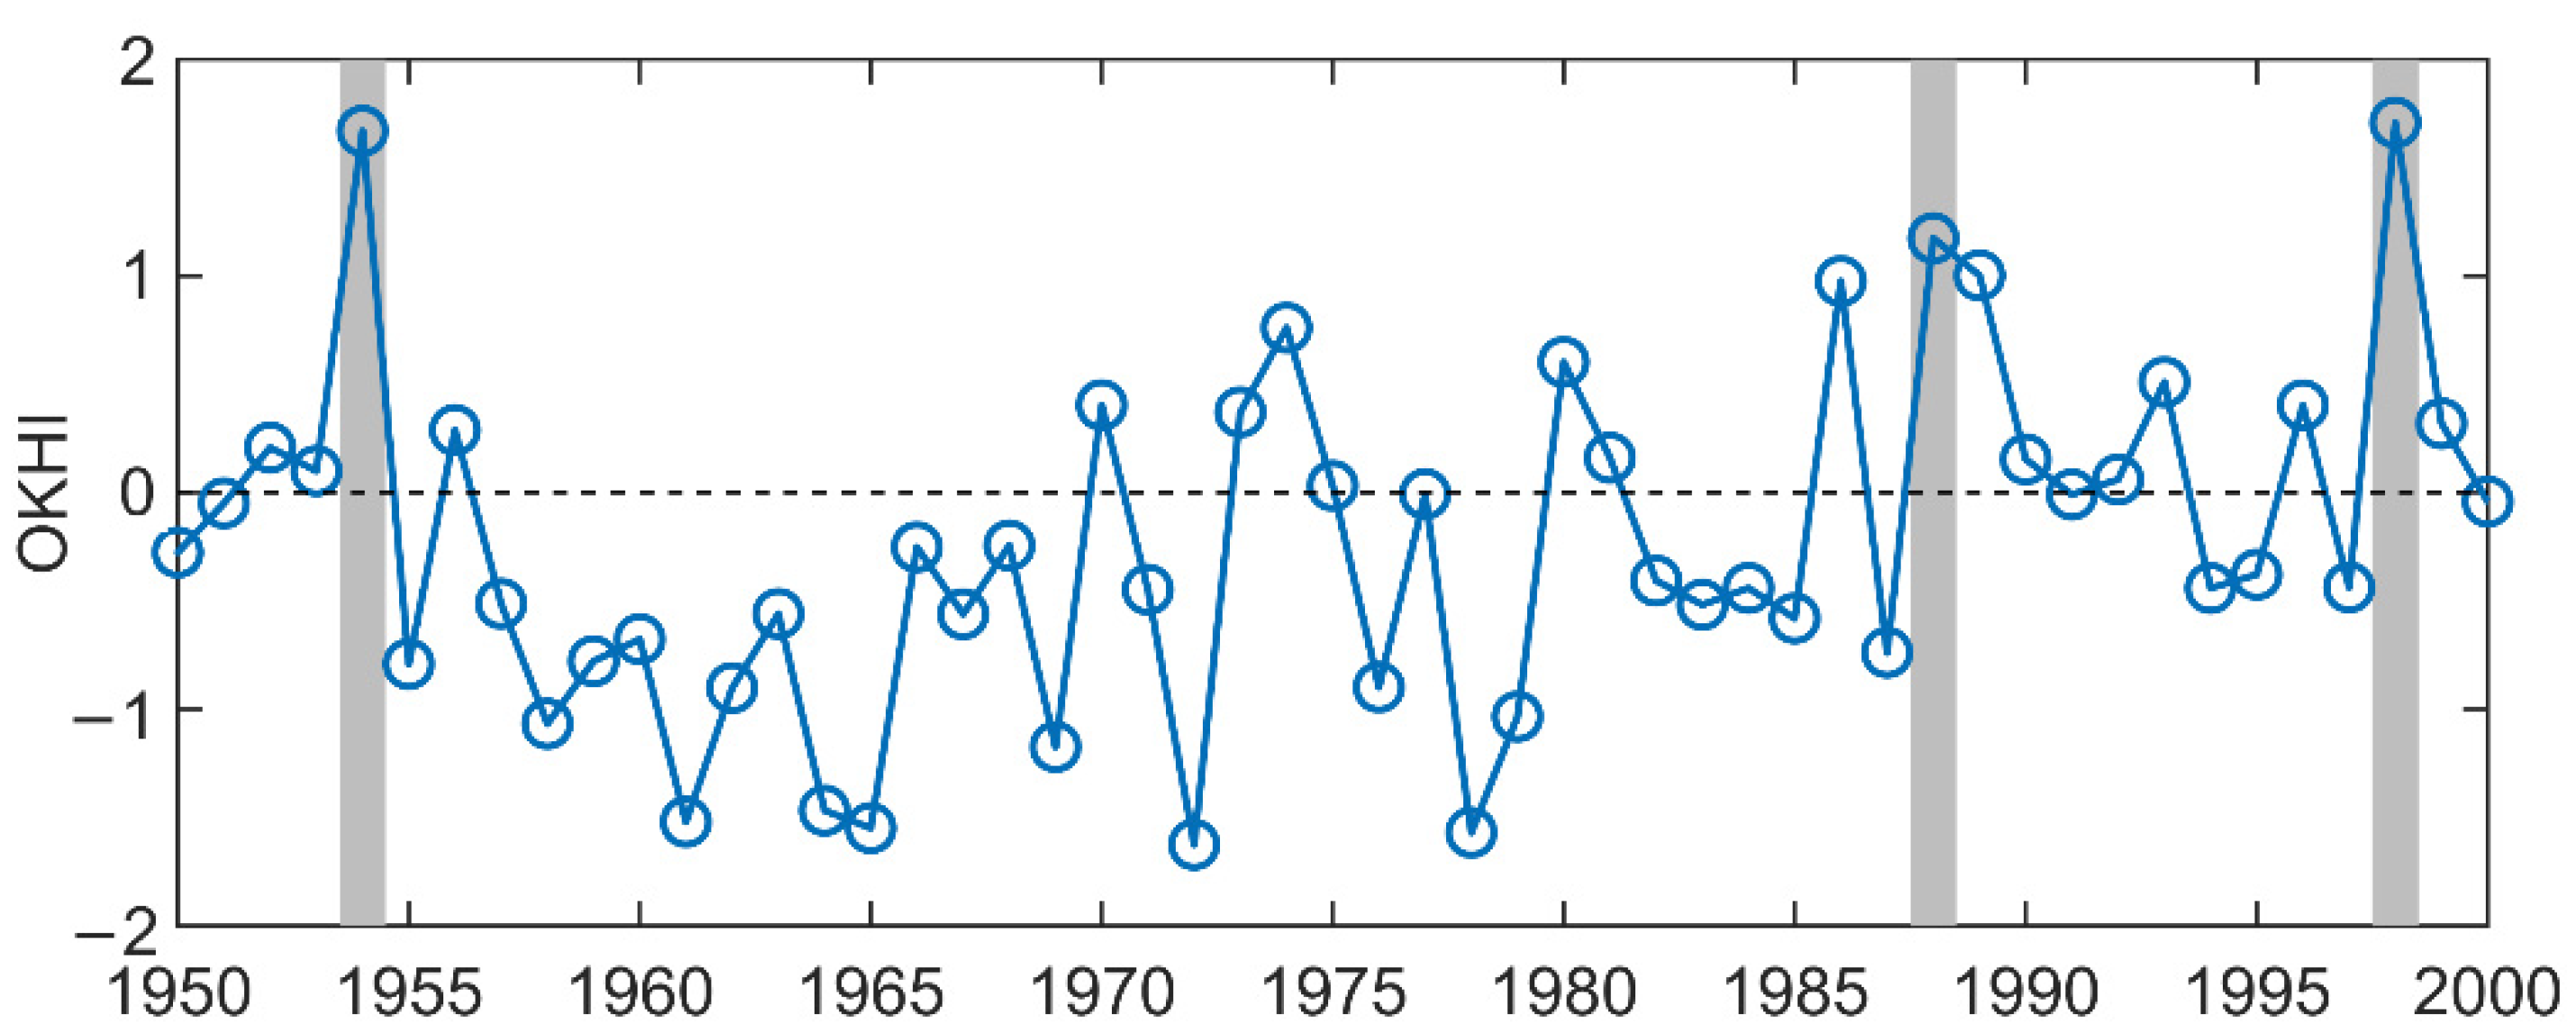
4.2. SSTAs of the Sea of Okhotsk

In addition to the southward shift of the WPSH ridge line, Figure 4b exhibits another characteristic: a blocking high hovering over the east of Siberia, Russia, and the Sea of Okhotsk. Describing the mechanism behind the formation of this blocking high, Lu (1954) confirmed that when SSTs of the region between the Sea of Okhotsk and Bering Sea were low with abundant sea surface ice [23], a blocking high can easily develop and sustain over the Sea of Okhotsk. Conducting potential vorticity inversion, Hisashi et al. (2004) proved that the cold Okhotsk Sea surface is necessary for highs to develop in this region [36]. The difference between the high temperature land surface and low SST in the Okhotsk region can cause cold advection with east wind anomalies, thus inducing the development of blocking highs. In the fall and winter of 1953, positive SSTAs of the central and eastern equatorial Pacific region were a typical phenomenon of El Niño. In 1954, the relatively low SSTAs in the central and eastern equatorial Pacific Ocean, as well as the high SSTAs in the Philippine Sea area, were both conducive to the formation and maintenance of highs over the Sea of Okhotsk [37].
Another study clarified that when a high is formed over the Sea of Okhotsk and becomes stable, the precipitation throughout the Yangtze River valley tends to be higher than average during the East Asian rainy season [38]. Wang’s research work [39] also specified that following the development of an Okhotsk Sea high a wave train is generated, which moves from the Sea of Okhotsk to subtropics throughout the east of Japan. The dissemination of this wave train then forms a cyclonic circulation centered on the sea surface to the east of Japan. This circulation is a crucial factor in weakening the northward shift of the WPSH, causing the subtropical high to move southward and remain there for nearly 3 months.
Figure 2 reveals that the SSTs in the Sea of Okhotsk region were unusually low in 1953, whereas the SSTs in regions of the central and eastern equatorial Pacific were relatively high. Figure 5 shows the SSTAs in the Sea of Okhotsk region from 1953 to 1954. SSTAs were continually present in the region between January 1953 and May 1954, with the annual SSTs averaging −0.61 °C in 1953 (the lowest SST is −1.3 °C). As shown in Figure 2, the usually low SSTs continued a necessary condition of blocking high formation. In 1954, El Niño turned into La Niña, during which time the central and eastern equatorial Pacific SSTAs switched from positive to negative, fostering the development and maintenance of a blocking high in the Sea of Okhotsk.
The standardized anomalies of average monthly 500-hPa geopotential heights within the region of 120E–150E, 50N–60N were defined as the Okhotsk high index (OKHI). The index represents the activity level of a blocking high. An OKHI ≥ 1.0 indicates that the geopotential height anomaly exceeds the mean by 1 standard deviation, suggesting that the blocking high in question is active. Figure 6 presents the time series of OKHIs. In 1954, the Okhotsk high was of substantially high intensity and peaked in June and July. This trend was consistent with the corresponding peak precipitation values. Intense Okhotsk highs brought the cold air branches in the mid-latitude westerlies southward to the Yangtze River valley, causing extended precipitation in the area.

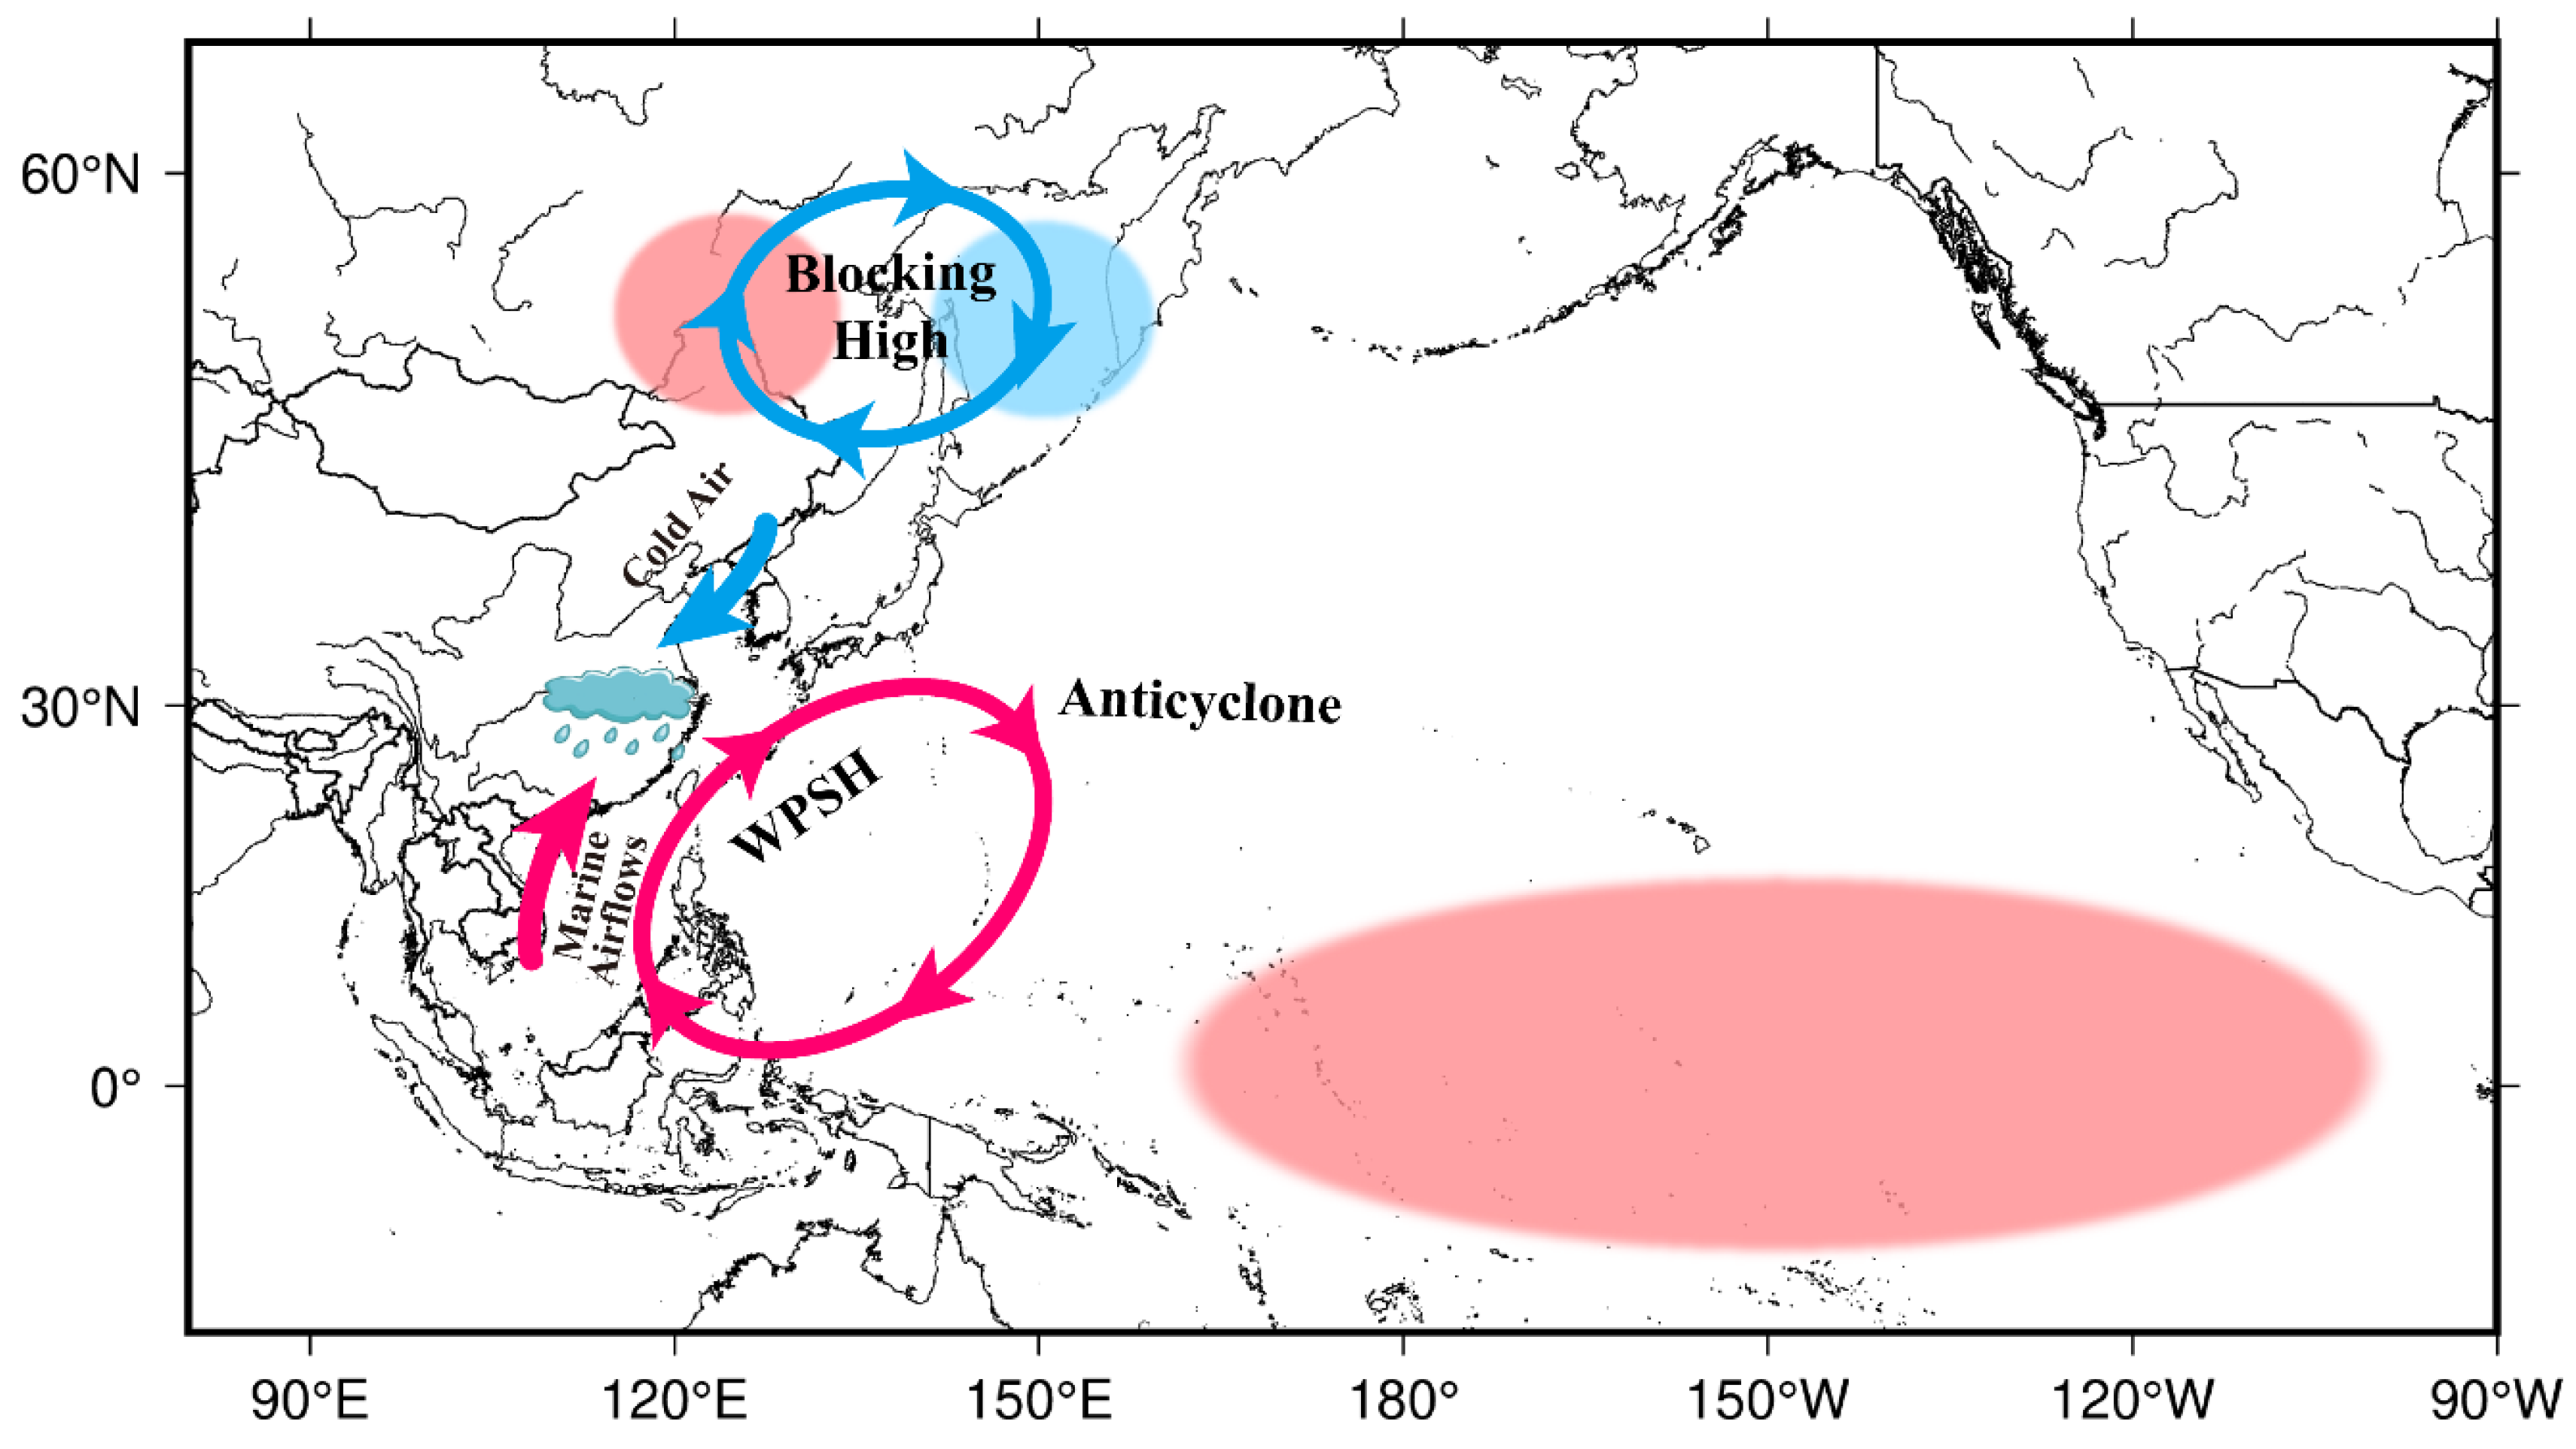
5. Precipitation Anomaly Causal Model

Numerous studies have proven that Pacific SSTAs are closely associated with the formation of AC anomalies [14, 15, 16, 36; 37]. Notably, SSTAs occur earlier than AC anomalies; therefore, SSTAs have been widely recognized as an indicator of unusual AC [40,41,42]. For example, Pacific SSTAs have become a crucial indicator for researchers seeking to predict summertime AC anomalies and precipitation in the Yangtze River valley [17, 18].
On the basis of SSTAs and previous data analysis results, we traced the unusual precipitation process back to 1954, and proposed a causal model of SSTAs affecting precipitation. Figure 7 presents the schematic diagrams showing the circulation anomalies associated with SST anomalies. Between the fall of 1953 and the spring of 1954, the El Niño recession generated abnormal convection activities across the Philippines, resulting in anticyclones at the bottom of the troposphere in the region and southward shifts of WPSHs.
An extended period of cold SSTAs was detected near the mid and high latitudes of the Sea of Okhotsk in contrast to the high temperature of the land surface, which led to the formation of a blocking high. Moreover, the lowered central and eastern Pacific SSTAs strengthened the potential energy of the Okhotsk blocking high. The formation of such a blocking high also weakened the northward shift of the WPSH, causing it to continue retreating southward. Southward shifts of summertime subtropical highs and the blocking high over the Sea of Okhotsk jointly and continually brought warm and moist airflows from over the sea, as well as high-latitude cold air into the drainage basin of the Yangtze. Consequently, an unusually high volume of precipitation occurred during the summer in said drainage basin in 1954.
Figure 3a shows that many flood disasters occurred during the recession of ENSO events, and when the Okhotsk high was also active in that year (Figure 6), the superposition effect of two anomalies may have intensified the precipitation and generated massive flood disasters. There are three years that the blocking high in Okhotsk is active: 1954, 1988, and 1998. Severe flood disasters also occurred in 1954 and 1998; both floods caused large casualties and economic losses [43]. Similar to the 1954 Yangtze floods, studies have reported that the 1998 precipitation anomalies in the Yangtze River valley were accompanied by the El Niño event and active Okhotsk highs (Figure 3a, Figure 6) [44,45,46]. Although the 1998 El Niño was more intense and rapid than in 1954, the circulation anomalies caused by it are similar [24]. There was an El Niño event in 1988, and its intensity was similar to that of 1954, which was relatively weak; however, it did not cause strong anomalies of the WPSH. Therefore, the precipitation in 1988 was relatively normal in spite of the existence of the Okhotsk blocking high. We speculate that the Okhotsk blocking high will enormously intensify the precipitation anomalies caused by El Niño events, resulting in extreme precipitation events.
The common meteorological background of 1954 and 1998 demonstrated that the causal model shown in Figure 7 is not particular, but a general pattern of anomalies prone to generate severe flood disasters; therefore, such a causal model can be used as a forecast tool for future severe flood disasters in the Yangtze River valley.

6. Conclusions

The 1954 precipitation anomalies were characterized by high total rainfall, an extended period of rainfall and numerous cloudbursts, with the rain mostly occurring during June and July. The total rainfall along the mid- and low-Yangtze areas of the Yangtze exceeded 1500 mm between April and July, which was roughly double the volume under average conditions in previous years; furthermore, heavy rainbands were extremely widespread.
The analysis revealed that between 1951 and early 1954, the SSTs near the eastern equatorial Pacific were unusually high, indicating the presence of El Niño. The El Niño event then led to an anomalous anticyclonic circulation in the summer of 1954, affecting the WSPH and the precipitation throughout the Yangtze River valley. Furthermore, the continued low SST of the Sea of Okhotsk between 1953 and 1954 generated a blocking high over the sea during the flood season. This blocking high prompted cold air at high latitudes to move southward continually, where it met moist and warm airflows over the sea, finally triggering continuous precipitation. The superposition effect of the above two anomalies intensified the precipitation and generated a severe flood disaster in the Yangtze River valley.
This study proposed a causal model of extreme summertime precipitation in the Yangtze River valley in 1954. The unusual changes in SSTs first resulted in AC anomalies, which caused the unusually heavy rainfall that year. This model indicated a pattern of anomalies prone to generate severe flood disasters in the Yangtze River valley, and thus can be used as a forecast tool for future severe flood disasters in this region.

Supplementary Materials

The following supporting information can be downloaded at: www.mdpi.com/article/10.3390/rs14030555/s1, Figure S1: (a) Precipitable water across the Yangtze river valley during April–July of 1954 based on NCEP/NCAR reanalysis. (b) Precipitation across the Yangtze river valley during April–July of 1954 based on ground station dataset. Figure S2: (a) Precipitable water anomalies across the Yangtze river valley during April–July of 1954 based on NCEP/NCAR reanalysis. (b) Precipitation anomalies across the Yangtze river valley during April–July of 1954 based on ground station dataset.

Author Contributions

Conceptualization, J.C. and S.Z.; methodology, M.L.; software, Y.Z. and Y.W.; validation, J.C. and Y.Z.; formal analysis, J.C. and S.Z.; investigation, J.C.; resources, S.Z.; data curation, P.X.; writing—original draft preparation, J.C.; writing—review and editing, S.Z. and Y.Z.; visualization, J.C. and M.L.; supervision, S.Z.; project administration, S.Z.; funding acquisition, S.Z. All authors have read and agreed to the published version of the manuscript.

Funding

This research was funded by the National Key R&D Program of China (grant number 2020YFC1512401) and the National Natural Science Foundation of China (grant number 42074176, 41874169, U1939204).

Institutional Review Board Statement

Not applicable.

Informed Consent Statement

Not applicable.

Data Availability Statement

Publicly available datasets were analyzed in this study. The ground station precipitation data presented in this study can be found here: [data.cma.cn]. The NOAA Extended Reconstructed SST V5 dataset and the NCEP/NCAR dataset can be found here: https://psl.noaa.gov/data/gridded/ accessed on 1 October 2021.

Acknowledgments

The authors would like to thank the editors and anonymous reviewers for their constructive suggestions.

Conflicts of Interest

The authors declare no conflict of interest.

References

  1. Xiaoxia, Z.; Yihui, D.; Panxing, W. Moisture Transpotr in Asian Summer Monsoon Region and its Relationship with Summer Precipitation in China. Acta Meteorol. Sin. 2008, 66, 59–70. (In Chinese) [Google Scholar]
  2. Jena, P.P.; Chatterjee, C.; Pradhan, G.; Mishra, A. Are recent frequent high floods in Mahanadi basin in eastern India due to increase in extreme rainfalls? J. Hydrol. 2014, 517, 847–862. [Google Scholar] [CrossRef]
  3. Wu, C.; Huang, G. Changes in heavy precipitation and floods in the upstream of the Beijiang River basin, South China. Int. J. Climatol. 2015, 35, 2978–2992. [Google Scholar] [CrossRef]
  4. Houze, R.A.; Rasmussen, K.L.; Medina, S.; Brodzik, S.R.; Romatschke, U. Anomalous atmospheric events leading to the summer 2010 floods in Pakistan. Bull. Am. Meteorol. Soc. 2011, 92, 291–298. [Google Scholar] [CrossRef]
  5. Khaing, Z.M.; Zhang, K.; Sawano, H.; Shrestha, B.B.; Sayama, T.; Nakamura, K. Flood hazard mapping and assessment in data-scarce Nyaungdon area, Myanmar. PLoS ONE 2019, 14, e0224558. [Google Scholar] [CrossRef] [PubMed] [Green Version]
  6. Li, X.; Zhang, K.; Gu, P.; Feng, H.; Yin, Y.; Chen, W.; Cheng, B. Changes in precipitation extremes in the Yangtze River Basin during 1960–2019 and the association with global warming, ENSO, and local effects. Sci. Total Environ. 2021, 760, 144244. [Google Scholar] [CrossRef] [PubMed]
  7. Lü, M.; Wu, S.J.; Chen, J.; Chen, C.; Wen, Z.; Huang, Y. Changes in extreme precipitation in the Yangtze River basin and its association with global mean temperature and ENSO. Int. J. Climatol. 2018, 38, 1989–2005. [Google Scholar] [CrossRef]
  8. Ji, Z.; Shan, H. Threshold diagnosis and hazard dangerousness evaluation for the disaster of drought-flood abrupt alternation in the middle and lower reaches of the Yangtze River. Resour. Environ. Yangtze Basin 2015, 24, 1713–1717. (In Chinese) [Google Scholar]
  9. Wu, Z.; Li, J.; He, J.; Jiang, Z. Large-scale atmospheric singularities and summer long-cycle droughts-floods abrupt alternation in the middle and lower reaches of the Yangtze River. Chin. Sci. Bull. 2006, 51, 2027–2034. (In Chinese) [Google Scholar] [CrossRef]
  10. Yang, S.; Wu, B.; Zhang, R.; Zhou, S. Relationship between an abrupt drought-flood transition over mid-low reaches of the Yangtze River in 2011 and the intraseasonal oscillation over mid-high latitudes of East Asia. Acta Meteorol. Sin. 2013, 27, 129–143. [Google Scholar] [CrossRef]
  11. Ronghui, H.; Yifang, W. The Influence of ENSO on the Summer Climate Change in China and Its Mechanism. Adv. Atmos. Sci. 1989, 6, 21–32. [Google Scholar] [CrossRef]
  12. Wang, B.; Wu, R.; Fu, X. Pacific–East Asian Teleconnection: How Does ENSO Affect East Asian Climate? J. Clim. 2000, 13, 1517–1536. [Google Scholar] [CrossRef]
  13. Zhang, R.; Sumi, A.; Kimoto, M. A Diagnostic Study of the Impact of El Nino on the Precipitation in China. Adv. Atmos. Sci. 1999, 16, 229–241. [Google Scholar] [CrossRef]
  14. Huang, R.; Sun, F. Impacts of the tropical western Pacific on the East Asian summer monsoon. J. Meteorol. Soc. Jpn. Ser. II 1992, 70, 243–256. [Google Scholar] [CrossRef] [Green Version]
  15. Zhang, R.; Sumi, A.; Kimoto, M. Impact of El Niño on the East Asian monsoon a diagnostic study of the’86/87 and’91/92 events. J. Meteorol. Soc. Jpn. Ser. II 1996, 74, 49–62. [Google Scholar] [CrossRef] [Green Version]
  16. Lau, K.; Wu, H. Principal modes of rainfall–SST variability of the Asian summer monsoon: A reassessment of the monsoon–ENSO relationship. J. Clim. 2001, 14, 2880–2895. [Google Scholar] [CrossRef]
  17. Qingcun, Z.; Zhaohui, L.; Guangqing, Z. Dynamical extraseasonal climate prediction system IAP DCP-II. Chin. J. Atmos. Sci.-Chin. Ed. 2003, 27, 289–303. (In Chinese) [Google Scholar]
  18. Ding, Y.H.; Li, Q.Q.; Li, W.J.; Luo, Y.; Zhang, P.Q.; Zhang, Z.Q.; Shi, X.L.; Liu, Y.M.; Wang, L. Advance in Seasonal Dynamical Prediction Operation in China. Acta Meteorol. Sin. 2004, 62, 598–612. (In Chinese) [Google Scholar]
  19. Xue, F.; Liu, C. The influence of moderate ENSO on summer rainfall in eastern China and its comparison with strong ENSO. Chin. Sci. Bull. 2008, 53, 791–800. [Google Scholar] [CrossRef]
  20. Feng, L.H.; Chen, L.R. Three Large Floods along the Yangtze River in the 20th Century. J. Nat. Disasters 2001, 10, 8–11. (In Chinese) [Google Scholar]
  21. Lihua, F.; Xiong, C. Superposition Function of Physical Factor in Super-Huge Flood along the Changjiang River in 1954. Sci. Geogr. Sin. 2004, 24, 753–756. (In Chinese) [Google Scholar]
  22. Hanyao, C. Circulation Characteristics During the Flood in Yangtze and Hwai-ho Valleys 1954. Acta Meteorol. Sin. 1957, 28, 3–14. (In Chinese) [Google Scholar]
  23. Jiong, L. Sea Ice and Climate. Acta Geogr. Sin. 1954, 20, 83–94. (In Chinese) [Google Scholar]
  24. Shuyi, C.; Yuean, L. Compared Analysis of Large-scale Circulation Characteristics in Summer between 1998 and 1954. Meteorol. Mon. 2000, 26, 38–42. (In Chinese) [Google Scholar]
  25. Administration, C.M. Daily Data Set of Surface Climate Data in China (V3.0); Institute of Tibetan Plateau Research: Beijing, China, 2012. [Google Scholar]
  26. Huang, B.; Thorne, P.W.; Banzon, V.F.; Boyer, T.; Chepurin, G.; Lawrimore, J.H.; Menne, M.J.; Smith, T.M.; Vose, R.S.; Zhang, H.M. NOAA Extended Reconstructed Sea Surface Temperature (ERSST), Version 5. 2020-9; NOAA National Centers for Environmental Information: Boston, MA, USA, 2017. [Google Scholar]
  27. Kalnay, E.; Kanamitsu, M.; Kistler, R.; Collins, W.; Deaven, D.; Gandin, L. The NCEP/NCAR 40-Year Reanalysis Project: March, 1996. Bull. Am. Meteorol. Soc. 1994, 77, 437–471. [Google Scholar] [CrossRef] [Green Version]
  28. Yun, S.; Licheng, L. Catastrophic Flood in the Yangtze River Valley in 1954. Meteorol. Knowl. 2004, 3, 11–15. (In Chinese) [Google Scholar]
  29. Zhengfu, X. Retrospect of Flood Control in the Yangtze River 1954 and Prospect. China Flood Drought Manag. 2004, 3, 23–31. (In Chinese) [Google Scholar]
  30. Bjerknes, J. Atmospheric teleconnections from the equatorial Pacific. Mon. Weather Rev. 1969, 97, 163–172. [Google Scholar] [CrossRef]
  31. Tong, J.; Qiang, Z.; Deming, Z.; Yijin, W. Yangtze floods and droughts (China) and teleconnections with ENSO activities (1470–2003). Quat. Int. 2006, 144, 29–37. [Google Scholar] [CrossRef]
  32. Zhang, Q.; Xu, C.Y.; Jiang, T.; Wu, Y. Possible influence of ENSO on annual maximum streamflow of the Yangtze River, China. J. Hydrol. 2007, 333, 265–274. [Google Scholar] [CrossRef]
  33. Zhang, W.; Jin, F.F.; Stuecker, M.F.; Wittenberg, A.T.; Timmermann, A.; Ren, H.L.; Kug, J.S.; Cai, W.; Cane, M. Unraveling El Niño’s impact on the East Asian monsoon and Yangtze River summer flooding. Geophys. Res. Lett. 2016, 43, 11375–11382. [Google Scholar] [CrossRef]
  34. Administration, C.M. QX/T 370—2017 Identification Method for El Niño/La Niña Events [S]; Meteorological Press: Beijing, China, 2017. [Google Scholar]
  35. Cai, W.; Wang, G.; Dewitte, B.; Wu, L.; Santoso, A.; Takahashi, K.; Yang, Y.; Carréric, A.; McPhaden, M.J. Increased variability of eastern Pacific El Niño under greenhouse warming. Nature 2018, 564, 201–206. [Google Scholar] [CrossRef] [PubMed]
  36. Nakamura, H.; Fukamachi, T. Evolution and dynamics of summertime blocking over the Far East and the associated surface Okhotsk high. Q. J. R. Meteorol. Soc. 2004, 130, 1213–1233. [Google Scholar] [CrossRef]
  37. Dong, W.; Yafei, W.; Min, D. Effects of sea surface temperature anomalies off the east coast of Japan on development of the Okhotsk High. Acta Meteorol. Sin. 2007, 21, 234. [Google Scholar]
  38. Wang, Y. Effects of blocking anticyclones in Eurasia in the rainy season (Meiyu/Baiu season). J. Meteorol. Soc. Jpn. Ser. II 1992, 70, 929–951. [Google Scholar] [CrossRef] [Green Version]
  39. Yafei, W.; Yasushi, F.; Kuranoshin, K. A teleconnection pattern related with the development of the Okhotsk high and the northward progress of the subtropical high in East Asian summer. Adv. Atmos. Sci. 2003, 20, 237–244. [Google Scholar] [CrossRef]
  40. Chan, J.C.; Zhou, W. PDO, ENSO and the early summer monsoon rainfall over south China. Geophys. Res. Lett. 2005, 32. [Google Scholar] [CrossRef]
  41. Mason, S.J.; Goddard, L.; Graham, N.E.; Yulaeva, E.; Sun, L.; Arkin, P.A. The IRI seasonal climate prediction system and the 1997/98 El Niño event. Bull. Am. Meteorol. Soc. 1999, 80, 1853–1874. [Google Scholar] [CrossRef] [Green Version]
  42. Alves, O.; Balmaseda, M.A.; Anderson, D.; Stockdale, T. Sensitivity of dynamical seasonal forecasts to ocean initial conditions. Q. J. R. Meteorol. Soc. J. Atmos. Sci. Appl. Meteorol. Phys. Oceanogr. 2004, 130, 647–667. [Google Scholar] [CrossRef] [Green Version]
  43. Yu, F.; Chen, Z.; Ren, X.; Yang, G. Analysis of historical floods on the Yangtze River, China: Characteristics and explanations. Geomorphology 2009, 113, 210–216. [Google Scholar] [CrossRef]
  44. Tao, S.Y.; Zhang, Q.Y.; Zhang, S.L. The Great Floods in the Changjiang River Valley in 1998. Clim. Environ. Res. 1998, 3, 290–299. (In Chinese) [Google Scholar]
  45. Chen, G.; Li, W.; Yuan, Z.; Wen, Z. Evolution mechanisms of the intraseasonal oscillation associated with the Yangtze River Basin flood in 1998. Sci. China Ser. D Earth Sci.-Engl. Ed. 2005, 48, 957. [Google Scholar] [CrossRef]
  46. Shuanglin, L.; Liren, J.; Wantao, L.; Yunqi, N. The maintenance of the blocking over the Ural Mountains during the second Meiyu period in the summer of 1998. Adv. Atmos. Sci. 2001, 18, 87–105. [Google Scholar] [CrossRef]
Figure 1. (a) Precipitation across the Yangtze River valley during April–July of 1954; (b) rainfall anomaly rates across the Yangtze River valley during April–July of 1954; (c) precipitation percentile across the Yangtze River valley during April–July of 1954—the 90th percentile indicates that the precipitation in that year exceeded 90% of the years from 1951 to 1980—which can be used as the threshold of extreme precipitation events; (d) daily precipitation in Wuhan in 1954; (e) monthly precipitation anomalies in Wuhan in 1954. The data used in the figures are ground station precipitation data from 1951 to 1980. We converted the ground station data into contours based on the kriging method.
Remotesensing 14 00555 g001
Figure 2. Pacific sea surface temperature anomalies in 1953 based on the NOAA Extended Reconstructed SST V5 dataset [26].
Remotesensing 14 00555 g002
Figure 3. Sea surface temperature anomalies (SSTAs) in the NINO3 region: (a) SSTAs from 1950 to 2000, the shadows indicate the flood disasters that may relate to the ENSO events, grayscale represents the disaster degree; (b) SSTAs between 1951 and 1954.
Remotesensing 14 00555 g003
Figure 4. (a) The 500 hPa geopotential height in summer 1954; (b) the geopotential height (contours) and wind anomalies (vectors) in summer 1954. The data used in the figures include geopotential height data, meridional wind data, and zonal wind data in NCEP/NCAR reanalysis dataset [27].
Remotesensing 14 00555 g004
Figure 5. Sea surface temperature anomalies of the Sea of Okhotsk.
Remotesensing 14 00555 g005
Figure 6. Okhotsk high index (OKHI) in summertime from 1950 to 2000, based on the geopotential height data in NCEP/NCAR reanalysis dataset [27], the shadow indicates years that OKHI ≥ 1.0.
Remotesensing 14 00555 g006
Figure 7. Schematic diagram showing the circulation and precipitation anomalies associated with SST anomalies. WPSH—western Pacific subtropical high.
Remotesensing 14 00555 g007
Publisher’s Note: MDPI stays neutral with regard to jurisdictional claims in published maps and institutional affiliations.

