Abstract
Rice height, as the fundamental biophysical attribute, is a controlling factor in crop phenology estimation and yield estimation. The aim of this study was to use time series Sentinel-1A images to estimate the spatio-temporal distribution of rice height. In this study, a particle filter (PF) was applied for the real-time estimation of rice height compared with a simplified water cloud model (SWCM) on the basis of rice mapping and transplanting date. It was found that the VH backscatter () can potentially be applied to accurately estimate rice height compared with VV backscatter (), the / ratio, and the Radar Vegetation Index (RVI, 4* /(+)). The results show that the rice height estimation by PF generated a better result with a root-mean-square error (RMSE) equal to 7.36 cm and a determination factor (R) of 0.95 compared with SWCM (RMSE = 12.59 cm and R = 0.86). Moreover, rice height in the south and east of the study area was higher than in the north and west. The reason for this is that the south and east are near to the South China Sea, and there are higher temperatures and earlier transplanting. Altogether, our results demonstrate the potential of PF and to study the spatio-temporal distribution of crop height estimation. As a result, the PF method can contribute greatly to improvements in crop monitoring.
1. Introduction
Rice, as one of the most important crops, has a great impact not only on food security, but also on water resource management and climate change. For instance, global rice consumption has increased in general since the 1960s [1], and rice fields consume a large amount of water and release methane gas and carbon dioxide gas [2]. Moreover, rice height, as the fundamental biophysical attribute, is a controlling factor in crop phenology estimation, yield estimation and rice scattering models. Remote sensing technology can be applied for the retrieval of rice height at a regional or even a global scale, which requires less manpower and is less expensive than conventional technology. Moreover, the synthetic aperture radar (SAR) has all-time and all-weather observation capabilities and is sensitive to the geometric features of scatterers. Thus, Sentinel-1 images with a fine spatio-temporal scale are used for rice height estimation in our study.
There has been some research on rice height since the advent of the synthetic aperture radar (SAR). An earlier study on rice height is from Le Toan (1997) [3], which showed radar backscattering coefficients expressed as a function of rice height using multi-temporal ERS-1 images. In the years that followed, there were very few studies on rice height estimation. After 2005, studies appeared on rice height estimation with SAR images [1,4,5,6,7] or Terrestrial Laser Scanning [8,9]. With the polarimetric SAR (PolSAR) and polarimetric interferometry SAR (PolInSAR) revolutions, the research teams of Dr. Erten [10,11,12,13,14,15] and Dr. Lopez-Sanchez [16,17,18] used TanDEM-X images for rice height estimation by PolInSAR. Moreover, Sentinel-1 data have been free to download since autumn 2014; since then, many studies have been conducted on rice monitoring using time-series Sentinel-1 images due to the fine spatio-temporal scale of SAR data [19,20,21,22].
To date, canopy height estimation with SAR images has been researched in a variety of studies with various techniques, such as Radiative Transfer Theory (RTT) [13,14,23], interferometry SAR (InSAR) [11,24,25], differential interferometry (DInSAR) [10,26], polarimetric interferometry SAR (PolInSAR) [27,28,29] and tomography SAR (TOMO-SAR) [30]. RTT [13,14,23], InSAR [1,10,15] and PolInSAR [15,17,31,32] are widely used for rice height estimation. Based on the rice canopy scattering mechanism, RTT is employed to simulate rice backscatter from flooded rice fields based on the simplified structures, and then rice height is retrieved by this inversion model [13,23]. For instance, Yuzugullu et al. (2016, 2017a, 2017b, 2018) [13,14,15,33] proposed a metamodel-based inversion algorithm with a scattering model for rice height estimation using PolSAR data. However, RTT was built based on many crop biophysical parameters (e.g., stem radius, leaf width, leaf thickness and stem mean tilt angle) and complex physics formulas. In addition, InSAR and PolInSAR have been widely applied for forest canopy height estimation based on the phase difference between two SAR acquisitions [29,31,34,35,36,37]. The interferometric phase in the InSAR technique has a direct relationship with canopy heights. In contrast with InSAR-based approaches, PolInSAR makes use of interferometry and polarimetry, to which the Random Volume over Ground (RVoG) has been widely employed for canopy height estimation. For instance, Lopez-Sanchez et al. (2011) [18] provided the first demonstration of the retrieval of crop height by means of PolInSAR-based techniques with airborne data. Since then, TanDEM data have been favored for crop height estimation due to their short wavelength (X-band) [11,15,31]. The works of Lopez-Sanchez et al. (2017) [17] and Lee et al. (2018) [1] presented demonstrations of the retrieval of rice height using the TanDEM-X data (baselines of 2–3 km) of the RVoG model without external reference information. However, current satellite missions cannot fulfill the RVoG model for crop height retrieval, which requires at least two acquisitions with suitable spatial baselines and no temporal baseline. Recently, other satellite data (e.g., Sentinel-1) have been applied for crop height estimation using a modified water cloud model (MWCM) [5,38,39]. For instance, Yang et al. (2016) [5] proposed a modified water cloud model (MWCM) to estimate rice height with a root-mean-square error (RMSE) of 10.37 cm and a determination factor (R) of 0.89, and the results indicated that MWCM could predict the temporal behaviors of rice variables at all growth stages. In addition, dynamic models (e.g., Kalman filtering (KF), extended Kalman filtering (EKF), or particle filter (PF)) have been applied for the real-time phenology estimation of rice at all growth stages. Moreover, PF can obtain accurate phenology estimation using time series parameters [40]. For instance, Yang et al. (2021) [41] proposed a modified PF for rice phenology estimation (R = 0.96 and RMSE = 5.82 cm) with accurate transplanting dates. Then, we hold that PF can also be applied for the real-time estimation of rice height. Therefore, we used the PF for rice height estimation with a comparison of a simplified water cloud model (SWCM) based on time series Sentinel-1 images. Specifically, the objectives of this study were as follows: (1) to conduct parameter optimization for SWCM and PF, (2) to estimate rice height in the spatio-temporal distribution using SWCM and PF and (3) to compare rice height estimations using SWCM and PF.
2. Study Area and Datasets
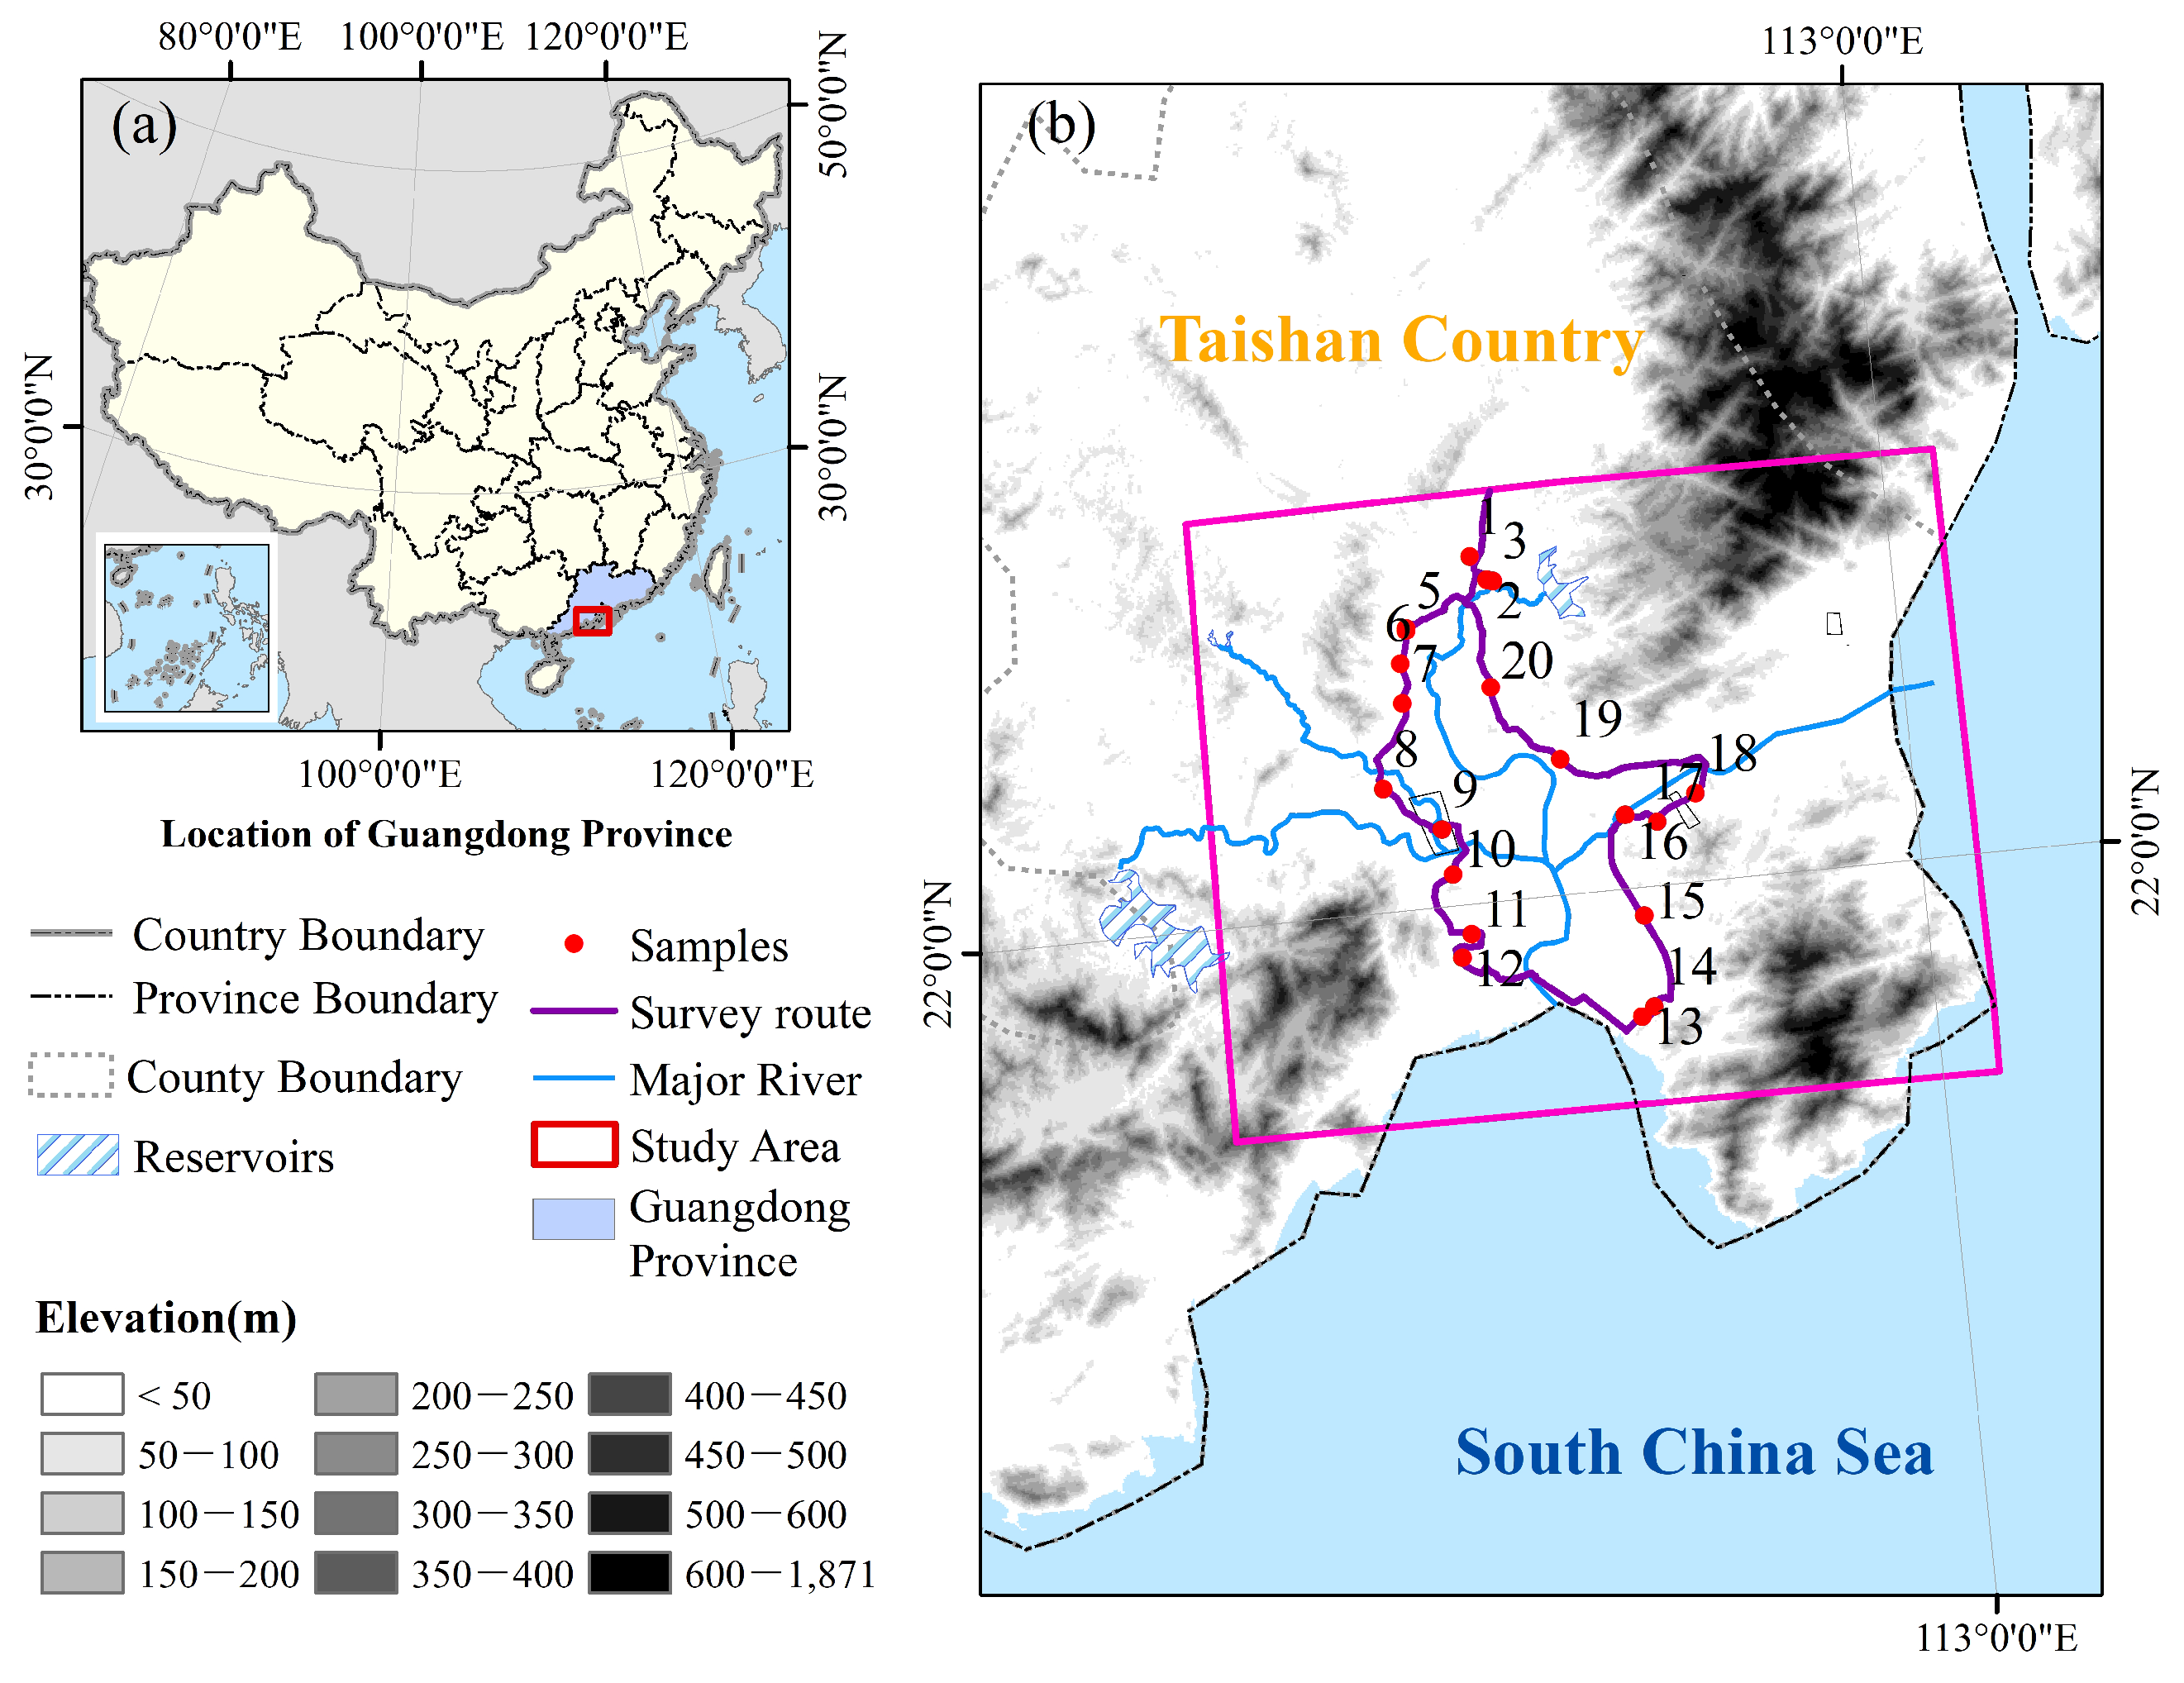
The study area is located in Taishan County in Guangdong province of China, adjacent to the South China Sea, which is almost completely surrounded by mountains (Figure 1). The site has a humid, moderate four-season climate. The annual average precipitation, temperature, relative humidity and sunshine duration (based on the period from 1981 to 2010) of the study area are 2002.6 mm, 22.3 °C, 79 and 2006 h, respectively. The geographical and climate conditions are advantageous for double and single-paddy rice cultivation. The main crop is double-paddy rice, and the height estimation of early season rice was conducted in our study.
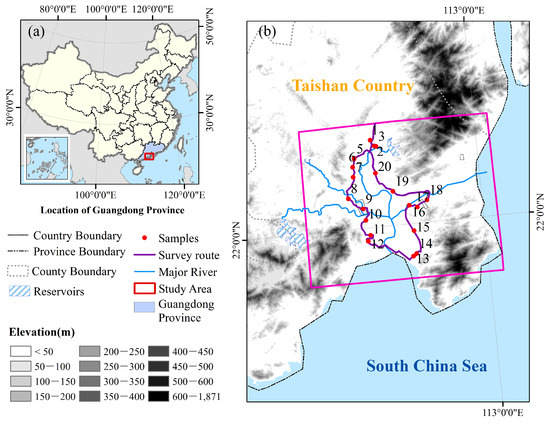
Figure 1.
(a) The location of Guangdong Province in China; (b) Location of the study area in Taishan County, Guangdong Province.
Sentinel-1A Level 1 (L1) Ground Range Detected (GRD) products with 12-day temporal resolution were freely downloaded from the Copernicus Open Access (COA) Hub (https://scihub.copernicus.eu/dhus/, accessed on 1 January 2019) of the European Space Agency (ESA). The attributes of Sentinel-1A data are shown in Table 1, and Figure 2 shows twenty-seven Sentinel-1A images from 1 January 2019 to 21 November 2019. The pre-processing of Sentinel-1 GRD included orbit correction, calibration, a speckle filter, range Doppler terrain correction and the conversion to dB scale, which was carried out with the SNAP (Sentinel Application Platform) toolbox provided by the ESA.

Table 1.
Specifications for Sentinel-1A images.
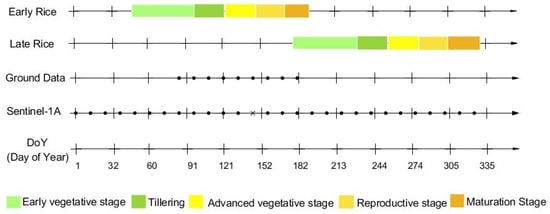
Figure 2.
Acquisition dates of ground campaigns and Sentinel-1A images. Crosses denote a lack of images, and black circles denote acquired data. The backscattering coefficients of the missing image were the mean value of two adjacent images.
During the campaign, the ground measurements of paddy rice were collected in one period (26 March to 30 June 2019) over 20 paddy rice fields. During this experimental period, rice advanced from transplanting to harvest (see Figure 2). Nine ground campaigns were performed at the same time with SAR Sentinel-1 image acquisition (Figure 2). Twenty field locations (see Figure 1) were identified during the campaign using Google Earth and GPS. A total of 28,332 pixels were collected during nine field campaigns. Training samples with a total of 180 pixels were selected randomly from each field from the nine images. Test samples with a total of 28,152 pixels were used to validate the model for rice height estimations.
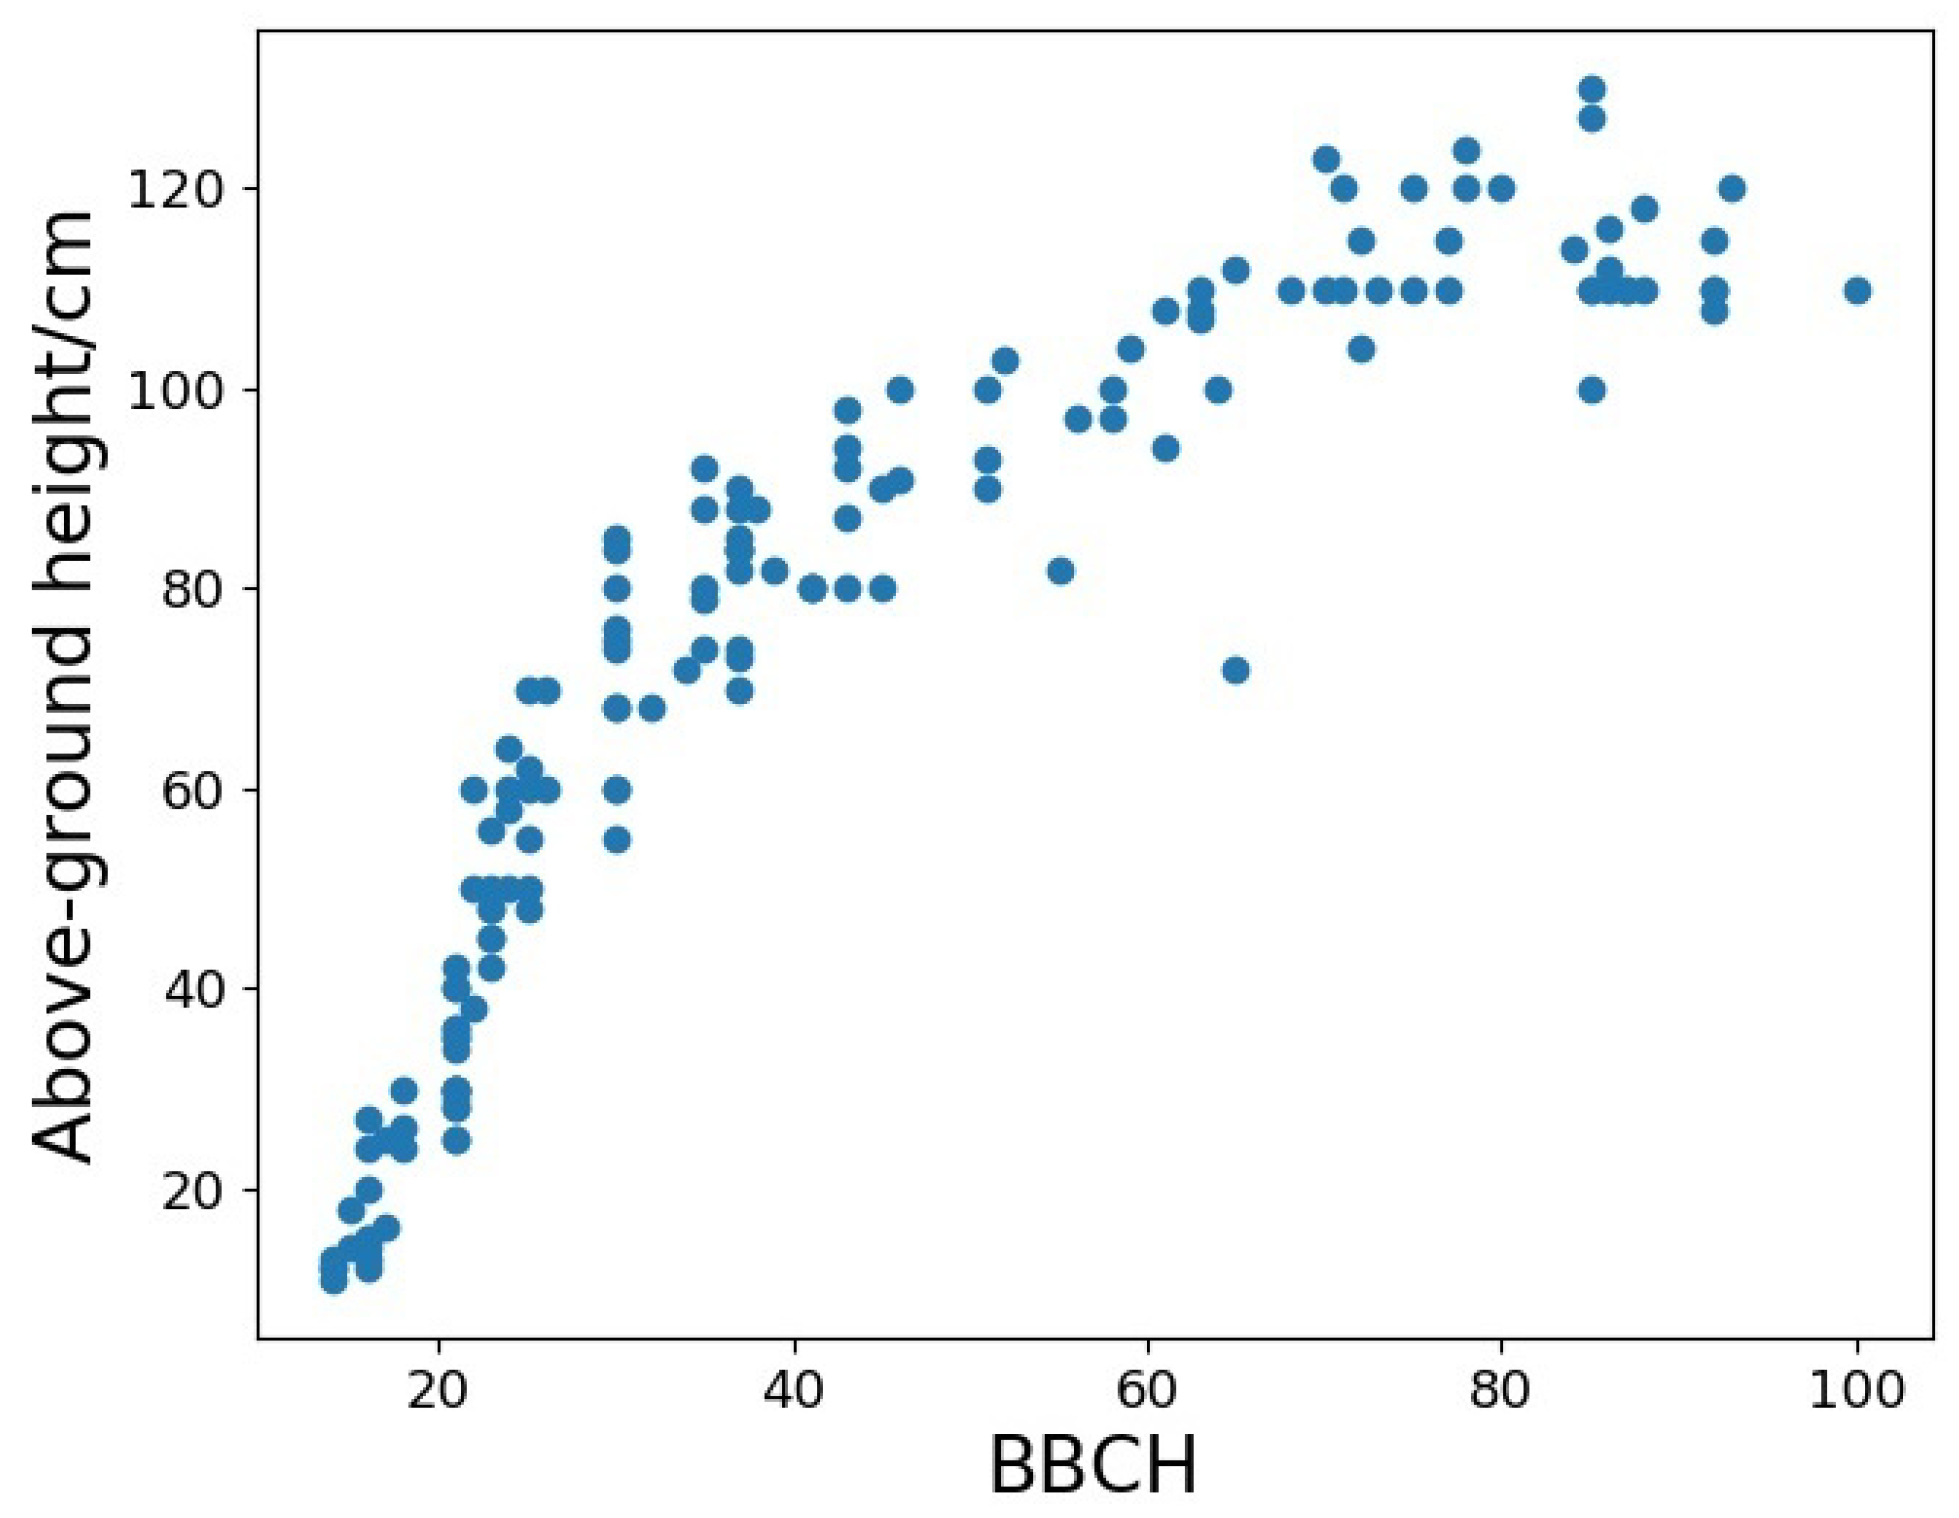
Rice above-ground height and Biologische Bundesanstalt, Bundessortenamt und CHemische Industrie (BBCH) were collected during field campaigns. Considering the interest in the relationship of rice height with other rice variables, Figure 3 and Figure 4a show the rice above-ground height at different growth stages. It is noteworthy that rice height rapidly increased up to approximately BBCH 60, and small changes occurred after this stage. Both days from transplanting and BBCH showed good correlations with rice above-ground height.

Figure 3.
The relationship between BBCH and rice above-ground height.
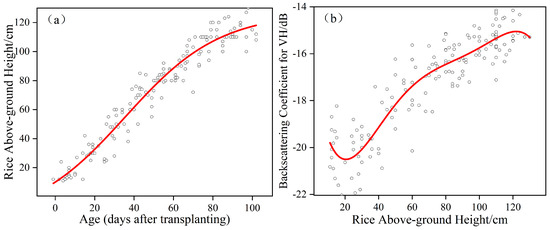
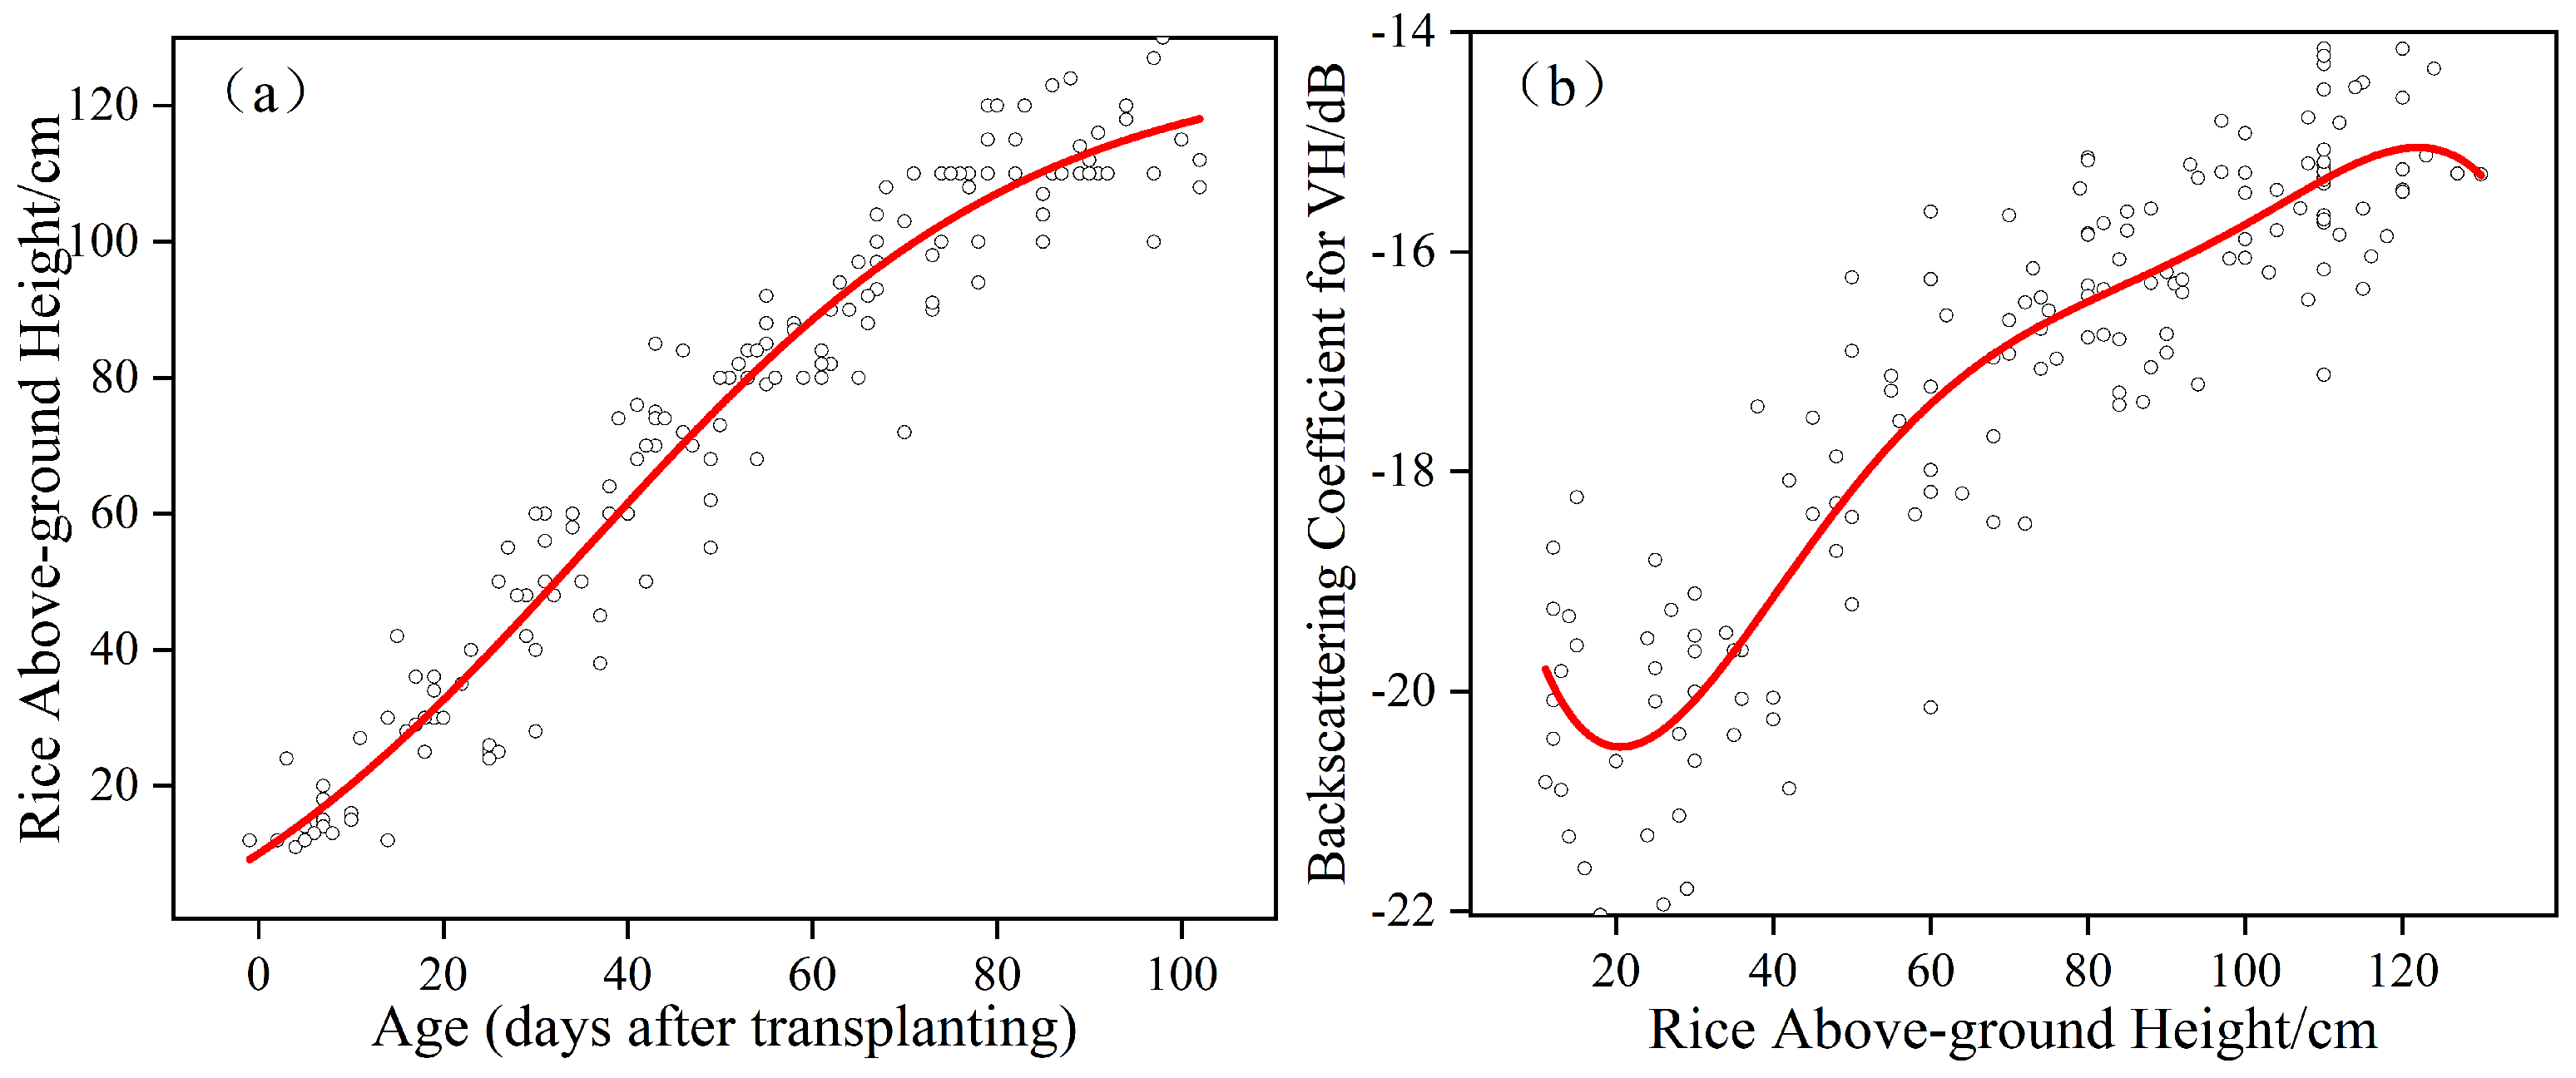
Figure 4.
(a) Relation between the age (days after transplanting) and the reference above-ground height (black circle); the model was obtained from the fitting of the Sigmoidal Richards model (red line). (b) Relation between the reference above-ground height and VH backscatter (black circle); the model was obtained from the fitting of a polynomial curve (red line).
3. Methodology
Two approaches, namely, the water cloud model and particle filter, were applied for rice height estimation. These approaches are based on rice mapping and transplanting date retrieval. Paddy rice was differentiated by Spectral Similarity Measures (SSMs) [41,42], and the transplanting date was retrieved by a dynamic threshold algorithm [41]. Table 2 shows the input and output parameters of SWCM and PF, respectively. In addition to and the observed height of rice, the number of days after transplanting is indispensable to PF.
Table 2.
Model parameters of SWCM and PF.
3.1. Simplified Water Cloud Model
The Water Cloud Model [43], as a semi-empirical model, was applied for the estimation of vegetation variables. It was proposed that the vegetation canopy and vegetation layer were assumed as a homogeneous anisotropic scatter, and the multiple scattering contributions from the vegetation soil were ignored. The backscattering coefficient mainly consisted of the direct backscattering of the vegetation and soil after two-way attenuation, as follows:
with
where o is the total backscattering coefficient; o and o are the backscatter coefficient of the vegetation cover and soil surface, respectively; is the angle of incidence; is the two-way attenuation. In our study, A, B and o are regarded as constants. V and V, as vegetation descriptors, describe the effect of canopy water content and its geometry on the backscatter [43,44]. Consequently, canopy height, as an important vegetation variable, was represented by both V and V in our study, and the Water Cloud Model was simplified as much as possible.
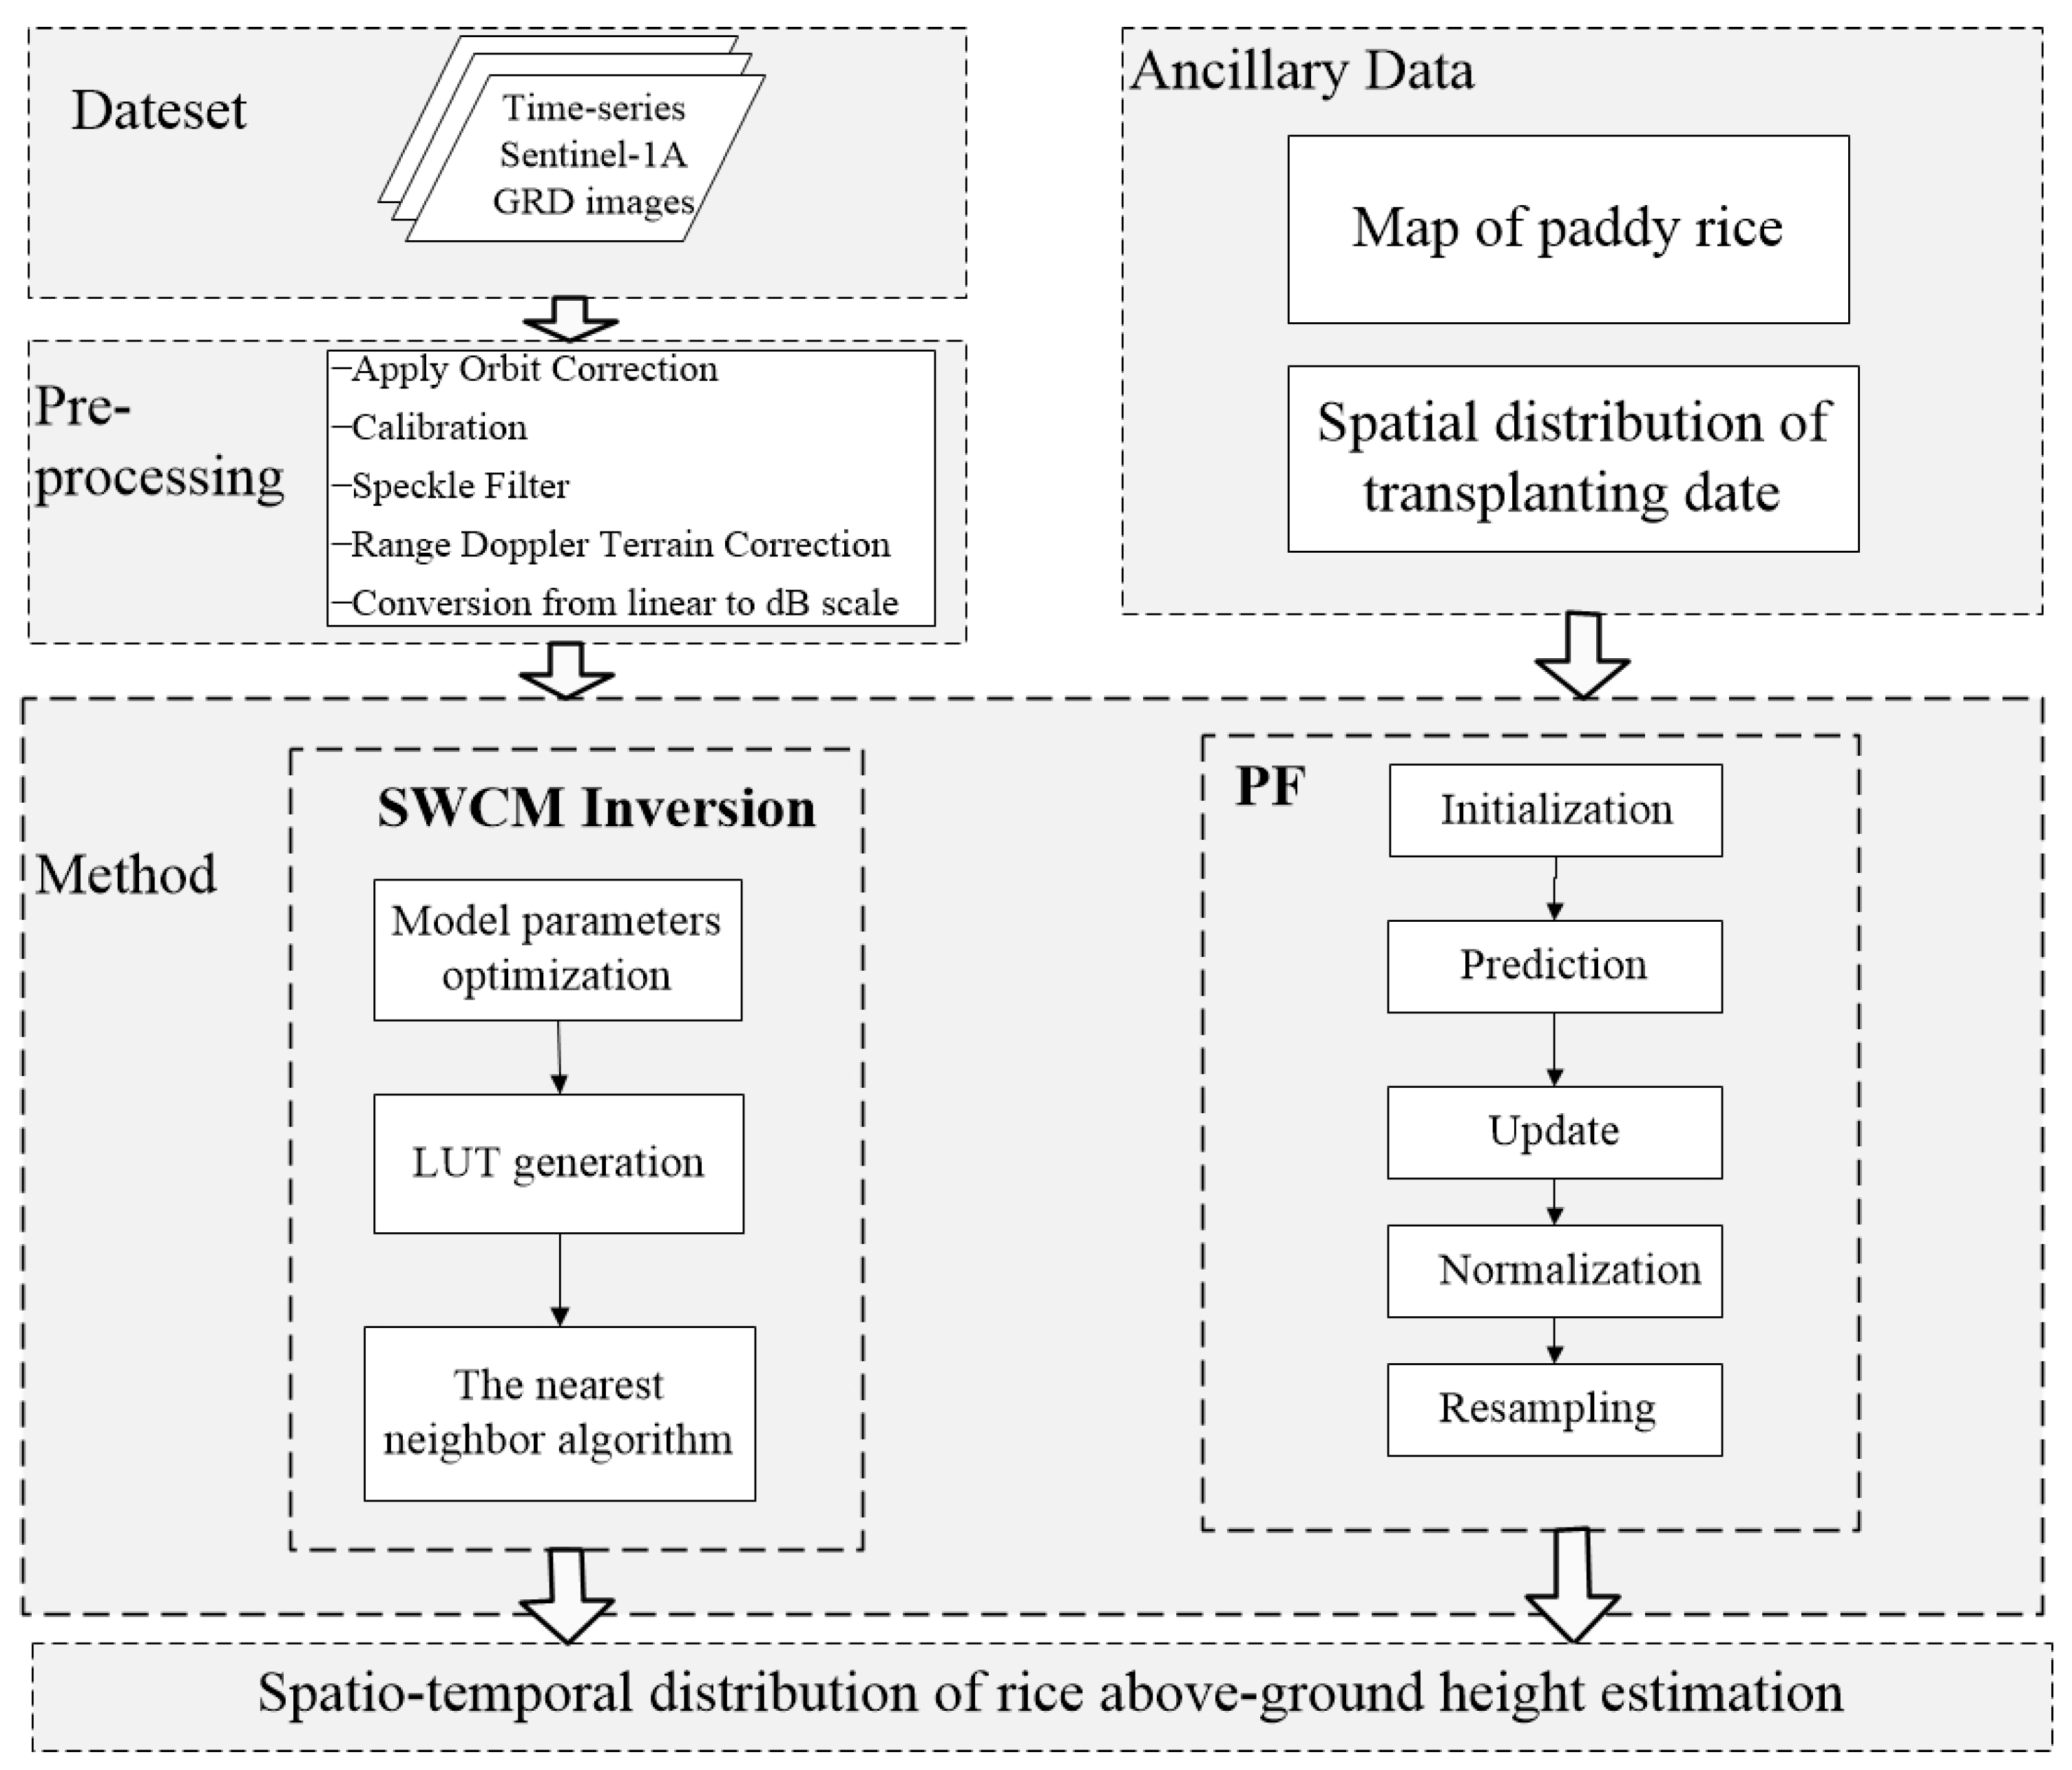
Simplified Water Cloud Model (SWCM) inversion comprised three steps, as shown in Figure 5. (1) Model parameter optimization was conducted by the nonlinear least-square fitting algorithm using in situ datasets. A, B and o were determined by the minimization between the simulated and observed backscattering coefficient of rice [45]. (2) The look-up table (LUT), which was generated by SWCM with optimized parameters, contained rice height and the corresponding simulated backscattering coefficients. It was of great significance to rice height retrieval. (3) The nearest neighbor algorithm was used for rice height estimation based on LUT. Height estimation was obtained by finding the nearest in the LUT. Accuracy estimation was performed for test samples with R and RMSE.
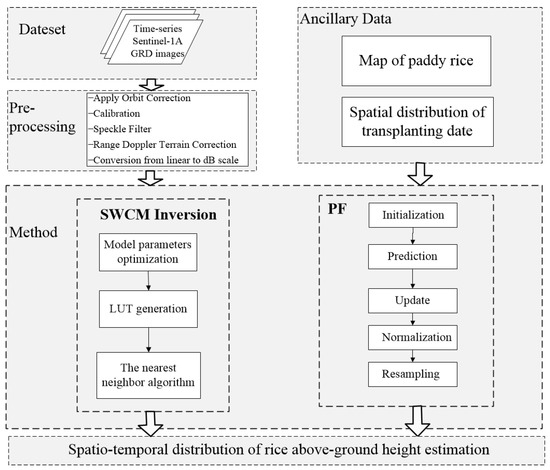
Figure 5.
Flow diagram of the methodology for rice above-ground height estimation. Rice was harvested when the growing duration from transplanting to harvest was larger than 100 days.
3.2. Particle Filter
PF, which consists of a prediction model (Equation (5)) and an observation model (Equation (6)), was used for rice above-ground height estimations. In order to generate a prediction model, we determined the above-ground height evolution of rice fields as a function of age (days after transplanting) (Figure 4a). The effect of above-ground height on the behavior is better described by the Sigmoidal Richards model [45]. The equation is as follows:
where t is the time in days; x(t) is the height at time t; a, a, x and d are −16.39447, 126.49631, 35.59066 and 24.00643, respectively. The prediction model is described by (5).
where x is the rice height at instant t; x is the rice height at the next instant; t is 12, which is the number of days between x and x. The observation model (Equation (6)) is fitted by a polynomial curve, as shown in Figure 5b.
where b, b, b, b, b and b are −16.23676, −0.5135, 0.02047,−3.14814 × 10, 2.19213 × 10 and −5.73078 × 10, and y is the backscattering coefficient of rice, respectively. The PF approach comprises five steps, namely, initialization, the prediction of the sample, the updating of the weight of particles, normalization of the weight of particles and the resampling of these particles. For a more detailed description of PF, see De Bernardis et al. (2014) [40]. For the first step, we assumed that the initial heights were 16.55 cm on the transplanting date. The mean (16.55) of the rice height was obtained by the fitting curve (Figure 4a), which was from fitted data within 12 days after transplanting.
4. Results
4.1. Parameter Optimization
The parameter optimization of SWCM for rice height was performed individually by both the VH and VV polarization channels using a training dataset. In our study, we focused on accurate height estimation and developing an uncomplicated model. Thus, WCM was simplified as much as possible. Therefore, as with A and B, is regarded as a constant. In addition, although the backscattering coefficient was affected by the angle of incidence, the volume scattering of paddy rice changed only slightly across the range [46]. Thus, the incidence angle was the mean value of all incidence angles in our study area. A, B and were determined by the minimization between the simulated and observed backscattering coefficient of paddy rice, as shown in Table 3. The performance of parameter optimization was assessed in terms of the R and RMSE between the simulated and observed backscattering coefficient of paddy rice, as shown in Table 3. The simulated backscattering coefficient for VH polarization was significantly correlated with rice height by SWCM with optimized parameters (R = 0.824267). The R and RMSE values calculated at VH polarization were approximately 0.595 higher and 0.577 lower, respectively, than those calculated at VV polarization. Consequently, VH polarization was used for rice height estimation.
Table 3.
Model parameters and comparison of simulated and observed backscatter coefficient of rice.
4.2. Comparison of Rice Above-Ground Height Estimation by Two Methods
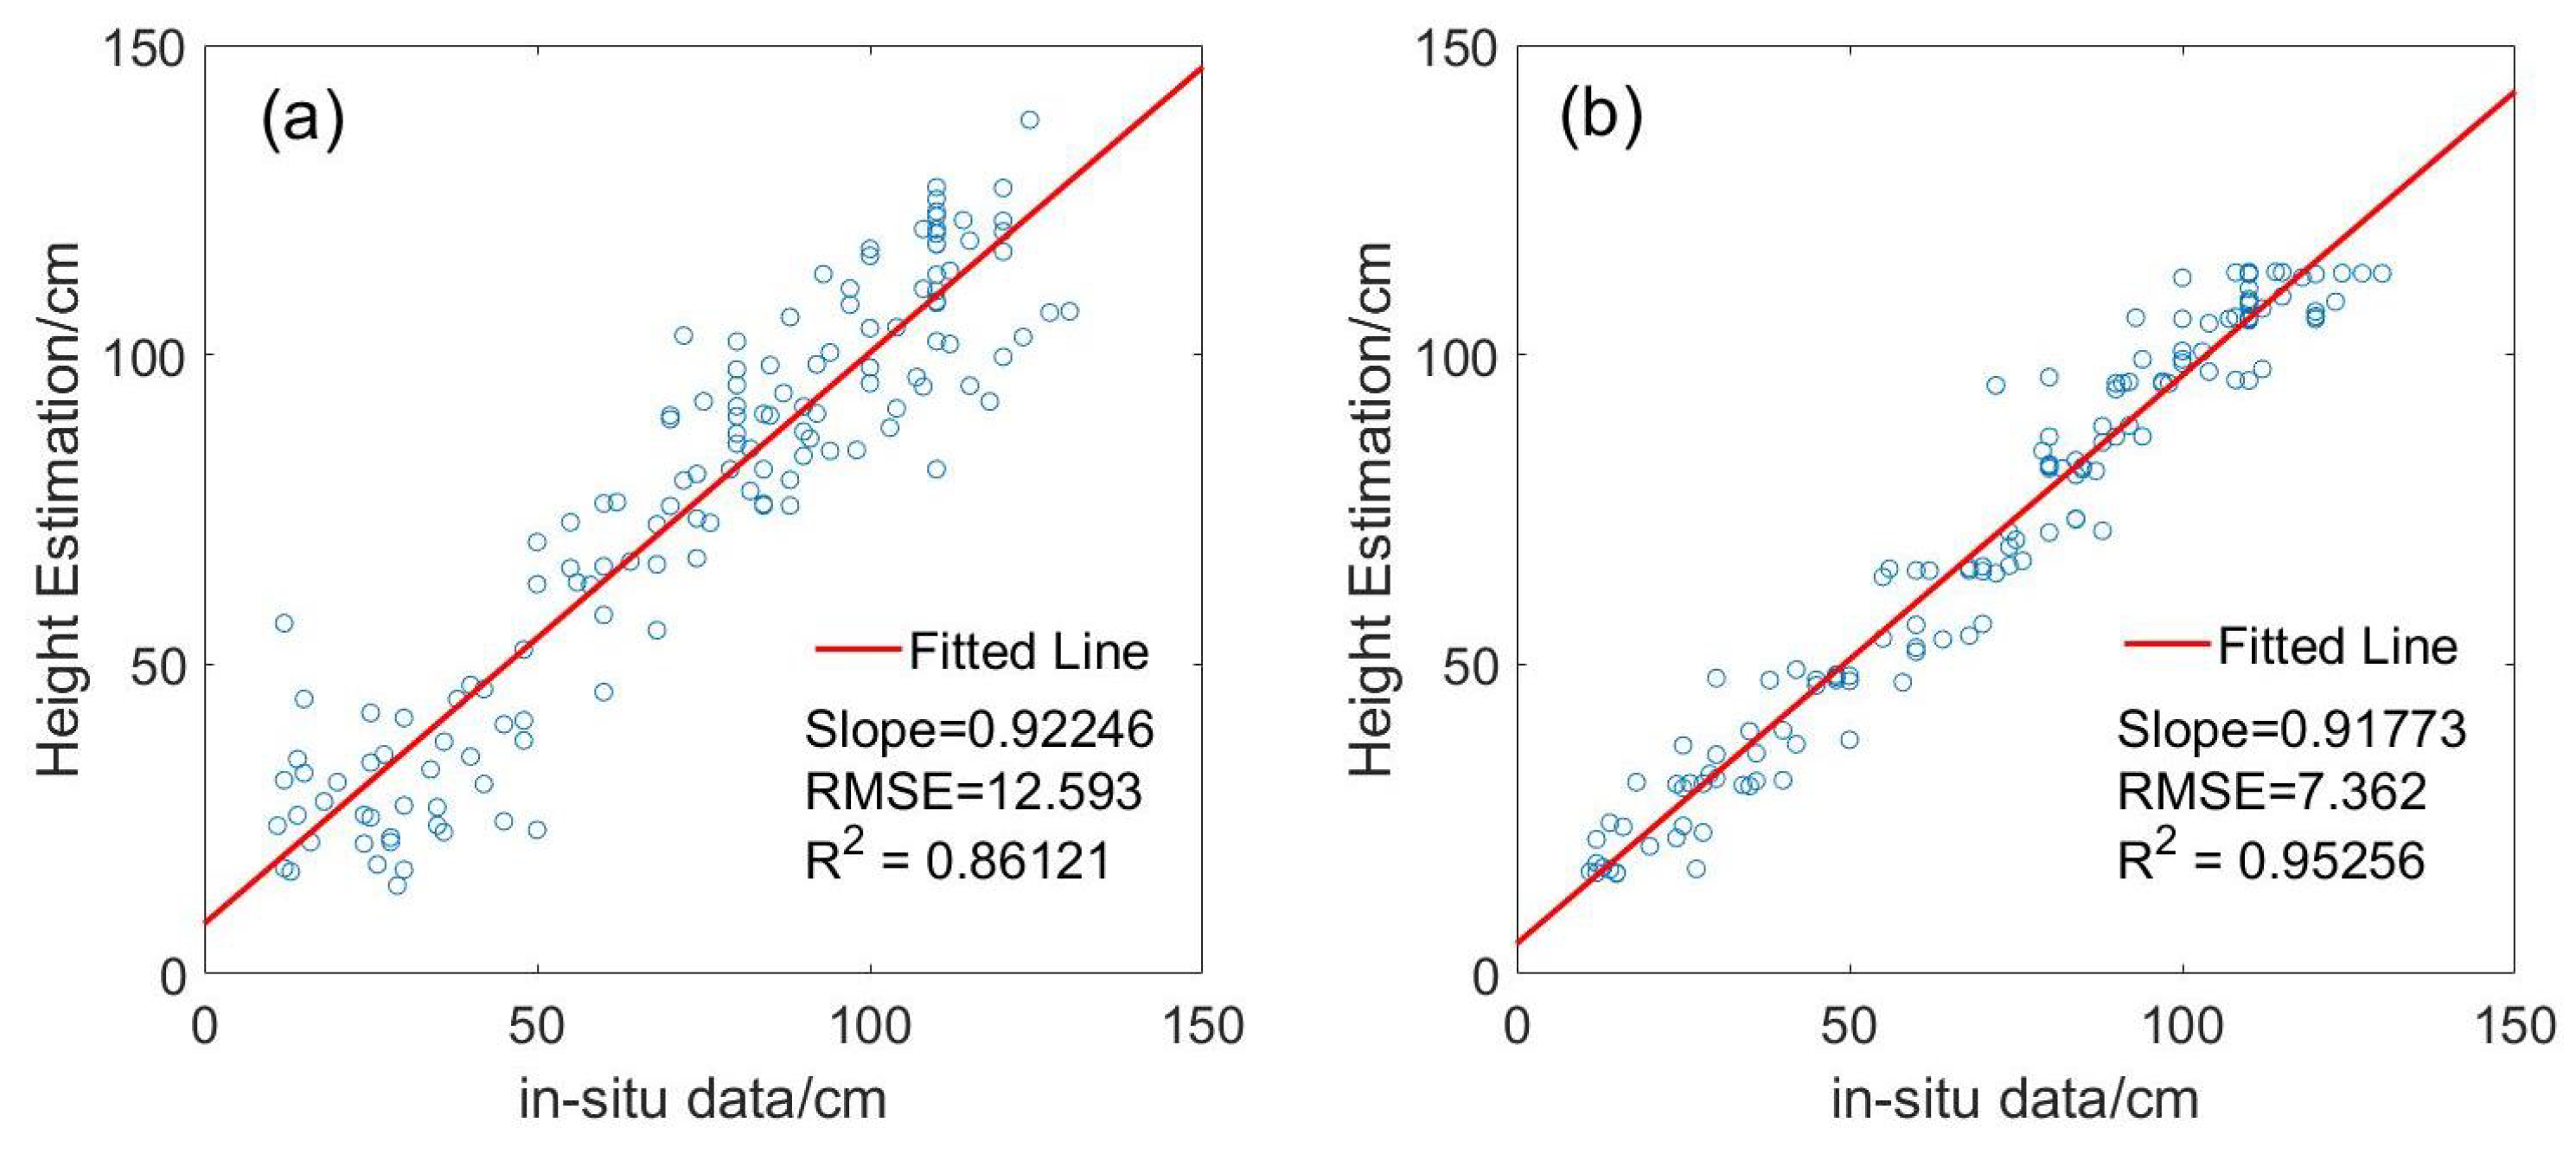
SWCM with optimized parameters and PF with initial rice height were used for rice height estimation based on the VH backscattering coefficient. Accuracy estimation was performed when rice and the transplanting dates were retrieved correctly from Yang et al. (2021) [41]. SWCM had a slope of the fitted line that is similar to that of PF, as shown in Figure 6. However, the RMSE values (7.362) and R (0.953) using PF were approximately 5.231 lower and 0.091 higher, respectively, than those obtained using SWCM. Height estimation using SWCM at a rice above-ground height of less than 30 cm had a larger error than at a height of more than 30 cm. Additionally, the error of height estimation by SWCM was larger than that of PF at the early vegetative stage (Figure 6 and Figure 7), such as the height estimation of DoY 85 (Figure 7). The main reason for this was that PF was based on a better fitting curve for a prediction model and an observation model, and SWCM was influenced more by the various incidence angle and soil moisture contents, especially during the early vegetative stage. Moreover, compared with the PF, the variation of the estimated above-ground height by SWCM on DoY 157 and DoY 169 was large, and the estimated above-ground height by SWCM from DoY 133 to 157 decreased (Figure 7), which was not in accordance with the growth rule of rice. In addition, the rice above-ground height was underestimated by SWCM or PF (Figure 6).
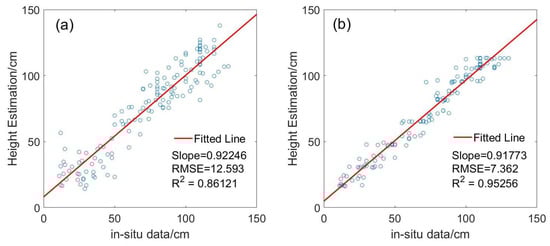
Figure 6.
RMSE and R of estimated rice above-ground height (a) for SWCM with optimized parameters and (b) for PF with initial height. The red line is a fitted line.
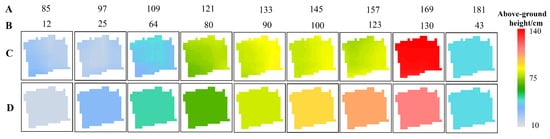
Figure 7.
Estimation of rice above-ground height for field 9 by two methods. (A) represents DoY and (B) represents the ground truth of rice above-ground height. (C,D) are the results calculated using the SWCM and PF, respectively.
4.3. The Spatio-Temporal Distribution of Above-Ground Height Estimation
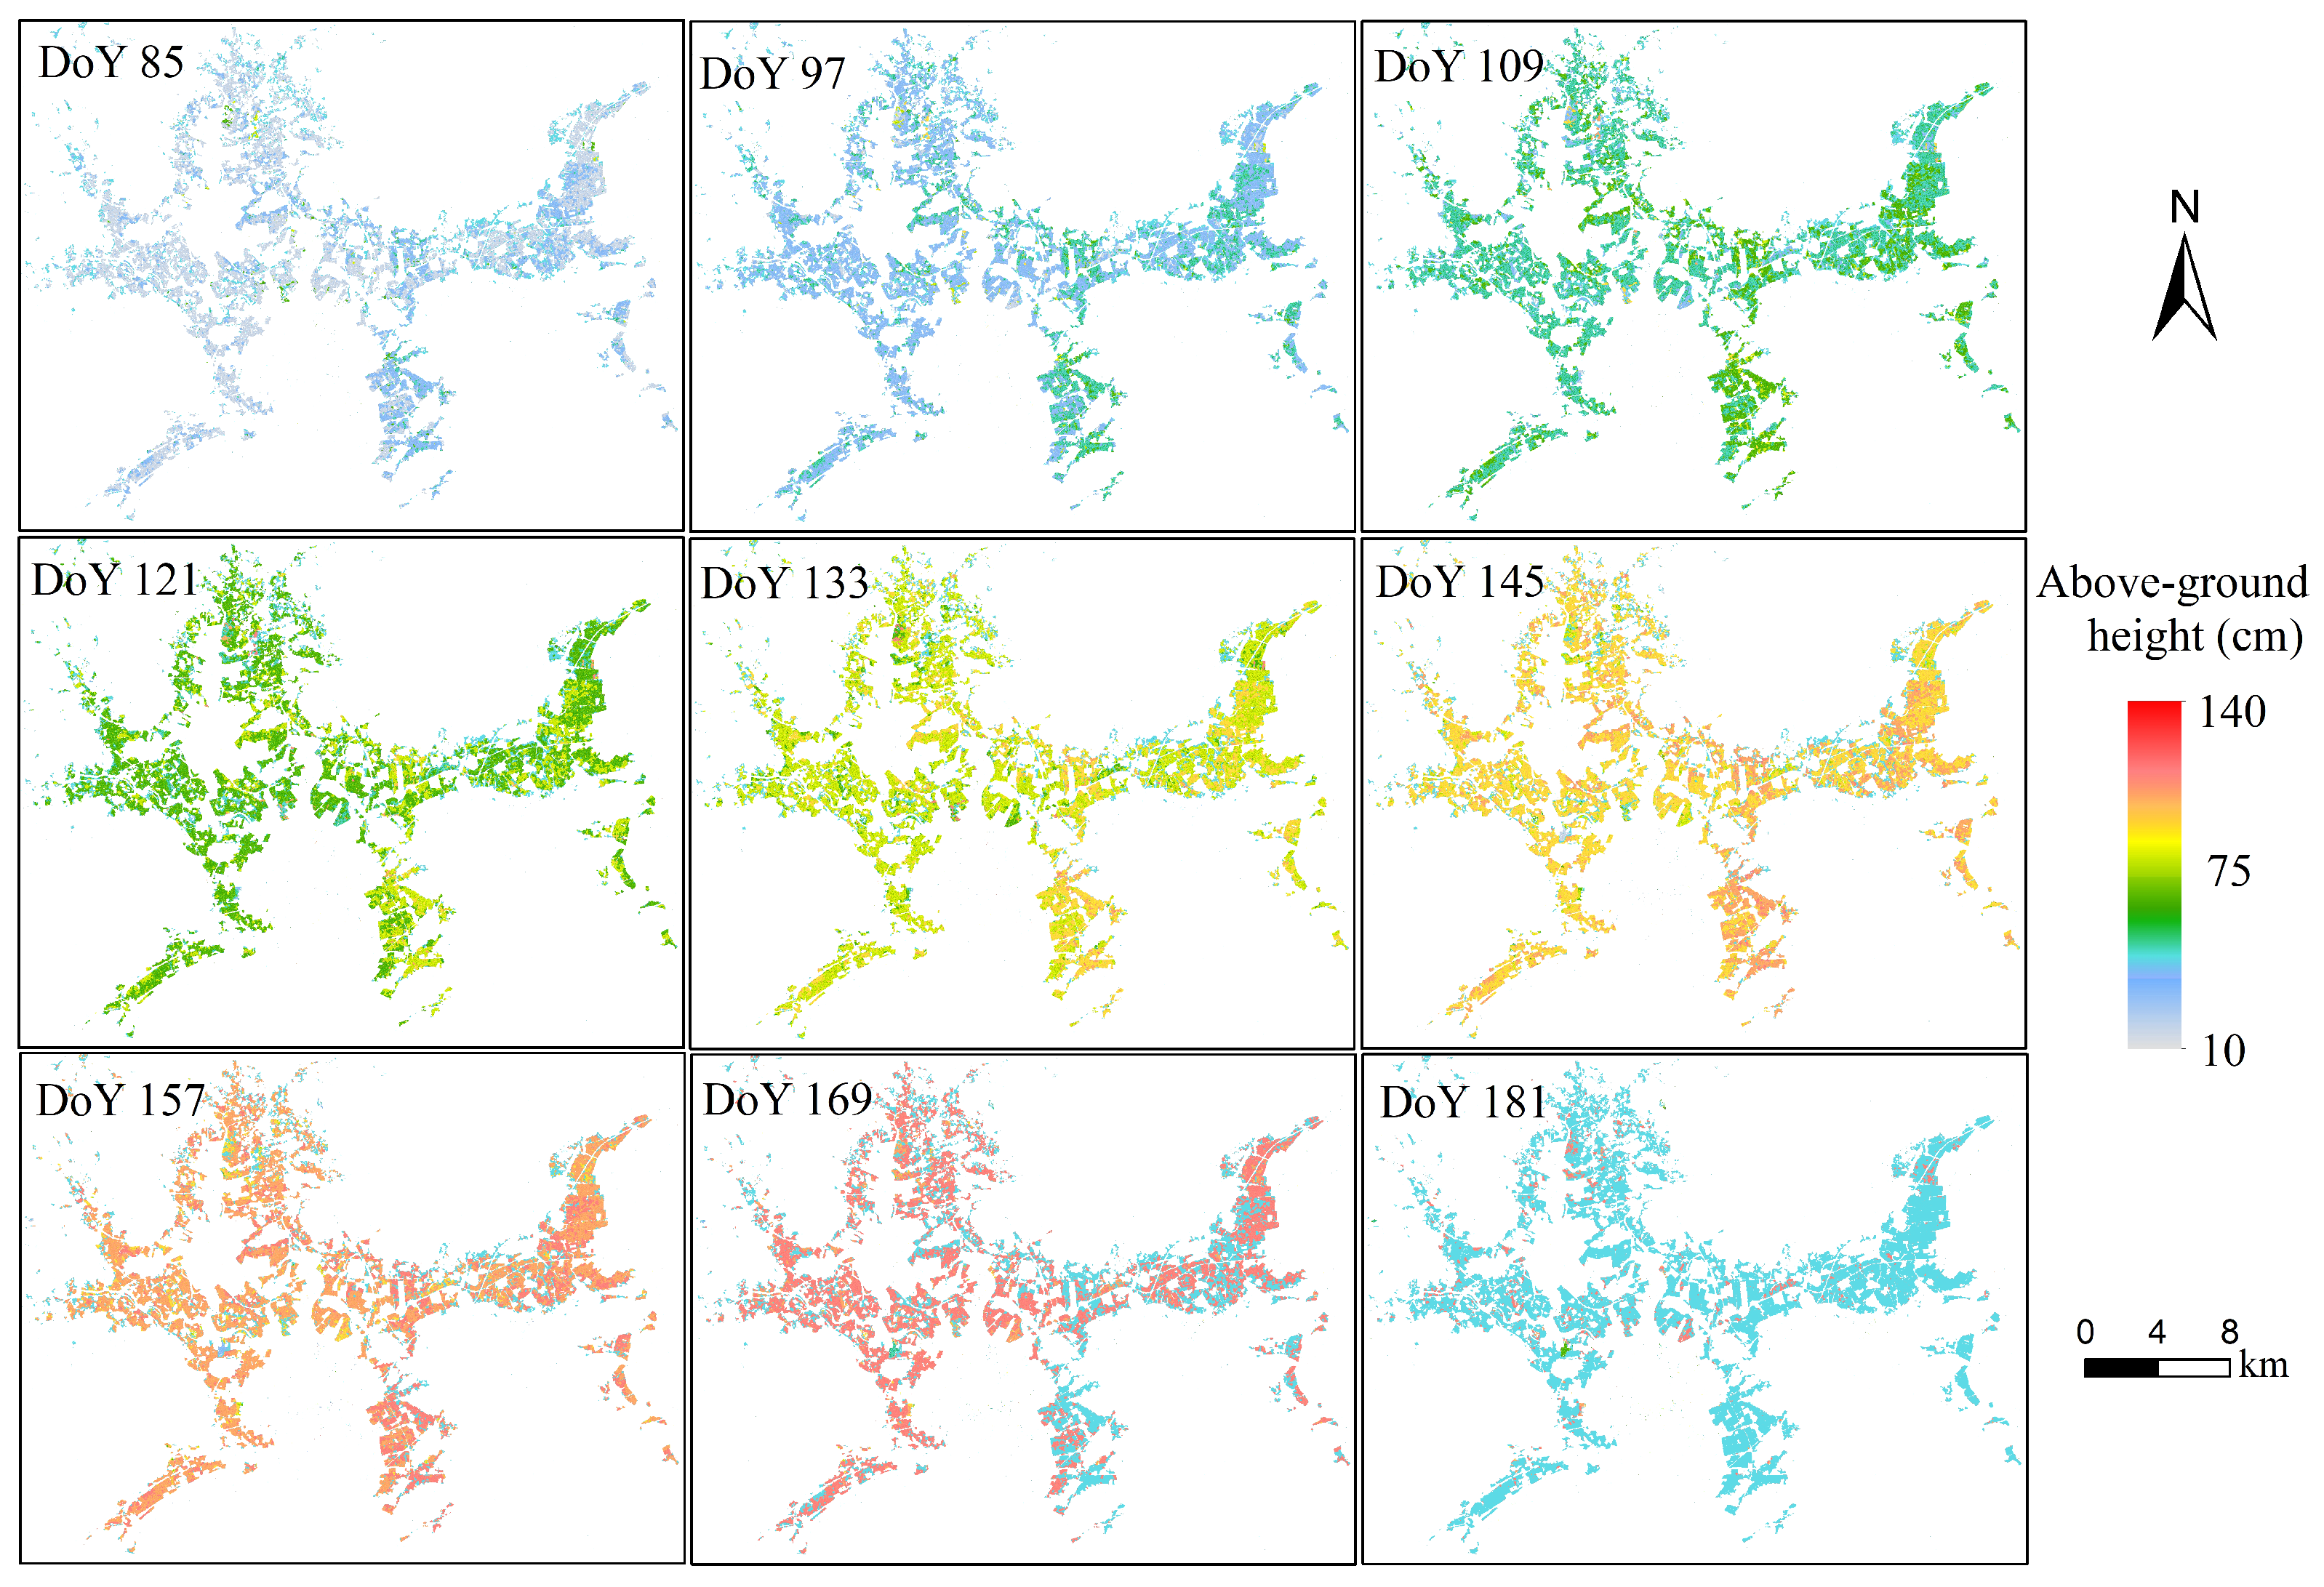
The spatio-temporal distribution of above-ground height estimation for early season rice was calculated using PF, as shown in Figure 8. We found that there was a dramatic fluctuation in the above-ground height from DoY 121 to 145, while there was a small fluctuation in the above-ground height from DoY 85 to 109. In terms of spatial distribution, the rice above-ground height on one day was lower than that in the east and south of the study area, especially on DoY 109 and 121. The reason for this is that air temperature is a determining factor driving the growth of rice [41,47,48]. Additionally, the south and east in this area have higher temperatures at the early vegetative stage of rice due to their proximity to the South China Sea. On DoY 169 and 181, most rice was harvested with an above-ground height estimation of 43 cm.
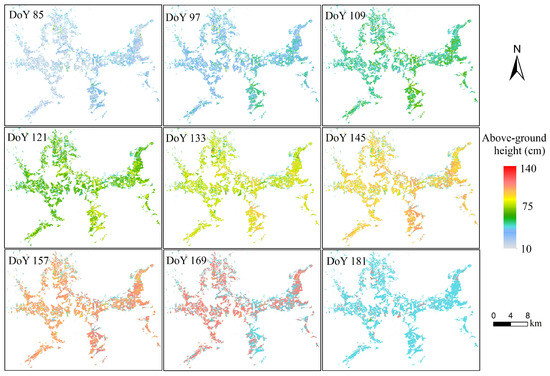
Figure 8.
The spatio-temporal distribution of rice above-ground height, analyzed using PF.
5. Discussion
5.1. Polarization Analysis
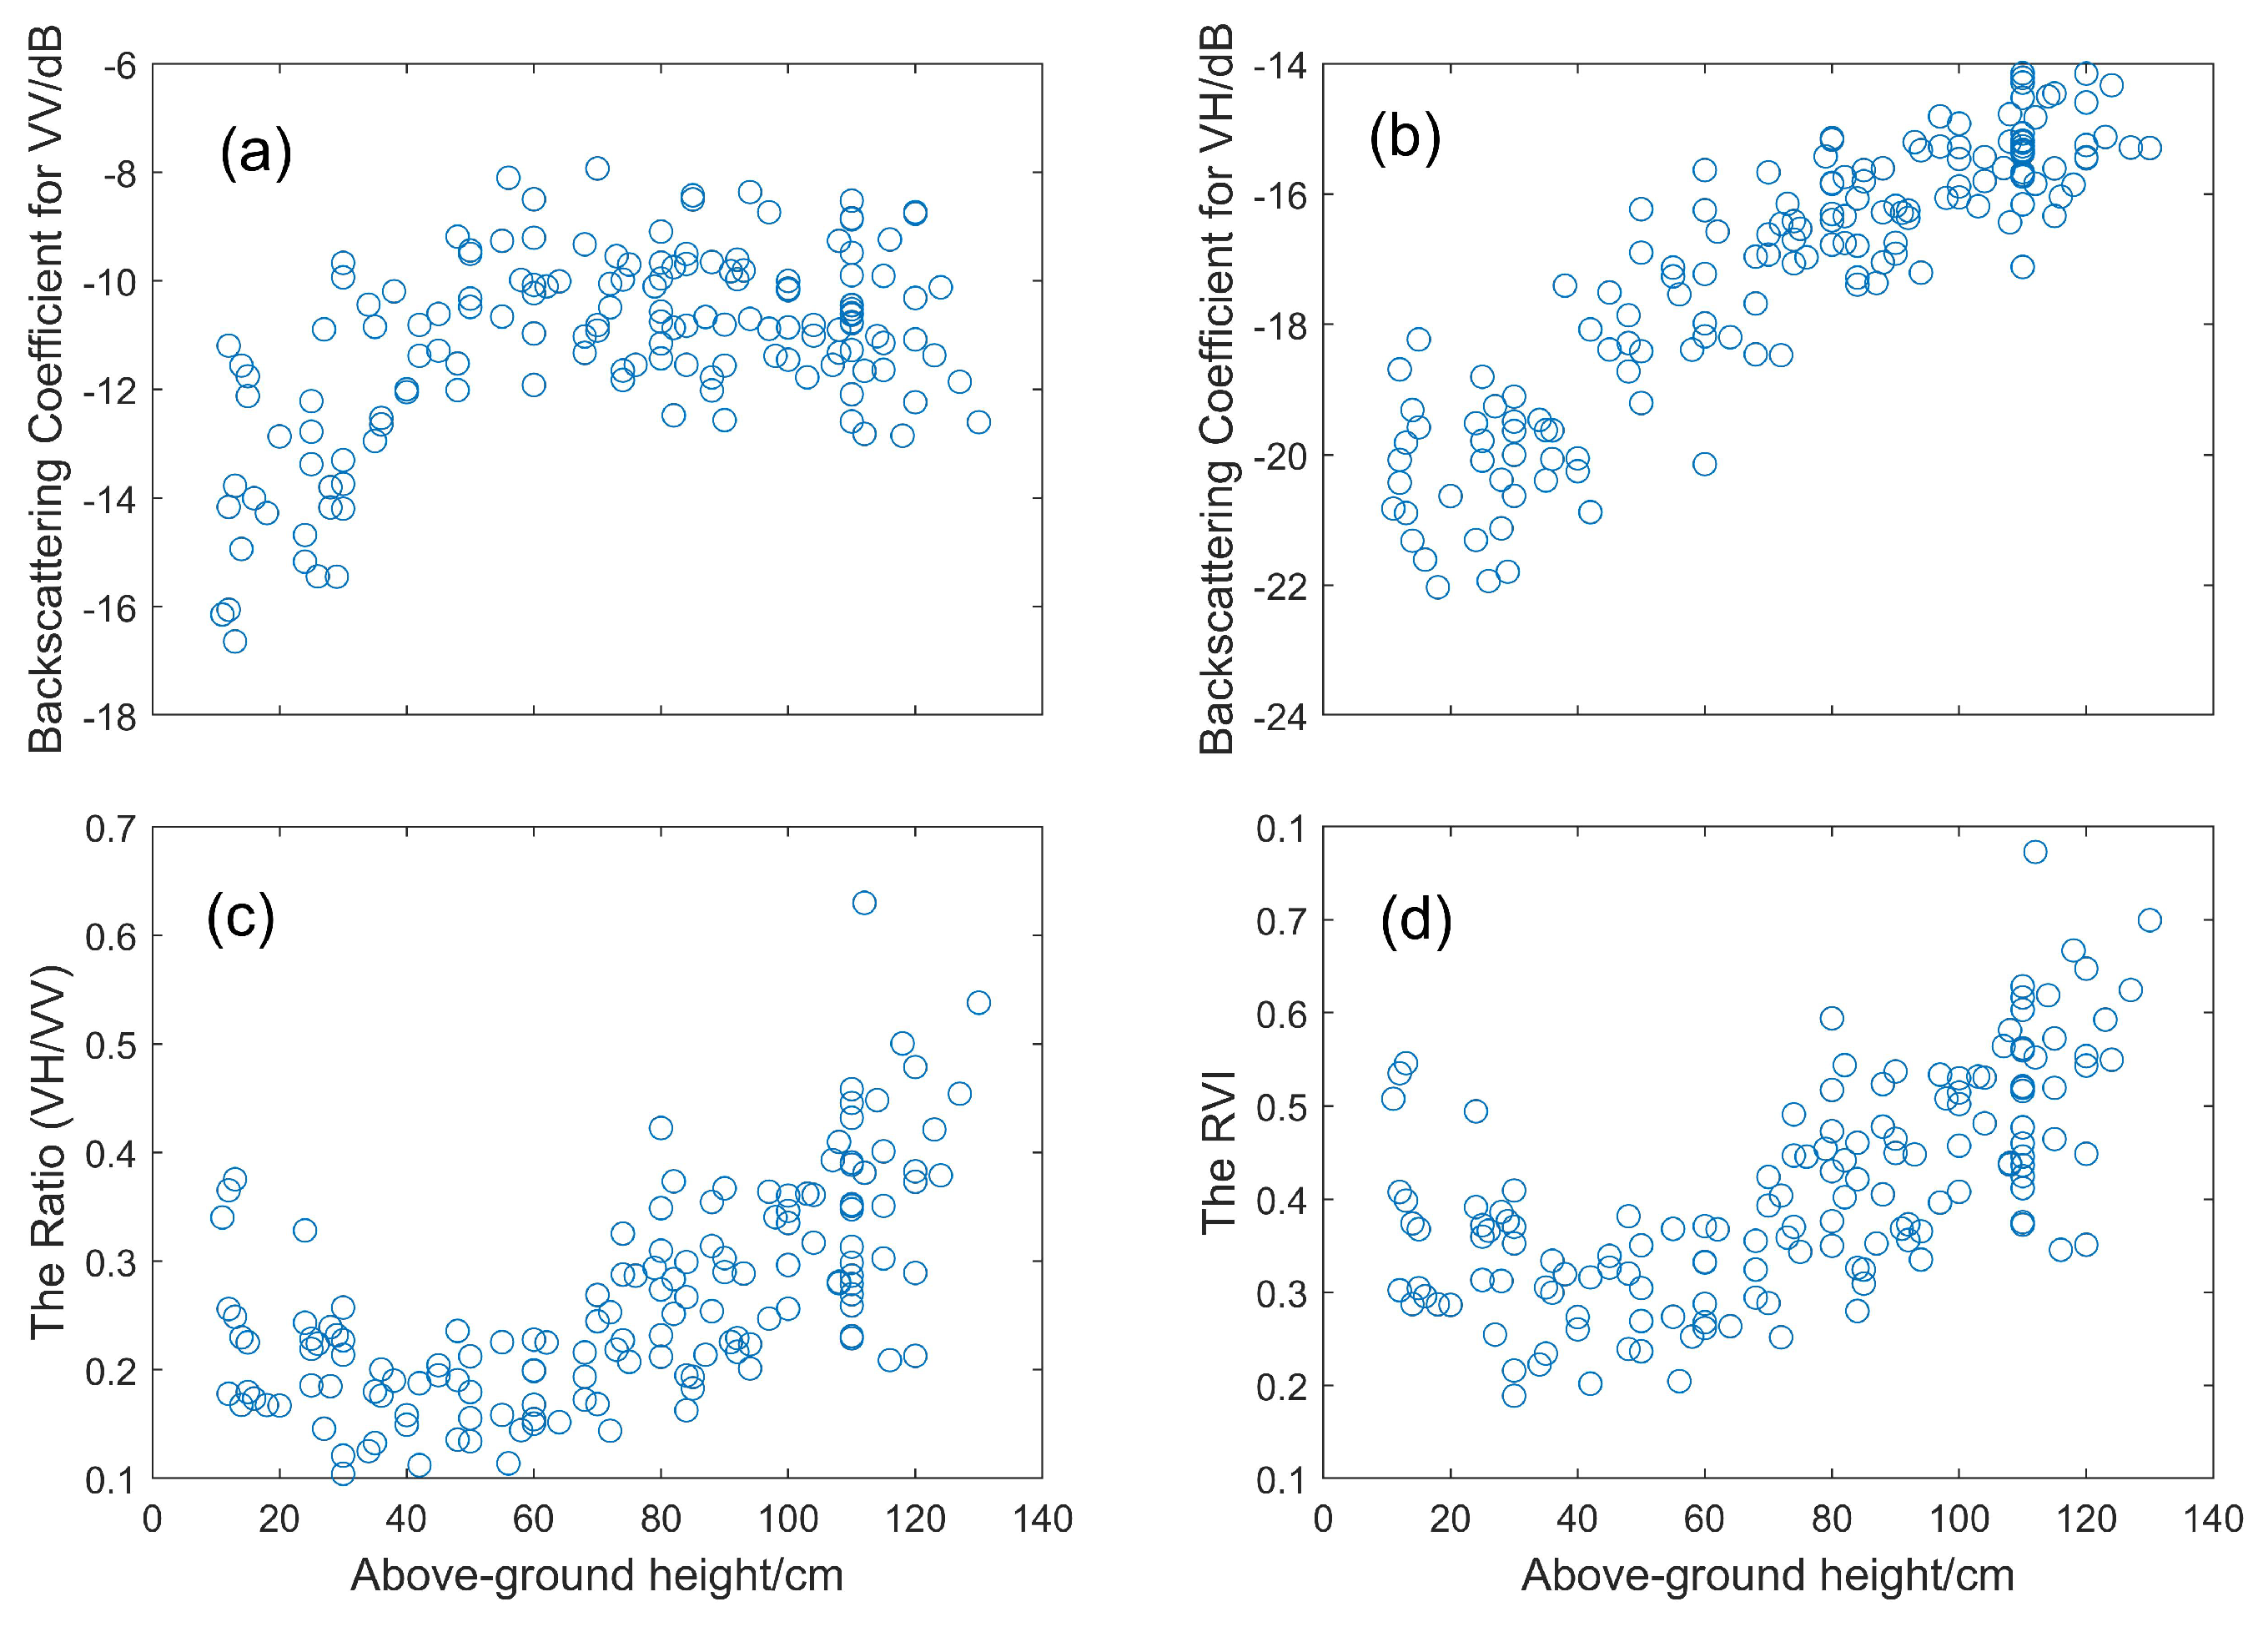
The backscattering coefficient at the VV polarization channel increased first and then decreased with the increase in rice height, as shown in Figure 9a. However, the backscattering coefficient at the VH polarization channel increased as the rice height increased, as shown in Figure 9b. The / ratio and the Radar Vegetation Index (RVI, 4 * /( + )) decreased first within a rice height of 40 cm and then increased, as shown in Figure 9c,d. The increase in the backscattering coefficient resulted mainly from the decrease in irrigated water in the paddy rice field and the fast development of rice leaves and tillering. Dominated scattering gradated from double scattering to volume scattering. The decrease in the backscattering coefficient at the VV polarization channel was caused by the longer propagation path inside the vegetation volume. At the maximum above-ground height, backscatter variation was more affected by the gradual drying of plants. In addition, VV backscatter increased and then decreased as rice grew (Figure 9a), while VH backscatter increased as rice grew (Figure 9b). The reason for this could be the stronger attenuation of vertical stems in the VV backscatter [3,17].

Figure 9.
Relationships between the rice above-ground height and (a) VV backscatter, (b) backscattering coefficients for VH, (c) the / ratio and (d) RVI.
Using the polynomial fitting algorithm, rice height had a better fit with VH backscatter with an R of 0.828. However, for VV backscatter, the / ratio and RVI, R were 0.4796, 0.552 and 0.561, respectively. Hence, the relationship between rice above-ground height and VH backscatter was stronger than that of VV backscatter. The main reason for this is that the longer propagation path inside the vegetation volume at the VV channel is more affected by surface roughness, the water content of the soil and rice and different parts of rice (leaves, stems and ears) in the vegetation layer than that at the VH channel [41]. In addition, although the RVI and the / ratio were used for crop growth monitoring [49,50,51], our results indicated that the RVI and the / ratio are not suitable for rice height estimation compared with VH backscatter (see Figure 9). Moreover, Yang et al. (2021) [41] found that the RVI and the / ratio are not the best variables for rice phenology estimation. Therefore, it was found that the VH backscatter has great potential for rice height estimation.
5.2. Features for SWCM and PF
Under the condition that the precision of rice height estimation is assured, two parts of SWCM were simplified as much as possible in our study. First, the effect of the incidence angle on rice canopy backscattering was ignored, as there is a small fluctuation in the volume scattering of paddy rice across the range of 31–46 degrees in Sentinel-1 images [46], and volume scattering from the vegetation canopy dominates in radar backscattering at all growing periods of rice, except for the sowing–transplanting period and early vegetative stage. Second, in our study, soil backscattering was regarded as a constant, as the soil was covered by the rice canopy in all the growing periods for rice, except for the sowing–transplanting period and early vegetative stage, and the C-band showed shallow penetration [52]. The larger variation in the above-ground height estimation of early vegetative rice resulted from the two parts outlined above.
At present, the PF approach has been applied for the phenology estimation of rice (De Bernardis et al., 2014, 2015, 2016) [40,48,53], and the initialization of PF was an important parameter for the spatio-temporal distribution of phenology estimation [41]. Likewise, initialization is of great significance for rice height estimation. This is due to the fact that the first Sentinel-1A acquisition date after transplanting, which is regarded as the transplanting date, as well as rice height, was varied in the spatial distribution dataset. This showed further variation when the rice height was estimated. Hence, transplanting dates were retrieved using a dynamic threshold algorithm in the literature of rice phenology estimation [41], and the initial height was the mean value (16.55 cm) of the fitted data, which were within 12 days of transplanting (Figure 4a).
Compared with the rice above-ground height estimation of SWCM, the accuracy and convergence of PF were higher, as shown in Figure 6. The main reason for this was that the PF approach not only described the evolution of rice height but also further estimated rice height using the relationships between rice height and radar scattering. We proved that the Sigmoidal Richards model could predict the next height (x) using the last known height (x), and the polynomial curve could be used to conduct accurate height estimation. This was also the reason that the estimation of the above-ground height was consistent with the ground truth data, with a slight variation in backscatter powers at the ripening stage.
6. Conclusions
In this study, the spatio-temporal distributions of rice above-ground height estimation were determined by PF and SWCM using Sentinel-1A time-series data on the basis of rice map and transplanting date. Rice height had a better fit with VH backscatter compared to VV backscatter, the / ratio and RVI. Therefore, the VH backscatter parameter was used for rice height estimation in our studies. The results depicted that rice height estimation by PF had a better result, with an RMSE equal to 7.36 cm and R of 0.95 compared to SWCM (RMSE = 12.59 cm and R = 0.86). The reason for this was that PF was based on a better fitting curve for a prediction model and an observation model, and SWCM was influenced more by the various incidence angle and soil moisture contents, especially at the early vegetative stage. In terms of spatial distribution, rice height in the south and east of the study area was higher than that in the north and west. The reason for this is that the south and east are near to the South China Sea, and they have higher temperatures at the early vegetative stage of rice. From our results, it is evident that the VH backscatter of the Sentinel-1A time-series images and PF method have the desired effect for the estimation of the spatio-temporal distribution of rice’s above-ground height. As a result, the PF method could contribute greatly to improvements in crop mapping, crop health modeling and crop yield predictions.
Author Contributions
Conceptualization: H.Y. and W.W.; Data curation: H.Y., H.L., J.Z. and B.P.; Formal analysis: H.Y., W.W. and N.L.; Writing—original draft: H.Y.; Visualization and validation: H.Y. and B.P. All authors have read and agreed to the published version of the manuscript.
Funding
This research was supported by the National Natural Science Foundation of China under grants 42101386 and 61871175; the College Key Research Project of Henan Province under grants 22A520021 and 21A520004; the Plan of Science and Technology of Henan Province under grants 212102210093.
Institutional Review Board Statement
Not applicable.
Informed Consent Statement
Not applicable.
Data Availability Statement
Sentinel-1A data are openly available via ESA, and other data are available upon request from the first author.
Acknowledgments
The authors are thankful to the Institute of Surveying & Mapping, Department of Land & Resources of Guangdong Province for their support during field campaigns.
Conflicts of Interest
The authors declare no conflict of interest.
References
- Lee, S.-K.; Yoon, S.Y.; Won, J.-S. Vegetation height estimate in rice fields using single polarization TanDEM-X science phase data. Remote Sens. 2018, 10, 1702. [Google Scholar] [CrossRef] [Green Version]
- Wassmann, R.; Lantin, R.; Neue, H.; Buendia, L.; Corton, T.; Lu, Y. Characterization of methane emissions from rice fields in Asia. III. Mitigation options and future research needs. Nutr. Cycl. Agroecosyst. 2000, 58, 23–36. [Google Scholar] [CrossRef]
- Le Toan, T.; Ribbes, F.; Wang, L.-F.; Floury, N.; Ding, K.-H.; Kong, J.A.; Fujita, M.; Kurosu, T. Rice crop mapping and monitoring using ERS-1 data based on experiment and modeling results. IEEE Trans. Geosci. Remote Sens. 1997, 35, 41–56. [Google Scholar] [CrossRef]
- Ballester-Berman, J.D.; Lopez-Sanchez, J.M.; Fortuny-Guasch, J. Retrieval of Biophysical Parameters of Agricultural Crops Using Polarimetric Sar Interferometry. IEEE Trans. Geosci. Remote Sens. 2005, 43, 683–694. [Google Scholar] [CrossRef]
- Yang, Z.; Li, K.; Shao, Y.; Brisco, B.; Liu, L. Estimation of paddy rice variables with a modified water cloud model and improved polarimetric decomposition using multi-temporal RADARSAT-2 images. Remote Sens. 2016, 8, 878. [Google Scholar] [CrossRef] [Green Version]
- Ndikumana, E.; Ho Tong Minh, D.; Dang Nguyen, H.T.; Baghdadi, N.; Courault, D.; Hossard, L.; El Moussawi, I. Estimation of Rice Height and Biomass Using Multitemporal SAR Sentinel-1 for Camargue, Southern France. Remote Sens. 2018, 10, 1394. [Google Scholar] [CrossRef] [Green Version]
- Xie, Q.; Wang, J.; Lopez-Sanchez, J.M.; Peng, X.; Liao, C.; Shang, J.; Zhu, J.; Fu, H.; Ballester-Berman, J.D. Crop Height Estimation of Corn from Multi-Year RADARSAT-2 Polarimetric Observables Using Machine Learning. Remote Sens. 2021, 13, 392. [Google Scholar] [CrossRef]
- Tilly, N.; Hoffmeister, D.; Cao, Q.; Huang, S.; Lenz-Wiedemann, V.; Miao, Y.; Bareth, G. Multitemporal crop surface models: Accurate plant height measurement and biomass estimation with terrestrial laser scanning in paddy rice. J. Appl. Remote Sens. 2014, 8, 083671. [Google Scholar] [CrossRef]
- Hoffmeister, D.; Waldhoff, G.; Korres, W.; Curdt, C.; Bareth, G. Crop height variability detection in a single field by multi-temporal terrestrial laser scanning. Precis. Agric. 2016, 17, 296–312. [Google Scholar] [CrossRef]
- Rossi, C.; Erten, E. Paddy-rice monitoring using TanDEM-X. IEEE Trans. Geosci. Remote Sens. 2014, 53, 900–910. [Google Scholar] [CrossRef] [Green Version]
- Erten, E.; Lopez-Sanchez, J.M.; Yuzugullu, O.; Hajnsek, I. Retrieval of agricultural crop height from space: A comparison of SAR techniques. Remote Sens. Environ. 2016, 187, 130–144. [Google Scholar] [CrossRef] [Green Version]
- Yuzugullu, O.; Erten, E.; Hajnsek, I. Crop height estimation of rice fields by X-and C-Band PolSAR. In Proceedings of the 11th European Conference on Synthetic Aperture Radar, Hamburg, Germany, 6–9 June 2016. [Google Scholar]
- Yuzugullu, O.; Erten, E.; Hajnsek, I. Estimation of rice crop height from X-and C-band PolSAR by metamodel-based optimization. IEEE J. Sel. Top. Appl. Earth Obs. Remote Sens. 2016, 10, 194–204. [Google Scholar] [CrossRef] [Green Version]
- Yuzugullu, O.; Erten, E.; Hajnsek, I. A multi-year study on rice morphological parameter estimation with X-band PolSAR data. Appl. Sci. 2017, 7, 602. [Google Scholar] [CrossRef] [Green Version]
- Yuzugullu, O.; Erten, E.; Hajnsek, I. Assessment of paddy rice height: Sequential inversion of coherent and incoherent models. IEEE J. Sel. Top. Appl. Earth Obs. Remote Sens. 2018, 11, 3001–3013. [Google Scholar] [CrossRef]
- Lopez-Sanchez, J.M.; Ballester-Berman, J.D.; Marquez-Moreno, Y. Model limitations and parameter-estimation methods for agricultural applications of polarimetric SAR interferometry. IEEE Trans. Geosci. Remote Sens. 2007, 45, 3481–3493. [Google Scholar] [CrossRef] [Green Version]
- Lopez-Sanchez, J.M.; Vicente-Guijalba, F.; Erten, E.; Campos-Taberner, M.; Garcia-Haro, F.J. Retrieval of vegetation height in rice fields using polarimetric SAR interferometry with TanDEM-X data. Remote Sens. Environ. 2017, 192, 30–44. [Google Scholar] [CrossRef] [Green Version]
- Lopez-Sanchez, J.M.; Hajnsek, I.; Ballester-Berman, J.D. First demonstration of agriculture height retrieval with PolInSAR airborne data. IEEE Geosci. Remote Sens. Lett. 2011, 9, 242–246. [Google Scholar] [CrossRef]
- Veloso, A.; Mermoz, S.; Bouvet, A.; Le Toan, T.; Planells, M.; Dejoux, J.F.; Ceschia, E. Understanding the temporal behavior of crops using Sentinel-1 and Sentinel-2-like data for agricultural applications. Remote Sens. Environ. 2017, 199, 415–426. [Google Scholar] [CrossRef]
- Ndikumana, E.; Minh, D.H.T.; Thu, D.N.H.; Baghdadi, N.; Courault, D.; Hossard, L.; El Moussawi, I. Rice height and biomass estimations using multitemporal SAR Sentinel-1: Camargue case study. In Proceedings of the Remote Sensing for Agriculture, Ecosystems, and Hydrology XX, Berlin, Germany, 10 October 2018. [Google Scholar]
- Sharifi, A.; Hosseingholizadeh, M. Application of sentinel-1 data to estimate height and biomass of rice crop in Astaneh-ye Ashrafiyeh, Iran. J. Indian Soc. Remote Sens. 2020, 48, 11–19. [Google Scholar] [CrossRef]
- Phan, H.; Le Toan, T.; Bouvet, A. Understanding Dense Time Series of Sentinel-1 Backscatter from Rice Fields: Case Study in a Province of the Mekong Delta, Vietnam. Remote Sens. 2021, 13, 921. [Google Scholar] [CrossRef]
- Zhang, Y.; Liu, X.; Su, S.; Wang, C. Retrieving canopy height and density of paddy rice from Radarsat-2 images with a canopy scattering model. Int. J. Appl. Earth Obs. Geoinf. 2014, 28, 170–180. [Google Scholar] [CrossRef]
- Engdahl, M.E.; Borgeaud, M.; Rast, M. The use of ERS-1/2 tandem interferometric coherence in the estimation of agricultural crop heights. Int. J. Appl. Earth Obs. Geoinf. 2001, 39, 1799–1806. [Google Scholar] [CrossRef]
- Wegmuller, U.; Werner, C. Retrieval of vegetation parameters with SAR interferometry. IEEE Trans. Geosci. Remote Sens. 1997, 35, 18–24. [Google Scholar] [CrossRef]
- Erten, E.; Rossi, C.; Yüzügüllü, O. Polarization impact in TanDEM-X data over vertical-oriented vegetation: The paddy-rice case study. IEEE Geosci. Remote Sens. Lett. 2015, 12, 1501–1505. [Google Scholar] [CrossRef] [Green Version]
- Cloude, S.; Papathanassiou, K. Three-stage inversion process for polarimetric SAR interferometry. IEEE Proc.-Radar Sonar Navig. 2003, 150, 125–134. [Google Scholar] [CrossRef] [Green Version]
- Hajnsek, I.; Kugler, F.; Lee, S.-K.; Papathanassiou, K.P. Tropical-forest-parameter estimation by means of Pol-InSAR: The INDREX-II campaign. IEEE Trans. Geosci. Remote Sens. 2009, 47, 481–493. [Google Scholar] [CrossRef] [Green Version]
- Kugler, F.; Schulze, D.; Hajnsek, I.; Pretzsch, H.; Papathanassiou, K.P. TanDEM-X Pol-InSAR performance for forest height estimation. IEEE Trans. Geosci. Remote Sens. 2014, 52, 6404–6422. [Google Scholar] [CrossRef]
- Jörg, H.; Pardini, M.; Hajnsek, I.; Papathanassiou, K.P. First multi-frequency investigation of SAR tomography for vertical structure of agricultural crops. In Proceedings of the 10th European Conference on Synthetic Aperture Radar, Berlin, Germany, 3–5 June 2014. [Google Scholar]
- Pichierri, M.; Hajnsek, I. Comparing performances of crop height inversion schemes from multifrequency pol-InSAR data. IEEE J. Sel. Top. Appl. Earth Obs. Remote Sens. 2017, 10, 1727–1741. [Google Scholar] [CrossRef]
- Romero-Puig, N.; Lopez-Sanchez, J.M. Comparing Insar Methodologies for the Retrieval of Paddy Rice Height with TanDEM-X Data. In Proceedings of the IGARSS 2020 -IEEE International Geoscience and Remote Sensing Symposium, Waikoloa, HI, USA, 26 September–2 October 2020. [Google Scholar]
- Yuzugullu, O.; Marelli, S.; Erten, E.; Sudret, B.; Hajnsek, I. Determining rice growth stage with X-band SAR: A metamodel based inversion. Remote Sens. 2017, 9, 460. [Google Scholar] [CrossRef] [Green Version]
- Chen, H.; Cloude, S.R.; Goodenough, D.G. Forest canopy height estimation using Tandem-X coherence data. IEEE J. Sel. Top. Appl. Earth Obs. Remote Sens. 2016, 9, 3177–3188. [Google Scholar] [CrossRef]
- Cloude, S.R.; Papathanassiou, K.P. Polarimetric SAR interferometry. IEEE Trans. Geosci. Remote Sens. 1998, 36, 1551–1565. [Google Scholar] [CrossRef]
- Managhebi, T.; Maghsoudi, Y.; Zoej, M.J.V. An improved three-stage inversion algorithm in forest height estimation using single-baseline polarimetric sar interferometry data. IEEE J. Sel. Top. Appl. Earth Obs. Remote Sens. 2018, 15, 887–891. [Google Scholar] [CrossRef]
- Simard, M.; Denbina, M. An assessment of temporal decorrelation compensation methods for forest canopy height estimation using airborne L-band same-day repeat-pass polarimetric SAR interferometry. IEEE Geosci. Remote Sens. Lett. 2017, 11, 95–111. [Google Scholar] [CrossRef]
- Chauhan, S.; Srivastava, H.S.; Patel, P. Crop Height Estimation Using RISAT-1 Hybrid-Polarized Synthetic Aperture Radar Data. IEEE J. Sel. Top. Appl. Earth Obs. Remote Sens. 2019, 12, 2928–2933. [Google Scholar] [CrossRef]
- Mandal, D.; Kumar, V.; Lopez-Sanchez, J.M.; Bhattacharya, A.; McNairn, H.; Rao, Y. Crop biophysical parameter retrieval from Sentinel-1 SAR data with a multi-target inversion of Water Cloud Model. Int. J. Remote Sens. 2020, 41, 5503–5524. [Google Scholar] [CrossRef]
- De Bernardis, C.G.; Vicente-Guijalba, F.; Martinez-Marin, T.; Lopez-Sanchez, J.M. Estimation of key dates and stages in rice crops using dual-polarization SAR time series and a particle filtering approach. IEEE J. Sel. Top. Appl. Earth Obs. Remote Sens. 2014, 8, 1008–1018. [Google Scholar] [CrossRef] [Green Version]
- Yang, H.; Pan, B.; Li, N.; Wang, W.; Zhang, J.; Zhang, X. A systematic method for spatio-temporal phenology estimation of paddy rice using time series Sentinel-1 images. Remote Sens. Environ. 2021, 259, 112394. [Google Scholar] [CrossRef]
- Yang, H.; Pan, B.; Wu, W.; Tai, J. Field-based rice classification in Wuhua county through integration of multi-temporal Sentinel-1A and Landsat-8 OLI data. Int. J. Appl. Earth Obs. Geoinf. 2018, 69, 226–236. [Google Scholar] [CrossRef]
- Attema, E.; Ulaby, F.T. Vegetation modeled as a water cloud. Radio Sci. 1978, 13, 357–364. [Google Scholar] [CrossRef]
- Yadav, V.P.; Prasad, R.; Bala, R.; Vishwakarma, A.K. An improved inversion algorithm for spatio-temporal retrieval of soil moisture through modified water cloud model using C-band Sentinel-1A SAR data. Comput. Electron. Agric. 2020, 173, 105447. [Google Scholar] [CrossRef]
- Richards, F. A flexible growth function for empirical use. J. Exp. Bot. 1959, 10, 290–301. [Google Scholar] [CrossRef]
- Phung, H.P.; Nguyen, L.D.; Thong, N.H.; Thuy, L.T.; Apan, A.A. Monitoring rice growth status in the mekong delta, vietnam using multitemporal sentinel-1 data. J. Appl. Remote Sens. 2020, 14, 014518. [Google Scholar] [CrossRef] [Green Version]
- Galán, C.; García-Mozo, H.; Cariñanos, P.; Alcázar, P.; Domínguez-Vilches, E. The role of temperature in the onset of the Olea europaea L. pollen season in southwestern Spain. Int. J. Biometeorol. 2001, 45, 8–12. [Google Scholar] [CrossRef] [PubMed]
- De Bernardis, C.; Vicente-Guijalba, F.; Martinez-Marin, T.; Lopez-Sanchez, J.M. Contribution to real-time estimation of crop phenological states in a dynamical framework based on NDVI time series: Data fusion with SAR and temperature. IEEE J. Sel. Top. Appl. Earth Obs. Remote Sens. 2016, 9, 3512–3523. [Google Scholar] [CrossRef] [Green Version]
- Canisius, F.; Shang, J.; Liu, J.; Huang, X.; Ma, B.; Jiao, X.; Geng, X.; Kovacs, J.M.; Walters, D. Tracking crop phenological development using multi-temporal polarimetric Radarsat-2 data. Remote Sens. Environ. 2018, 210, 508–518. [Google Scholar] [CrossRef]
- Mandal, D.; Kumar, V.; Ratha, D.; Dey, S.; Bhattacharya, A.; Lopez-Sanchez, J.M.; McNairn, H.; Rao, Y.S. Dual polarimetric radar vegetation index for crop growth monitoring using sentinel-1 SAR data. Remote Sens. Environ. 2020, 247, 111954. [Google Scholar] [CrossRef]
- Nasirzadehdizaji, R.; Balik Sanli, F.; Abdikan, S.; Cakir, Z.; Sekertekin, A.; Ustuner, M. Sensitivity analysis of multi-temporal Sentinel-1 SAR parameters to crop height and canopy coverage. Appl. Sci. 2019, 9, 655. [Google Scholar] [CrossRef] [Green Version]
- Jia, M.; Tong, L.; Zhang, Y.; Chen, Y.; Chopra, R. Multi-temporal radar backscattering measurements and modelling of rice fields using a multi-frequency (L, S, C, and X) scatterometer. Int. J. Remote Sens. 2014, 35, 1253–1271. [Google Scholar] [CrossRef]
- De Bernardis, C.; Vicente-Guijalba, F.; Martinez-Marin, T.; Lopez-Sanchez, J.M. Particle filter approach for crop phenological stage estimation using time series of NDVI images. In Proceedings of the IEEE International Geoscience and Remote Sensing Symposium, Milano, Italy, 26–31 July 2015. [Google Scholar]


Publisher’s Note: MDPI stays neutral with regard to jurisdictional claims in published maps and institutional affiliations. |
© 2022 by the authors. Licensee MDPI, Basel, Switzerland. This article is an open access article distributed under the terms and conditions of the Creative Commons Attribution (CC BY) license (https://creativecommons.org/licenses/by/4.0/).