Article

Remote Sensing of Wave Overtopping on Dynamic Coastal Structures

1
Centre for Infrastructure, Geotechnics and Water Engineering, Department of Architecture and Civil Engineering, University of Bath, Bath BA2 7AY, UK
2
School of Civil Engineering, University of Queensland, St Lucia, QLD 4072, Australia
3
BRGM, Regional Direction Nouvelle-Aquitaine, 33600 Pessac, France
4
IFREMER Arcachon, 33120 Arcachon, France
5
Instituto de Oceanografia, Campus Carreiros, Universidade Federal do Rio Grande (FURG), Avenida Italia, Km 8, Rio Grande 96203-900, Brazil
6
+ATLANTIC LVT, Edifício LACS Estrada da Malveira da Serra 920, 2750-834 Cascais, Portugal
7
Forschungszentrum Küste (FZK), Leibniz University Hannover & Technische Universität Braunschweig, Merkurstraße 11, 30419 Hannover, Germany
*
Author to whom correspondence should be addressed.
Remote Sens. 2022, 14(3), 513; https://doi.org/10.3390/rs14030513
Submission received: 8 December 2021 / Revised: 13 January 2022 / Accepted: 15 January 2022 / Published: 21 January 2022
(This article belongs to the Special Issue New Advances in Coastal Processes and Dynamics Using LiDAR)

Abstract

:
The development of coastal regions combined with rising sea levels is leading to an increasing risk of coastal flooding caused by wave overtopping of natural beaches and engineered coastal structures. Previous measurements of wave overtopping have been obtained for static coastal structures using fixed current meters and depth sensors or tanks. These are unsuitable for dynamically stable coastal protection structures however, because the geometry of these structures is expected to evolve under wave action. This study investigates the potential to use elevated 2D laser scanners (Lidar) to remotely sense the flow volumes overtopping the time-varying crest of a porous dynamic cobble berm revetment. Two different analysis methods were used to estimate the wave-by-wave overtopping volumes from measurements of the time-varying free surface elevation with good agreement. The results suggest that the commonly used EurOtop parameterisation can be used to estimate overtopping discharge to an acceptable precision. An advantage of the remote sensing approach reported here is that it enables the spatial distribution of overtopping discharge and infiltration rate to be measured. It was found that the overtopping discharge on a porous dynamic revetment decays rapidly landward of the structure crest, and that this has implications for safety and structure design.

1. Introduction

Continued population growth combined with sea-level rise and climate change-related increases in storm intensity are placing ever-greater stress on the coastal zone, leading to increased reliance on existing coastal protection structures or the installation of new defences. Management of wave overtopping is a key criterion in the design of coastal protection structures, which must be designed to restrict overtopping to tolerable levels during design storm conditions.
Historical design guidance has typically focussed on limiting time-averaged overtopping discharge to minimise coastal flood risk. However, experimental evidence suggests that the peak discharge during individual overtopping events can be several orders of magnitude larger than the mean value and poses substantial hazards to people or vehicles [1]. As a result, recent design guidance also specifies acceptable limits on peak overtopping discharge for different structure types and safety considerations [2].
Wave overtopping of fixed coastal structures is typically measured using overtopping tanks which capture the flow volumes that pass over the structure crest in the laboratory [3,4,5]. Overtopping volumes are then estimated by measuring the water volume or mass collected within the overtopping tank. Field measurement of wave overtopping using tanks has also been undertaken but is limited to a relatively small number of studies [4,6,7] due to the practical challenges of applying this method in field conditions. A recent alternative to this approach is the WireWall system which uses a 3D array of capacitance wires mounted in a frame at the crest of a coastal structure [8]. This approach is designed to overcome some of the limitations of overtopping tanks which include tank capacity limits, challenges in measuring longshore variability and the lack of depth and velocity data for the captured overtopping flows. These approaches are limited to static structures. Here, we explore the use of Lidar to determine overtopping rates on dynamic coastal structures or dynamic morphology.
Dynamic cobble berm revetments are coastal structures that are designed to mimic the gravel barriers which form around the high tide shoreline of composite beaches and are fronted by a typically dissipative sand beach which is exposed at lower tide levels [9,10]. These ridges, whether natural or artificial, consist of pebbles or cobbles and are expected to continuously reshape under wave action, but maintain a coherent structure which provides overtopping protection to the hinterland [11]. Because the geometry of such structures varies naturally in response to wave forcing and water levels, it is not possible to design a fixed crest elevation to provide a defined level of wave overtopping protection. Nonetheless, it is important to understand the overtopping performance of these structures to determine their suitability for a particular location. Measurement of overtopping on a non-fixed structure is challenging however because the cross-shore location and elevation of the structure crest constantly changes during energetic overtopping conditions and as such, the use of fixed devices such as overtopping tanks or WireWall is unsuitable.
In their review of beach overtopping and overwash processes, Matias and Masselink [12] note that only a small number of researchers have presented field measurements of overtopping hydrodynamics on sand and gravel barriers [13,14,15,16,17]. Furthermore, these are typically confined to overtopping velocities and depths for a small number of events due to the challenges of obtaining measurements on a mobile feature during the storm conditions generally associated with overtopping events. It is noted that on natural barriers, the term “overwash” is typically used to describe flows which substantially exceed the crest and deposit sediment onto the backbarrier, while “overtopping” is used to describe events which just reach the crest and tend to lead to crest buildup [18]. Hereafter in this paper, the term “overtopping” will be used to describe flows which exceed the crest of both natural barriers and coastal structures.
The most comprehensive measurements of overtopping hydrodynamics on gravel and sand barriers were obtained during the large-scale BARDEX laboratory experiments [19,20]. These studies used video and an array of ultrasonic altimeters to obtain wave-by-wave measurements of flow velocities, intrusion distances and discharge, taking into account the variation in barrier crest location as the barrier evolved under wave action.
Hofland et al. [21] demonstrated the use of a single 2D Lidar to measure “virtual” wave overtopping volumes and discharge. This was done by integrating the flow depths landward of a chosen “virtual crest” location on a non-overtopped 1:3 planar dike slope in a large-scale laboratory flume. They hypothesised that the peak volume for each virtual overtopping event would represent a reasonable estimate of the volume of water that would have overtopped the virtual crest if the slope were truncated at that location. The results obtained using this method compared well to established parameterisations for wave overtopping on a plane slope. The approach was further developed by Oosterloo et al. [22] for application to oblique wave overtopping. Almeida et al. [17] used a different approach to estimate overtopping discharge at a large gravel barrier at Loe Bar, England using 2D Lidar. They assumed that a timeseries of overtopping discharge could be estimated as the product of the flow depth at the crest (hc) and the shoreline velocity (us) and reported the first field measurements of overtopping discharge by individual waves for 12 events, recording peak values of up to 780 L/s/m.
An understanding of wave overtopping on dynamic coastal structures is essential to enable robust design, however minimal useful data currently exists due to limitations in traditional overtopping measurement techniques to obtain reliable laboratory or field data on a non-fixed structure. This paper will investigate the ability of 2D scanning Lidar to measure the spatial distribution of overtopping discharge on a dynamic cobble berm revetment structure using data from two large-scale laboratory experiments. The measured overtopping volumes are compared to the general wave overtopping formulation presented in [2] and the relationship between the overtopping rate and the deficit in freeboard is investigated.

2. Materials and Methods

2.1. Experimental Setup

Two experiments (DynaRev1 and 2) designed to investigate the performance of a dynamic cobble berm revetment under a rising water level and varying wave conditions were undertaken in the Large Wave Flume (Großer Wellenkanal, GWK) in Hannover, Germany. The GWK flume is 309 m long, 7 m deep and 5 m wide and equipped with a combined piston-flap type wavemaker. All coordinates are given as the distance from the wave paddle rest position (x = 0 m) and elevation above the horizontal flume bed (z = 0 m).
DynaRev1 (1DR) is described in detail in [10,23] and was completed during August and September 2017. In summary, a dynamic cobble berm revetment with an initial slope of 1:6 (tanβ = 0.167) was constructed using well-sorted, rounded cobbles (D50 = 63 mm, D85/D15 = 1.32, porosity, ∅ = 0.41) on a sand beach profile (D50 = 0.33 mm) which had developed after 20 h of constant wave forcing (Hs = 0.8 m, Tp = 6.0 s) (see Figure 1a). The water level was then increased in steps of 0.1 m from zWL = 4.6 m to 4.9 m, with 7 h of testing at all water levels except zWL = 4.9 m which lasted 17 h. The experimental testing was broken down into a series of test runs ranging in duration from 20 min to 3 h. At all water levels, the same two-hour long wave paddle signal was generated to produce an identical timeseries of waves at the wave paddle, taking water depth into account. Following the water level rise increments, the short-term response of the revetment was measured at the final water level (zWL = 4.9 m) for a range of different wave conditions (0.00791 < Ho/Lo < 0.0142) during a further 13 h of testing (see Figure 2a). The final profile of the revetment and underlying sand beach are shown in Figure 1a. It was observed that there was substantial loss of sediment from beneath the revetment during the experiment, an increase in the gradient to tanβ = 0.24, and only a small rise in crest elevation (see Bayle et al., 2020).
DynaRev2 (2DR) was completed during December 2019 and was almost identical to DynaRev1 except that the revetment was constructed using poorly-sorted angular pebbles and cobbles (D50 = 44 mm, D85/D15 = 3.79) leading to a lower porosity, ∅ = 0.35. The beach and revetment profiles were translated 11 m further from the paddle due to a reduced availability of sand and a slightly different test series order was used at the final water level (Figure 2b). Due to the greater difficulty of shaping the irregular stone used in DynaRev2, the initial revetment profile was more irregular than that for DynaRev1. Note also that the wider grading and greater angularity (leading to increased interlocking) of the stone used during DynaRev2 led to the development of a much more pronounced crest feature and increased gradient (tanβ = 0.25) once waves began to overtop the structure (see x = 272.8 m in Figure 1b).
During both experiments, an array of three SICK LMS511 2D scanning Lidar were installed in the flume roof to measure surf and swash processes at 25 Hz and with an angular resolution of 0.167°. In this paper, only the most landward Lidar which was just seaward of the revetment toe and covered approximately a 30 m swath was used (x = 255 m, z = 11.8 m (1DR), x = 266 m, z = 11.8 m (2DR)).
The analysis presented in this manuscript focusses on the most elevated water level testing at zWL = 4.8 m and 4.9 m when overtopping of the revetment crest occurred. In both experiments, the range of wave conditions tested was relatively limited (Figure 2a,b). However, the variability of the revetment geometry and crest elevation meant that a large range of relative freeboard (Rc/Ho) and deficit in freeboard values (Rdef) were captured:
R c = z c z S W L ,
R d e f = R 2 % z c ,
where zc is the revetment crest elevation, zSWL is the elevation of the still water level and R2% is the predicted 2% exceedance wave runup elevation. Experimentally and theoretically, on a plane slope, the overtopping scales with the square of the deficit in freeboard [24]. In this paper, R2% above the measured MWL at the shoreline is estimated using a runup equation developed specifically for composite beaches using data from field experiments [10,17,25] and the DynaRev experiments reported here:
R 2 % = 3.11 H m 0 tan β + 0.26 ,
where Hm0 is the spectral significant wave height at the revetment toe and tanβ is the revetment gradient.

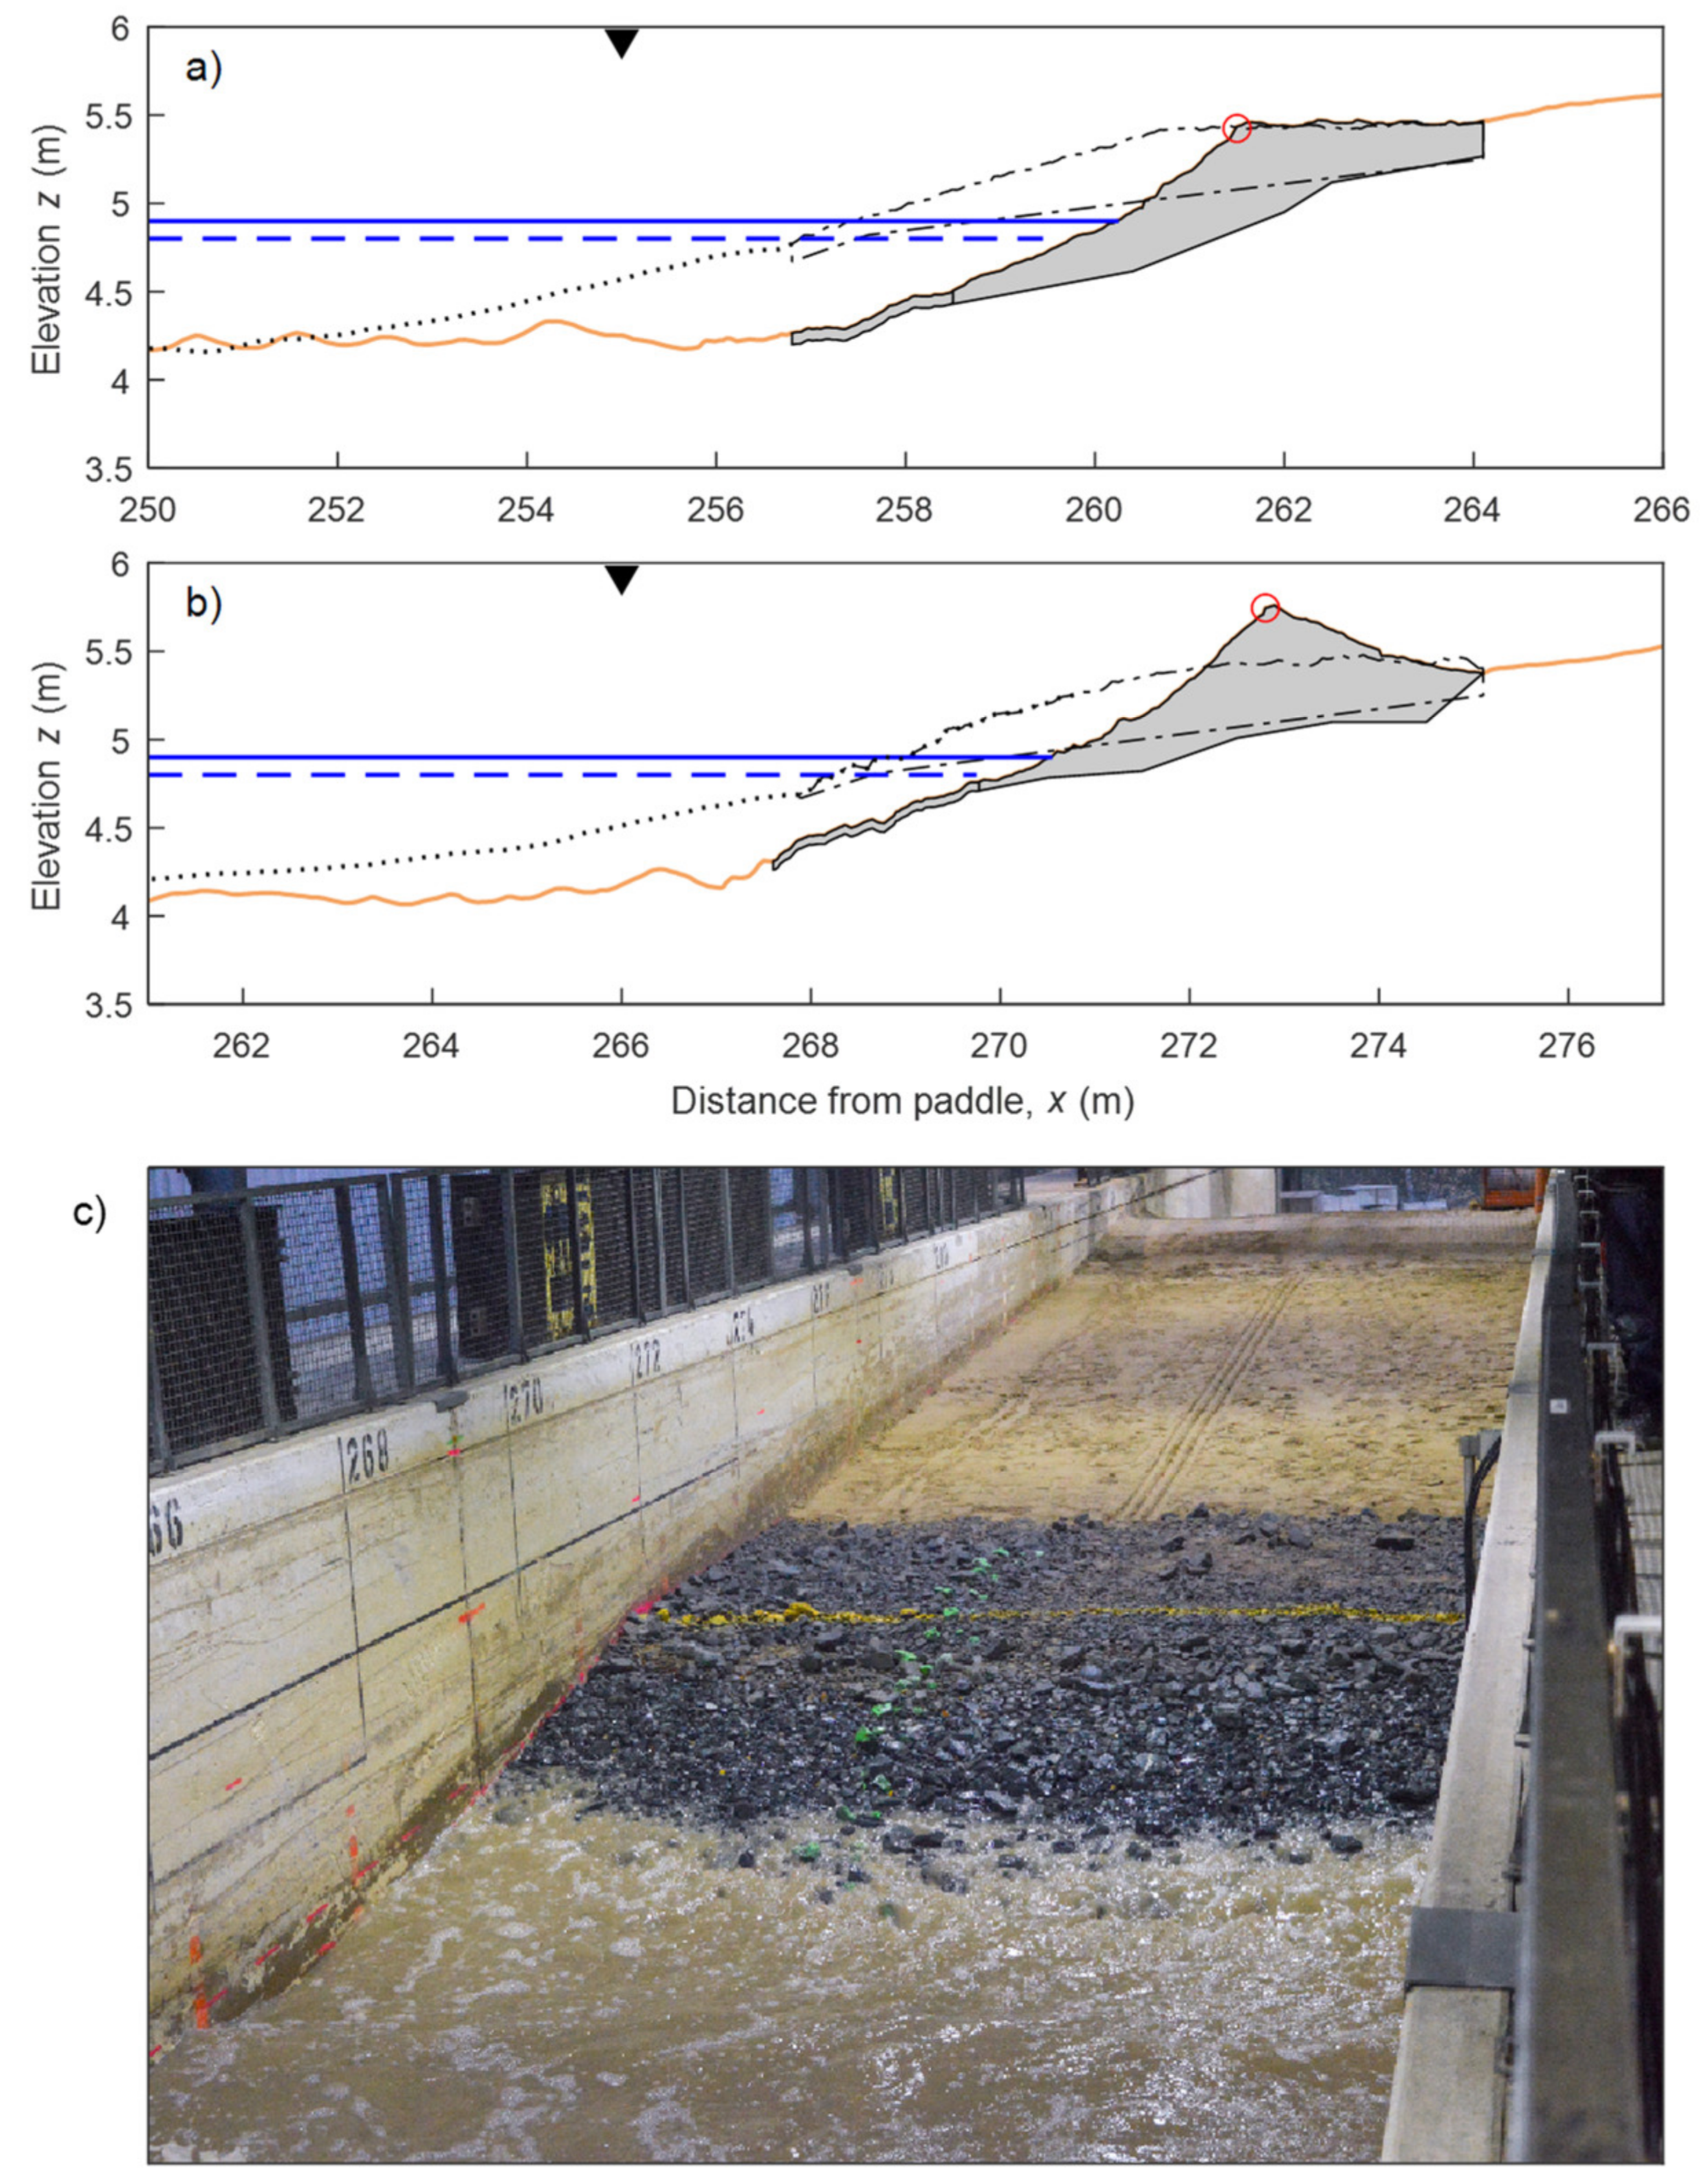
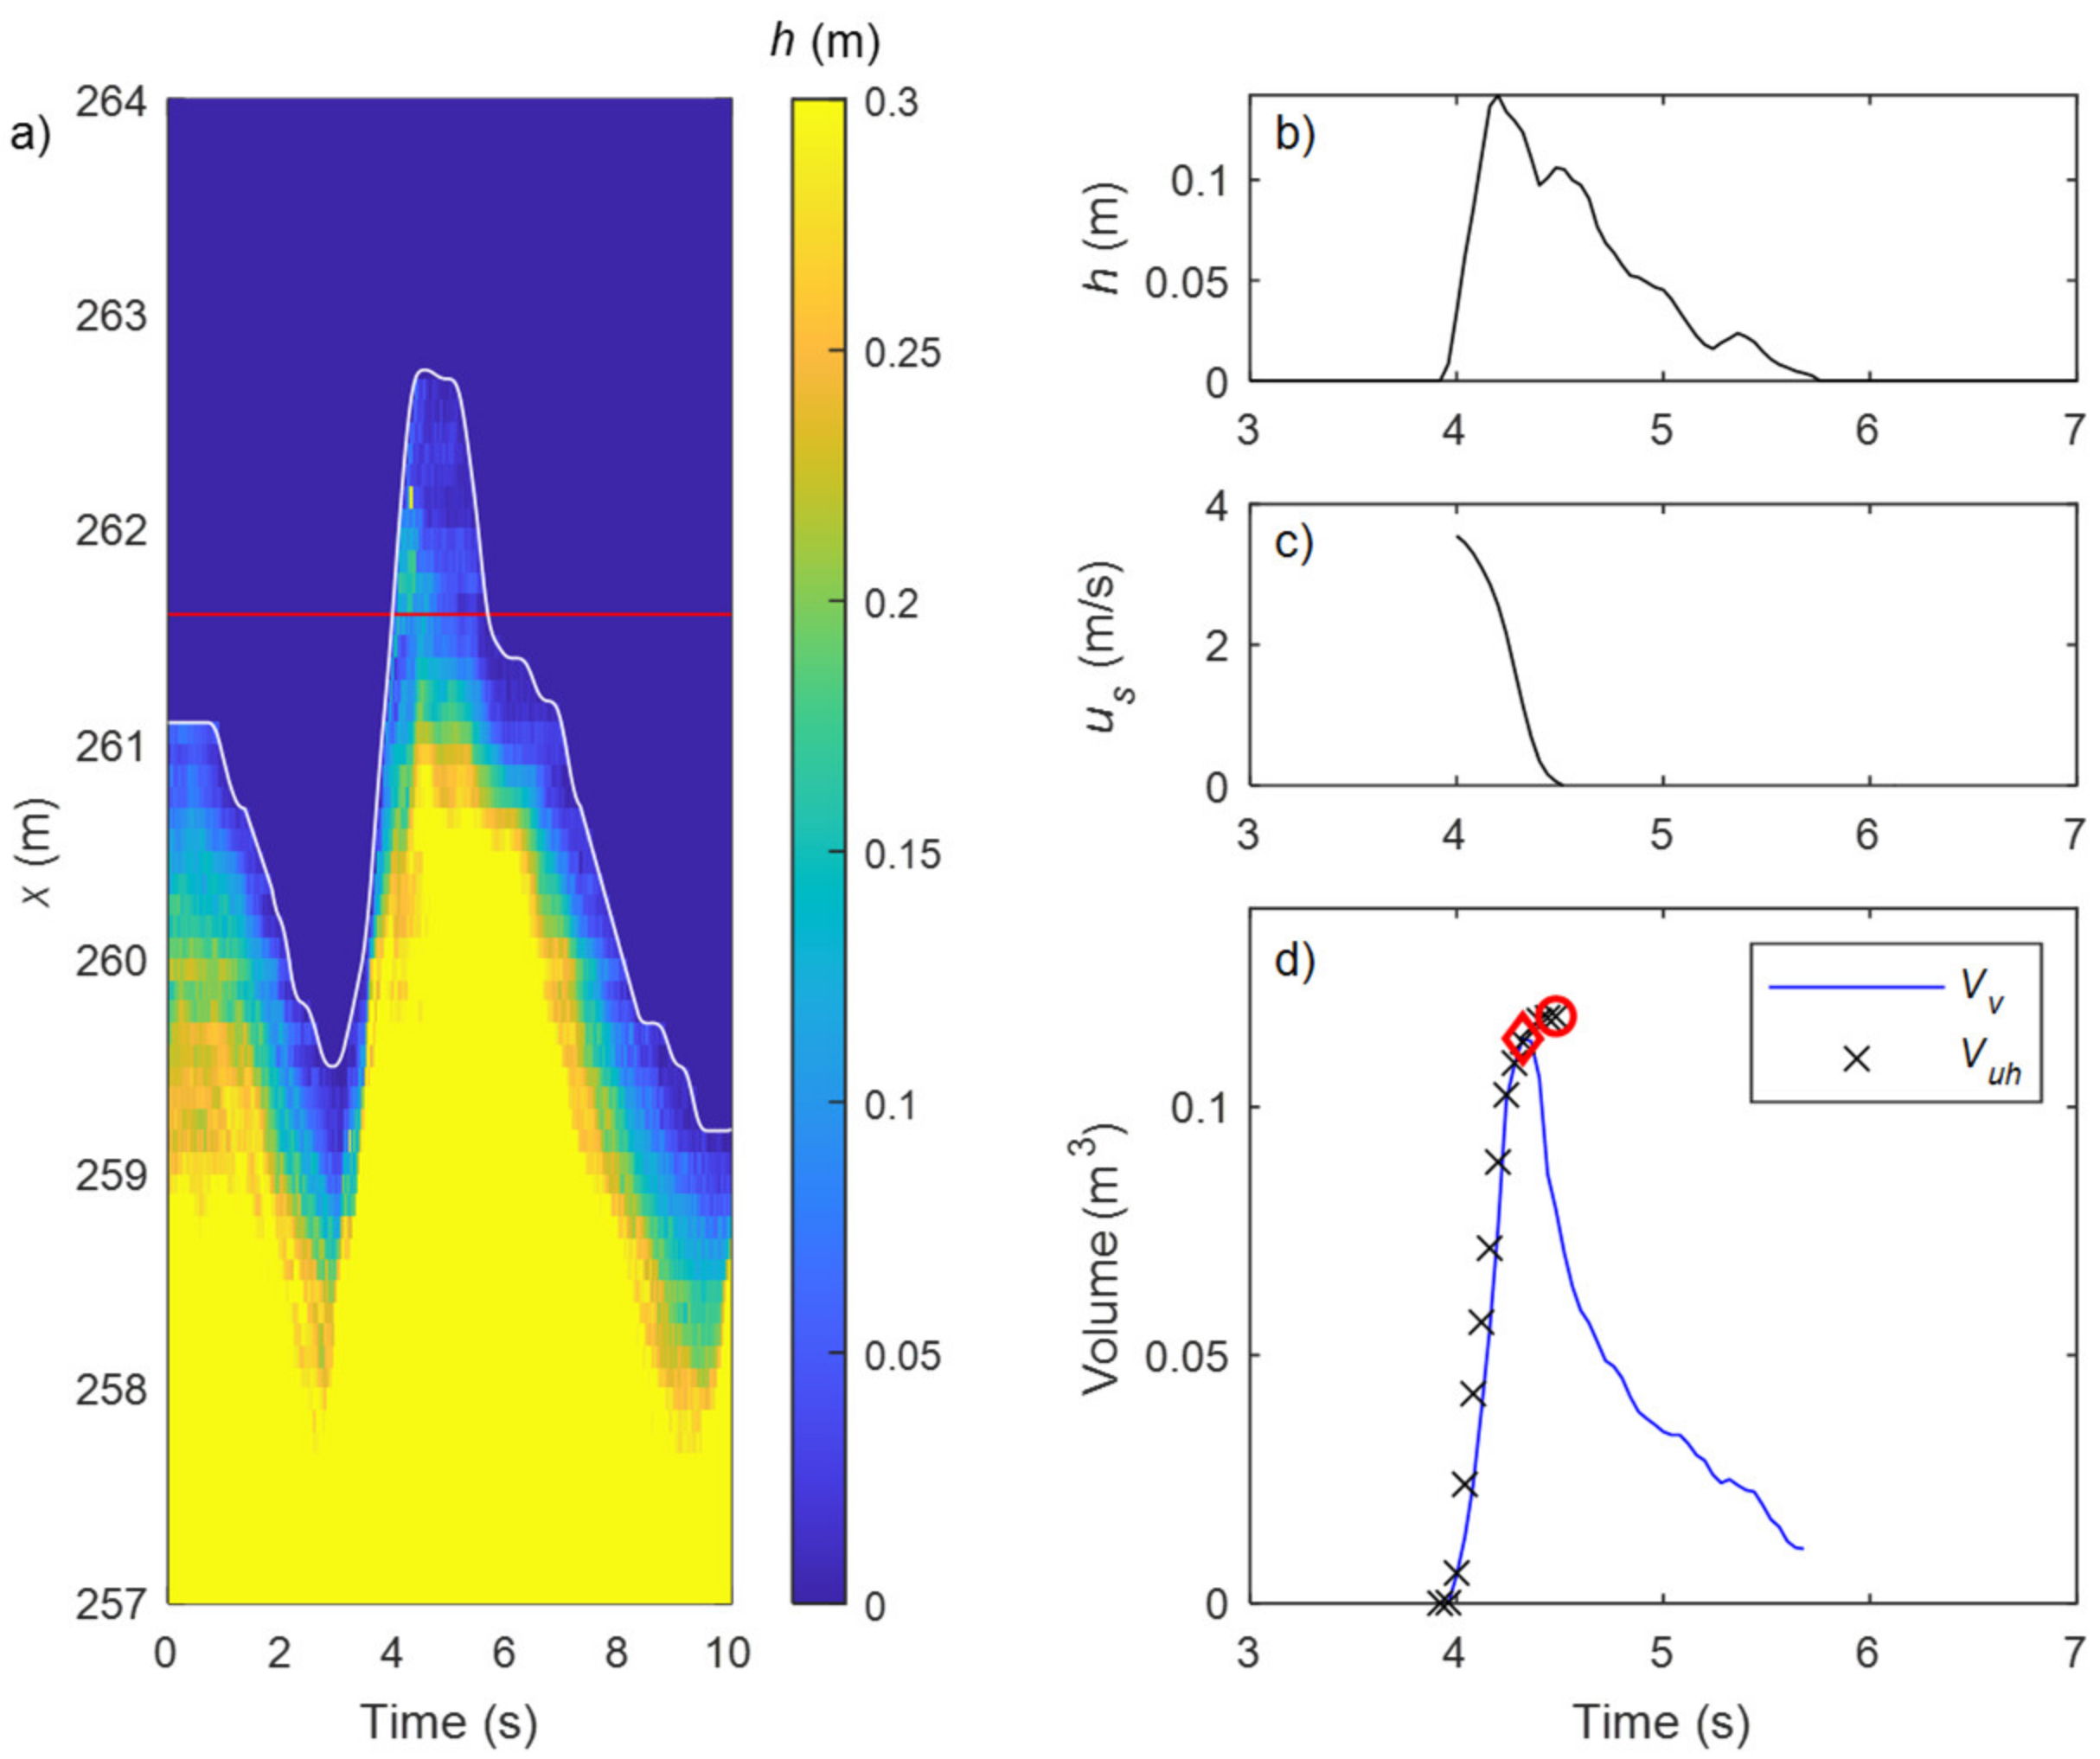
2.2. Lidar Measurements of Wave Overtopping

The 2D scanning Lidar used in the experiments reported here enable high spatio-temporal resolution measurements of both the time-varying bed elevation (when the bed is exposed) and the swash surface elevation (when the bed is submerged). The Lidar dataset was converted from polar to cartesian coordinates and interpolated onto a horizontal grid (Δx = 0.1 m). These data were then post-processed using the method of Almeida et al. [26] to generate separate timeseries of: (1) continuous beach profile measurements z(x, t) updated on a swash-by-swash timescale from which the time-varying crest location can be obtained (see Figure 1); and (2) swash hydrodynamics including swash/overtopping flow depths h(x, t) and horizontal shoreline position Xs(t) (see Figure 3a).
Wave overtopping events were identified by applying a zero-upcrossing method to the shoreline timeseries with the horizontal crest location xc(t) as the datum. Only events where the peak water depth at the crest exceeded 0.05 m were considered as valid overtopping events in the analysis presented here. As such the overtopping percentage values presented in Figure 2e,f are smaller than those shown by Bayle et al. [10] who did not apply an overtopping depth threshold.
Due to the constantly evolving nature of the revetment geometry, all experimental runs were broken down into 20 min “segments”. During each segment, the cross-shore location of the crest (xc) was assumed to be constant and was determined from the Lidar-derived bed profile data at the mid-point of the segment (e.g., after 10 min). The crest was taken as the location were the seaward slope of the revetment transitioned to either a flat structure top (1DR, see Figure 1a) or a peaked crest which sloped landward in the positive x-direction (2DR, see Figure 1b). In general, the crest also corresponded with the highest point on the revetment profile. While the cross-shore location of the crest and revetment gradient (tanβ) was assumed to be fixed within each segment, the crest elevation (zc) was updated on a wave-by-wave basis using the Lidar-derived bed profile data. The 20 min segment length was chosen to minimise the effect of crest movement (|Δxc| < 0.5 m; |Δzc| < 0.05 m) and any variability in the revetment slope, but is shorter than would typically be used to obtain stable overtopping statistics on a fixed structure. Over all 20 min segments, an average of 205 swash events were measured, with 26.7 (13%) of these events overtopping the structure crest. A sensitivity analysis using 40 and 60-min segments was undertaken which showed comparable results to those presented below.
Wave overtopping volumes were estimated on a wave-by-wave basis using two different approaches. The “peak volume” method is comparable to the “virtual” overtopping volume approach [21,22]. Timeseries of overtopping flow volume were produced by integrating the timeseries of flow depths landward of the crest position xc(t):
V v t = Δ x 2 h c + 2 h c + 1 + . + 2 h s 1 + h s ,
where hc represents the depth at the crest, hc+1 the depth at the next landward position and hs the depth immediately seaward of the time varying shoreline position Xs(t), thus hs+1 = 0 m. For every identified overtopping event, the overtopping volume Vv,max is assumed to be the peak value of the overtopping volume timeseries Vv(t) (see Figure 3).
Note that [21] did not actually measure overtopping of a structure crest, but analyzed peak flow volumes landward of a fixed point on a non-overtopped planar slope. For the experimental setup investigated here, where waves overtopped the crest of a porous structure, there are a number of potential sources of error in this approach:
  • An air void fraction α = 0 is assumed, however for violent overtopping flows on an irregular stone surface this is unlikely to be the case and will lead to an overestimate of overtopping volume. Indeed, very rapid overtopping flows were occasionally observed to “jump” as they passed over the revetment crest during 2DR leading to a short-lived air cavity beneath the overtopping flow. This effect led to anomalously large maxima in the depth timeseries during initial overtopping which were removed by discounting volume peaks during the first 0.25 s of these events.
  • Infiltration into the porous revetment structure will mean that the estimated peak swash volume is smaller than the total amount of water that overtopped the crest. However, from an engineering perspective, the volumes presented here represent the flow volume actually present landward of the structure crest that could lead to safety concerns or inundation risk.
The second “sum of positive discharge” method used to estimate wave overtopping volume is based on [17] which estimated instantaneous overtopping discharge on a gravel barrier as:
q t = h c u s ,
where hc is updated at every timestep and us is the shoreline velocity calculated as the first derivative of the shoreline position timeseries:
u s t = d X s d t ,
By summing the flow volume passing the crest since the start of each overtopping event, a timeseries of overtopping flow volume can be estimated:
V u h t = q Δ t ,
and the overtopping volume for each identified overtopping event is estimated as:
V u h , m a x = T + q   for   u s > 0   m / s ,
where T+ is the duration of positive shoreline velocity values (us > 0 m/s) for each overtopping event.
This methodology is similar to that used by previous researchers [27] to estimate wave overtopping of fixed structures in the laboratory where velocimeters are used to measure flow velocity over the structure crest. For the experimental setup investigated here, a number of potential sources of error exist:
  • As with the peak volume method, an air void fraction α = 0 is assumed, however for violent overtopping flows on an irregular stone surface this is unlikely to be the case. The presence of air voids will increase hc and lead to an overestimate of overtopping volume. Note that the flow “jumps” described above occur landward of the structure crest and so the large depths associated with this effect were not measured at the crest location.
  • The flow depth at the structure crest was sometimes observed to be noisy during energetic overtopping events due to splashing, potentially leading to overestimates of the depth and hence overtopping volume. The depth data was despiked to remove short-lived depth maxima in order to minimise this effect.
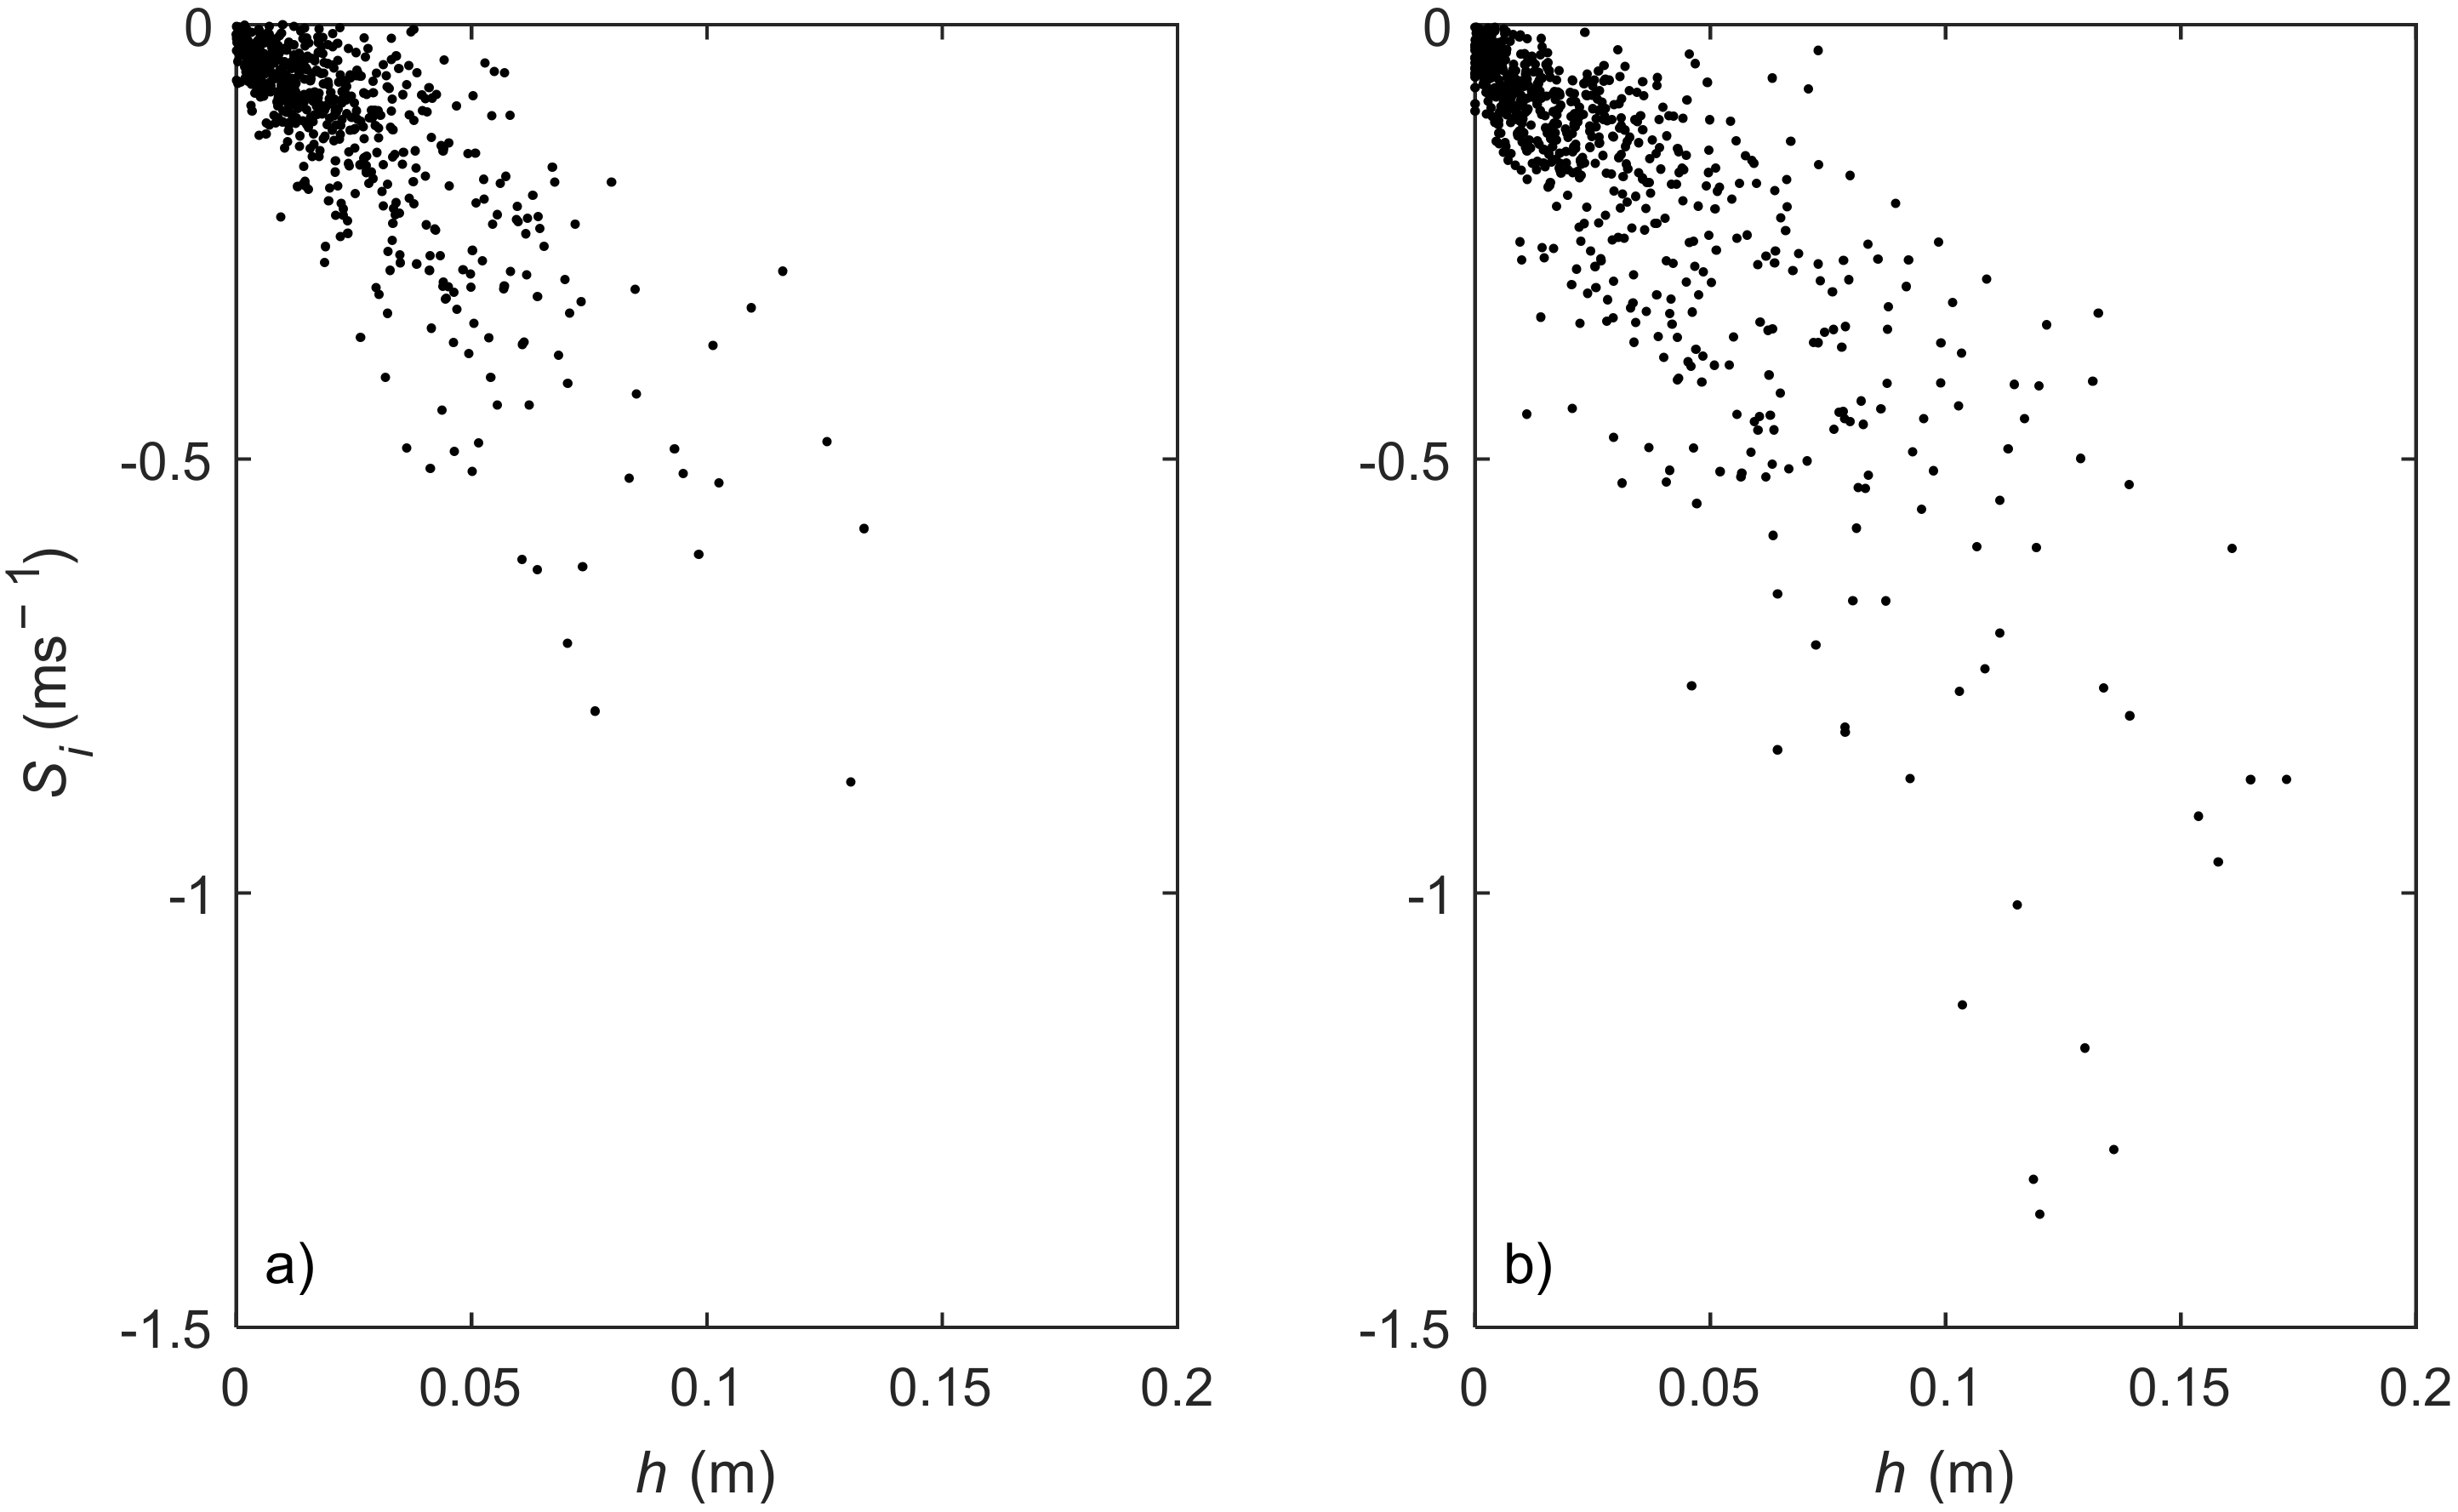
  • The shoreline velocity us is assumed to be representative of the depth-averaged flow velocity at the barrier crest uc. Schüttrumpf and Oumeraci [27] demonstrated that bore front velocity compared well with flow velocity measurements (micro-propeller) for waves overtopping an impermeable sea dike in the laboratory. In the current experiment, the irregular and porous nature of the structure may be expected to lead to enhanced deceleration of the swash front after overtopping. As a result, us is expected to provide a reasonable estimate of uc during the initial stages of overtopping but underestimate uc as flow reversal is approached.
For both methods, overtopping discharge qv (“peak volume”) or quh (“sum of positive discharge”) during a 20 min segment (t = 1200 s) is defined as:
q = V m a x t ,
where Vmax is Vv,max for the peak volume method and Vuh,max for the sum of positive discharge method.

3. Results

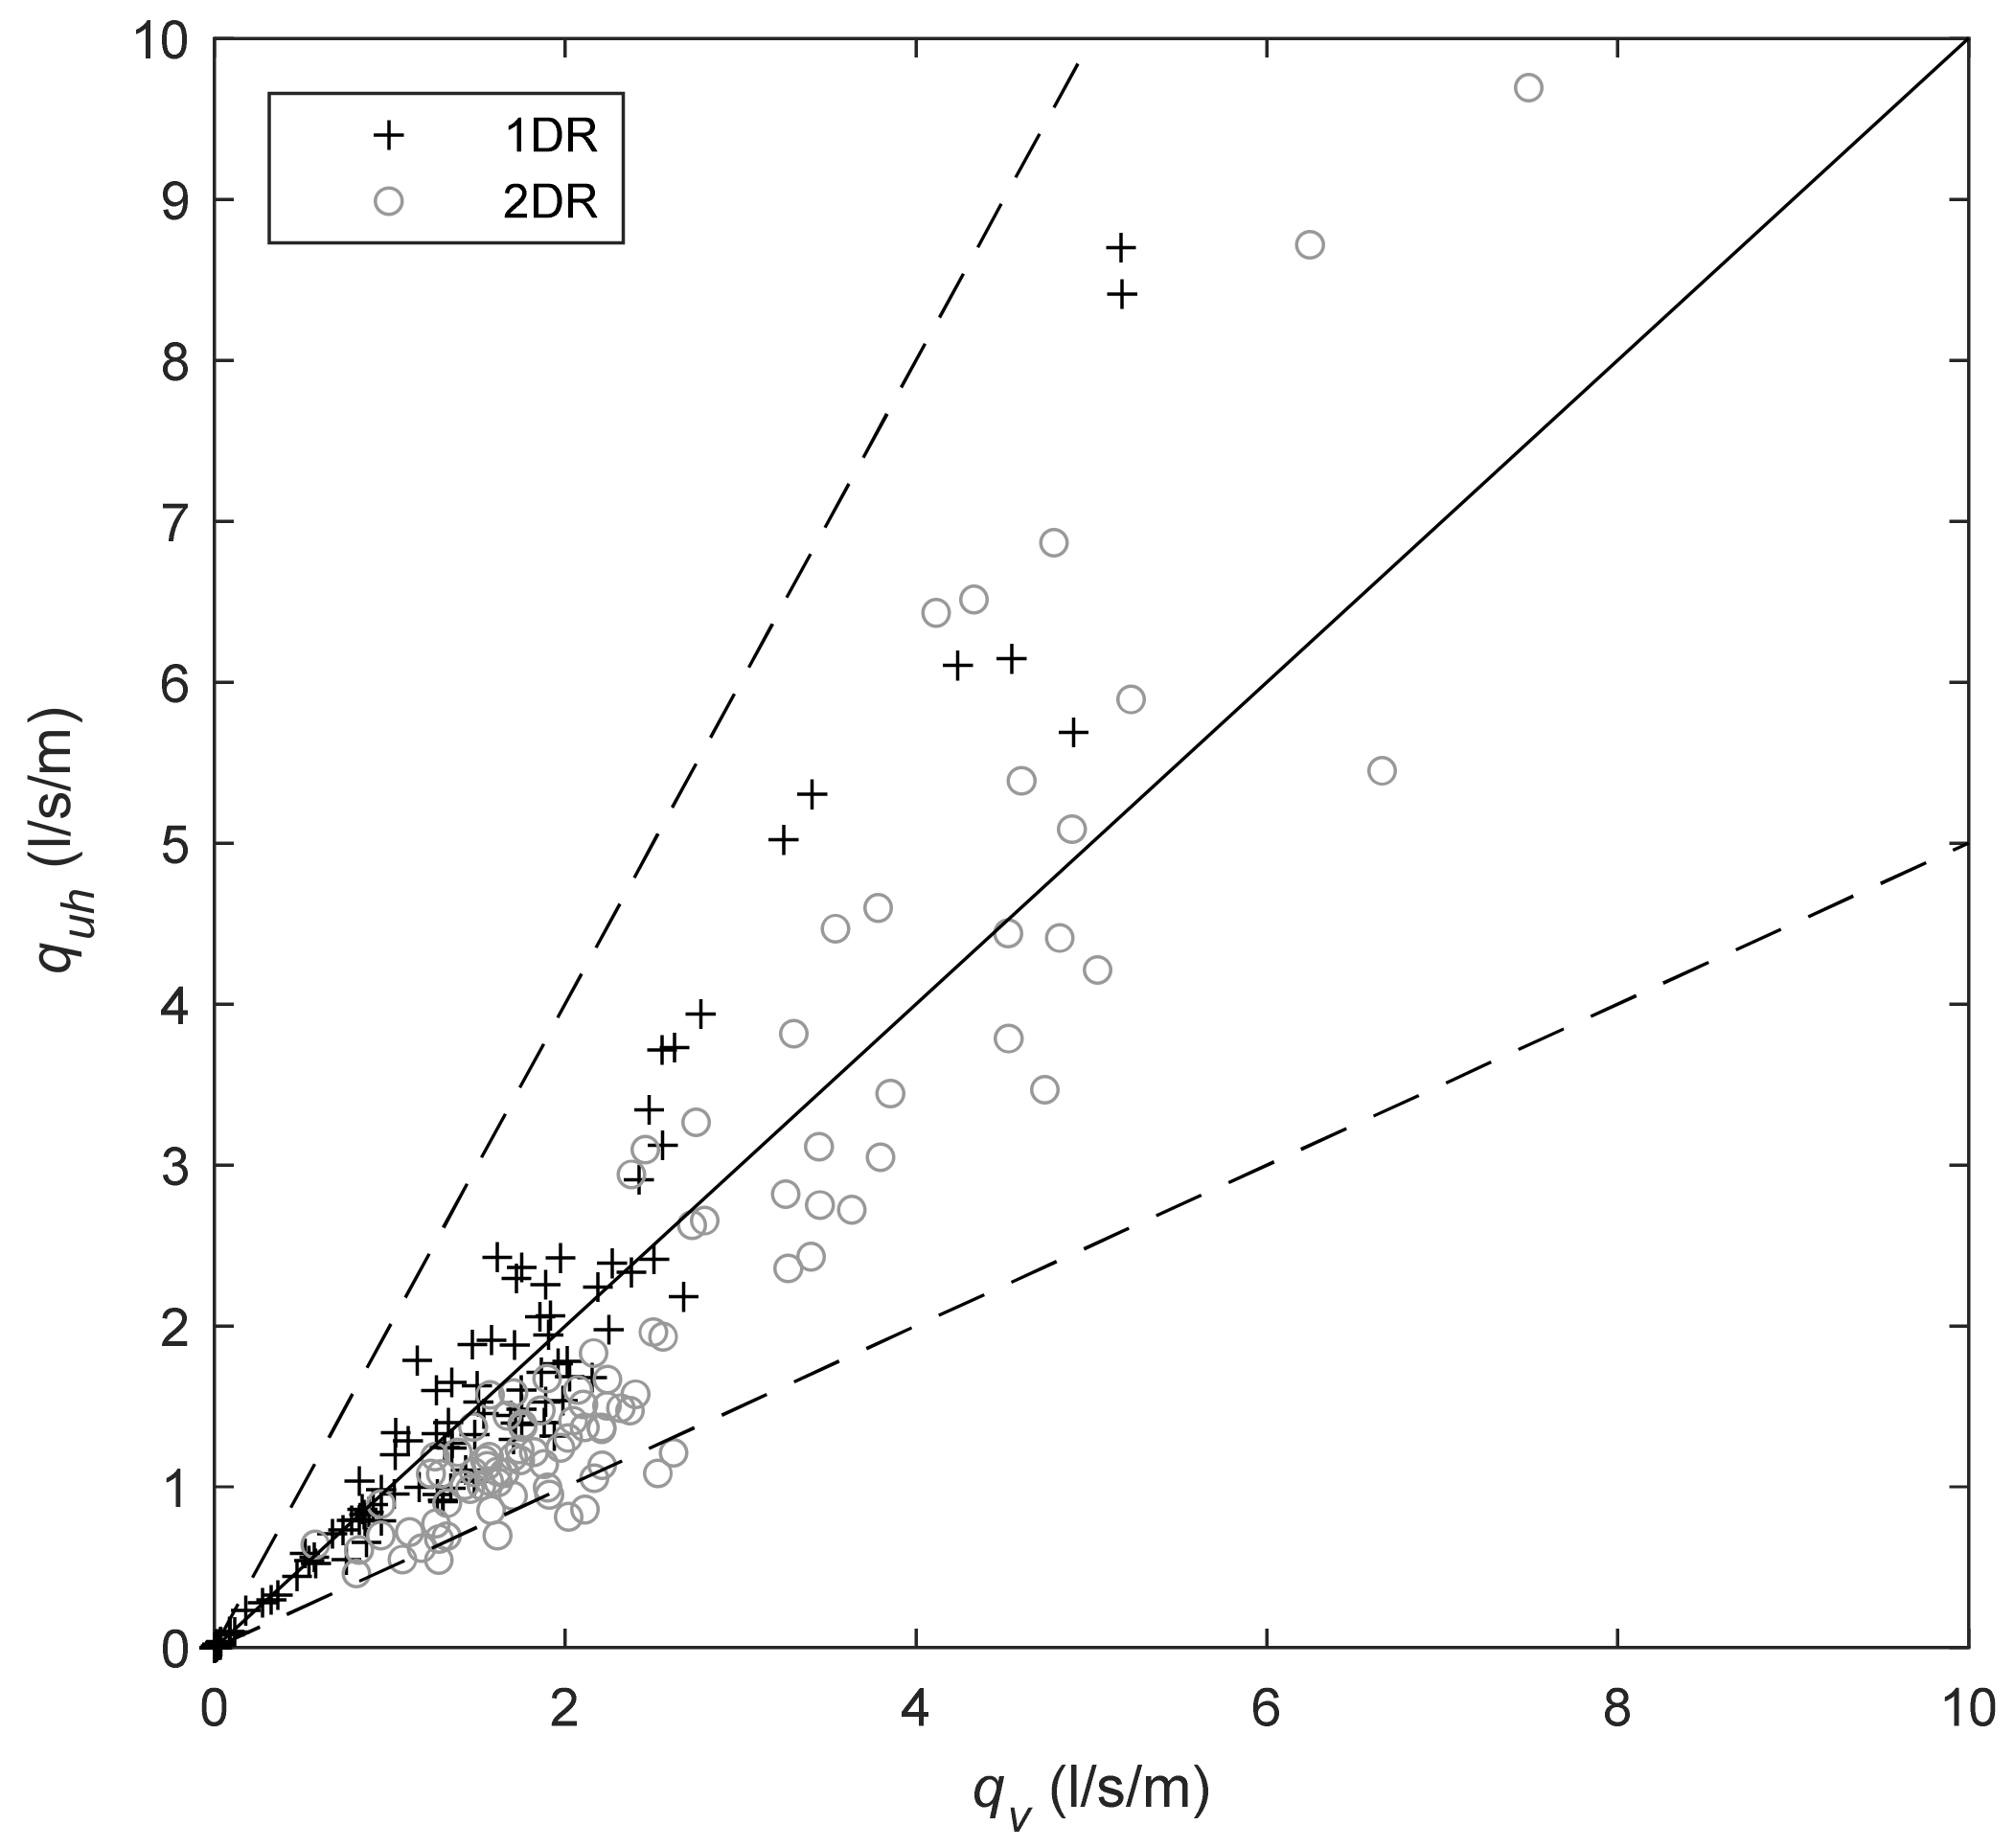
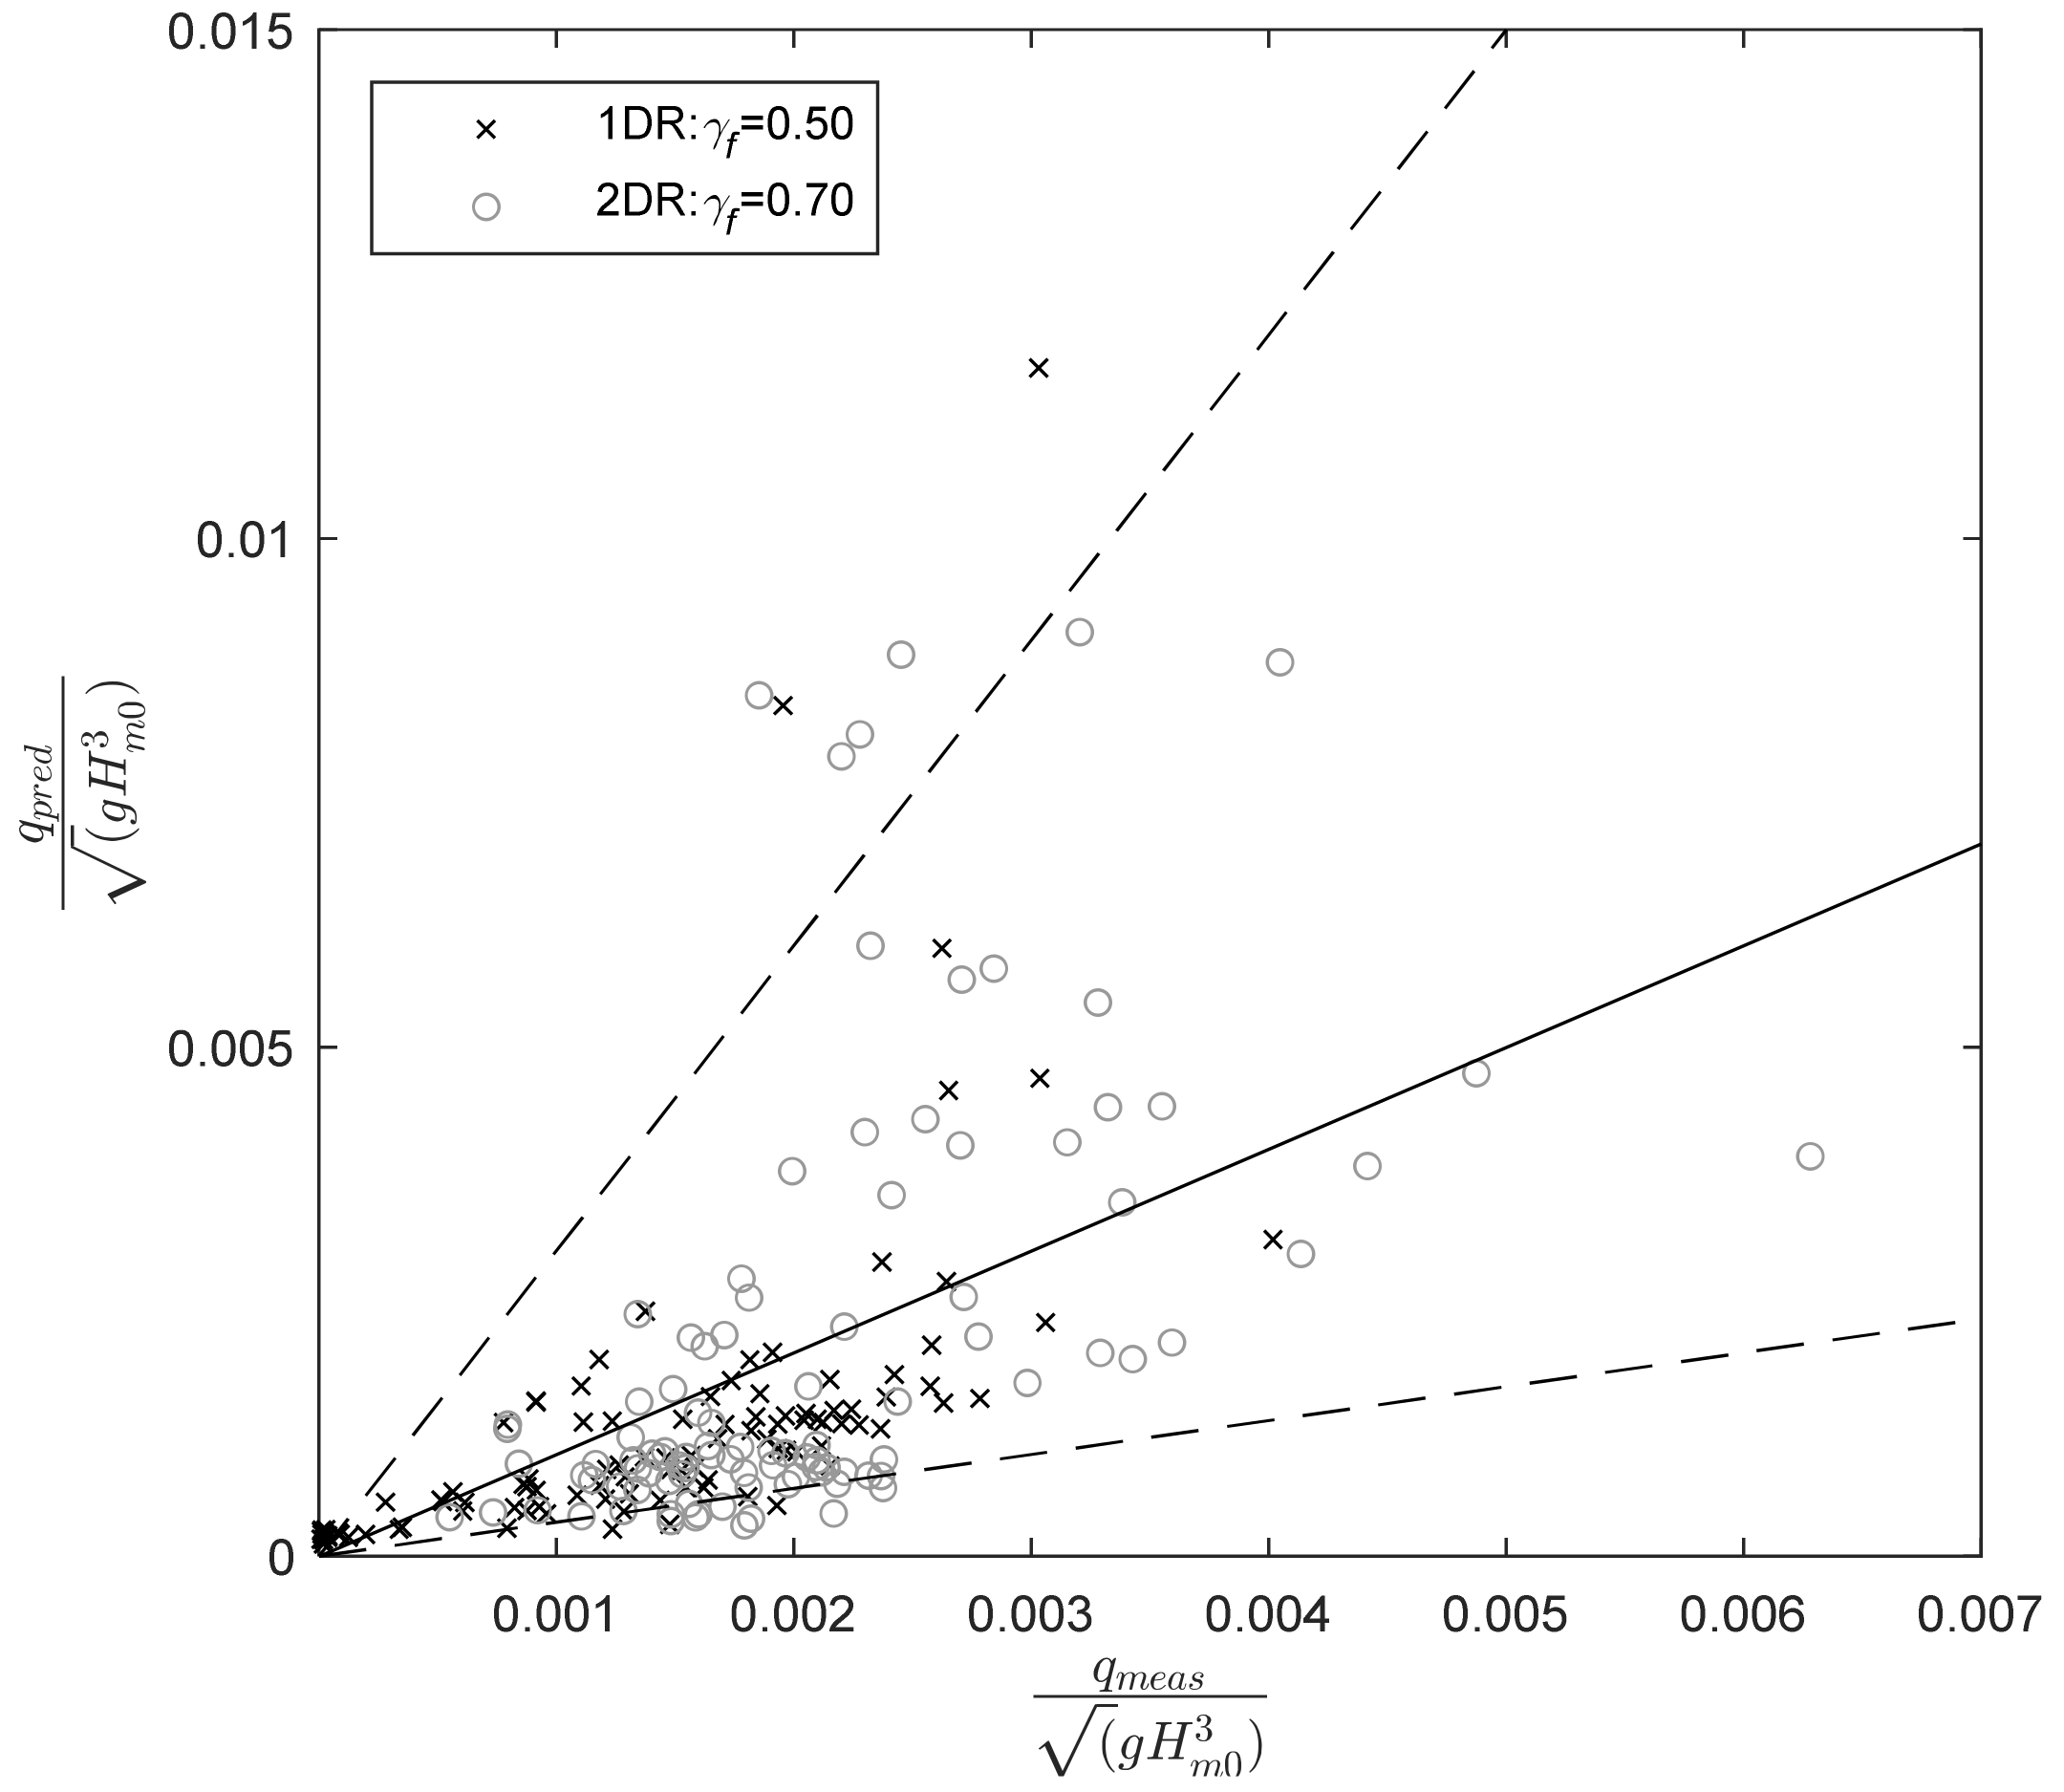
3.1. Comparison of Overtopping Measurement Methods

Hofland et al. [21] and Oosterloo et al. [22] demonstrated that the peak volume method could be used to obtain valid overtopping measurements on relatively smooth, impermeable dike structures, however it has not been tested on a constantly evolving, porous structure such as a dynamic cobble berm revetment. Due to the limitations of fixed instrumentation for measuring overtopping on a dynamic revetment it was not possible to validate the Lidar-based methodologies outlined in Section 2.2 against traditional overtopping measurement techniques. Consequently, the following section compares results obtained using the two different methodologies.
Figure 4 compares the discharge measured using the peak volume and sum of positive discharge methods for all 20 min segments during both 1DR and 2DR. For 1DR, there is reasonably good agreement, with all values within a factor of two of each other. There is a tendency for qv < quh for higher values of discharge (qv > 2.5 l/s/m). For 2DR, qv > quh for lower values of discharge (qv < 2.5 l/s/m), possibly due to higher levels of aeration and splashing in the flow caused by overtopping events passing over the prominent crest.
Figure 5 compares the estimated overtopping volume for all individual overtopping events measured during both experiments (3006 events (1DR); 2665 events (2DR)). While the data are scattered, there is a reasonable level of agreement, with 82% and 74% of values within a factor of two agreement for 1DR and 2DR respectively.
The results presented above indicate that while there is not total agreement between the two methods, the majority of values are within a factor of two agreement which is considered an acceptable result given the complexity of overtopping flows on a rough, porous and constantly evolving structure and the inherent uncertainties in the methodologies. For the remainder of the manuscript, the peak volume method is used to estimate overtopping volume or discharge as this method is simpler and is likely to be more reliable because it has been previously validated on impermeable structures and is less sensitive to spikes in the depth or velocity timeseries.

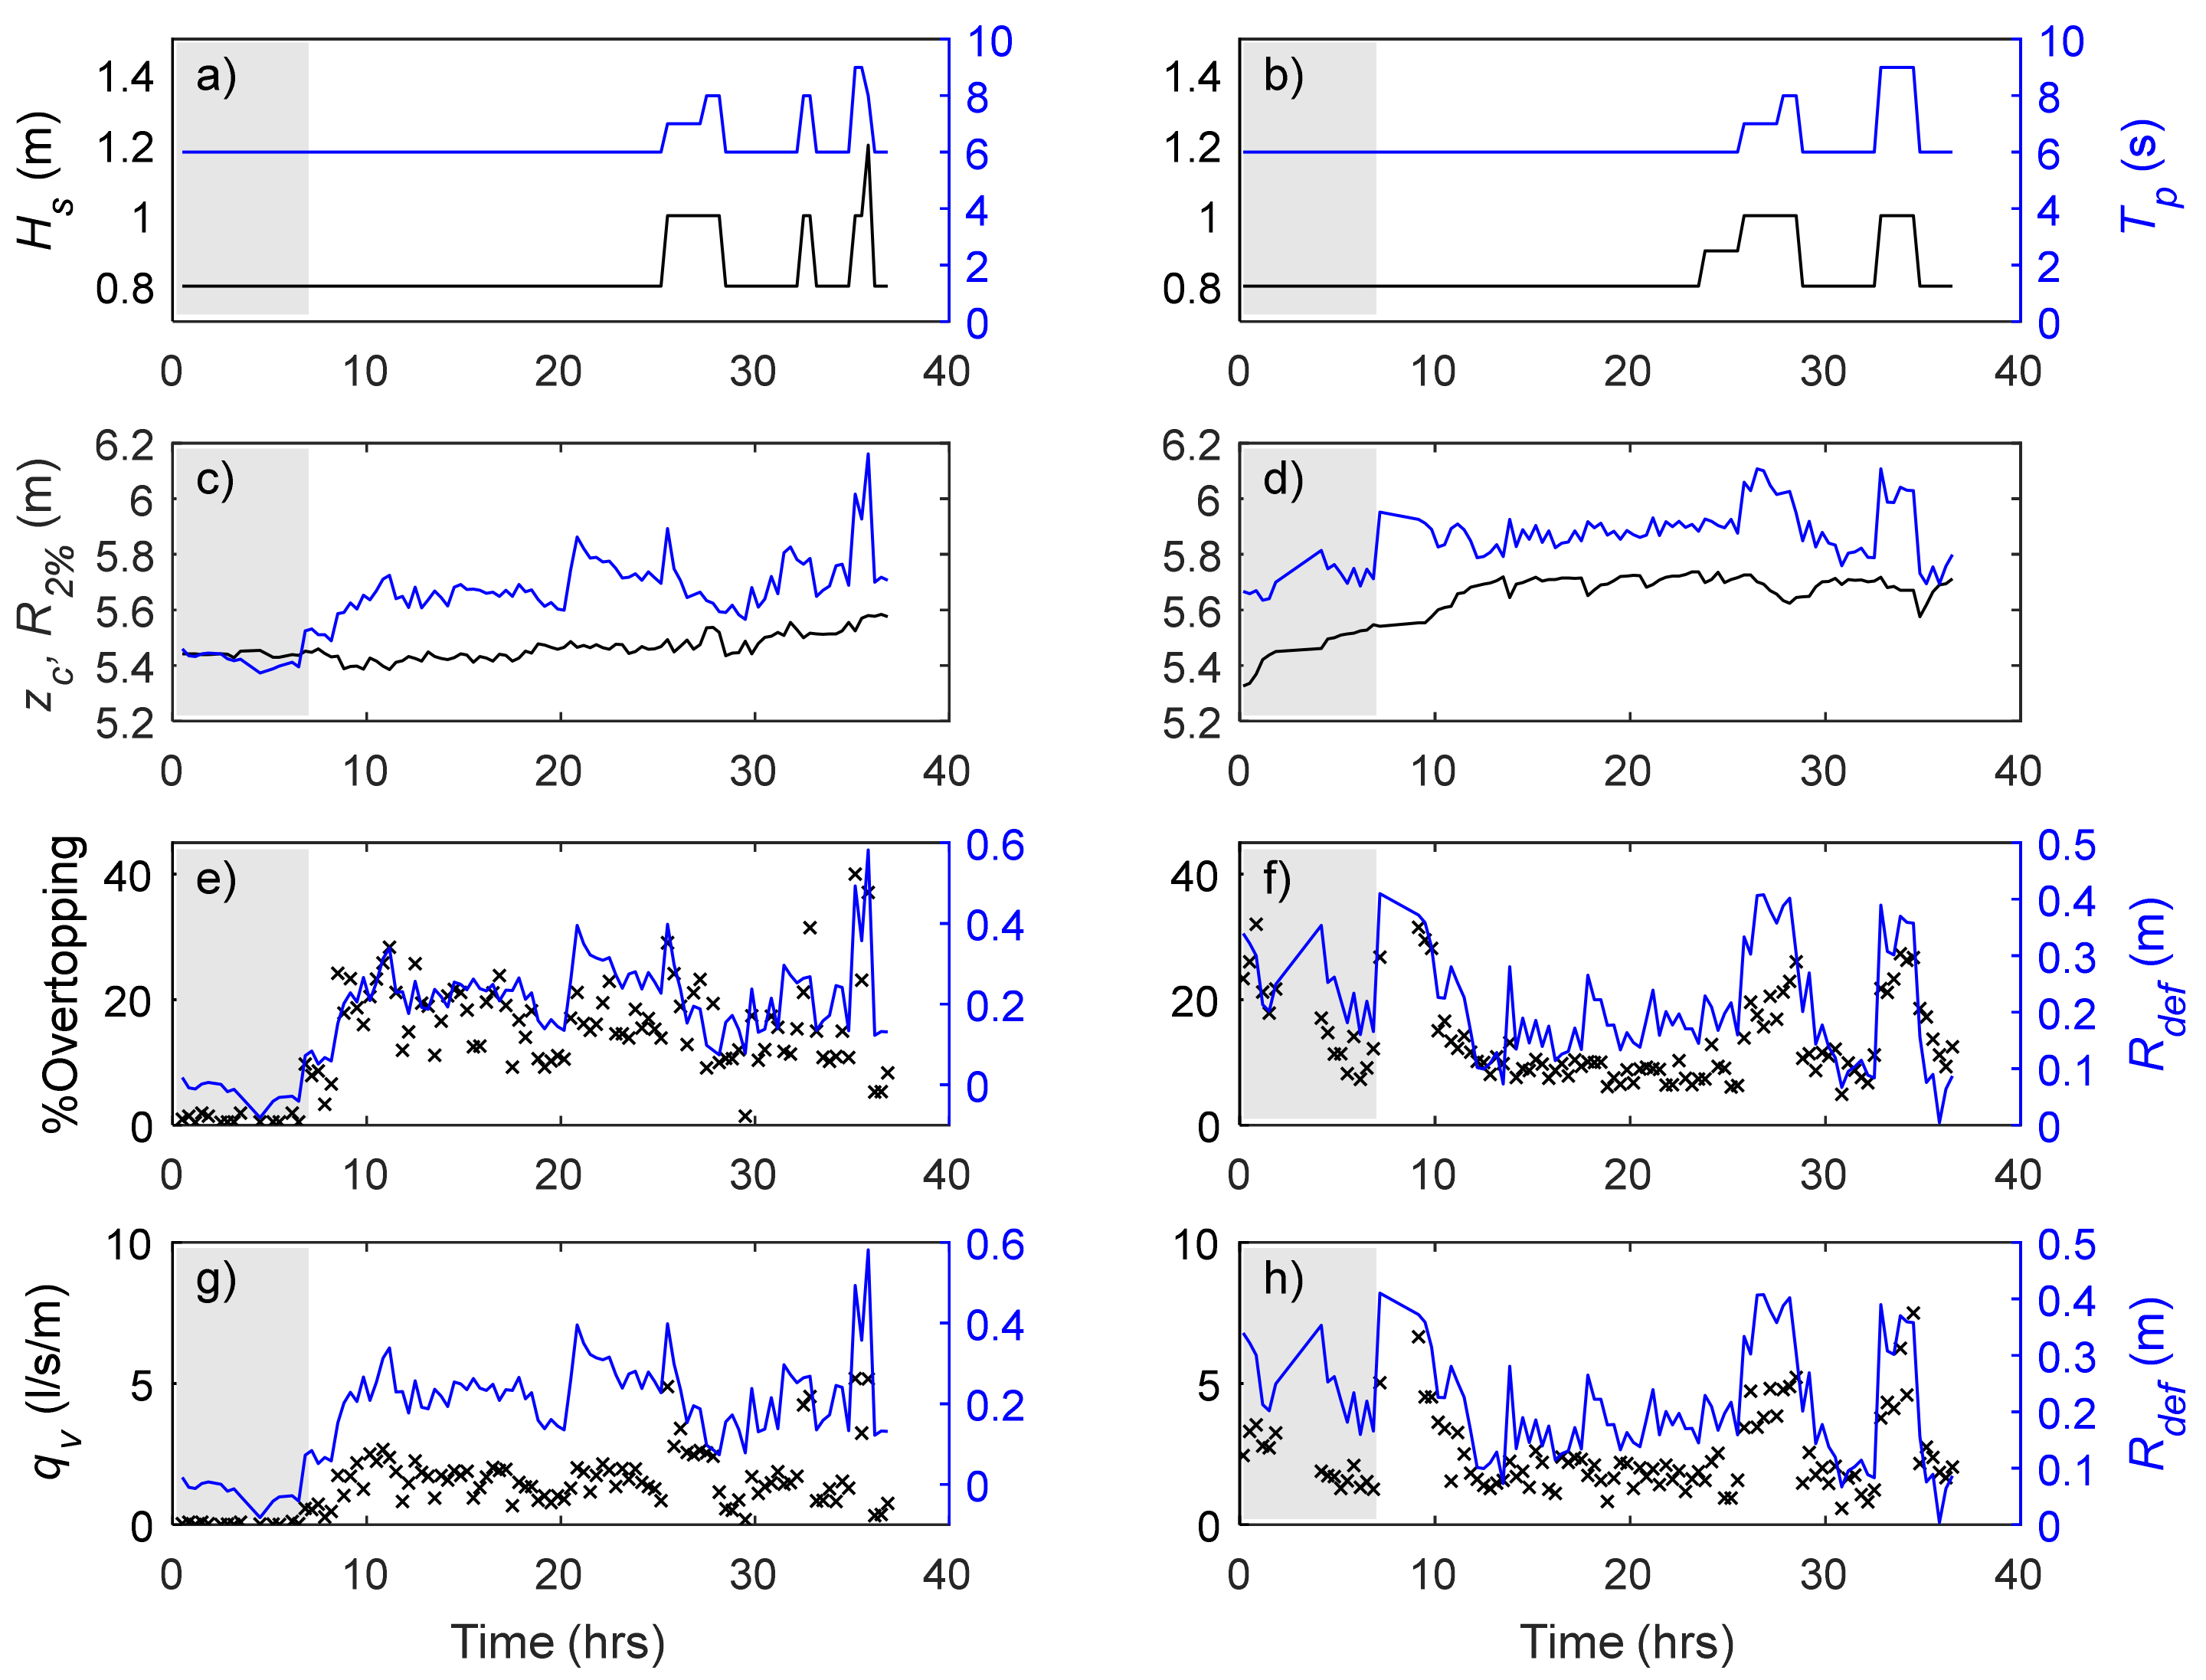
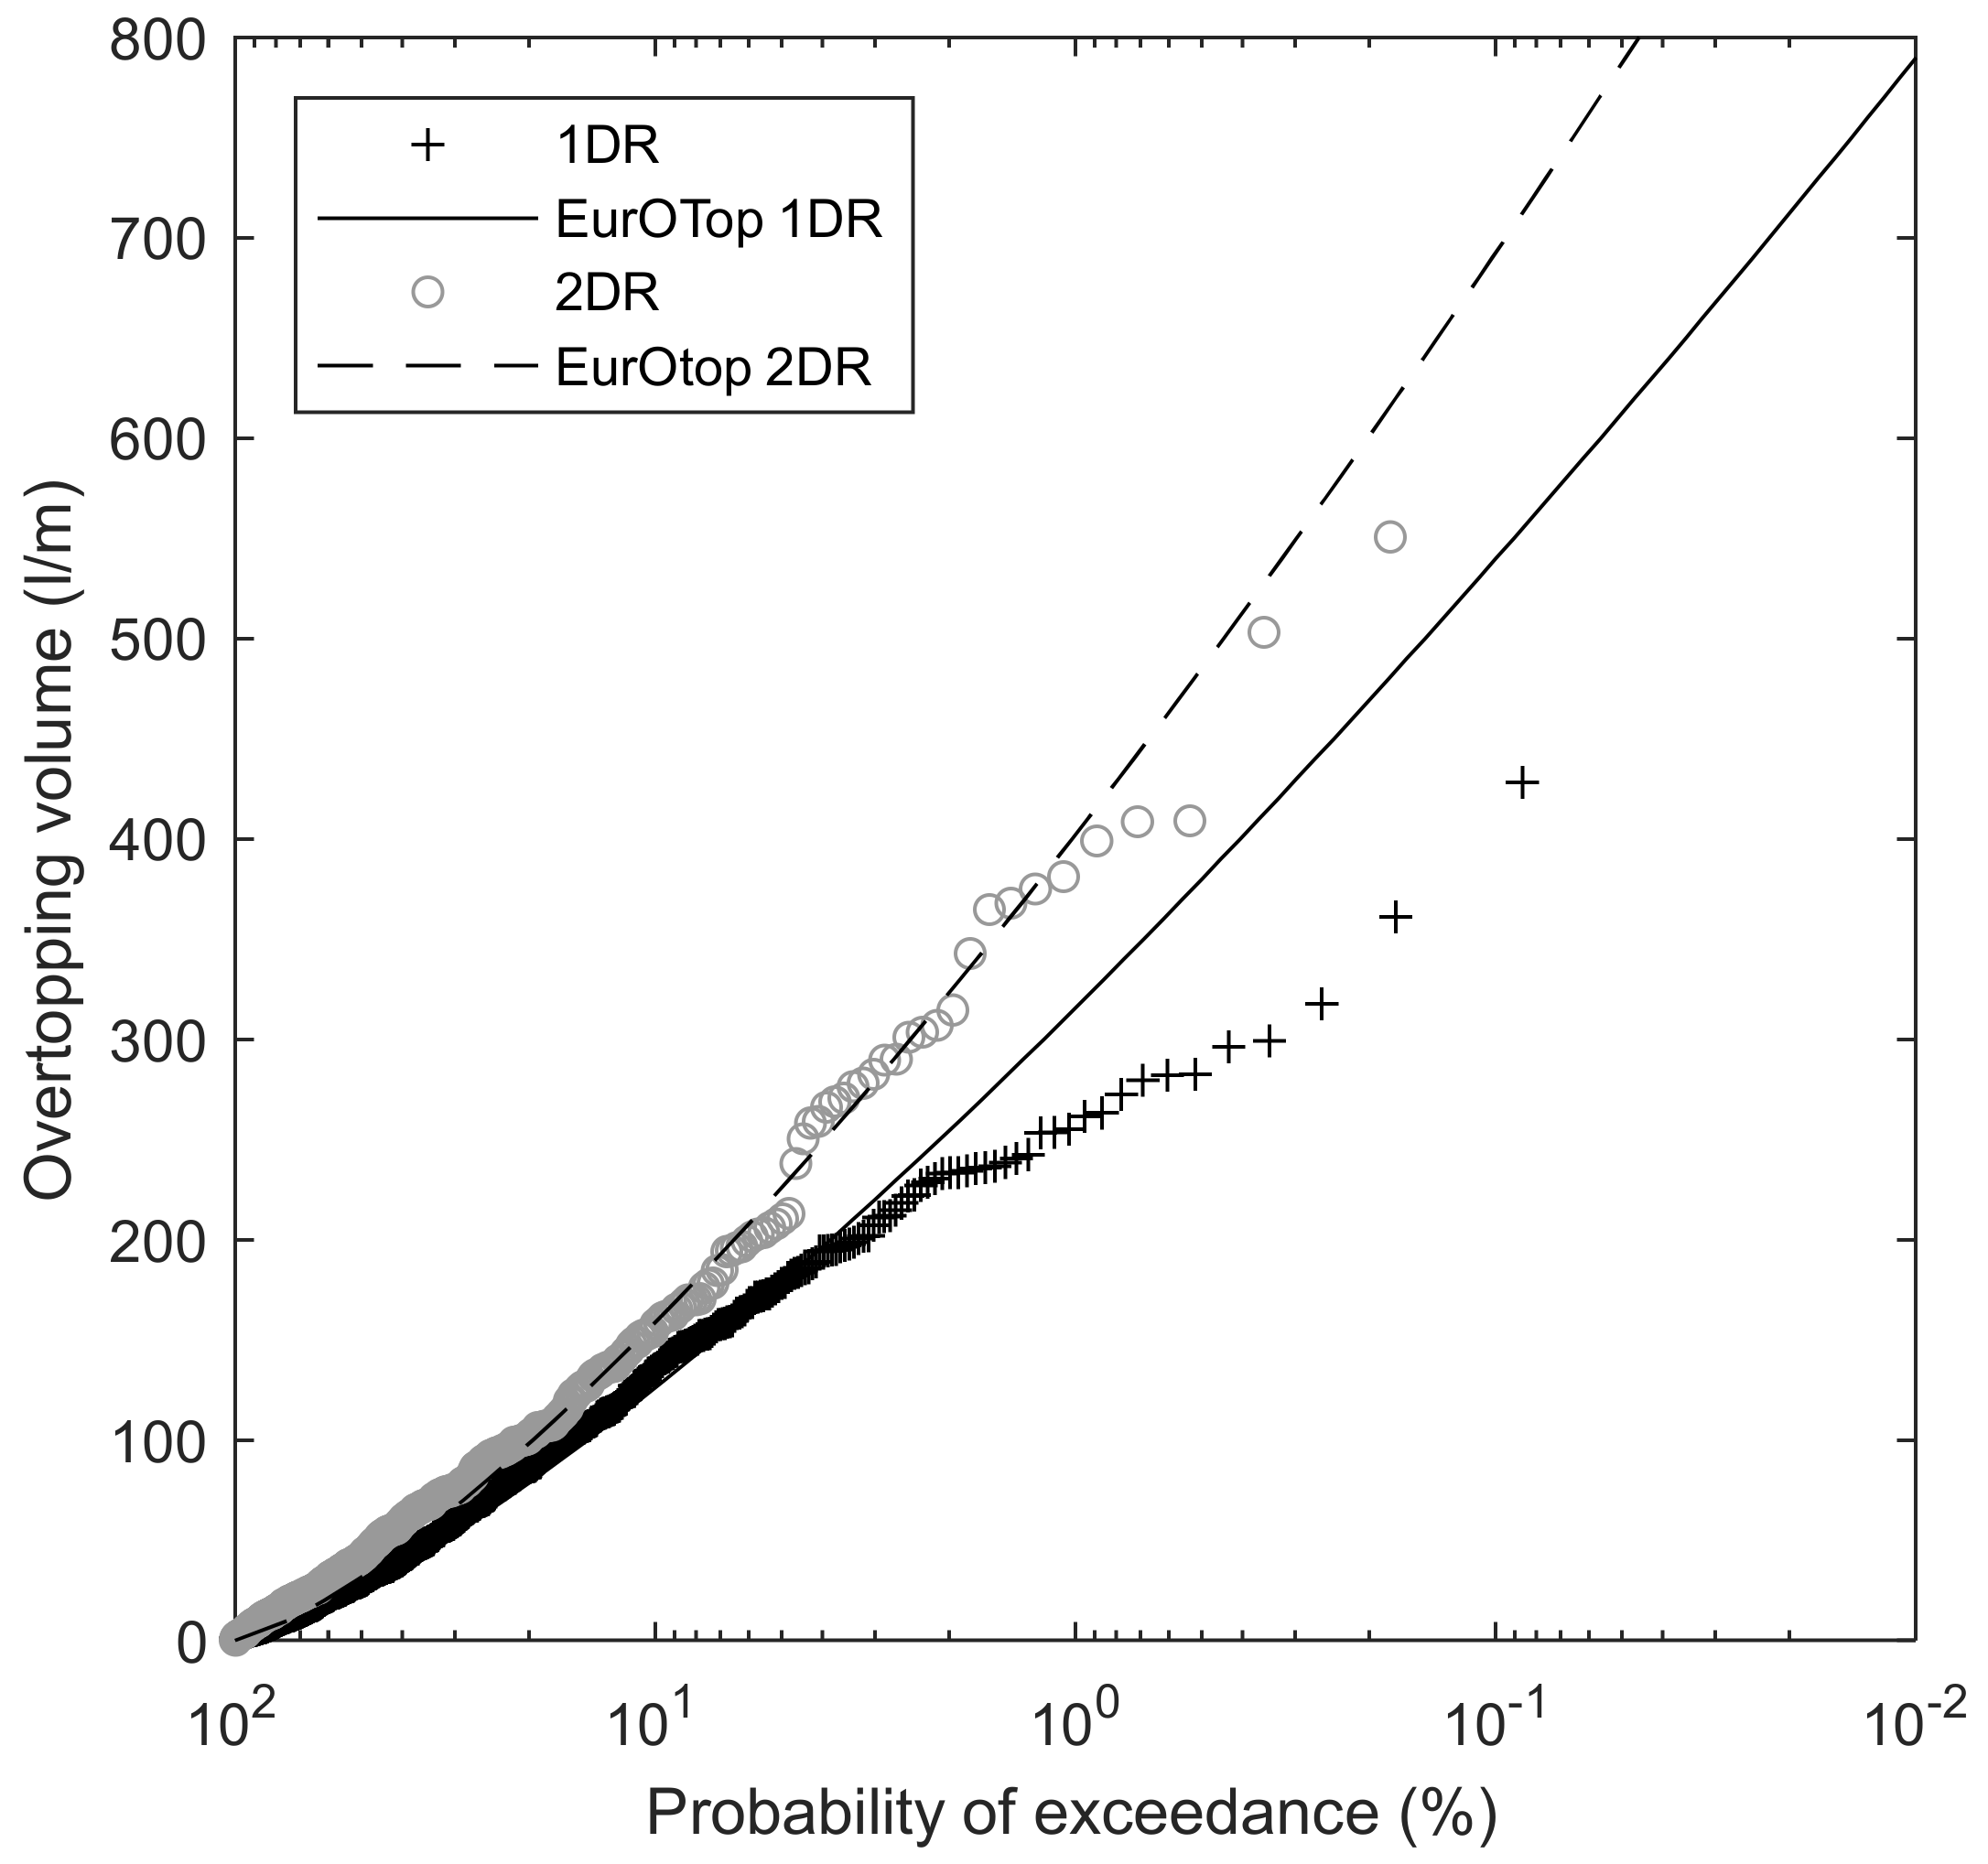
3.2. Overtopping Discharge at the Revetment Crest

The timeseries presented in Figure 2c,d demonstrates the variability of the crest elevation throughout the two experiments. As noted in [10], the rounded nature of the cobbles used in 1DR limits crest build-up and so there is only a 0.22 m increase in crest elevation during the test runs analysed here (Figure 2c). By contrast for 2DR, the poorly sorted angular stone allowed a peaked crest to form once the structure was regularly overtopped (zWL ≥ 4.8 m) and this feature adjusted rapidly to changes in water level and wave conditions. It is evident that the crest elevation increases during the first few hours after the changes in water level to zWL = 4.8 m (0 h) and zWL = 4.9 m (7 h) leading to a gradual reduction in the freeboard deficit which can be observed in Figure 2e–h. The observed reduction in freeboard deficit with time leads to an associated decrease in the percentage of wave overtopping (Figure 2e,f) and overtopping discharge (Figure 2g,h), both of which approximately stabilise between 12 and 24 h at mean values of 8.6% (σ = 1.5%) and 2.03 l/s/m (σ = 0.62 l/s/m) respectively. Note that predicted runup elevation for 2DR is consistently larger than for 1DR despite using the same wave conditions at the wave paddle due to slightly larger depths seaward of the revetment and hence greater wave heights measured at the revetment toe.
EurOtop [2] provides a widely used general formulation for the prediction of wave overtopping on coastal structures:
q g H m 0 3 = 0.023 tan β γ b ξ m 1 , 0 . exp 2.7 R c ξ m 1 , 0 H m 0 γ b γ f γ β γ v 1.3 ,
where Hm0 is the spectral significant wave height at the structure toe, α is the revetment gradient, ξ m 1 , 0 is the surf-similarity parameter calculated using the spectral wave period Tm-0,1 and γb, γf, γβ, γv are influence factors to account for a berm, roughness, wave obliquity and a wall at the end of the slope respectively.
Figure 6 shows the overtopping discharge normalised using the approach presented by EurOtop [2] as a function of the normalised freeboard deficit R*:
R * = R d e f R 2 % = R 2 % z c R 2 % ,
While there is substantial scatter (common for large-scale overtopping measurements), there is evidence of a linear relationship between R*2 and the normalised overtopping discharge as previously noted by Ibrahim and Baldock [24].
Figure 7 presents a scatter plot comparing the measured discharge rates with those predicted by the EurOtop equation where all reduction factors are taken as unity except for the roughness factor γf. Little previous research has been done to determine the roughness factor for cobble slopes and no design values are provided in [2], however recent numerical work [28] suggests values of γf between 0.62 and 0.75 for a dynamic cobble berm revetment. Their work suggested that overtopping increases as the porosity of the revetment reduces due to sand infilling and γf ∝ 1/pv where pv is the relative pore volume of the revetment. It was found that the values of γf that best fitted the present data were γf = 0.50 and γf = 0.70 for 1DR and 2DR respectively. It is suggested that the lower value for 1DR accounts for the higher porosity of the revetment ( 1 D R = 0.41 ;   2 D R = 0.35 ).
Using these values for γf enables predictions of overtopping discharge to within a factor of three which is the approximate accuracy quoted for Equation (10) given in [2]. Furthermore, in agreement with results from other types of structures, the largest deviations tend to be at smaller discharges, particularly for 2DR where overtopping of small discharges is consistently underestimated.
Figure 8 shows the exceedance probabilities for individual wave overtopping discharge measured between 12 and 24 h of testing when zWL = 4.9 m and the crest elevation and cross-shore location were relatively constant (Rc,1DR = 0.54 m (σ = 0.026 m) and Rc,2DR = 0.61 m (σ = 0.022 m)). Note that the relative freeboard Rc/Hm0 is almost identical for the two datasets at 1.26 and 1.27 for 1DR and 2DR respectively. For both experiments, the measured data agrees well with a 2-parameter Weibull distribution using the shape and scale factors calculated using the guidance in EurOtop [2] for probabilities of exceedance larger than approximately 10%, however the probability of larger discharges is smaller than that suggestedin [2]. This was also observed by Oosterloo et al. [22] and in this case may be due to greater relative underestimation of the largest overtopping volumes caused by greater infiltration over the longer overtopping duration.

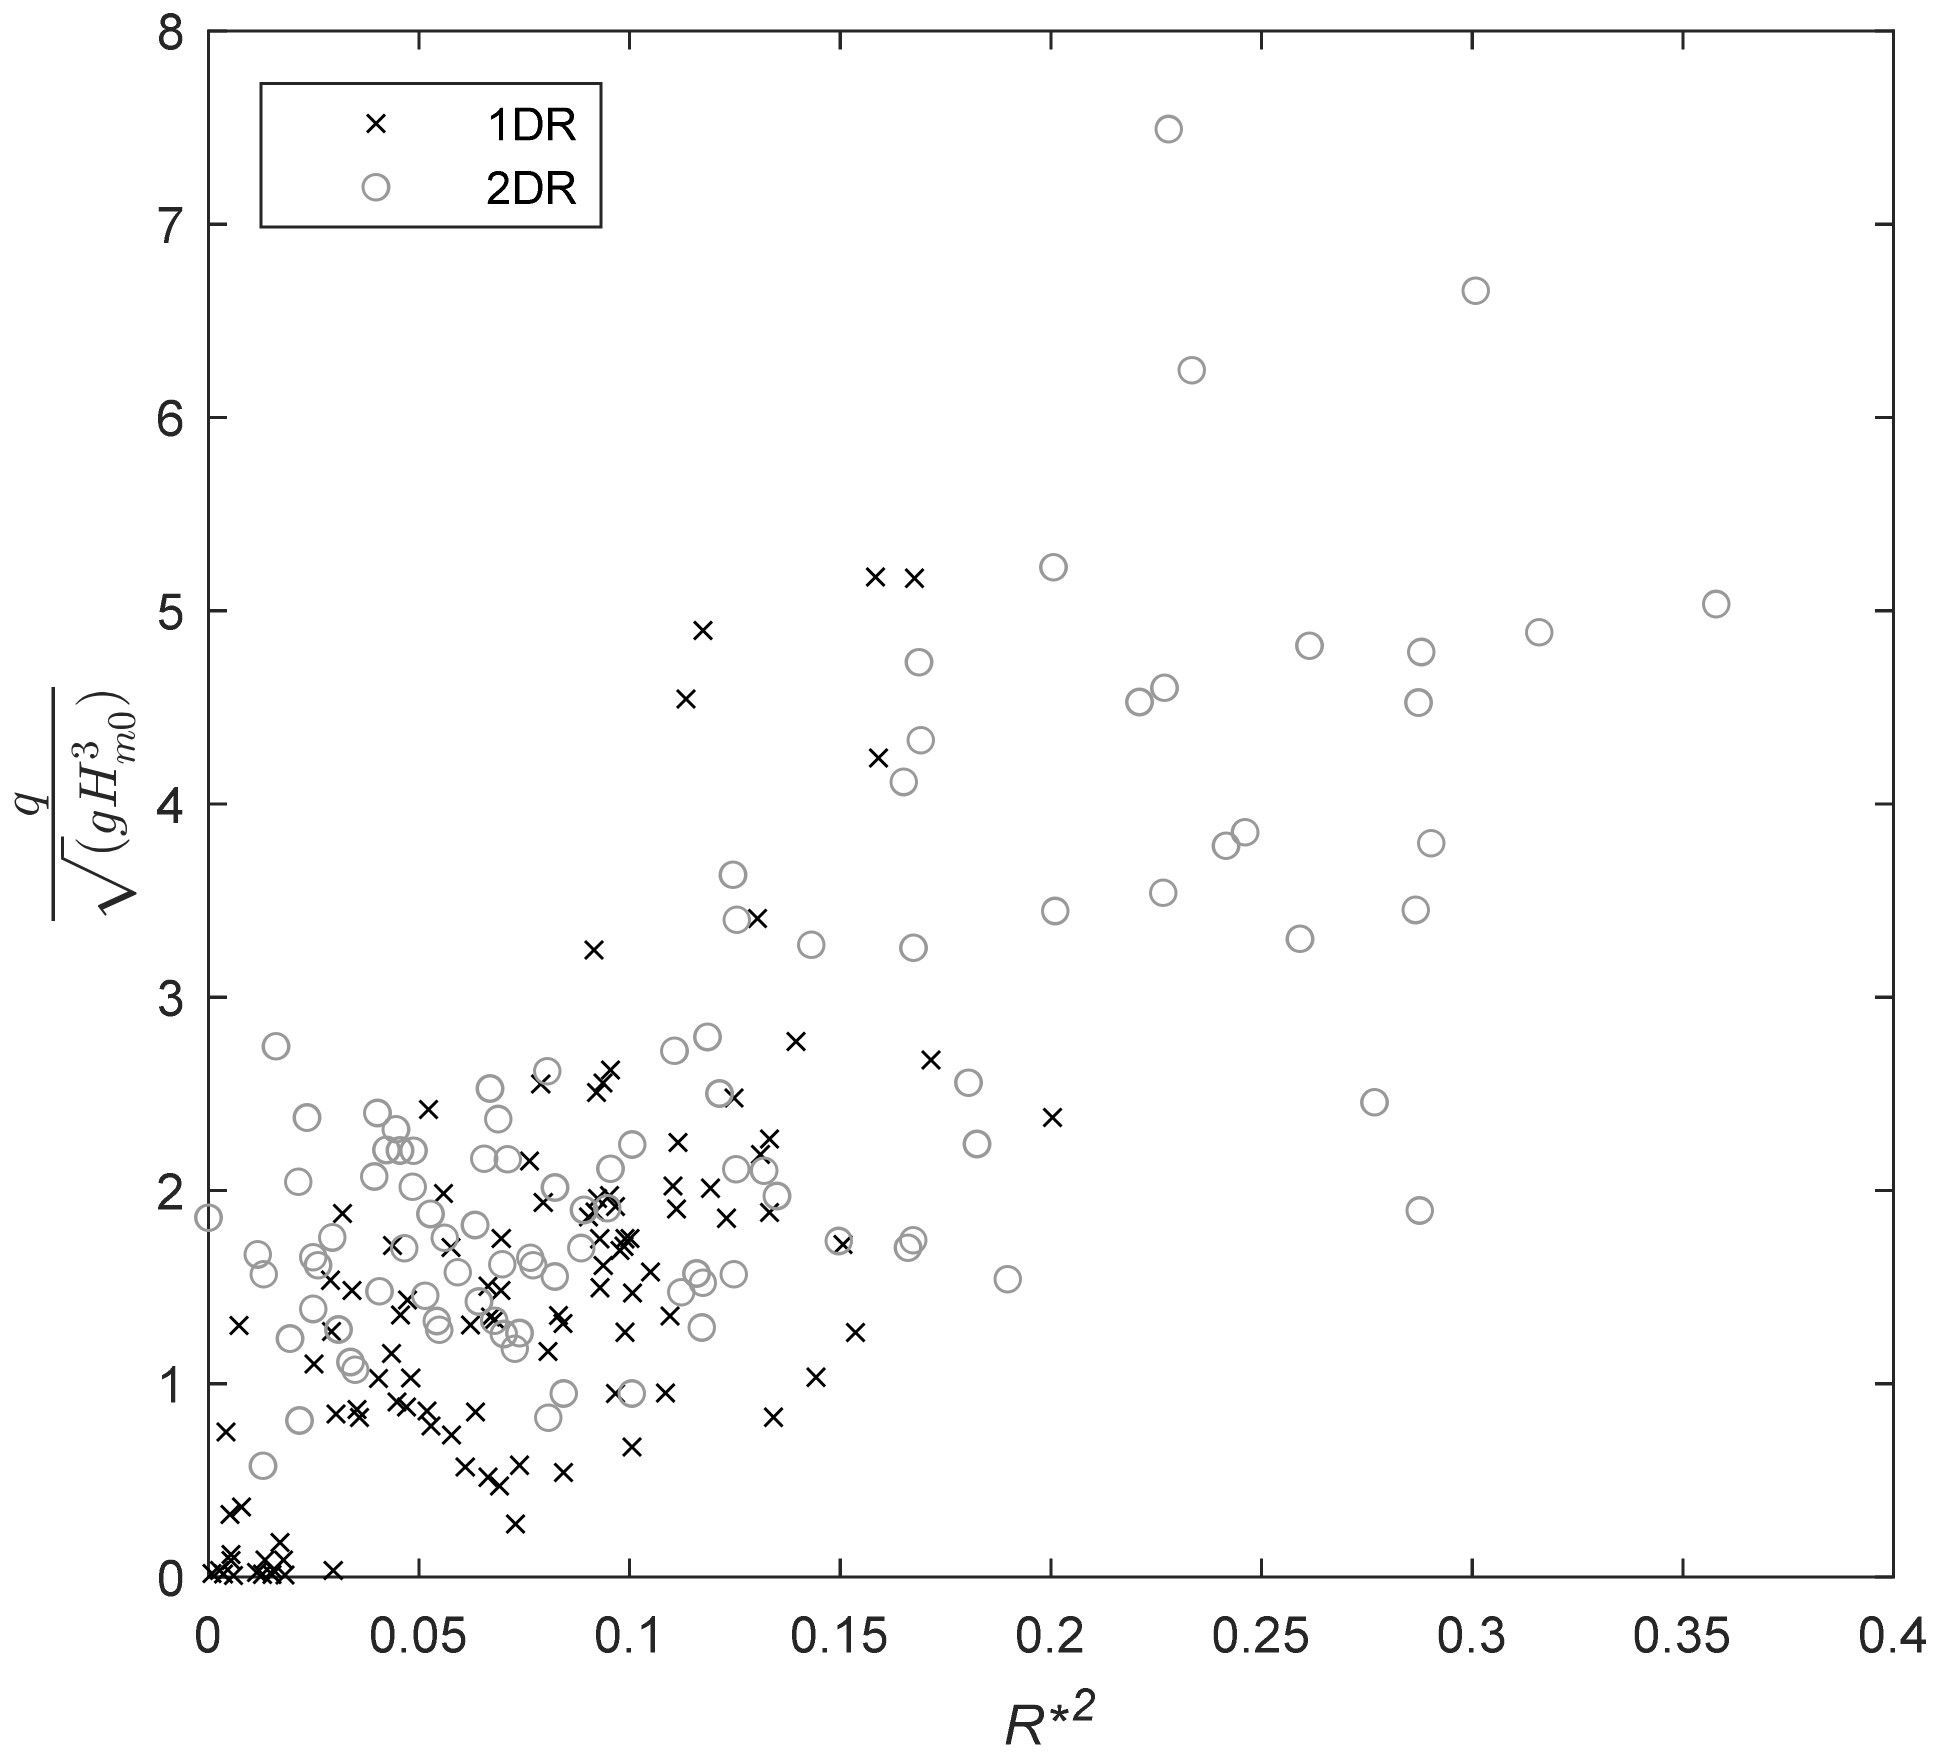
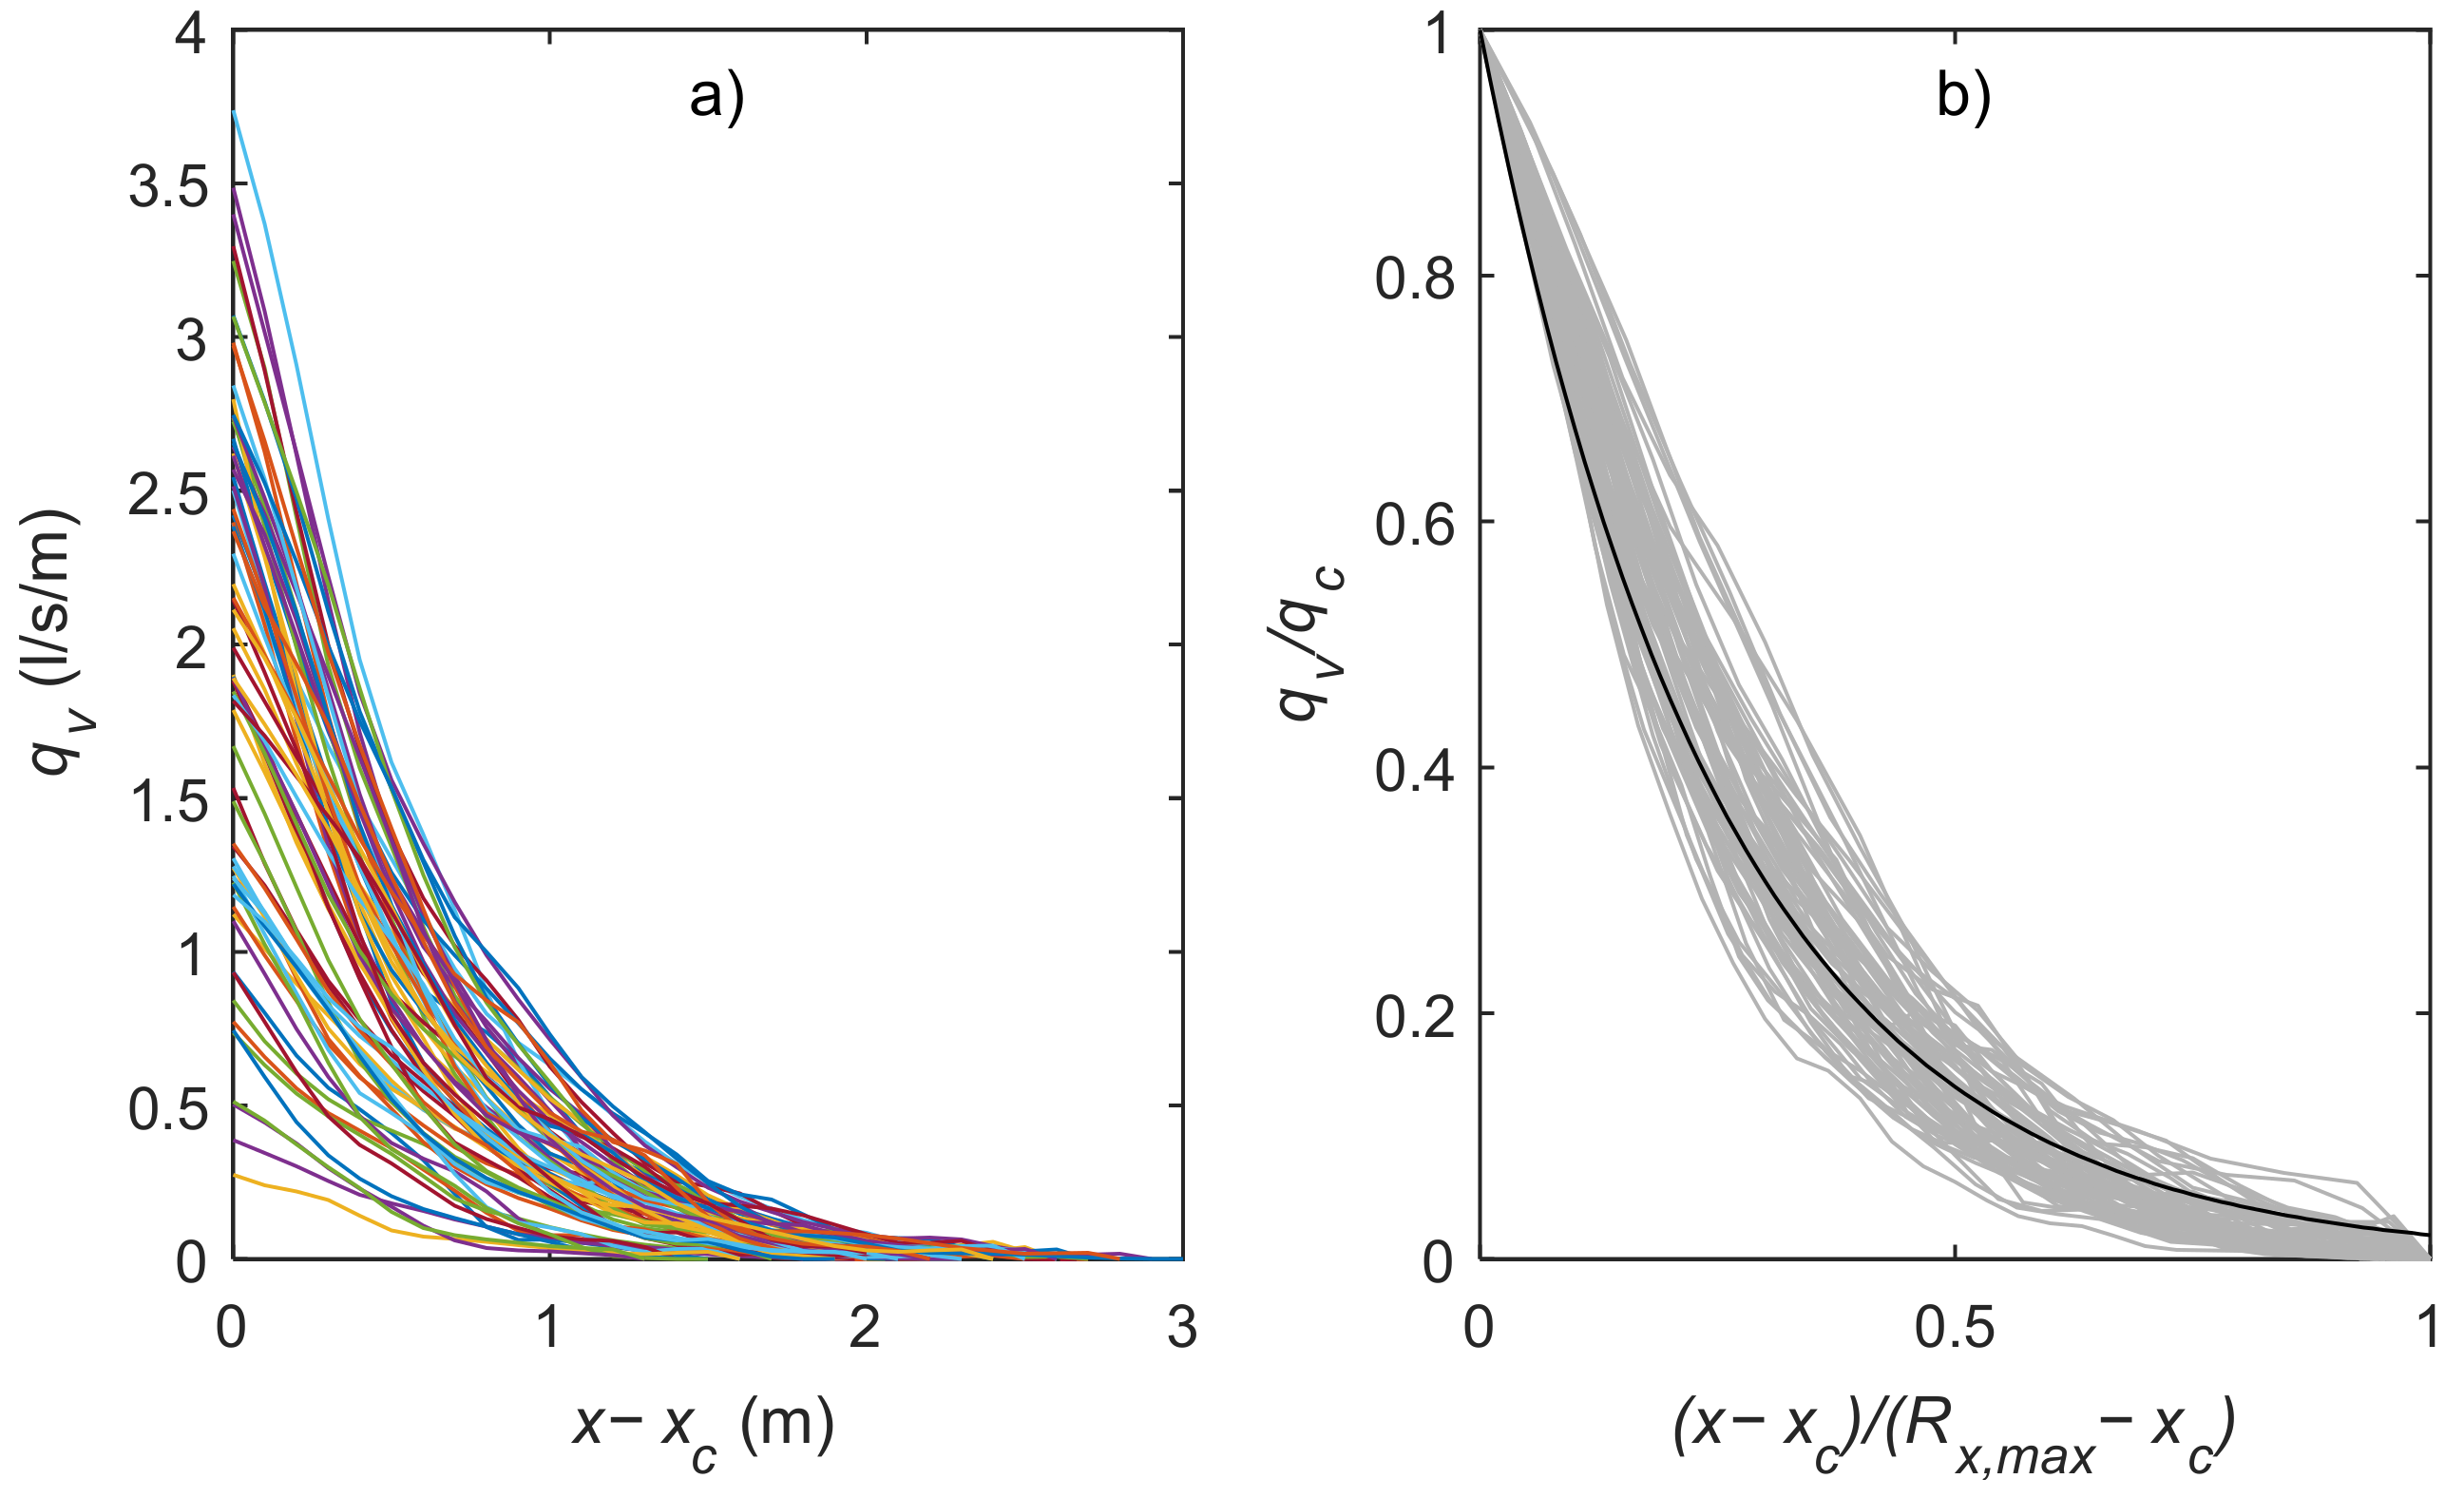
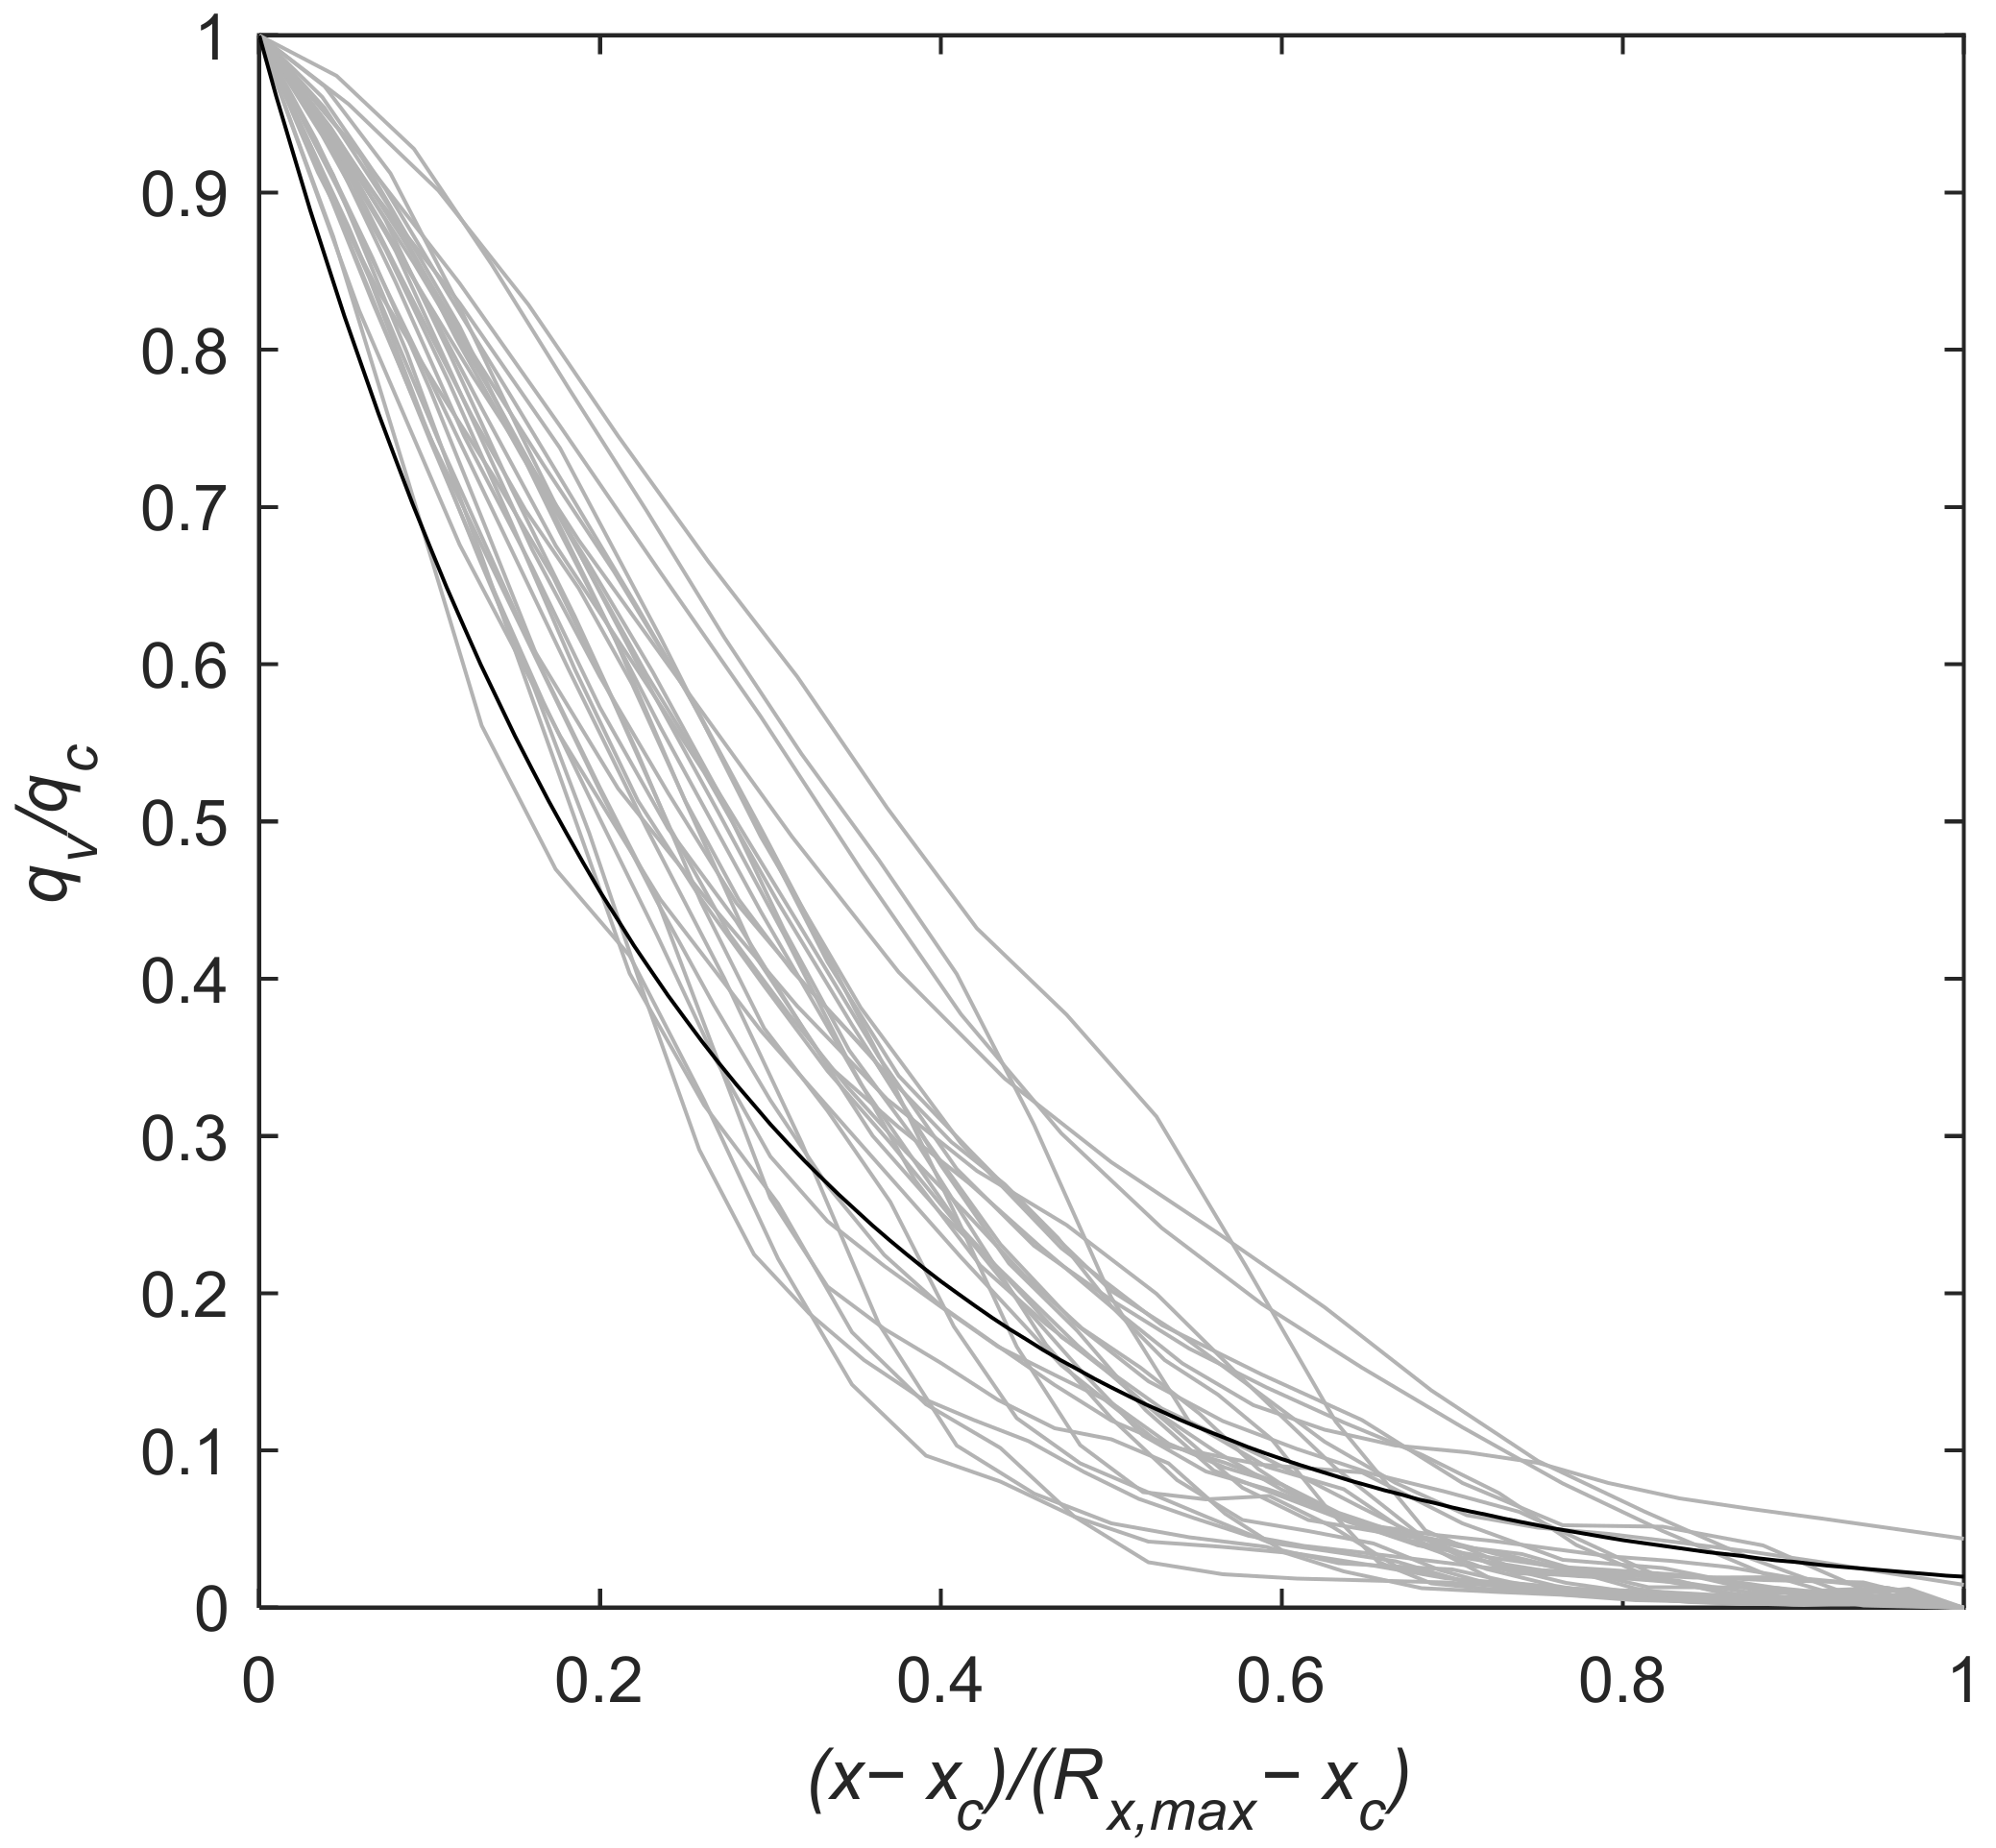
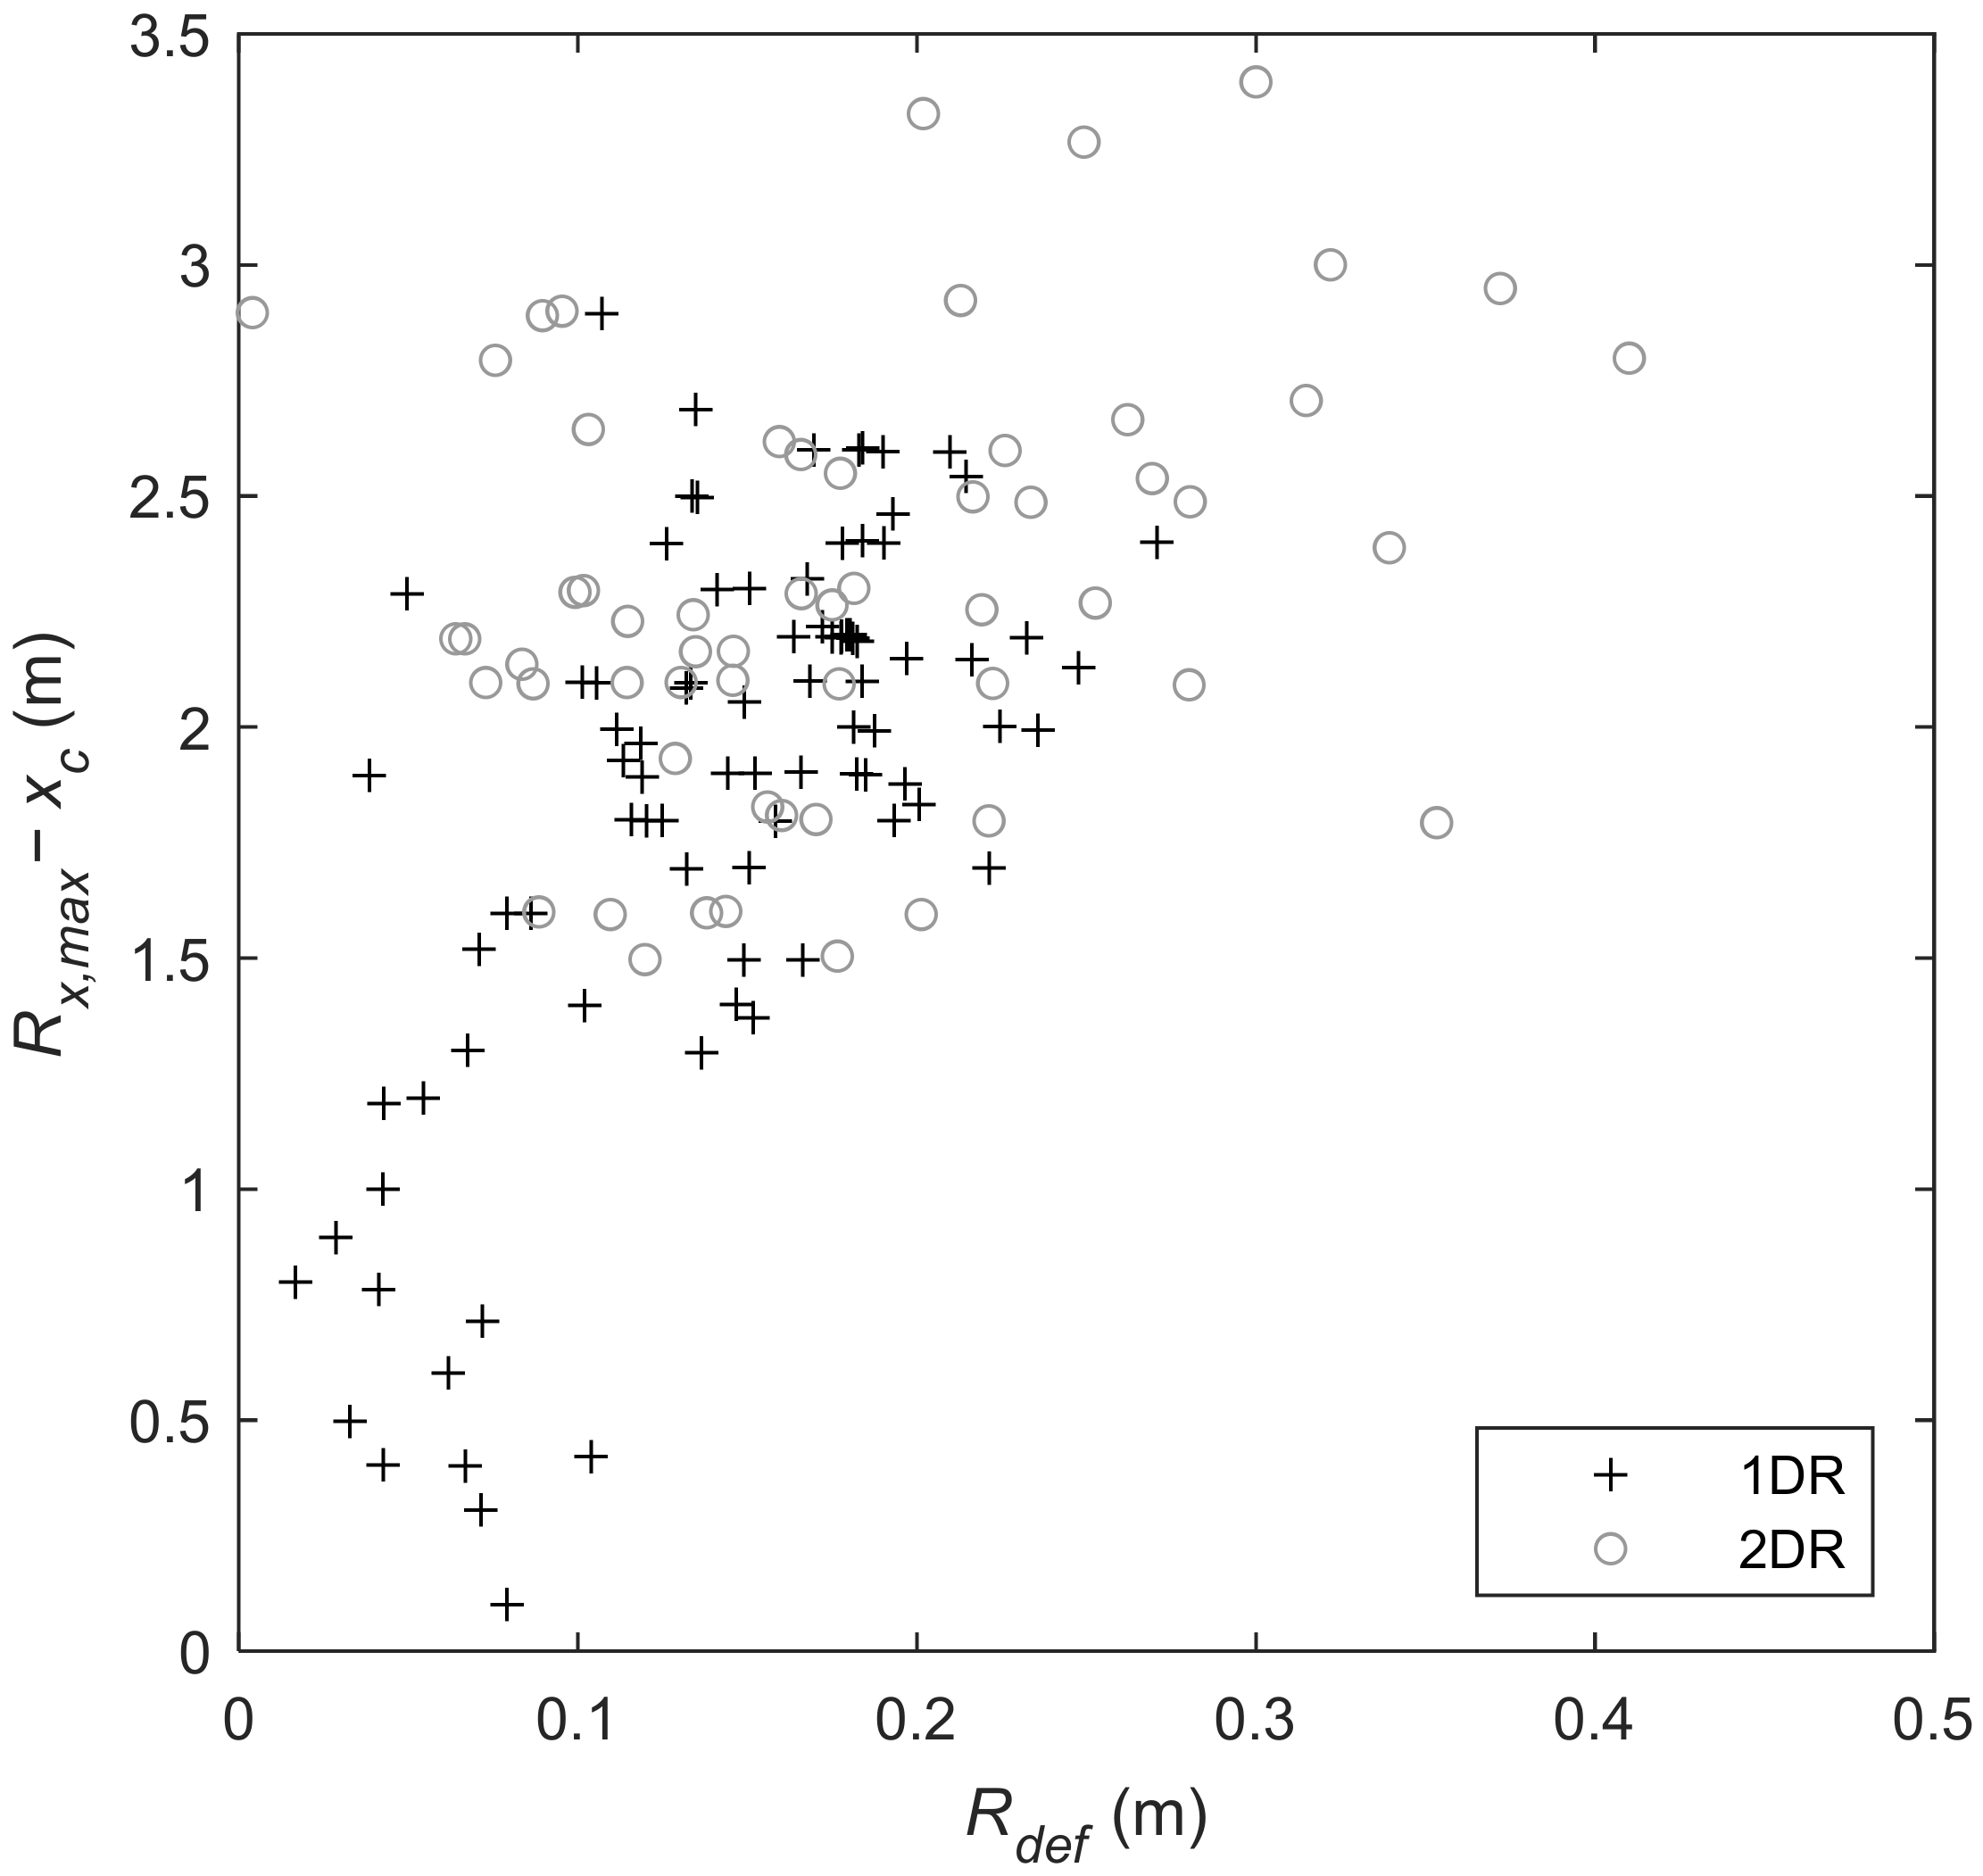
3.3. Spatial Distribution of Overtopping Discharge

An advantage of using remote sensing methods to estimate wave overtopping is that the location of measurement points is not fixed, making it possible to investigate the spatial distribution of overtopping flows. This is particularly relevant on a porous structure where the mass of flow passing over the structure is not conserved due to high levels of infiltration (unlike on impermeable sea dikes, e.g., [29]).
The analysis below focusses on the 1DR experiment where the structure crest is relatively flat and so there are reduced complications caused by flow acceleration on the landward slope of the revetment crest in 2DR. Figure 9a presents the cross-shore distribution of qv relative to the structure crest for all 20 min segments during 1DR where the entire structure was not overtopped such that flow reached the sand behind the revetment (see Figure 1a). In Figure 9a, the values of qv at each cross-shore position (Δx = 0.1 m) are calculated using Equation (9) by evaluating the maximum overtopping volume (Vv,max) captured landward of each measurement location for every overtopping event. Due to infiltration, the maximum overtopping volumes and hence qv decays rapidly landward of the revetment crest.
The normalised discharge distributions in Figure 9b indicate a level of self-similarity and can be described using power law decay, with the best-fit power law decay function found to be:
q v q c = 1 x x c ( R x , m a x x c ) 3 ,
where qc is the overtopping discharge at the crest, xc is the horizontal location of the revetment crest and Rx,maxxc represents the incursion distance, defined here as the horizontal distance between the revetment crest and the maximum recorded shoreline position Rx,max during each 20 min segment.
While the landward sloping crest of the 2DR revetment will influence the spatial distribution of overtopping discharge, Figure 10 indicates that the distributions are relatively similar, if slightly more variable than for 1DR and Equation (12) can be reasonably applied to the 2DR data.

Implications for Dynamic Cobble Berm Revetment Design

The ability to measure the spatial variation of overtopping discharge landward of the crest is a significant advantage of the Lidar-based method used here. The results presented in Figure 10a indicate that discharge qv decays rapidly landward of the crest, leading to a substantial reduction in the risk to people safety or inundation with distance from the crest. For example, if the current large-scale experiments are considered to be at prototype scale, Figure 4 shows that the time-averaged overtopping discharge at the crest, qv exceeded the recommended tolerable limit for an aware pedestrian of 0.1 l/s/m [30] during 88% of all 20 min segments during 1DR. However, this value was not exceeded during any segment only 2 m landward of the crest.
The decay of overtopping discharge landward of a dynamic cobble berm revetment crest is described well using the power law relationship given in Equation (12) for the current experiment. Further it was demonstrated that overtopping discharge at the crest can be predicted using the EurOtop equation to within approximately a factor of 3 if an appropriate value of γf is used (Figure 7). This performance is comparable to that for static coastal structures. Thus, if the incursion distance (Rx,maxxc) can be reasonably estimated, it is possible to predict the spatial distribution of overtopping discharge.
Figure 11 indicates that the incursion distance beyond the revetment crest increases with freeboard deficit as might be expected, but the data from the present study is very scattered. This scatter and difference between results for 1DR and 2DR is likely due to the variable backbarrier geometry. For 2DR, the landward sloping gradient behind the crest means that any events which overtop the crest will run down the backbarrier and this leads to a minimum measured incursion distance of 1.5 m. For 1DR, the barrier crest is approximately flat and as such there is no physically defined minimum incursion distance and the relationship between incursion and runup deficit is stronger. While scattered, the results indicate that it may be possible to approximate (Rx,maxxc) as a function of Rdef and use this value along with Equations (10) and (12) to estimate the spatial distribution of overtopping discharge. The best fit linear regression for the current data suggests Rx,maxxc ≈ 11.4Rdef, however it is suggested that additional experimental data is required to better understand this relationship, in particular the effect of barrier geometry. The ability to predict the spatial distribution of wave overtopping discharge would aid the dynamic cobble berm design process as it would enable the specification of a design crest elevation and structure width that would maintain tolerable overtopping discharge at a particular location. Such a method would also enable more robust safety assessments of existing revetment structures and naturally occurring composite beach ridges. It is noted that the dynamic nature of dynamic cobble berm revetments means that the structure geometry would not be constant and so a conservative design process would be required.

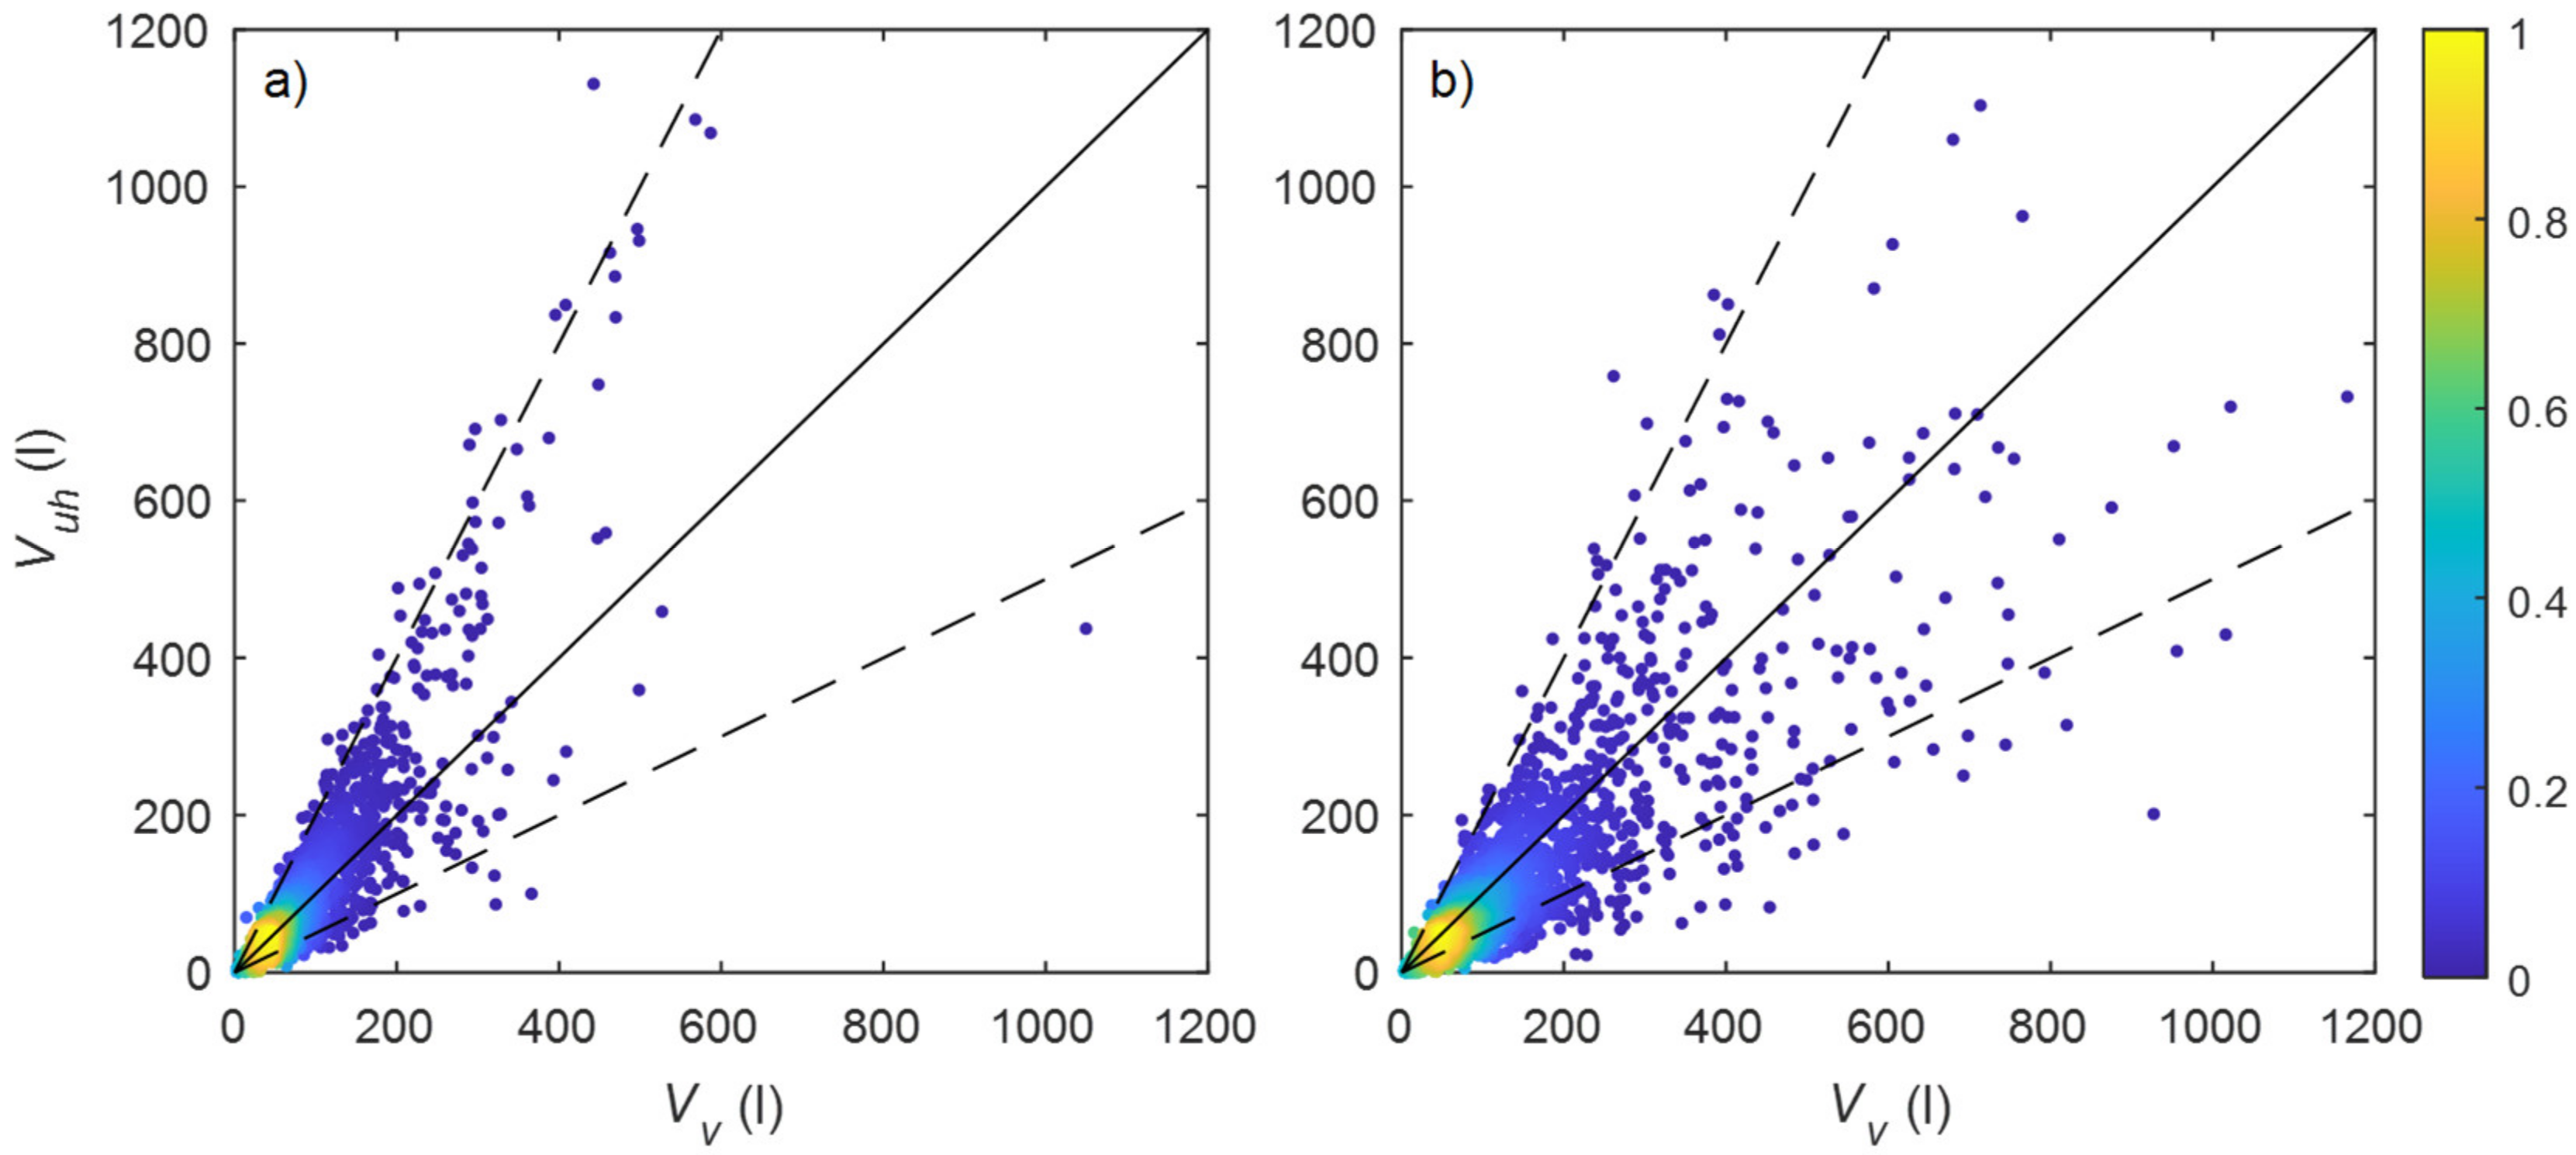
3.4. Infiltration of Overtopping Volume

The decay of overtopping discharge landward of the revetment crest observed in Figure 9 and Figure 10 is primarily a result of volume loss through infiltration into the porous revetment. This infiltration of the overtopping flow is an important characteristic contributing to the stability of coastal barriers and dynamic revetments. However, if infiltration rates are too great this could lead to scour below the revetment and subsequent sub-surface erosion of the barrier.
The ability of the Lidar to capture flow volumes enables the time decay of volume after overtopping to be measured in order to estimate the infiltration rate. Figure 3d shows the typical decay of the overtopped flow volume landward of the crest due to infiltration into the bed between t = 4.3 s and t = 5.7 s and indicates a gradually reducing rate of volume loss with time as the depth of the overtopped flow volume on the revetment crest reduces. Figure 12 presents the infiltration flow rate as a function of the mean depth of the overtopping flow, where infiltration rate Si(t) is calculated during the period after the overtopping event has reached its landward limit and the overtopped flow volume is decaying (e.g., t = 4.3 s to t = 5.7 s in Figure 3d) as:
S i t = 1 l t d V v t d t ,  
where l is the cross-shore distance landward of the revetment crest covered by time-varying overtopping flow.
The analysis focusses on overtopping events with a single peak in the volume time-series that occurred in the 3-h period between 18 and 21 h for both experiments and discounts any overtopping events where multiple overriding waves overtopped the revetment, because this greatly influences the cross-barrier decay of the flow volume. Furthermore, only events with an intrusion distance larger than 0.5 m but smaller than the structure crest width were considered.
Figure 12 indicates that instantaneous infiltration rates averaged over the overtopping volume are two to three orders of magnitude larger than previously observed on sand beaches [31], with median values of −0.07 ms−1 (−0.11 ms−1) and rates of up to −0.87 ms−1 (−1.37 ms−1) measured during experiment 1DR (2DR). While the data is scattered, there is a clear trend for higher infiltration rates with larger flow depths when the pressure head at the bed is relatively large. Infiltration rates tend to be larger for 2DR, primarily because of larger measured flow depths. It may be expected that for a constant value of mean flow depth h, infiltration rates would be higher for 1DR where the well-sorted, rounded cobbles for 1DR would lead to a more porous structure and higher infiltration rates ( 1 D R = 0.41 ;   2 D R = 0.35 )
. This is not obvious in the results presented here, though the scatter is substantial.
Due to the intermittent nature of wave overtopping, it is assumed that the bed is unsaturated during initial overtopping. Packwood [32] presented a model to estimate the influence of an unsaturated porous bed on wave runup on sandy beaches which has been successfully employed in the XBeach-G model to calculate infiltration rate Si. If we assume hydrostatic pressure variation with depth:
S i = K h δ w f + 1 ,
where K is the hydraulic conductivity, h is the flow depth and δ w f is the time-varying thickness of the wetting front (the depth of the infiltrating flow volume below the revetment surface). Note that due to the presence of cobbles, the wetting front thickness will increase at a greater rate than the decrease in overlying overtopping volume depth.
Equation (14) includes a dependence of Si on the overtopping volume flow depth h which is observed in the current data in Figure 12. However, Equation (14) assumes that the cobble bed is unsaturated and as such is ventilated beneath the wetting front, leading to the result that SiK as the water depth h → 0. Values of hydraulic conductivity for cobble beds are not well documented, but K is expected to be approximately 0.1 to 1 m/s [33,34]. The current data does not appear to agree with this result as observed in Figure 12 which indicates that Si → 0 for h → 0. Several possible reasons for this exist: (1) Equation (13) is based on conservation of mass and assumes that volume is only lost through infiltration into the cobbles, as such it must be applied over the entire overtopping volume. This means that the infiltration rates presented are averaged over cross-shore distances of the order of metres and local rates may be different. (2) The cross-shore resolution of the Lidar data (0.1 m) is not sufficient to resolve individual cobbles, consequently the accuracy of the depth estimates is limited by the irregularity of the cobble surface and the effect of this uncertainty will be largest at small values of h. Furthermore, the values of depth presented are also averaged over the entire time-varying overtopping volume. (3) Due to the relatively low gradient of the underlying sand bed, infiltrating water may not always drain seaward between consecutive overtopping events meaning that the bed is not always ventilated. (4) It is possible that due to the small thickness of the cobble layer overlying the sand bed (generally < 0.5 m) and the low gradient of the sand, the wetting front for larger events reaches the sand bed during the early stages of overtopping, meaning that the bed is not ventilated as assumed by Equation (14).

4. Conclusions

The results presented in this paper indicate that 2D scanning Lidar can be used to capture wave overtopping of porous dynamic coastal structures with evolving geometry. Two different analysis methods were used to estimate wave-by-wave overtopping volumes and agreed to within a factor of two for the majority of events, with better agreement for time-averaged discharge. This result gives confidence that Lidar is a valid tool for the measurement of wave overtopping, however further validation against overtopping tanks on a fixed, porous structure would be beneficial.
The commonly used EurOtop parameterisation for estimating overtopping discharge was found to provide estimates of time-averaged wave overtopping to within a factor of three, which is comparable to the expected accuracy for typical fixed coastal protection structures. Use of an appropriate friction factor is essential for robust application of the EurOtop equation. For the current dataset the friction factor was found here to be smaller for round, well-sorted compared to angular, poorly-sorted cobbles. It is hypothesised that this difference is due to the increased porosity of the rounded cobble revetment leading to higher infiltration rates. To investigate this further, the time-variation of the overtopped flow volume was used to obtain the first estimates of infiltration rate into cobble beaches. These data indicate infiltration rates 2–3 orders of magnitude larger than on sand beaches, but there was no evidence of higher infiltration rates for the rounded cobble revetment.
The ability to capture the time-variation of the entire overtopping volume, rather than just flow volume or velocity and depth measurements at one location, enables the cross-shore distribution of overtopping discharge to be measured. It is demonstrated that the overtopping discharge decays rapidly landward of the crest due to the porous nature of the structure and can be described using a power law function. This is valuable for the design of porous structures where the rapid decay of overtopping discharge means that inundation and safety concerns can potentially be reduced by using an appropriate structure width and setting back access routes and infrastructure.

Author Contributions

Conceptualisation, C.E.B., P.M.B., T.E.B. and S.S.; Methodology, C.E.B., P.M.B., T.E.B., L.P.A. and S.S.; Formal Analysis, C.E.B., P.M.B. and O.F.; Investigation, C.E.B. and T.E.B.; Data Curation, S.S., C.E.B. and P.M.B.; Writing—Original Draft, C.E.B. and T.E.B.; Writing—Review and Editing, C.E.B., T.E.B., P.M.B., O.F., L.P.A. and S.S. All authors have read and agreed to the published version of the manuscript.

Funding

DynaRev1 received funding from the European Union’s Horizon 2020 research and innovation programme under grant agreement No 654110, HYDRALAB+. DynaRev2 was funded through a Research England Global Challenges Research Fund. Chris Blenkinsopp was supported by a Royal Academy of Engineering Leverhulme Trust Research Fellowship. Ollie Foss and Paul Bayle were supported by a PhD scholarship through the EPSRC CDT in Water Informatics: Science and Engineering (WISE).

Data Availability Statement

The data from the DynaRev1 experiment analysed within this manuscript is available for download from DOI 10.5281/zenodo.3889796. Additional metadata is provided within each *.mat file detailing how the data from each instrument is stored. Note also that all raw, unprocessed data is available at DOI 10.5281/zenodo.3855650.

Acknowledgments

The authors would like to acknowledge the support of everyone who assisted with the laboratory experiments reported here, in particular Matthias Kudella, Kévin Martins, Isabel Kelly, Emily Gulson and Tom Beuzen.

Conflicts of Interest

The authors declare no conflict of interest.

References

  1. Van der Meer, J.W.; Janssen, J. Wave Run-Up and Wave Overtopping at Dikes and Revetments; Publication No. 485; Delft Hydraulics: Delft, The Netherlands, 1994. [Google Scholar]
  2. EurOtop. Manual on Wave Overtopping of Sea Defences and Related Structures. An Overtopping Manual Largely Based on European Research, but for Worldwide Application; Van der Meer, J.W., Allsop, N.W.H., Bruce, T., De Rouck, J., Kortenhaus, A., Pullen, T., Schüttrumpf, H., Troch, P., Zanuttigh, B., Eds.; 2018. Available online: www.overtopping-manual.com (accessed on 12 January 2022).
  3. Victor, L.; Troch, P. Wave Overtopping at Smooth Impermeable Steep Slopes with Low Crest Freeboards. J. Waterw. Port Coast. Ocean Eng. 2012, 138, 372–385. [Google Scholar] [CrossRef]
  4. Pullen, T.; Allsop, N.W.H.; Bruce, T.; Pearson, J. Field and laboratory measurements of mean overtopping discharges and spatial distributions at vertical seawalls. Coast. Eng. 2009, 56, 121–140. [Google Scholar] [CrossRef]
  5. Williams, H.E.; Briganti, R.; Romano, A.; Dodd, N. Experimental analysis of wave overtopping: A new small scale laboratory dataset for the assessment of uncertainty from smooth sloped and vertical coastal structures. J. Mar. Sci. Eng. 2019, 7, 217. [Google Scholar] [CrossRef] [Green Version]
  6. Troch, P.; Geeraerts, J.; Van de Walle, B.; De Rouck, J.; Van Damme, L.; Allsop, W.; Franco, L. Full-scale wave overtopping measurements on the Zeebrugge rubble mound breakwater. Coast. Eng. 2004, 51, 609–628. [Google Scholar] [CrossRef]
  7. Briganti, R.; Bellotti, G.; Franco, L.; De Rouck, J.; Geeraerts, J. Field measurements of wave overtopping at the rubble mound breakwater of Rome-Ostia yacht harbour. Coast. Eng. 2005, 52, 1155–1174. [Google Scholar] [CrossRef]
  8. Pullen, T.; Silva, E.; Brown, J.; Yelland, M.; Pascal, R.; Pinnell, R.; Cardwell, C.; Jones, D. WireWall—Laboratory and field measurements of wave overtopping. In Proceedings of the Coastal Structures Conference 2019, Hannover, Germany, 30 September–2 October 2019. [Google Scholar]
  9. Allan, J.C.; Hart, R. Profile dynamics and particle tracer mobility of a cobble berm constructed on the Oregon Coast. In Proceedings of the Coastal Sediments’ 07, New Orleans, LO, USA, 13–17 May 2007. [Google Scholar]
  10. Bayle, P.M.; Blenkinsopp, C.E.; Conley, D.; Masselink, G.; Beuzen, T.; Almar, R. Performance of a dynamic cobble berm revetment for coastal protection, under increasing water level. Coast. Eng. 2020, 159, 103712. [Google Scholar] [CrossRef]
  11. Bayle, P.M.; Kaminsky, G.M.; Blenkinsopp, C.E.; Weiner, H.M.; Cottrell, D. Behaviour and performance of a dynamic cobble berm revetment during a spring tidal cycle in North Cove, WA, USA. Coast. Eng. 2021, 167, 103898. [Google Scholar] [CrossRef]
  12. Matias, A.; Masselink, G. Overwash Processes: Lessons from Fieldwork and Laboratory Experiments. In Coastal Storms: Processes and Impacts; Ciavola, P., Coco, G., Eds.; Wiley-Blackwell: Hoboken, NJ, USA, 2017; pp. 175–194. [Google Scholar]
  13. Leatherman, S.P. Overwash Hydraulics and Sediment Transport; Coastal Sediments: Charleston, SC, USA, 1977. [Google Scholar]
  14. Leatherman, S.P.; Zaremba, R.E. Overwash and aeolian processes on a US Northeast coast barrier. Sediment. Geol. 1987, 52, 183–206. [Google Scholar] [CrossRef]
  15. Holland, K.T.; Holman, R.A.; Sallenger, A.H. Estimation of Overwash Bore Velocities Using Video Techniques; Coastal Sediments: Seattle, WA, USA, 1991. [Google Scholar]
  16. Matias, A.; Ferreira, Ó.; Vila-Concejo, A.; Morris, B.; Dias, J.A. Short-term morphodynamics of non-storm overwash. Mar. Geol. 2010, 274, 69–84. [Google Scholar] [CrossRef]
  17. Almeida, L.P.; Masselink, G.; McCall, R.; Russell, P. Storm overwash of a gravel barrier: Field measurements and XBeach-G modelling. Coast. Eng. 2017, 120, 22–35. [Google Scholar] [CrossRef] [Green Version]
  18. Orford, J.D.; Carter, R.W.G. Crestal overtop and washover sedimentation on a fringing sandy gravel barrier coast, Carnsore Point, Southeast Ireland. J. Sediment. Petrol. 1982, 52, 265–278. [Google Scholar]
  19. Matias, A.; Blenkinsopp, C.; Masselink, G. Detailed investigation of overwash on a gravel barrier. Mar. Geol. 2014, 350, 27–38. [Google Scholar] [CrossRef] [Green Version]
  20. Matias, A.; Masselink, G.; Castelle, B.; Blenkinsopp, C.E.; Kroon, A. Measurements of morphodynamic and hydrodynamic overwash processes in a large-scale wave flume. Coast. Eng. 2016, 113, 33–46. [Google Scholar] [CrossRef] [Green Version]
  21. Hofland, B.; Diamantidou, E.; Van Steeg, P.; Meys, P. Wave runup and wave overtopping measurements using a laser scanner. Coast. Eng. 2015, 106, 20–29. [Google Scholar] [CrossRef]
  22. Oosterlo, P.; Hofland, B.; van der Meer, J.W.; Overduin, M.; Steendam, G.J. Calibration and preparation of field measurements of oblique wave run-up and overtopping on dikes using laser scanners. Coast. Eng. 2021, 167, 103915. [Google Scholar] [CrossRef]
  23. Blenkinsopp, C.E.; Bayle, P.M.; Conley, D.C.; Masselink, G.; Gulson, E.; Kelly, I.; Almar, R.; Turner, I.L.; Baldock, T.E.; Beuzen, T.; et al. High-resolution, large-scale laboratory measurements of a sandy beach and dynamic cobble berm revetment. Sci. Data 2021, 8, 1–11. [Google Scholar] [CrossRef]
  24. Ibrahim, M.S.; Baldock, T.E. Swash overtopping on plane beaches—Reconciling empirical and theoretical scaling laws using the volume flux. Coast. Eng. 2020, 157, 103668. [Google Scholar] [CrossRef] [Green Version]
  25. Martins, K.; Blenkinsopp, C.E.; Power, H.E.; Bruder, B.; Puleo, J.; Bergsma, E.W.J. High-resolution monitoring of wave transformation in the surf zone using a LiDAR scanner array. Coast. Eng. 2017, 128, 37–43. [Google Scholar] [CrossRef]
  26. Almeida, L.P.; Masselink, G.; Russell, P.E.; Davidson, M.A. Observations of gravel beach dynamics during high energy wave conditions using a laser scanner. Geomorphology 2015, 228, 15–27. [Google Scholar] [CrossRef] [Green Version]
  27. Schüttrumpf, H.; Oumeraci, H. Layer thicknesses and velocities of wave overtopping flow at seadikes. Coast. Eng. 2005, 52, 473–495. [Google Scholar] [CrossRef]
  28. Zaalberg, P. The Relation between Cobble Revetments, Sand and Overtopping: A Numerical Approach With OpenFOAM. Master’s Thesis, Delft University of Technology, Delft, The Netherlands, 2019. [Google Scholar]
  29. Formentin, S.M.; Gaeta, M.G.; Palma, G.; Zanuttigh, B.; Guerrero, M. Flow depths and velocities across a smooth dike crest. Water 2019, 11, 2197. [Google Scholar] [CrossRef] [Green Version]
  30. EurOtop. Wave Overtopping of Sea Defences and Related Structures—Assessment Manual; Allsop, N.W.H., Pullen, T., Bruce, T., van der Meer, J.W., Schuttrumpf, H., Kortenhaus, A., Eds.; 2007. Available online: www.overtopping-manual.com (accessed on 12 January 2022).
  31. Turner, I.L.; Masselink, G. Swash infiltration-exfiltration and sediment transport. J. Geophys. Res. Oceans. 1998, 103, 30813–30824. [Google Scholar] [CrossRef]
  32. Packwood, A.R. The influence of beach porosity on wave uprush and backwash. Coast. Eng. 1983, 7, 29–40. [Google Scholar] [CrossRef]
  33. McCall, R. Process-Based Modelling of Storm Impacts on Gravel Coasts. Ph.D. Thesis, Plymouth University, Plymouth, UK, 2015. [Google Scholar]
  34. Judge, A. Measurement of the Hydraulic Conductivity of Gravels Using a Laboratory Permeameter and Silty Sands Using Field Testing with Observation Wells. Ph.D. Thesis, University of Massachusetts Amherst, Amherst, MA, USA, 2013. [Google Scholar]
Figure 1. Sandy beach and revetment geometry for (a) DynaRev1 and (b) DynaRev2. The filled grey region and orange line indicate the dynamic revetment and sand beach profile at the end of testing at zWL = 4.9 m. The dot-dashed region shows the initial revetment cross-section, and the dotted black line indicates the sand profile after revetment construction. The dashed blue horizontal line indicates zWL = 4.8 m, and the solid blue dashed line shows zWL = 4.9 m. The crest locations for the final profiles are marked by a red circle. The black triangles mark the cross-shore position of the Lidar, the Lidar elevation is z = 11.8 m and the swath is approximately 30 m in length in both experiments and so covers the entire region shown in panels a and b. (c) Photograph of the DynaRev2 revetment.
Remotesensing 14 00513 g001
Figure 2. Timeseries of wave, morphology and overtopping data during each 20 min segment (see Section 2.2) for 1DR (left) and 2DR (right). (a,b) Significant wave height (primary x-axis, black) and peak wave period (secondary y-axis, blue). (c,d) Crest elevation zc (black) and predicted runup elevation R2% (blue). (e,f) Percentage of swash events which overtopped the revetment crest (primary axis, black) and deficit in freeboard (secondary axis, blue). (g,h) Overtopping discharge qv (primary axis, black) and deficit in freeboard Rdef (secondary axis, blue). The grey box indicates the period for which zWL = 4.8 m, at all other times zWL = 4.9 m.
Remotesensing 14 00513 g002
Figure 3. Example overtopping event. (a) Timestack of flow depths during an example overtopping event. The red line shows the cross-shore location of the revetment crest, xc and the solid white line indicates the shoreline position. (b) Time series of depth h at the revetment crest during the overtopping event. (c) Landward velocity of the shoreline. (d) Timeseries of overtopping volume using the peak volume (Vv) and sum of positive discharge (Vuh) methods. The red markers indicate the overtopping volume estimates Vv,max = 0.087 m3 (red diamond) and Vuh,max = 0.096 m3 (red circle) for this event. Note that Vv is calculated relative to the bed elevation preceding the overtopping event and so does not return to zero in this case because the overtopping leads to minor bed accretion.
Remotesensing 14 00513 g003
Figure 4. Scatter plot comparing the overtopping discharge measured using the peak volume (qv) and sum of positive discharge methods (quh) for all 20 min segments during 1DR (black crosses) and 2DR (grey circles). The solid black line represents qv = quh and the black dashed lines indicate a factor of 2 range about the 1:1 line.
Remotesensing 14 00513 g004
Figure 5. Comparison of event-by-event overtopping volume estimates obtained using the peak volume (Vv) and sum of positive discharge (Vuh) methods during (a) 1DR and (b) 2DR. The solid black line represents Vv = Vuh and the black dashed lines indicate a factor of 2 range about the 1:1 line. The colour scale indicates the normalised point density.
Remotesensing 14 00513 g005
Figure 6. Overtopping discharge normalised using the EurOtop scaling [2] as a function of freeboard deficit R*2. Black crosses indicate 1DR data and grey circles 2DR.
Remotesensing 14 00513 g006
Figure 7. Predicted normalised overtopping discharge as a function of the measured values. Black crosses indicate 1DR data and grey circles 2DR. The solid black line represents the 1:1 relationship and the black dashed lines indicate a factor of 3 range about the 1:1 line.
Remotesensing 14 00513 g007
Figure 8. Exceedance probabilities for individual wave overtopping volumes measured between 12 and 24 h of testing (zWL = 4.9 m) when the crest position was approximately constant. Black crosses represent data for 1DR (Rc/Hm0 = 1.26) and the 2DR data are shown as grey circles (Rc/Hm0 = 1.27).
Remotesensing 14 00513 g008
Figure 9. (a) Cross-shore distribution of overtopping discharge qv relative to the revetment crest location during 1DR where the data from each 20 min segment is represented using a different colour. Note that 20 min segments where the entire structure was overtopped such that overtopping events reached the sand beach landward of the revetment (x = 264.1 m) were excluded from this analysis. (b) Overtopping discharge normalised by the overtopping discharge at the crest as a function of distance from the revetment crest normalised by the measured incursion distance for each segment. The grey lines indicate the data for each segment and the solid black line shows the best fit power law and exponential decay functions respectively.
Remotesensing 14 00513 g009
Figure 10. Overtopping discharge normalised by the overtopping discharge at the crest during 2DR as a function of incursion distance for each segment. The grey lines indicate the data for each segment and the solid black line shows Equation (12). Note that 20 min segments where the entire structure was overtopped such that overtopping events reached the sand beach landward of the revetment (x = 275.1 m) were excluded from this analysis.
Remotesensing 14 00513 g010
Figure 11. Incursion distance relative to the cross-shore crest location as a function of the freeboard deficit. Black crosses represent data for 1DR and the 2DR data are shown as grey circles. Note that 20 min segments where the entire structure was overwashed such that overtopping events reached the sand beach landward of the revetment were excluded from this analysis.
Remotesensing 14 00513 g011
Figure 12. Overtopping volume infiltration rate as a function of the mean depth of the overtopped flow volume: (a) 1DR and (b) 2DR.
Remotesensing 14 00513 g012
Publisher’s Note: MDPI stays neutral with regard to jurisdictional claims in published maps and institutional affiliations.

