Article

Tracking of Land Reclamation Activities Using Landsat Observations—An Example in Shanghai and Hangzhou Bay

1
State Key Laboratory of Information Engineering in Surveying, Mapping and Remote Sensing, Wuhan University, Wuhan 430079, China
2
Department of Geographical Sciences, University of Maryland, College Park, MD 20770, USA
*
Author to whom correspondence should be addressed.
Remote Sens. 2022, 14(3), 464; https://doi.org/10.3390/rs14030464
Submission received: 7 December 2021 / Revised: 9 January 2022 / Accepted: 17 January 2022 / Published: 19 January 2022

Abstract

:
At present, reclamation—changing ocean areas into inland land cover type for human usage—is one of the major methods for expanding land area around the world to alleviate the problem of land shortage. Thus, reclamation activities play an important role in land area extension. In recent years, reclamation projects have been active in eastern China. However, research on how to determine the initiation of reclamation activity remains very limited. Thus, a method of tracking reclamation activities was proposed in this study to analyze the coastline change due to human activities in Shanghai Lingang New City and Hangzhou Bay area. First, the reclamation area was extracted and separated into sea filling and sea enclosing. Next, the “SEDIMENT” signal track method and the “Eight-Neighborhood” morphological method were used to track dissimilar reclamation types. The historical reclamation activities (including start time and end time) over the recent 30 years were also tracked and obtained. Experimental results indicated that the time tracker accuracy of reclamation activity can reach 83.8%. Thus, this study can provide a reference for tracking coastline change.

Graphical Abstract

1. Introduction

Land cover composition and change are important factors of ecosystem condition and function [1]. With the rapid development of human society, the demand for land has intensified, and available land for development has become scarcer [2]. Land reclamation is one of the potential solutions for the increasing demand of new land for living and development [3]. Because of reclamation activities, coastlines can change dramatically, which greatly affects marine ecology, environmental systems, and economic systems. Many countries such as the Netherlands [4], Japan [5], Korea [6,7], and Indonesia [8], and several megacities such as Mumbai (India), Karachi (Pakistan), Rio de Janeiro (Brazil), and Lima (Peru) [9] had reclamation projects in the past to extend the land area for city expansion or agricultural development. In China, reclamation projects have occurred in recent years, and the coastline has changed significantly in the past four decades [10,11,12]. The coastal environments and economic systems have been influenced during reclamation activities [13]. To obtain a better understanding of coastline change due to human activities, tracking the historical land reclamation activities is necessary. For the development of society, the analysis of reclamation area also brings many benefits. For the decision makers of land reclamation projects, the historical information on reclamation activities can be extremely helpful for building future reclamation projects.
Remote sensing has emerged as a useful data source for quantitatively measuring land-cover changes at the landscape scale [14]. Remote sensing data with high-quality observations are widely used in coastline detection. Contemporary research has quantified the costal change using remote sensing data in recent years. For example, Landsat time-series images from 1976 to 2015 were used to detect the coastline change of Ningbo [15]. The case of island coastline change detection also used Landsat images from 1984 to 2009 [16]. Multiple types of remote sensing data were also used in coastline detection [17,18]. Historical remote sensing data provide an excellent chance to track the land cover and use change. Human activities also can be tracked by remote sensing data.
In recent research, remote sensing data have been widely used to detect land reclamation. Remote sensing data were used to analyze land reclamation in Egypt [19]. Large-scale remote sensing data were also used to detect land reclamation [20]. The reclamation research in China indicated that the enclosed wetland area increased by an average of 24,000 ha year−1 between 1950 and 2000, which led to a loss of 50% of coastal wetlands. From 2006 to 2010, the reclamation rate increased to 40,000 ha year−1 to support rapid urbanization and economic development [12]. Most of recent research analyzed the coastline change due to land reclamation in 5 or 10 year increments, which cannot provide the start time and end times of the reclamation project. Thus, recent research may not meet the annual or even monthly monitoring requirements in practical applications due to the lack of quantitative analysis. The land cover and use of reclamation area was also not investigated.
Thus, this study uses Landsat observations and proposes a method based on sediment factor discrimination to track reclamation activities. The major aim of this work is to proposes a new type of reclamation activity identification based on inland water body change. The study divides the reclamation activities into two types of reclamation and tracks the reclamation area by using the proposed “SEDIMENT” signal track method and “Eight-Neighborhood” morphological method based on Landsat data. We then determine the start and end times of the reclamation projects at monthly or daily scales, to improve the accuracy of existing annual reclamation change research. Finally, this work also analyzes the reclamation activity of Hangzhou Bay to verify the stability of the method and draw a historical reclamation information map.

2. Study Area and Dataset
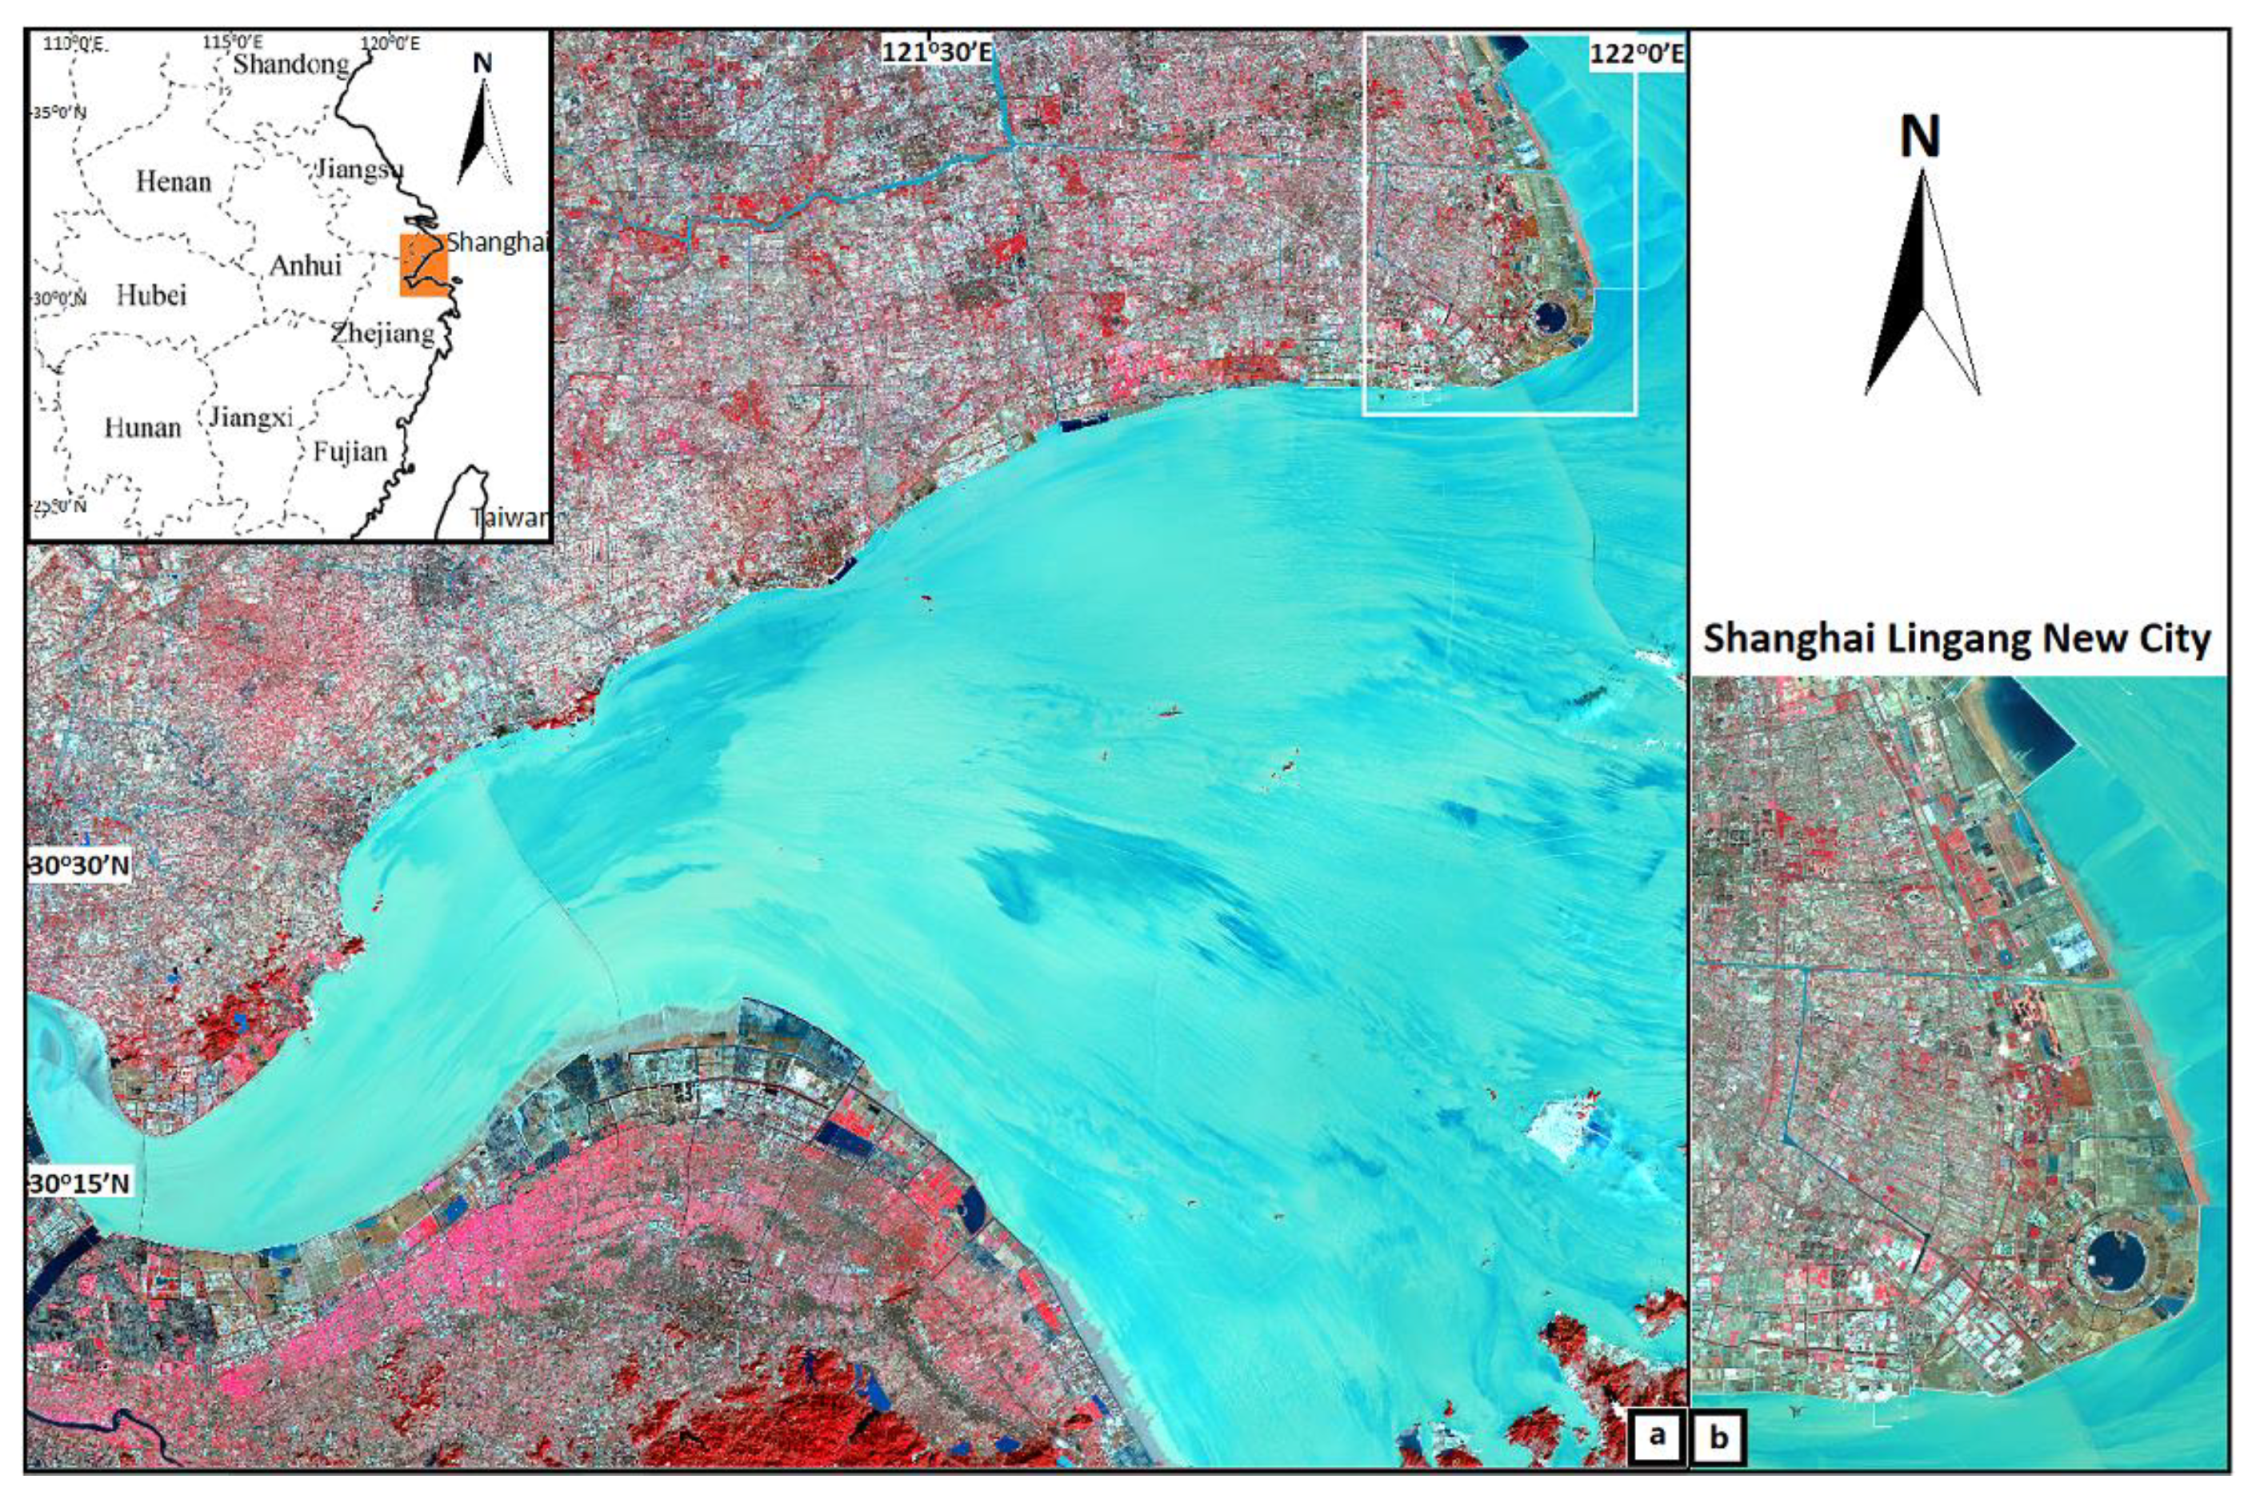
2.1. Study Area

Shanghai is one of the most important cities in east China. Shanghai Lingang New City, located in the south-east of Shanghai, has been called the world’s largest reclamation project. It is a preplanned new city, with an area of approximately 69.11 km2 and is planned for over eight hundred thousand residents. Moreover, 65.85% of the city has been reclaimed from the East China Sea with a lake named Dishui Lake in the middle of the city [21]. This study selects Shanghai Lingang New City as the typical case to build the tracker and monitor the reclamation activities and analyze the reclamation area after the reclamation project.
Hangzhou Bay was selected to analyze the reclamation activity and verify the robustness and the generalization of this method. Hangzhou Bay is a funnel-shaped inlet of the East China Sea, located in the East of China, bordered by the province of Zhejiang and the municipality of Shanghai, which is located to the north of the Bay. The Bay extends from the East China Sea to its head at the city of Hangzhou, from which its name is derived. Before the 1980s, due to social–economic conditions and technology limitations, the reclamation of Zhejiang Province was all around the high beach that is above the tide. In recent years, sea reclamation has become one of the most important projects in the marine development activities of Zhejiang Province. In recent decades, the coastline length changed rapidly in Zhejiang Province, and Hangzhou Bay showed the most coastline change in Zhejiang Province [22]. This study area, located in the north of Zhejiang coastline, starts from the coastline between Ningbo and Zhoushan to the south of Shanghai. It covers the Hangzhou Bay area, including the coastline of Ningbo, Cixi, Hangzhou, Jiaxing and part of Shanghai, as shown in Figure 1.
In this study, two reclamation areas located near Shanghai and Jiaxing are analyzed, and the reclamation map of Hangzhou Bay is produced.

2.2. Study Dataset

To monitor and analyze the reclamation project, the Landsat time series historical data of the study area were used in this study. Landsat historical data with 30 m spatial resolution and high temporal resolution were most suitable for this study [23]. Landsat observations located in 118/039 paths/rows are used. From 1988 to 2018, 108 satellite observations from Landsat-5 Thematic Mapper (TM), Landsat-7 Enhanced Thematic Mapper (ETM+), and Landsat-8 Operational Land Imager (OLI) were used in this study. The selected time interval covered all traceable human reclamation activities in the study area. All the observations used in this study were cloud free and preprocessed to surface reflectance. All the Landsat data used in this study were Collection 1 data. Landsat-5 TM and Landsat-7 ETM+ data were preprocessed by the Landsat Ecosystem Disturbance Adaptive Processing System algorithm [24]. Landsat-8 OLI observations use the Landsat Surface Reflectance Code algorithm [25]. Bands 2 (green 0.52–0.60 μm), 3 (red 0.63–0.69 μm), and 4 (near IR 0.76–0.90 μm) of Landsat-5 TM and Landsat-7 ETM+ were used in the study. Bands 3 (green 0.52–0.60 μm), 4 (red 0.63–0.69 μm), and 5 (near IR 0.76–0.90 μm) of Landsat-8 OLI were also used. All Landsat preprocessed observations were downloaded from the United States Geological Survey global visualization viewer (http://glovis.usgs.gov/ (accessed on 1 July 2021)). The overview of all the observations used in this study are listed in Table 1. For the specific title IDs of the observations see supplementary materials: Table S1.

2.3. Validation Data
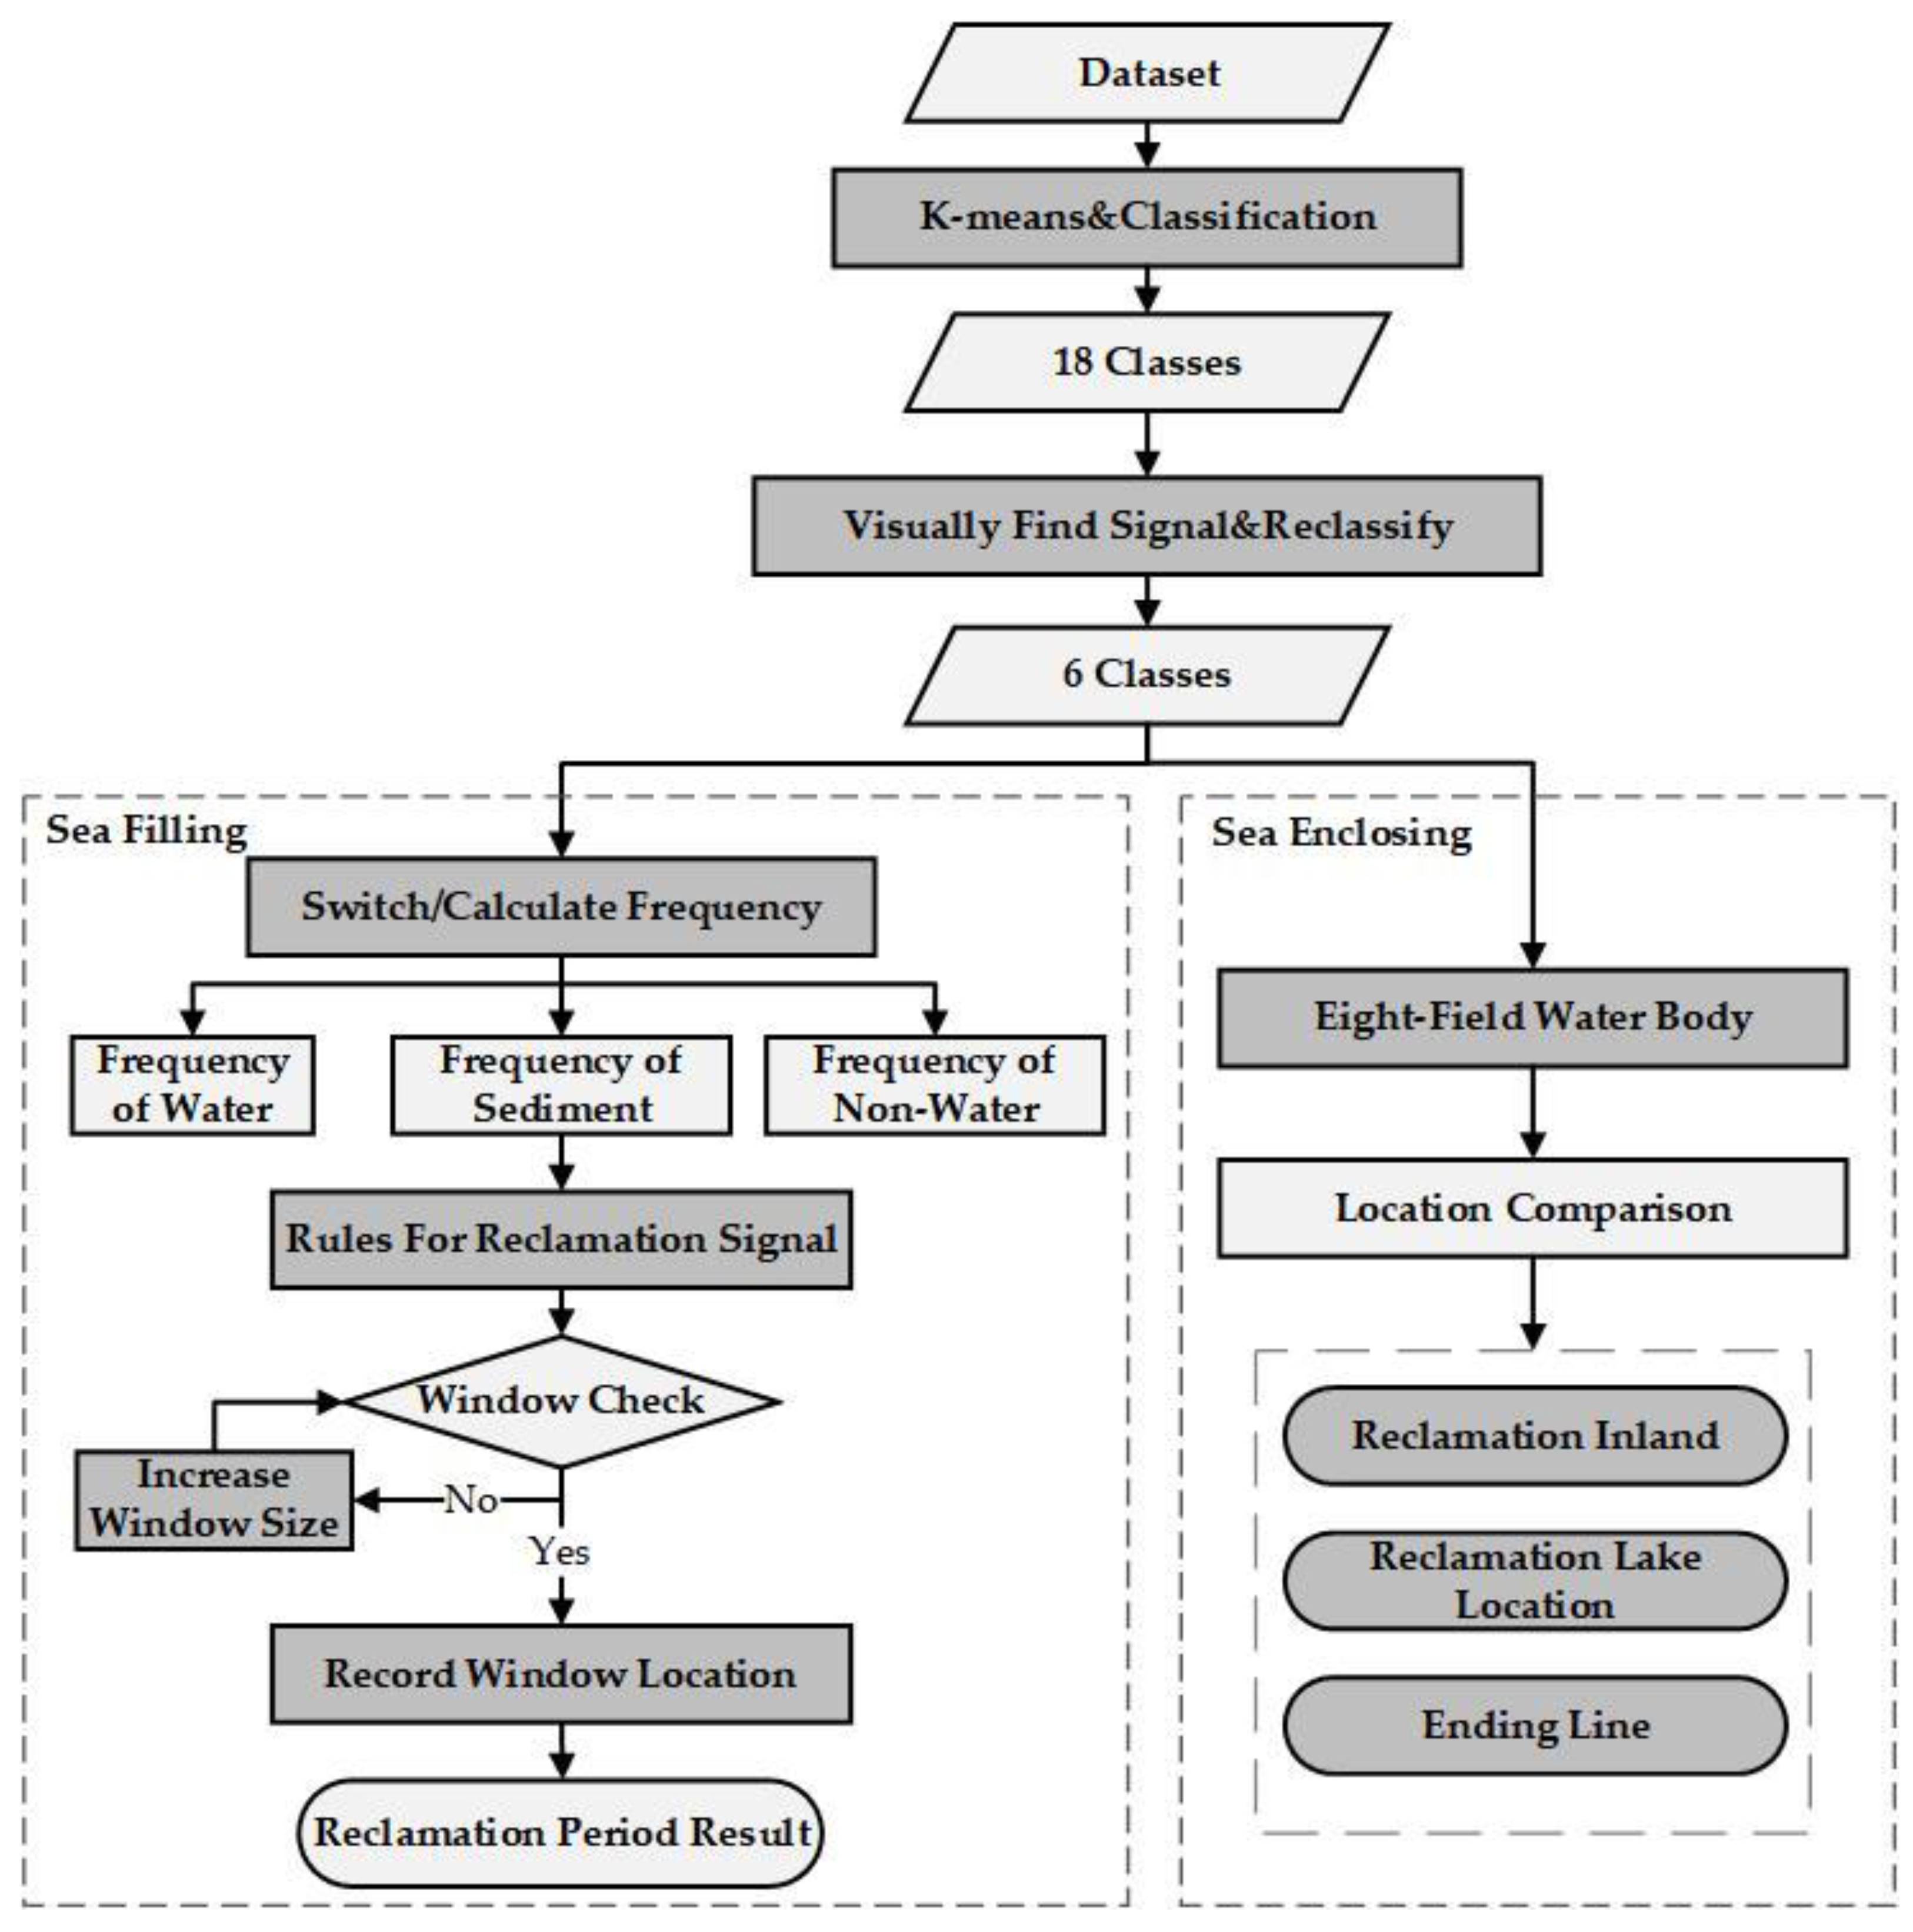
This study aimed to track the reclamation area including the reclamation start time and end time. The results are accurate to years or months in time resolution, and 30 m resolution data were needed for validation. Two existing studies provided 30 m resolution classification product [26,27]. However, they provided global land cover types only available for the years 2000 and 2010, which do not fit the reclamation tracker build in this study. Given the above situation, this study selected Google Earth Pro historical observation for validation. Google Earth provided 30 m observation Landsat true-color historical data from the year 1984. From 1988 to 2018, each year has at least one observation. The historical time series data helped visually check the reclamation period, which verifies the possibility of validation in this study.

3. Method

This study classifies all reclamation methods into two types: (1) Sea filling—filling the sea or coastline area by material such as stone, sand, or soil. The reclaimed area can be used as farmland, ground, urban area, fishpond, or for other human activities. (2) Sea enclosing—enclosure of the sea areas, without filling activities, and the water body is preserved within an enclosing region [3,28]. For these two types of reclamation, the map performance of the area is different. In the definition of two types of reclamation, the sea filling reclamation will change the land cover type of the reclamation area from water at the start into inland land cover at the end. The reflectance performance will show the land cover type change during the process. For the sea enclosing reclamation, the change is that the water body becomes isolated from the marine area. The area will always be the water through Landsat observation. In this case, this study builds up the reclamation tracker for two kinds of reclamation separately.
For the sea filling type of reclamation, this study established a new method based on the “SEDIMENT” reclamation signal to locate the reclamation area. To extract the SEDIMENT, this study used K-means and visual check to reclassify the dataset into six classes. Based on the reclamation signal’s appearance time and disappearance time, this study calculated the frequency of three major classes: water, non-water, and SEDIMENT. Using the signal frequency analysis method, this study located the changes of SEDIMENT during the reclamation activities and tracked the reclamation start time and end time.
For the sea enclosing type of reclamation, this study used an “Eight-Neighborhood” morphological method to detect the water boundary [29,30]. Based on the morphological change of the water body in the study area, this study calculated the isolated water body during the reclamation activities to locates the sea enclosing type reclamation. By analyzing the successive water body change, the study tracked the reclamation end time of the sea enclosing reclamation. The steps of the reclamation period tracker are shown in Figure 2.

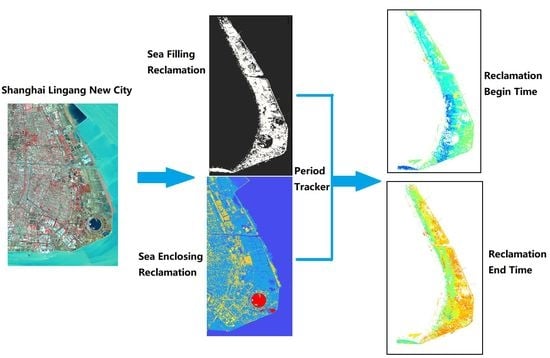
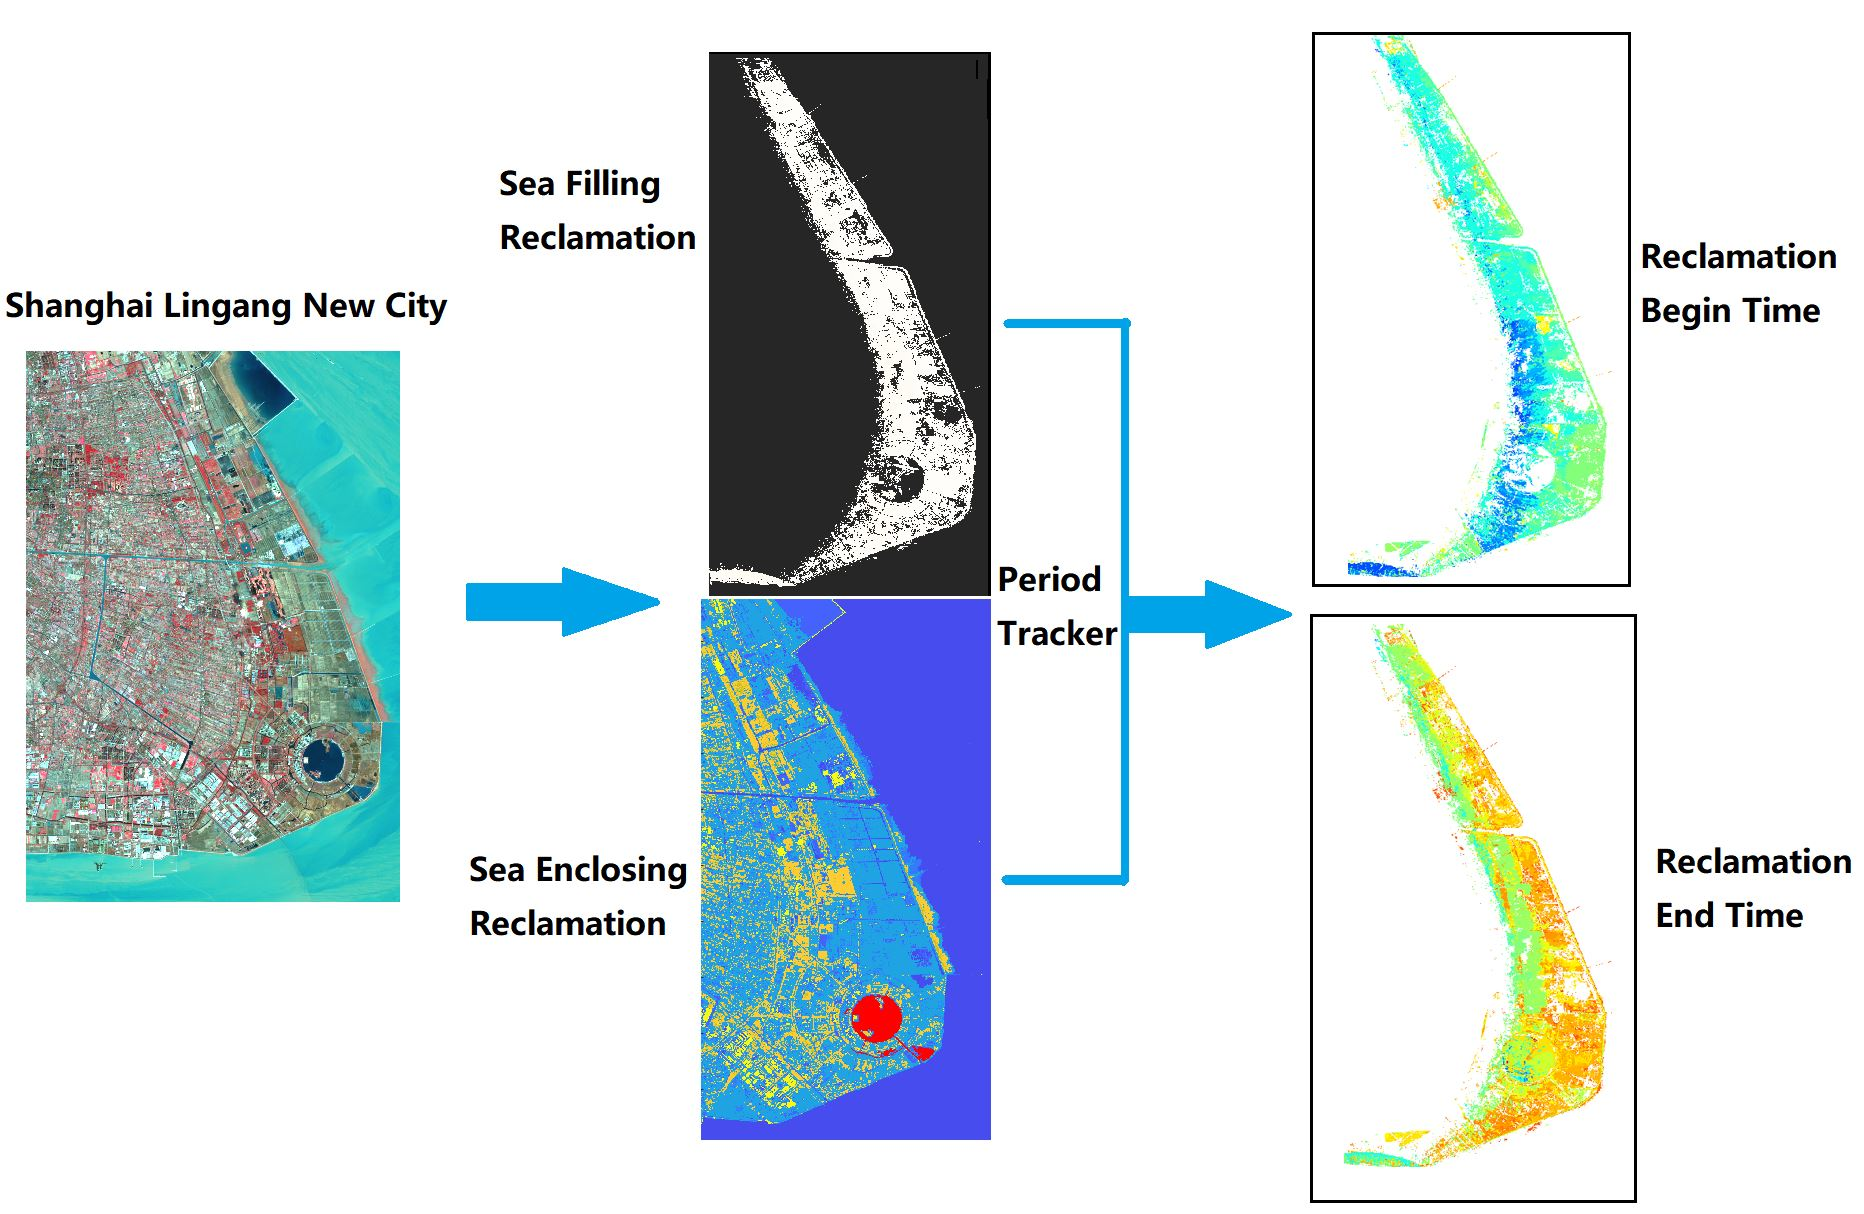
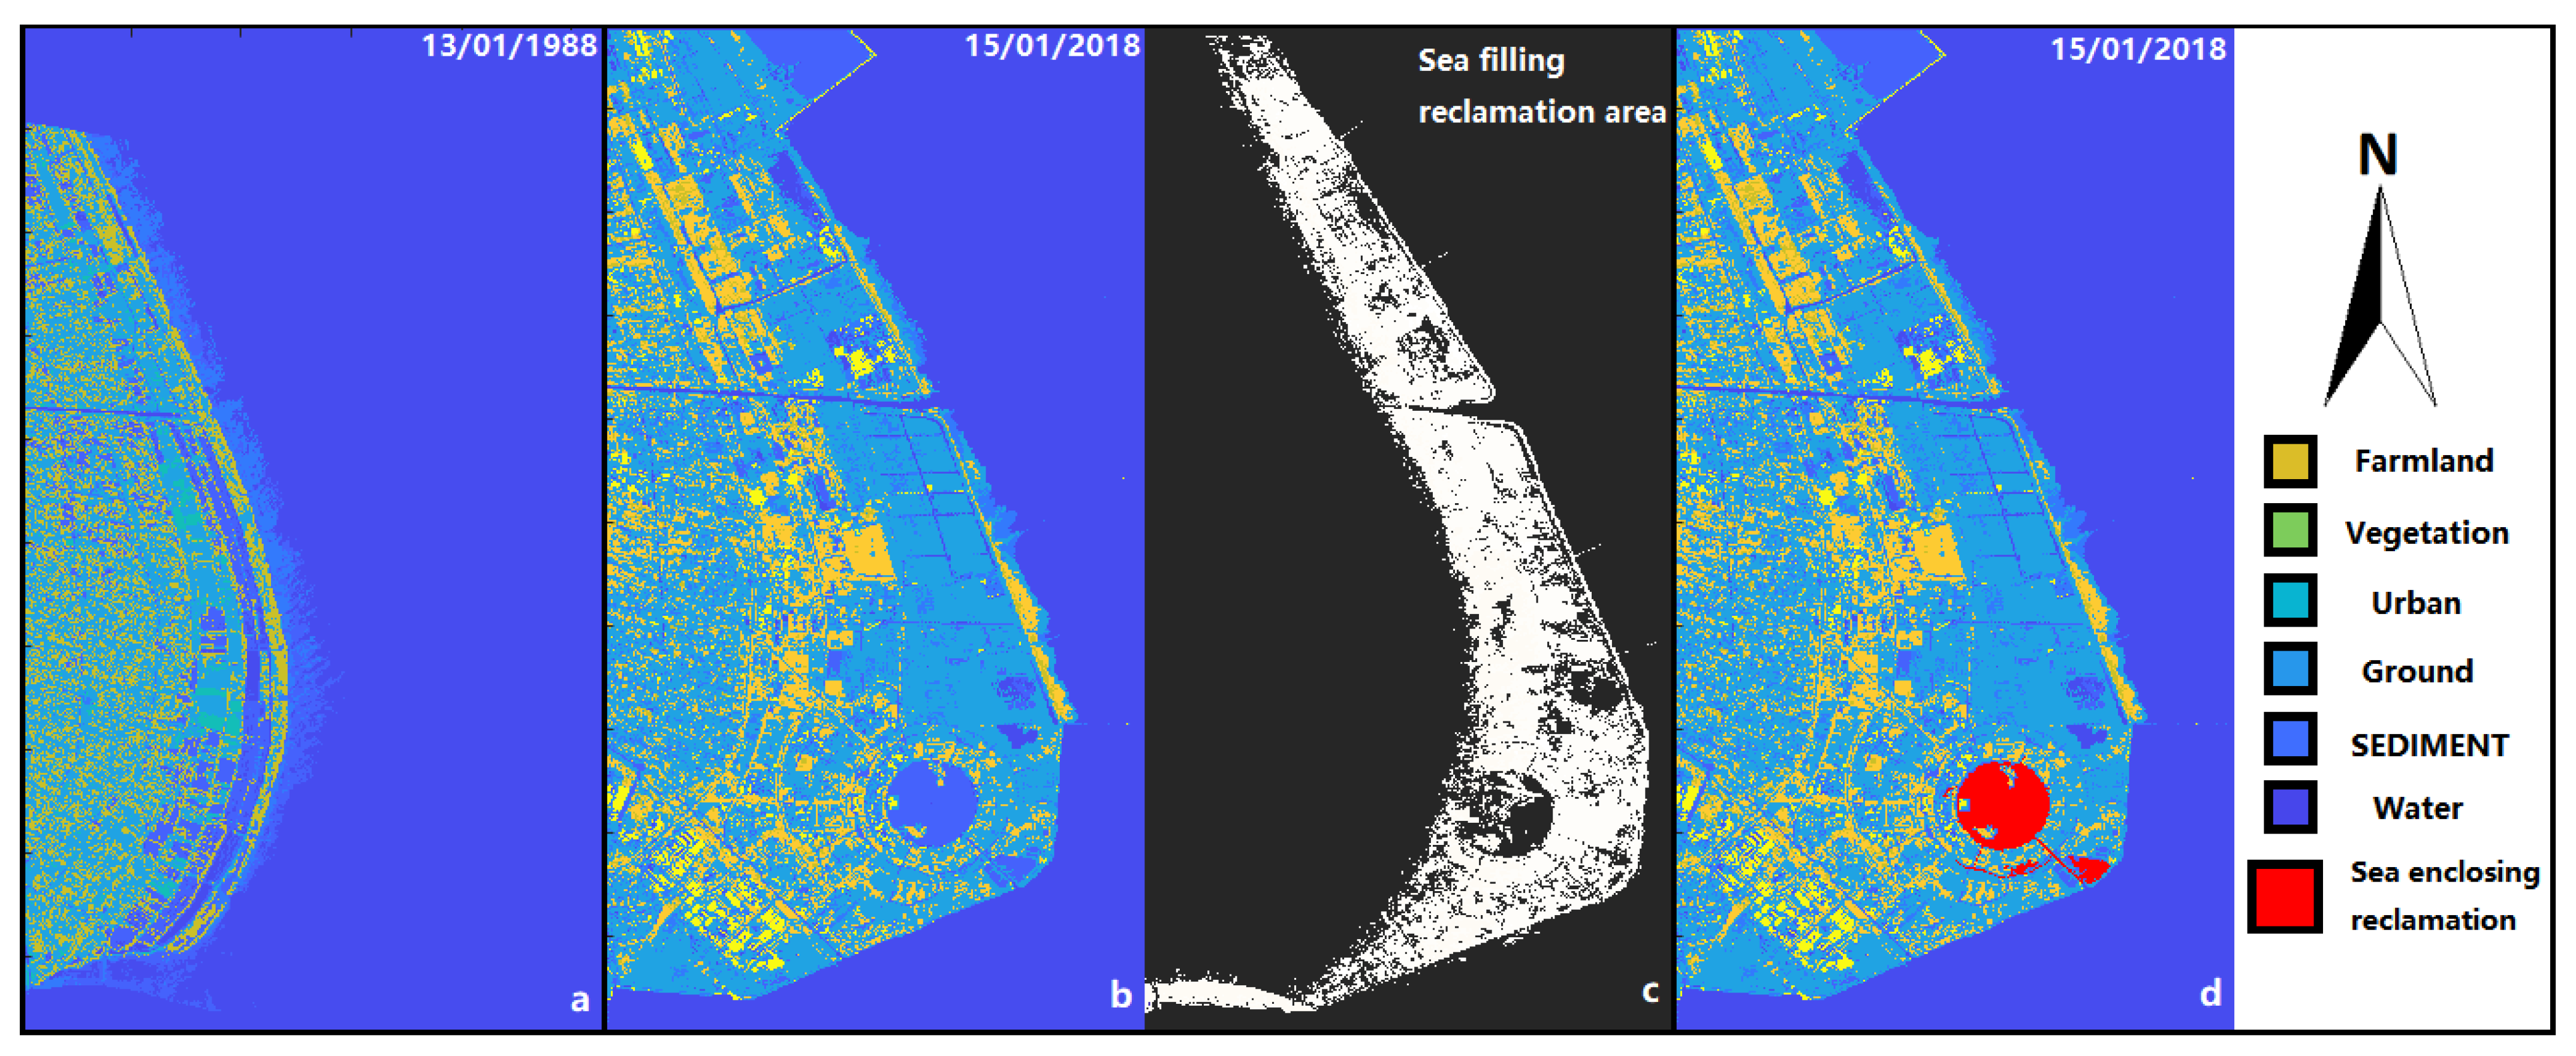
3.1. Reclamation Area Locator

To extract the reclamation signal, this study analyzed the land cover type change during the reclamation activities. For the sea filling reclamation, human activities fill the reclamation area with different material until the area is filled into the land. When the reclamation finishes, the land cover type of reclamation area changes from permanent water to other land cover types. During the reclamation activities, the land cover type changes constantly from water to land. This study names the intermediate form of land cover type between water and land as “SEDIMENT.” This study sets rules to distinguish the SEDIMENT land cover type:
  • The SEDIMENT area only appears at the coastline.
  • The land cover type of the SEDIMENT area changes between water and non-water frequently during the SEDIMENT signal appearance period.
To extract the SEDIMENT area, this study classified the Landsat observations. K-means clustering algorithm was used in the study. The K-means clustering algorithm is one of the basic, popular clustering techniques used in many data analysis studies [31,32]. The K-means algorithm aims to divide M points in N dimensions into K clusters to minimize the within-cluster sum of squares [33]. For further analysis of the reclamation area, the study classified the land cover type into six classes: Water, Vegetation, Urban Area, Ground, Farmland, and SEDIMENT. To obtain better classification results, K-means clustering algorithm was first used to classify the Landsat observations into triple the target classes—18 classes. After K-means classification, this study visually reclassified the 18 classes into the six final classes, including the reclamation signal SEDIMENT class. The SEDIMENT class is a new class named in this study. As the water class and non-water class are easy to distinguish in the K-means classification result, this study distinguished the SEDIMENT class based on the location and the reflective performance of the target pixel. If a pixel was located on the coastline and reflectance performance was between that for Water and Ground, this study distinguished this pixel as SEDIMENT class. The location of SEDIMENT class in the result was the reclamation area.
For the sea enclosing reclamation area, the signal of reclamation activities was different from that of the sea filling reclamation. As the processing of the sea enclosing reclamation, the land cover type did not change during the reclamation period, but the difference before and after the reclamation activities was whether the water area was still connected to the sea area. In this situation, this study used the “Eight-Neighborhood” morphological method [34]. For each classification result, this step extracted the Water class. For each Water region, this study detected the random Water boundary pixel and used the “Eight-Neighborhood” morphological method to traverse the “Eight-Neighborhood” of the pixel. When the next Water pixel was found, it marked the new Water pixel as the new traverse center and repeated the traverse until the next new Water pixel was the first selected Water pixel. All the marked Water pixels then defined the boundary of this Water region. With the boundary of all the Water regions of the classification result, this study located the sea enclosing reclamation area by comparing the Water region boundary between two target observations. The process of this kind of reclamation follows:
  • Two target classification results were selected based on the reclamation detection period requirement.
  • The Water class of the classification result in the later image was selected, and the “Eight-Neighborhood” morphological method was used to designate the largest water body in the previous image.
  • Two selected water area maps were stacked together. The isolated water area from a later observation in the stacked area was the sea enclosing reclamation area.
By these processes, the sea enclosing reclamation area can be located, and the reclamation end time can be tracked. Given that the sea enclosing reclamation area is rare in Chinese reclamation project and only one case of inland lake is noted, Shanghai Lingang New City was the sea enclosing reclamation area used in this study. This area is set as the special case, and the previous “Eight-Neighborhood” morphological method can locate the reclamation area and track the end time of the reclamation period. For the start time, defining what is the beginning of sea enclosing reclamation was difficult, as the signal could not be displayed in the optical observations used in this study. Thus, the start of sea enclosing reclamation is not tracked and discussed here.

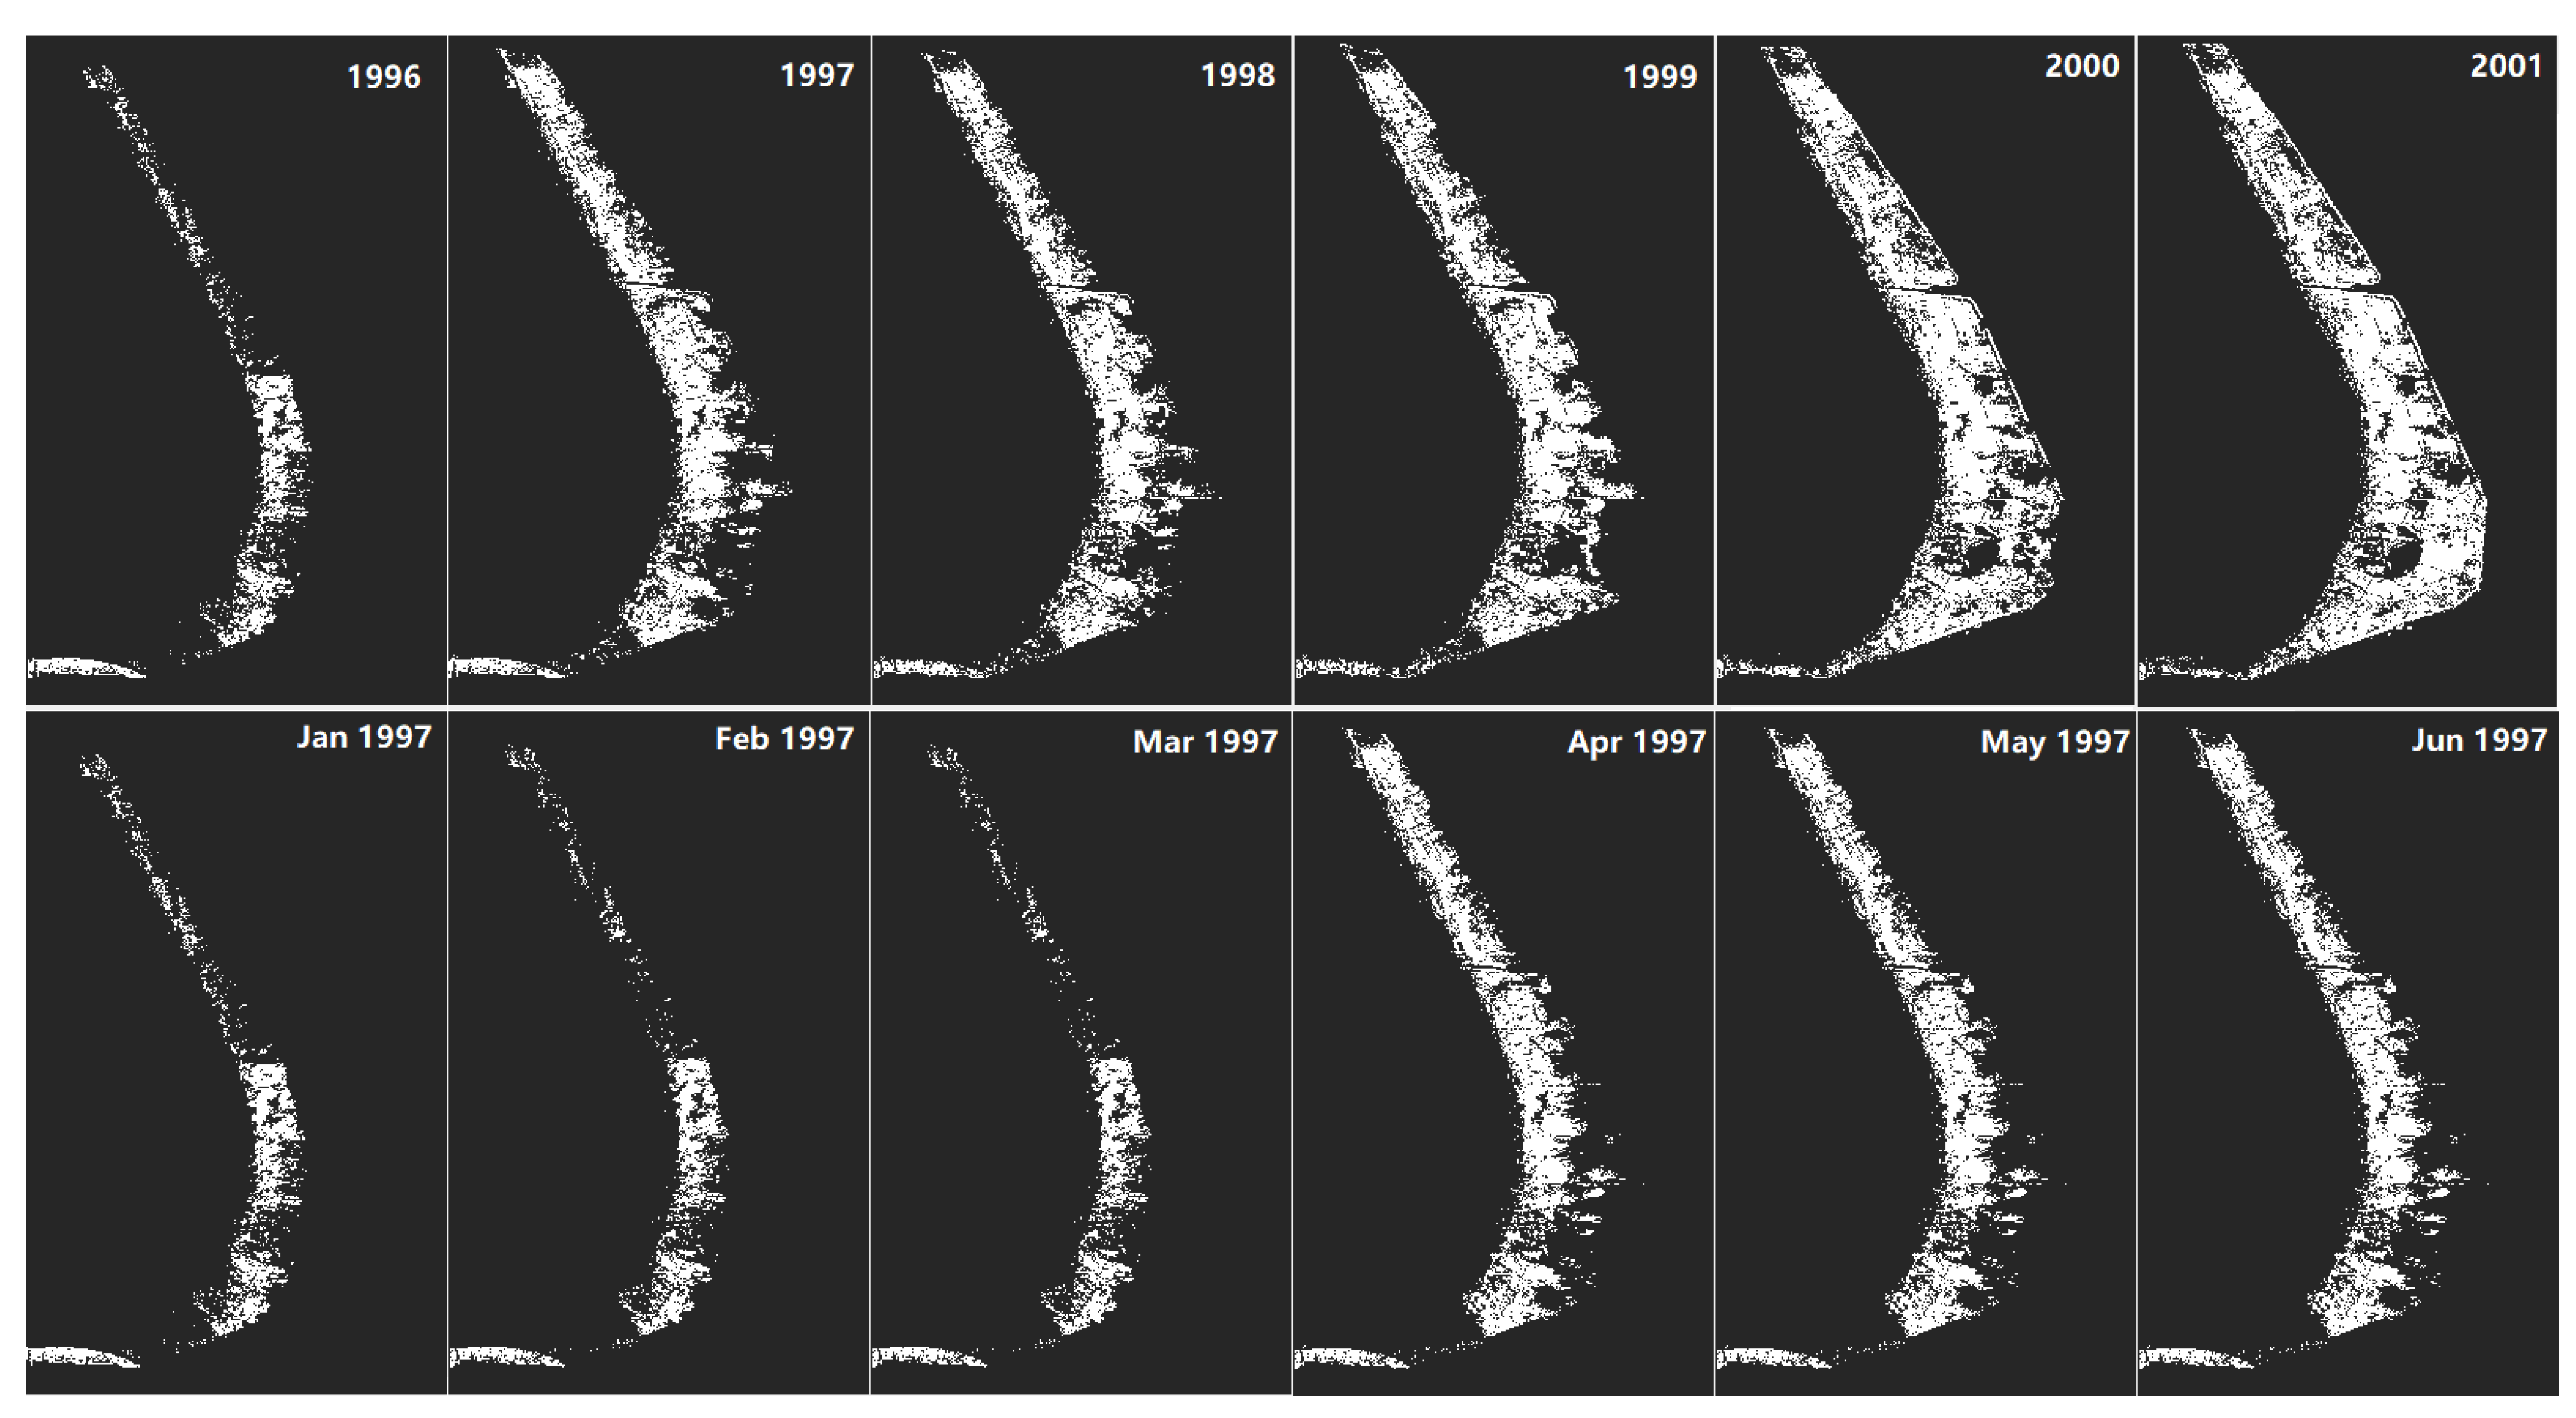
3.2. Reclamation Period Tracker

In the previous section, this study located the reclamation area of the sea filling reclamation by extraction of the reclamation signal. In this section, the study used the frequency tracker to track the reclamation signal and track the reclamation period including the reclamation start time and end time. Before the period tracker was built, all the classification results were stacked together. Each pixel had 108 classification results in 30 years. To calculate the frequency of the reclamation signal, in this step, the classification result from the six previous classes was divided into three classes: Water, SEDIMENT, and Non-water. For a typical example, when the reclamation begins, the land cover of the reclamation pixel changes from permanent Water into SEDIMENT/Non-water, and in the reclamation period, the land cover changes between Water, SEDIMENT, and Non-water. When the reclamation ends, the land cover of this pixel changes from Water/SEDIMENT into permanent Non-water. Based on this land cover change behavior, this study switched the 108 classification results into frequency of Water, SEDIMENT, and Non-water. For each pixel of the dataset, beginning from the first date, we calculated the frequency of Water, SEDIMENT, and Non-water between first date and next nine dates. The frequency of the three different classes were recorded on this date. For the next date of this pixel, the calculation was repeated. After the traverse of 108 classification results, the dataset switched to the 98 frequency values of the three classes on this pixel. The 108 classification results for each pixel were switched to 98 frequency values of three classes.
After the frequency value calculation, the reclamation period tracker was built based on the frequency value change. The signal indicating the beginning of reclamation activities was the water frequency decreasing from permanent Water and the frequency of SEDIMENT increasing. The signal of reclamation ending was the frequency of SEDIMENT decreasing and the frequency of Non-water increasing until permanent Non-water. By this feature, this study defines the frequency change for the reclamation period:
  • The frequency of Water does not change before the reclamation period.
  • The frequency of Non-water does not change after the reclamation period.
  • The frequency of SEDIMENT increases at the beginning of reclamation and decreases at the end of the reclamation.
By these rules, this study set up a window to traverse the 98 frequency value results of the three classes. When the window matched the rules, window size and window location were recorded. After finishing the traversal of the first window, window size was increased and traversed again. When window size was equal to the largest frequency length, the loop ended. The window size was the reclamation period length of the pixel, and the window location was the reclamation start time of the pixel. The reclamation period is therefore tracked.

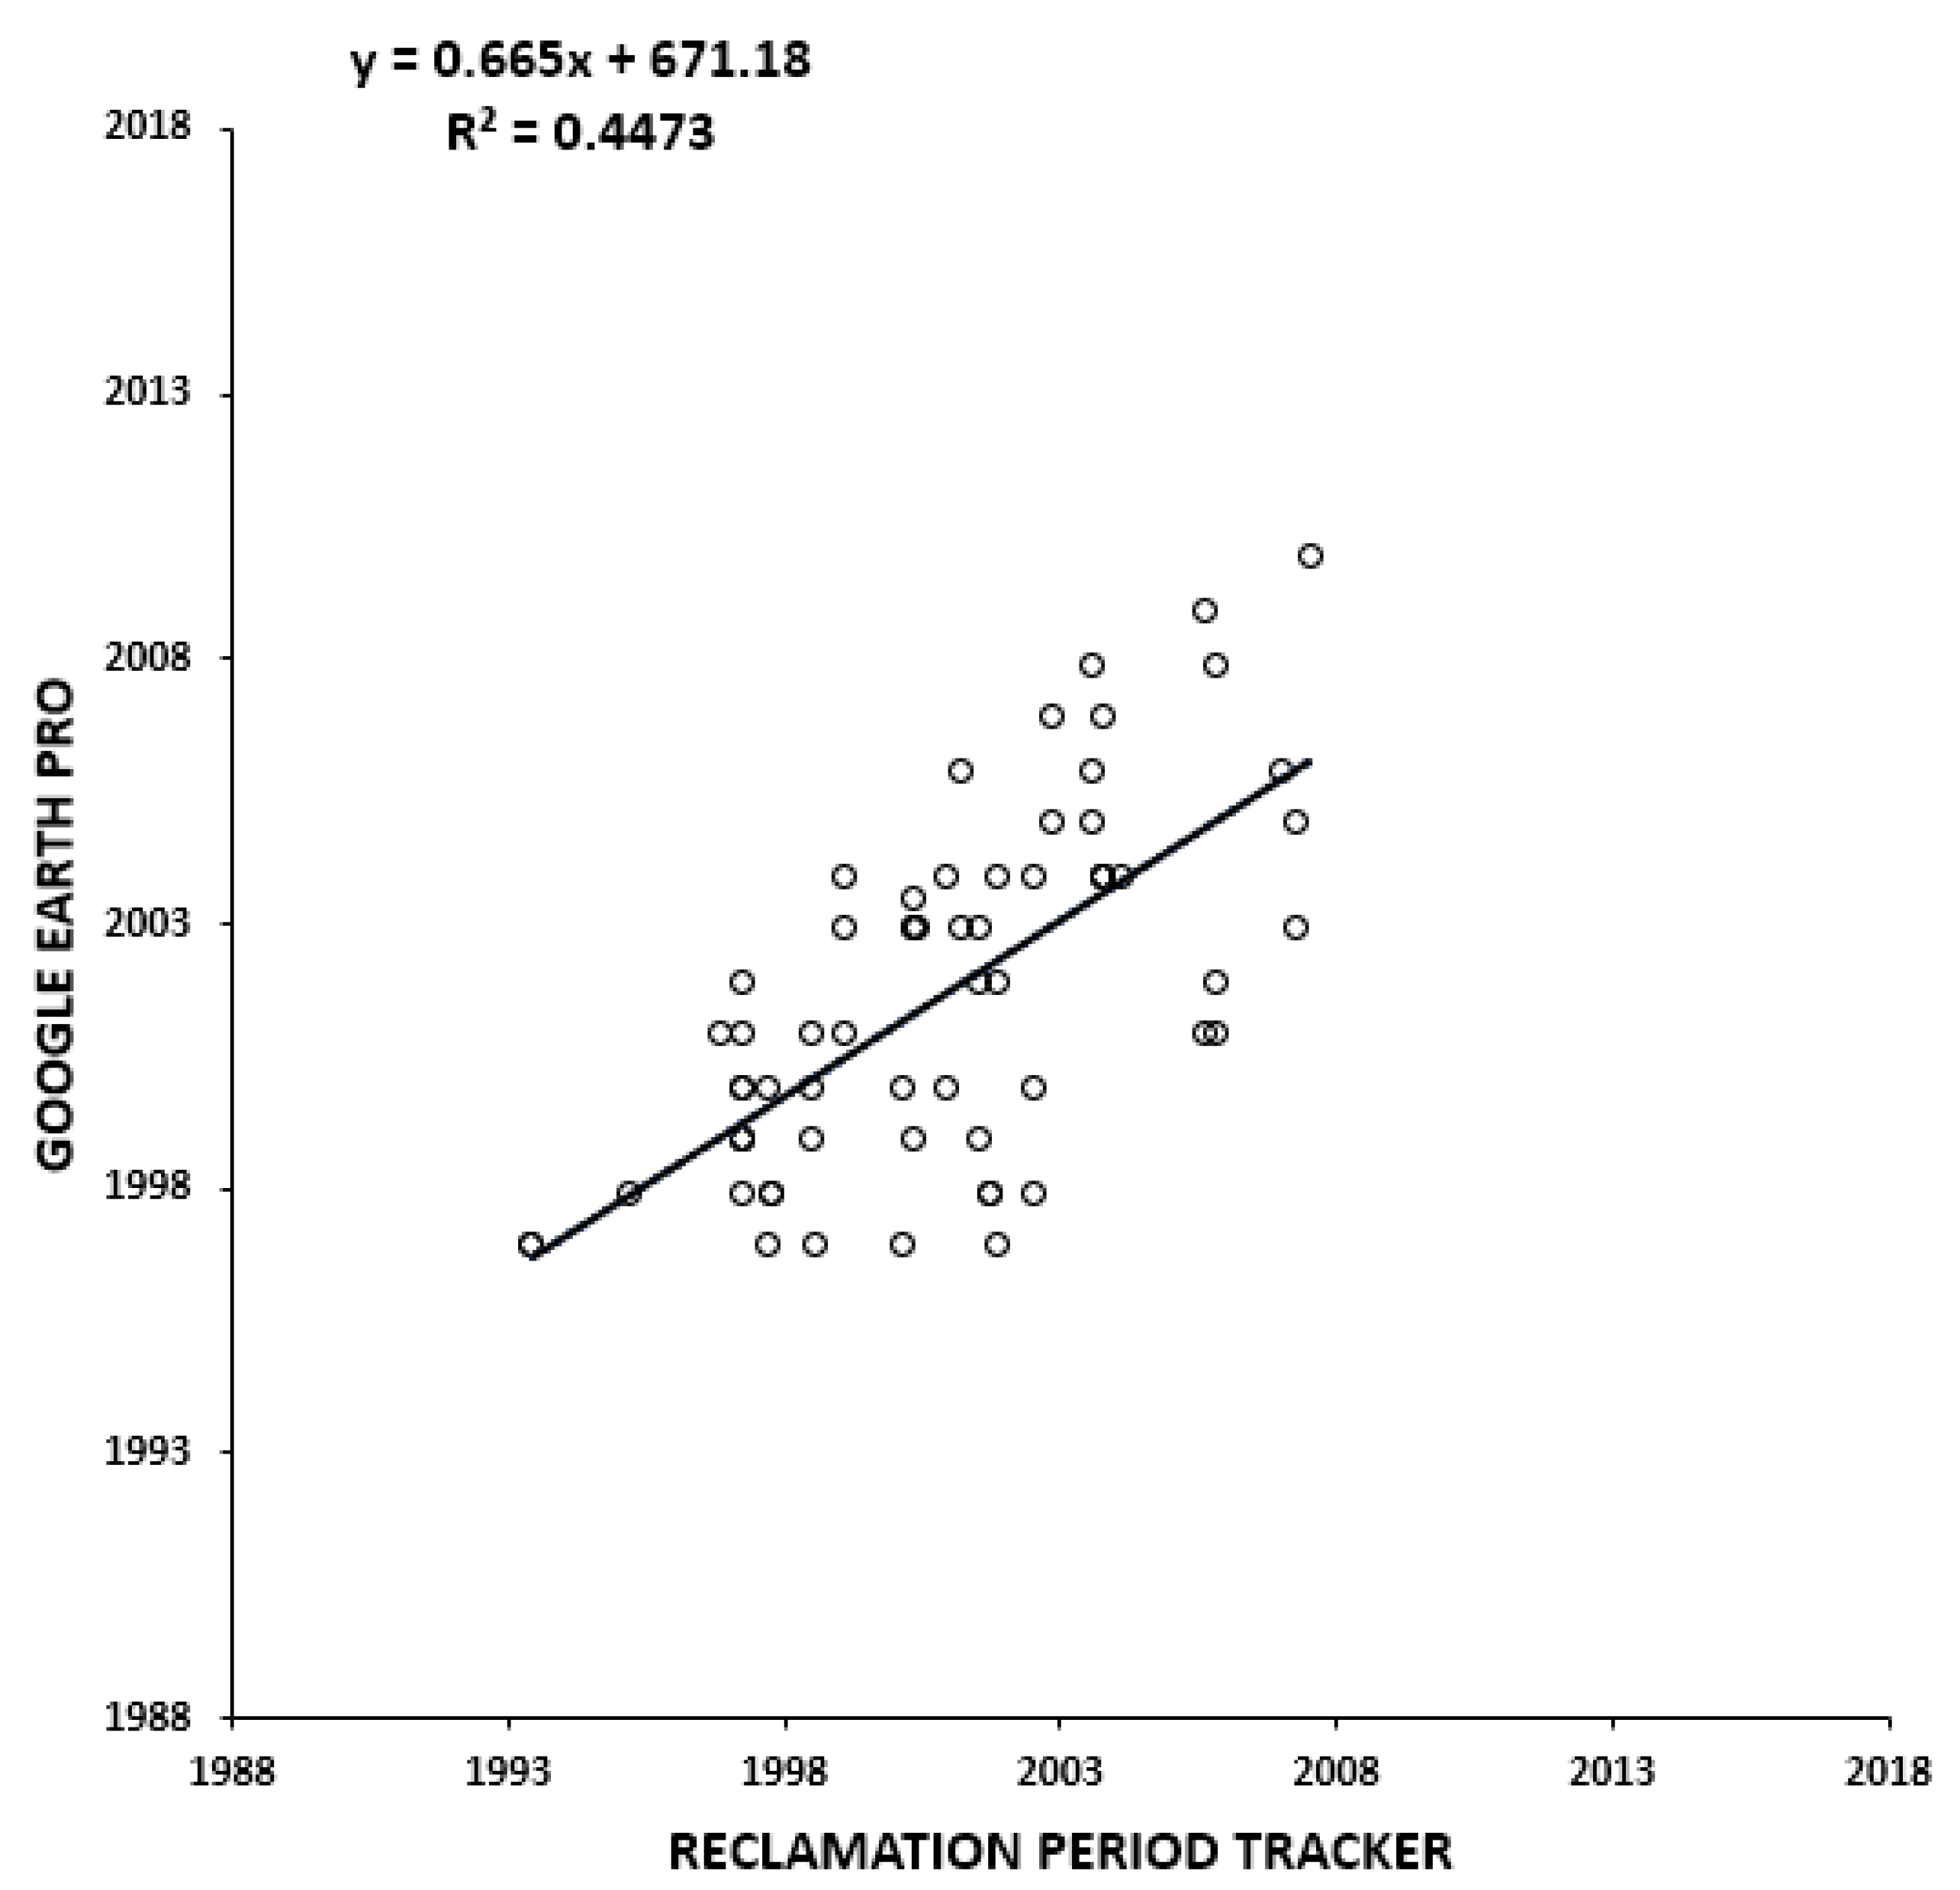
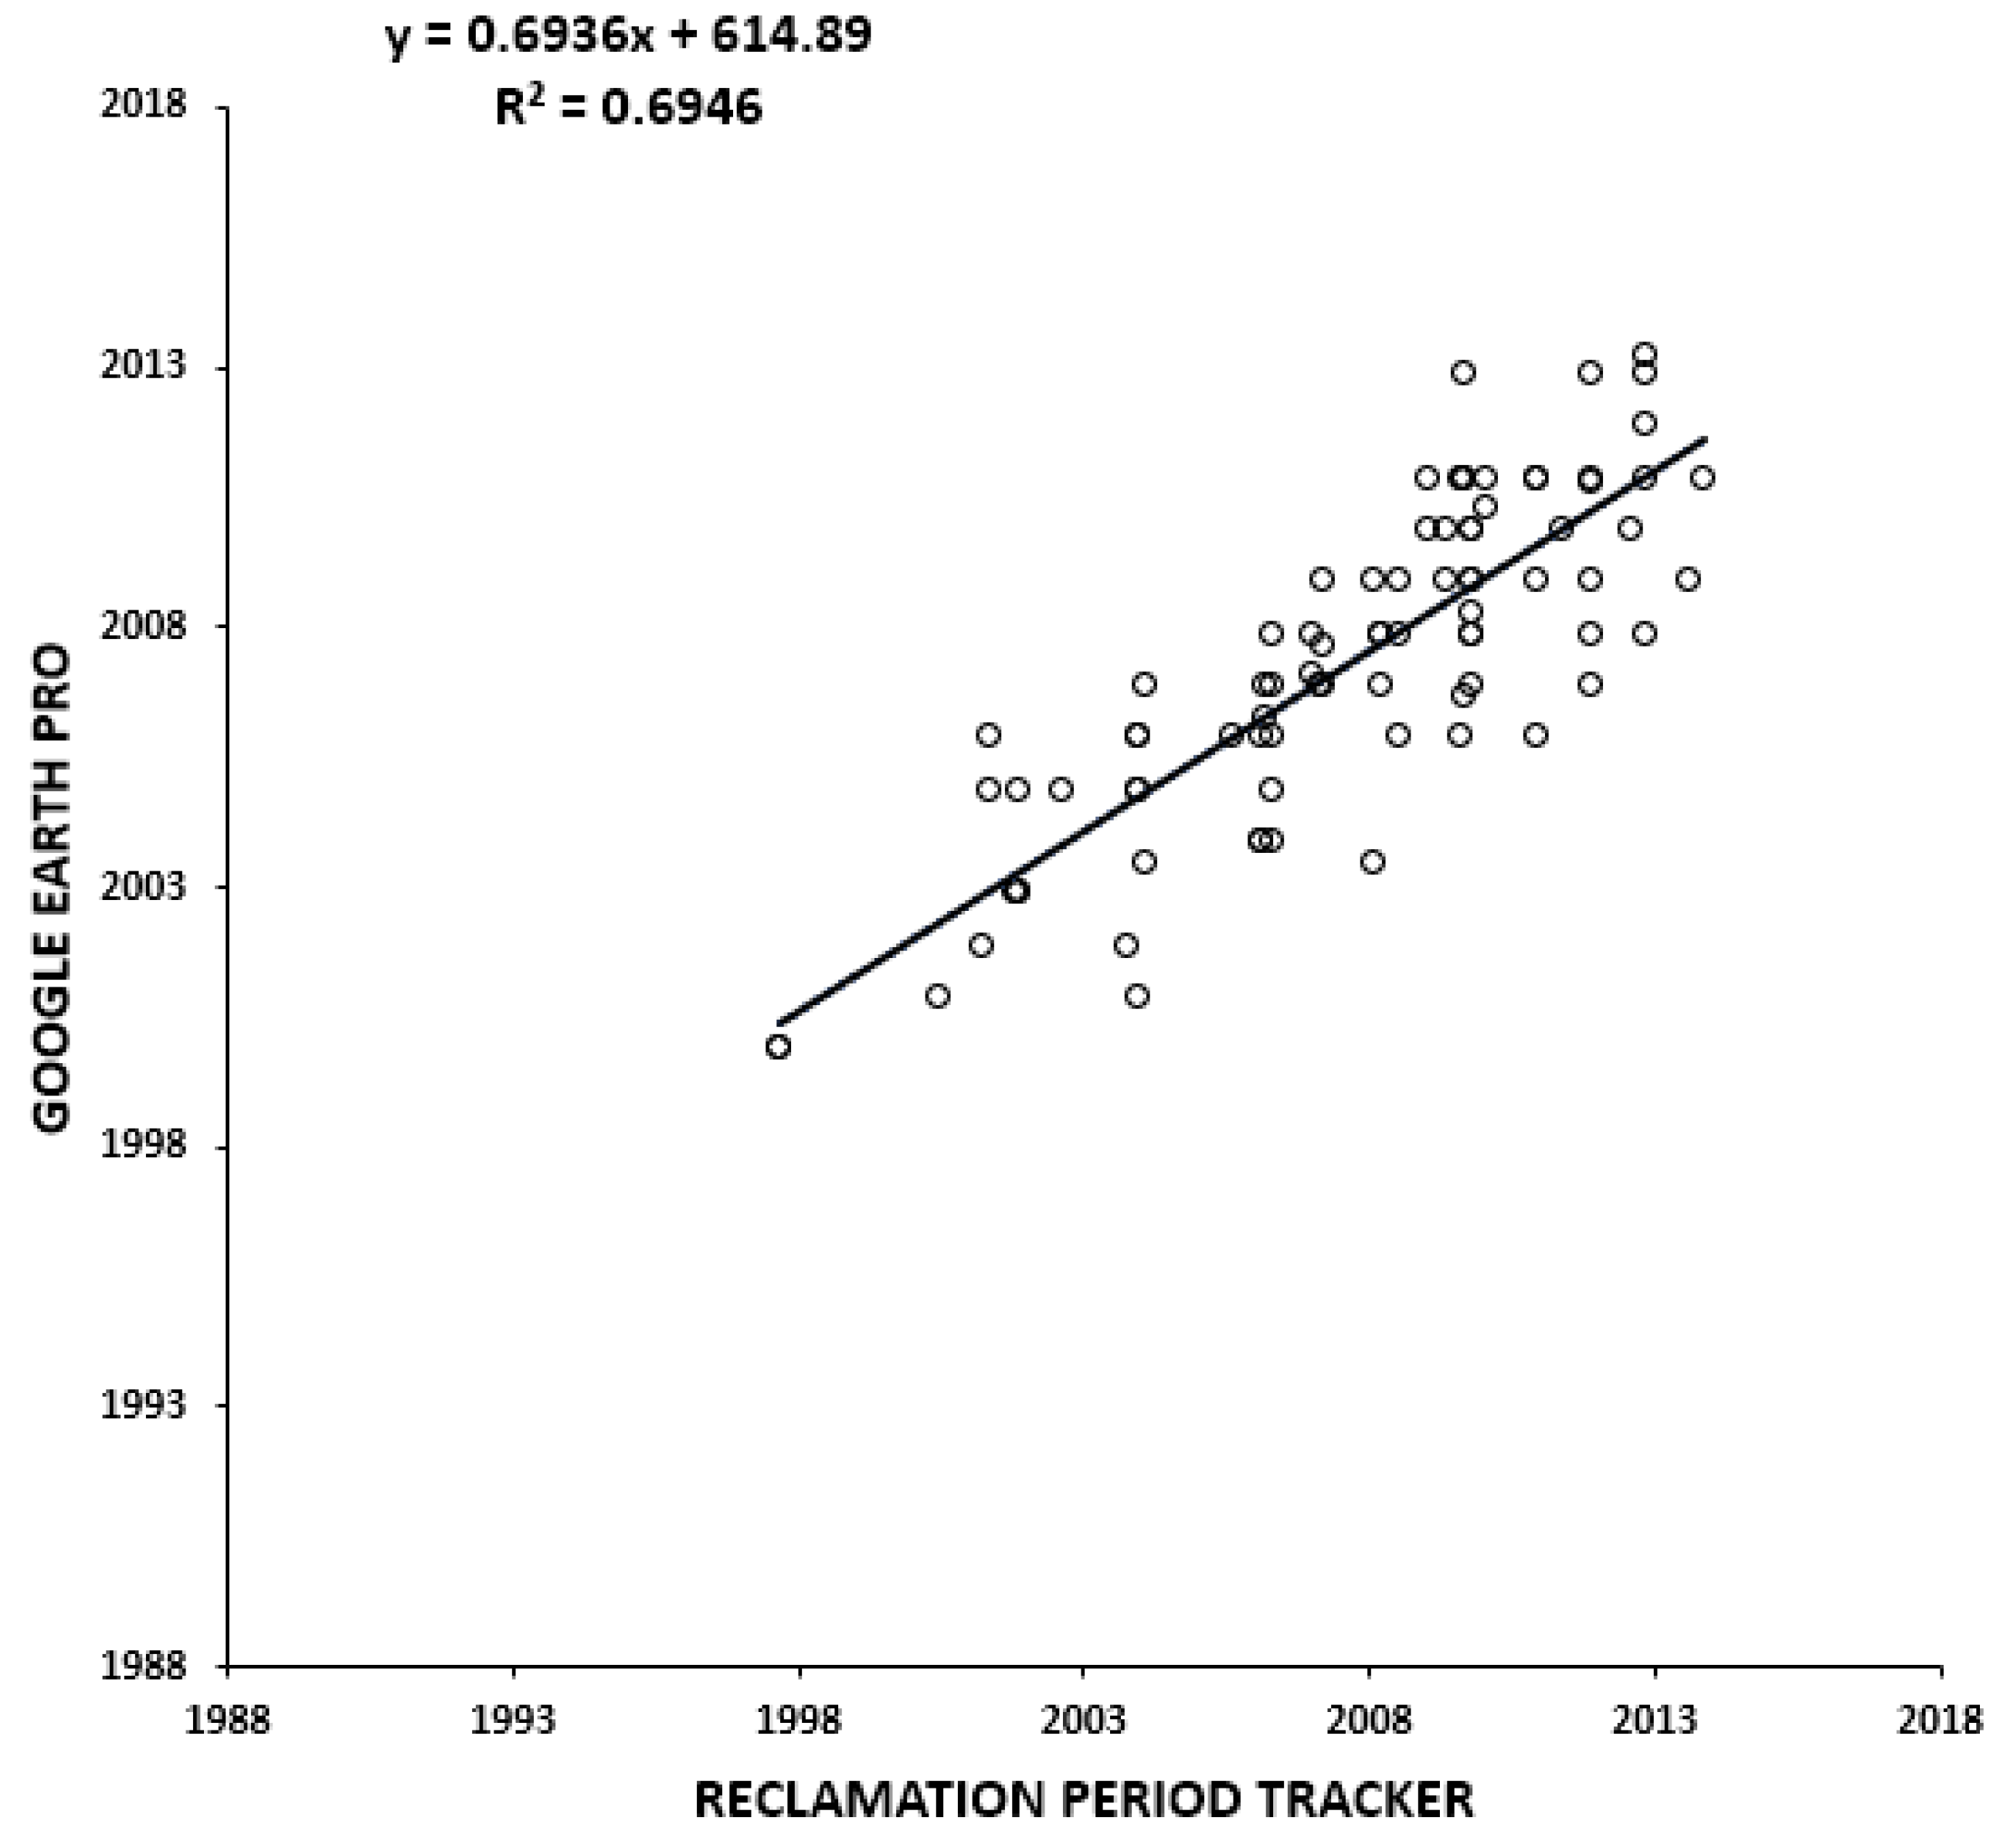
3.3. Reclamation Tracker Validation

For the reclamation locator validation, this study selected two results of frequency calculation which have available historical datasets on Google Earth Pro. This study compared the Google Earth Pro historical datasets and the located reclamation area to validate the assessment of the reclamation locator. In each result, 120 random pixels were selected to validate the accuracy of the classification result. Because the Google Earth historical data show true color imagery, the reclamation area was hard to distinguish visually. This study used the Shanghai Lingang New City reclamation area for this validation.
The previous method was built based on the case of Shanghai Lingang New City reclamation area. For the validation of the method at a large scale, this study used the Hangzhou Bay area to test the robustness and the generalization ability of the method. Google Earth dataset was used in validation. This study defined a new class named SEDIMENT, and this class cannot be read clearly using Google Earth. Hence, in the validation, only pixels in the five classes besides the SEDIMENT class were selected for validation. For the classification result, 100 random pixels of the latest classification result image were selected to assess the classification accuracy. The same pixel was located on Google Earth Pro, and the real land cover type and the results were visually checked. The validation results were indicated by the confusion matrix of five classes. For the reclamation tracker validation, after the method test run on Hangzhou Bay, this study randomly selected 100 pixels on the reclamation result to validate the method. This study calculated the time gap between the reclamation result and the Google Earth dataset to validate the reclamation period because the Google Earth dataset provided on average one image per year of historical data, and the reclamation period of this study provided monthly or daily results. The reclamation start year and end year in Google Earth were visually checked, and the time gap between the start time and end time in the reclamation tracker result was calculated. Given that Google Earth provides historical true-color images, if reclamation occurs, the land cover of the area evidently changed from water at the start to non-water at the end. For the reclamation period, if the reclamation activities were progressing, the area changed in the Google Earth historical images, and the reclamation period could be identified. The validation result was expressed as the month gap of start time and end time. Two scatter diagrams for the reclamation start time and the reclamation end time, including regression curves, were drawn, and the correlation coefficients were calculated.

4. Results

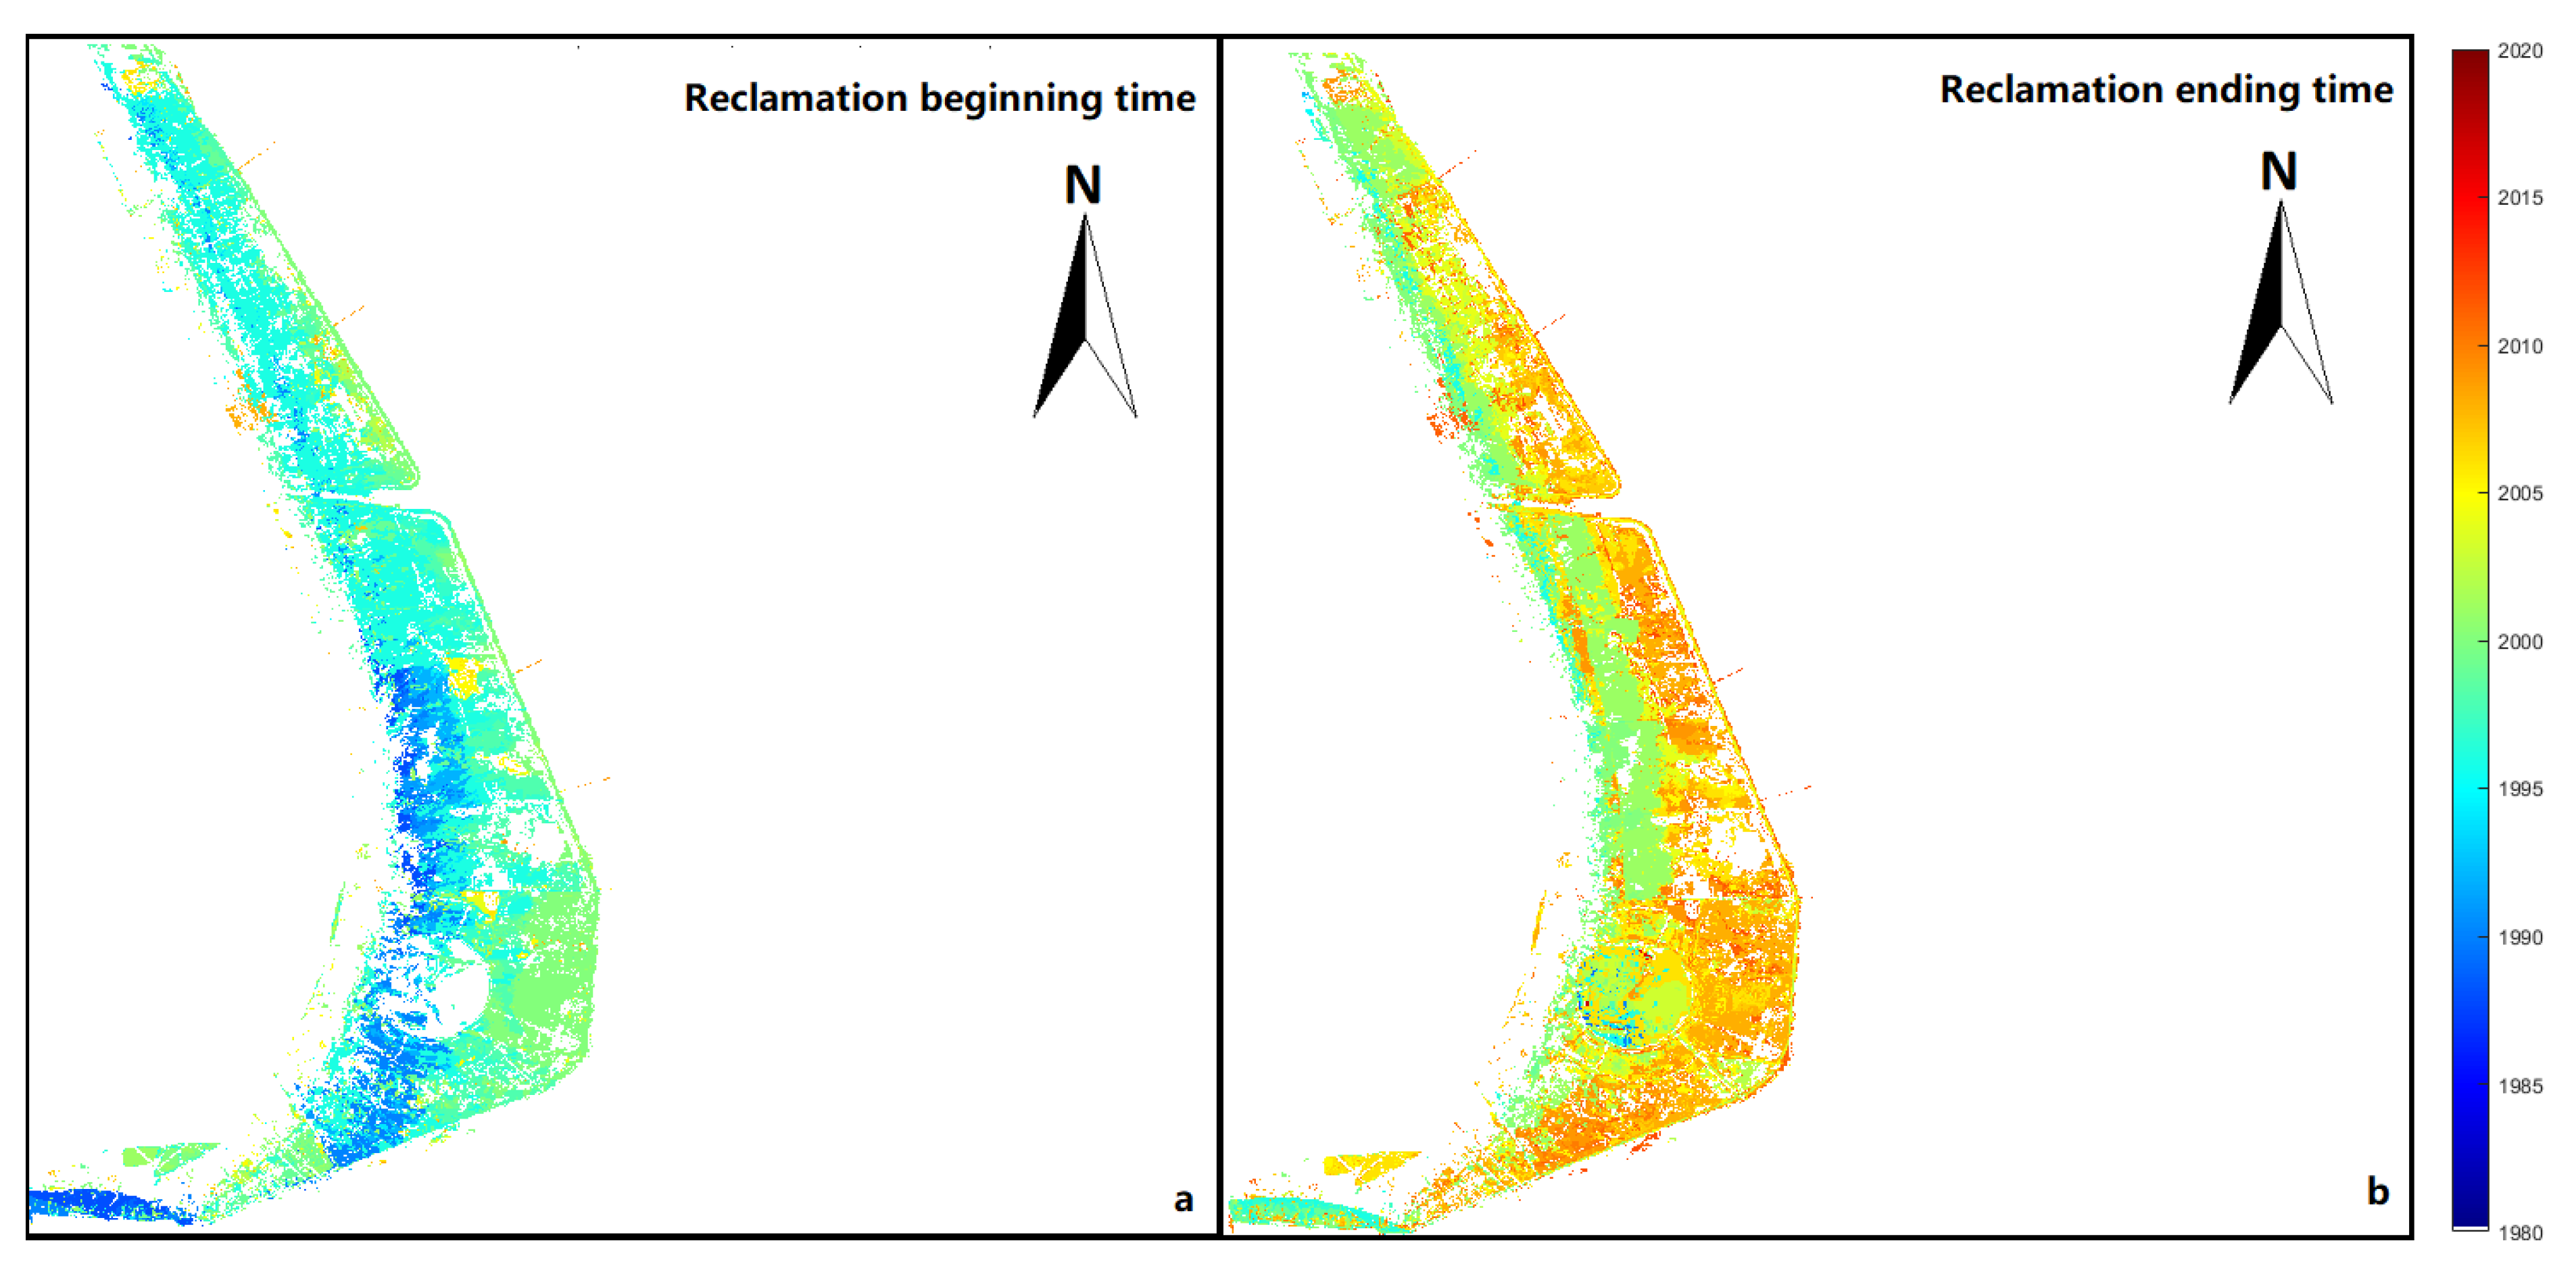
4.1. Reclamation Map of Shanghai Lingang New City

The reclamation area indicates the area where the reclamation project occurred. By comparing the classification results of 1988 and 2018, it can be seen that the land area has a large extent filled in the sea area. Figure 3c appropriately locates all the sea filling reclamation area. Between 1988 and 2018, an inland lake appeared. Although the land cover type of the inland lake area is still water, the reclamation area also detects the sea enclosing reclamation area by using the “Eight-Neighborhood” morphological method shown in Figure 3d. Figure 3 indicates that the two types of reclamation area are located appropriately.

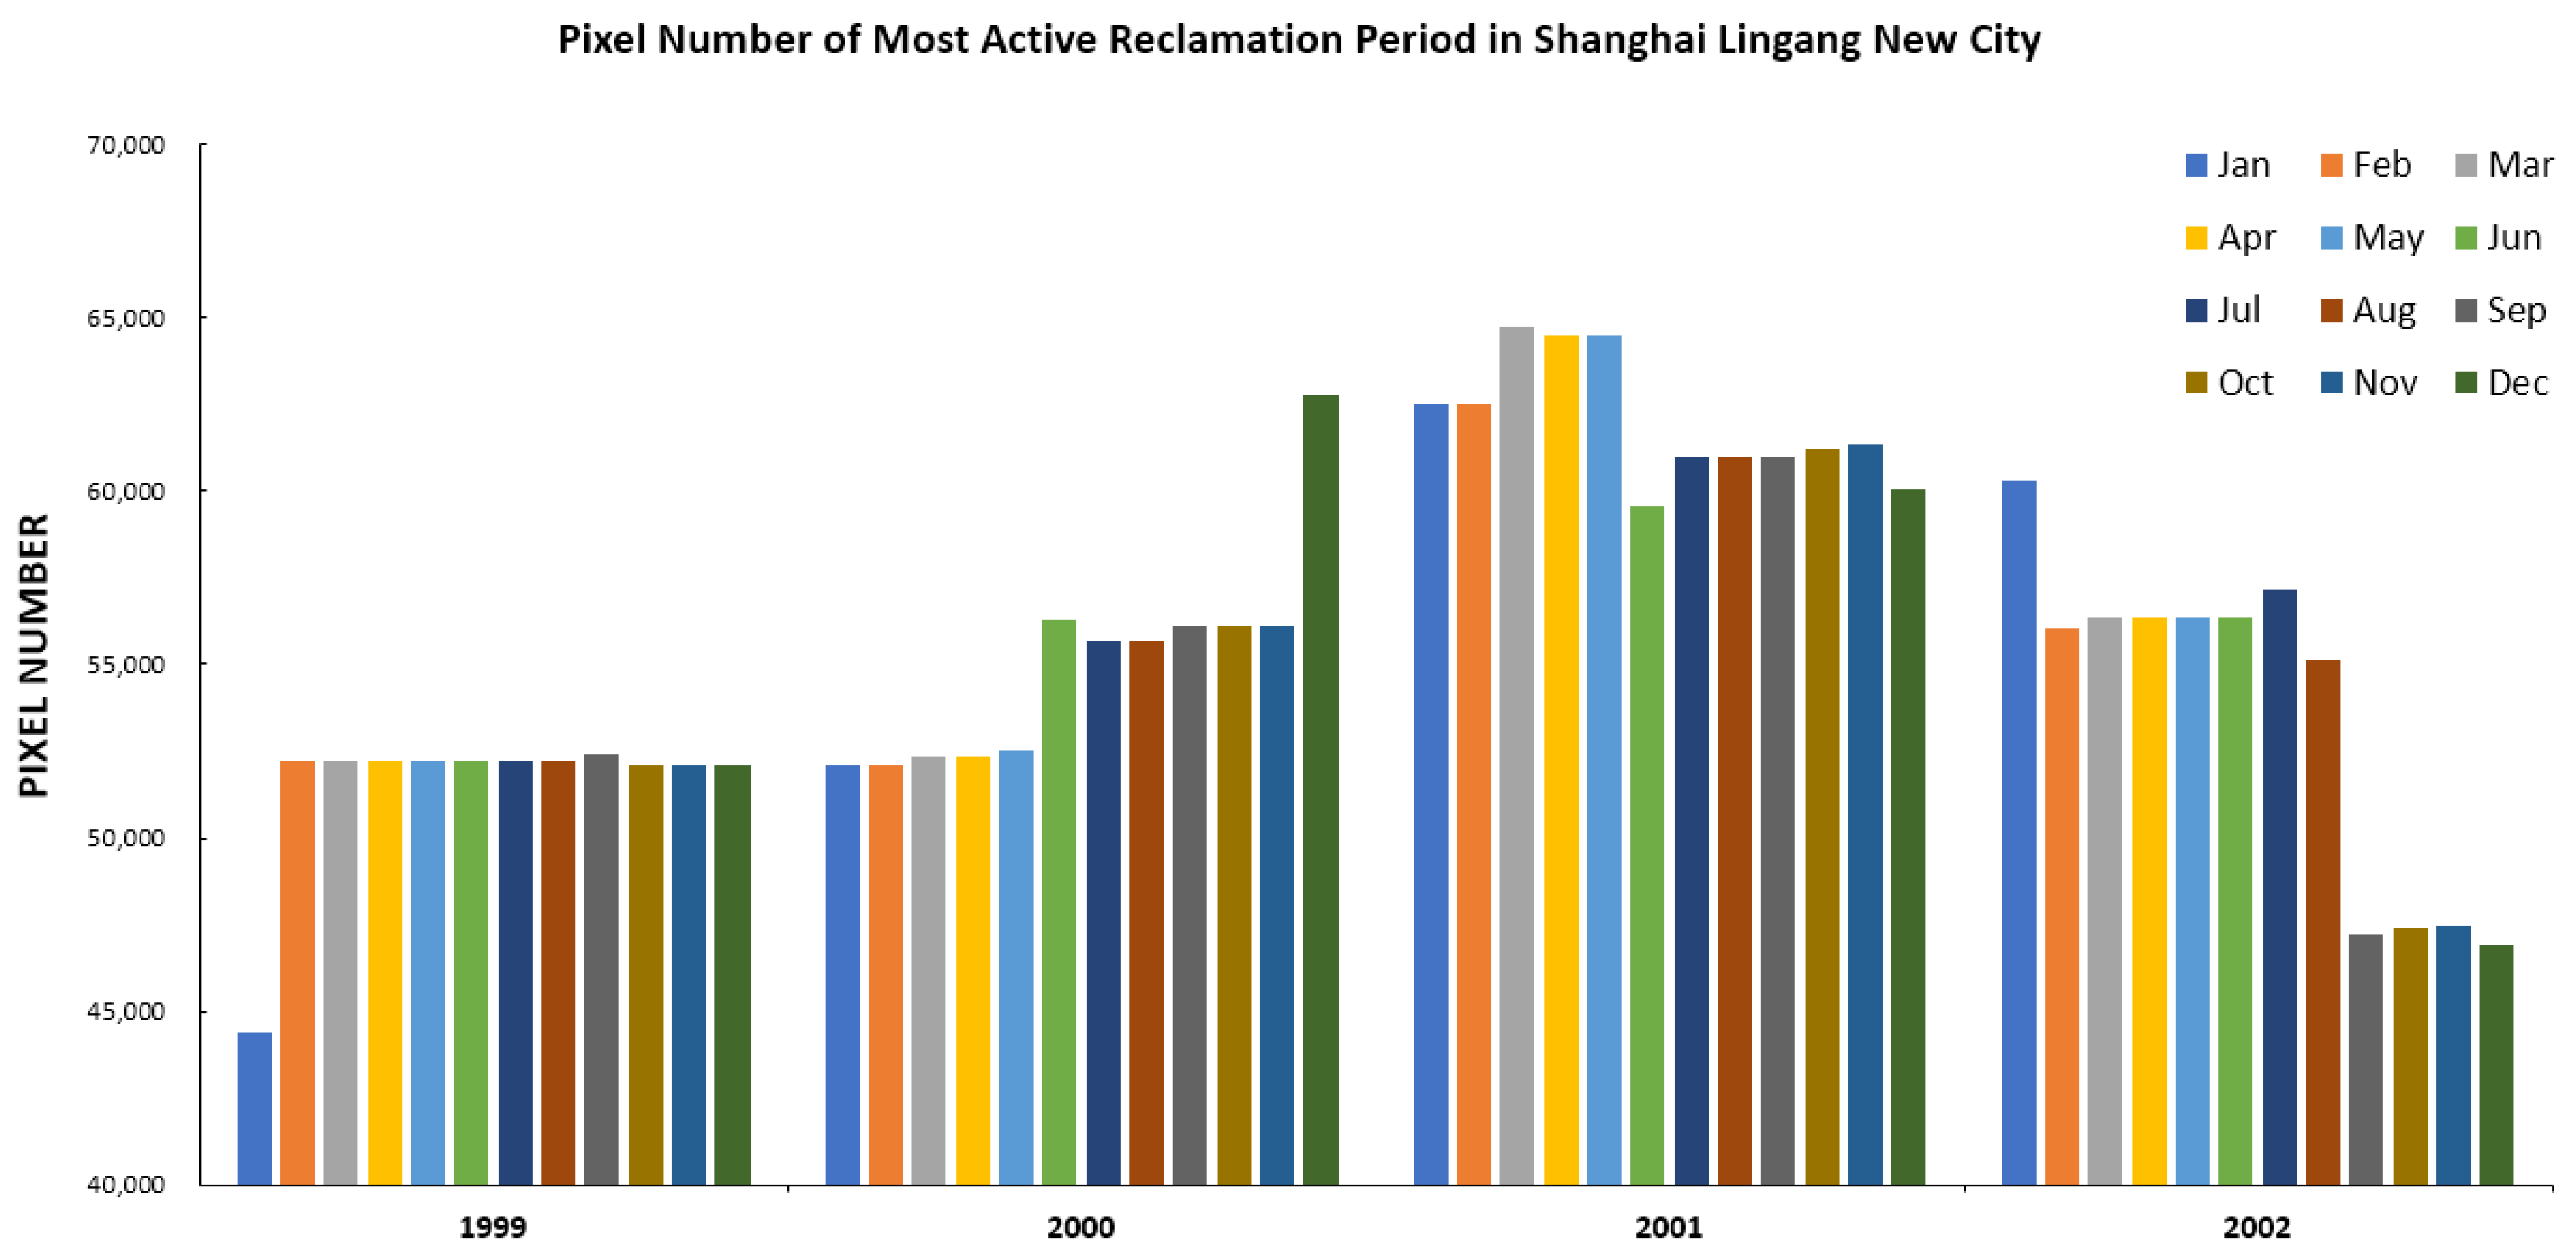
4.2. Reclamation Tracker Result of Shanghai Lingang New City

Figure 4 shows the reclamation activities map on selected months and years. The first row of Figure 4 indicates that from 1996 to 2001, the reclamation activities become more and more active each year. Among them, a big change occurred between 1996 and 1997. However, the information is lacking to determine how and when the reclamation area changed between 1996 and 1997. This study provides the monthly reclamation results shown in the second row. The second row of Figure 4 shows the monthly reclamation area change between January and June of 2017. The second row of Figure 4 indicates that there was no big change from January to March and April to June. However, the big change of the reclamation area occurred between March and April of 1997. The result shows the necessity of monthly monitoring of the reclamation area.
Figure 5 shows the most active reclamation period in this study. The monthly results indicate that the start from December 2000 and end of May 2001 have the most active reclamation pixels, which means in several months, the reclamation activities of the study area had the fastest progress. In addition, the active reclamation area is the biggest overall reclamation project this month. After 2001, the reclamation activities slow down and there is a significant drop between August and September 2002. Figure 4 and Figure 5 can provide information to support the analysis of reclamation activities.
Figure 6 shows the reclamation period of the study area. Given that the start time of sea enclosing type reclamation cannot be tracked, the missing inland lake area in Figure 6a,b successfully tracks all the reclamation area in this study area. Comparison of the two maps shows that the reclamation area started around 1995 and ended around 2008; the reclamation activities started from the west of the map and spread to the east. The two reclamation maps clearly indicate the reclamation trend in the study area. The Shanghai Lingang New City area reclamation project progressed quickly after 2003. The reclamation project extended the land into the southeast-most part and formed an inland lake around 2005. Most reclamation activities ended around 2008.

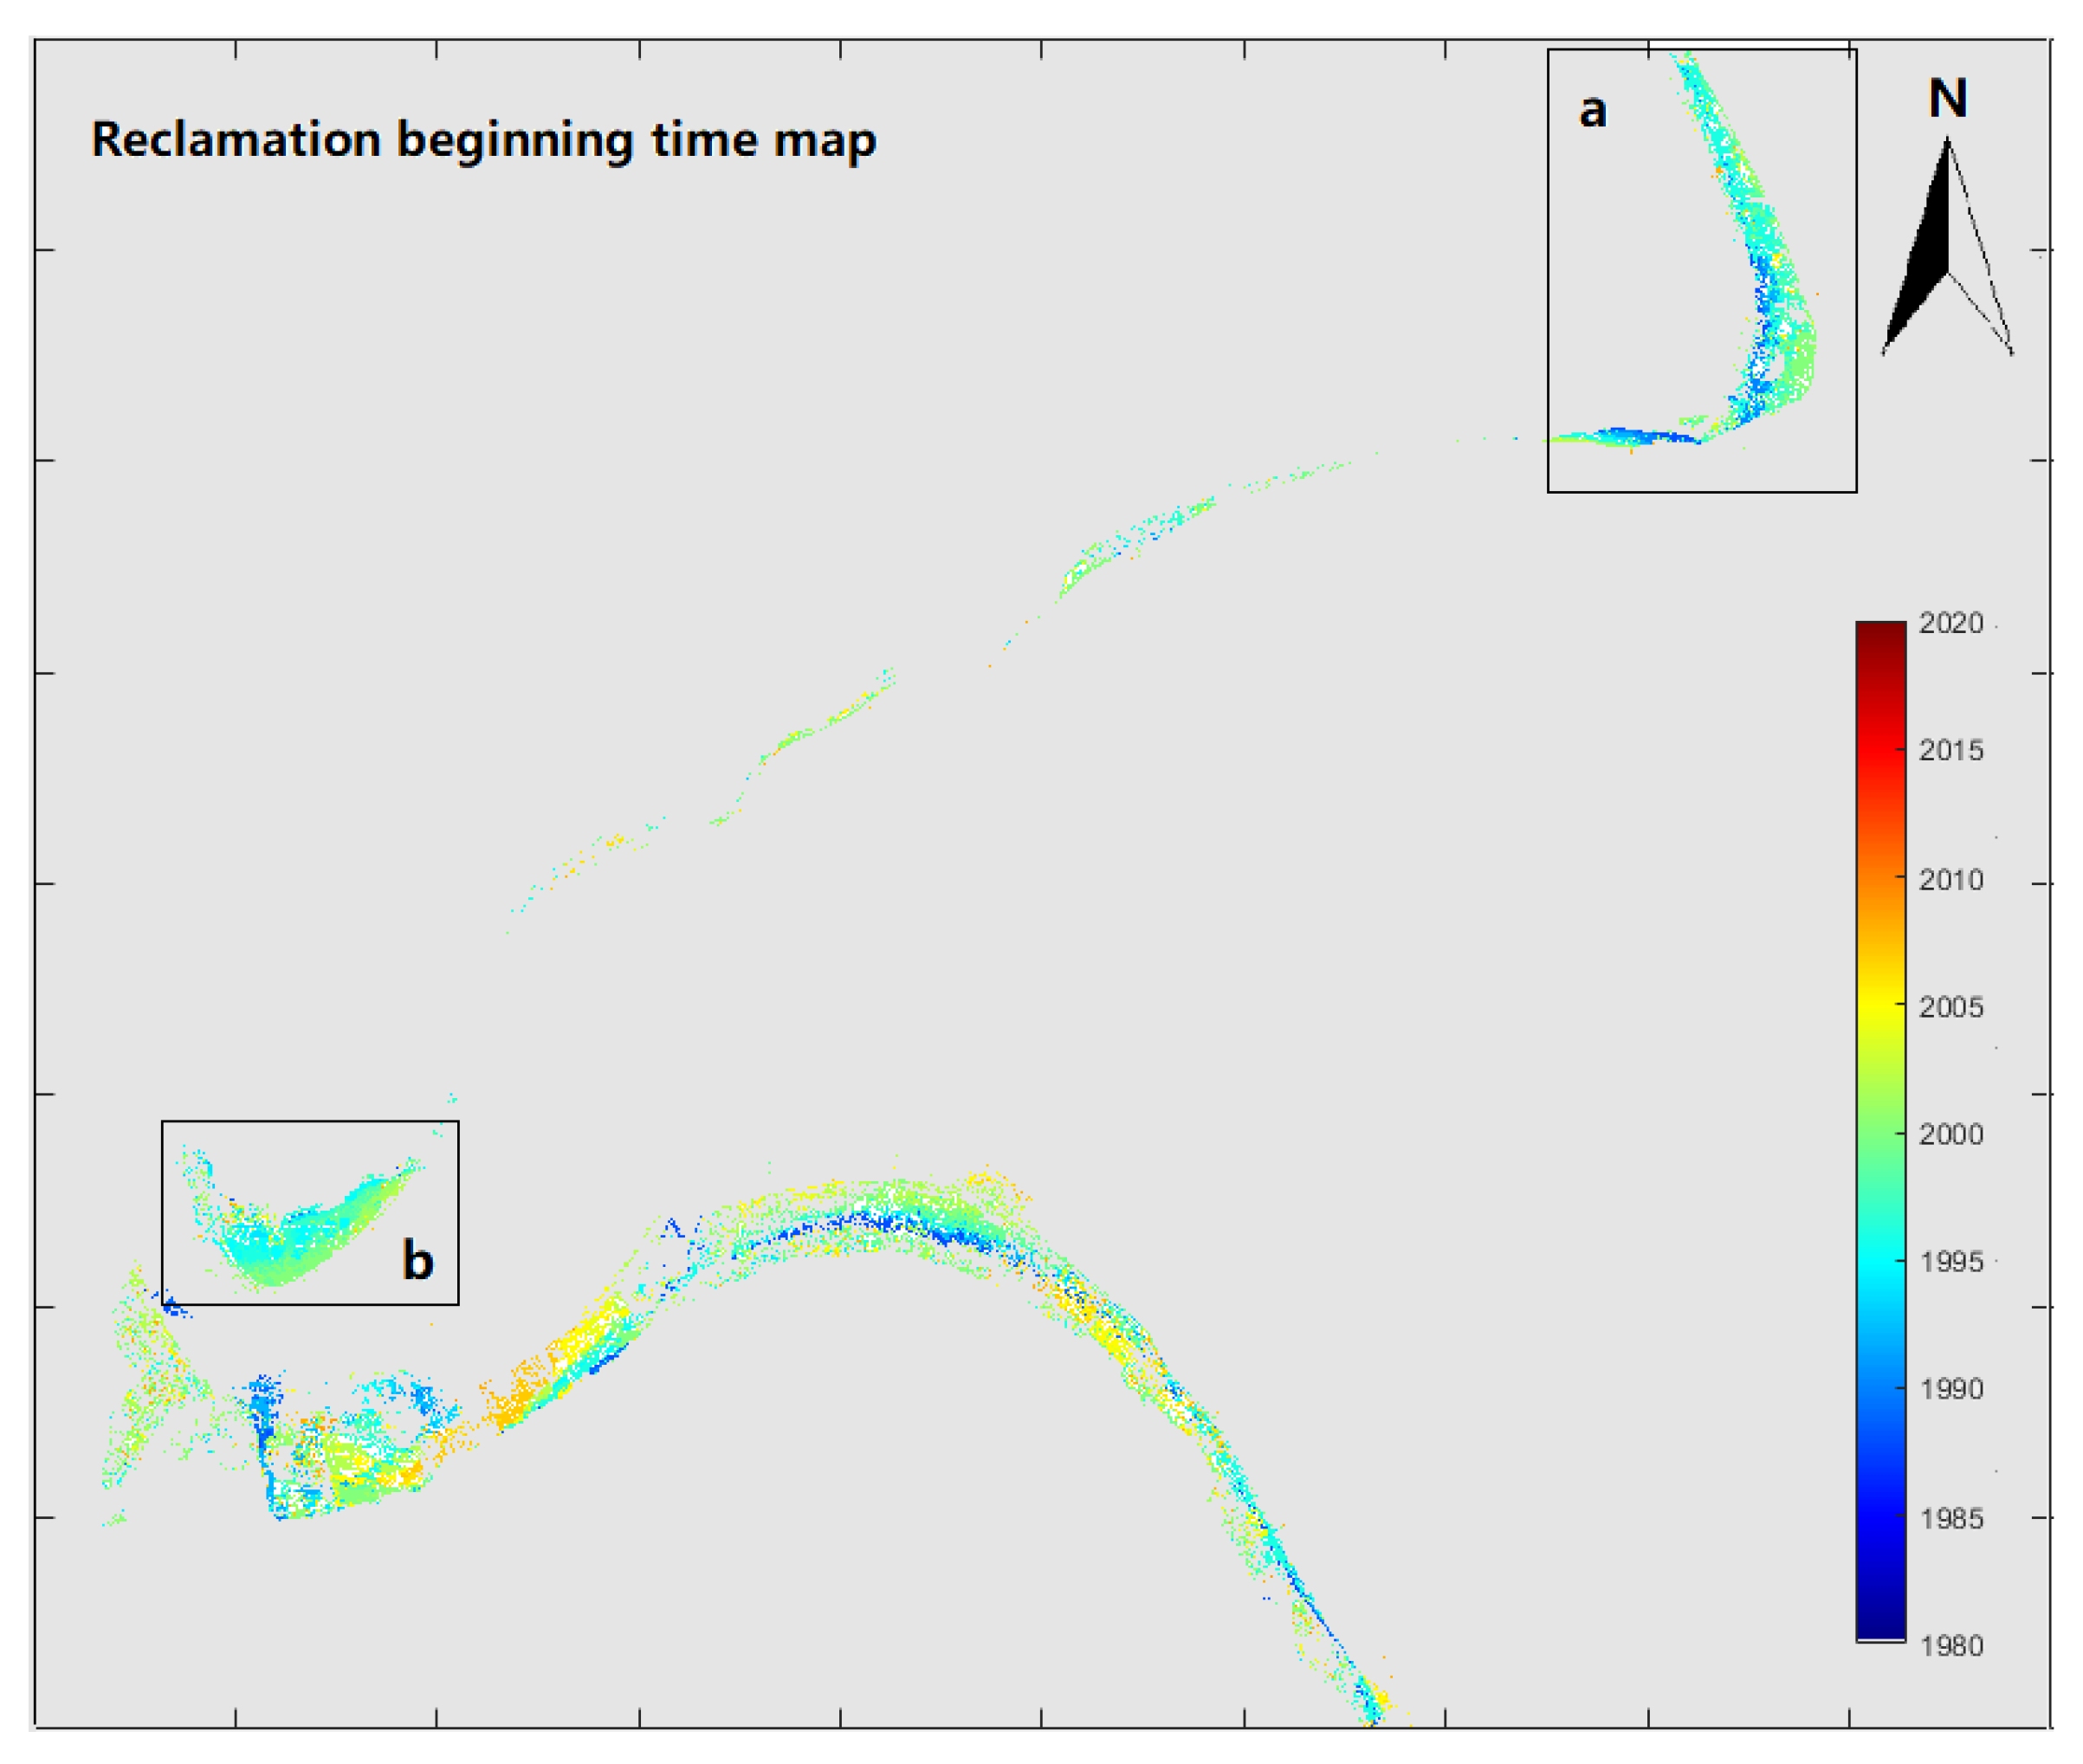
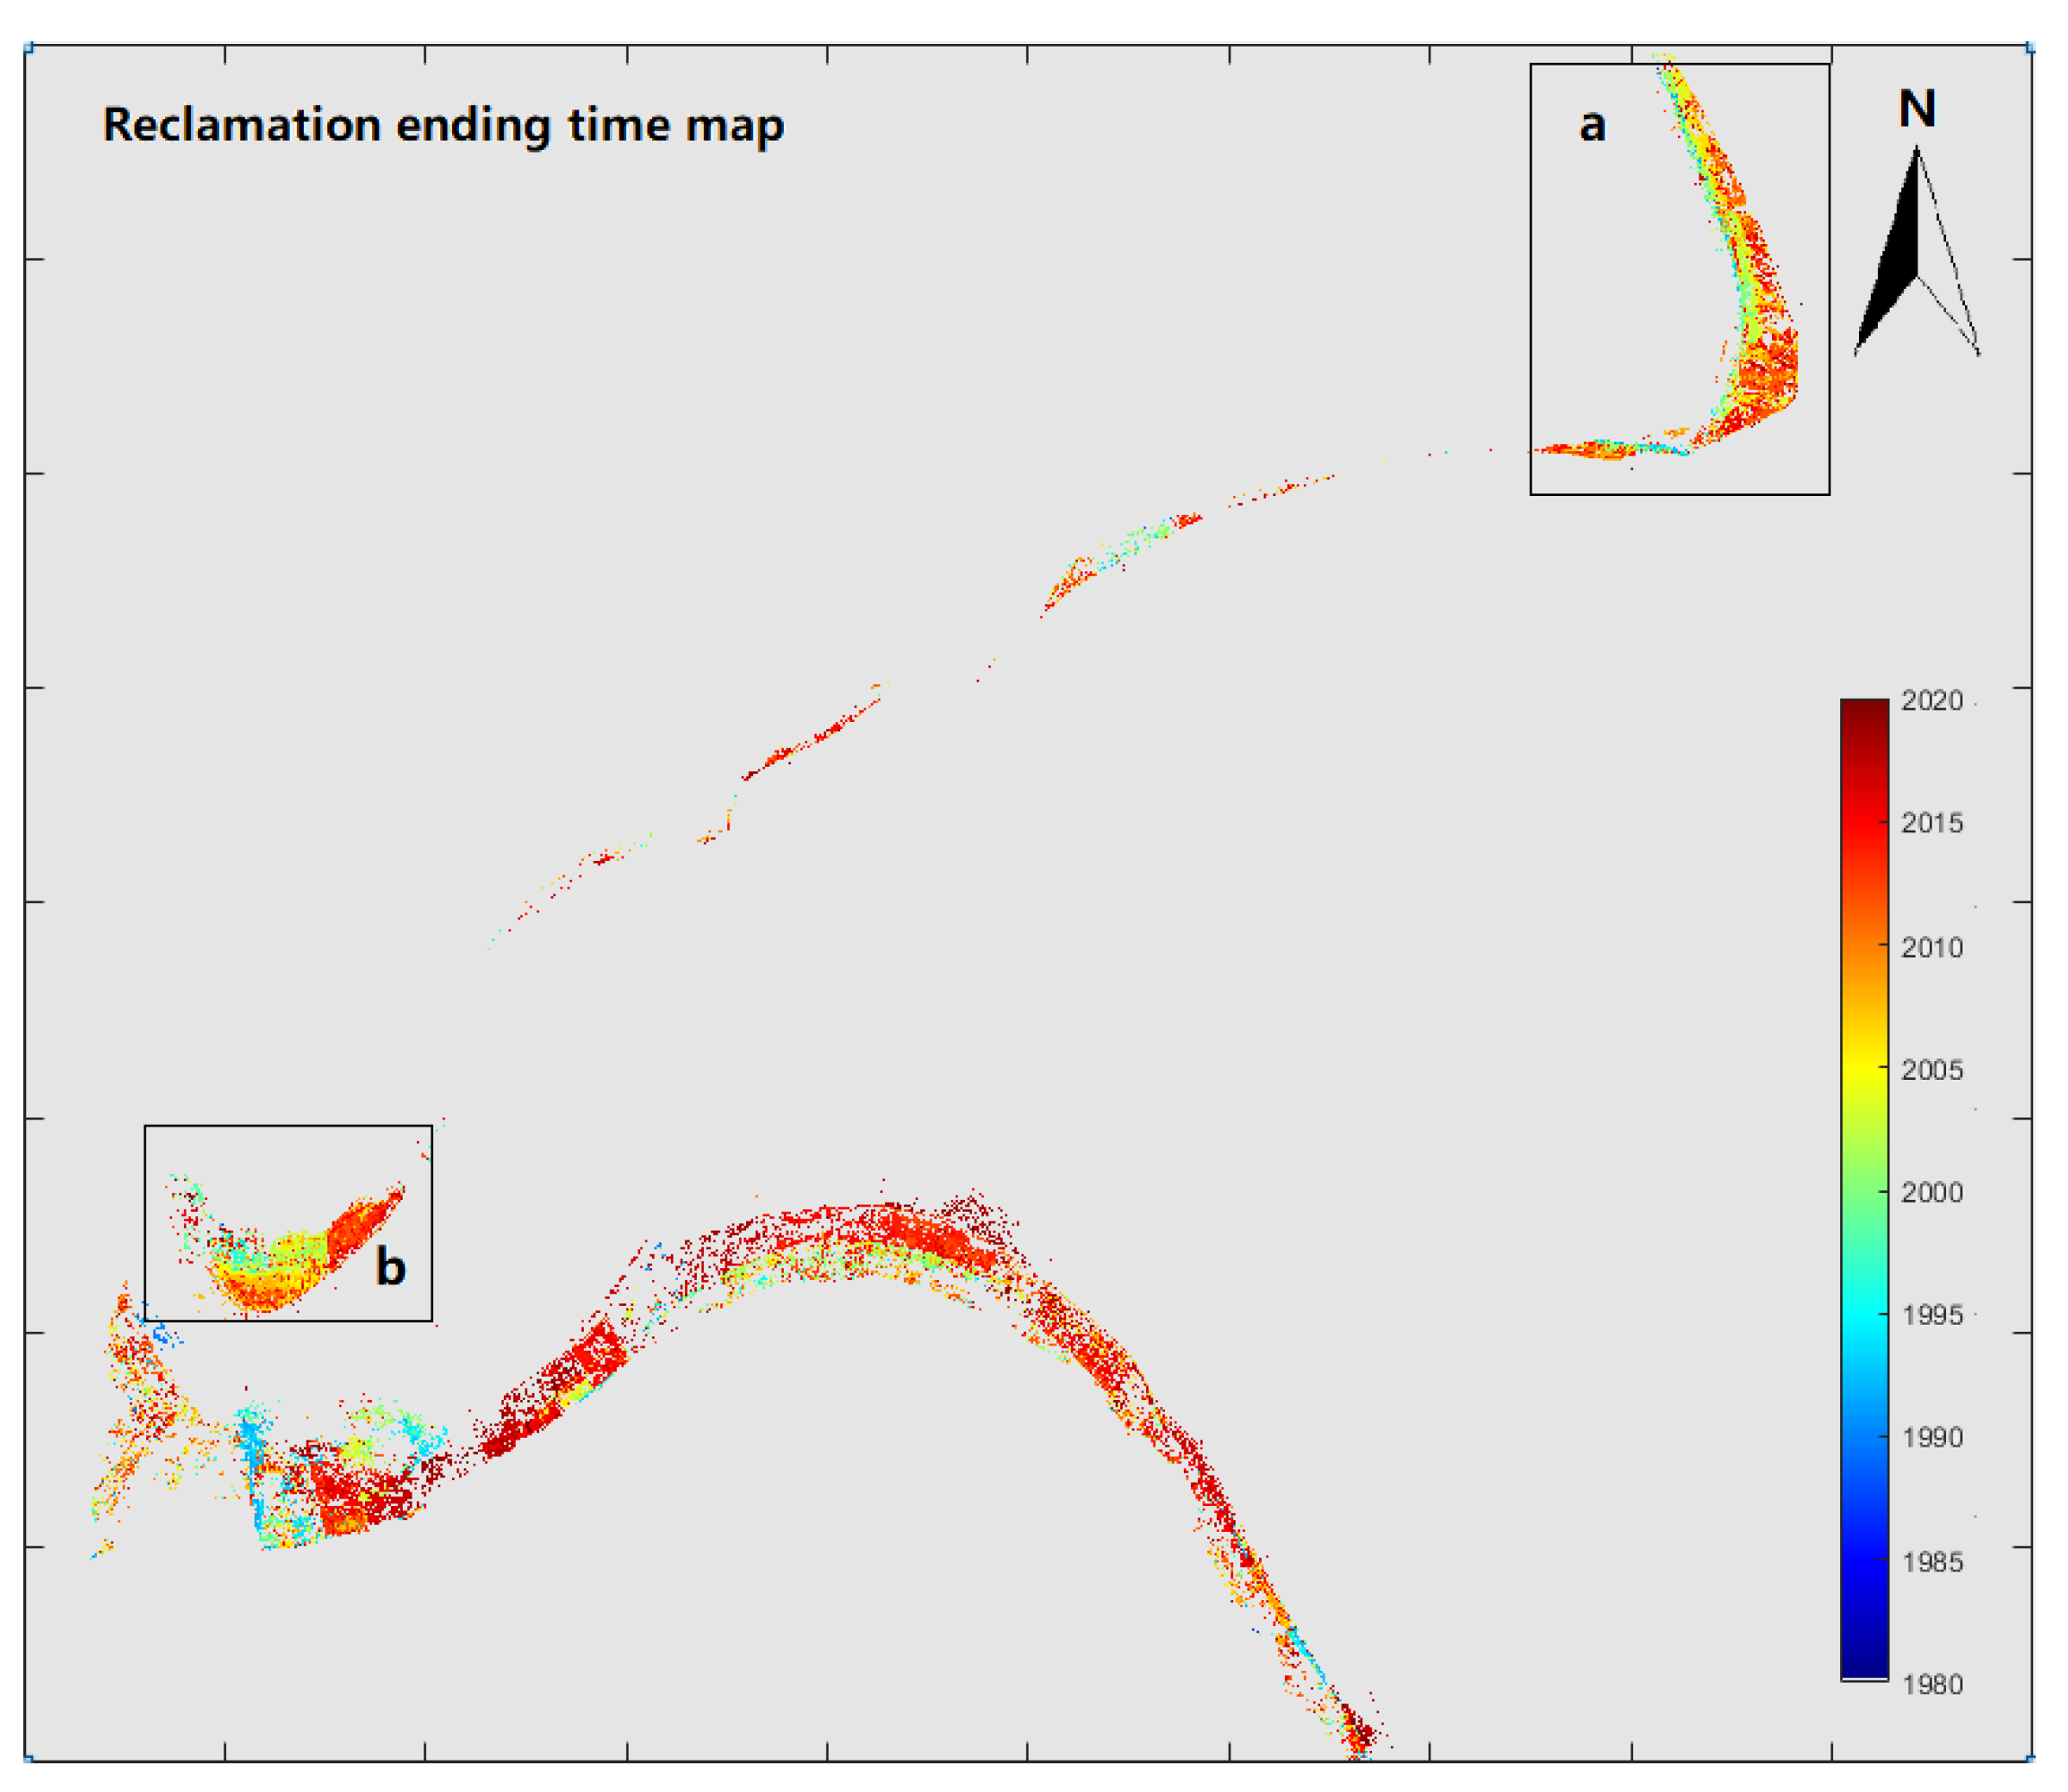
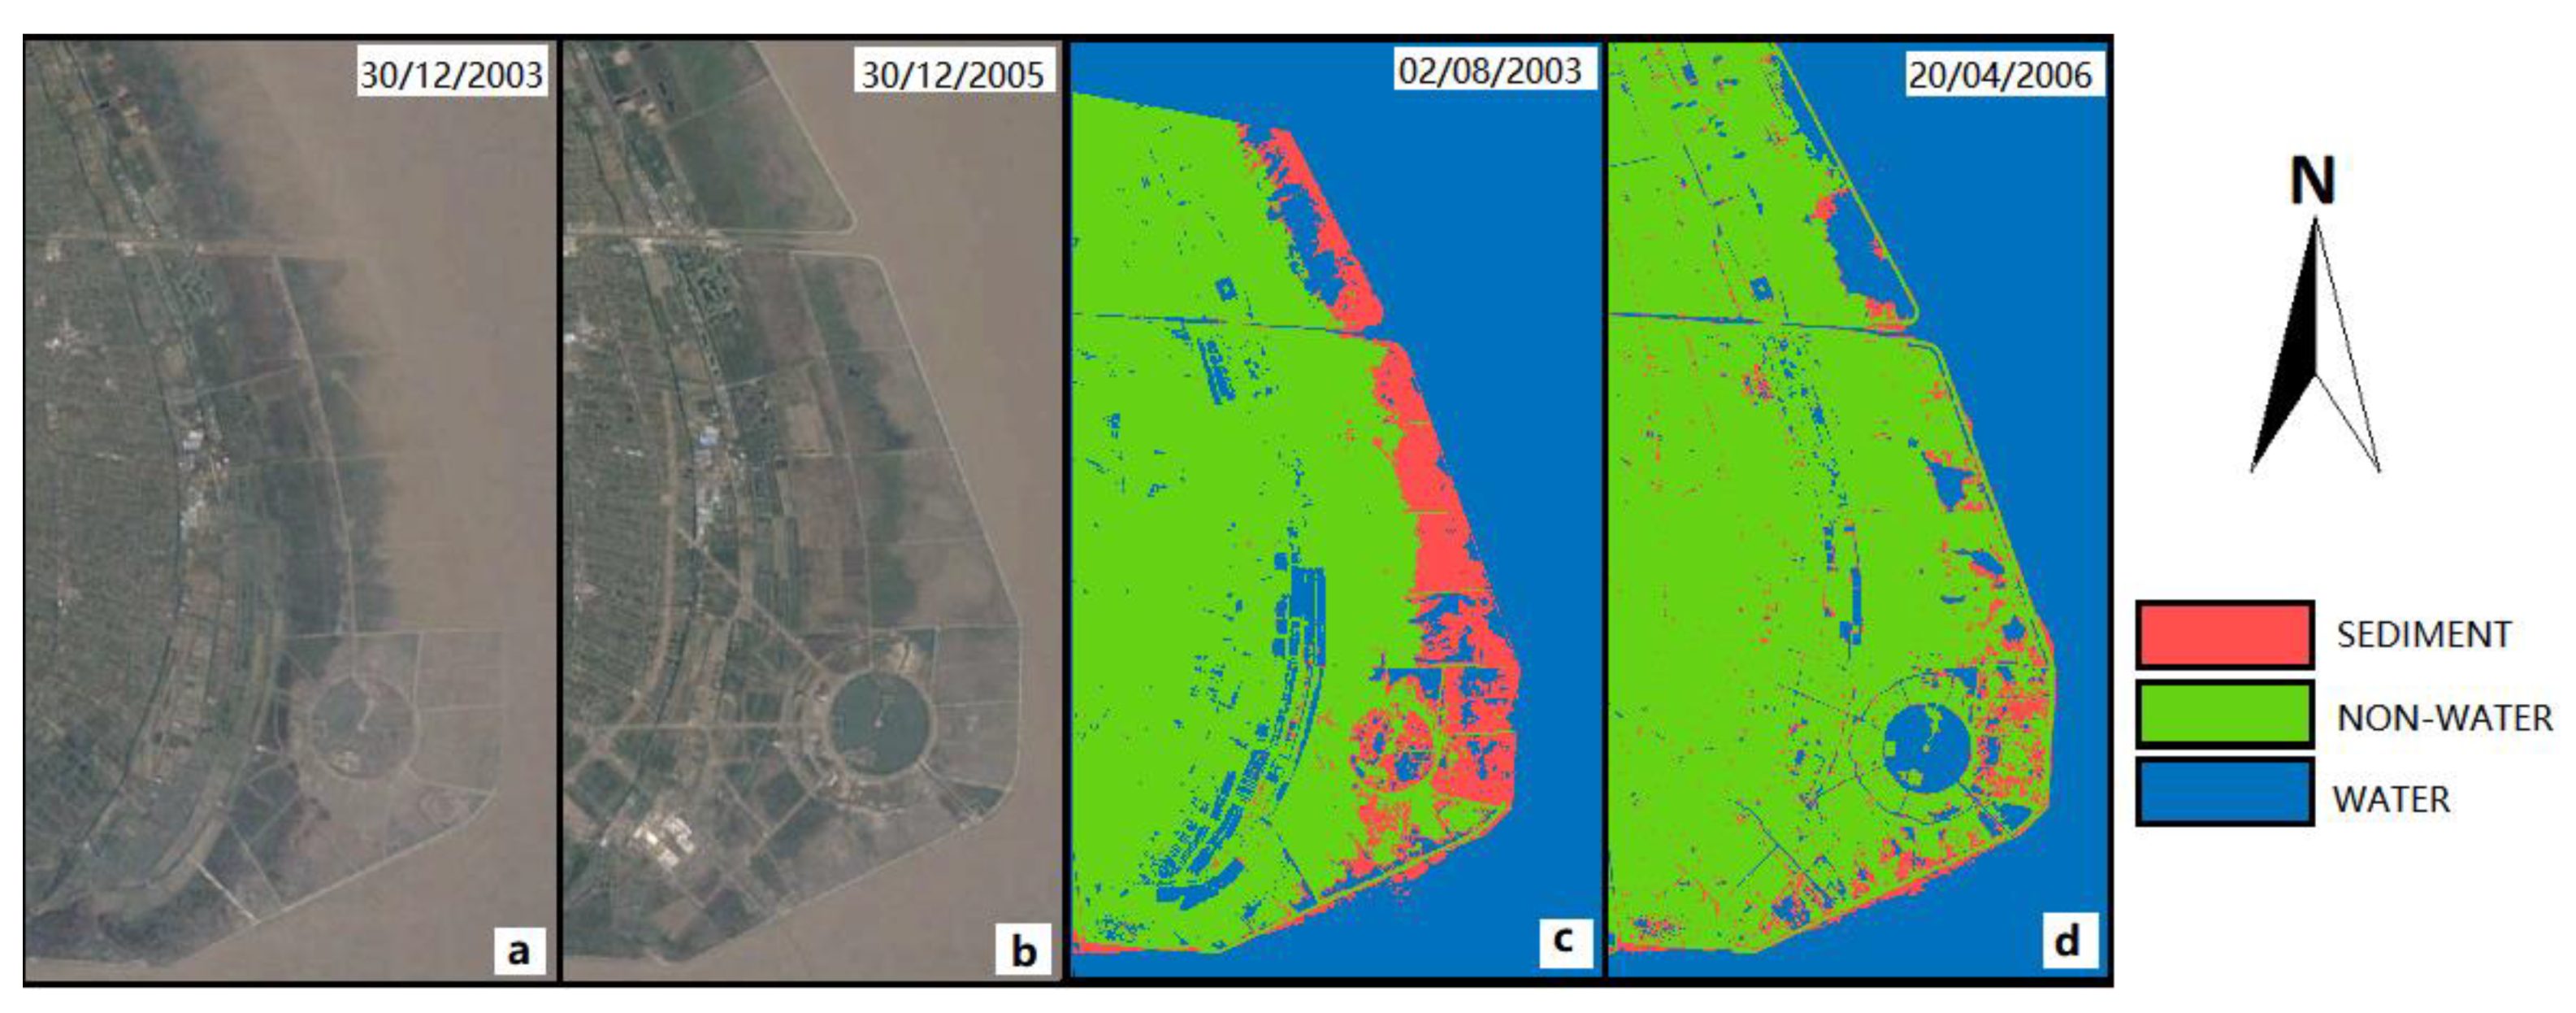
4.3. Reclamation Map of Hangzhou Bay

Figure 7 and Figure 8 show the reclamation period of Hangzhou Bay.
Although Shanghai Lingang New City (section a) is located on the top right of the map, several reclamation areas are on the map. Most of the reclamation areas are located around Hangzhou Bay. Section b indicates another integrated reclamation project in the Hangzhou Bay area. The reclamation project in section b started around 2000 and ended around 2010. The reclamation area is smaller than in section a but is also tracked successfully. The rest of the area of the reclamation map is the reclamation area located on the coastline. The two figures indicate that the reclamation activities located on the coastline are active during the research period. Even at the end of the selected research period, the reclamation activities are still in progress over the coastline.

4.4. Accuracy Assessment

Figure 9 indicates the classification results in selected dates. Two results indicate that the reclamation tracker locate the reclamation area by detecting “SEDIMENT” class in selected dates. To validate the results, a random sample of 240 pixels in Figure 9c,d are selected to evaluate the accuracy.
Table 2 indicates the reclamation tracker accuracy in Shanghai Lingang New City. The results show high accuracy of 91.7%. The Water and Non-water classes show higher accuracy of 98.3% and 97.9%, respectively.
In order to analyze the accuracy of the classification results in Hangzhou Bay, the confusion matrix is calculated through three major classes and shown in Table 3.
Table 3 indicates the confusion matrix of the results. The Water class shows the highest classification accuracy, with 88% across five classes. Given that in the reclamation tracker build process, this study divides six classes into three major classes, Water, SEDIMENT, and Non-water, the classification accuracy among Ground, Urban, Vegetation, and Farmland does not influence the final classification accuracy. The Non-water class also shows a high accuracy in the confusion matrix, with 98% (Table 4).
As shown in Table 5, in the randomly selected 100 pixels of the reclamation map, only 1 pixel cannot be determined as a reclamation pixel in Google Earth. A total of 99 reclamation pixels out of 100 are validated in this section. Therefore, the accuracy of the reclamation locator is 99% in selected pixels. A sea enclosing reclamation pixel is selected in this part, which means the tracker can only track the end time of this pixel. Thus, 98 pixels with start time and 99 pixels with end time are validated in this section, as shown in Table 5. For a time difference less than 60 months, the scatter plot and regression curve are drawn.
The validation data for the reclamation period provided by Google Earth have an average of one image per year, but the results in this study present monthly accuracy, and the time gap between Google Earth and the result has a maximum of 12 months irreducible error. Figure 10 and Figure 11 show that the start time and the end time results show a good correlation with the Google Earth result. If a time difference of more than 60 months is determined as an unsuccessful tracking result, the two figures indicate that 65.3% of start time and 83.8% of end time are located and tracked successfully. Comparison of the two figures indicate that the method based on the SEDIMENT signal and signal frequency change in this study track the reclamation end time better than the start time.
The accuracy of this study indicates that the method proposed in this study located and track the reclamation successfully. The results indicate that the method proposed in the small study area works well in the large scale of the study area. In addition, the monthly reclamation activity results indicate the value of this study. However, the reclamation tracker in this study does not consider other factors such as tidal waves, temperature, and precipitation, which may influence the result of this study. For the follow-up work to this study, we will analyze other factors that may influence the results to improve the accuracy. For the classification part, we will try different classification methods in order to improve accuracy. We will also test the method in other reclamation areas all over the world to improve the method of the study.

5. Conclusions

This study proposed a method to track the reclamation activities based on the reclamation signal in Shanghai Lingang New City and the Hangzhou Bay area. The reclamation area can be efficiently extracted with 99% accuracy, and the reclamation period of the reclamation area can be tracked at a monthly scale with 83.8% accuracy. The method can help to build a historical reclamation activity dataset in large scale and high accuracy that provides detailed information of reclamation. It is expected to provides reference information for the urban expansion planning decision makers and marine environment managers. The following study will improve the accuracy of tracking the start time and the end time of the sea enclosing reclamation. Owing to blocks, the flow water from the sea and 30 m optical satellite images used cannot track the pilot process.

Supplementary Materials

The following supporting information can be downloaded at: https://www.mdpi.com/article/10.3390/rs14030464/s1, Table S1: IDs of used Landsat observations in this study.

Author Contributions

Conceptualization, C.H. and Y.S.; methodology, Y.S. and C.H.; software, Y.S.; validation, Y.S.; resources, Y.S.; data curation, Y.S.; writing—original draft preparation, Y.S.; writing—review and editing, Y.S. and S.S.; visualization, Y.S. and S.S.; supervision, S.S. and J.G.; project administration, S.S. and J.G.; funding acquisition, S.S. and J.G. All authors have read and agreed to the published version of the manuscript.

Funding

This work was supported by the National Natural Science Foundation of China (41971307); LIESMARS Special Funding.

Institutional Review Board Statement

Not applicable.

Informed Consent Statement

Not applicable.

Data Availability Statement

The data that support the findings of this study are openly available in the United States Geological Survey (USGS) global visualization viewer at [http://glovis.usgs.gov/ (accessed on 1 July 2021)].

Conflicts of Interest

The authors declare no conflict of interest.

References

  1. Lunetta, R.S.; Knight, J.F.; Ediriwickrema, J.; Lyon, J.G.; Worthy, L.D. Land-cover change detection using multi-temporal MODIS NDVI data. Remote Sens. Environ. 2006, 105, 142–154. [Google Scholar] [CrossRef]
  2. Chee, S.Y.; Othman, A.G.; Sim, Y.K.; Adam, A.N.M.; Firth, L. Land reclamation and artificial islands: Walking the tightrope between development and conservation. Glob. Ecol. Conserv. 2017, 12, 80–95. [Google Scholar] [CrossRef] [Green Version]
  3. Wang, W.; Liu, H.; Li, Y.; Su, J. Development and management of land reclamation in China. Ocean Coast. Manag. 2014, 102, 415–425. [Google Scholar] [CrossRef]
  4. Hoeksema, R.J. Three stages in the history of land reclamation in the Netherlands. Irrig. Drain. 2007, 56, S113–S126. [Google Scholar] [CrossRef]
  5. Jia, R.; Lei, H.; Hino, T.; Arulrajah, A. Environmental changes in Ariake Sea of Japan and their relationships with Isahaya Bay reclamation. Mar. Pollut. Bull. 2018, 135, 832–844. [Google Scholar] [CrossRef]
  6. Lie, H.-J.; Cho, C.-H.; Lee, S.; Kim, E.-S.; Koo, B.-J.; Noh, J.-H. Changes in Marine Environment by a Large Coastal Development of the Saemangeum Reclamation Project in Korea. Ocean Polar Res. 2008, 30, 475–484. [Google Scholar] [CrossRef] [Green Version]
  7. Lee, C.-H.; Lee, B.-Y.; Chang, W.K.; Hong, S.; Song, S.J.; Park, J.; Kwon, B.-O.; Khim, J.S. Environmental and ecological effects of Lake Shihwa reclamation project in South Korea: A review. Ocean Coast. Manag. 2014, 102, 545–558. [Google Scholar] [CrossRef]
  8. Slamet, N.S.; Dargusch, P.; Aziz, A.A.; Wadley, D. Mangrove vulnerability and potential carbon stock loss from land reclamation in Jakarta Bay, Indonesia. Ocean Coast. Manag. 2020, 195, 105283. [Google Scholar] [CrossRef]
  9. Sengupta, D.; Chen, R.; Meadows, M.E. Building beyond land: An overview of coastal land reclamation in 16 global megacities. Appl. Geogr. 2018, 90, 229–238. [Google Scholar] [CrossRef]
  10. Tian, B.; Wu, W.; Yang, Z.; Zhou, Y. Drivers, trends, and potential impacts of long-term coastal reclamation in China from 1985 to 2010. Estuar. Coast. Shelf Sci. 2016, 170, 83–90. [Google Scholar] [CrossRef]
  11. Wang, X.; Yan, F.; Su, F. Changes in coastline and coastal reclamation in the three most developed areas of China, 1980–2018. Ocean Coast. Manag. 2021, 204, 105542. [Google Scholar] [CrossRef]
  12. Ma, Z.; Melville, D.S.; Liu, J.; Chen, Y.; Yang, H.; Ren, W.; Zhang, Z.; Piersma, T.; Li, B. Rethinking China’s new great wall. Science 2014, 346, 912–914. [Google Scholar] [CrossRef] [Green Version]
  13. Yang, H.-Y.; Chen, B.; Barter, M.; Piersma, T.; Zhou, C.-F.; Li, F.-S.; Zhang, Z.-W. Impacts of tidal land reclamation in Bohai Bay, China: Ongoing losses of critical Yellow Sea waterbird staging and wintering sites. Bird Conserv. Int. 2011, 21, 241–259. [Google Scholar] [CrossRef] [Green Version]
  14. Hudak, A.T.; Wessman, C.A. Textural Analysis of Historical Aerial Photography to Characterize Woody Plant Encroachment in South African Savanna. Remote Sens. Environ. 1998, 66, 317–330. [Google Scholar] [CrossRef]
  15. Wang, X.; Liu, Y.; Ling, F.; Liu, Y.; Fang, F. Spatio-Temporal Change Detection of Ningbo Coastline Using Landsat Time-Series Images during 1976–2015. ISPRS Int. J. Geo-Inf. 2017, 6, 68. [Google Scholar] [CrossRef] [Green Version]
  16. Bouchahma, M.; Yan, W.; Ouessar, M. Island Coastline Change Detection Based on Image Processing and Remote Sensing. Comput. Inf. Sci. 2012, 5, p27. [Google Scholar] [CrossRef] [Green Version]
  17. Patel, S.; Shah, E.; Jayaprasad, P.; James, M. Changes in Antarctic coastline between 1997 and 2016 using RADARSAT and MODIS data. Int. J. Remote Sens. 2019, 41, 1389–1414. [Google Scholar] [CrossRef]
  18. Aedla, R.; Dwarakish, G.; Reddy, D.V. Automatic Shoreline Detection and Change Detection Analysis of Netravati-GurpurRivermouth Using Histogram Equalization and Adaptive Thresholding Techniques. Aquat. Procedia 2015, 4, 563–570. [Google Scholar] [CrossRef]
  19. El-Kawy, O.A.; Rød, J.K.; Ismail, H.; Suliman, A. Land use and land cover change detection in the western Nile delta of Egypt using remote sensing data. Appl. Geogr. 2011, 31, 483–494. [Google Scholar] [CrossRef]
  20. Sengupta, D.; Chen, R.; Meadows, M.E.; Choi, Y.R.; Banerjee, A.; Zilong, X. Mapping Trajectories of Coastal Land Reclamation in Nine Deltaic Megacities using Google Earth Engine. Remote Sens. 2019, 11, 2621. [Google Scholar] [CrossRef] [Green Version]
  21. Xu, H.; Chen, L.; Zhao, B.; Zhang, Q.; Cai, Y. Green stormwater infrastructure eco-planning and development on the regional scale: A case study of Shanghai Lingang New City, East China. Front. Earth Sci. 2015, 10, 366–377. [Google Scholar] [CrossRef]
  22. Xu, N.; Gong, P. Significant coastline changes in China during 1991–2015 tracked by Landsat data. Sci. Bull. 2018, 63, 883–886. [Google Scholar] [CrossRef] [Green Version]
  23. Kovalskyy, V.; Roy, D. The global availability of Landsat 5 TM and Landsat 7 ETM+ land surface observations and implications for global 30m Landsat data product generation. Remote Sens. Environ. 2013, 130, 280–293. [Google Scholar] [CrossRef] [Green Version]
  24. Masek, J.; Vermote, E.; Saleous, N.; Wolfe, R.; Hall, F.; Huemmrich, K.; Gao, F.; Kutler, J.; Lim, T.-K. A Landsat Surface Reflectance Dataset for North America, 1990–2000. IEEE Geosci. Remote Sens. Lett. 2006, 3, 68–72. [Google Scholar] [CrossRef]
  25. Vermote, E.; Justice, C.; Claverie, M.; Franch, B. Preliminary analysis of the performance of the Landsat 8/OLI land surface reflectance product. Remote Sens. Environ. 2016, 185, 46–56. [Google Scholar] [CrossRef]
  26. Gong, P.; Wang, J.; Yu, L.; Zhao, Y.; Zhao, Y.; Liang, L.; Niu, Z.; Huang, X.; Fu, H.; Liu, S.; et al. Finer resolution observation and monitoring of global land cover: First mapping results with Landsat TM and ETM+ data. Int. J. Remote Sens. 2013, 34, 2607–2654. [Google Scholar] [CrossRef] [Green Version]
  27. Chen, J.; Chen, J.; Liao, A.; Cao, X.; Chen, L.; Chen, X.; He, C.; Han, G.; Peng, S.; Lu, M.; et al. Global land cover mapping at 30 m resolution: A POK-based operational approach. ISPRS J. Photogramm. Remote Sens. 2011, 103, 7–27. [Google Scholar] [CrossRef] [Green Version]
  28. Huang, C.; Zhang, C.; Liu, Q.; Wang, Z.; Li, H.; Liu, G. Land reclamation and risk assessment in the coastal zone of China from 2000 to 2010. Reg. Stud. Mar. Sci. 2020, 39, 101422. [Google Scholar] [CrossRef]
  29. Zhen, L.; Chan, A. An artificial intelligent algorithm for tumor detection in screening mammogram. IEEE Trans. Med. Imaging 2001, 20, 559–567. [Google Scholar] [CrossRef]
  30. Shi, Y.; Feng, L.; Gong, J. Four decades of the morphological dynamics of the lakes in the Jianghan Plain using Landsat observations. Water Environ. J. 2017, 31, 353–359. [Google Scholar] [CrossRef]
  31. Dhanachandra, N.; Manglem, K.; Chanu, Y.J. Image Segmentation Using K -means Clustering Algorithm and Subtractive Clustering Algorithm. Procedia Comput. Sci. 2015, 54, 764–771. [Google Scholar] [CrossRef] [Green Version]
  32. Ossama, O.; Mokhtar, H.M.; El-Sharkawi, M.E. An extended k-means technique for clustering moving objects. Egypt. Inform. J. 2011, 12, 45–51. [Google Scholar] [CrossRef] [Green Version]
  33. Steinley, D. K-means clustering: A half-century synthesis. Br. J. Math. Stat. Psychol. 2006, 59, 1–34. [Google Scholar] [CrossRef] [PubMed] [Green Version]
  34. He, C.; Li, X.; Hu, Y.; Ye, Z.; Kang, H. Microscope images automatic focus algorithm based on eight-neighborhood operator and least square planar fitting. Optik 2020, 206, 164232. [Google Scholar] [CrossRef]
Figure 1. Landsat 8 OLI observation on 20 January 2018. Band 3 4 5 false color image of study area: (a) Hangzhou Bay area, and (b) Shanghai Lingang New City area.
Remotesensing 14 00464 g001
Figure 2. Flow chart of method to build the reclamation tracker in this study.
Remotesensing 14 00464 g002
Figure 3. Reclamation tracker result in Shanghai Lingang New City: (a,b) indicate the first and last date of final classification result; (c) indicates the sea filling reclamation area; and (d) indicates the sea enclosing reclamation area in Shanghai Lingang New City.
Remotesensing 14 00464 g003
Figure 4. Reclamation activities map. First row indicates the reclamation activities in each year from 1996 to 2001. Second row indicates the reclamation activities in each month from January 1997 to June 1997.
Remotesensing 14 00464 g004
Figure 5. The histogram of active reclamation pixel numbers for each month from 1999 to 2002.
Remotesensing 14 00464 g005
Figure 6. Reclamation period map: (a) indicates the reclamation start time, and (b) indicates the reclamation end time of the study area.
Remotesensing 14 00464 g006
Figure 7. Reclamation start time map of study area. Section (a) indicates the Shanghai Lingang New City area, and section (b) indicates an integrated reclamation project in the Hangzhou Bay area.
Remotesensing 14 00464 g007
Figure 8. Reclamation end time map of study area. Section (a) indicates the Shanghai Lingang New City area, and section (b) indicates an integrated reclamation project in the Hangzhou Bay area.
Remotesensing 14 00464 g008
Figure 9. Selected classification results of three major classes in Shanghai Lingang New City: (a,b) show the Google Earth Pro historical results in 30/12/2003 and 30/12/2005; (c,d) show the classification results of 02/08/2003 and 20/04/2006 corresponding to Google historical data.
Remotesensing 14 00464 g009
Figure 10. Scatter plot of reclamation start time for time difference of less than 60 months: 64 pixels out of 98.
Remotesensing 14 00464 g010
Figure 11. Scatter plot of reclamation end time for time difference less than 60 months: 83 pixels out of 99.
Remotesensing 14 00464 g011
Table 1. Overview of study data.
Type of DataAmount of ObservationsDate of Observation (Year)
Landsat-5 TM661988–2009
Landsat-7 ETM+282000–2012
Landsat-8 OLI142013–2018
Table 2. Evaluation of 240 pixels in two reclamation tracker results of Shanghai Lingang New City.
ResultCorrectIncorrectTotal
Class
Water60161
Non-water1403143
SEDIMENT33336
Total2337240
Table 3. Confusion matrix of 100 randomly selected pixels on the classification results of Hangzhou Bay shown in five classes.
GoogleWaterGroundUrbanVegetationFarmlandTotal
Classification
Water441 2350
Ground117 220
Urban 0 0
Vegetation 5510
Farmland 41620
Total451801126100
Table 4. Confusion matrix of 100 randomly selected pixels on the classification results of Hangzhou Bay shown in three major classes.
GoogleWaterNon-WaterTotal
Tracker
Water44650
Non-water14950
Total4555100
Table 5. Random selection of 100 pixels on reclamation map of Hangzhou Bay.
Time Difference (Month)Start TimeEnd Time
Less than 36 months4272
36–60 months2211
More than 60 months3315
Total9899
Publisher’s Note: MDPI stays neutral with regard to jurisdictional claims in published maps and institutional affiliations.

