Article

An Improved Exponential Model Considering a Spectrally Effective Moisture Threshold for Proximal Hyperspectral Reflectance Simulation and Soil Salinity Estimation

1
Center for Agricultural Water Research in China, China Agricultural University, Beijing 100083, China
2
National Field Scientific Observation and Research Station on Efficient Water Use of Oasis Agriculture, Wuwei 733000, China
3
Southern Xinjiang Research Center for Information Technology in Agriculture, College of Information Engineering, Tarim University, Alaer 843300, China
4
National Centre for Groundwater Research and Training, College of Science and Engineering, Flinders University, Adelaide, SA 5001, Australia
*
Author to whom correspondence should be addressed.
Remote Sens. 2022, 14(24), 6396; https://doi.org/10.3390/rs14246396
Submission received: 17 October 2022 / Revised: 15 December 2022 / Accepted: 16 December 2022 / Published: 18 December 2022
(This article belongs to the Section Remote Sensing Image Processing)

Abstract

:
Soil salinization has become one of the main factors restricting sustainable development of agriculture. Field spectrometry provides a quick way to predict the soil salinization. However, soil moisture content (SMC) seriously interferes with the spectral information of saline soil in arid areas. It is vital to establish a model that is insensitive to SMC for potential in situ field applications. The soil spectral reflectance exponential model (SSREM) has been widely employed for reflectance simulation and SSC inversion. However, its reliability for saline soils with high SMC has not been verified yet. Based on hyperspectral remote sensing data (400~1000 nm) on 459 saline soil samples in Shiyang River Basin of Northwest China, we investigated the role of SMC and SSC in soil spectral reflectance from 29 October 2020 to 22 January 2021. Targeted at saline soils, soil spectral moisture threshold (MT) was introduced to improve the SSREM toward a modified spectral reflectance exponential model (MT-SSREM). The bands that are sensitive to SSC but not sensitive to SMC were obtained based on a method of correlation analysis between original spectra, four kinds of spectral data, and SSC. SSREM and MT-SSREM were finally applied to inversely estimate SSC. Results show that wavelengths at 658~660, 671~685, 938 nm were suitable for SSC estimation. Furthermore, although SSREM was able to simulate the spectral reflectance of most saline soils, its simulation accuracy was low for saline soil samples with high SMC (SMC > MT(i), 400   nm i 1000   nm ), while MT-SSREM performed well over the whole range of SMC. The simulated spectral reflectance from MT-SSREM agreed well with the measured reflectance, with the R2 being generally larger than 0.9 and RMSE being less than 0.1. More importantly, MT-SSREM performed substantially better than SSREM for SSC estimation; in the statistical performance of the former case, R2 was in range of 0.60~0.66, RMSE was in range of 0.29~0.33 dS m−1; in the latter case, R2 was in range of 0.10~0.16, RMSE was in the range of 0.26~0.29 dS m−1. MT-SSREM proposed in this study thus provides a new direction for estimating hyperspectral reflectance and SSC under various soil moisture conditions at wavelengths from 400 to 1000 nm. It also provides an approach for SSC and SMC mapping in salinization regions by incorporating remote sensing data, such as GF-5.

1. Introduction

Soil salinization is widespread around the world; 23% of cultivated land is affected by salinization, especially in arid and semi-arid irrigated agricultural areas. Soil salinization affects crop growth and soil properties and has become one of the main factors restricting sustainable development of agriculture [1,2,3]. Estimation of soil salinization is necessary to improve land management, inhibit soil degradation and guarantee crop yield. Previous studies have shown that remote sensing data is a promising tool for estimating soil salinization. Among the current remote sensing techniques, UAV and satellite remote sensing are vulnerable to weather and disturbed by vegetation. In addition, the inversion model needs to be established and tested under various salinization conditions. In recent years, hyperspectral remote sensing data have been widely used for monitoring soil salinization because of its high resolution and the large amount of information captured [4,5,6,7]. With the ground-based hyperspectral technique, it is convenient to conduct laboratory measurements and obtain the corresponding spectral information; therefore, it is efficient and reliable for quantitative study of soil–moisture–salt relationships and for salt inversion.
The spectral pattern of saline soil is the result of numerous factors, such as soil particle size distribution, moisture content (SMC), organic matter content, mineral composition and salt content (SSC) [8,9,10,11]. Among them, SMC and SSC are the dominant factors in arid areas [12,13,14,15]. With the help of hyperspectral proximal remote sensing technology, many studies have been conducted to quantify the influence of soil moisture and salt on soil spectral reflectance [16,17,18,19].
Based on remote sensing data, the influence of SMC on the spectrum was quantitatively examined. The results of these previous studies have shown that there is a negative correlation between soil reflectance and SMC [20,21,22]. However, for high SMC values, soil reflectance increases with SMC due to specular reflection [23,24]. There seems to be a moisture threshold (MT) across which the relation between soil reflectance and SMC changes; i.e., when the SMC is lower than MT, the reflectance decreases with an increase of SMC. When the SMC is greater than MT, the reflectance increases with an increase of SMC. The MT value is generally considered equal to field moisture capacity [13,21,23,25]. The relationships between SMC and spectral reflectance have been used to develop functions for estimating SMC [21,26]. However, most of these functions were tested over a limited range of soil types. Meanwhile, models for SMC estimation have been developed based on optical theory. Zhang et al. [27] explored the relationship between single-scattering albedo and SMC on the wavelengths from 400 to 2400 nm and modified the Hapke photometric model to simulate spectral reflectance of different soil samples [28]. Bablet et al. [23] conceptualized SMC as water-equivalent thickness in a soil and proposed a multilayer radiative transfer model for wet soil reflectance to estimate SMC on the wavelengths from 400 to 2500 nm. Yuan et al. [29] found that the diffuse reflection of soil responded to SMC changes and proposed an SMC retrieval model using reflectance based on the Kubelka–Munk model [30]. Although various SMC estimation methods have been established and verified for controlled conditions, few of them have considered the MT effect on the SMC-reflectance relationship.
As to SSC, numerous studies show that soil spectral reflectance correlated negatively with SSC [31,32,33], while some other studies show a positive correlation [4,11,34]. This discrepancy is mainly caused by the difference in salt composition and/or difference in soil structure (e.g., disturbed soils in laboratory or undisturbed soils in situ) among studies [15,35,36]. Based on the variation of saline soil spectral reflectance with SSC, several methods have been applied for estimating SSC, such as partial least-square regression (PLSR), artificial neural network (ANN), random forest regression (RFR) and support vector machine (SVM) [37,38,39]. However, both SMC and SSC can influence the soil spectral reflectance [13,25]. It has been found that SSC estimation becomes less accurate for soils with high SMC [35,36,40]. Therefore, for quantifying the influence of salt on spectral reflectance, the noise of moisture should be removed.
To separate the interference of SMC and SSC on the soil spectrum, it is crucial to differentiate the spectral signals corresponding to moisture and salt. Common approaches include extraction of sensitive bands for SMC and SSC of saline soils [41,42,43]; decomposition of spectral signal of saline soils into two spectral signals corresponding to SMC and SSC by using methods such as wavelet analysis, empirical mode decomposition (EMD), and external parameter orthogonalization (EPO) [44,45,46,47]; and inversion of spectral reflectance of wet or dry saline soils by regression algorithms [48]. Researchers have also constructed semi-empirical and physical models to differentiate the spectral signals corresponding to moisture and salt [49]. Farifteh [50] used an inverted Gaussian (IG) function to describe the soil spectral reflectance and quantify the effects of SMC and SSC on the soil spectrum. The exponential regression model, first proposed by Lobell and Asner [21] and Muller and Décamps [26], to characterize the relationship between soil moisture and soil spectral reflectance has been continually upgraded to incorporate the effect of SSC. Wang et al. [15] and Yang and Yu [31] proposed the soil spectral reflectance exponential model (SSREM) by taking into account the mechanism of soil salinity on the spectral reflectance. Zhang et al. [51] considered the influence of water–salt interaction on saline soil spectrums based on the soil spectral reflectance exponential model.
Despite these previous efforts on SSREM, there are still deficiencies to be solved for SSREM applications and SSC/SMC estimation; (1) Low accuracy [36] and a large variation in performance among sites [39]; (2) Since different spectral bands might respond to SMC in different manners, it is necessary to determine functions to describe the relationship between SMC and spectral reflectance of all bands following a consistent procedure; (3) The MT effect has been reported in some studies, however, it is unknown yet the exact MT value for each wavelength within 400~1000 nm [24]; (4) The applicability of SSREM parameters; i.e., the changing rates of soil spectral reflectance caused by SMC (parameter a) and SSC (parameter b) and the spectral reflectance which is not affected by moisture and salt (parameter R0), needs further verification [52]; (5) The sensitive wavelengths of SMC and SSC could be identical. In this case, how to distinguish between the spectral signals of SMC and SSC needs to be further explored.
Therefore, the objectives of this paper are to: (1) investigate the saline soil spectral reflectance in response to moisture and salt in arid areas of Northwest China; (2) identify the relationship between spectral reflectance and SMC, as well as MT value of each hyperspectral band; (3) propose a new model (MT-SSREM) by incorporating the MT effect on the relationship of SMC and spectral reflectance; (4) evaluate the capabilities of SSREM and MT-SSREM for estimating hyperspectral reflectance and SSC.

2. Methodology

2.1. Experimental Site Description

The experiments were conducted at National Field Scientific Observation and Research Station on Efficient Water Use of Oasis Agriculture in Wuwei, Gansu Province, China (37°52′20″N, 102°50′50″E), with a map of the study area shown in Figure 1. The station belongs to a continental temperate arid desert climate, with a mean annual precipitation of 164 mm and pan evaporation of 2400 mm [53,54,55].

2.2. Data Collection

The experiments were carried out from 29 October 2020 to 22 January 2021 with 10 samples taken on the following dates: 29 October 2020, 6 November 2020, 12 November 2020, 19 November 2020, 4 December 2020, 19 December 2020, 4 January 2021 and 22 January 2021. Soil samples were obtained from an agricultural field in the fallow season, which was previously planted with sunflower under brackish water irrigation (including three irrigation salinities, 0.7, 4.0, and 8.0 g/L, respectively) between May and September of 2020 [56]. The soil type in the field is silt loam and the measured soil physical properties along the soil samples are shown in Table 1.
A total of 459 soil samples were collected from soils at 0~10 cm depth during the whole test period. Each soil sample was sieved through a 2-mm sieve and divided into three parts. The first partition of the sample was used for measuring its reflectance, the second partition of the sample was for measuring the reflectance after the soil was air dried, and the third partition of the sample was for measuring its mass water content, electrical conductivity (EC) and ion content.
The first partitions of the soil samples were packed into black cylindrical plastic containers with a diameter of 5 cm and a height of 3 cm. Then, the surface of the samples was carefully leveled to avoid preferential orientation of particles on the surface and minimize shadowing effects. Spectral reflectance of each soil sample was measured by a spectro-radiometer (ASD FieldSpec HandHeld2). The field angle of the spectrometer is 25°, the wavelength range is 325~1075 nm, and the sampling interval is 1 nm. Before each measurement, the spectroradiometer was calibrated with the spectralon panel (reflectance in the range of 325~1075 nm all equals 1). During measurements, the spectrometer probe was held vertically downward at a height of 22 cm above the soil surface (making sure that the spectrometer field of view was all soil sample surface), and the reflectance of each soil sample was collected 10 times. A dark environment was ensured during the whole measurement, and the light source (300~2500 nm) was provided by a 50 W halogen lamp [15,57].
The second partitions of the soil samples were first air-dried and then their hyperspectral reflectance was measured in the same way described above.
The third partitions of the soil samples were measured for the mass water content according to the weighing method. Then, the soil samples were crushed, and the soil leachate was prepared according to the ratio 1:5 of soil to water, and EC was measured by FE38 electrical conductivity meter (Swiss mettler-Toledo Company). Next, the soil leachate was diluted 20 times to determine concentrations of 4 major cations, i.e., potassium (K+), sodium (Na+), calcium (Ca2+) and magnesium (Mg2+), using an inductive coupling plasma emission spectrometer (ICP-OES).

2.3. Hyperspectral Reflectance Data Preprocessing

To reduce the influence of the spectrometer, environment and other factors on the spectral signal-to-noise ratio, we removed the reflectance of the bands less than 400 nm and greater than 1000 nm and smoothed the spectral curve using the Gaussian smoothing method. The raw reflectance spectra reflectance (RSR) was subjected to the four following pre-processed methods according to the reference [58,59], including (1) first derivative (FD); (2) second derivative (SD); (3) multiplicative scatter correction (MSC); and (4) standard normal variate transform (SNV). These processing methods were achieved in MATLAB 2019 b.

2.4. Theoretical Approach

2.4.1. Description of SSREM

SSREM describes the relationship between soil moisture, salt and soil spectral reflectance [15,21,26,31,51], which can be summarized as,
R ( i ) = R 0 ( i ) e ( a ( i ) SMC b ( i ) SSC )
where, R(i) is the spectral reflectance affected by moisture and salt when the wavelength i as i, and i ranges from 400~1000 nm; R0(i) is the reflectance for wavelength i which is not affected by moisture and salt; SMC is soil mass moisture content, g g−1; SSC is soil EC, dS m−1; a(i) and b(i) are the changing rates of soil spectral reflectance corresponding to band i caused by soil moisture and salt, respectively.
According to Equation (1), the soil moisture contents of any two soil samples (among the 459 data obtained from the second part of the soil samples) affected by moisture and salt are SMC1 and SMC2, and the EC are SSC1 and SSC2, respectively, the corresponding spectral reflectance R1 and R2 (corresponding to values measured from the first part of the soil samples) are as follows:
R 1 ( i ) = R 0 ( i ) e ( a ( i ) SMC 1 b ( i ) SSC 1 )
R 2 ( i ) = R 0 ( i ) e ( a ( i ) SMC 2 b ( i ) SSC 2 )
For the air-dried soil of the above two soil samples, the corresponding spectral reflectance (R3, R4) (corresponding to values measured from the second part of the soil samples) are described as,
R 3 ( i ) = R 0 ( i ) e ( b ( i ) SSC 1 )
R 4 ( i ) = R 0 ( i ) e ( b ( i ) SSC 2 )
Based on Equations (2)–(5), Equations (6) and (7) are obtained:
ln R 1 ( i ) R 2 ( i ) = a ( i ) ( SMC 1 SMC 2 ) b ( i ) ( SSC 1 SSC 2 )
ln R 3 ( i ) R 4 ( i ) = b ( i ) ( SSC 1 SSC 2 )
Through Equations (6) and (7), parameters a(i), b(i) are obtained, which can then be substituted into Equations (2), (3), (4) or (5) to obtain R0(i).

2.4.2. Establishment of MT-SSREM

The MT of soil refers to the critical moisture content which leads to the abrupt change of the relationship between spectral reflectance and SMC. When SMC is less than MT, soil spectral reflectance decreases with an increase of SMC. However, when SMC is larger than MT, soil spectral reflectance changes to increasing with an increase of SMC [13,24,60]. Therefore, the SMC value corresponding to the minimum reflectance is the MT value. The MT value varies with the wavelength, soil type, soil porosity and other factors. Therefore, we need to provide the specific MT for each band. If the function between the reflectance of band i and SMC is f ( x ) , MT(i) can be determined as follows,
f ( i ) ( x 0 ) = 0 ,   MT ( i ) = x 0
where, f ( i ) ( x 0 ) is the derivative of the f ( x ) ( f ( i )   ( x 0 )   is derivable in the range of SMCmin and SMCmax), x 0 is the extremum point, g g−1.
Liu et al. [24] found that when SMC exceeded MT, the inversion accuracy of SMC decreased. It indicated that the role of MT on the spectrum of saline soil could not be ignored. The role of SMC in the exponential model was modified as follows:
R ( i ) = { R 0 ( i ) e ( a ( i ) SMC b ( i ) SSC )   SMC < MT ( i )   ( 400 i 1000 ) R 0 ( i ) e ( a ( i ) MT ( i ) b ( i ) SSC )   SMC MT ( i )   ( 400 i 1000 )

2.5. Research Framework

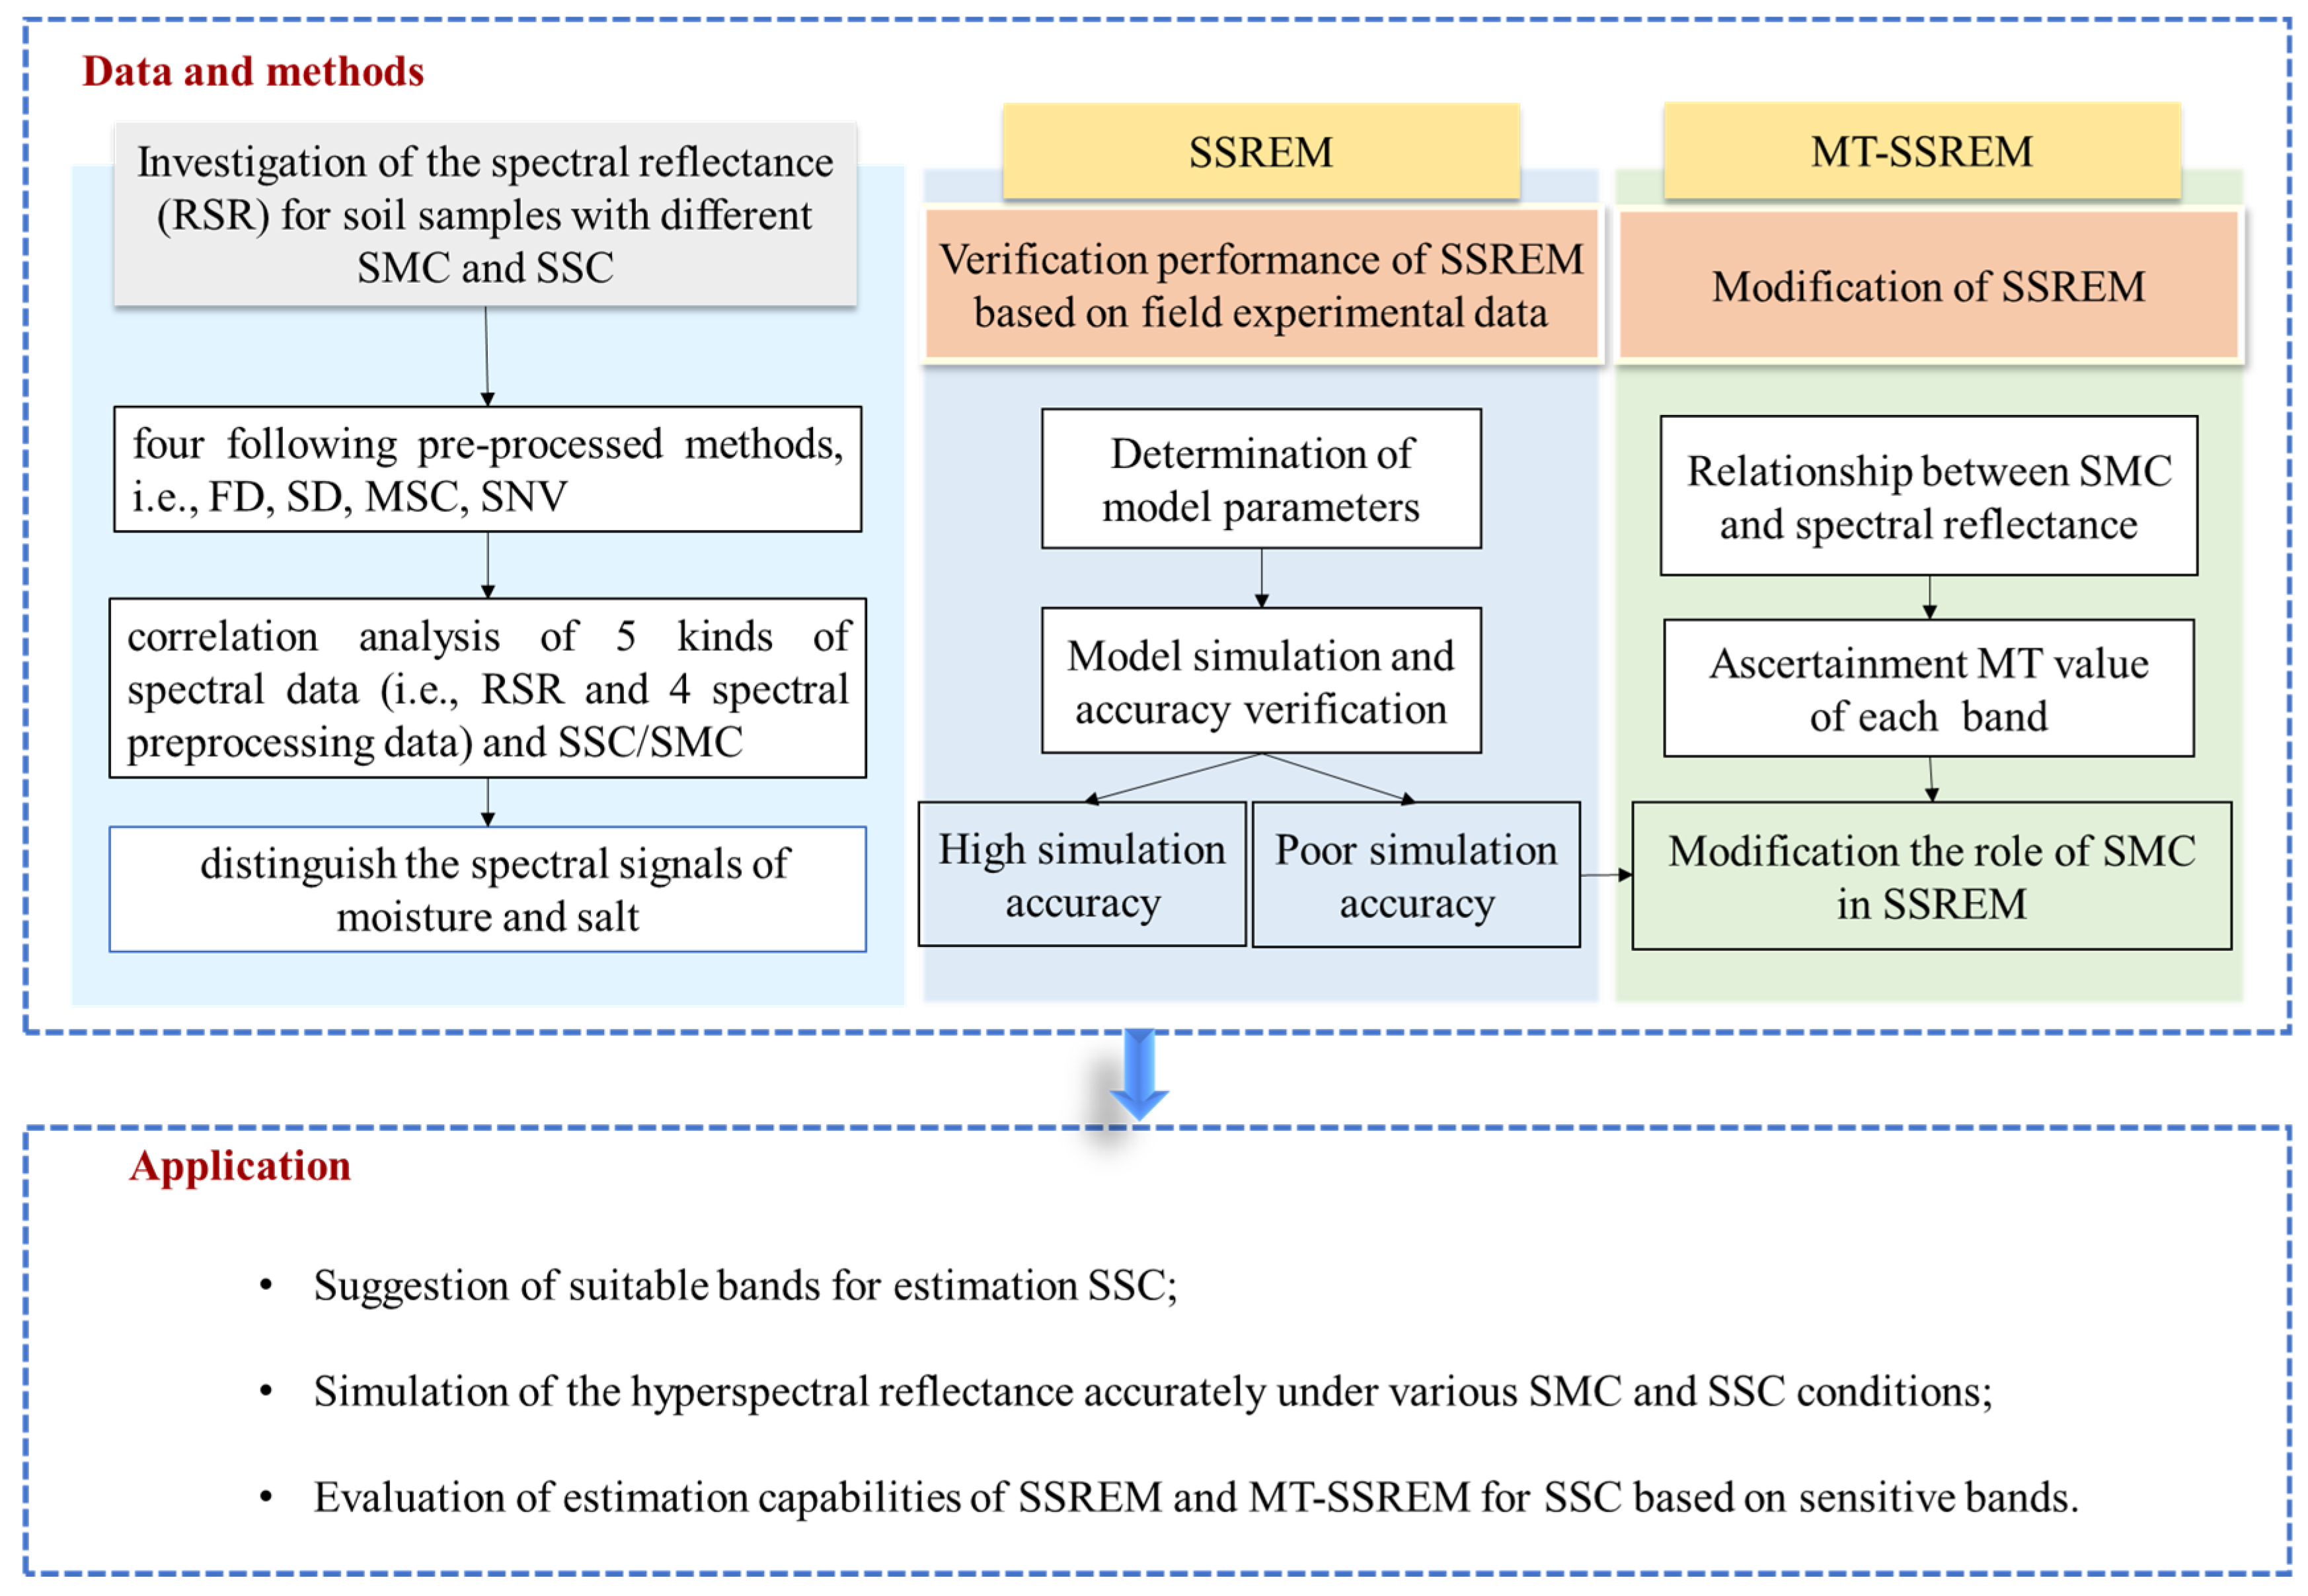
The framework of this research includes six parts (Figure 2): (1) Investigation of the spectral reflectance for soil samples with different SMC and SSC and determination of MT based on the relationship between reflectance and SMC. (2) Verification of SSREM based on the saline soil samples. (3) Modification of SSREM by adjusting the role of SMC in SSREM according to MT value. (4) Suggestion of suitable bands for estimating SSC. (5) Comparison of the simulation accuracy of SSREM and MT-SSREM for the spectral reflectance of saline soil under different SSC and SMC conditions. (6) Evaluation of estimation capabilities of SSREM and MT-SSREM for SSC based on sensitive bands.

2.6. Model Calibration and Validation

The 459 samples were split into two independent datasets in the ratio of 3:2 randomly, one as the calibration dataset (including 276 samples) and the other as the validation dataset (including 183 samples). In terms of calibration dataset, we randomly split the 276 samples into two parts of equal size and averaged the four kinds of data from each part, i.e., SMC, SSC (from the third partition of the soil samples), hyperspectral reflectance of wet soil (from the first partition of the soil samples) and dry soil (from the second partition of the soil samples), to obtain the parameters of SSREM and MT-SSREM, the workflow of splitting process is shown in Figure 3.
Coefficient of determination (R2), root mean square error (RMSE) and SD were used to quantify the prediction accuracy of the models
R 2 = [ i = 400 1000 ( R ( i ) R ( i ¯ ) ( R ( i ) R ( i ) ¯ ] 2 i = 400 1000 ( R ( i ) R ( i ¯ ) 2 ( R ( i ) R ( i ) ¯ ) 2
RMSE = i = 400 i = 1000 ( R ( i ) R ( i ) ) 2 601
SD = i = 400 1000 ( R ( i ) R ( i ) ¯ ) 2 601
where, R ( i ) is the spectral reflectance of band i simulated by the model, R ( i ) ¯ is the average spectral reflectance simulated by the model, R(i) is the spectral reflectance of band i of measured by spectrometer; R ( i ) ¯ is the average spectral reflectance of measured soil.

3. Results

3.1. SMC, SSC and Major Cation Concentrations

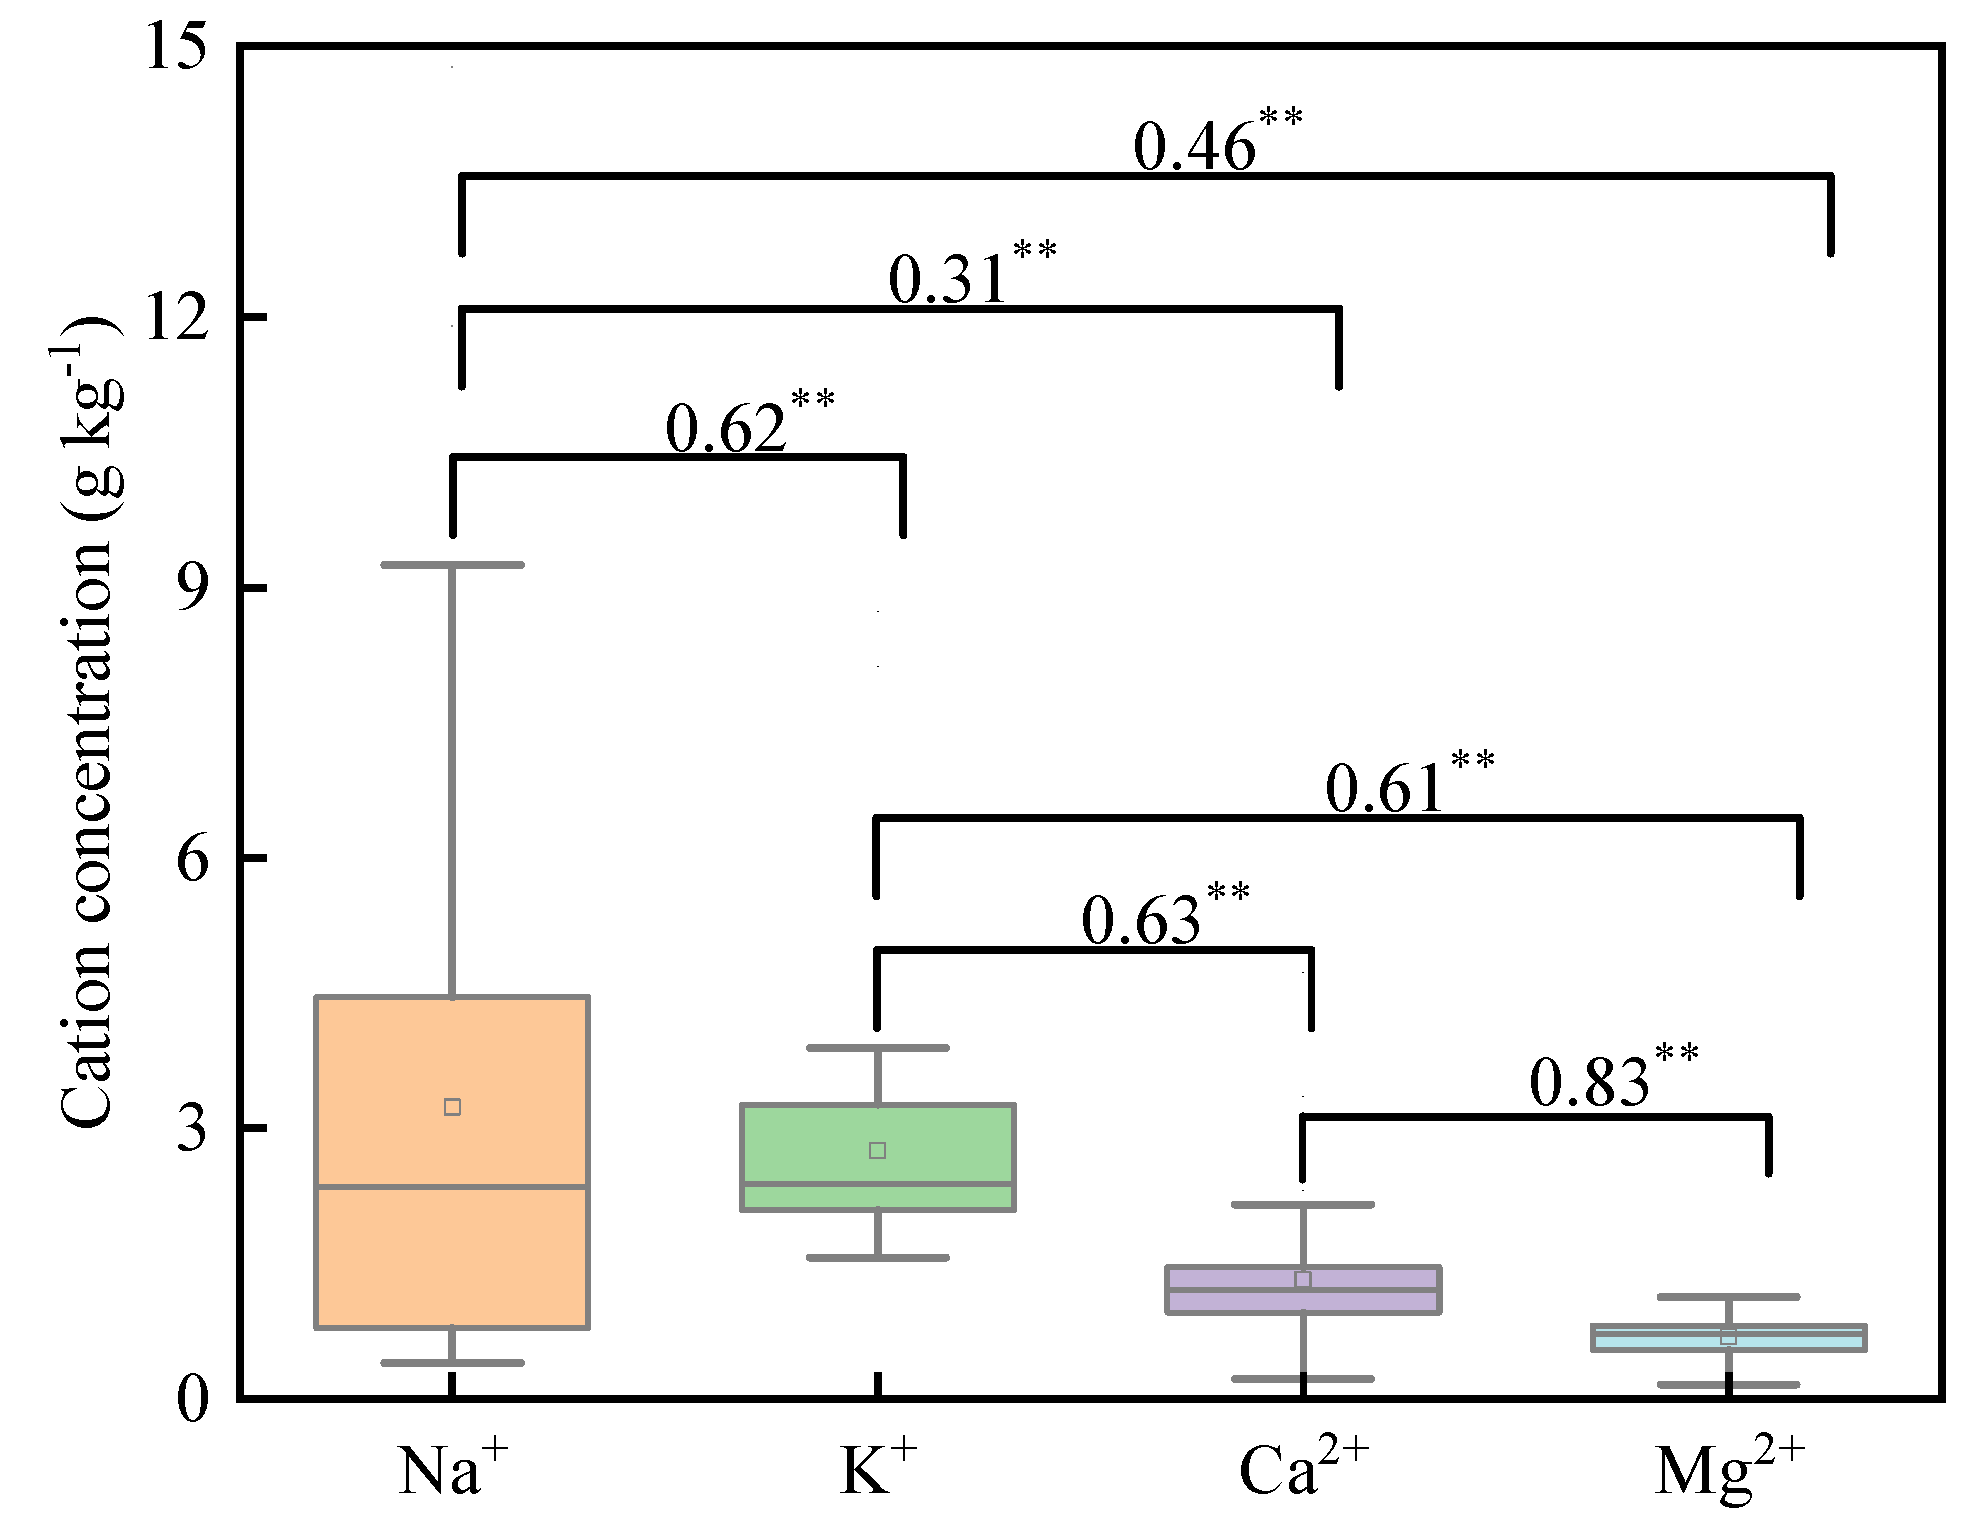
The statistics of SMC, SSC and the four cation concentrations are shown in Table 2 and Figure 4. With respect to SMC, the SMC of calibration dataset and validation dataset range from 0.05 to 0.27 and 0.07 to 0.29 g g−1, with SDs of 0.048 and 0.052 g g−1, respectively. Furthermore, the SSC of the calibration dataset and validation dataset range from 0.10 to 2.84 and 0.095 to 3.29 dS m−1, respectively. We also tested concentration and correlation among four cations in the samples. The experimental field was irrigated by brackish water, which was prepared by mixing local deep groundwater with NaCl. As a result, the soil samples were rich in NaCl and KCl. The concentrations of the four cations follow the order of Na+, K+, Ca2+, and Mg2+. The four cations showed significant correlations, especially for Ca2+ and Mg2+, with the correlation coefficient above 0.80.

3.2. Soil Hyperspectral Reflectance at Different SSC Levels

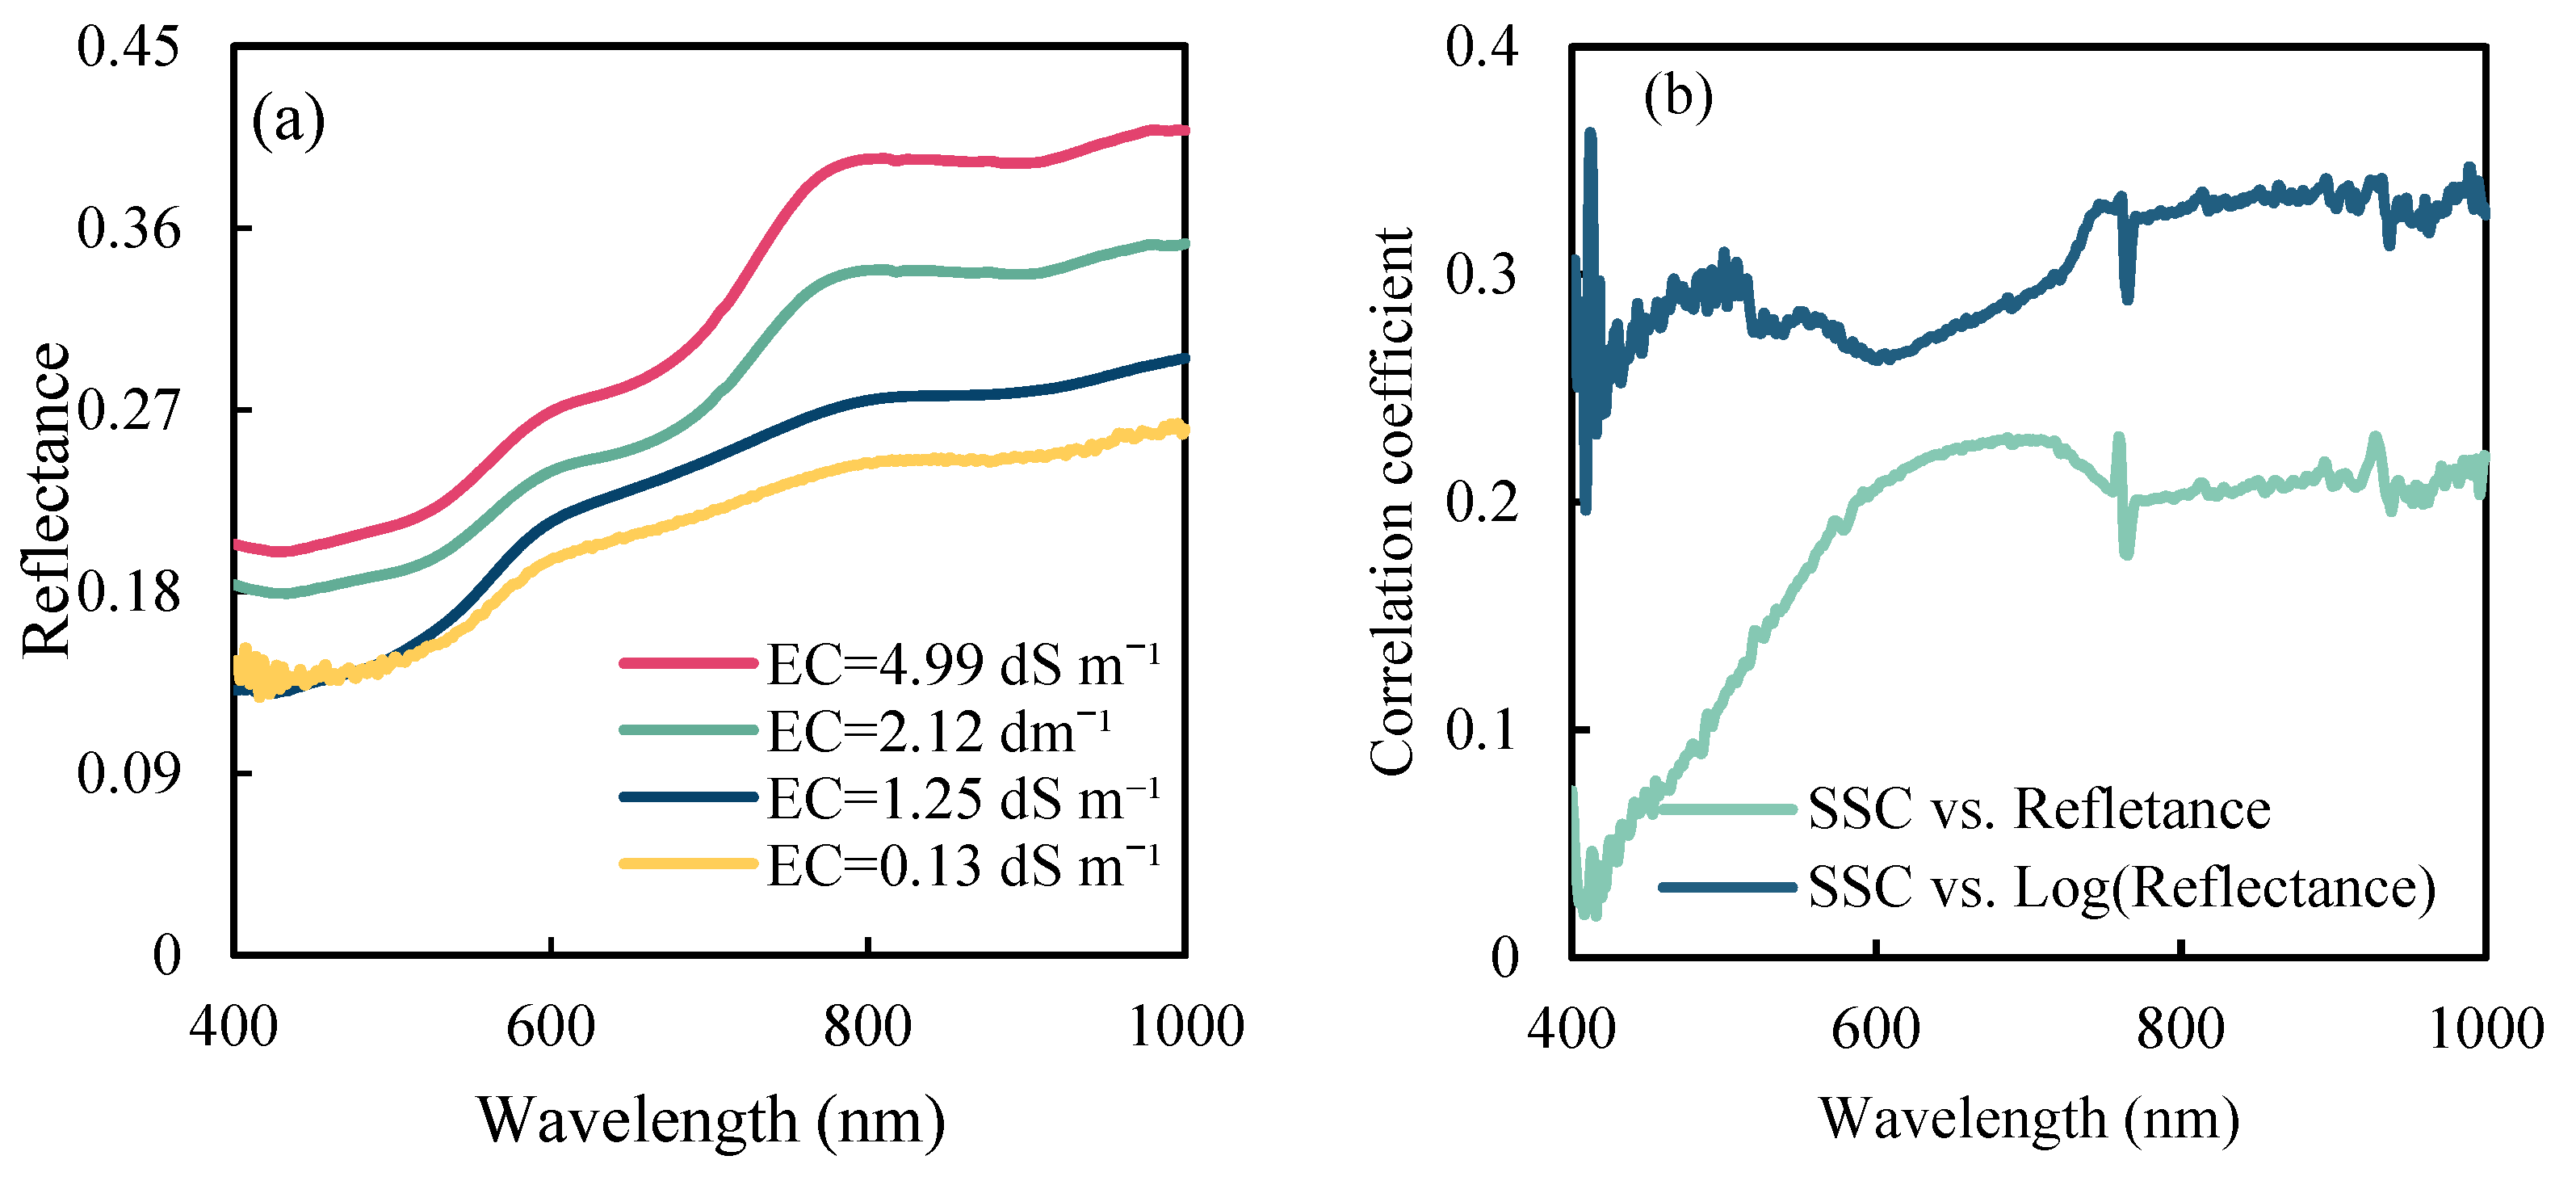
Figure 5 depicts the reflectance curves of wet soil samples with various SSCs corresponding to the same SMC. The shape of each soil sample’s spectral curve is similar, but the values vary. The spectral reflectance of all SSC conditions increases from 400 to 1000 nm. However, it is less sensitive to the changes of SSC in the visible bands (<760 nm) compared with the near infrared (NIR) bands (>760 nm). Notably, spectral reflectance positively correlates with SSC (Figure 5a), and the correlation coefficient between the spectral reflectance and SSC for each band is greater than 0 (Figure 5b). Therefore, it indicates there is no threshold like MT for SSC as there is for SMC. Figure 5a shows that the lower SSC samples have more noise compared with the other samples in visible region under the same SMC level. It may be due to the fact that SMC had greater influence on soil spectral reflectance than SSC. According to SSREMs formula (Equation (1)), the correlation coefficient between logarithm of reflectance and SSC of each wavelength was also calculated; the results are presented in Figure 5b. It is apparent that the correlation between the logarithm of reflectance (log(Reflectance)) and SSC is stronger than the reflectance. In this regard, the result reveals that by the logarithm of reflectance, the noise could be generally reduced.

3.3. Soil Hyperspectral Reflectance at Different SMC Levels

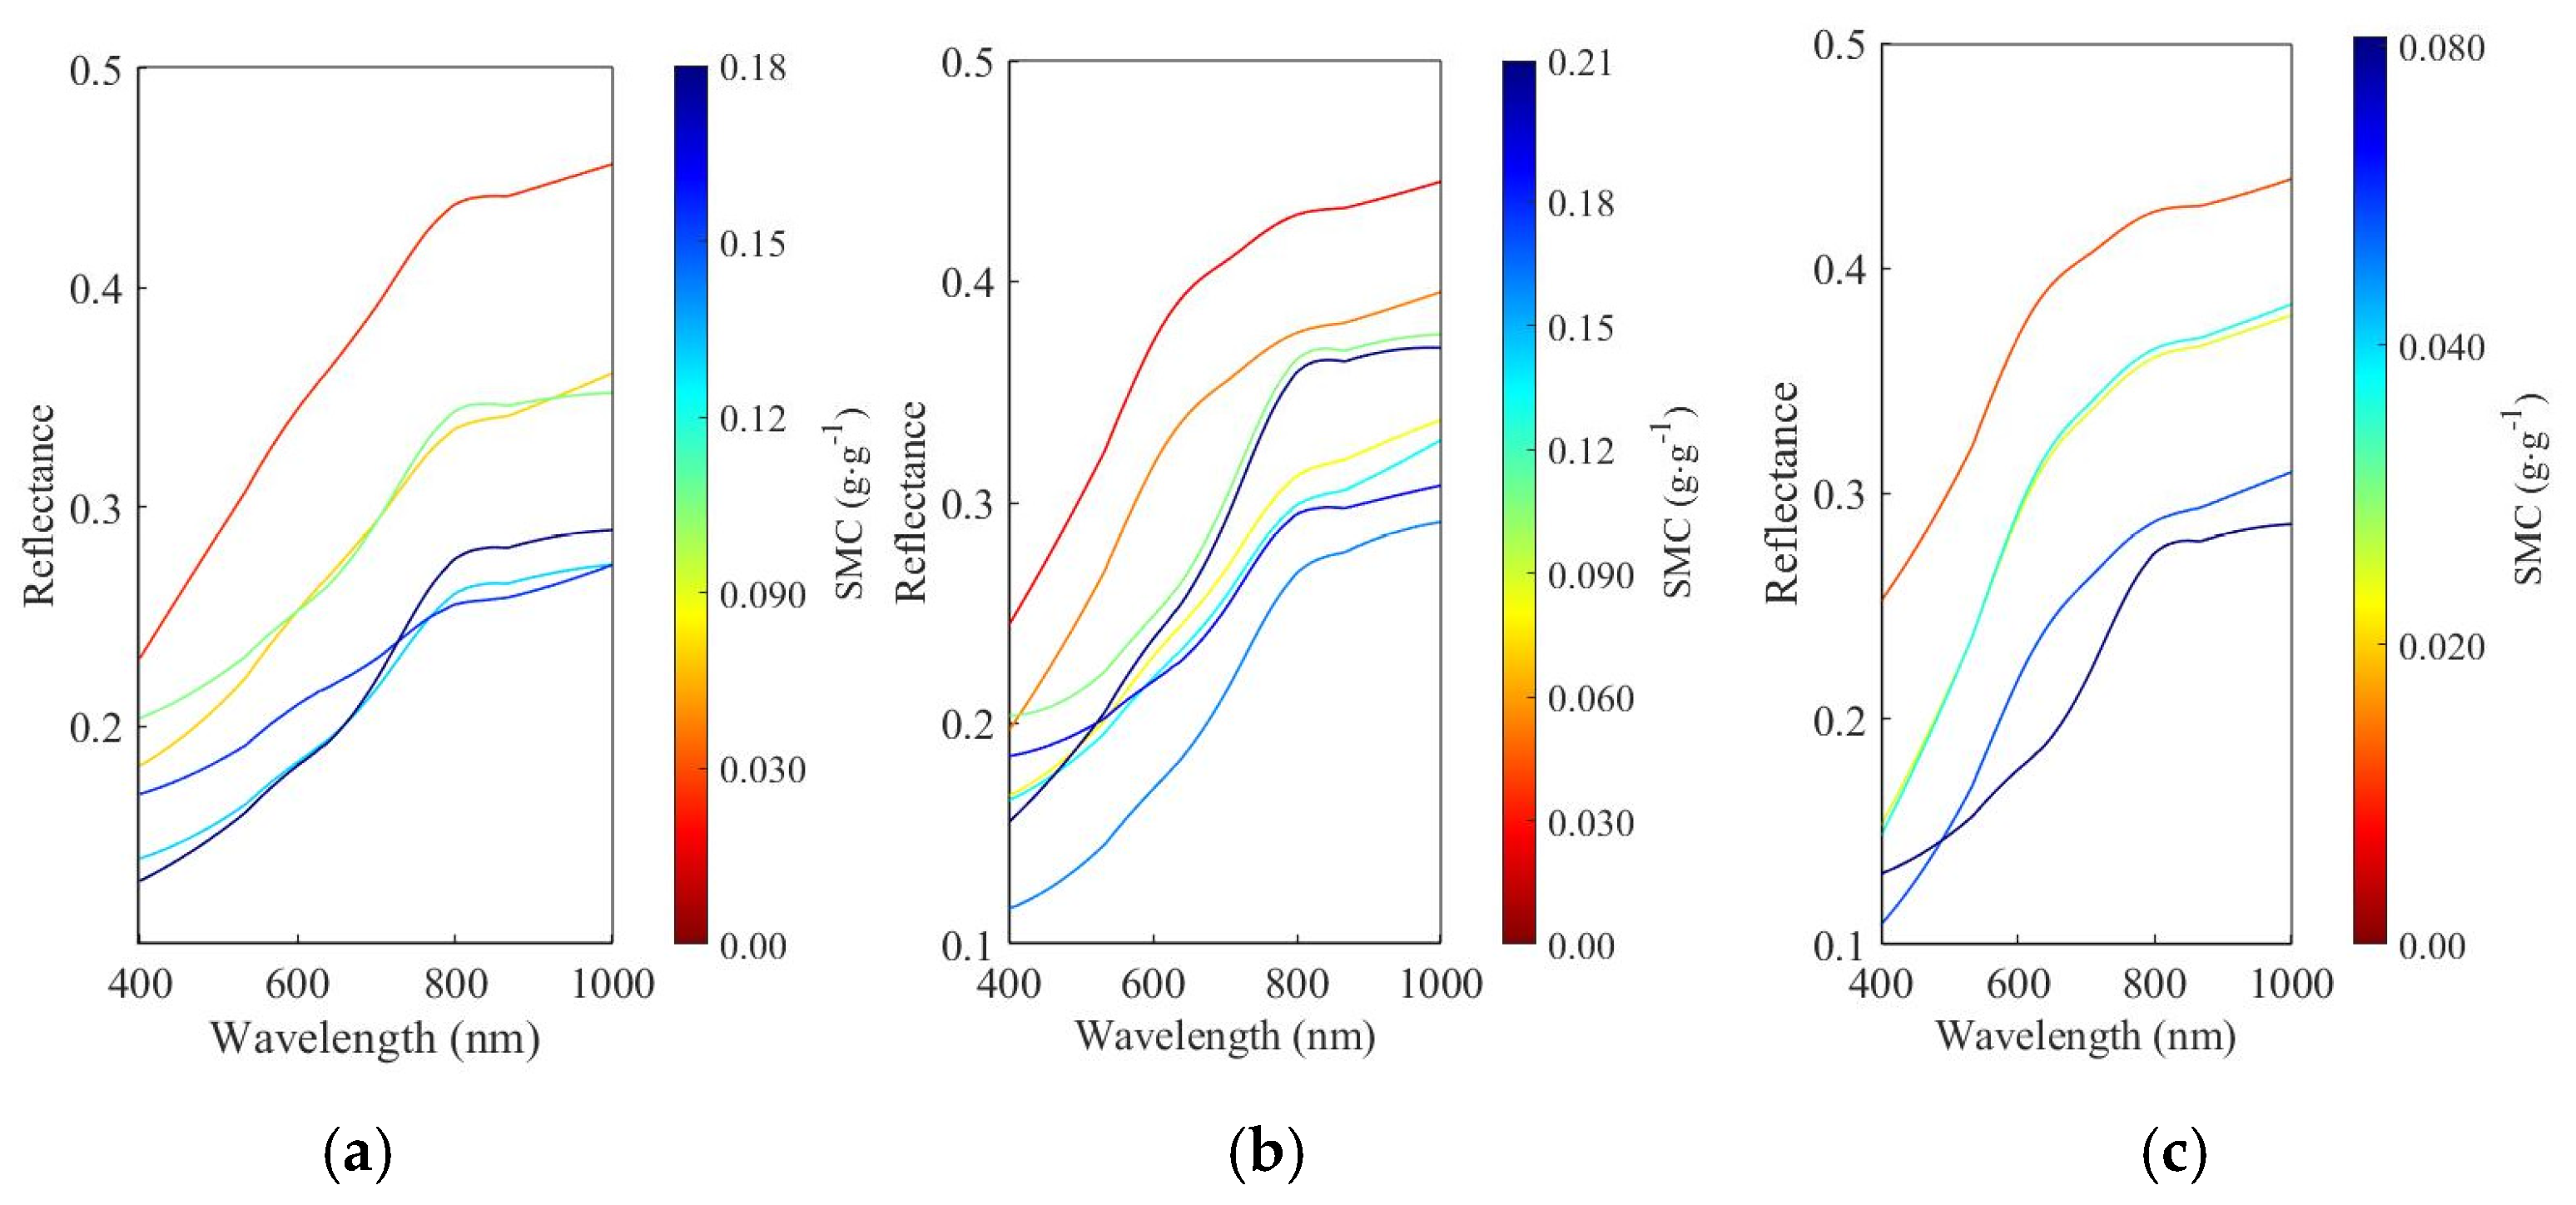
Similarly, the influence of SMC on soil spectral curves with controlled SSC is shown in Figure 6. The reflectance of air-dried soil is significantly higher than that of wet soil, and the spectral curves show similar shapes at different SMC levels, with some of them intersecting. For the soil samples with an EC of 0.15 dS m−1, reflectance in visible bands is generally negatively correlated with SMC, and the reflectance in NIR bands decreases at first and then increases with the increase of SMC, with the turning point at 0.15 g g−1 for 750 nm (Figure 6a). For the soil samples with an EC of 0.5 dS m−1, the reflectance decreases at first and then increases with an increase of SMC, with a turning point at 0.089 g g−1 for 400~532 nm and 0.12 g g−1 for 533~1000 nm, shown in Figure 6b. With respect to EC of 1.6 dS m−1, the spectral reflectance decreases first and then increases for 400~500 nm, with a turning point at 0.14 g g−1 for 500 nm, while the spectral reflectance decreases with an increase of SMC for 500~1000 nm.

3.4. Suitable Bands for Estimating SSC

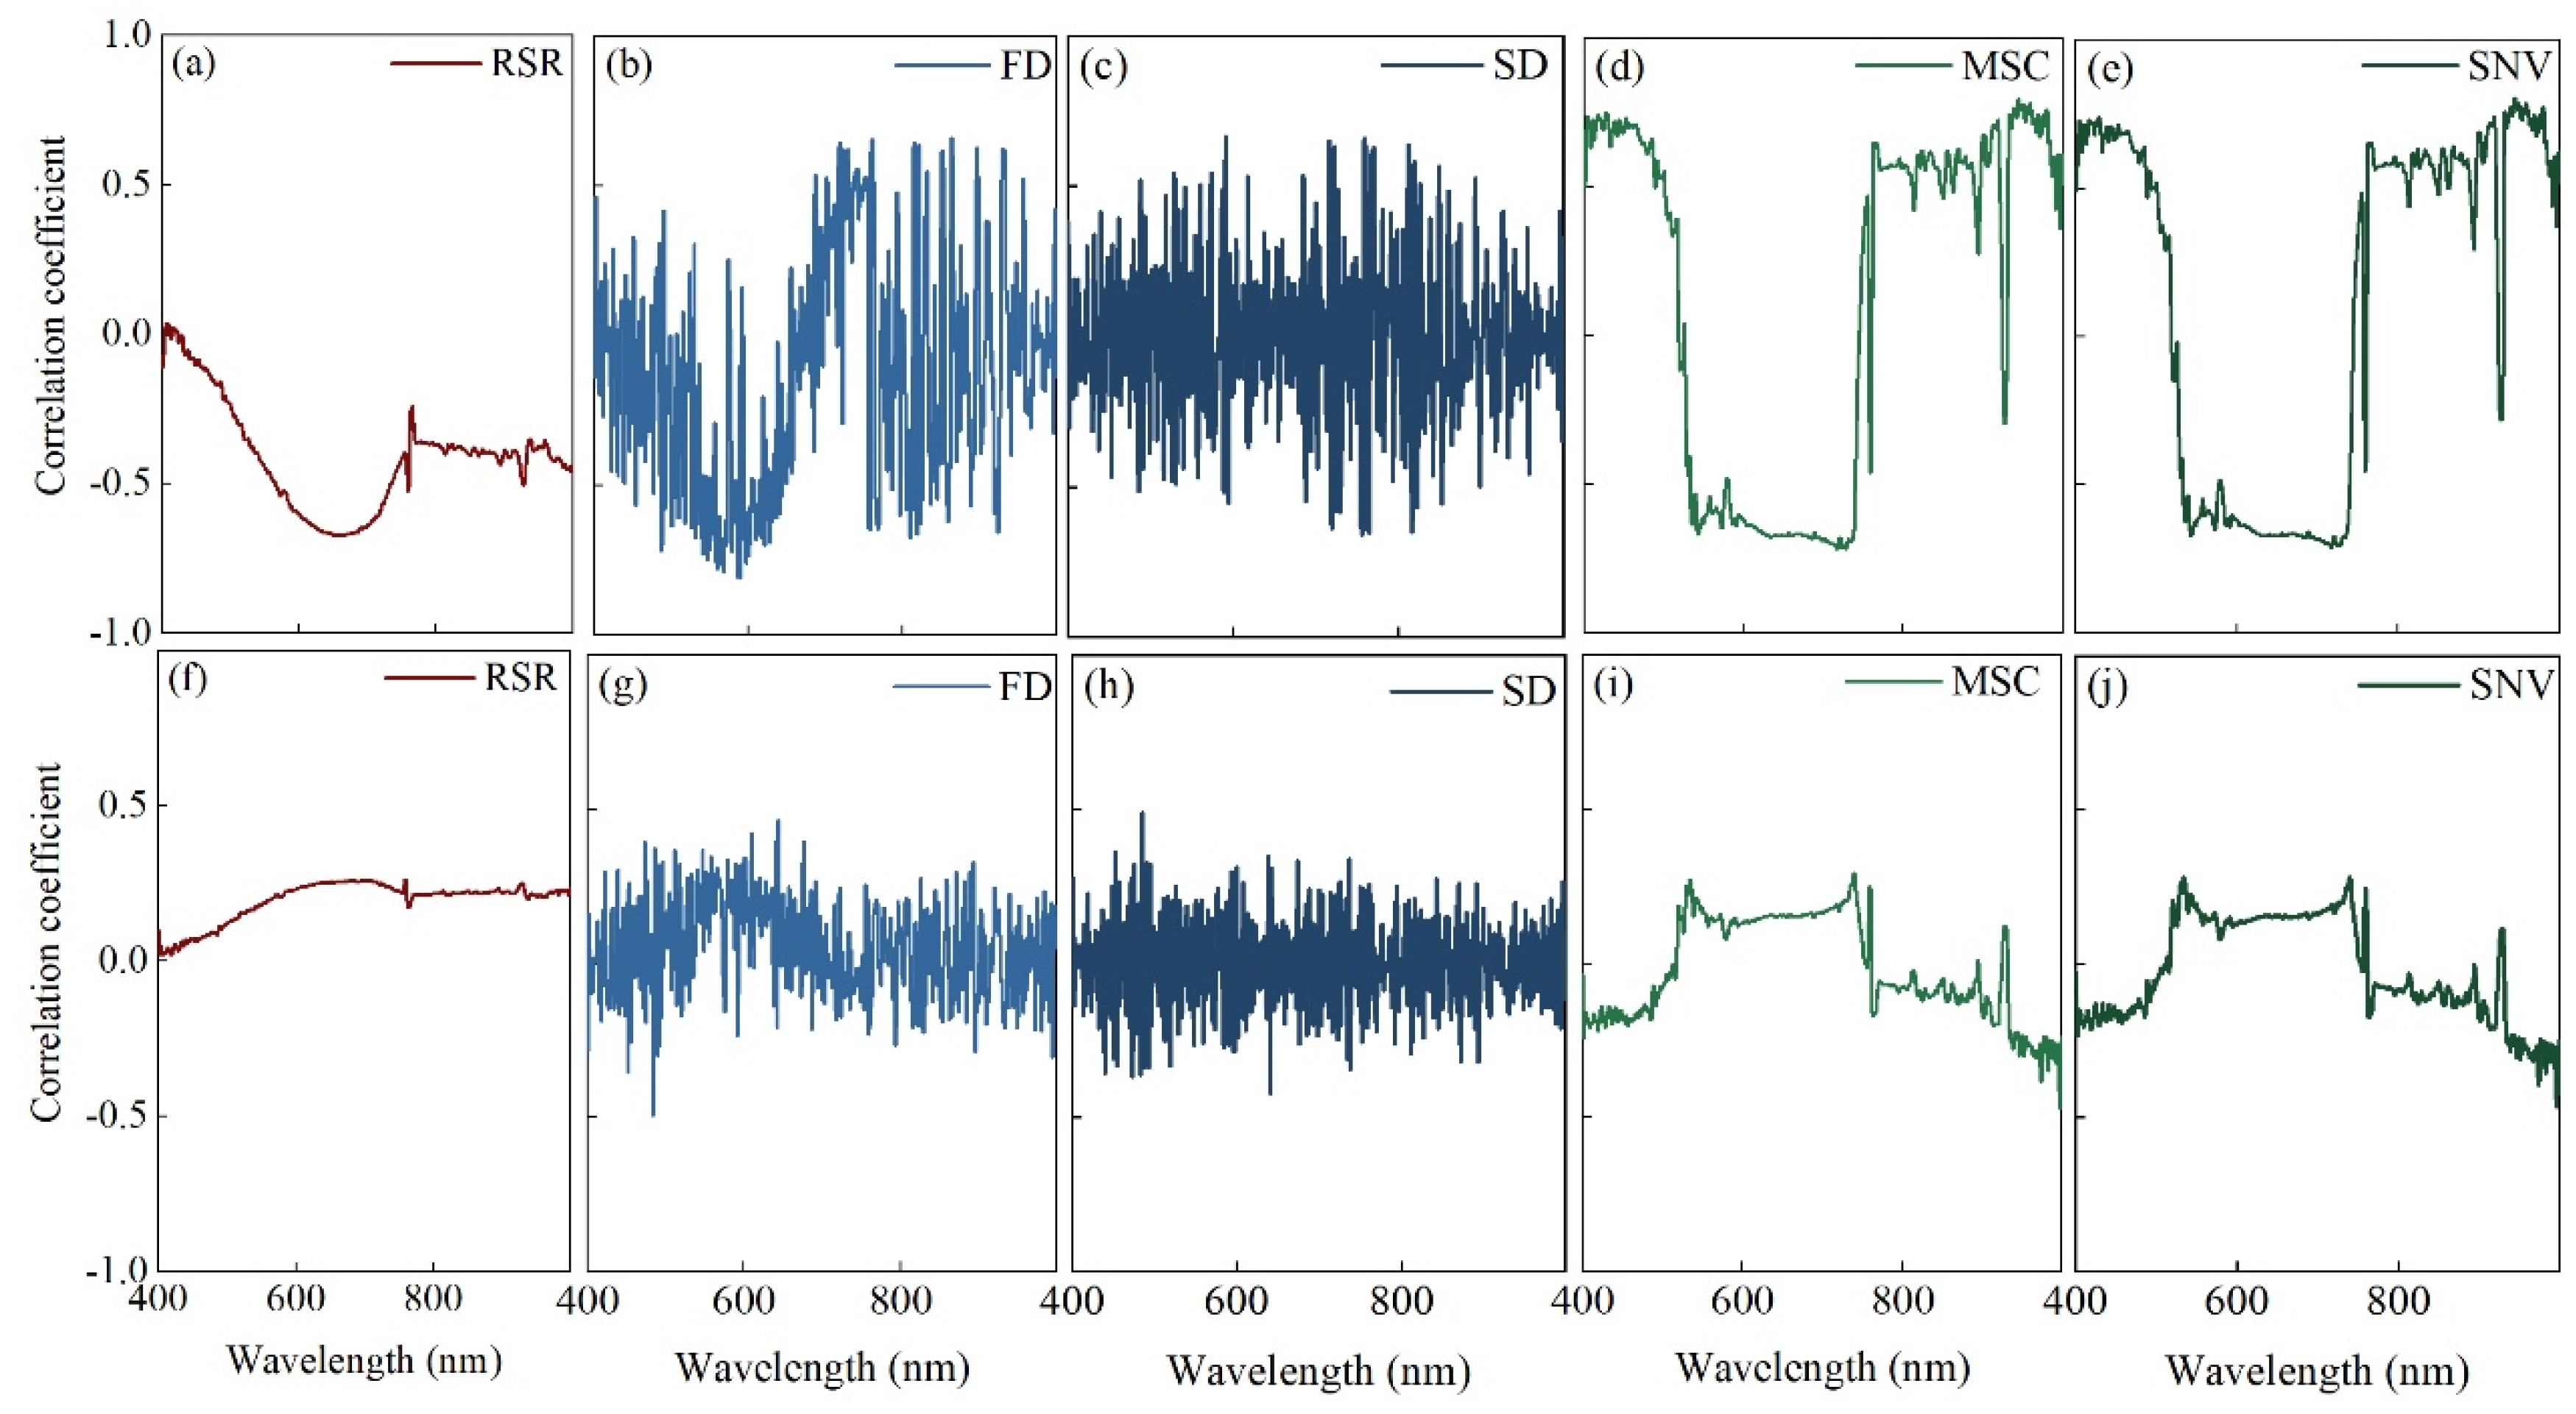
To select wavelengths with the spectral reflectance sensitive to SSC but not sensitive to SMC among the 601 hyperspectral wavelengths, correlation analysis of five kinds of spectral data (i.e., RSR and four spectral preprocessing data) and SSC was conducted, with the result shown in Figure 7a–e. Compared with RSR, preprocessing methods could improve the correlation between SMC and spectral data at some wavelengths. We selected sensitive wavelengths to SCC, by averaging and ranking the absolute values of five kinds of correlation coefficients and then selecting the top 100 bands. Finally, the selected wavelengths appear in 640~660 nm, 671~728 nm and 938~961 nm. In terms of SMC, we used the same method by considering correlation coefficient values (Figure 7f–j) to determine its sensitive wavelengths, which are in 628~658, 685~735 and 940~960 nm.
The result supported that both the sensitive wavelengths of SMC and SSC could be the same, i.e., 640~658 nm, 685~728 nm and 940~960 nm. It is necessary to distinguish the spectral signals of moisture and salt. Therefore, we suggest 658~660 nm, 672~685 nm, 938 nm, 939 nm and 961 nm for SSC estimation.

3.5. Determination of MT Based on the Relationship between Reflectance and SMC

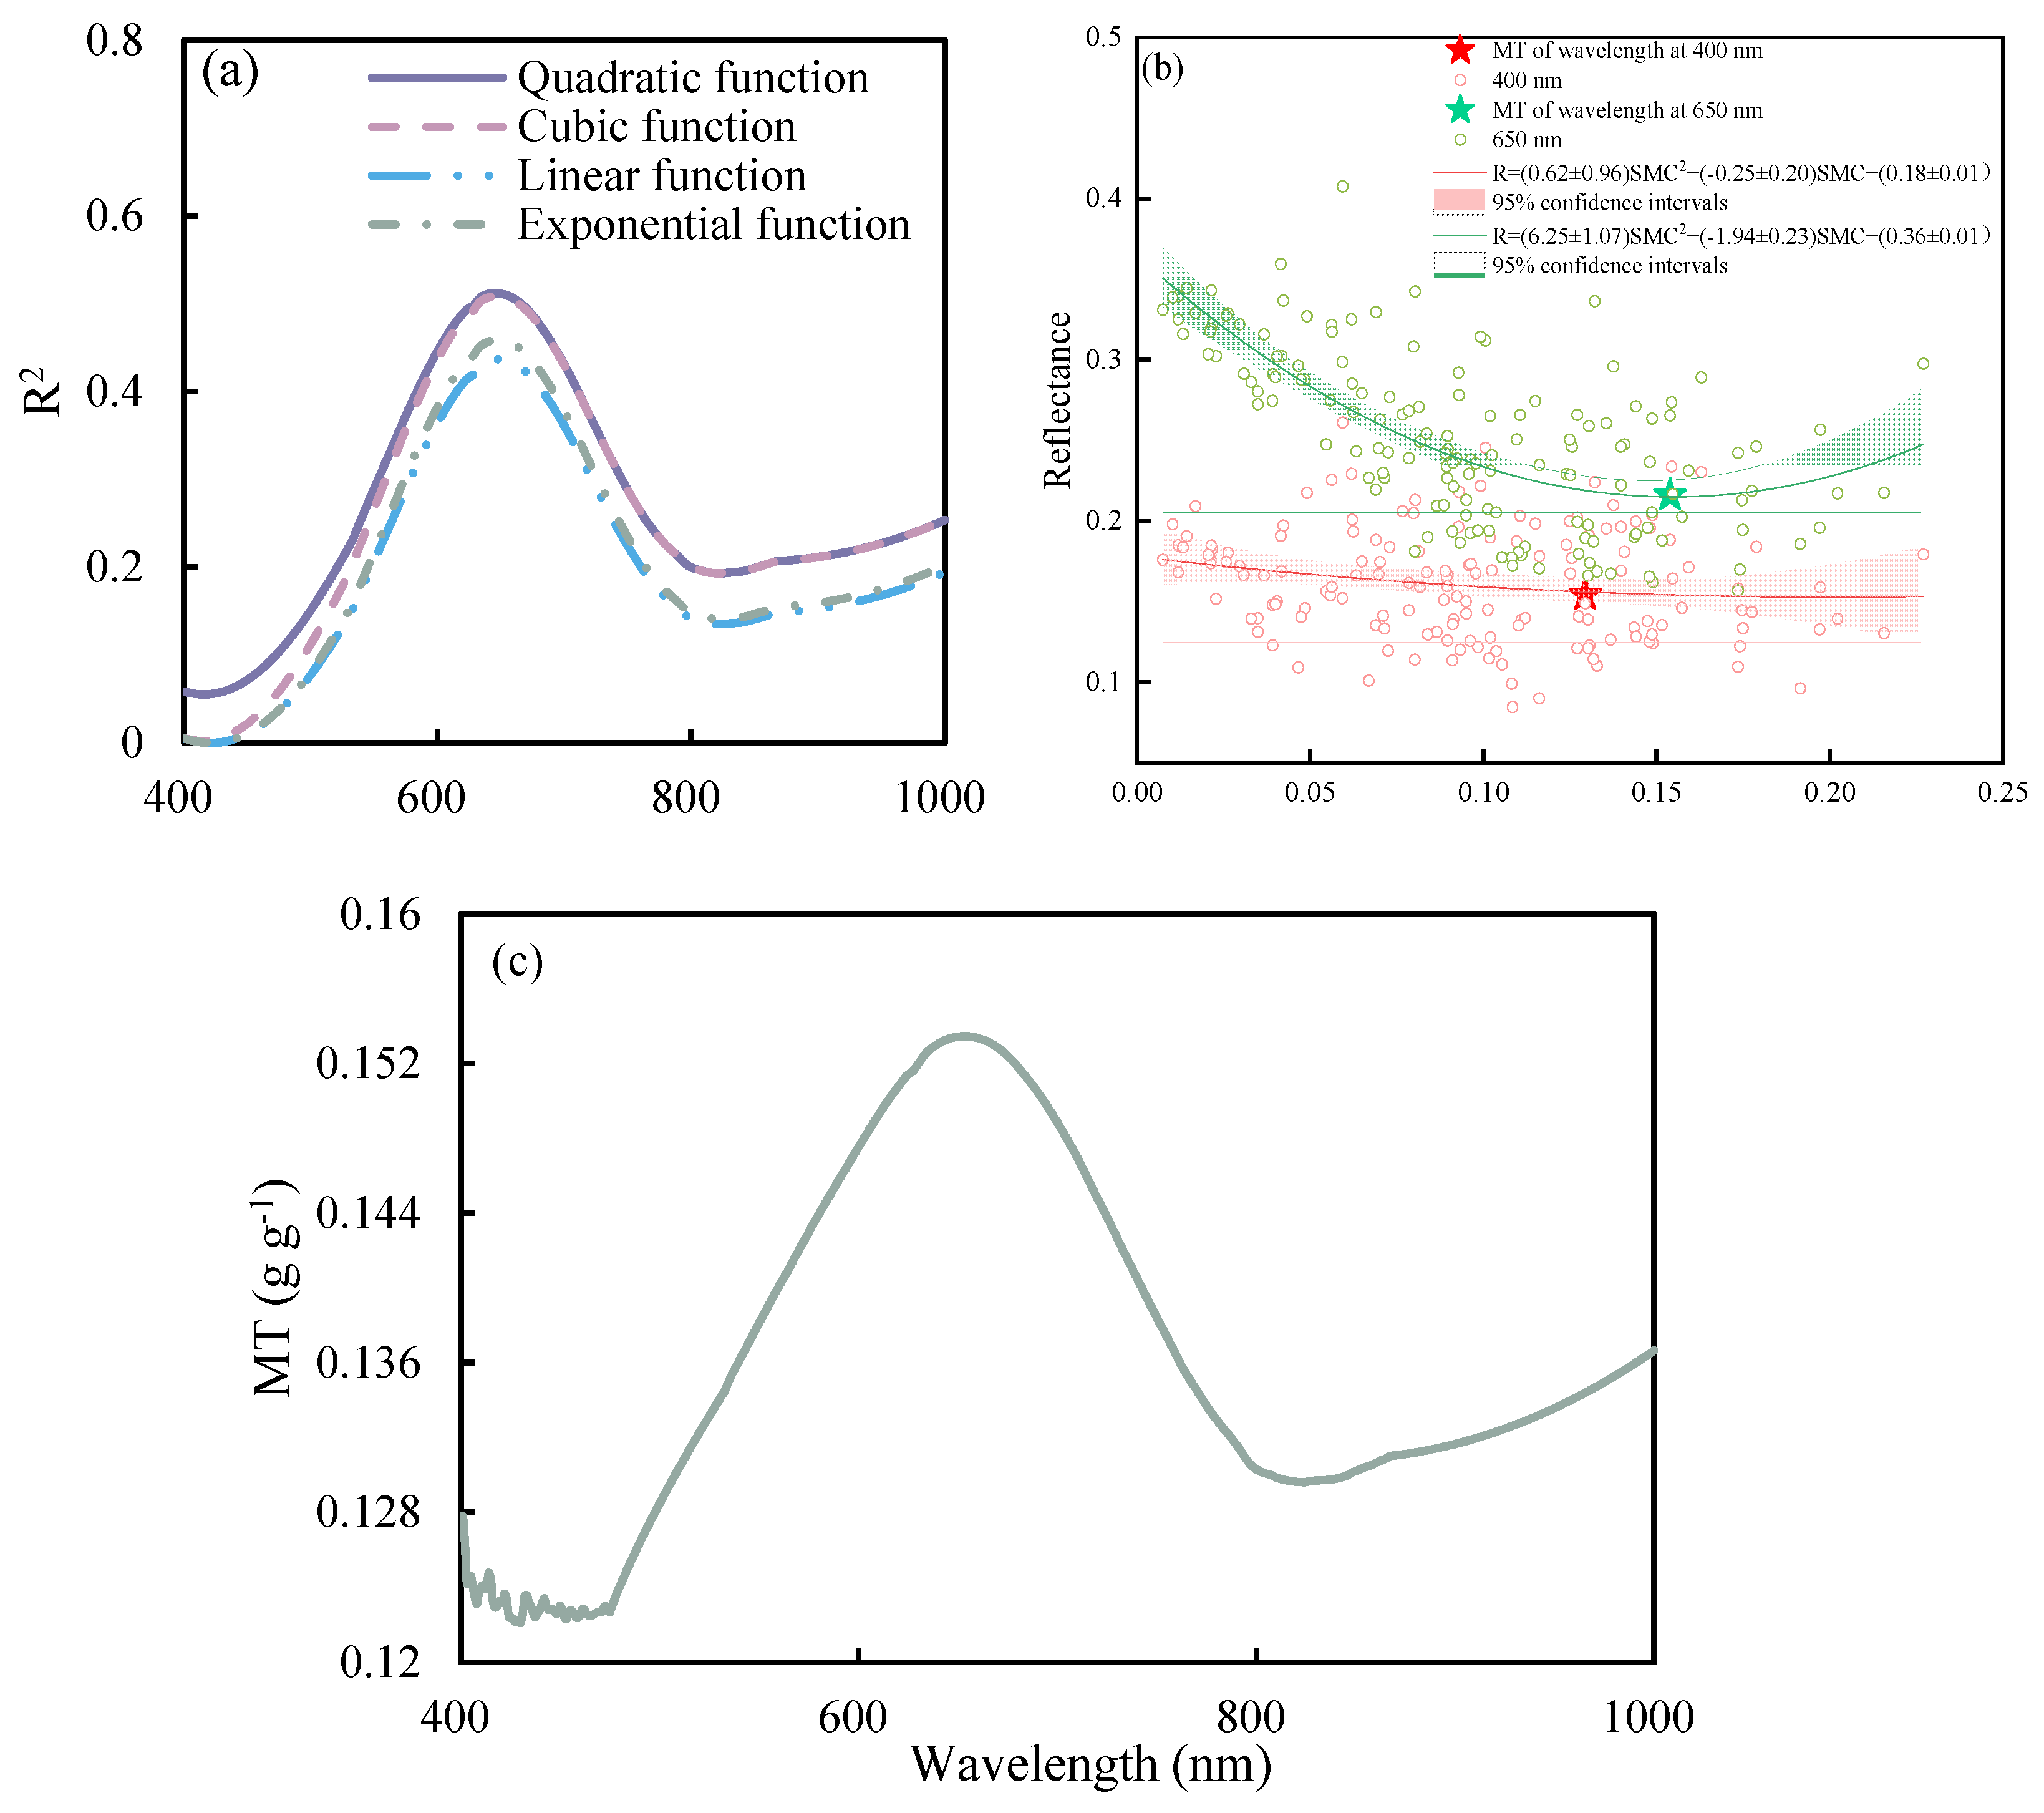
To further quantify the relationship between SMC and soil spectral reflectance, we obtained 601 scatter plots of SMC and reflectance for each single band and used different functions to describe the relationship between spectral reflectance and SMC. Results are shown in Figure 8a. The R2 values of quadratic and cubic functions are higher than those of linear and exponential equations. Besides, because the linear and exponential functions are monotonic functions, they are unable to depict the impact of MT on spectral reflectance. Therefore, quadratic and cubic functions are more suitable to be used. The R2 values of these two functions are similar for the spectral range of 600 to 1000 nm, while R2 by quadratic functions are higher than cubic functions for 400~600 nm. Therefore, we used quadratic functions to quantify the relationship between spectral reflectance and SMC. With an example of wavelength at 400 and 650 nm, as in Figure 8b, the spectral reflectance quadratically correlated with SMC and the SMCs of minimum reflectance in the curve at 400 nm and 600 nm are 0.12 and 0.15 g g−1, respectively.
Based on the fitted quadratic function between the spectral reflectance and SMC of each band, the extremum point (the minimum point) was calculated, which represented the MT value. Figure 8c shows that within 475~830 nm, the MT value fluctuates greatly with the wavelength, with the maximum MT value reaching 0.15 g g−1 at 660 nm and the minimum 0.12 g g−1 at 475 nm. The shape of R2 (Figure 8a) and MT (Figure 8b) curves are similar and the R2 and MT values peak in the range of 600~715 nm.

3.6. Evaluation of Model Performance

3.6.1. Model Parameters

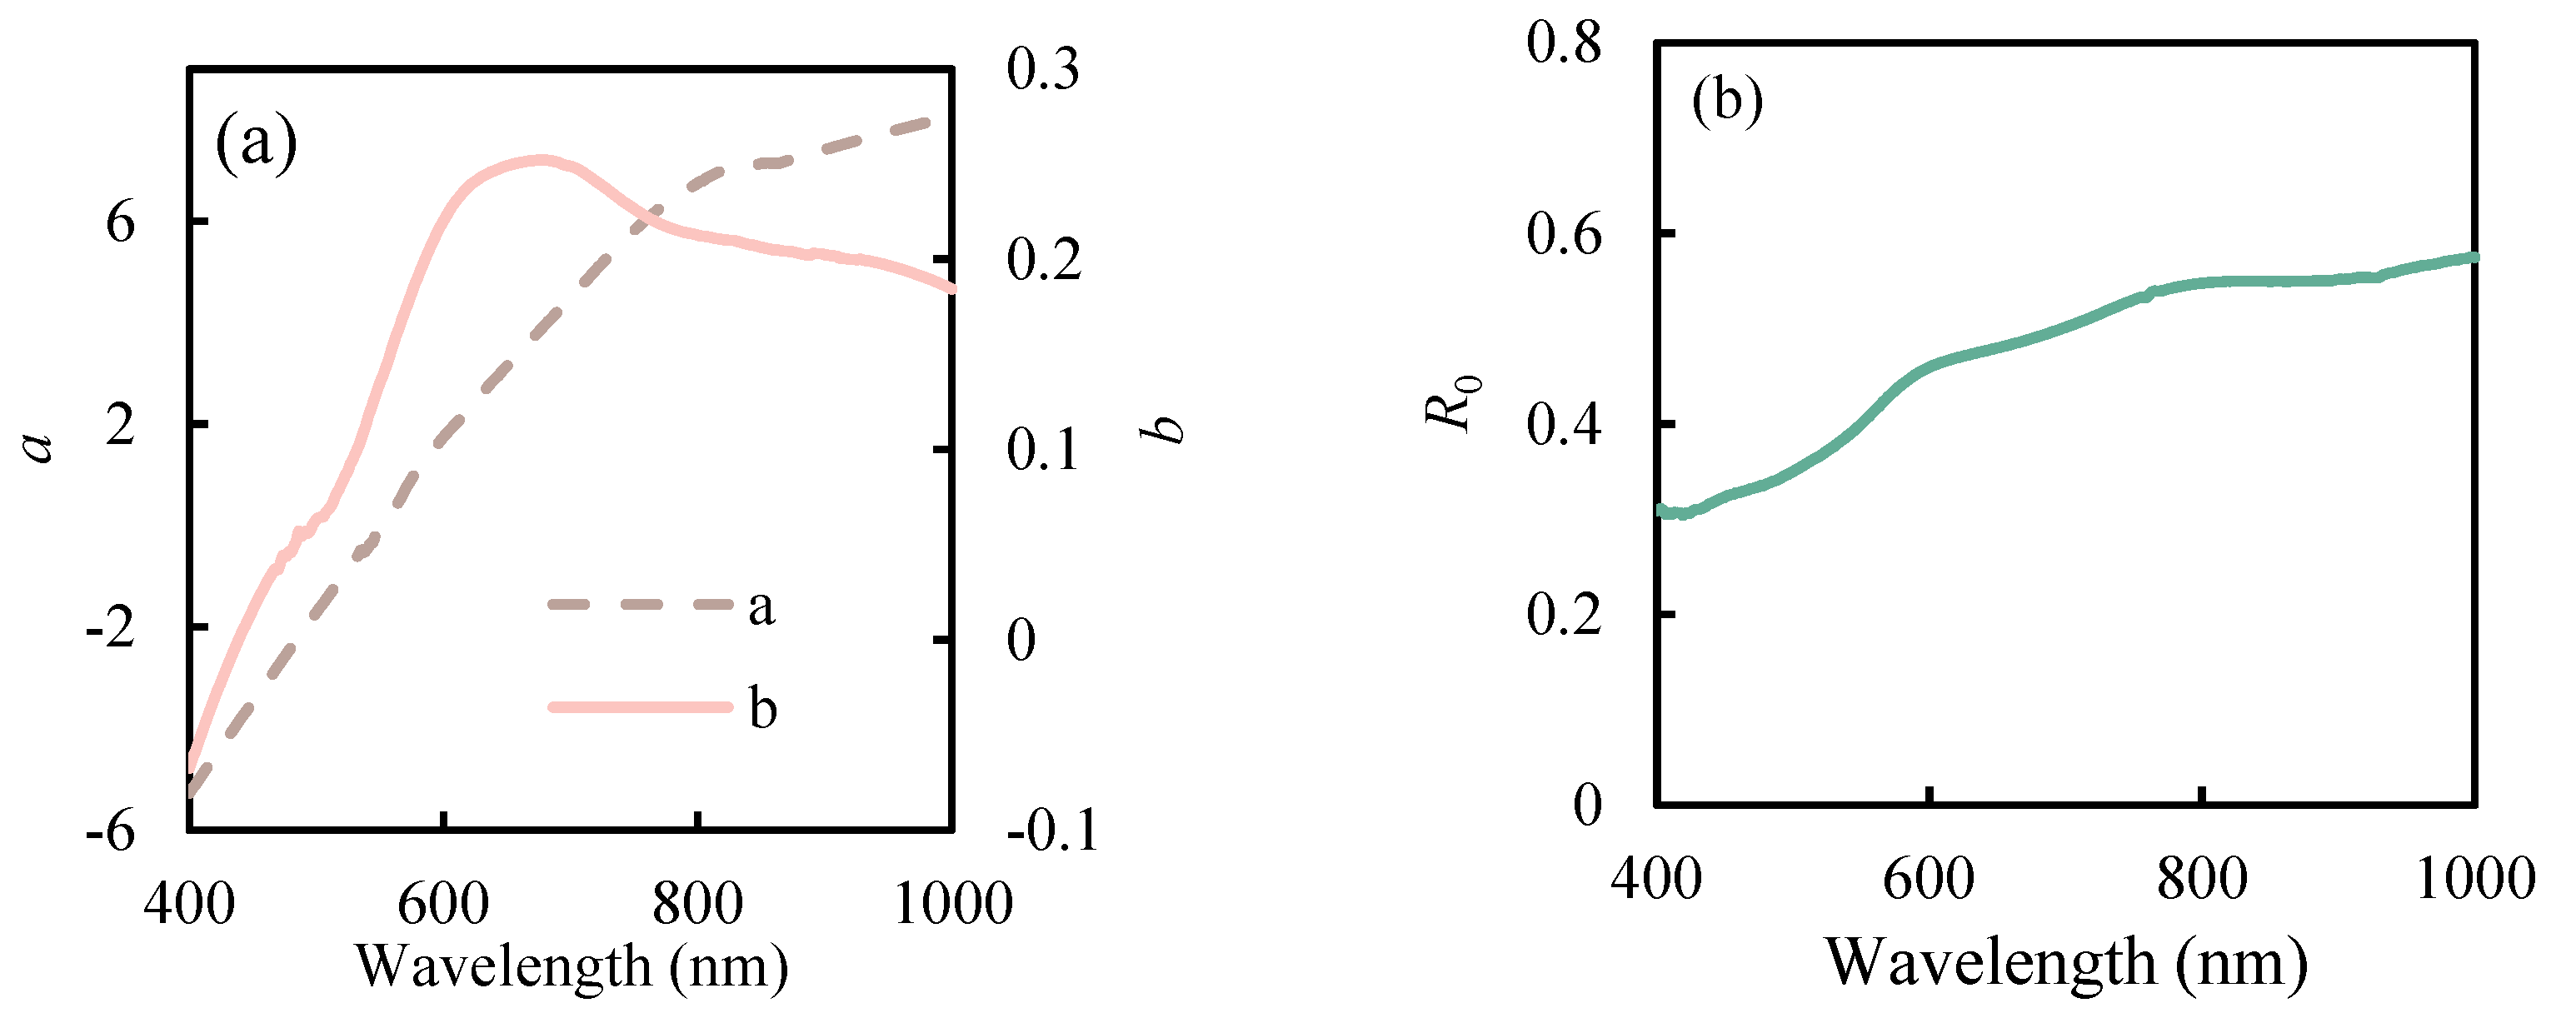
The parameters a, b and R0 of the models (SSREM and MT-SSREM) were obtained based on average reflectance for wet (i.e., R 1 ¯ , SMC 1 ¯ , SSC 1 ¯ , R 2 ¯ , SMC 2 ¯ and SSC 2 ¯ as shown in Figure 3) and air-dried (i.e.,   R 3 ¯ ,   SSC 1 ¯ , R 4 ¯ and SSC 2 ¯ ) soils, and the results are shown in Figure 9. The value of parameter a varies in the range of −5.27 to 8.07. It increases with the wavelength following a logarithmic function, with a negative value for the wavelength smaller than 534 nm and a positive value for the wavelength larger than 534 nm (Figure 9a). Parameter b varies in the range of −0.068 to 0.25, which first increases and then decreases with wavelength. It is negative when the wavelength is in the range of 400~421 nm, and positive for wavelengths greater than 421 nm. SMC exerts greater influence on spectral reflectance than SSC because the absolute value of parameter a was larger than that of parameter b at the same wavelength. Using a similar method, the parameter R0 was determined for each band in the range of 400~1000 nm (Figure 9b). The R0 values show an increasing trend in the whole wavelength, and the maximum spectral reflectance is 0.58 at 1000 nm.

3.6.2. Results of the SSREM

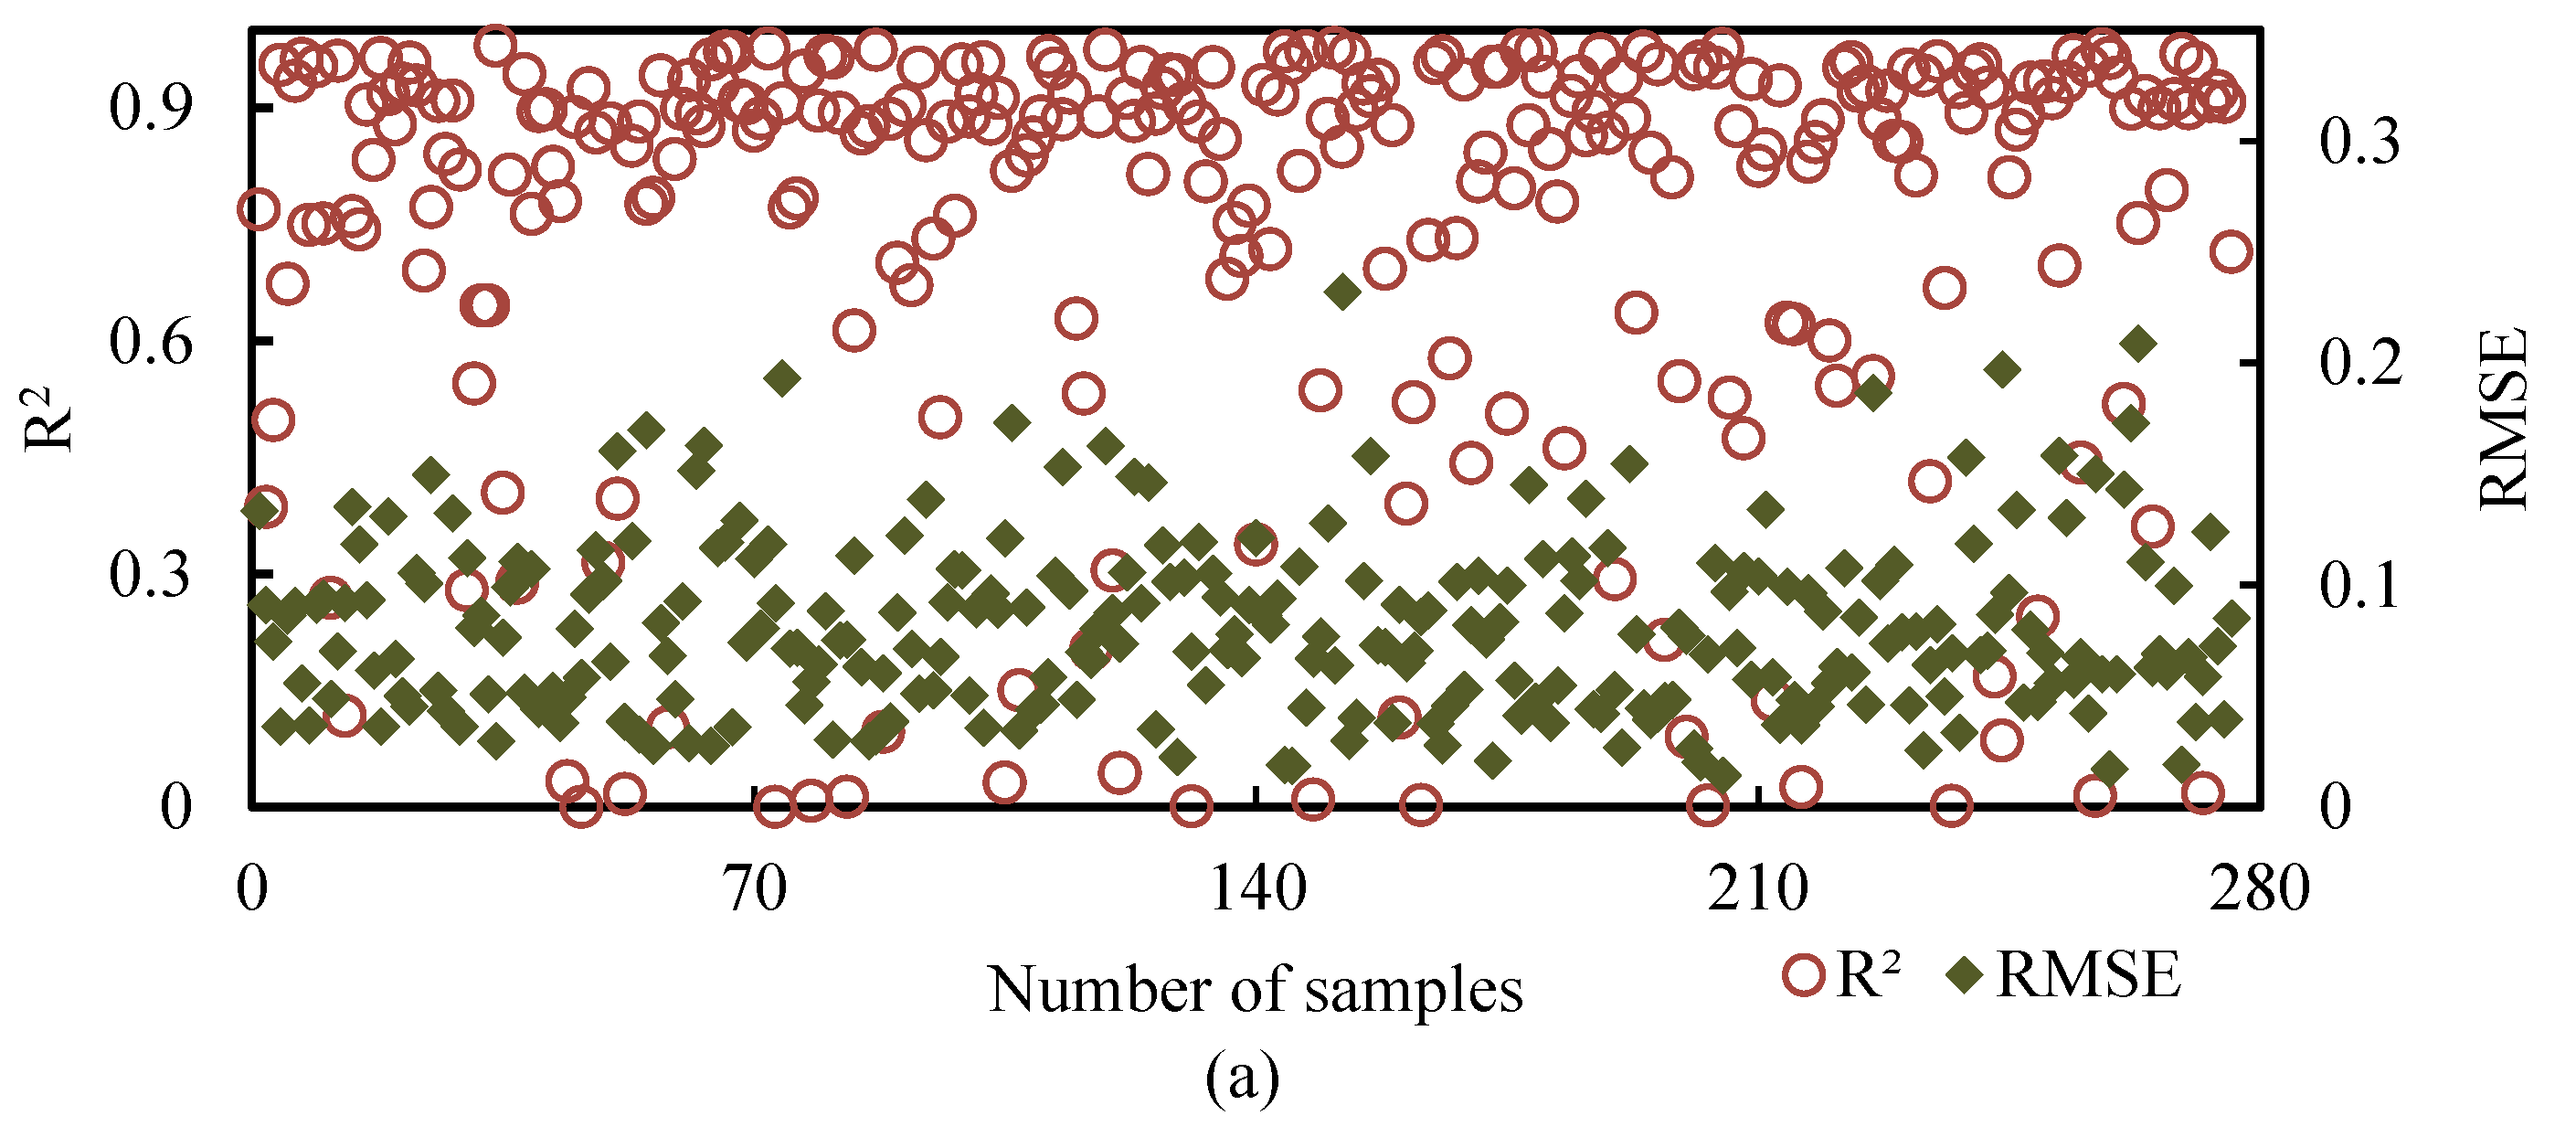
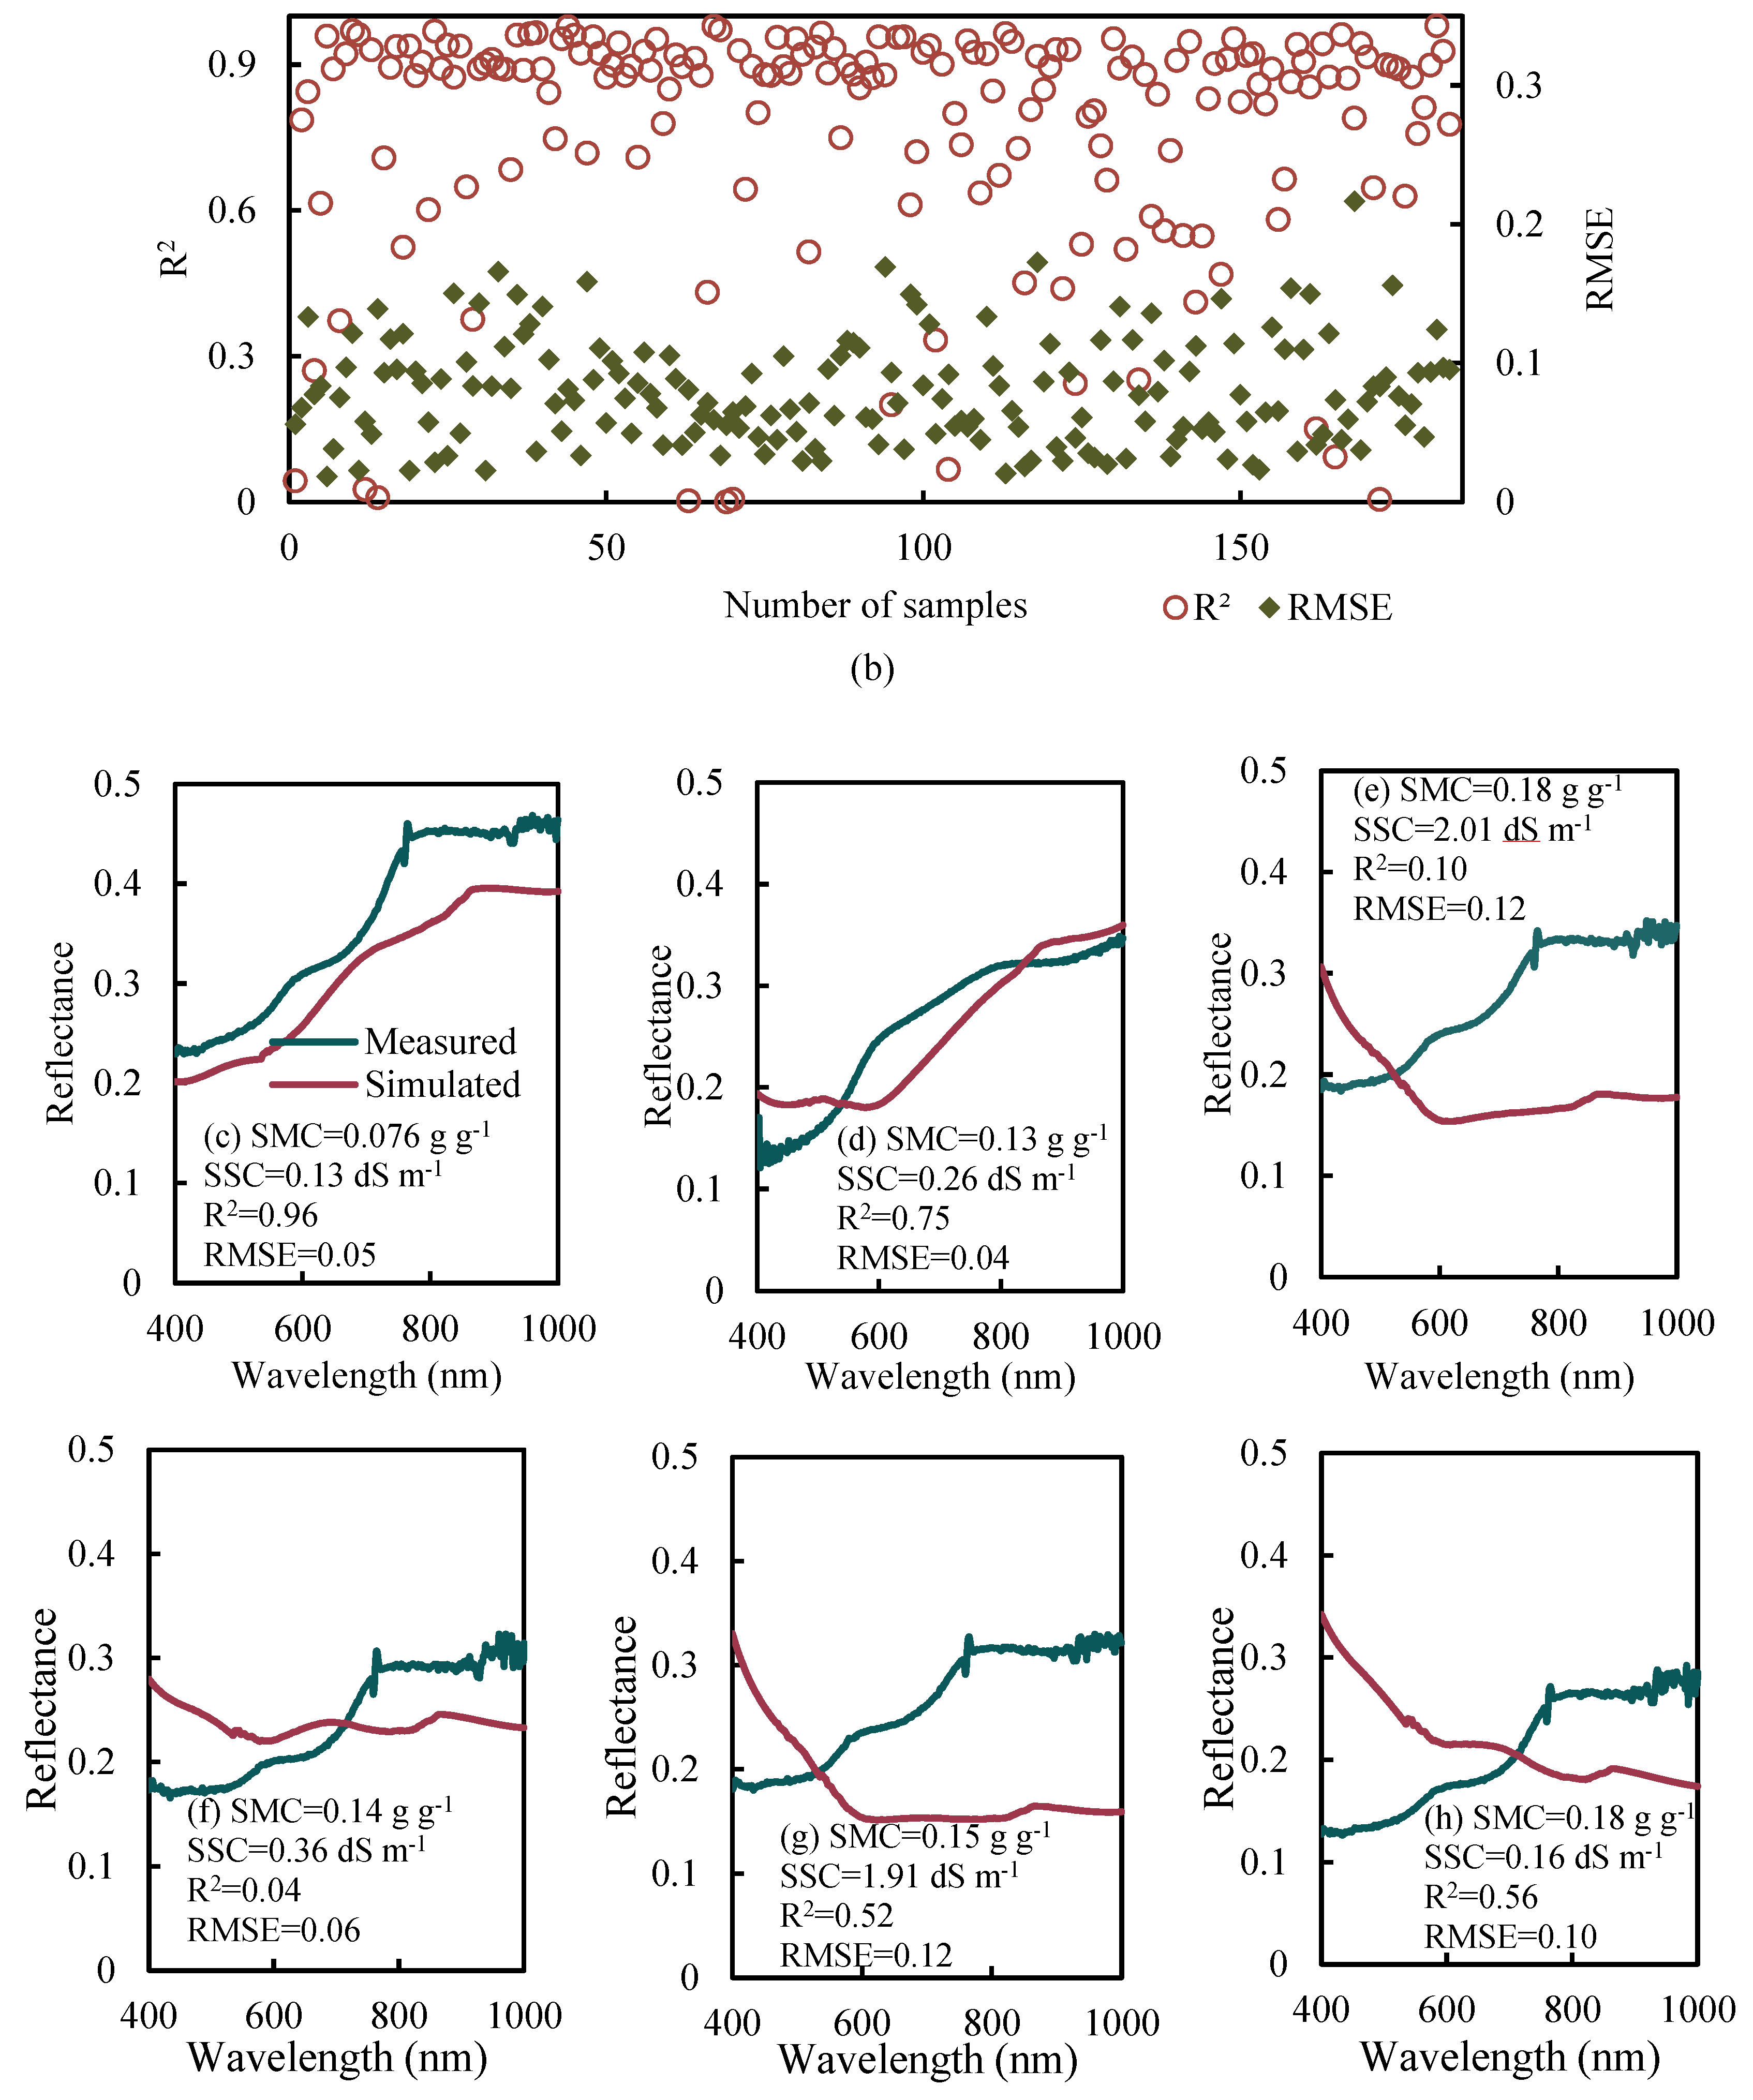
According to the above results, the soil reflectance was simulated by SSREM. Figure 10 summarizes the performance of SSREM in various SMC and SSC conditions. It shows that SSREM well-simulates the spectral reflectance of most saline soils. The calibration R2 and RMSE values are in the range of 0~0.98 and 0.014~0.23, respectively. Validation R2 and RMSE values are in the range of 0~0.98 and 0.018 to 0.22, respectively.
For soil samples with poor simulation accuracy, their SMC values were all above 0.12 g g−1. Figure 10e,g,h shows that the spectral reflectance is overestimated in the visible bands and underestimated in the NIR bands by SSREM when the SMC value is greater than the maximum of MT(i) (i = [400, 1000]), i.e., 0.15 g g−1. At the same time, the shape of the simulated spectral curves differs from that of the measured spectral curves. When the SMC value is greater than the MT value, the error between the simulated and measured reflectance values is small for some bands, but the correlation is poor (Figure 10d,f). When the SMC value is less than the minimum of MT(i) (0.12 g g−1), the shapes of the simulated spectral curves of SSREM are similar to the measured spectral curves (Figure 10c), indicating SSREM has a good simulation accuracy.
The parameters of SSREM help to explain the performance of SSREM for soil samples with different SMCs. Parameter a and b are below zero in visible bands (Figure 9), i.e., the simulated reflectance is positively correlated with SMC and SSC. In the NIR, parameter a and b are greater than zero, then simulated reflectance is negatively correlated to SMC and SSC. However, the reflectance of soil samples with high SMC is higher than that of soil samples with low SMC, due to specular reflection. Therefore, SSREM overestimates the reflectance in the visible band and underestimates the reflectance in the NIR band because it neglects the MT. The simulation findings confirm that SSREM is not suitable for simulating the spectral reflectance of saline soil with high SMC and it needs to be further modified to improve its performance.

3.6.3. Results of the MT-SSREM

The result of MT-SSREM for reflectance simulation is demonstrated in Figure 11. MT-SSREM improves spectral reflectance estimation compared with SSREM (with calibration R2 and RMSE values ranging from 0.53 to 0.98 and 0.014 to 0.16, respectively, and validation R2 and RMSE values ranging from 0.75 to 0.98 and 0.016 to 0.17, respectively).

3.6.4. SSC Estimation

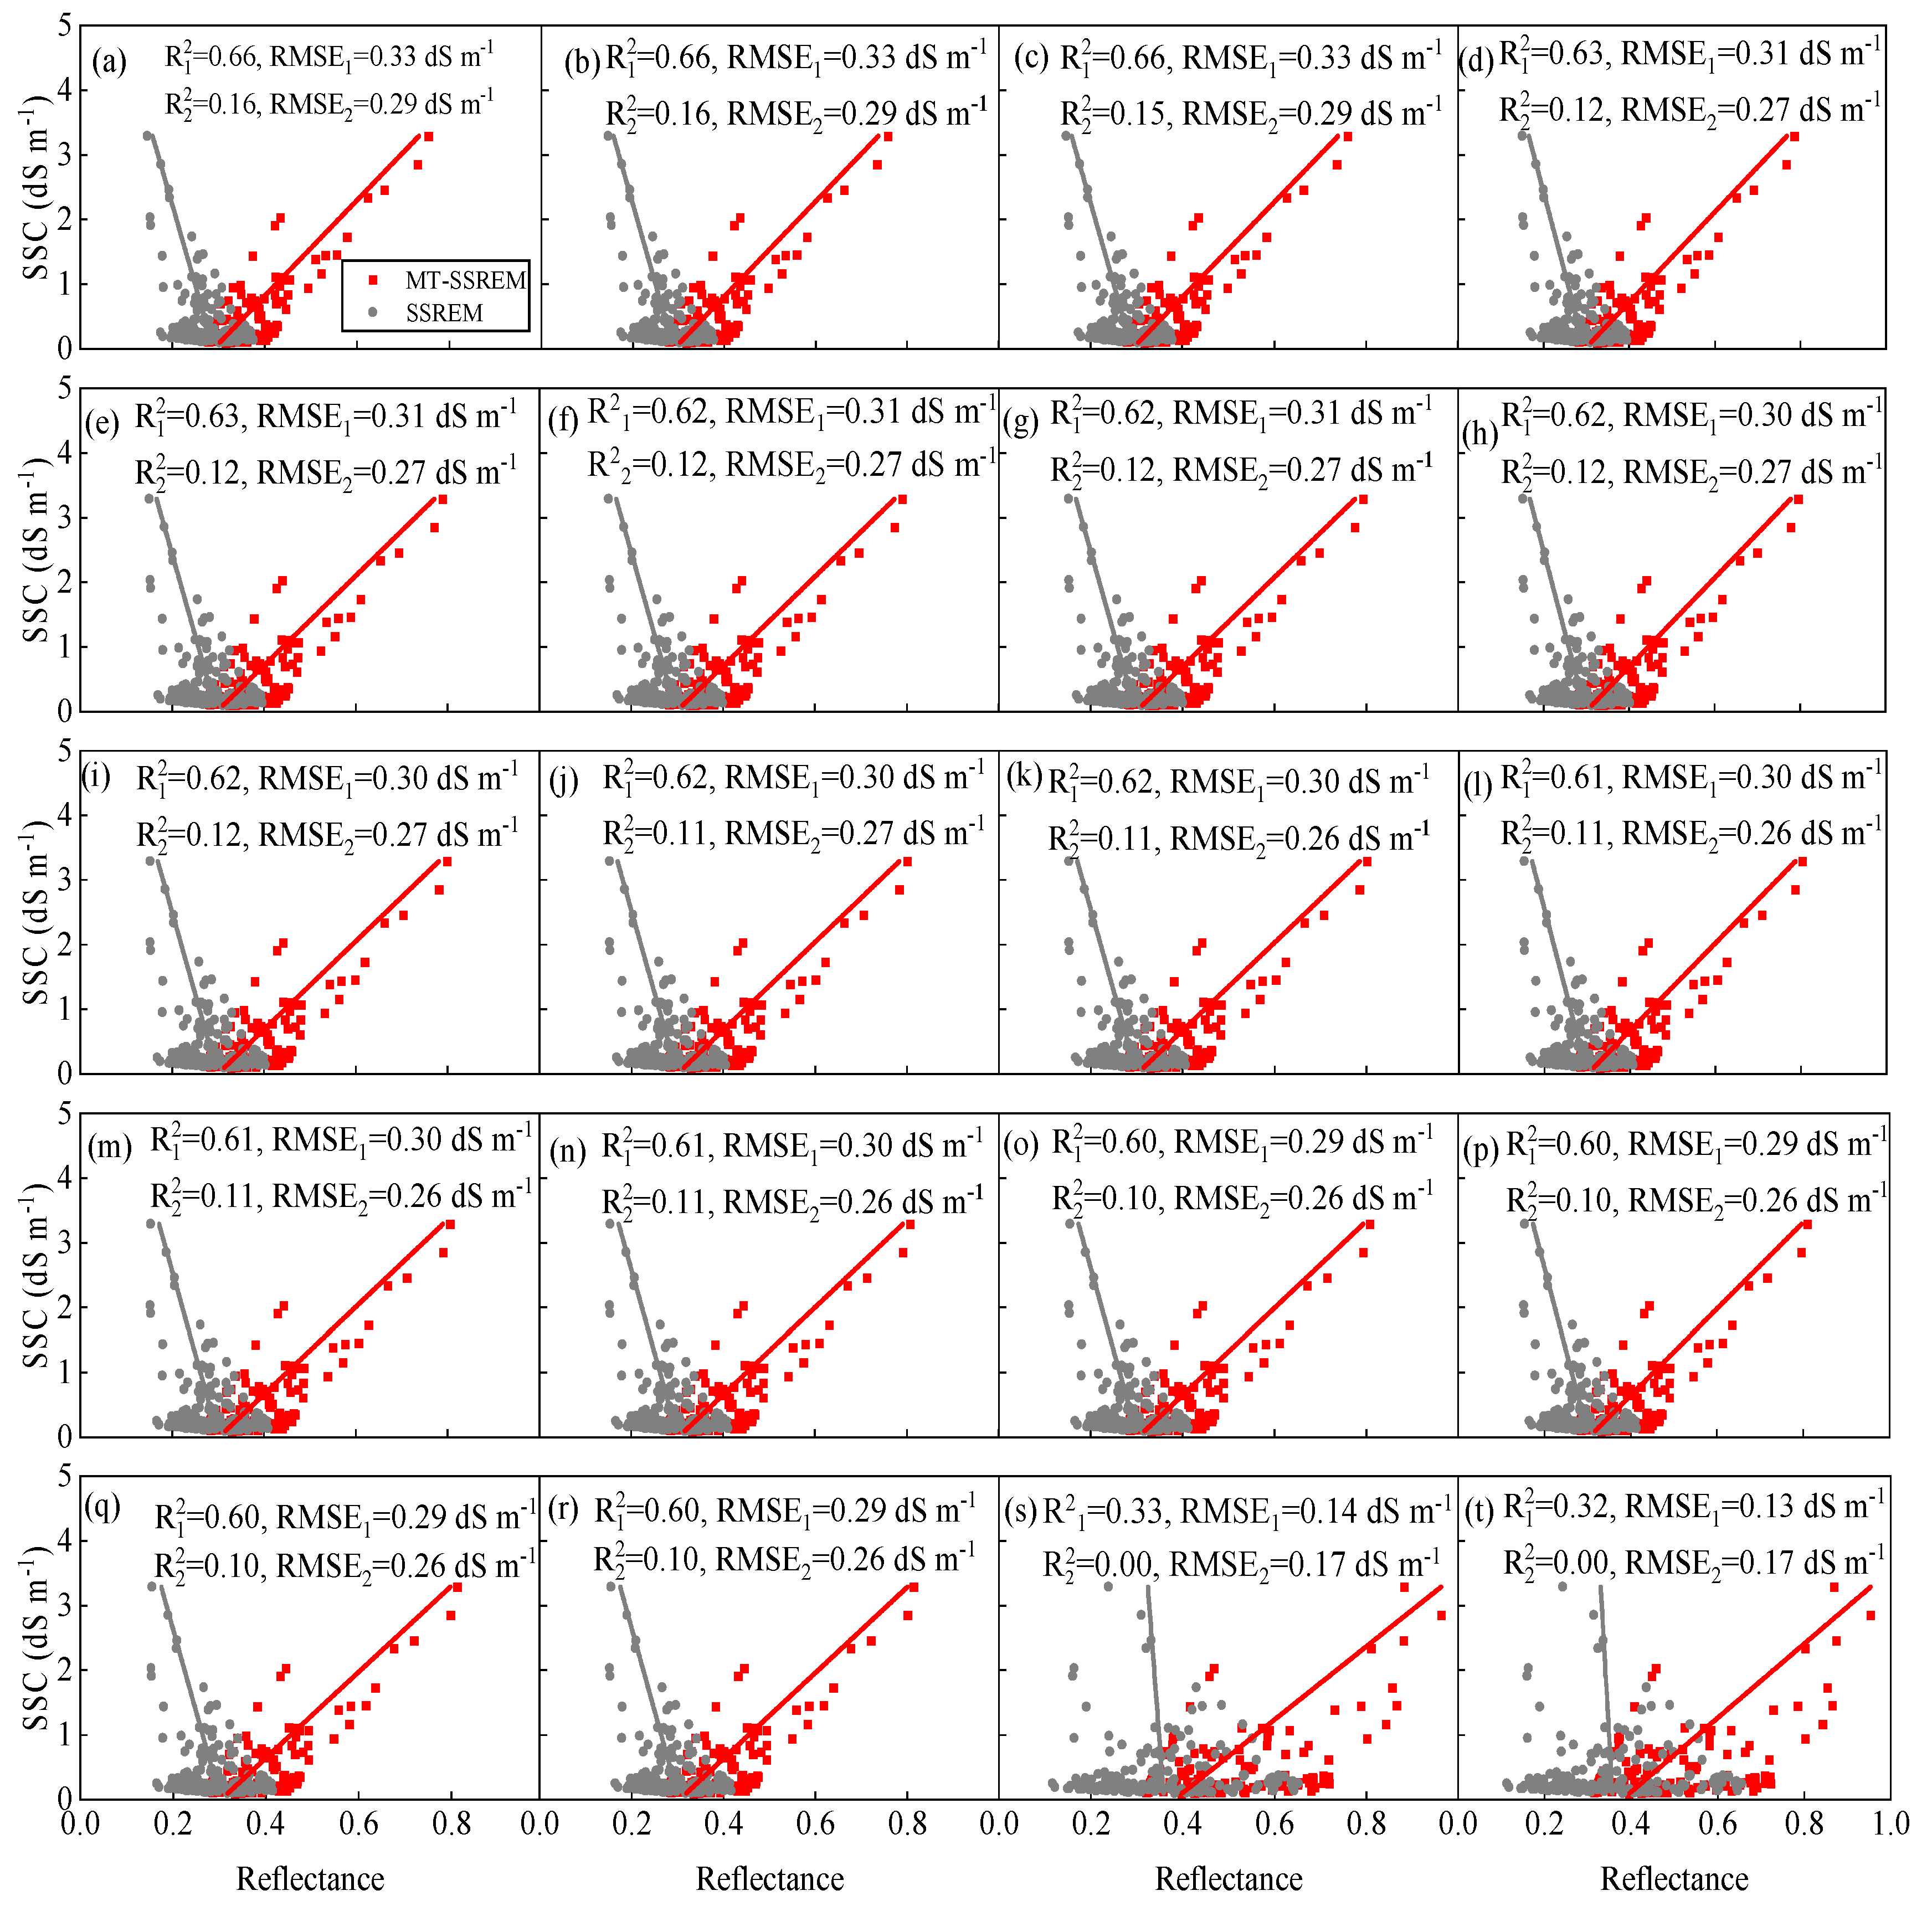
Based on the suggested suitable bands for estimating SSC in Section 3.5, we further compared the estimation capabilities of SSREM and MT-SSREM for SSC and the results are presented in Figure 12. For MT-SSREM, the SSC estimation models based on 658, 659 and 660 nm bands achieved the highest accuracy, with R2 values of 0.66 and corresponding RMSEs of 0.33 dS m−1 for the three bands. The SSC estimation models for 672 nm to 685 nm and 938 nm also performed well, with R2 in the range of 0.60 to 0.63 and RMSE in the range of 0.29 to 0.31 dS m−1. However, wavelengths at 939 nm and 961 nm could not be used to estimate SSC. It is caused by the absorption properties at 939 nm and 961 nm, which led to their poor performance for the SSC estimation, i.e., they are within the specific absorption wavelengths of the water. For SSREM, the estimation model based on the simulated bands could not estimate the SSC. The R2 values were no more than 0.16 and the RMSEs were in the range of 0.17~0.29 dS m−1. In particular, when SSC < 1 dS m−1, the SSC estimation model performed poorly as shown in Figure 12.

4. Discussion

4.1. The MT-SSREM Parameters

MT-SSREM contains four parameters, i.e., MT, a, b, and R0. The MT parameter can be difficult to determine, given its dependence on many potential factors. Soil particle-size distribution, salt concentration, salt composition and wavelength are considered the main factors that significantly affect MT [13,21,23,25]. In this study, spectral reflectance data were fitted with the SMC data of the soils by quadratic functions. The resulted MTs are in the range of 0.12~0.15 g g−1 for the whole spectrum (400~1000 nm). This result is different from some previous studies. Liu et al. [24] reported that MTs for 1000 nm band, under different levels of soil organic matter contents in black soil, were in the range of 0.28~0.54 g g−1, with higher values corresponding to lower organic matter contents. Some studies simply assumed MT was equal to field moisture capacity [23,25]. Soil type (the soil sand content in this study was greater than that in previous studies [24]), soil color (e.g., the soil color was yellow in this study and black in previous study) and SMC (SMCs in this study were lower than SMCs in previous study [25,45]) might cause the difference in the estimated MT values between this study and previous studies. We determined MT following a consistent procedure (quadratic function) and contributed a new way for quantifying the effects of SMC on saline soil spectral reflectance.
With respect to a, b and R0, Wang et al. [15] and Yang and Yu [31] found that parameter b increased with wavelength. It was negative for the range of 350~600 nm and positive for the range of 600~1000 nm. The spectral pattern of parameter b of this study is similar, but approaches zero at the wavelength of 421 nm, which might be caused by the difference in salt composition between this study and previous ones. Furthermore, we assumed SMC equals zero for air-dried soil samples, which might slightly affect the values of the parameters.
These parameters are obtained mainly by the least-squares method and statistical method, e.g., the parameters of R0, a and b, were obtained based on the average reflectance for wet and dry soils in this study. Yang and Yu [31] and Zhang et al. [51] fitted these parameters using the least-squares method. Somers et al. [61] modelled parameter a by establishing a function of parameter a and specific surface area (SSA). In addition, the absolute value of parameter a was larger than that of parameter b (as shown in Figure 9a), which showed that SMC had greater influence on soil spectral reflectance than SSC, sometimes the spectral signal of SMC even covered up the spectral signal of SSC. Previous results also confirmed that the influence of moisture on soil spectrum was commonly greater than other factors [17,26]. SMC affects the reflectance signal in the field and affects the accuracy of SSC estimation based on reflectance, especially in arid lands. Therefore, it is vital to establish a model that can eliminate the noise of SMC on SSC estimation for potential in situ field applications.

4.2. Features of Suitable Bands for Estimating SSC

Here, we first used five kinds of correlation coefficient values between SSC and hyperspectral data to determine the sensitive band of SSC/SMC. The sensitive bands of SSC were then determined by removing the sensitive bands of SMC. The wavelengths most sensitive to SSC and not sensitive to SMC were in 658~660 nm, 671~685 nm and 938 nm, which were mostly located at red (622~780 nm), red edge (680~760 nm) and NIR (780~1000 nm). These spectral regions were proposed to be the most sensitive bands to SSC [39,62]. Hu et al. [39] recommended 610 nm, 650 nm and 870 nm were the most important bands for SSC prediction. Zhang et al. [62] performed RSR and FD correlation maps to determine the sensitive wavelengths of SSC at 483~507 nm, 632~697 nm, 731~762 nm, 812~868 nm, 884~909 nm and 918~930 nm. In the previous research, these wavelengths were also used to derive vegetation indexes (VI), e.g., NDVI = (NIR − red)/(NIR + red), NDRE = (NIR − red edge)/(NIR + red edge), RVI = NIR/red, or establish estimation models for SSC [63,64].
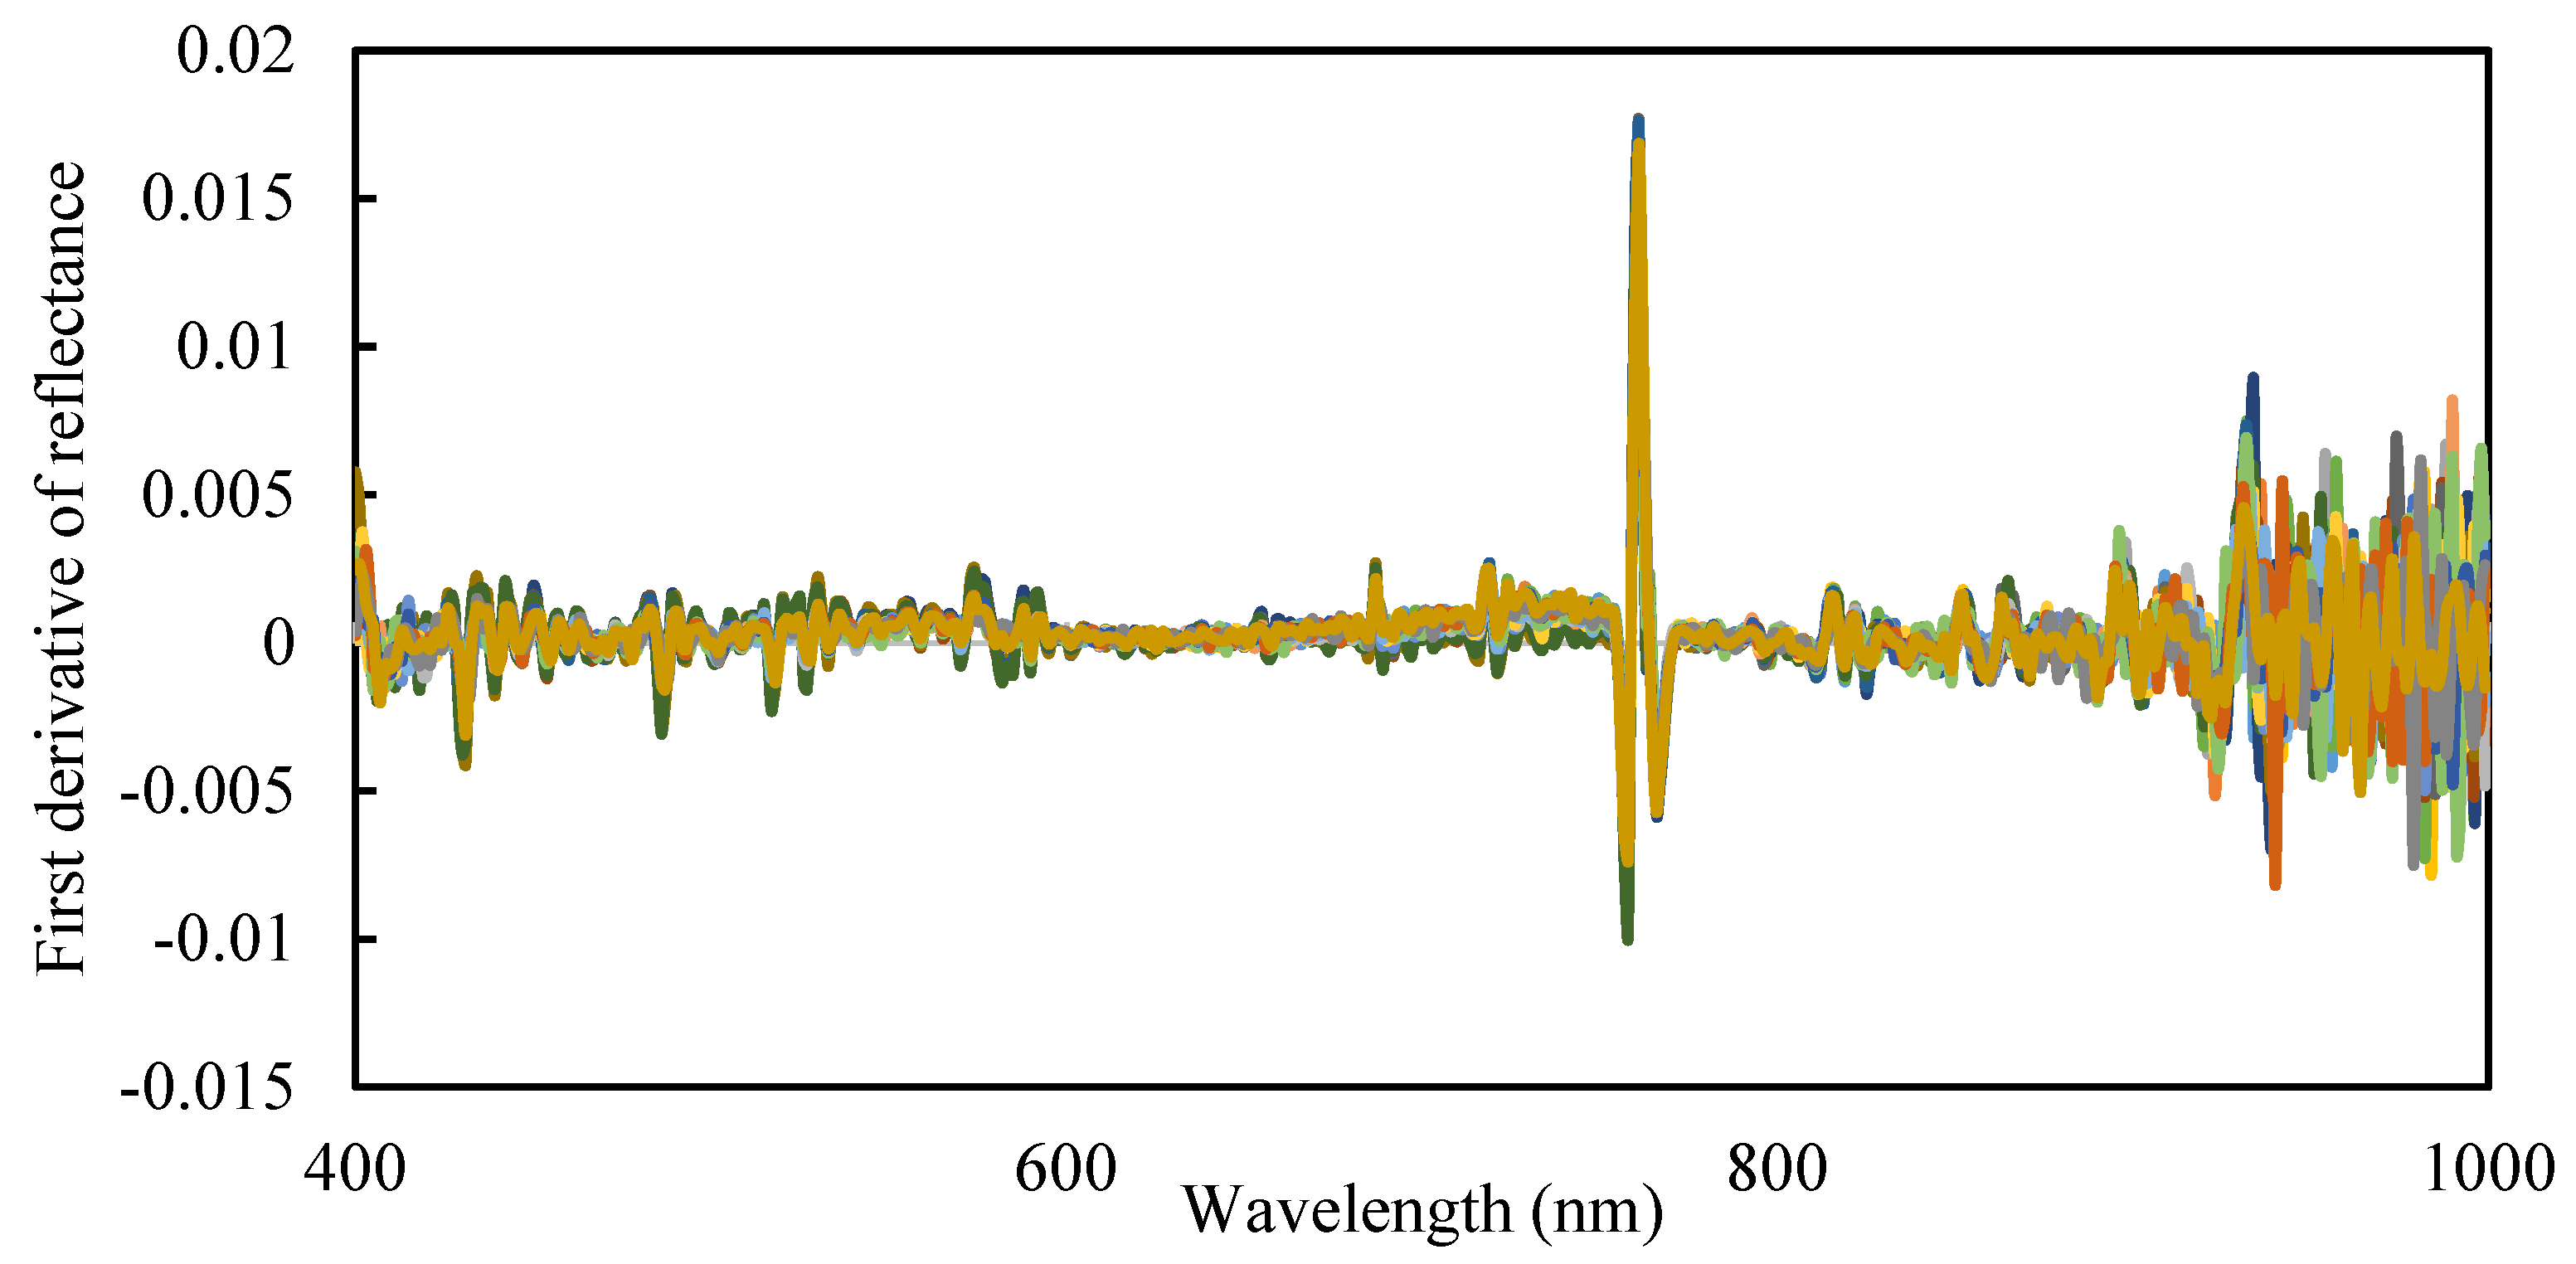
The photochemical mechanism corresponding to the selected wavelengths could contribute to SSC diagnosis performance. As can be seen from Figure 13, the FD values corresponding to the sensitive bands of SSC are zero, indicating that the change in reflectance of these bands is also not influenced by wavelengths. Therefore, these bands have strong noise immunity and are uniquely representative of the SSC. Furthermore, these bands also covered the following bands of sensors: red (670 nm) of UAV sensors RedEdge-MX; red (630–690 nm) and NIR (600~900 nm) bands of QuickBird; the second (610~680 nm) and third (780~890 nm) bands of SPOT4; and the third (630~690 nm) and fourth (760~900 nm) bands of LANDSAT5. This suggests that the results of our study to determine the sensitive bands of SSC can be applied to most sensors with small spatial resolution. This provides a theoretical foundation for large area mapping of SSC.
In this study, the sensitive bands of SSC were obtained based on correlation analysis, and the accuracy of the sensitive bands for SSC estimation is high (Figure 12). We noticed that methods based on intelligent algorithms have been applied to screen hyperspectral data for sensitive bands in numerous studies. Intelligent algorithms are mainly divided into two categories. One is supervised algorithm, including correlation analysis (CA), the genetic algorithm (GA), variable importance in the projection (VIP), wavelet analysis and recursive feature elimination (RFE) [65,66]. The other is unsupervised algorithms, such as clustering-based algorithms: k-means, density-based clustering and subspace clustering [67,68,69]. Clustering requires non-labeled training samples, which allows a wider application for SSC sensitive-bands selection. However, the bands in wavelength 400 to 1000 nm may respond to both SSC and SMC, as confirmed in our results (Section 3.4) (explain why we need to select the band of SSC by reducing SMC effects). The clustering algorithms rely on the data itself to group bands into clusters, which may result in the same sensitive bands of SMC and SSC; therefore, they may be unable to eliminate the noise of SMC.

4.3. MT-SSREM Model Performance

According to the simulation results of SSREM shown in Figure 10, the model had poor simulation accuracy for soil reflectance when SMC was larger than MT(i). These results are consistent with previous studies, e.g., Somers et al. [61] indicated that the SSREM model was unsuitable for simulating spectral reflectance of saline soils with high SMC. From Table 3, compared with SSREM, MT-SSREM performs better with a mean increase of 0.17 in R2 and a mean decrease of 0.012 in RMSE. In addition, MT-SSREM appears to be more robust than SSREM for various SMC and SSC conditions, with MT-SSREM having a much smaller variation of R2 and RMSE (SD = 0.035 and 0.035) than SSREM (SD = 0.24 and 0.037). Meanwhile, the R2 values of MT-SSREM simulations are above 0.75, accounting for 100% (in the 183 saline soil samples of the validation dataset), and RMSE values are below 0.1, accounting for 80.33% soil samples.
Many studies employed SSREM to estimate SMC or SSC and evaluated the accuracy of the inversion [15,21,31,51,61]. Some researchers tried to modify SSREM, e.g., Zhang et al. [51] considered the influence of water–salt interaction on soil spectral reflectance on the basis of previous studies, and added the water–salt interaction role into SSREM by the relationship between error in SSREM simulation and the water–salt feature index. In this study, soil spectral moisture threshold (MT) was introduced to improve the SSREM. We have compared the estimation capabilities of SSREM and MT-SSREM for SSC. The results in Figure 12 showed that MT-SSREM performed substantially better than SSREM for SSC estimation.

4.4. Application and Limitations of MT-SSREM

In this study we obtained the MT values for each band and modified the SSREM accordingly, resulting in more accurate simulation of the reflectance in the range of 400~1000 nm. MT-SSREM has potential applicability in the field. First, MT-SSREM provides a priori knowledge for disentangling soil and canopy reflectance, which is essential for image-based inversion of vegetation parameters. For example, the reflectance of bare soils in the visible and NIR range has mainly been discussed as background noise to the spectral response of vegetative surfaces. Our study provides a method that the soil reflectance could be directly calculated based on known soil moisture content (SMC) and soil salt content (SSC). Second, hyperspectral sensors typically collect hundreds of contiguous spectral bands with narrow bandwidths, which allow it to be freely collected into a band combination that matches the wavelength range of any satellite/UAV multispectral band by the spectral response function. Thus, the use of field hyperspectral data in correcting satellite multispectral data leads to higher correction accuracy [65]. Third, MT-SSREM can be applied to SSC or SMC estimation in the field. Based on MT-SSREM inversion, with known reflectance and SSC (or SMC), the SMC (or SSC) could be obtained. In all, this study could provide useful information for soil salt detection where the remote sensing may not cover such a wider spectral range, especially beyond 1000 nm, e.g., PROBA-1 CHRIS, which is 400~1050 nm in VNIR.
However, some limitations are worth noting. Soil composition is complicated and involves various minerals and each mineral shows distinct spectral behavior. We only investigated one type of soil gathered from the Shiyang River Basin in Northwest China. It is possible the different soil types, especially their different mineral compositions, could result in different coefficients of MT-SSREM. In addition, the SSC estimation could be further improved. In terms of the methodology, more advanced machine-learning algorithms can be incorporated into the MT-SSREM, e.g., deep-learning-based regression techniques (convolution neural network, sparse coding and recurrent neural network, etc.). Therefore, the model’s application on different saline soil types and geographical locations should be further examined to build a look-up table of the parameters (a, b, R0 and MT) to facilitate the application. Furthermore, future work is required to incorporate MT-SSREM and remote sensing data like GF-5, which is significant for the SSC mapping.

5. Conclusions

Quantifying the influence of SMC on the spectrum of saline soil is critical for rapid, precise and real-time monitoring of SSC in saline soil. The MT value of each band was obtained based on the relationship between reflectance and SMC. Then, a new model, MT-SSREM, was proposed based on SSREM and applied for spectral reflectance simulation on 459 soil samples collected in Shiyang River Basin, Northwest China. The main conclusions are as follows.
(1)
The relationship of spectral reflectance and SMC can be fitted with a quadratic function, and the MT value of each waveband can be determined at the minimum point of the corresponding quadratic function.
(2)
SSREM is not suitable for simulating the spectral reflectance of saline soil with high SMC. An improved model, MT-SSREM has been proposed to incorporate the MT effect on saline soil spectral reflectance modelling.
(3)
MT-SSREM performed better than SSREM for hyperspectral reflectance simulation and SSC estimation in various SMC and SSC conditions.
(4)
SMC has greater influence on soil spectral reflectance than SSC, which make it difficult to eliminate SMC noise when estimating SSC from spectral reflectance. It is suggested to use spectral reflectance of 628~640 and 728~735 nm bands for estimating SMC, and that of 658~660, 671~685 and 938 nm for estimating SSC.

Author Contributions

Conceptualization, X.H. and X.M.; methodology, X.H.; software, X.H.; validation, X.H., T.B. and H.G.; formal analysis, X.H.; investigation, X.W.; resources, X.H.; data curation, Y.W. and X.W.; writing—original draft preparation, X.H.; writing—review and editing, X.H., T.B., H.G. and X.M.; visualization, X.H.; supervision, X.M.; project administration, X.M.; funding acquisition, X.M. All authors have read and agreed to the published version of the manuscript.

Funding

This work was supported by the National Natural Science Foundation of China (51790535, 51861125103) and National Key Research and Development Program (2021YFD1900801).

Data Availability Statement

No new data were created or analyzed in this study. Data sharing is not applicable to this article.

Conflicts of Interest

The authors declare no conflict of interest.

References

  1. Butcher, K.; Wick, A.F.; DeSutter, T.; Chatterjee, A.; Harmon, J. Soil Salinity: A Threat to Global Food Security. Agron. J. 2016, 108, 2189–2200. [Google Scholar] [CrossRef]
  2. Heung, B.; Ho, H.C.; Zhang, J.; Knudby, A.; Bulmer, C.E.; Schmidt, M.G. An overview and comparison of machine-learning techniques for classification purposes in digital soil mapping. Geoderma 2016, 265, 62–77. [Google Scholar] [CrossRef]
  3. Singh, A. Soil salinization and waterlogging: A threat to environment and agricultural sustainability. Ecol. Indic. 2015, 57, 128–130. [Google Scholar] [CrossRef]
  4. Mitran, T.; Ravisankar, T.; Fyzee, M.; Suresh, J.R.; Sujatha, G.; Sreenivas, K. Retrieval of soil physicochemical properties towards assessing salt-affected soils using Hyperspectral Data. Geocarto Int. 2015, 30, 701–721. [Google Scholar] [CrossRef]
  5. Zhang, X.; Huang, B. Prediction of soil salinity with soil-reflected spectra: A comparison of two regression methods. Sci. Rep. 2019, 9, 5067. [Google Scholar] [CrossRef] [Green Version]
  6. Wang, Z.; Zhang, X.; Zhang, F.; Chan, N.W.; Kung, H.-T.; Liu, S.; Deng, L. Estimation of soil salt content using machine learning techniques based on remote-sensing fractional derivatives, a case study in the Ebinur Lake Wetland National Nature Reserve, Northwest China. Ecol. Indic. 2020, 119, 106869. [Google Scholar] [CrossRef]
  7. Wang, J.; Li, X. Comparison on quantitative inversion of characteristic ions in salinized soils with hyperspectral based on support vector regression and partial least squares regression. Eur. J. Remote Sens. 2020, 53, 340–348. [Google Scholar] [CrossRef]
  8. Chang, C.-W.; Laird, D.A.; Hurburgh, C.R. influence of soil moisture on near-infrared reflectance spectroscopic measurement of soil properties. Soil Sci. 2005, 170, 244–255. [Google Scholar] [CrossRef] [Green Version]
  9. Ben-Dor, E.; Patkin, K.; Banin, A.; Karnieli, A. Mapping of several soil properties using DAIS-7915 hyperspectral scanner data—A case study over clayey soils in Israel. Int. J. Remote Sens. 2002, 23, 1043–1062. [Google Scholar] [CrossRef]
  10. Ganjegunte, G.K.; Sheng, Z.; Clark, J.A. soil salinity and sodicity appraisal by electromagnetic induction in soils irrigated to grow cotton. Land Degrad. Dev. 2012, 25, 228–235. [Google Scholar] [CrossRef]
  11. Pessoa, L.G.M.; Dos Santos Freire, M.B.G.; Wilcox, B.P.; Green, C.H.M.; De Araújo, R.J.T.; De Araújo Filho, J.C. Spectral reflectance characteristics of soils in northeastern Brazil as influenced by salinity levels. Environ. Monit. Assess. 2016, 188, 616. [Google Scholar] [CrossRef] [PubMed]
  12. Musick, H.B.; Pelletier, R.E. Response to soil moisture of spectral indexes derived from bidirectional reflectance in thematic mapper wavebands. Remote Sens. Environ. 1988, 25, 167–184. [Google Scholar] [CrossRef]
  13. Liu, W.D.; Baret, F.; Gu, X.F.; Tong, Q.; Zheng, L.F.; Zhang, B. Relating soil surface moisture to reflectance. Remote Sens Environ. 2002, 81, 238–246. [Google Scholar]
  14. Metternicht, G.I.; Zinck, J.A. Remote sensing of soil salinity: Potentials and constraints. Remote Sens. Environ. 2003, 85, 1–20. [Google Scholar] [CrossRef]
  15. Wang, Q.; Li, P.; Chen, X. Modeling salinity effects on soil reflectance under various moisture conditions and its inverse application: A laboratory experiment. Geoderma 2012, 170, 103–111. [Google Scholar] [CrossRef]
  16. Bartholomeus, H.; Schaepman, M.; Kooistra, L.; Stevens, A.; Hoogmoed, W.; Spaargaren, O. Spectral reflectance based indices for soil organic carbon quantification. Geoderma 2008, 145, 28–36. [Google Scholar] [CrossRef]
  17. Wang, Y.P.; Lee, C.K.; Dai, Y.H.; Shen, Y. Effect of wetting on the determination of soil organic matter content using visible and near-infrared spectrometer. Geoderma 2020, 376, 114528. [Google Scholar] [CrossRef]
  18. Haubrock, S.-N.; Chabrillat, S.; Lemmnitz, C.; Kaufmann, H. Surface soil moisture quantification models from reflectance data under field conditions. Int. J. Remote Sens. 2008, 29, 3–29. [Google Scholar] [CrossRef]
  19. Lesaignoux, A.; Fabre, S.; Briottet, X. Influence of soil moisture content on spectral reflectance of bare soils in the 0.4–14 μm domain. Int. J. Remote Sens. 2012, 34, 2268–2285. [Google Scholar] [CrossRef]
  20. Baumgardner, M.F.; Silva, L.F.; Biehl, L.L.; Stoner, E.R. Reflectance Properties of Soils. Adv. Agron. 1986, 38, 1–44. [Google Scholar] [CrossRef]
  21. Lobell, D.B.; Asner, G.P. Moisture effects on soil reflectance. Soil Sci. Soc. Am. J. 2002, 66, 722–727. [Google Scholar] [CrossRef]
  22. Anderson, K.; Croft, H. Remote sensing of soil surface properties. Prog. Phys. Geogr. Earth Environ. 2009, 33, 457–473. [Google Scholar] [CrossRef]
  23. Bablet, A.; Vu, P.; Jacquemoud, S.; Viallefont-Robinet, F.; Fabre, S.; Briottet, X.; Sadeghi, M.; Whiting, M.; Baret, F.; Tian, J. MARMIT: A multilayer radiative transfer model of soil reflectance to estimate surface soil moisture content in the solar domain (400–2500 nm). Remote Sens. Environ. 2018, 217, 1–17. [Google Scholar] [CrossRef] [Green Version]
  24. Liu, H.-J.; Zhang, Y.-Z.; Zhang, X.-L.; Zhang, B.; Song, K.-S.; Wang, Z.-M.; Tang, N. Quantitative Analysis of Moisture Effect on Black Soil Reflectance. Pedosphere 2009, 19, 532–540. [Google Scholar] [CrossRef]
  25. Wang, X.; Dou, X.; Zhang, X.; Liu, H.; Li, H.; Meng, X. Development of soil spectral allocation models considering the effect of soil moisture. Soil Tillage Res. 2019, 195, 104374. [Google Scholar] [CrossRef]
  26. Muller, E.; Décamps, H. Modeling soil moisture–reflectance. Remote Sens Environ. 2001, 76, 173–180. [Google Scholar] [CrossRef] [Green Version]
  27. Hapke, B. Bidirectional Reflectance Spectroscopy: 5. The Coherent Backscatter Opposition Effect and Anisotropic Scattering. Icarus 2002, 157, 523–534. [Google Scholar] [CrossRef] [Green Version]
  28. Zhang, Y.; Tan, K.; Wang, X.; Chen, Y. Retrieval of Soil Moisture Content Based on a Modified Hapke Photometric Model: A Novel Method Applied to Laboratory Hyperspectral and Sentinel-2 MSI Data. Remote Sens. 2020, 12, 2239. [Google Scholar] [CrossRef]
  29. Yuan, J.; Wang, X.; Yan, C.-X.; Wang, S.-R.; Ju, X.-P.; Li, Y. Soil Moisture Retrieval Model for Remote Sensing Using Reflected Hyperspectral Information. Remote Sens. 2019, 11, 366. [Google Scholar] [CrossRef] [Green Version]
  30. Vargas, W.E.; Niklasson, G. Applicability conditions of the Kubelka–Munk theory. Appl. Opt. 1997, 36, 5580–5586. [Google Scholar] [CrossRef]
  31. Yang, X.; Yu, Y. Estimating Soil Salinity Under Various Moisture Conditions: An Experimental Study. IEEE Trans. Geosci. Remote Sens. 2017, 55, 2525–2533. [Google Scholar] [CrossRef]
  32. Bannari, A.; Musa, N.H.M.; Abuelgasim, A.; El-Battay, A. Sentinel-MSI and Landsat-OLI Data Quality Characterization for High Temporal Frequency Monitoring of Soil Salinity Dynamic in an Arid Landscape. IEEE J. Sel. Top. Appl. Earth Obs. Remote Sens. 2020, 13, 2434–2450. [Google Scholar] [CrossRef]
  33. Wang, J.; Peng, J.; Li, H.; Yin, C.; Liu, W.; Wang, T.; Zhang, H. Soil Salinity Mapping Using Machine Learning Algorithms with the Sentinel-2 MSI in Arid Areas, China. Remote Sens. 2021, 13, 305. [Google Scholar] [CrossRef]
  34. Rao, B.R.M.; Sharma, R.C.; Sankar, T.R.; Das, S.; Dwivedi, R.S.; Thammappa, S.S.; Venkataratnam, L. Spectral behavior of salt-affected soils. Int. J. Remote Sens. 1995, 16, 2125–2136. [Google Scholar] [CrossRef]
  35. Mirzaei, S.; Boloorani, A.D.; Bahrami, H.A.; Alavipanah, S.K.; Mousivand, A.; Mouazen, A.M. Minimising the effect of moisture on soil property prediction accuracy using external parameter orthogonalization. Soil Tillage Res. 2021, 215, 105225. [Google Scholar] [CrossRef]
  36. Xu, C.; Zeng, W.; Huang, J.; Wu, J.; Van Leeuwen, W.J. Prediction of Soil Moisture Content and Soil Salt Concentration from Hyperspectral Laboratory and Field Data. Remote Sens. 2016, 8, 42. [Google Scholar] [CrossRef] [Green Version]
  37. Mashimbye, Z.; Cho, M.; Nell, J.; DE Clercq, W.; VAN Niekerk, A.; Turner, D. Model-Based Integrated Methods for Quantitative Estimation of Soil Salinity from Hyperspectral Remote Sensing Data: A Case Study of Selected South African Soils. Pedosphere 2012, 22, 640–649. [Google Scholar] [CrossRef]
  38. Jiang, H.; Rusuli, Y.; Amuti, T.; He, Q. Quantitative assessment of soil salinity using multi-source remote sensing data based on the support vector machine and artificial neural network. Int. J. Remote Sens. 2018, 40, 284–306. [Google Scholar] [CrossRef]
  39. Hu, J.; Peng, J.; Zhou, Y.; Xu, D.; Zhao, R.; Jiang, Q.; Fu, T.; Wang, F.; Shi, Z. Quantitative Estimation of Soil Salinity Using UAV-Borne Hyperspectral and Satellite Multispectral Images. Remote Sens. 2019, 11, 736. [Google Scholar] [CrossRef] [Green Version]
  40. Roberts, J.; Cozzolino, D. Wet or dry? The effect of sample characteristics on the determination of soil properties by near infrared spectroscopy. TrAC Trends Anal. Chem. 2016, 83, 25–30. [Google Scholar] [CrossRef]
  41. Farifteh, J.; Van der Meer, F.; Atzberger, C.; Carranza, E. Quantitative analysis of salt-affected soil reflectance spectra: A comparison of two adaptive methods (PLSR and ANN). Remote Sens. Environ. 2007, 110, 59–78. [Google Scholar] [CrossRef]
  42. Moreira, L.C.J.; Teixeira, A.D.S.; Galvao, L. Laboratory Salinization of Brazilian Alluvial Soils and the Spectral Effects of Gypsum. Remote Sens. 2014, 6, 2647–2663. [Google Scholar] [CrossRef] [Green Version]
  43. Xia, K.; Xia, S.; Shen, Q.; Yang, B.; Song, Q.; Xu, Y.; Zhang, S.; Zhou, X.; Zhou, Y. Moisture spectral characteristics and hyperspectral inversion of fly ash-filled reconstructed soil. Spectrochim. Acta Part A Mol. Biomol. Spectrosc. 2021, 253, 119590. [Google Scholar] [CrossRef] [PubMed]
  44. Minasny, B.; McBratney, A.B.; Bellon-Maurel, V.; Roger, J.-M.; Gobrecht, A.; Ferrand, L.; Joalland, S. Removing the effect of soil moisture from NIR diffuse reflectance spectra for the prediction of soil organic carbon. Geoderma 2011, 167-168, 118–124. [Google Scholar] [CrossRef] [Green Version]
  45. Liu, Y.; Deng, C.; Lu, Y.; Shen, Q.; Zhao, H.; Tao, Y.; Pan, X. Evaluating the characteristics of soil vis-NIR spectra after the removal of moisture effect using external parameter orthogonalization. Geoderma 2020, 376, 114568. [Google Scholar] [CrossRef]
  46. Nawar, S.; Munnaf, M.A.; Mouazen, A.M. Machine Learning Based On-Line Prediction of Soil Organic Carbon after Removal of Soil Moisture Effect. Remote Sens. 2020, 12, 1308. [Google Scholar] [CrossRef] [Green Version]
  47. Tan, Y.; Jiang, Q.; Yu, L.; Liu, H.; Zhang, B. Reducing the Moisture Effect and Improving the Prediction of Soil Organic Matter With VIS-NIR Spectroscopy in Black Soil Area. IEEE Access 2021, 9, 5895–5905. [Google Scholar] [CrossRef]
  48. Ogen, Y.; Faigenbaum-Golovin, S.; Granot, A.; Shkolnisky, Y.; Goldshleger, N.; Ben-Dor, E. Removing Moisture Effect on Soil Reflectance Properties: A Case Study of Clay Content Prediction. Pedosphere 2019, 29, 421–431. [Google Scholar] [CrossRef]
  49. Philips-Invernizzi, B.; Dupont, D.; Caze, C. Bibliographical review for reflectance of diffusing media. Opt. Eng. 2001, 40, 1082–1092. [Google Scholar] [CrossRef]
  50. Farifteh, J. Interference of salt and moisture on soil reflectance spectra. Int. J. Remote Sens. 2011, 32, 8711–8724. [Google Scholar] [CrossRef]
  51. Zhang, Z.T.; Du, R.Q.; Yang, S.; Yang, N.; Wei, G.F.; Yao, Z.H.; Qiu, Y.L. Effects of water-salt interaction on soil spectral characteristics in Hetao Irrigation Areas of Inner Mongolia, China. Trans. CSAE 2020, 36, 153–164. [Google Scholar]
  52. Du, R.Q.; Chen, J.Y.; Zhang, Z.T.; Chen, Y.W.; He, Y.J.; Yin, H.Y. Simultaneous estimation of surface soil moisture and salinity during irrigation with the moisture-salinity-dependent spectral response model. Agric. Water Manag. 2022, 265, 107538. [Google Scholar] [CrossRef]
  53. Qin, S.; Li, S.; Kang, S.; Du, T.; Tong, L.; Ding, R.; Wang, Y.; Guo, H. Transpiration of female and male parents of seed maize in northwest China. Agric. Water Manag. 2018, 213, 397–409. [Google Scholar] [CrossRef]
  54. Zhao, Y.; Mao, X.; Shukla, M.K. A modified SWAP model for soil water and heat dynamics and seed–maize growth under film mulching. Agric. For. Meteorol. 2020, 292-293, 108127. [Google Scholar] [CrossRef]
  55. Guo, H.; Li, S.; Wong, F.-L.; Qin, S.; Wang, Y.; Yang, D.; Lam, H.-M. Drivers of carbon flux in drip irrigation maize fields in northwest China. Carbon Balance Manag. 2021, 16, 12. [Google Scholar] [CrossRef] [PubMed]
  56. Wang, Y.L.; Mao, X.M.; Chen, S.; Bo, L.Y. Experiments and simulation of soil moisture, temperature and salinity dynamics and oil sunflower growth in saline border irrigated farmland. Trans. CSAE 2021, 37, 76–86. [Google Scholar]
  57. Lao, C.; Chen, J.; Zhang, Z.; Chen, Y.; Ma, Y.; Chen, H.; Gu, X.; Ning, J.; Jin, J.; Li, X. Predicting the contents of soil salt and major water-soluble ions with fractional-order derivative spectral indices and variable selection. Comput. Electron. Agric. 2021, 182, 106031. [Google Scholar] [CrossRef]
  58. Wang, S.; Chen, Y.; Wang, M.; Zhao, Y.; Li, J. SPA-Based Methods for the Quantitative Estimation of the Soil Salt Content in Saline-Alkali Land from Field Spectroscopy Data: A Case Study from the Yellow River Irrigation Regions. Remote Sens. 2019, 11, 967. [Google Scholar] [CrossRef] [Green Version]
  59. Chen, S.; Hu, T.; Luo, L.; He, Q.; Zhang, S.; Li, M.; Cui, X.; Li, H. Rapid estimation of leaf nitrogen content in apple-trees based on canopy hyperspectral reflectance using multivariate methods. Infrared Phys. Technol. 2020, 111, 103542. [Google Scholar] [CrossRef]
  60. Whiting, M.L.; Li, L.; Ustin, S. Predicting water content using Gaussian model on soil spectra. Remote Sens. Environ. 2004, 89, 535–552. [Google Scholar] [CrossRef]
  61. Somers, B.; Gysels, V.; Verstraeten, W.W.; Delalieux, S.; Coppin, P. Modelling moisture-induced soil reflectance changes in cultivated sandy soils: A case study in citrus orchards. Eur. J. Soil Sci. 2010, 61, 1091–1105. [Google Scholar] [CrossRef]
  62. Zhang, T.T.; Zeng, S.-L.; Gao, Y.; Ouyang, Z.-T.; Li, B.; Fang, C.-M.; Zhao, B. Using hyperspectral vegetation indices as a proxy to monitor soil salinity. Ecol. Indic. 2011, 11, 1552–1562. [Google Scholar] [CrossRef]
  63. Chen, H.; Zhao, G.; Sun, L.; Wang, R.; Liu, Y. Prediction of Soil Salinity Using Near-Infrared Reflectance Spectroscopy with Nonnegative Matrix Factorization. Appl. Spectrosc. 2016, 70, 1589–1597. [Google Scholar] [CrossRef]
  64. Song, K.; Li, L.; Li, S.; Tedesco, L.; Hall, B.; Li, Z. Hyperspectral retrieval of phycocyanin in potable water sources using genetic algorithm–partial least squares (GA–PLS) modeling. Int. J. Appl. Earth Obs. Geoinf. 2012, 18, 368–385. [Google Scholar] [CrossRef]
  65. Jin, J.; Wang, Q. Selection of Informative Spectral Bands for PLS Models to Estimate Foliar Chlorophyll Content Using Hyperspectral Reflectance. IEEE Trans. Geosci. Remote Sens. 2018, 57, 3064–3072. [Google Scholar] [CrossRef]
  66. Chen, X.; Dong, Z.; Liu, J.; Wang, H.; Zhang, Y.; Chen, T.; Du, Y.; Shao, L.; Xie, J. Hyperspectral characteristics and quantitative analysis of leaf chlorophyll by reflectance spectroscopy based on a genetic algorithm in combination with partial least squares regression. Spectrochim. Acta Part A Mol. Biomol. Spectrosc. 2020, 243, 118786. [Google Scholar] [CrossRef]
  67. Huang, S.; Zhang, H.; Pizurica, A. Subspace Clustering for Hyperspectral Images via Dictionary Learning With Adaptive Regularization. IEEE Trans. Geosci. Remote Sens. 2021, 60, 1–17. [Google Scholar] [CrossRef]
  68. Lloyd, S.P. Least squares quantization in PCM. IEEE Trans. Inf. Theory 1982, 28, 129–137. [Google Scholar] [CrossRef] [Green Version]
  69. Duan, L.; Xu, L.; Guo, F.; Lee, J.; Yan, B. A Local-Density Based Spatial Clustering Algorithm with Noise. Inf. Syst. 2007, 32, 978–986. [Google Scholar] [CrossRef]
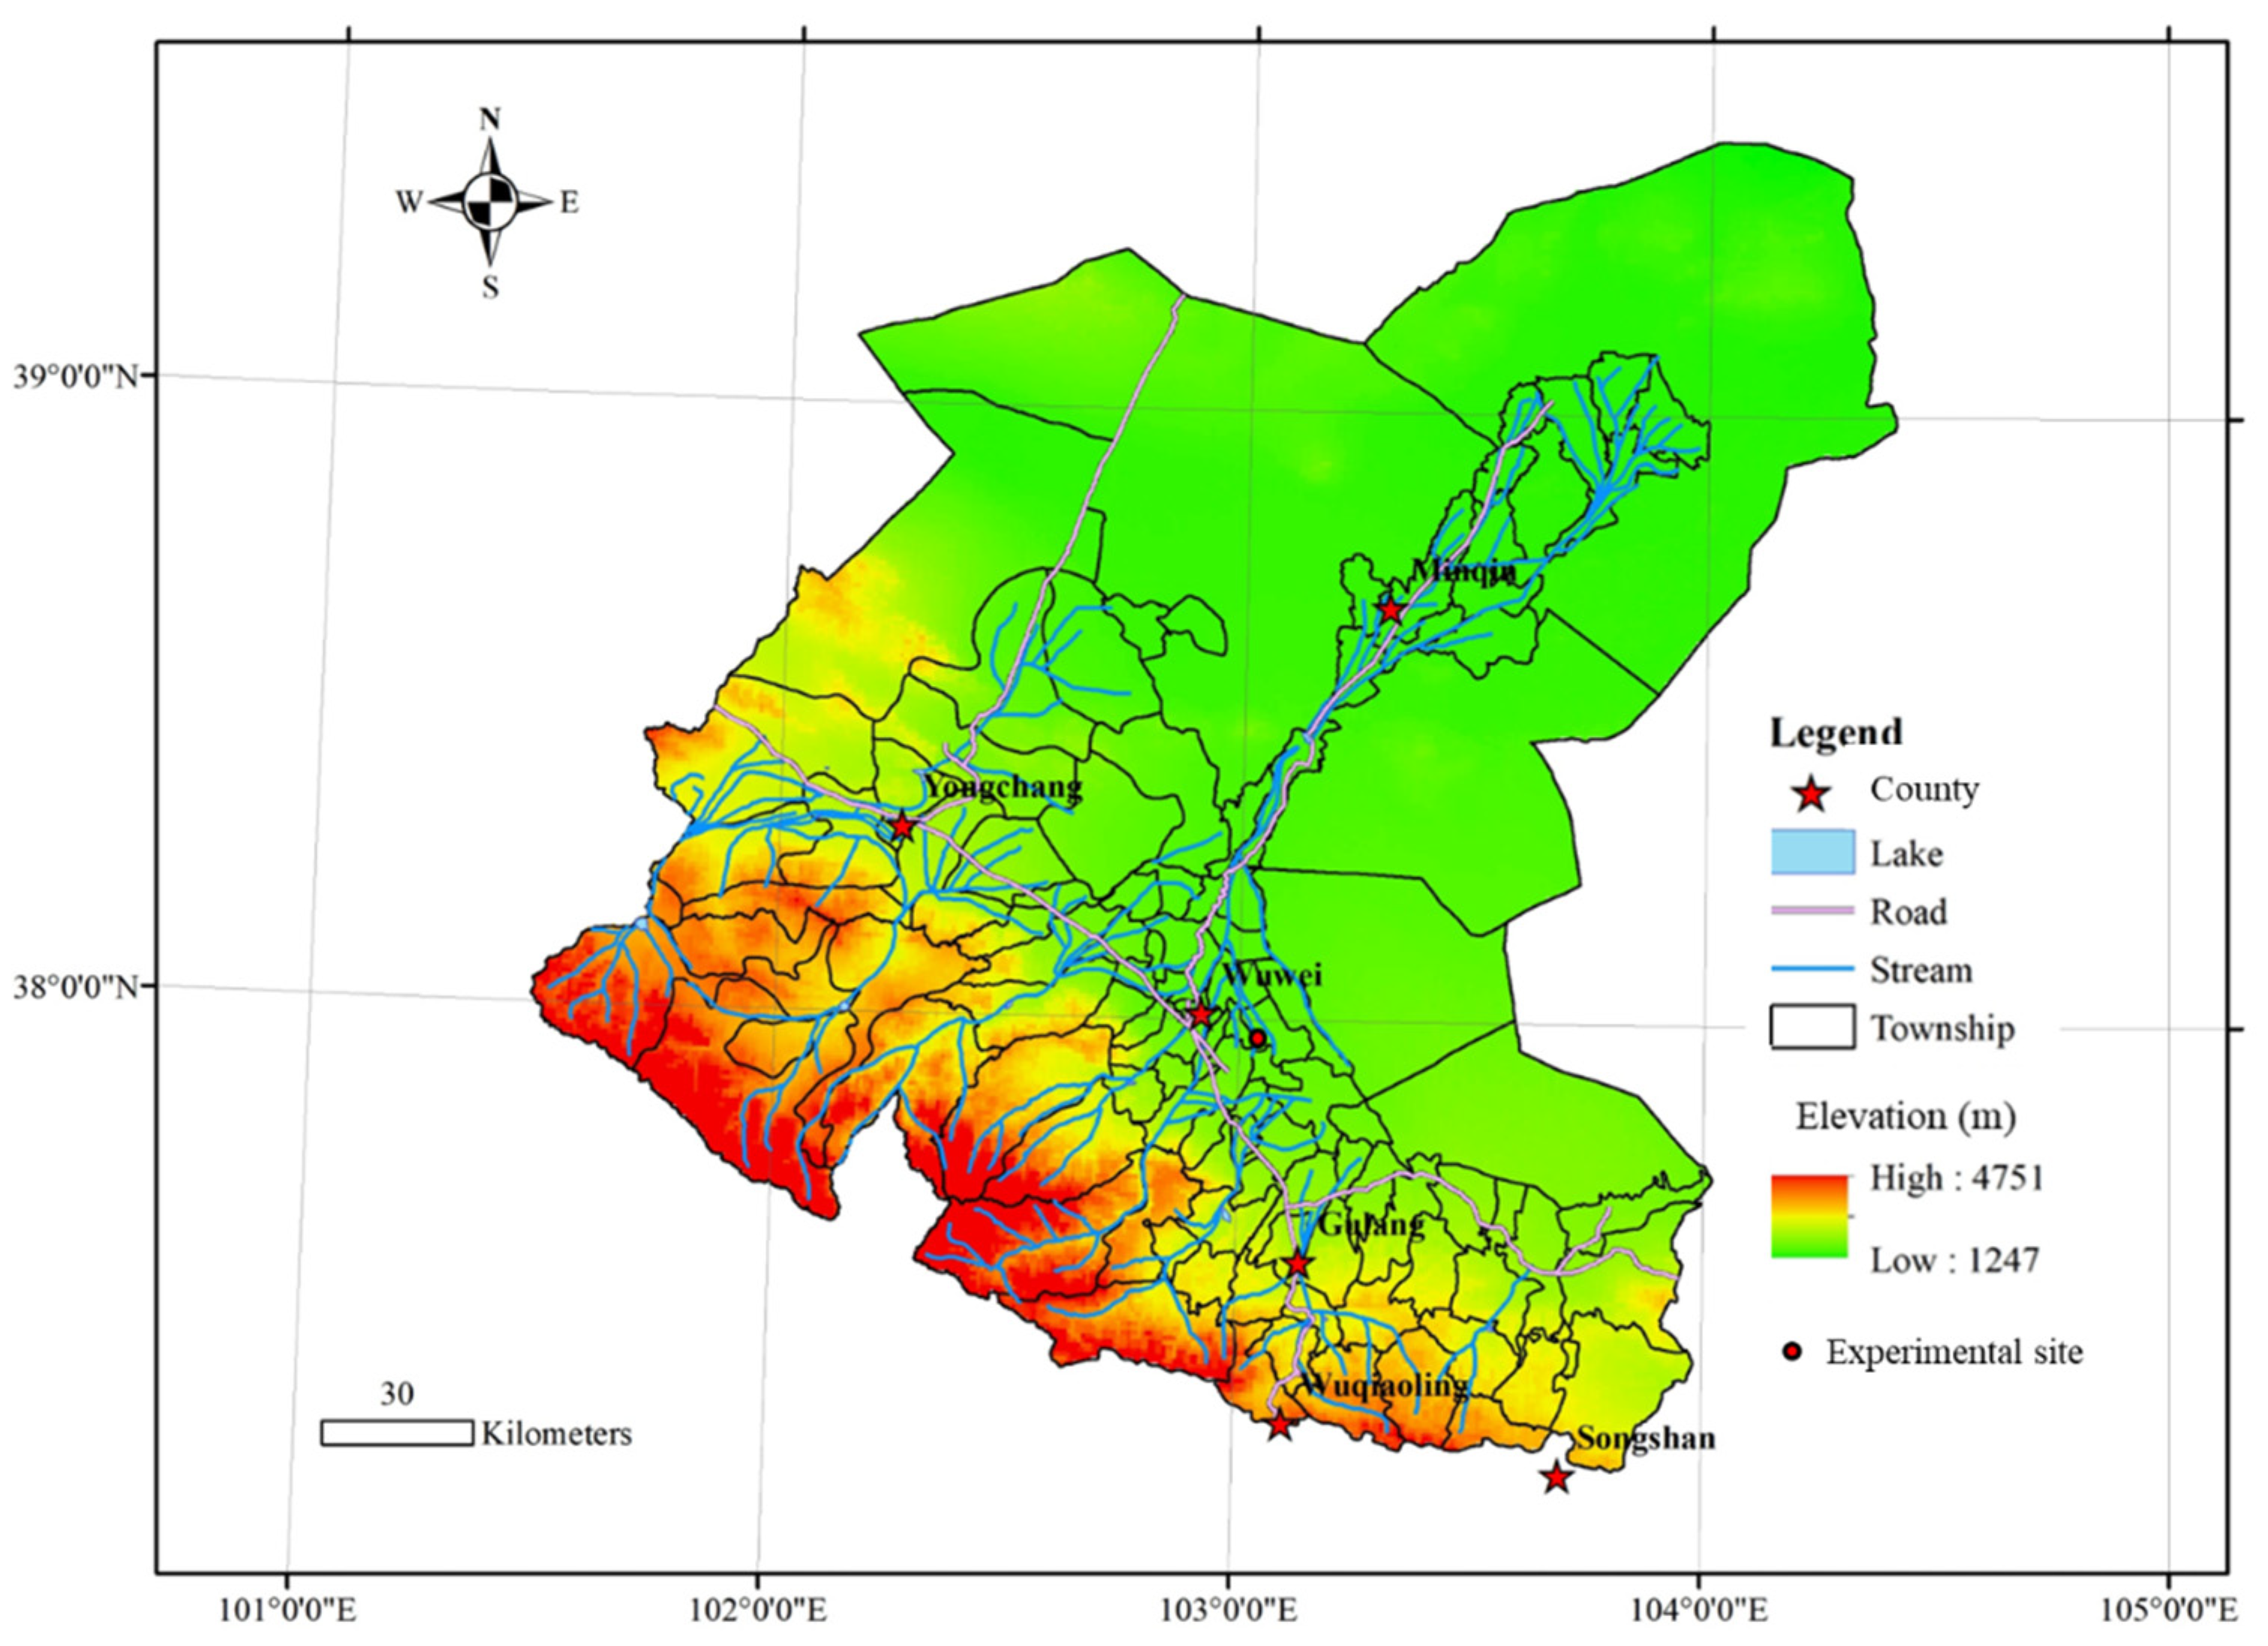
Figure 1. Map of the study area.
Remotesensing 14 06396 g001
Figure 2. Study framework. Note: RSR is raw reflectance spectra reflectance; SSREM is the soil spectral reflectance exponential model; MT is the moisture threshold; MT-SSREM is the modified model based on SSREM considering MT; FD is the first derivative of RSR; SD is the second derivative of RSR; MSC is the multiplicative scatter correction of RSR; SNV is the standard normal variate transform of RSR.
Remotesensing 14 06396 g002
Figure 3. The workflow of splitting the validation and calibration datasets.
Remotesensing 14 06396 g003
Figure 4. The distribution and correlation between each pair of four cation concentrations (g kg−1) in soil samples. Note: ** marks a significant correlation at a level of p < 0.01.
Remotesensing 14 06396 g004
Figure 5. The relationship between SSC and spectral reflectance: (a) variation of spectral reflectance of soil with SSC with SMC 0.11 g g−1; (b) correlation analysis of SSC with reflectance and log(reflectance), respectively.
Remotesensing 14 06396 g005
Figure 6. Variation of spectral reflectance of soils with SMC under three SSC conditions: (a) SSC 0.15 dS m−1, (b) SSC 0.50 dS m−1 and (c) SSC 1.6 dS m−1.
Remotesensing 14 06396 g006
Figure 7. The correlation coefficients of five kinds of spectral data with SMC (ae) and SSC (fj) under different preprocessing methods. (a,f) raw spectral reflectance; (b,g) first derivative; (c,h) second derivative; (d,i) multiplicative scatter correction; (e,j) standard normal transformation.
Remotesensing 14 06396 g007
Figure 8. Relationship between SMC and spectral reflectance: (a) fitting R2 of spectral reflectance and SMC by different functions; (b) spectral reflectance variation with SMC at the wavelength 400 and 650 nm; (c) MT value of each band.
Remotesensing 14 06396 g008
Figure 9. Calibration results of parameters a, b and R0 in the soil spectral reflectance exponential model: (a) parameters a and b; (b) R0.
Remotesensing 14 06396 g009
Figure 10. Comparison of simulated reflectance based on SSREM with measured reflectance: (a) simulation accuracy of calibration dataset; (b) simulation accuracy of validation dataset; (ce) measurement and simulation of wet-soil reflectance from calibration dataset and (fh) from validation dataset.
Remotesensing 14 06396 g010aRemotesensing 14 06396 g010b
Figure 11. Comparison of simulated reflectance based on MT-SSREM with measured reflectance: (a) simulation accuracy of calibration dataset; (b) simulation accuracy of validation dataset; (ce) measurement and simulation of wet-soil reflectance from calibration dataset and (fh) from validation dataset.
Remotesensing 14 06396 g011
Figure 12. Performance of suggested bands to estimate SSC based on MT-SSREM and SSREM. (at) 658~660, 672~685, 938, 939 and 961 nm.
Remotesensing 14 06396 g012
Figure 13. First derivative of reflectance.
Remotesensing 14 06396 g013
Table 1. The statistics of the soil particle-size distribution.
PropertiesMeanStandard Deviation (SD)
Soil particle-size distribution (%)Sand (2~0.05 mm)4.910.054
Silt (0.05~0.002 mm)36.540.13
Clay (<0.002 mm)58.554.57
Table 2. Statistics of SMC and SSC for the calibration and validation datasets used in this study.
Calibration DatasetValidation Dataset
n276183
SMC (g g−1)Max0.270.29
Min0.0500.070
Average0.100.12
SD0.0480.052
SSC (dS m−1)Max2.843.29
Min0.100.095
Average0.410.42
SD0.430.50
Table 3. Statistics of R2 and RMSE for SSREM and MT-SSREM.
R2RangeMeanSDProportion (%)
≤0.530.53 < R2 < 0.75≥0.75
SSREM-cal0~0.980.750.2818.4811.5969.93
SSREM-val0~0.980.770.2414.2114.7571.04
MT-SSREM-cal0.53~0.980.920.06202.1797.83
MT-SSREM-val0.75~0.980.940.03500100
RMSERangeMeanSDProportion (%)
≤0.050.05 < RMSE < 0.1≥0.1
SSREM-cal0.014~0.230.0810.03926.0946.0127.90
SSREM-val0.018~0.220.0790.03725.6847.5426.78
MT-SSREM-cal0.014~0.160.0690.03436.9643.8419.20
MT-SSREM-val0.016~0.170.0680.03537.7142.6219.67
Note: SSREM-cal, SSREM-val, MT-SSREM-cal, MT-SSREM-val: SSREM calibration dataset result, SSREM validation results, MT-SSREM calibration dataset result, MT-SSREM validation results, respectively.
Publisher’s Note: MDPI stays neutral with regard to jurisdictional claims in published maps and institutional affiliations.