Article

A Complete Meteo/Hydro/Hydraulic Chain Application to Support Early Warning and Monitoring Systems: The Apollo Medicane Use Case

1
CIMA Research Foundation, Via A. Magliotto 2, 17100 Savona, Italy
2
Department of Informatics, Bioengineering, Robotics and Systems Engineering (DIBRIS), University of Genoa, 16145 Genova, Italy
3
Italian Civil Protection Department, 00189 Rome, Italy
*
Author to whom correspondence should be addressed.
Remote Sens. 2022, 14(24), 6348; https://doi.org/10.3390/rs14246348
Submission received: 9 November 2022 / Revised: 12 December 2022 / Accepted: 12 December 2022 / Published: 15 December 2022
(This article belongs to the Special Issue Hydrometeorological Hazards in the USA and Europe)

Abstract

:
Because of the ongoing changing climate, extreme rainfall events’ frequency at the global scale is expected to increase, thus resulting in high social and economic impacts. A Meteo/Hydro/Hydraulic forecasting chain combining heterogeneous observational data sources is a crucial component for an Early Warning System and is a fundamental asset for Civil Protection Authorities to correctly predict these events, their effects, and put in place anticipatory actions. During the last week of October 2021 an intense Mediterranean hurricane (Apollo) affected many Mediterranean countries (Tunisia, Algeria, Malta, and Italy) with a death toll of seven people. The CIMA Meteo/Hydro/Hydraulic forecasting chain, including the WRF model, the hydrological model Continuum, the automatic system for water detection (AUTOWADE), and the hydraulic model TELEMAC-2D, was operated in real-time to predict the Apollo weather evolution as well as its hydrological and hydraulic impacts, in support of the early warning activities of the Italian Civil Protection Department. The WRF model assimilating radar data and in situ weather stations showed very good predictive capability for rainfall timing and location over eastern Sicily, thus supporting accurate river flow peak forecasting with the hydrological model Continuum. Based on WRF predictions, the daily automatic system for water detection (AUTOWADE) run using Sentinel 1 data was anticipated with respect to the scheduled timing to quickly produce a flood monitoring map. Ad hoc tasking of the COSMO-SkyMed satellite constellation was also performed to overcome the S1 data latency in eastern Sicily. The resulting automated operational mapping of floods and inland waters was integrated with the subsequent execution of the hydraulic model TELEMAC-2D to have a complete representation of the flooded area with water depth and water velocity.

1. Introduction

Medicane, the short name for Mediterranean hurricane [1], is a cyclone that can manifest different characteristics at different stages of its life cycle. Its genesis is typical of extra-tropical cyclones that are frequently observed in the middle latitudes, but under certain conditions, it can evolve into phenomena similar to hurricanes that develop in the tropical belts of the Atlantic, Pacific, and Indian oceans. Genesis is characterized by the presence of a strong temperature difference between the upper layers of the atmosphere (colder) and those low and close to the earth’s surface (warmer). Evolution into a tropical-like cyclone occurs when there is sufficient exchange of heat and moisture between the sea and the lower atmosphere to fuel the development of massive storm clouds. Typical characteristics are nearly circular symmetry, a deep warm core, a closed eye in its center with spiral cloud coverage around, and maximum 10 m wind speed at 20–30 km from its center. Medicanes never reach the intensities of hurricanes of the highest category, at most they have winds comparable to category 1 hurricanes, i.e., higher than 110 km/h. For comparison, Category 5 cyclones have winds above 250 km/h. In addition, Medicanes last less long, from 24 to 36 h, while tropical cyclones can last even weeks. The literature [2,3] agrees in estimating an annual incidence of around 1.5 events, concentrated in the months between September and April. Recently, [4] demonstrated that cloud resolving grid spacing hindcast simulations are able to reproduce the fine-scale structure of the Medicane event of 7 and 8 November 2014, near southern Sicily, conversely poorly predicted by operational numerical weather prediction (NWP) models, which failed to reproduce the trajectory of the cyclone. In particular, the simulations characterized by a grid spacing ≥ 5 km miss the first intensification phase of the cyclone and do not predict the correct landfall time over Sicily. Instead, simulations performed with a grid spacing ≤ 2.5 km correctly reproduce the initial deepening of the cyclone and the northward turn towards Sicily during the evening of 7 November. A powerful Medicane, named Apollo, affected many countries on the Mediterranean coast, especially southern Italy, in October 2021, causing a death toll of seven people. A low-pressure area, centered over the Strait of Sicily, led to disturbed weather conditions on the southernmost regions of the Italian peninsula, especially on the Ionian sectors of Calabria and Sicily. On 25 October 2021, an intense Mediterranean Cyclone developed over the sea south of Sicily. Due to the Medicanes aforementioned intrinsic characteristics, such as long-lived [5] and high-impact effect, the Apollo Medicane was chosen as a test case because it allows to test all the chain components in real or near-real time to support civil protection during the forecasting and monitoring phase. This study aims to test the predictive capability of an operational meteo/hydro and hydraulics forecasting chain from the atmospheric processes to the hydraulic scenarios through the hydrological phenomena for this high-impact event and to assess the possible chain components’ support for civil protection purposes. These kind of chains are one of the components of a complete Early Warning System that the Sendai Framework incorporates into one of its seven global targets: “Substantially increase the availability and access to multi-hazard early warning systems and disaster risk information and assessments to people by 2030”. Thus, this event has been used as a benchmark for the CIMA (Centro Internazionale di Monitoraggio Ambientale) meteo-hydrological forecasting and monitoring chain operational version in real-time mode, as well as for its enhanced version in hindcast mode. The operational counterpart of the CIMA meteo/hydro/hydraulic chain was operated in real-time to predict the Apollo weather evolution, as well as its hydrological and hydraulic impacts. The chain includes the Weather Research Forecasting (WRF) model without data assimilation (WRF-OL hereafter) feeding the hydrological model Continuum in the forecasting phase, the automatic system for water detection (AUTOWADE) and the hydraulic model TELEMAC-2D to assess the hydraulics impact running on meteorological observations. Furthermore, in hindcast mode, an enhanced version of the CIMA forecasting chain starting from the meteorological outputs obtained with the WRF model improved with a 3DVAR data assimilation of radar reflectivity and personal weather stations of Wunderground network (WRF-DA) up to the hydrological forecast with the Continuum model, and hydraulic impacts obtained with TELEMAC-2D was investigated. The chain application uses many kind of observations for the different steps, such as radar reflectivity observations, temperature observations from ground stations, and satellite data from Sentinel, COSMO SkyMed (CSK), and COSMO 2nd generation (CSG) acquisitions. All the chain step results are directly uploaded and visualized on MyDewetra platform (Dewetra in Figure 1), which was developed by CIMA Research Foundation and is used by the Italian Civil Protection Department for risk management during emergencies [6]. The forecasting chains used in this work enable a step change in how high-impact weather events can be predicted and monitored with a rich portfolio of observational data used and assimilated and a full exploitation of high-performance and cloud computing facilities, built on top of the H2020 project LEXIS (https://cordis.europa.eu/project/id/825532) (accessed on 11 December 2022). This application is the result of an interdisciplinary effort based on the cooperation of research fields such as meteorology, hydrology, hydraulics, Earth Observation, and ICT (Information and Communications Technology). Figure 1 reports all the steps and the tools used to build the complete chain used partially already in operational mode and in hindcast:
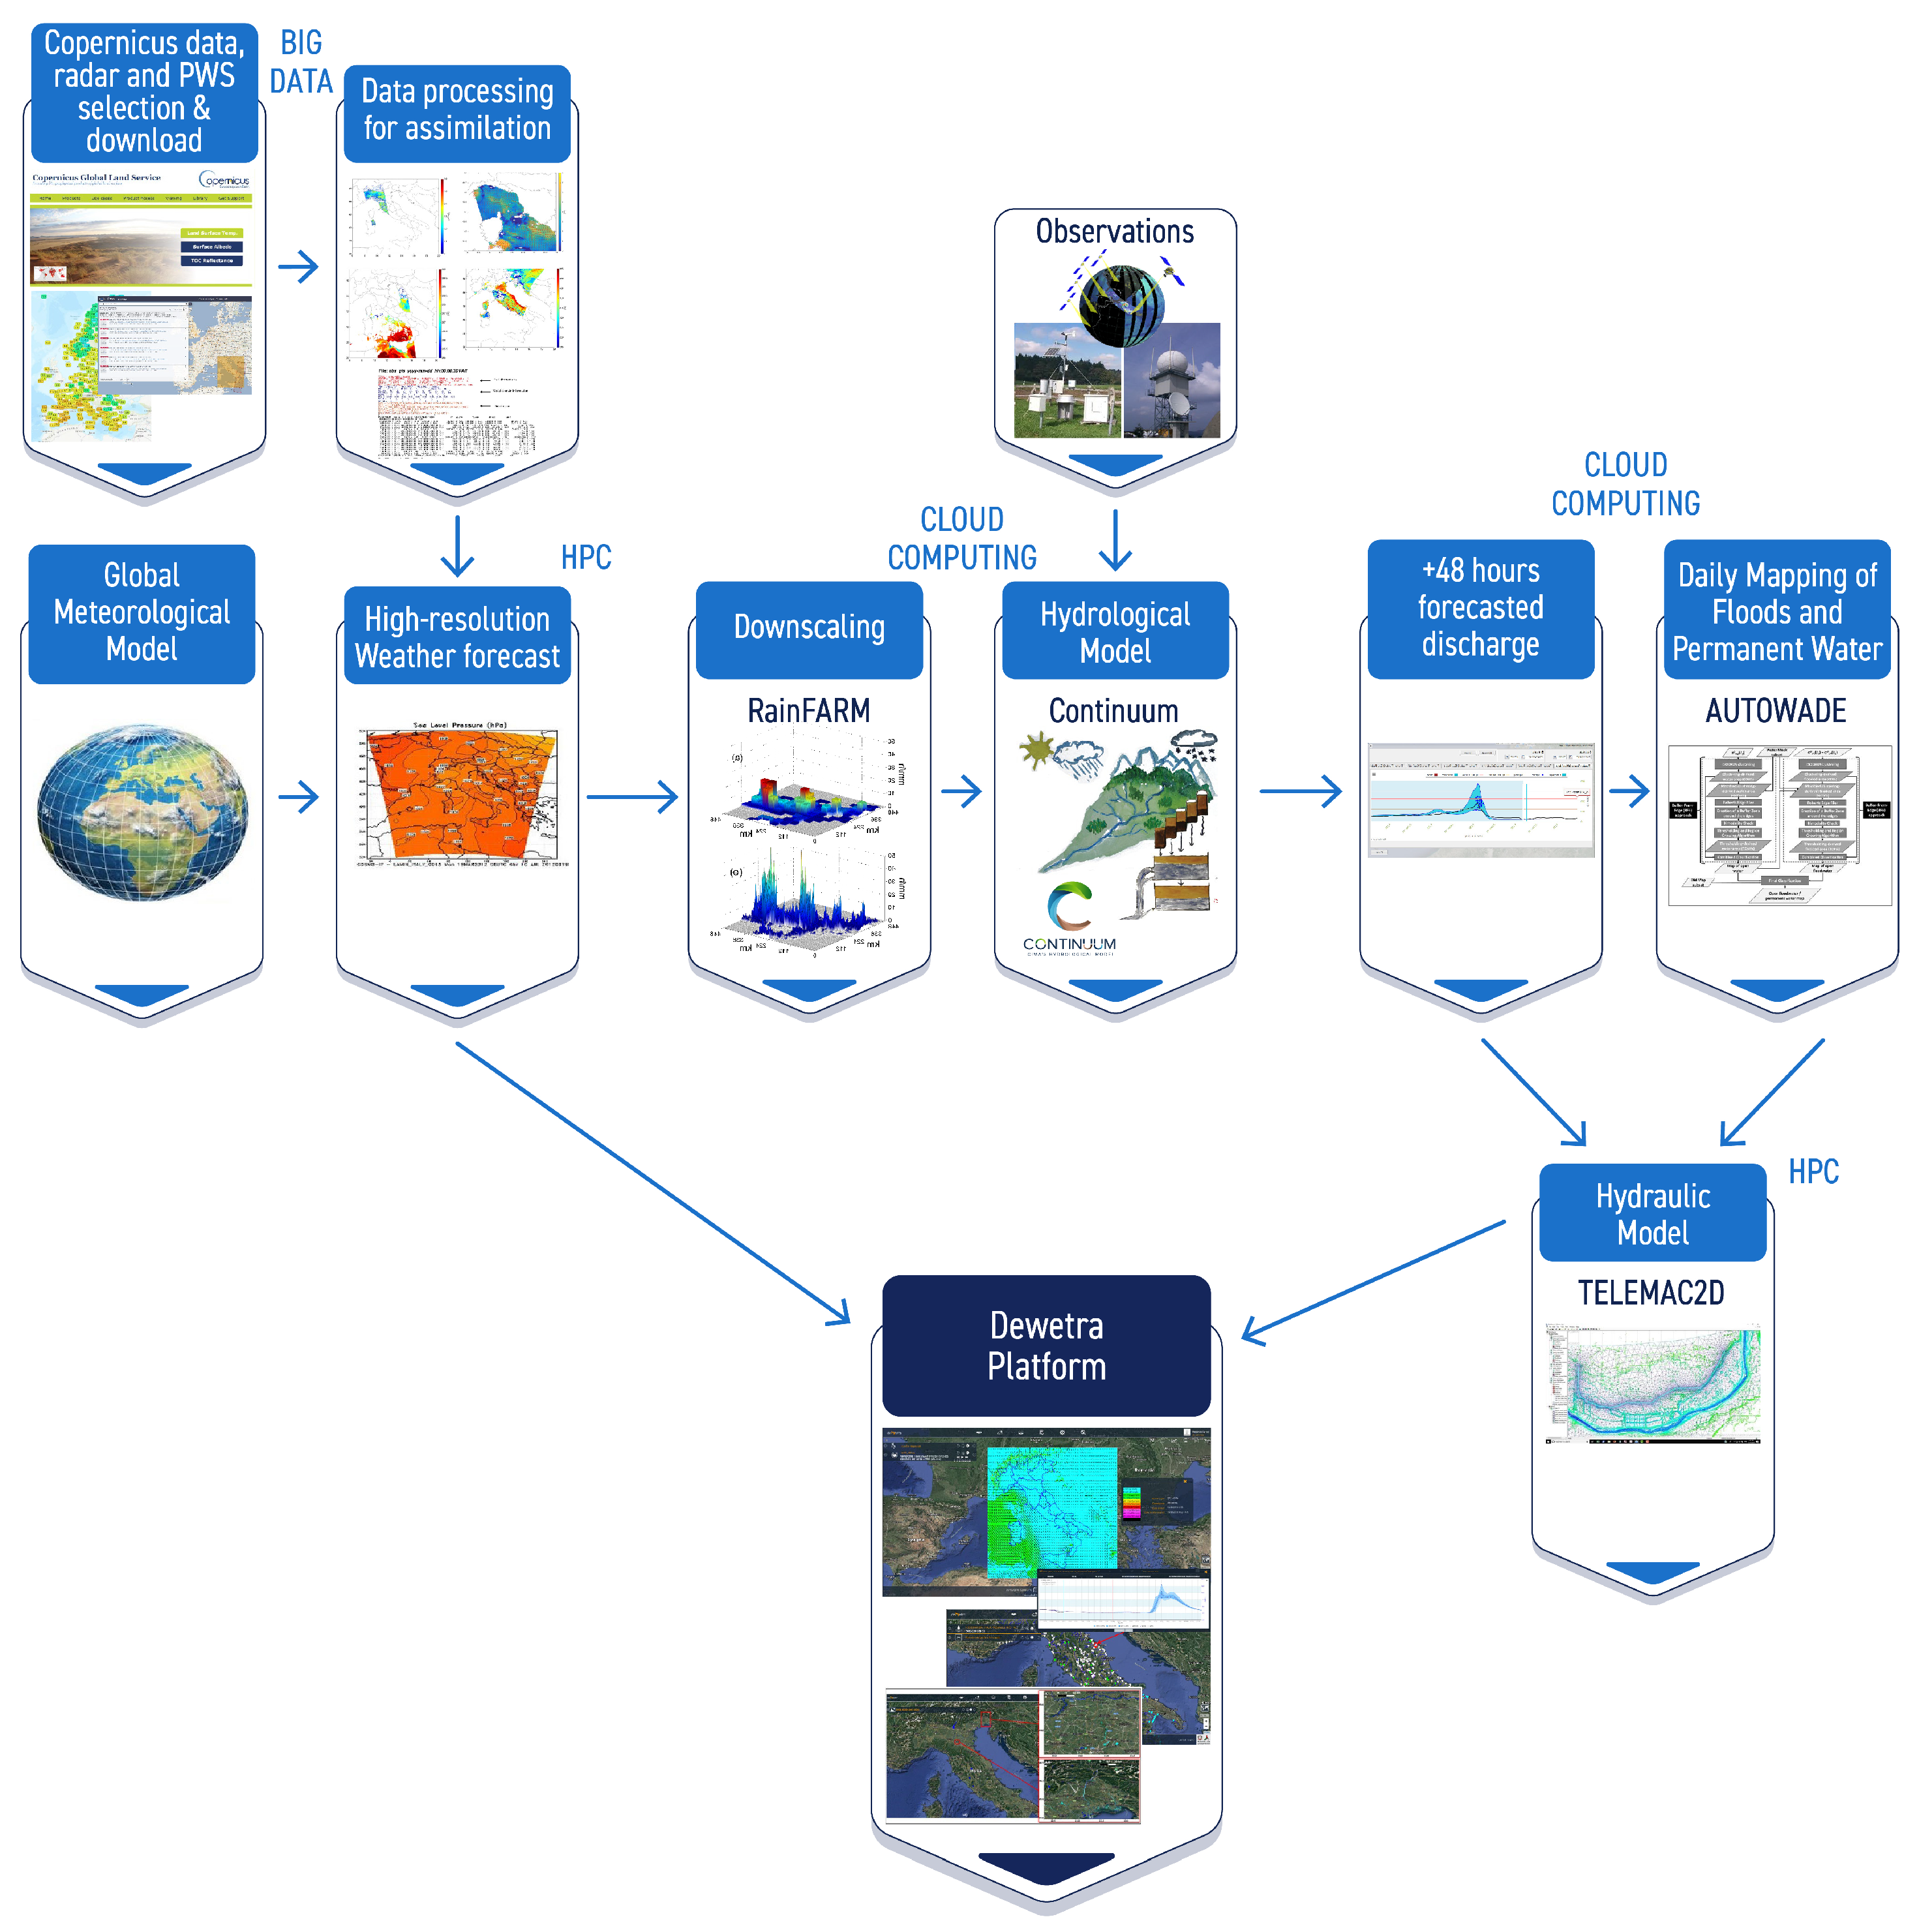
  • Data download and storage services: Supporting the modeling and observational data stream for the subsequent modeling instances.
  • Meteorological forecasts: The WRF meteorological model, executed on High-Performance Computing (HPC) facilities, provides high-resolution weather forecasts after the assimilation of radar reflectivity and weather station observations.
  • Hydrological forecast: The fully distributed hydrological model Continuum, executed on cloud computing facilities, provides the peak discharge forecast based on the WRF meteorological input and assimilated Sentinel 1 soil moisture products.
  • Flooded area detection: The automatic system for water detection (AUTOWADE) exploits satellite acquisitions, along with ad hoc tasks set depending on the meteorological forecasts (Sentinel 1 and COSMO SKYMED) to operationally monitor the flooded areas.
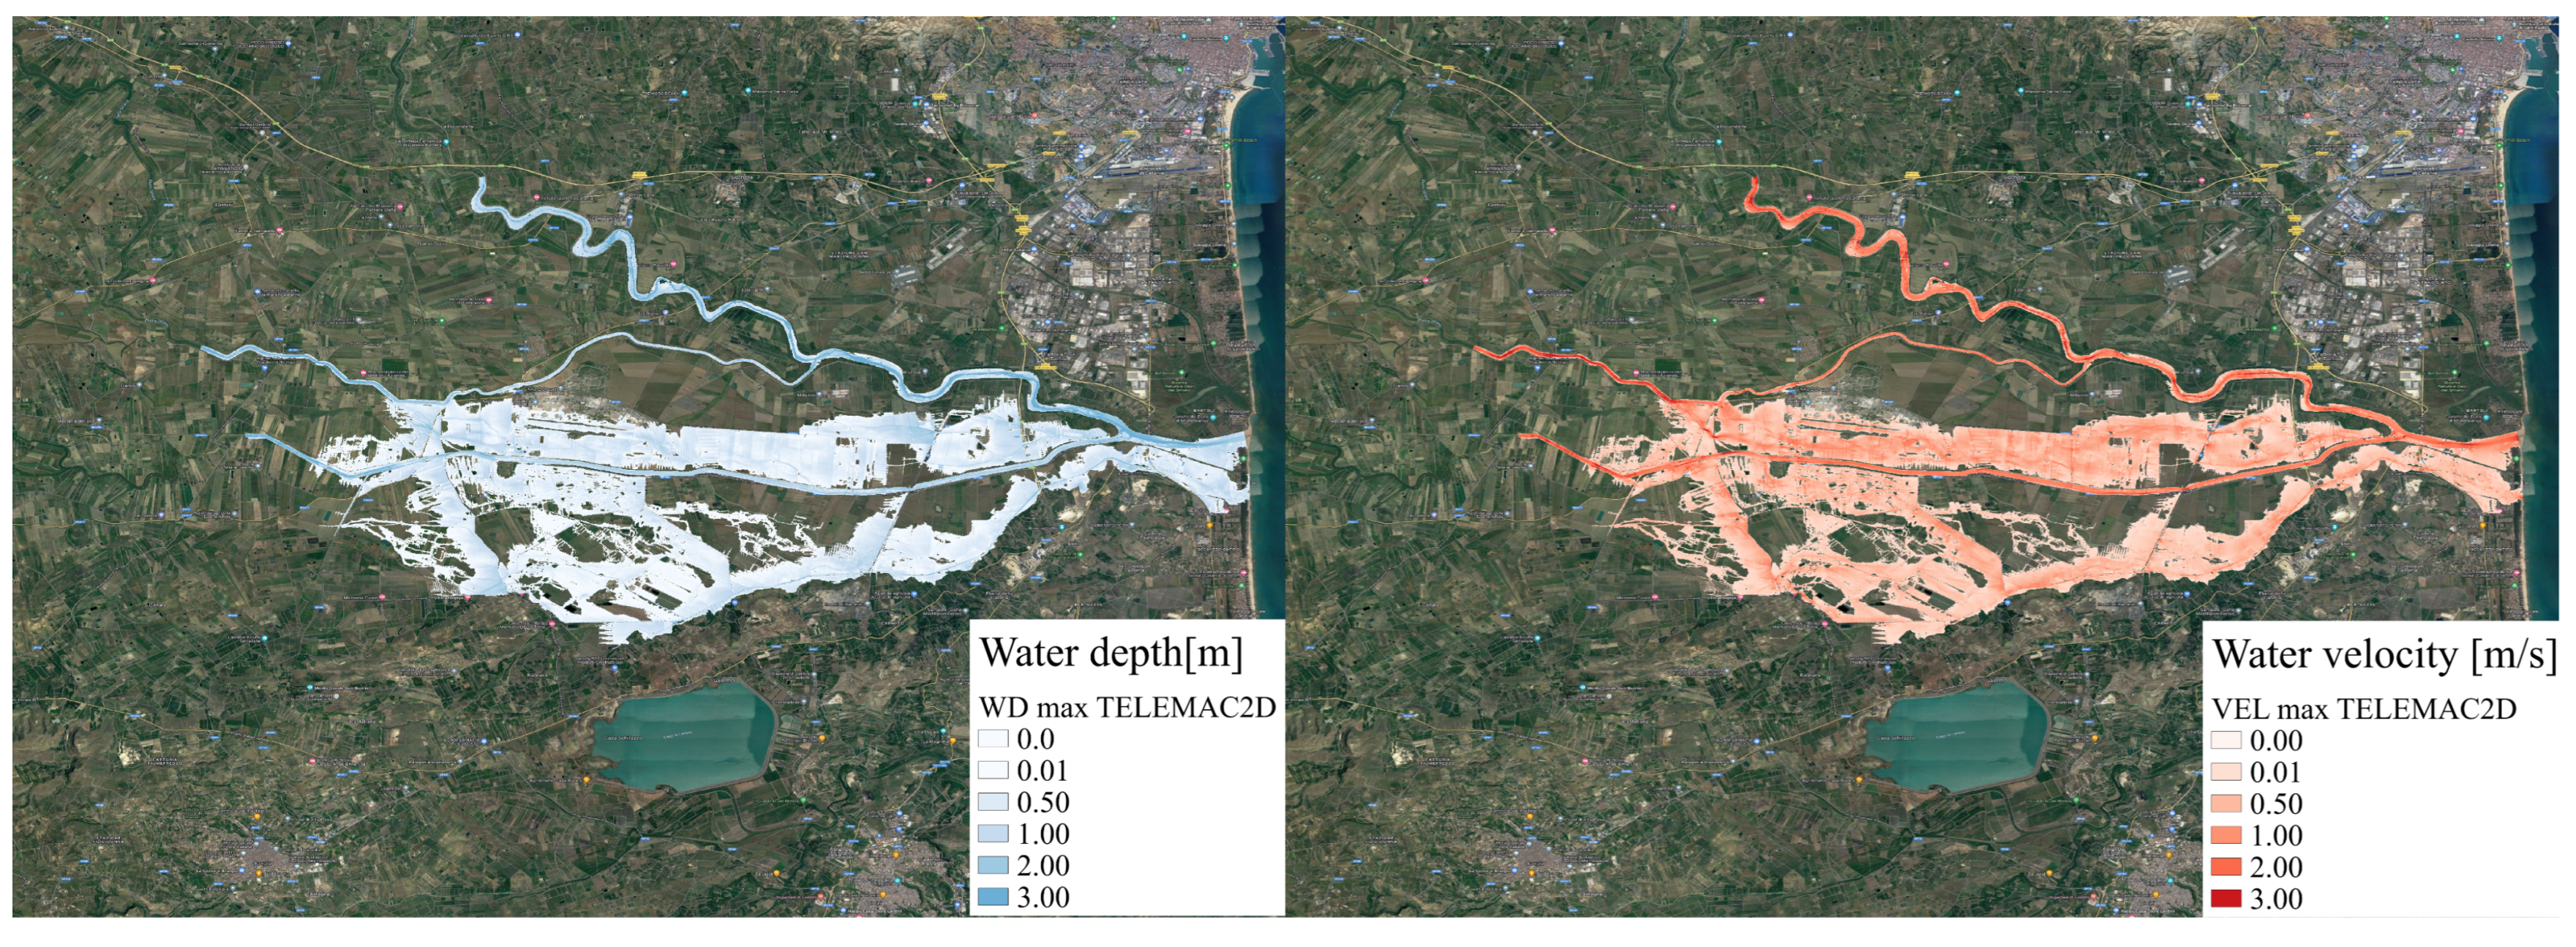
  • Hydraulic forecast: The TELEMAC-2D hydraulic model, executed on HPC facilities, integrates Continuum forecasts to predict flooded areas.
The paper is divided as follows: Section 2 describes the Materials and Methods, including a short case study description and all the model setups used in this work. The results are discussed in Section 3, dividing the operational and the hindcast research phase and, eventually, some concluding remarks about the forecast chain performances are reported in Section 4.

2. Materials and Methods

2.1. Case Study Description: The Apollo Medicane

The genesis of the Medicane was a low-pressure system which isolated near the Balearic islands around 22 October 2021 and then moved towards the Algerian and Tunisian coastline, already producing damages on 23 October 2021. During its movement towards the southeast, it affected Sicily by producing self-regenerating thunderstorms around the Catania area in the late afternoon of 24 October 2021. It then moved towards Libya, but on 27 October, it changed direction, again approaching Sicily. Finally, on 29 October 2021, it moved towards the southeast, fading on 2 November off the Turkish cost. Figure 2 shows the atmospheric conditions at 00UTC on 25 October, when the flood hit the Catanian plain. The cold air intrusion at 500 hPa caused a strong convective instability, and the wind convergence over eastern Sicily maintained the precipitation over the same area for hours. Moreover, the barotropic structure of the cyclone at this stage contributed to keep the phenomena over the same place. Between Sunday 24 and Tuesday 26 October 2021, the amount of rain recorded by the Regional Agrometeorology Service of Sicily (SIAS—http://www.sias.regione.sicilia.it/) (accessed on 11 December 2022) was 180 mm in Catania (CA black dot in Figure 4, panel A), 280 mm in Lentini (Syracuse, LE black dot in Figure 4, panel A), about 230 mm in Fabrizia (Vibo Valentia, FA black dot in Figure 4, panel A), and 520 mm in Linguaglossa-Monte Conca (Catania, LI black dot in Figure 4, panel A). This station is placed at an altitude of 1875 m on the northeastern side of Etna, and it is particularly prone to humid eastern winds because the mountain acts as an orographic barrier. It has to be highlighted that, in Lentini, 280 mm was recorded during 24 October. The situation was correctly predicted and a red alert (the most Severe Weather Warning in the Italian system) was issued by the National Department of Civil Protection. Nevertheless, the runoff produced an extended flood over the Catanian plain with several casualties.
The event hit, with harmful effects, the eastern side of Sicily Island and the south of the Calabria Region. The area is mainly characterized by several small coastal basins of a few hundred square kilometers with steep slopes and low corrivation times. Within the area of interest is located a medium/big basin: the Simeto River, in Sicily, with an area of about 4186 km2 and an elevation that ranges from the sea up to a maximum of 3274 m asl. Within the Simeto basins, there is the Catanian floodplain that was severely flooded and is modeled with a 2D hydraulic model in the present work. The Simeto basin is characterized a northern sector with rough and rugged forms of lanscape due to the presence of arenaceous-conglomerate and quartzarenitic outcrops which constitute, in large part, the Nebrodi mountain group [7]. To the west and southwest are the Erei Mountains, of arenaceous and calcarenitic-sandy nature, isolated and with hilly morphology. In the central-southern portion of the area under examination, the plastic and sandstone post-orogenic soils, which are easily eroded, give rise to a hilly landscape with very softened shapes. Gypsums represent the most widespread lithotype and, due to their high solubility, they are affected by karst phenomena. The eastern sector is affected by the presence of the volcanic relief of Etna; the morphology is characterized by not very steep slopes which, in the presence of recent lava flows, take on a more rugged aspect. Finally, the southeastern sector presents a flat morphology with the “Piana di Catania”. The basin has about 89% arable land and tree forest for the remaining part. The Catanian plain has an area of 430 km2, equal to a fifth of all the plains of the island, and is one of the largest in southern Italy. The Catanian plain was formed with the alluvial deposit accumulation from the Dittaino, Gornalunga, and Simeto rivers and their tributaries. It is surrounded by mountains and hills and is an alluvial plain; Etna dominates it with its imposing mass and, in a certain way, is its architect, making it fertile with the products of its volcanic activity. It is one of the most important agricultural areas of Sicily. The prevailing agriculture is citrus farming with an almost absolute prevalence of the orange tree, but there are also olive groves, cereals, and legumes (for a complete area description refer to [8]).

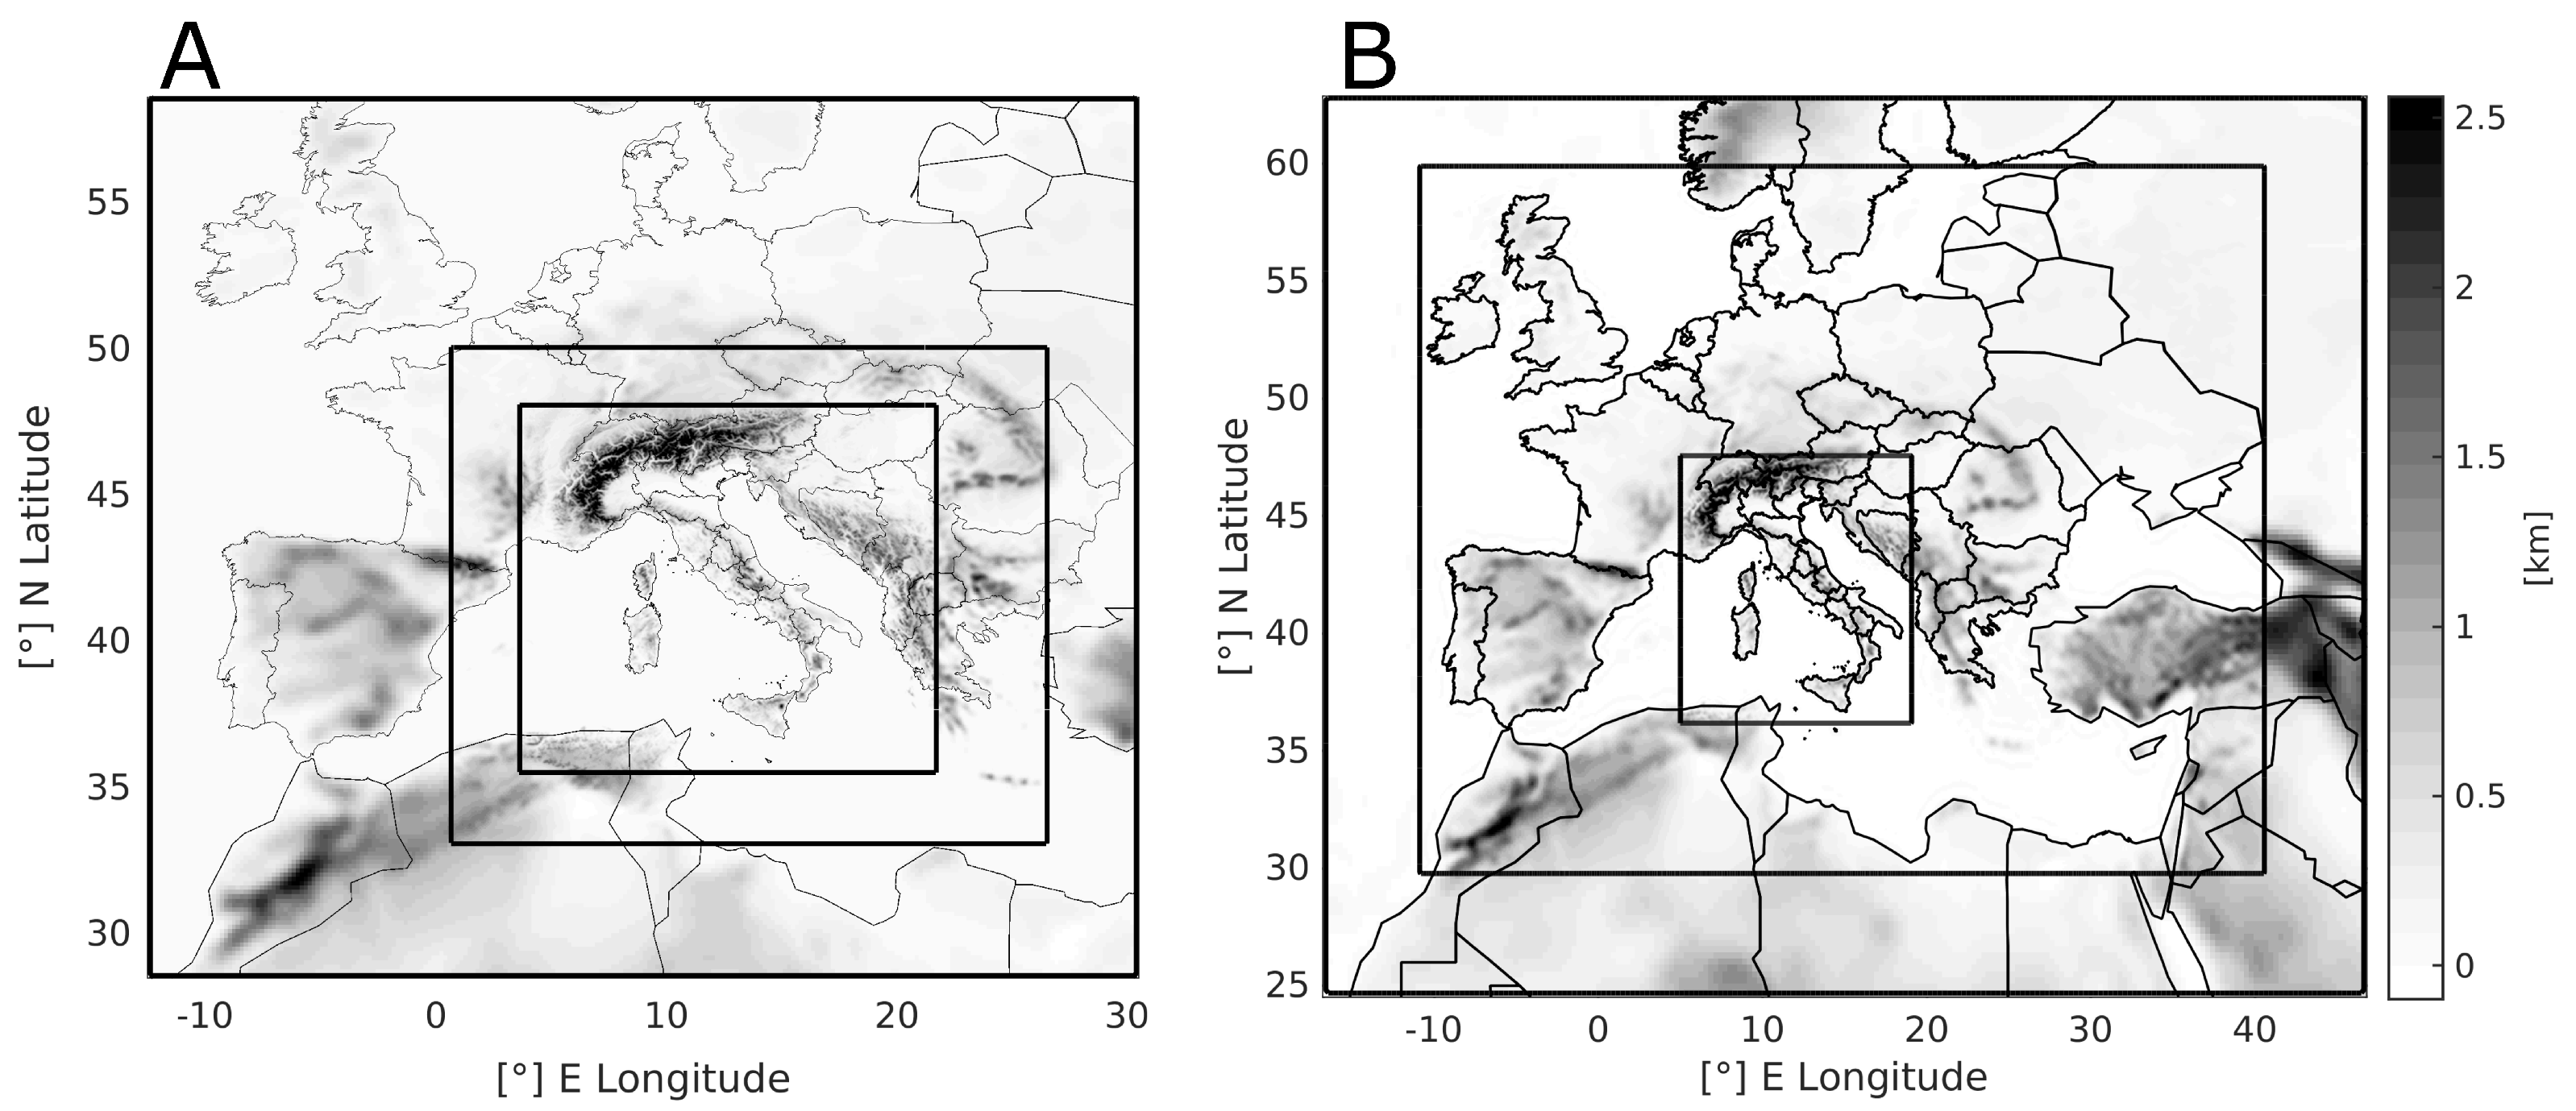
2.2. The Meteorological Model: WRF

The WRF model [9] is used in this work both in operational application without data assimilation (WRF-OL) and in hindcast mode assimilating radar data and in situ weather stations (2 m temperature data, WRF-DA). WRF is a compressible nonhydrostatic model with mass-based terrain-following coordinates that was developed at the National Center for Atmospheric Research (NCAR) in collaboration with several institutes and universities for operational weather forecasting and atmospheric science research. For this study, three two-way nested domains were used in both configurations. The WRF-OL setup adopts a horizontal grid spacing of 13.5, 4.5, and 1.5 km with 50 vertical levels (Figure 3 panel A). The WRF-DA setup has instead a horizontal grid spacing of 22.5, 7.5, and 2.5 km with 50 vertical levels (Figure 3 panel B); all domains’ tops reach 50 hPa. The WRF-OL and WRF-DA setup have different grid spacing because the configurations used are both already operationally run in CIMA Research Foundation. Thus, for the experiment with data assimilation, the decision was to maintain the setup already running with cappi reflectivity assimilation, with consolidated background error covariance matrix, adding only the 2 m temperature assimilation for the hindcast experiment.
All the simulations are performed with the same set of physical parameterizations (Table 1), described hereafter, that have already been successfully tested in other extreme events studies over Italy [10,11,12]. The MM5 scheme is adopted as surface layer [13,14,15]. A [16] scheme is used to enhance surface fluxes of heat and moisture. The Rapid Update Cycle (RUC) scheme is used as a multi-level soil model (6 levels), with higher resolution in the upper soil layers (0, 5, 20, 40, 160, and 300 cm). This soil model solves the heat diffusion and Richards moisture transfer equations (with a layer approach) and, in the cold season, considers phase changes in soil water [17,18]. The planetary boundary layer (PBL) dynamics are parameterized with the diagnostic nonlocal Yonsei University (YSU) PBL scheme [19]. The WSM6 microphysics six-class scheme is adopted [20]. Lastly, the radiative processes are parameterized by means of the longwave and shortwave RRTMG schemes [21]. Both model setups in their innermost domains are at the km scale, therefore adopting cloud-resolving grid spacing; thus, they both have an explicit treatment of convection.
The initial and lateral boundary conditions are derived from NCEP-GFS (National Centers for Environmental Prediction Global Forecast System) analysis and forecast data available at a horizontal grid spacing of 0.25 × 0.25 and a 3 h time resolution. The forecasts in this work are initialized at 00 UTC on 24 October 2021.
The research forecasts with data assimilation (WRF-DA setup) were implemented with a 3-h cycle 3DVAR technique of radar reflectivity and personal weather station (Wunderground) data at 18-21-00 UTC before the 48 h free forecast. The WRF data assimilation package WRFDA v3.9.1 is used. For the applied 3DVAR [12], the reflectivity operator used is the modified direct operator. This work adopts the Control Variable option 5 (CV5) of the WRFDA package for the B matrix (background error covariance matrix) calculation using the National Meteorological Center (NMC) method [22]. It estimates climatological background error covariances using a process that assumes background errors to be well-approximated by averaged forecast difference statistics [12]:
B = ϵ b ϵ b T ¯ = ( X t + 24 X t + 12 ) ( X t + 24 X t + 12 ) T ¯
where X t is the true state of the atmosphere and ϵ b is the background error. The overbar means an average over time and space. Thus, the NMC method was applied over the entire month of October 2015 with a 24-h lead time for the forecasts starting at 00:00 UTC and a 12-h lead time for the ones initialized at 12:00 UTC of the same day. The differences between the two forecasts ( t + 24 and t + 12 ) valid for the same reference time were used to calculate the domain-specific error statistics.

2.3. The Hydrological Modeling Chain: Flood-PROOFS

Flood-PROOFS (Flood PRObabilistic Operative Forecasting System) is a system designed to support decision makers during the operational phases of flood forecasting, flood monitoring, and water resource management. Its main goal is to protect the population and infrastructure from damage caused by intense precipitation events. The system is operational for the Italian National Civil Protection Department and other hydro-meteorological offices in different countries (e.g., Bolivia, Caribbean, plus ongoing implementation in the Greater Horn of Africa and Mozambique). The Flood-PROOFS system manages the data flow deriving from various modeling tools developed by the CIMA Research Foundation to return a quantitative assessment of the effects that severe weather conditions can have in terms of river flow and probability to overcome critical thresholds.
Flood-PROOFS’ core is the distributed hydrological model Continuum [23,24]. The Continuum solves both mass and energy balance equations on a regular grid, using hydro-derivatives (flow direction, flow accumulation, and slope) extracted from a Digital Elevation Model (DEM), as well as land cover and soil texture information. Within Flood-PROOFS, the Continuum is forced by meteorological observations from Automatic Weather Stations (AWS), meteorological radar, satellite, and meteorological models’ forecasts. A description of the forecasting chain and its application on the whole of Italy can be found in [25]. The Continuum is both an operational and research model; some studies that involve Continuum are: [26,27,28,29,30,31]. Flood-PROOFS and the Continuum are open-source tools available at https://github.com/c-hydro (accessed on 11 December 2022).

2.4. The Automatic System for Water Detection: AUTOWADE

AUTOWADE (AUTOmatic Water Areas DEtector, [32]) is an automatic processor, which does not need any supervision or user intervention, that performs a systematic daily mapping of water surfaces (both floodwater and permanent water bodies) using Sentinel-1 (S1) data [32]. It was originally designed to respond to the Italian National Civil Protection Department’s need of monitoring the water surfaces’ extent. Therefore, it works at the national (Italian) scale. The AUTOWADE processor is formed by different components. The main component is obviously water detection, but other components are included, such as the automatic downloading of S1 images (GRD products) and their preprocessing to derive geocoded and calibrated data, the generation of reference and exclusion masks, and the delivery of the data to the end user. All these components are sequentially executed in a fully automated way. The water mapping algorithm implemented in AUTOWADE combines different image processing techniques, such as clustering, edge filtering, automatic thresholding, and region growing; it is applied to copolarized data only. The floodwater detection performed by AUTOWADE using Sentinel-1 SAR data is based on a change detection approach that uses a preflood image acquired under standard conditions and an image of the flood. The approach identifies the modifications of the roughness and the reflectivity of the ground due to the presence of floodwater. When the electromagnetic radiation transmitted by SAR impinges upon a target, the amplitude and phase of the backscattered electromagnetic field depend on the physical (i.e., geometry and roughness) and electrical (i.e., dielectric constant) properties of the target itself. These properties are substantially changed by the presence of floodwater. In particular, the roughness of the surface decreases because floodwater is generally very smooth (in the absence of significant winds). This implies that standing water reflects most of the impinging radiation toward the specular direction and the portion of the radiation that is backscattered toward the radar (which basically represents the SAR measurement) is very low. Then, the presence of floodwater implies a significant decrease in the backscattering with respect to that measured under nonflooded conditions.
AUTOWADE is scheduled to run twice a day to process both ascending and descending S1 orbits. However, if the end user (Italian National Civil Protection Department) requires a fast processing of S1 data, for instance to quickly obtain information about the extent of a big flood, it is possible to manually run AUTOWADE in anticipation with respect to the schedule. This was perfrmed for the flood that occurred in Sicily due to the Apollo Medicane.

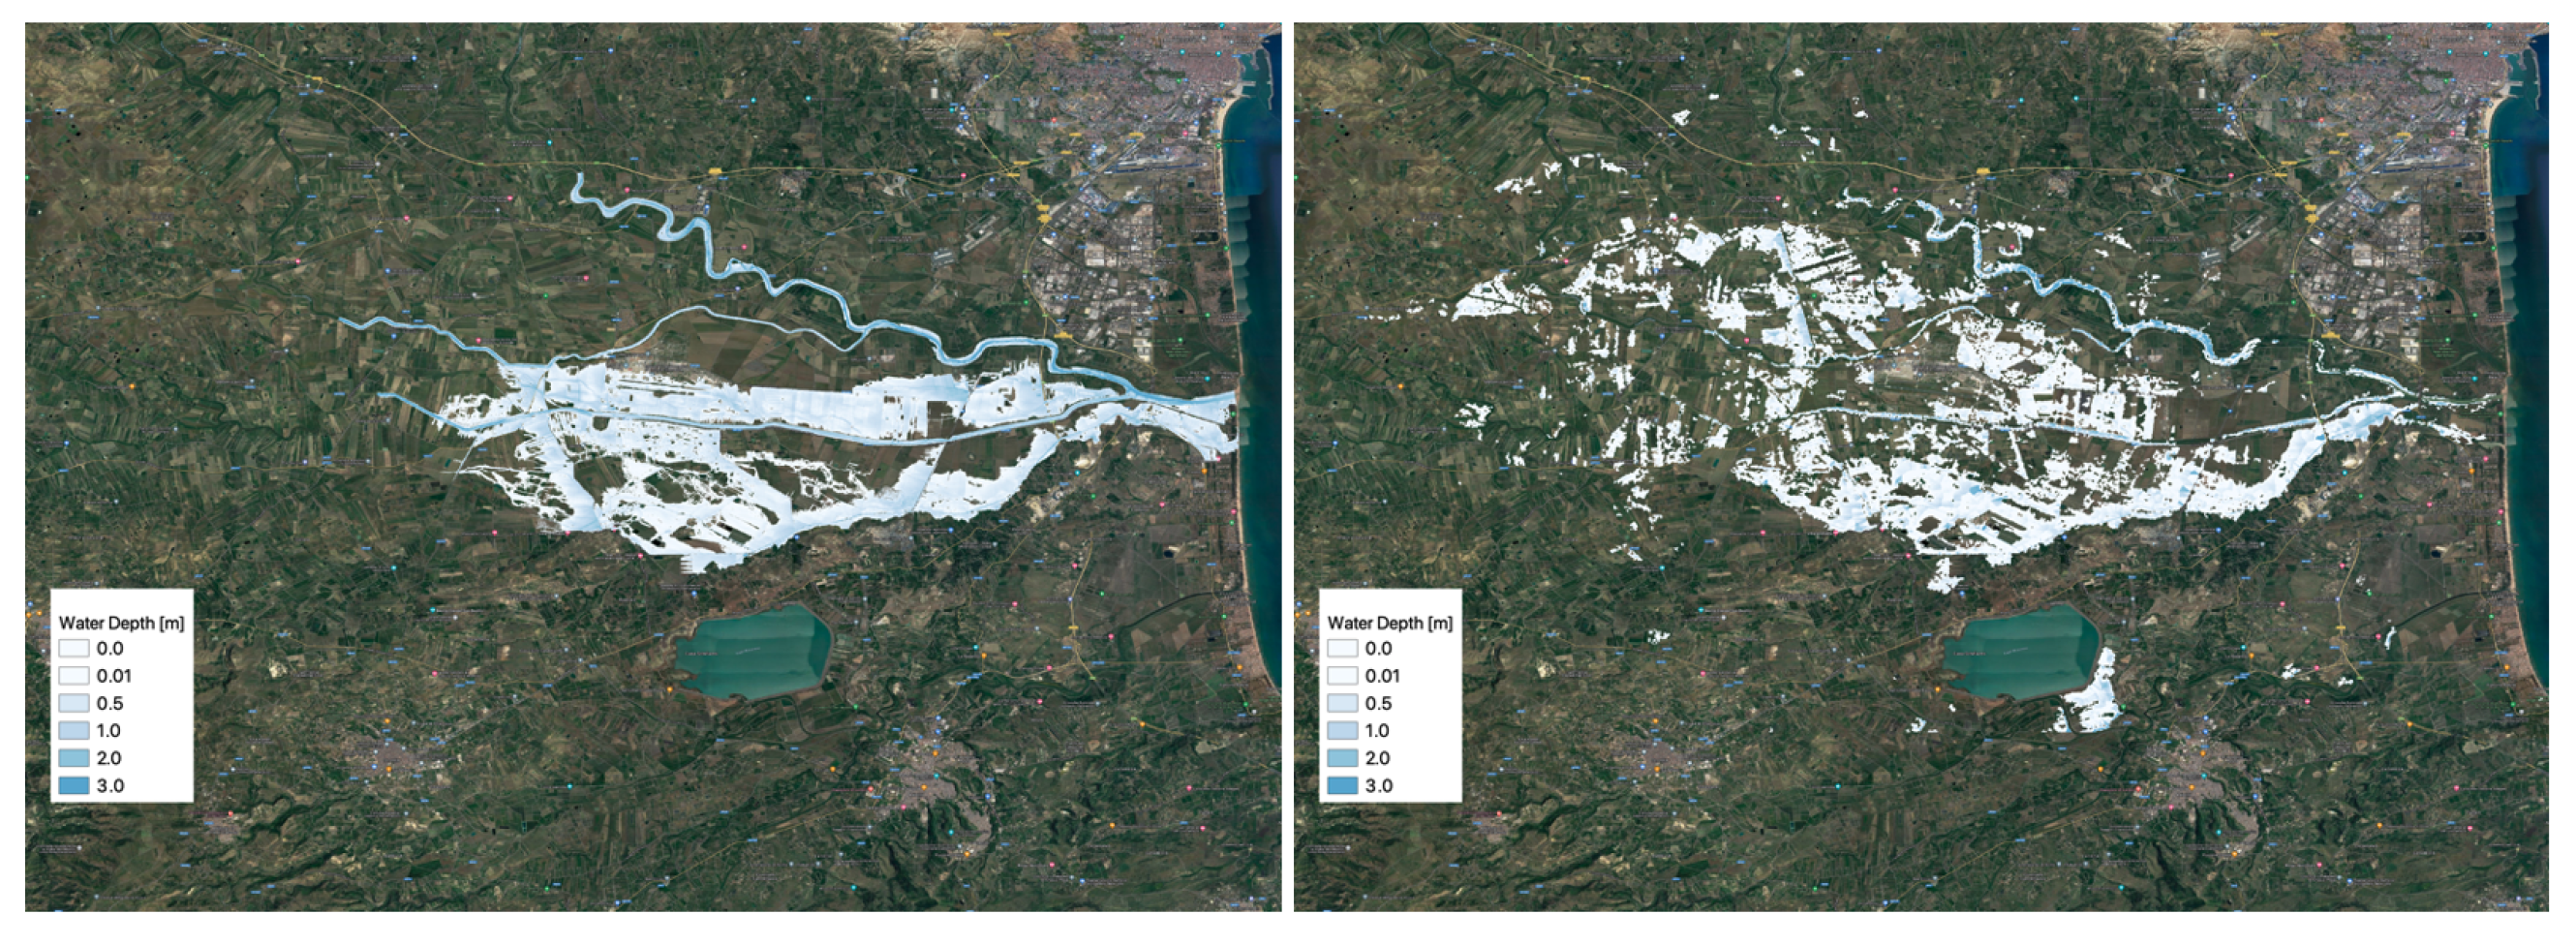
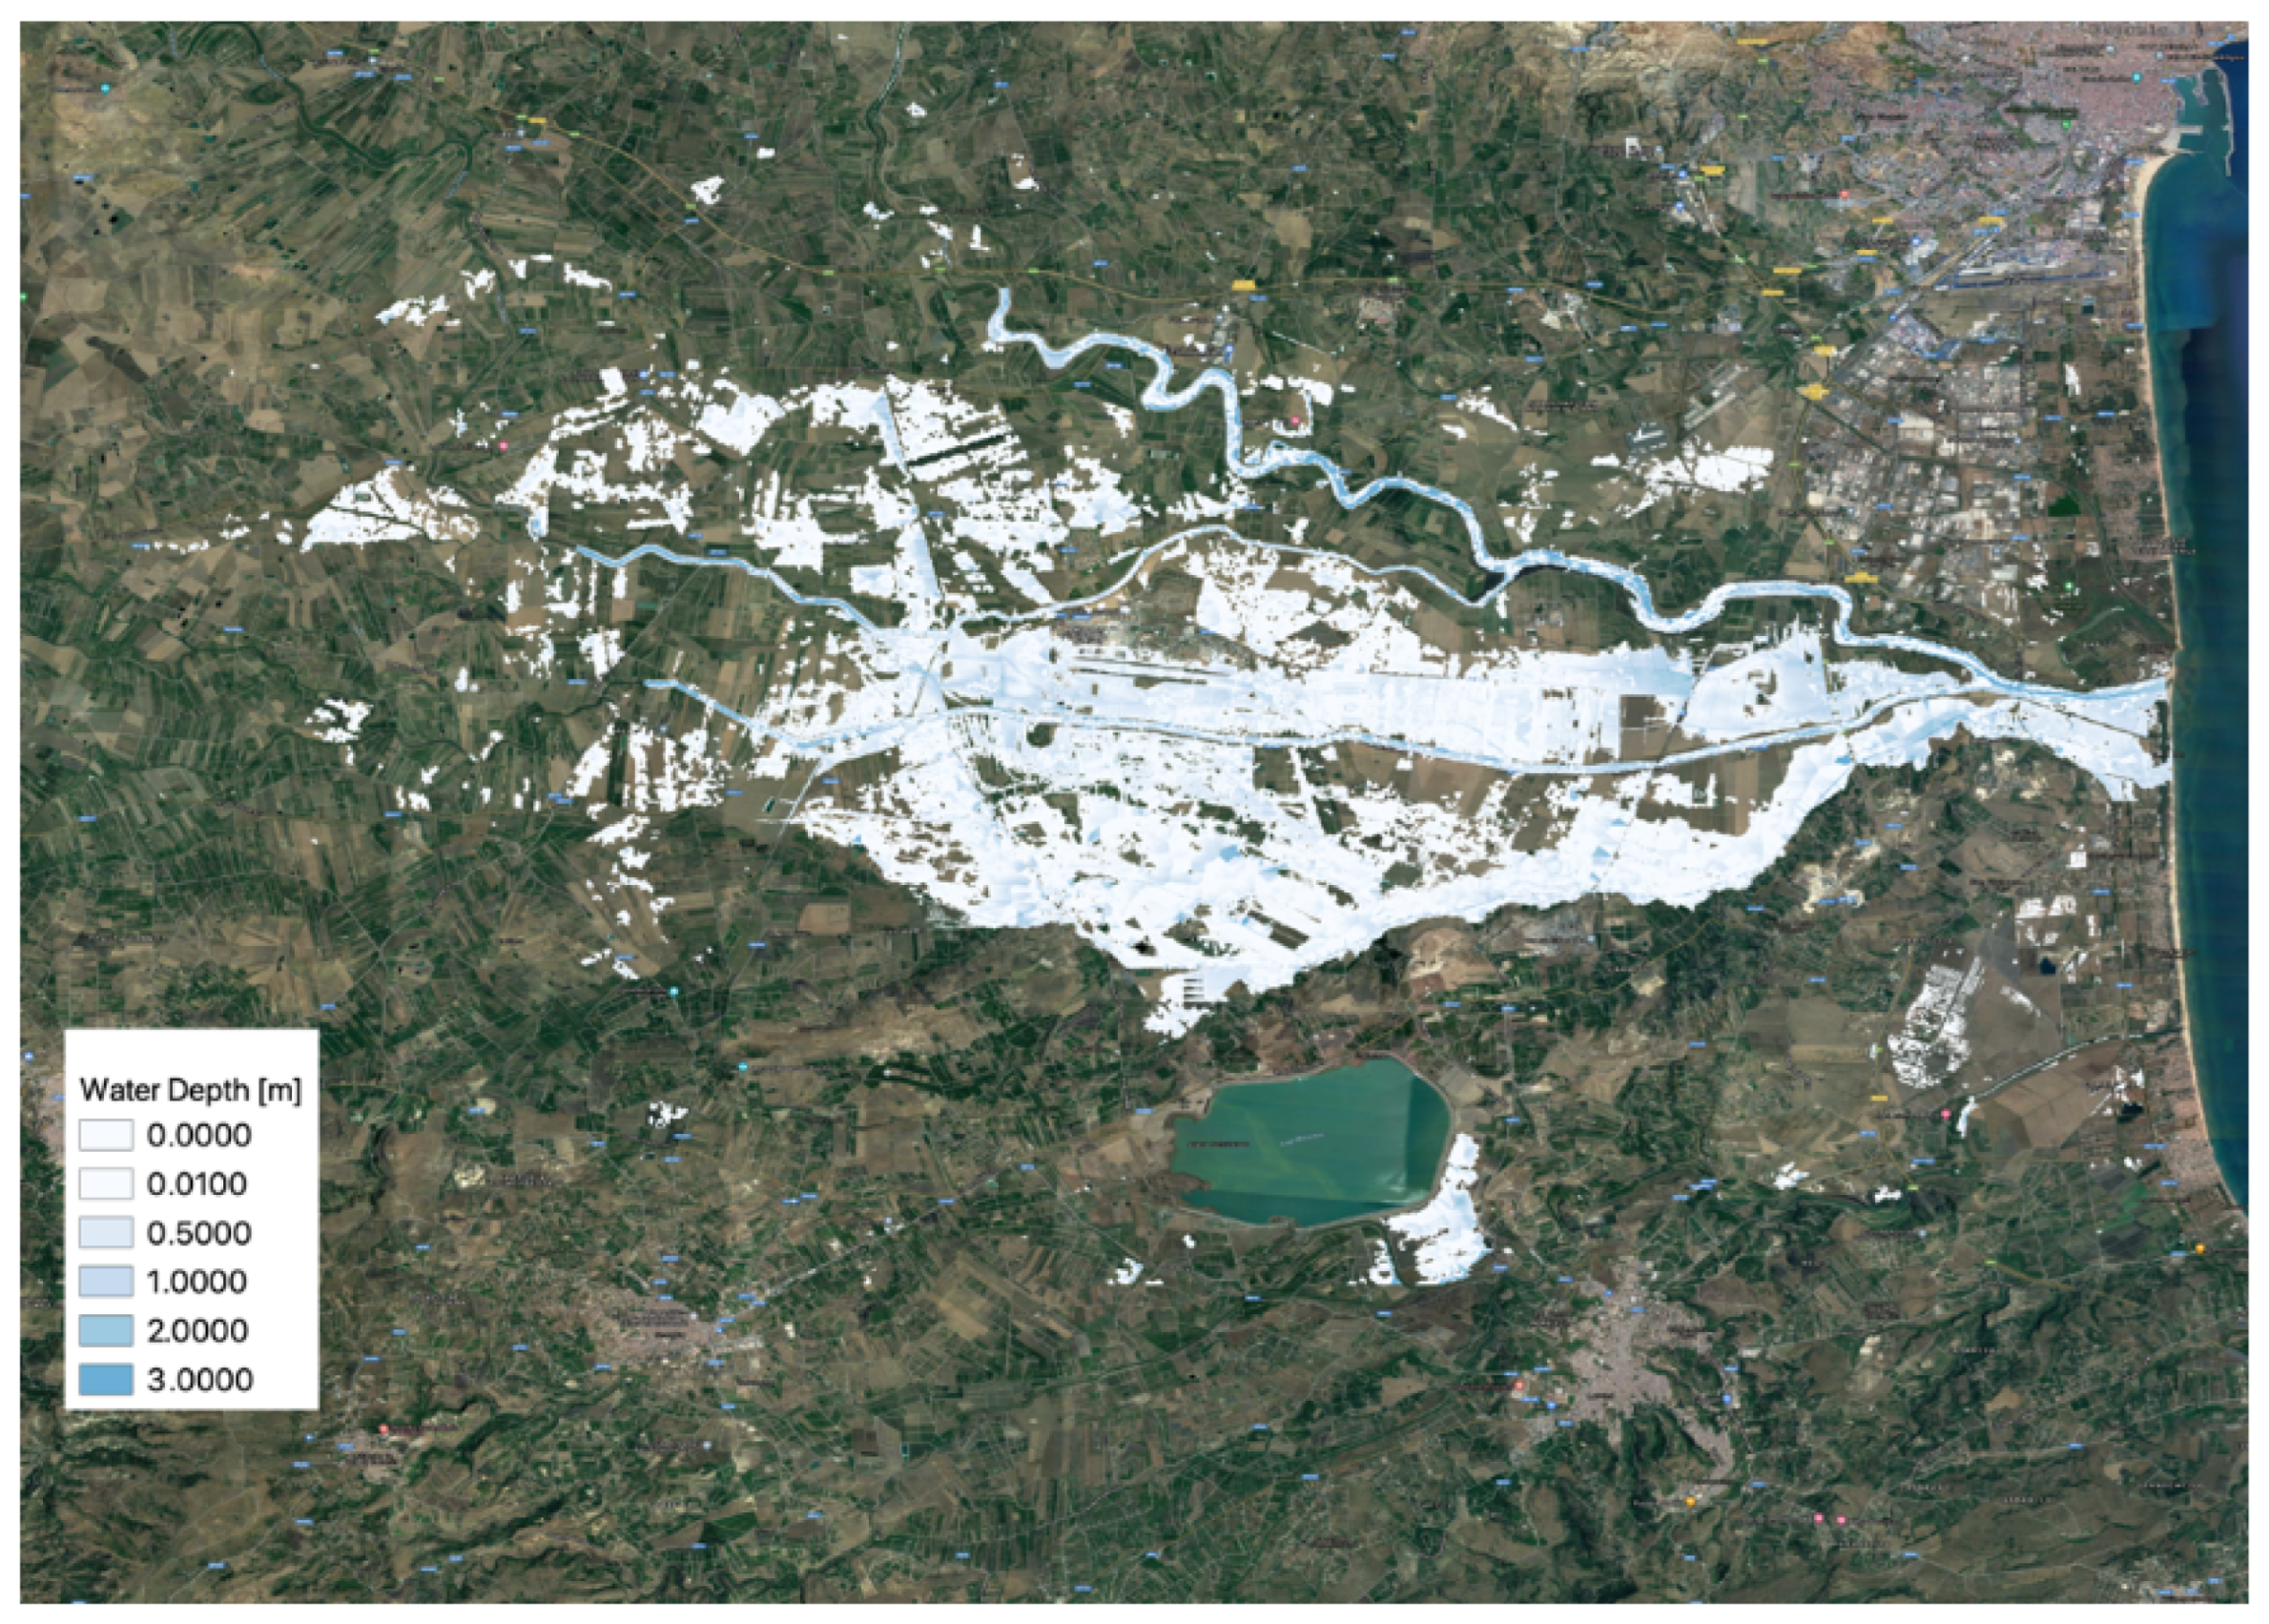
2.5. The Floodwater Depth Estimation Tool: FwDET

The Floodwater Depth Estimation Tool (FwDET, [33]) is a tool that allows to evaluate water depths associated with flood areas retrieved by satellite. FwDET identifies the water depth of the flooded areas in each cell within a flooded domain based on its closest point located on the edge of the flooded area through the use of an appropriate digital terrain model (DTM). FwDET calculates water depth based solely on a flood polygon and a DTM, then eliminates the need for additional data while maintaining usability with complex and fragmented flood extension maps from any source and resolution (e.g., independent from the sensors used for the acquisition). Regarding the accuracy of FwDET in estimating flood depths, ref. [33] reports mean differences between FwDET and observations of 0.18 and 0.31 m for two case studies in the United States, based on a DEM resolution of 1 m and 10 m, respectively. In this case, the DTMs used is from Lidar and has a resolution of 2 m and is freely available from the Sicily Region (https://www.sitr.regione.sicilia.it/) (accessed on 11 December 2022). The version of FwDET used is an implementation in Google Earth Engine (GEE, https://earthengine.google.com) (accessed on 11 December 2022), a cloud-based open service that has the advantage of allowing large-scale and high-resolution calculation.

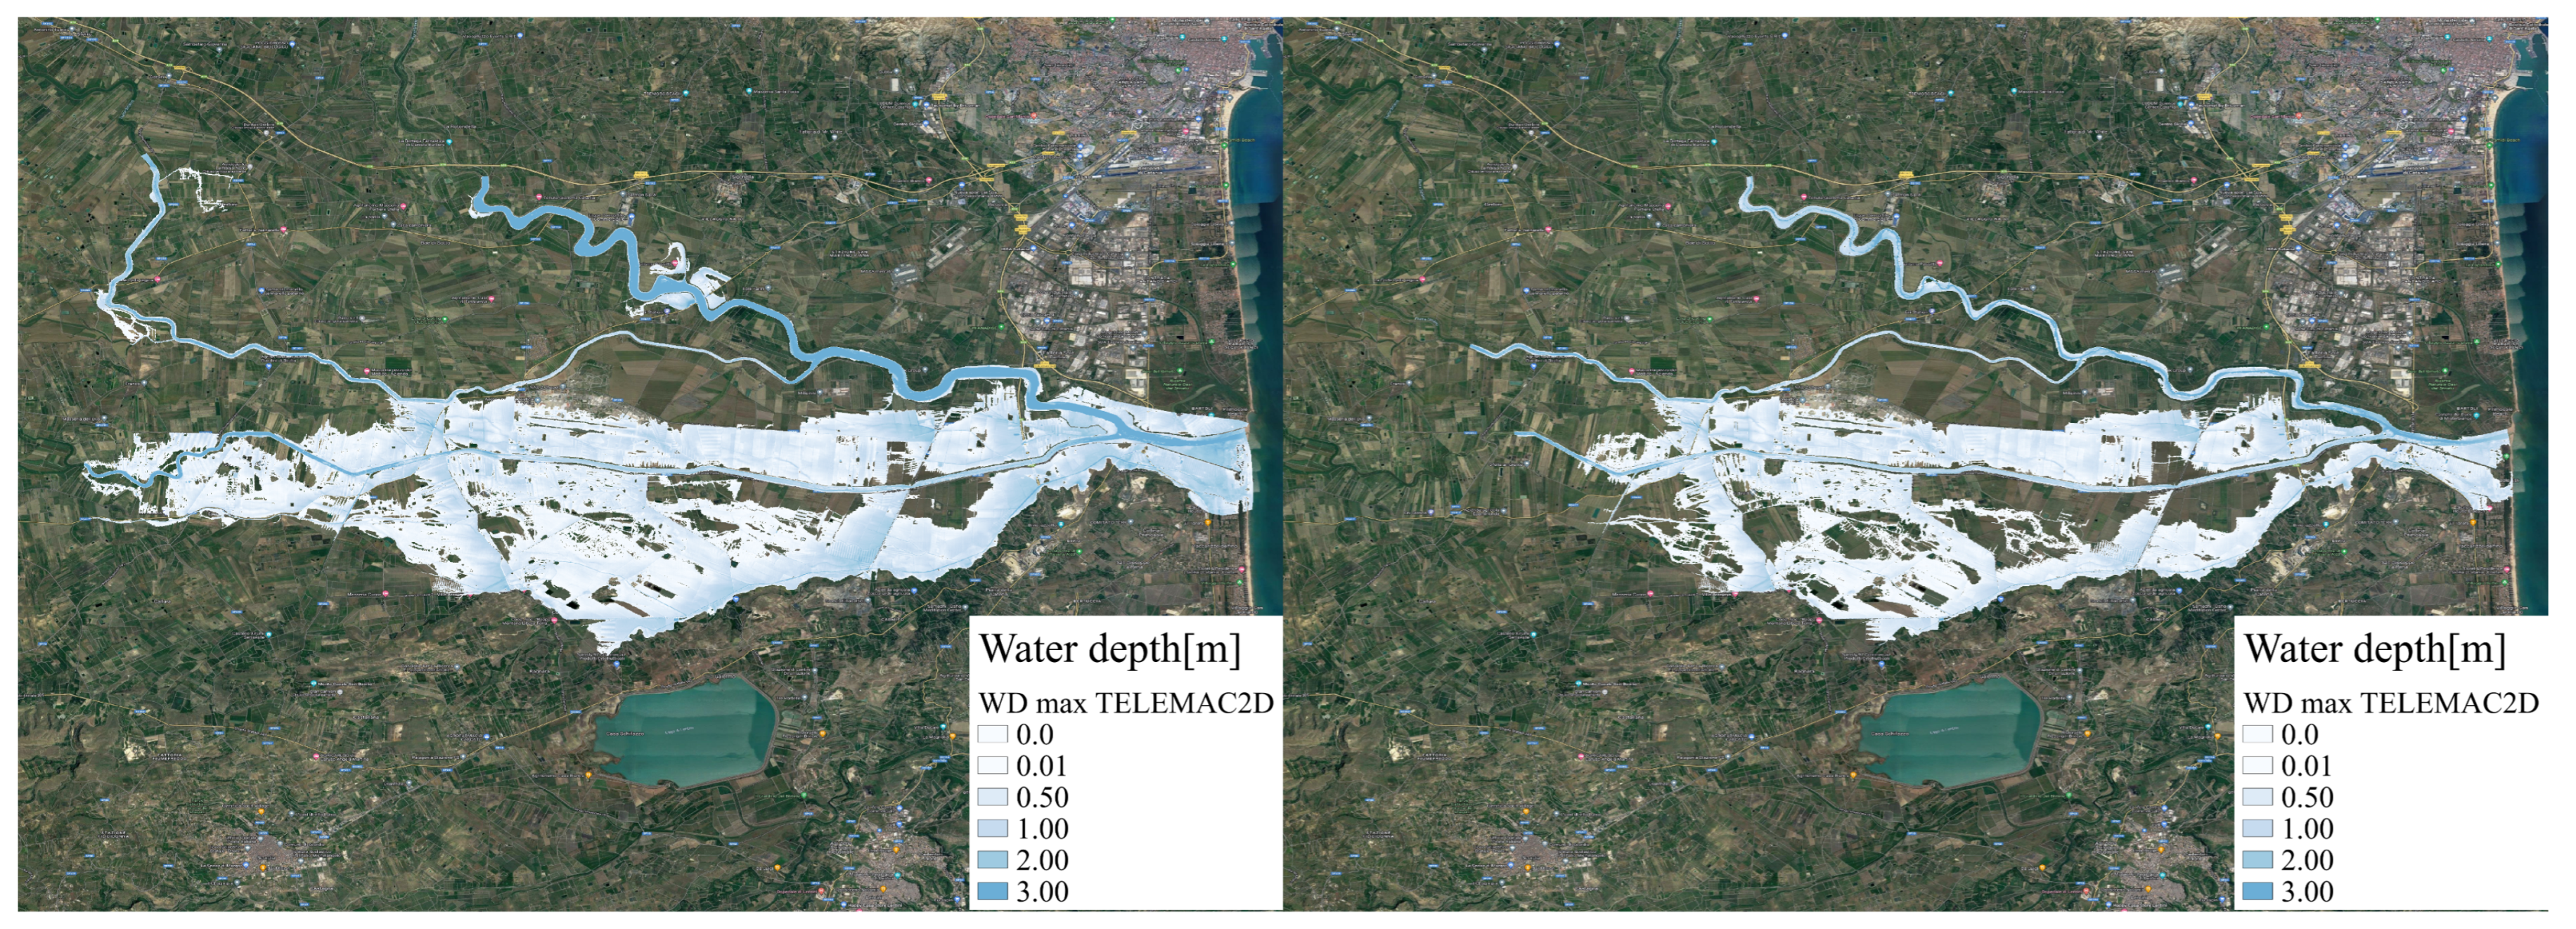
2.6. The Hydraulic Model: TELEMAC-2D

TELEMAC-2D (http://www.opentelemac.org/) (accessed on 11 December 2022) is a 2D hydrodynamic model that uses the Saint Venant equation and models free-surface flows in two dimensions. At each point of the mesh, it calculates the depth of water and the two velocity components. TELEMAC-2D is used for a wide spectrum of applications, including the design of hydraulic structures, dam breaches, and flood analysis. The main outputs of the model are water depth and water velocity, as well as spatial and temporal evolution within the river bead and on the floodplain. In this work, the TELEMAC-2D model is coupled with the Continuum hydrological model, and TELEMAC-2D uses the stream-flow simulated by the Continuum as boundary conditions.
A very-high-resolution Digital Terrain Model was used for the implementation of TELEMAC-2D. The DTM from Lidar with a resolution of 2m is freely available from Sicily Region (https://www.sitr.regione.sicilia.it/) (accessed on 11 December 2022).

3. Results and Discussion

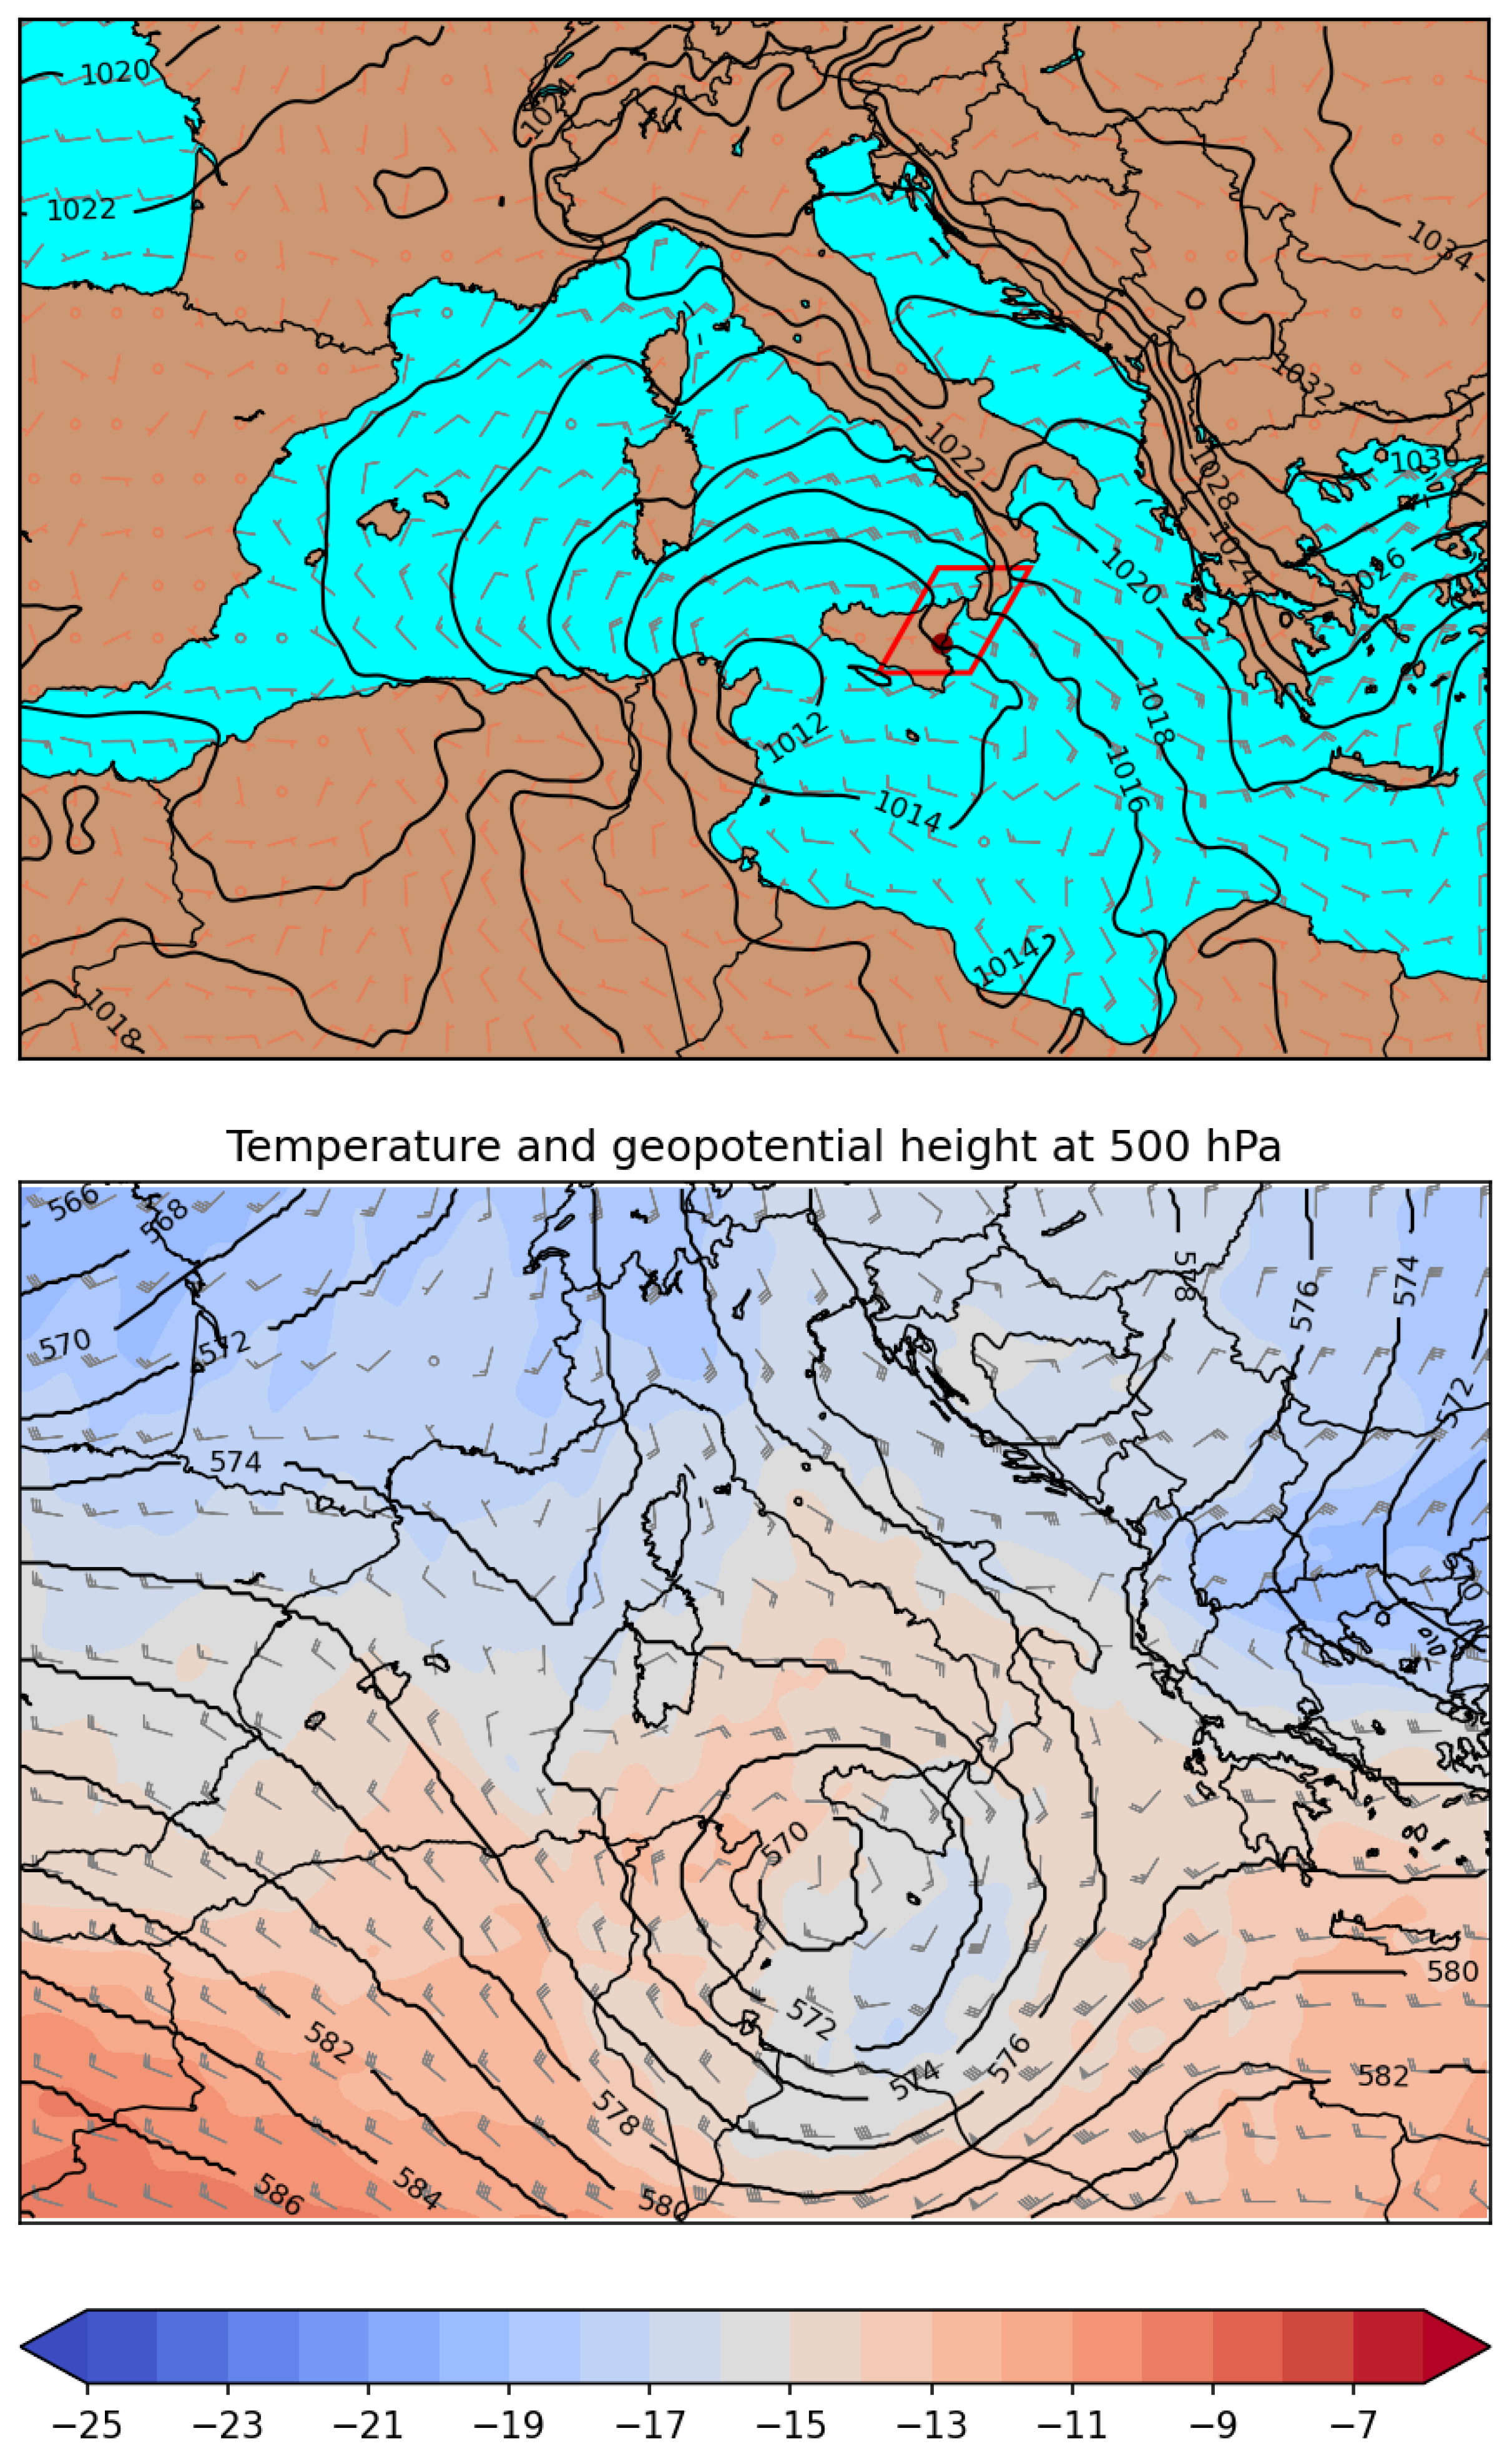
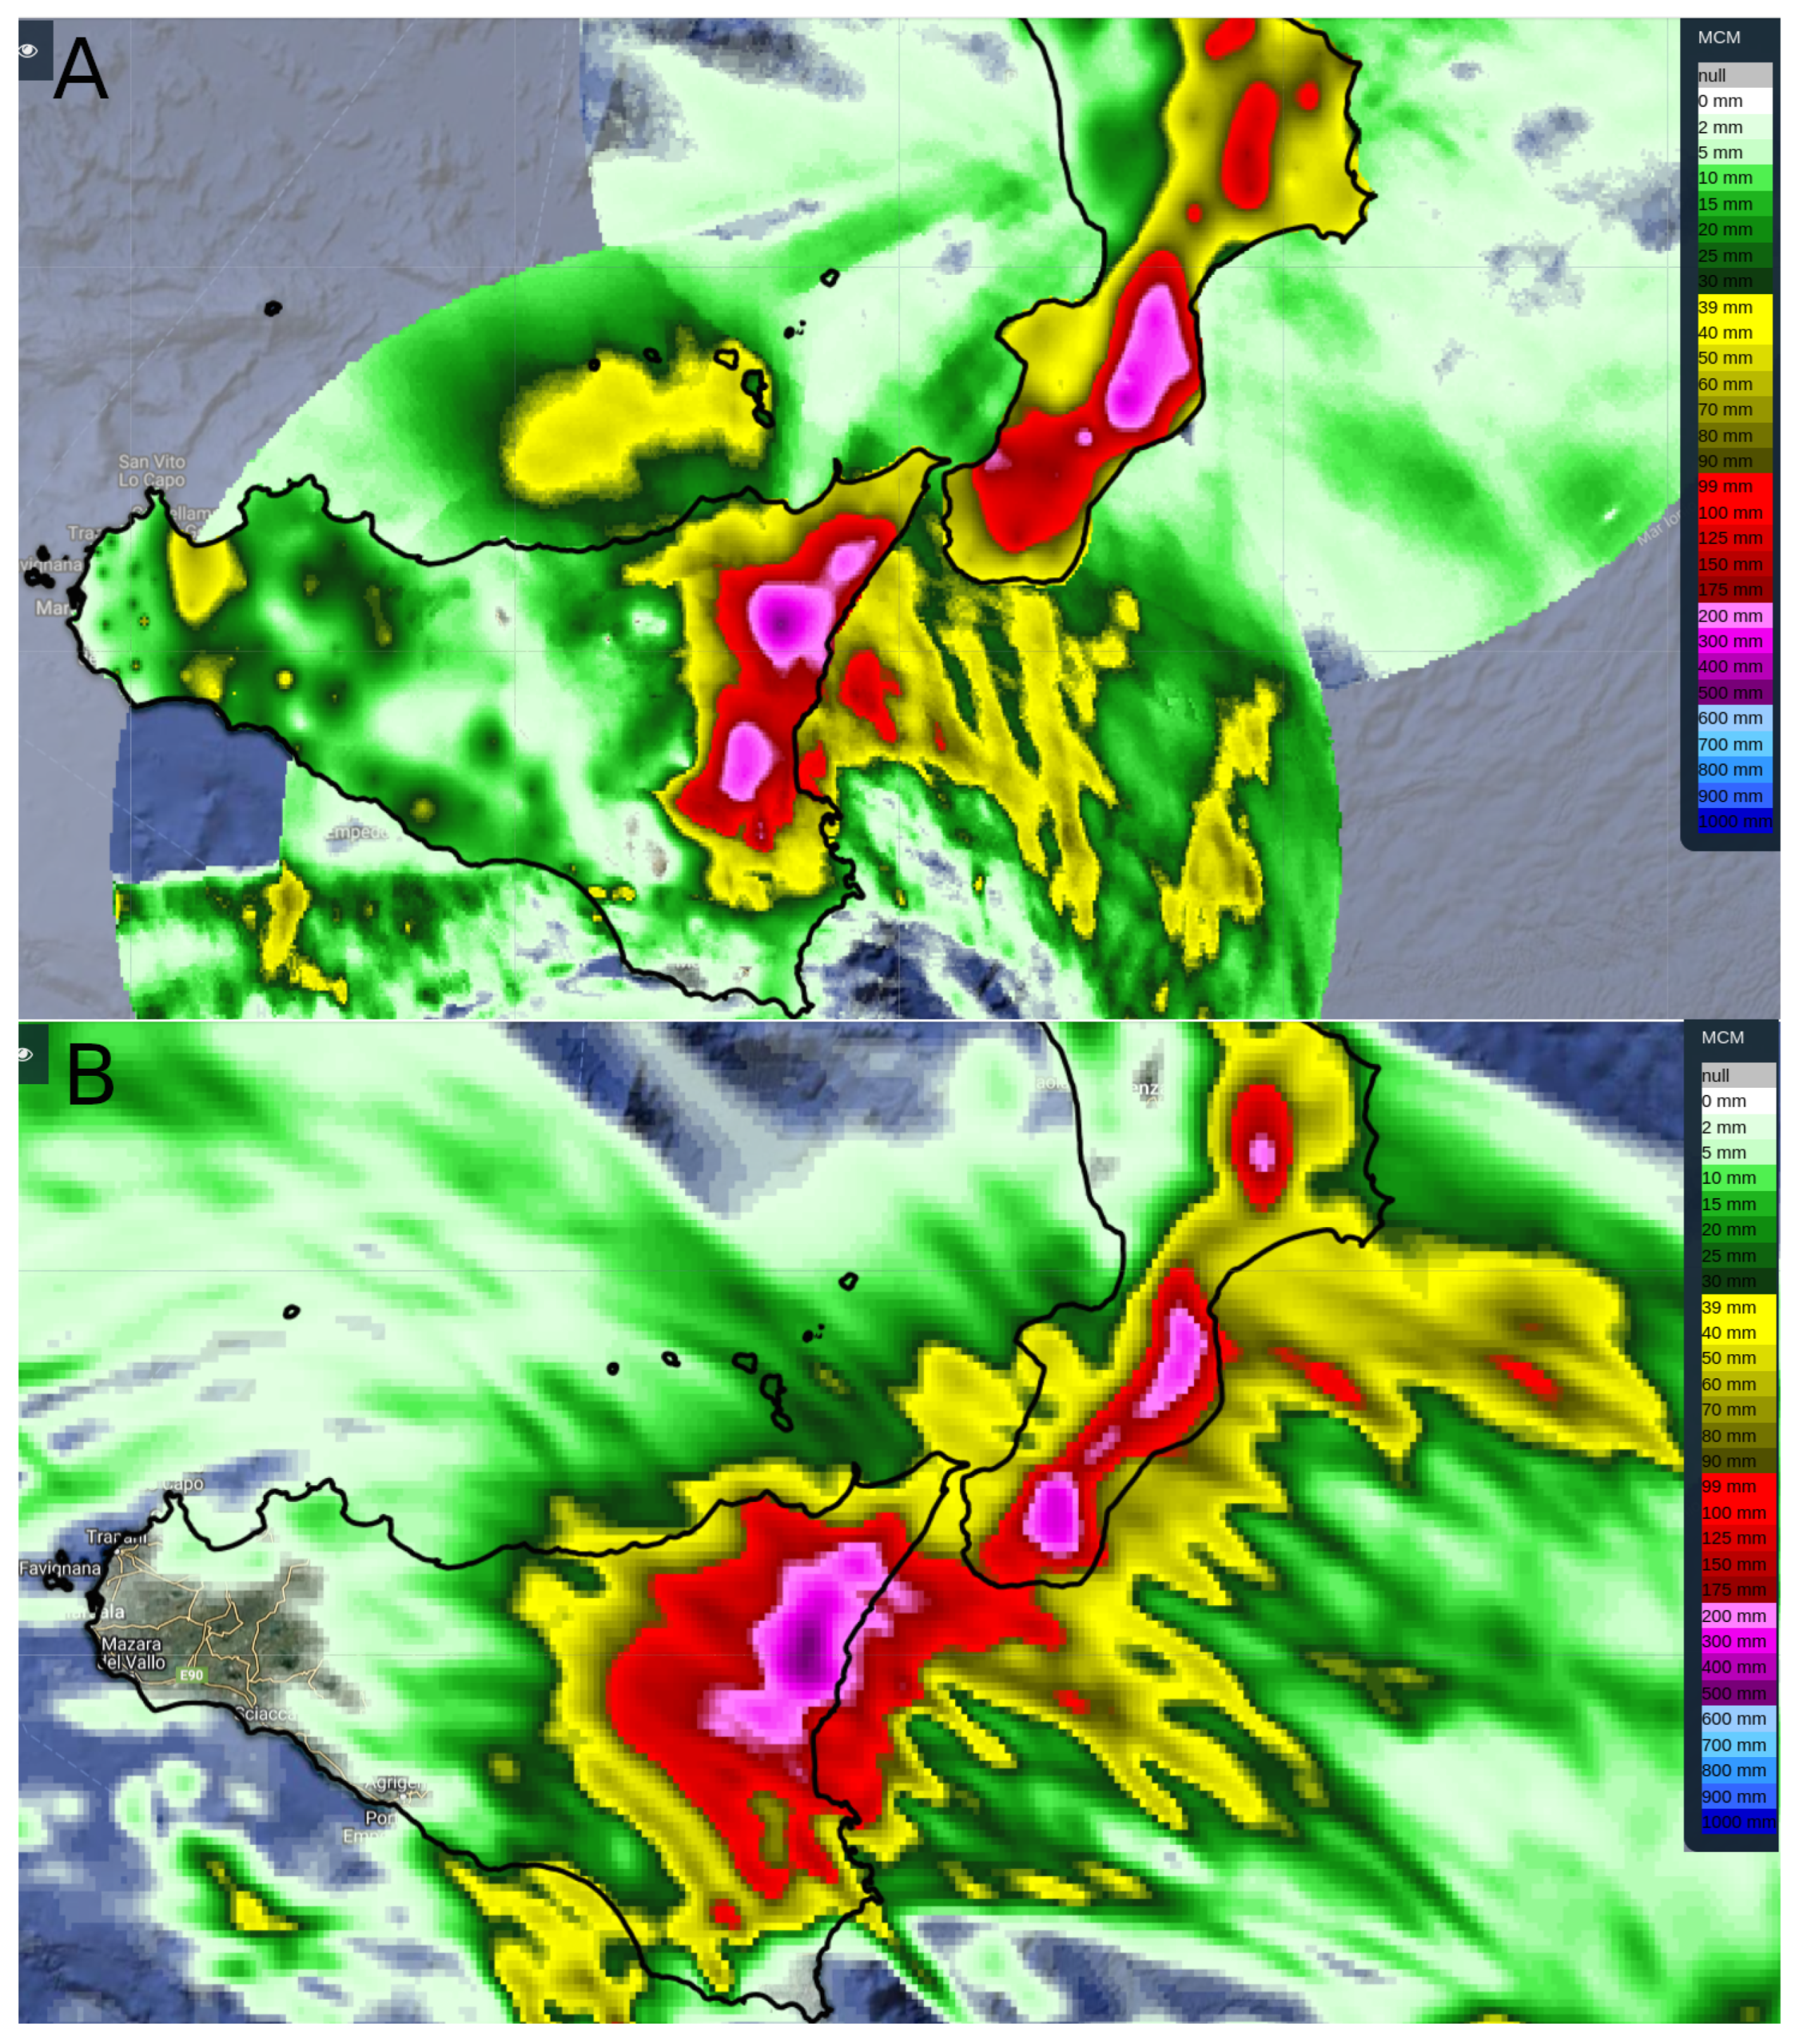
3.1. The Operational Meteorological Forecast

The meteorological forecast obtained using the operational framework based on the aforementioned model WRF-OL setup showed a very good predictive capability for rainfall timing and location, especially over eastern Sicily. Figure 4 shows the observed (merging radar and rain gauges [25]) in panel A and modeled cumulated rainfall (panel B) for the 48 h between 24 October 2021 at 00 UTC and 26 October 2021 at 00 UTC, uploaded on the MyDewetra platform to provide an easy and immediate situation view during the forecasting phase.
A quantitative verification of the meteorological forecast is performed using the MODE tool [34,35] by comparing the observed accumulated rainfall field with the forecast fields of the other runs. The main advantage of such a validation is that the forecast is not only evaluated point-wise but also at feature level, thus overcoming the so-called “double-penalty” issue [36]. MODE identifies precipitation structures above given thresholds in both the forecast and the observed fields and performs a spatial evaluation of the model capability of reproducing the identified objects [37]. Especially for high-resolution observations and cloud-resolving meteorological forecasts during deep convective events, it is preferable to use feature-based verification techniques, such as MODE, because traditional methods cannot provide a measure of spatial and temporal match between observed and forecast fields. The MODE analysis aims to verify the model capability in reproducing the pattern of the considered atmospheric field through the evaluation of indices (for further description refer to [11,12]) such as centroid distance (CEN DIST), angle difference (ANG DIFF), area ratio (obtained with forecast area—FCST AREA divided by OBS AREA, symmetric difference (SYMM DIFF), intesection area (INTERS AREA), union area (UNION AREA), and percentile intensity within object (FCST INT and OBS INT considering 50 and 90 percentile) above a fixed threshold (150 mm and 200 mm in this case). All the above-mentioned attributes are then summarized in a single index, called Total Interest, through a fuzzy logic algorithm (Equation (1) of [38] and Section 4 of [39]). In this work, the quantitative object comparison and some of the calculated indices, including the Total Interest (ranging between 0 and 1), are reported in Table 2. The Total Interest for both thresholds is above 0.9 (up to 0.95 for the 150 mm threshold), close to 1 (best score); this means that the forecast pattern is very close to the observed pattern, despite a slight overestimation of rainfall peaks and patterns, as also visible in Figure 4.

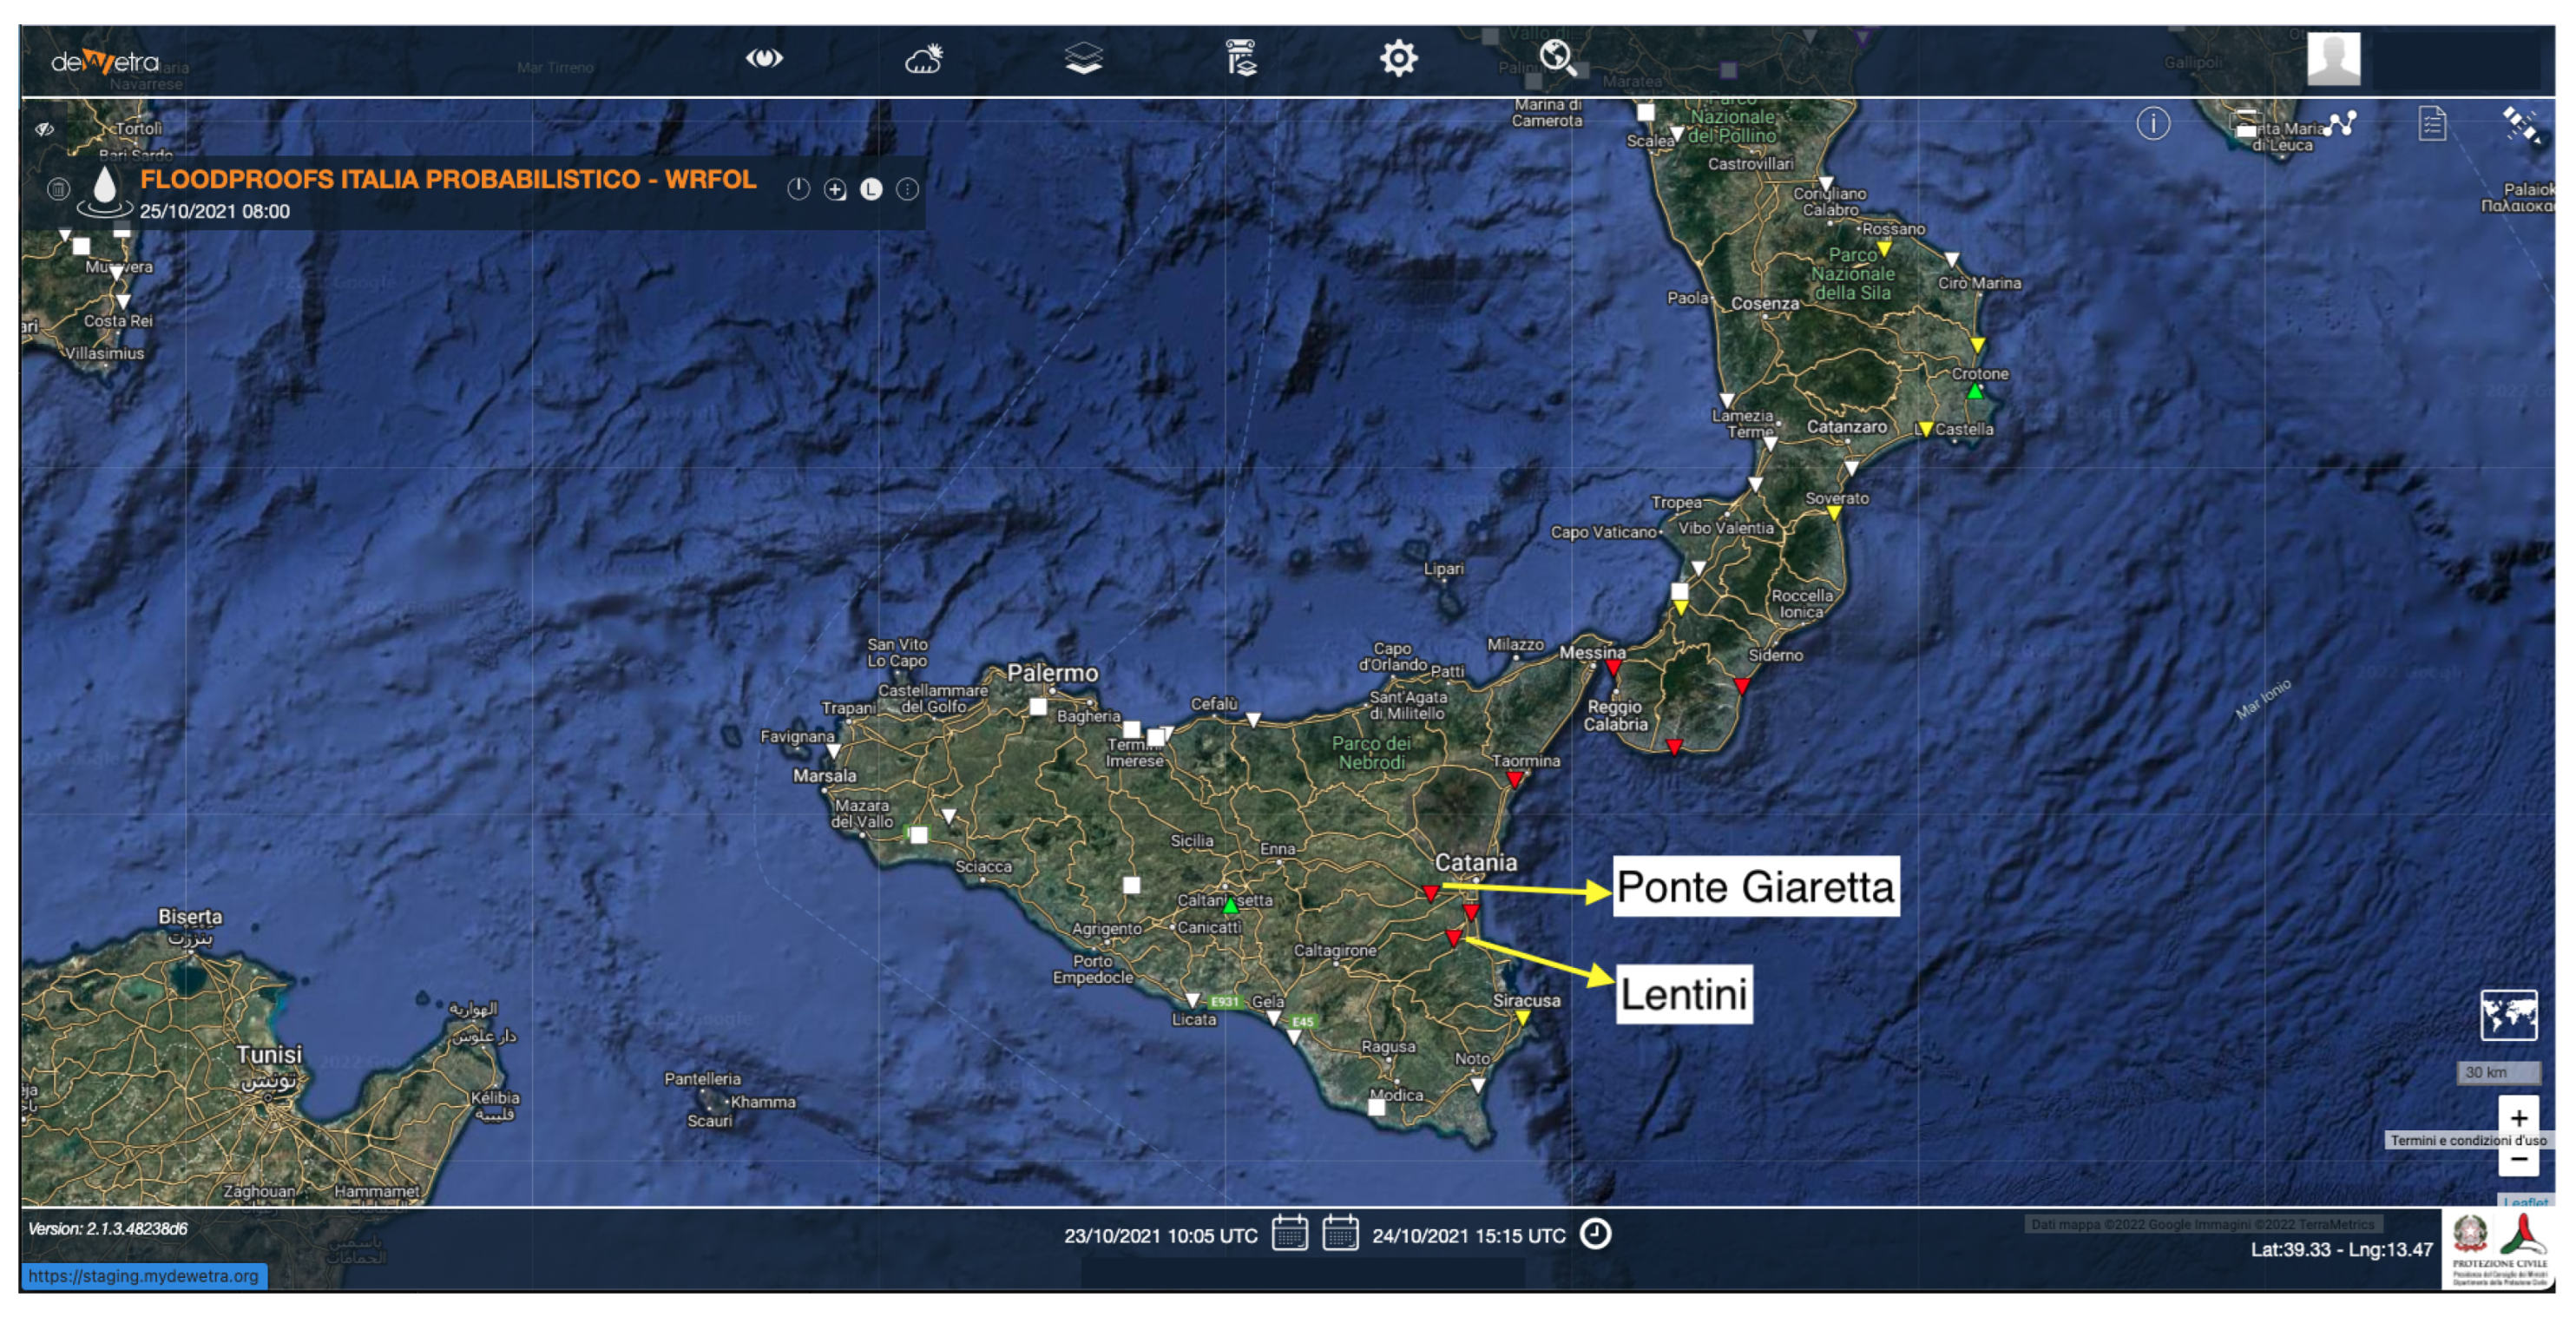
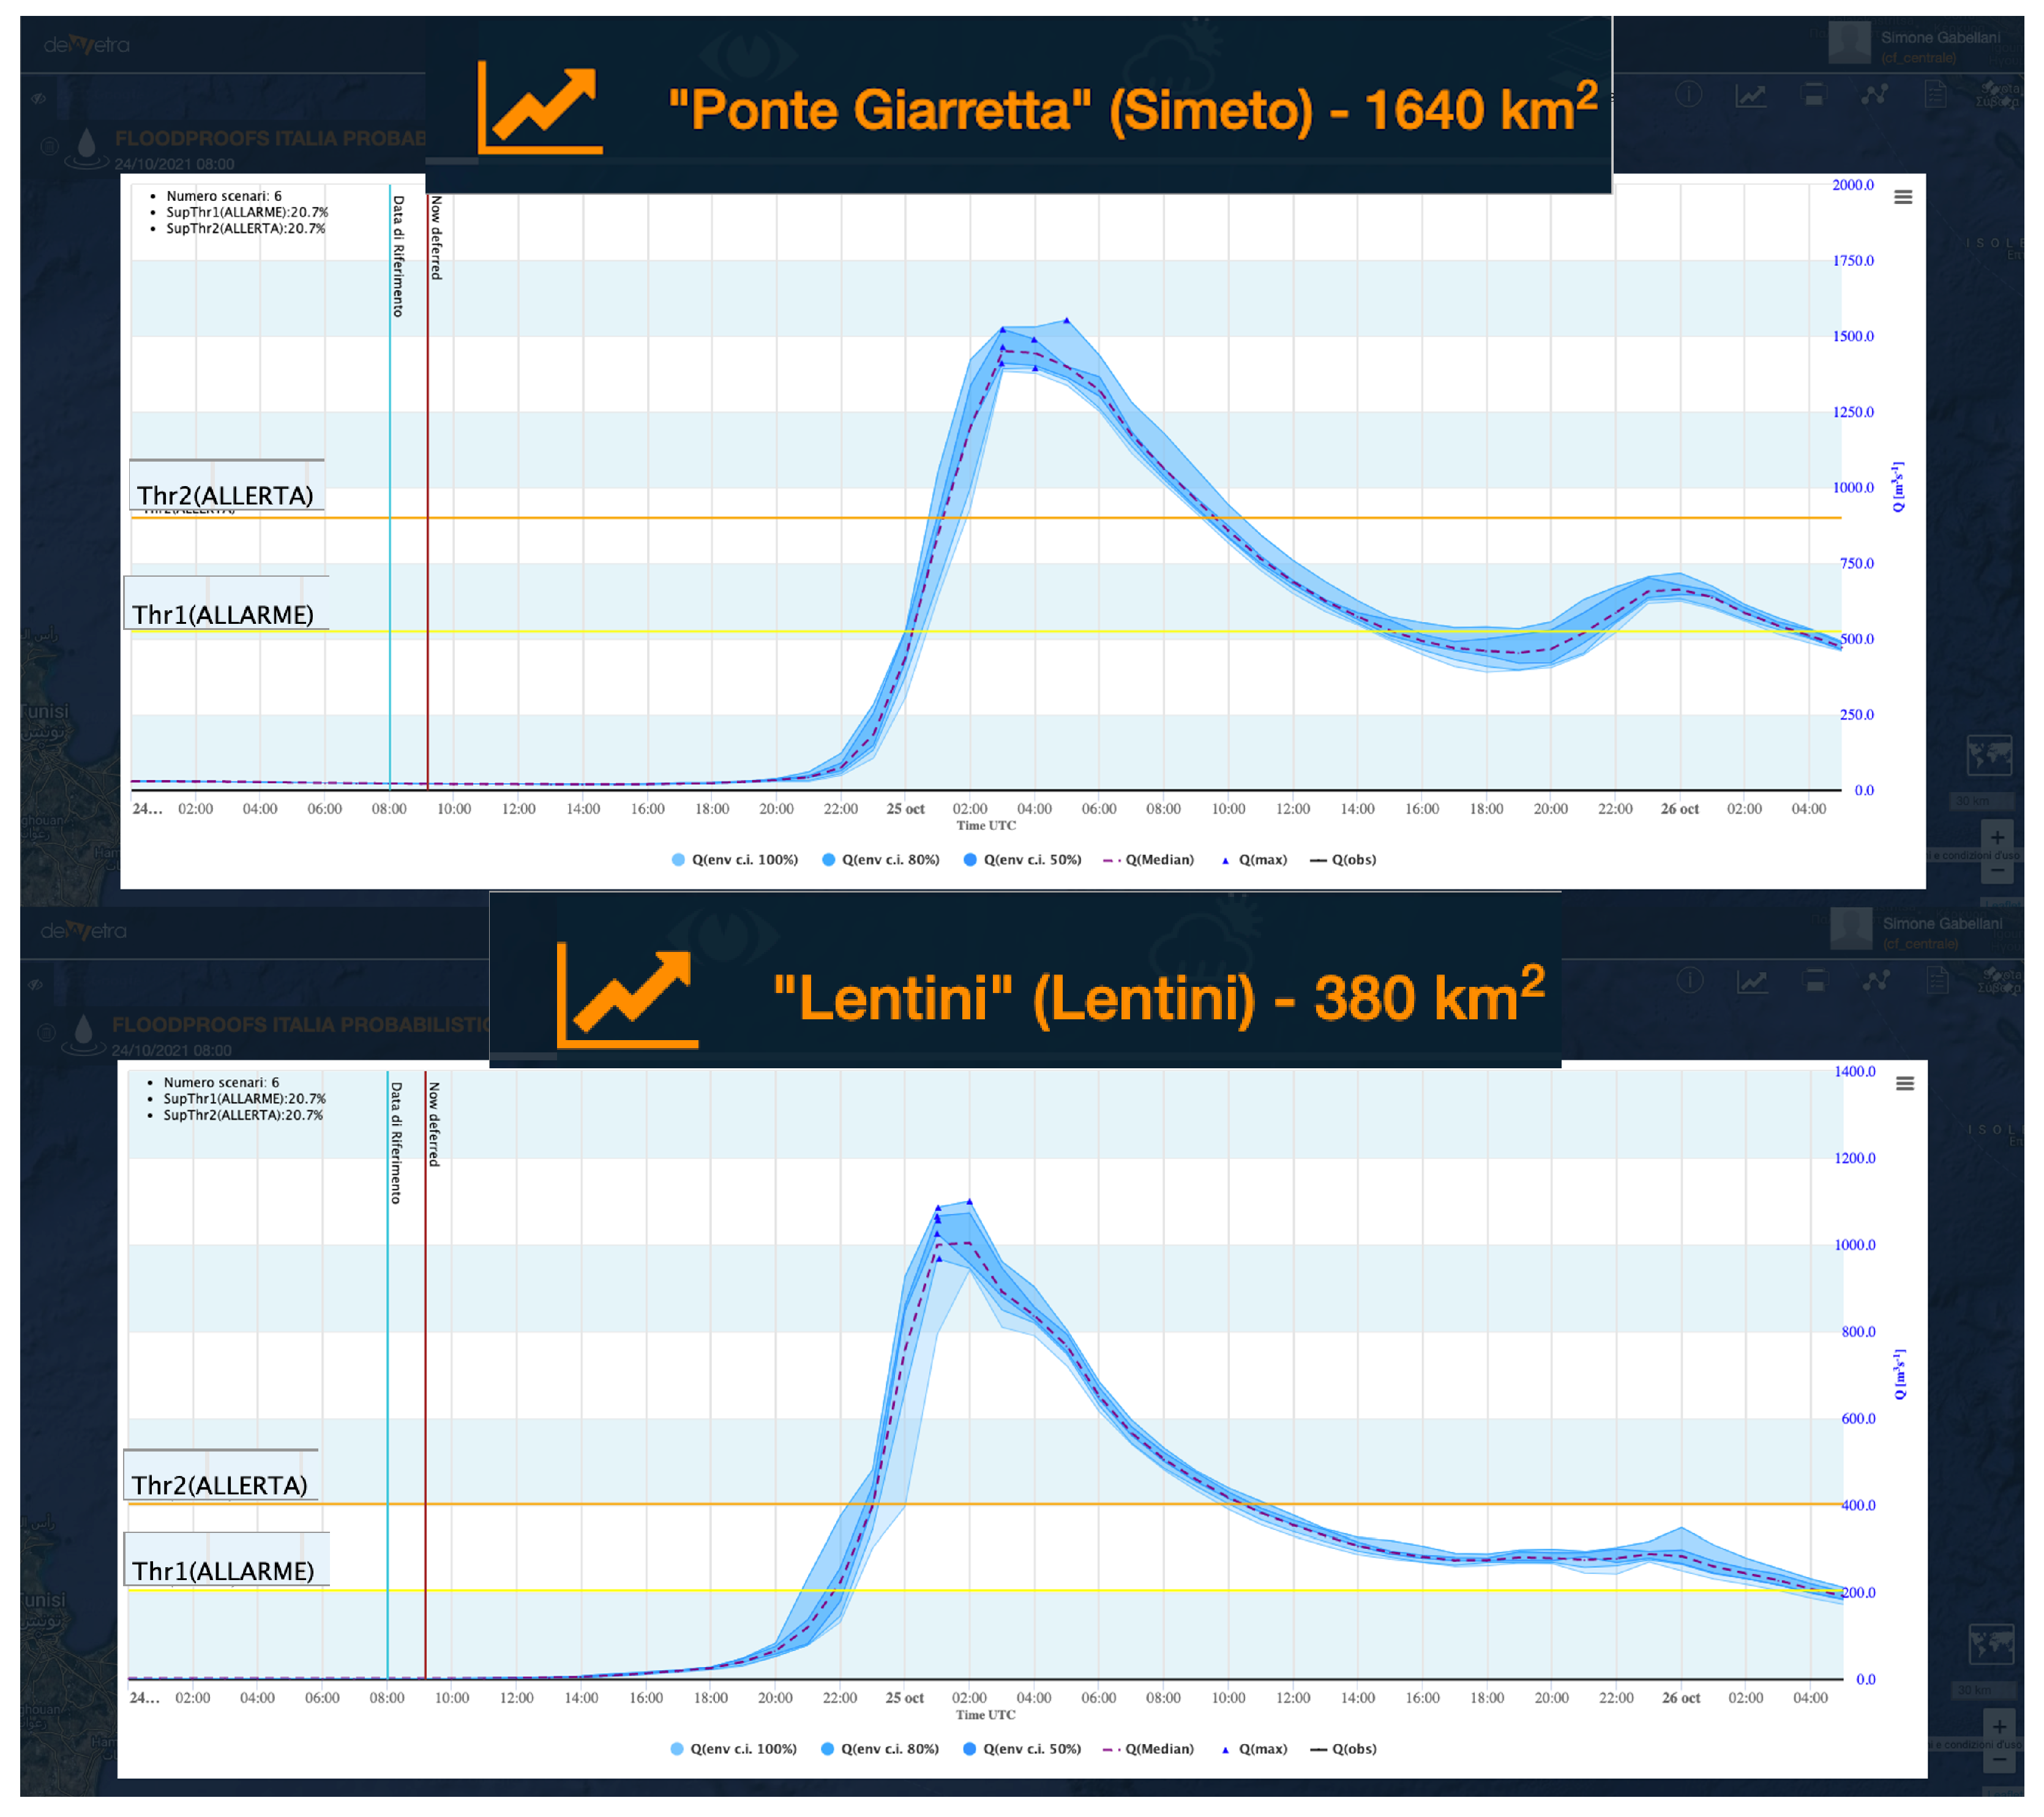
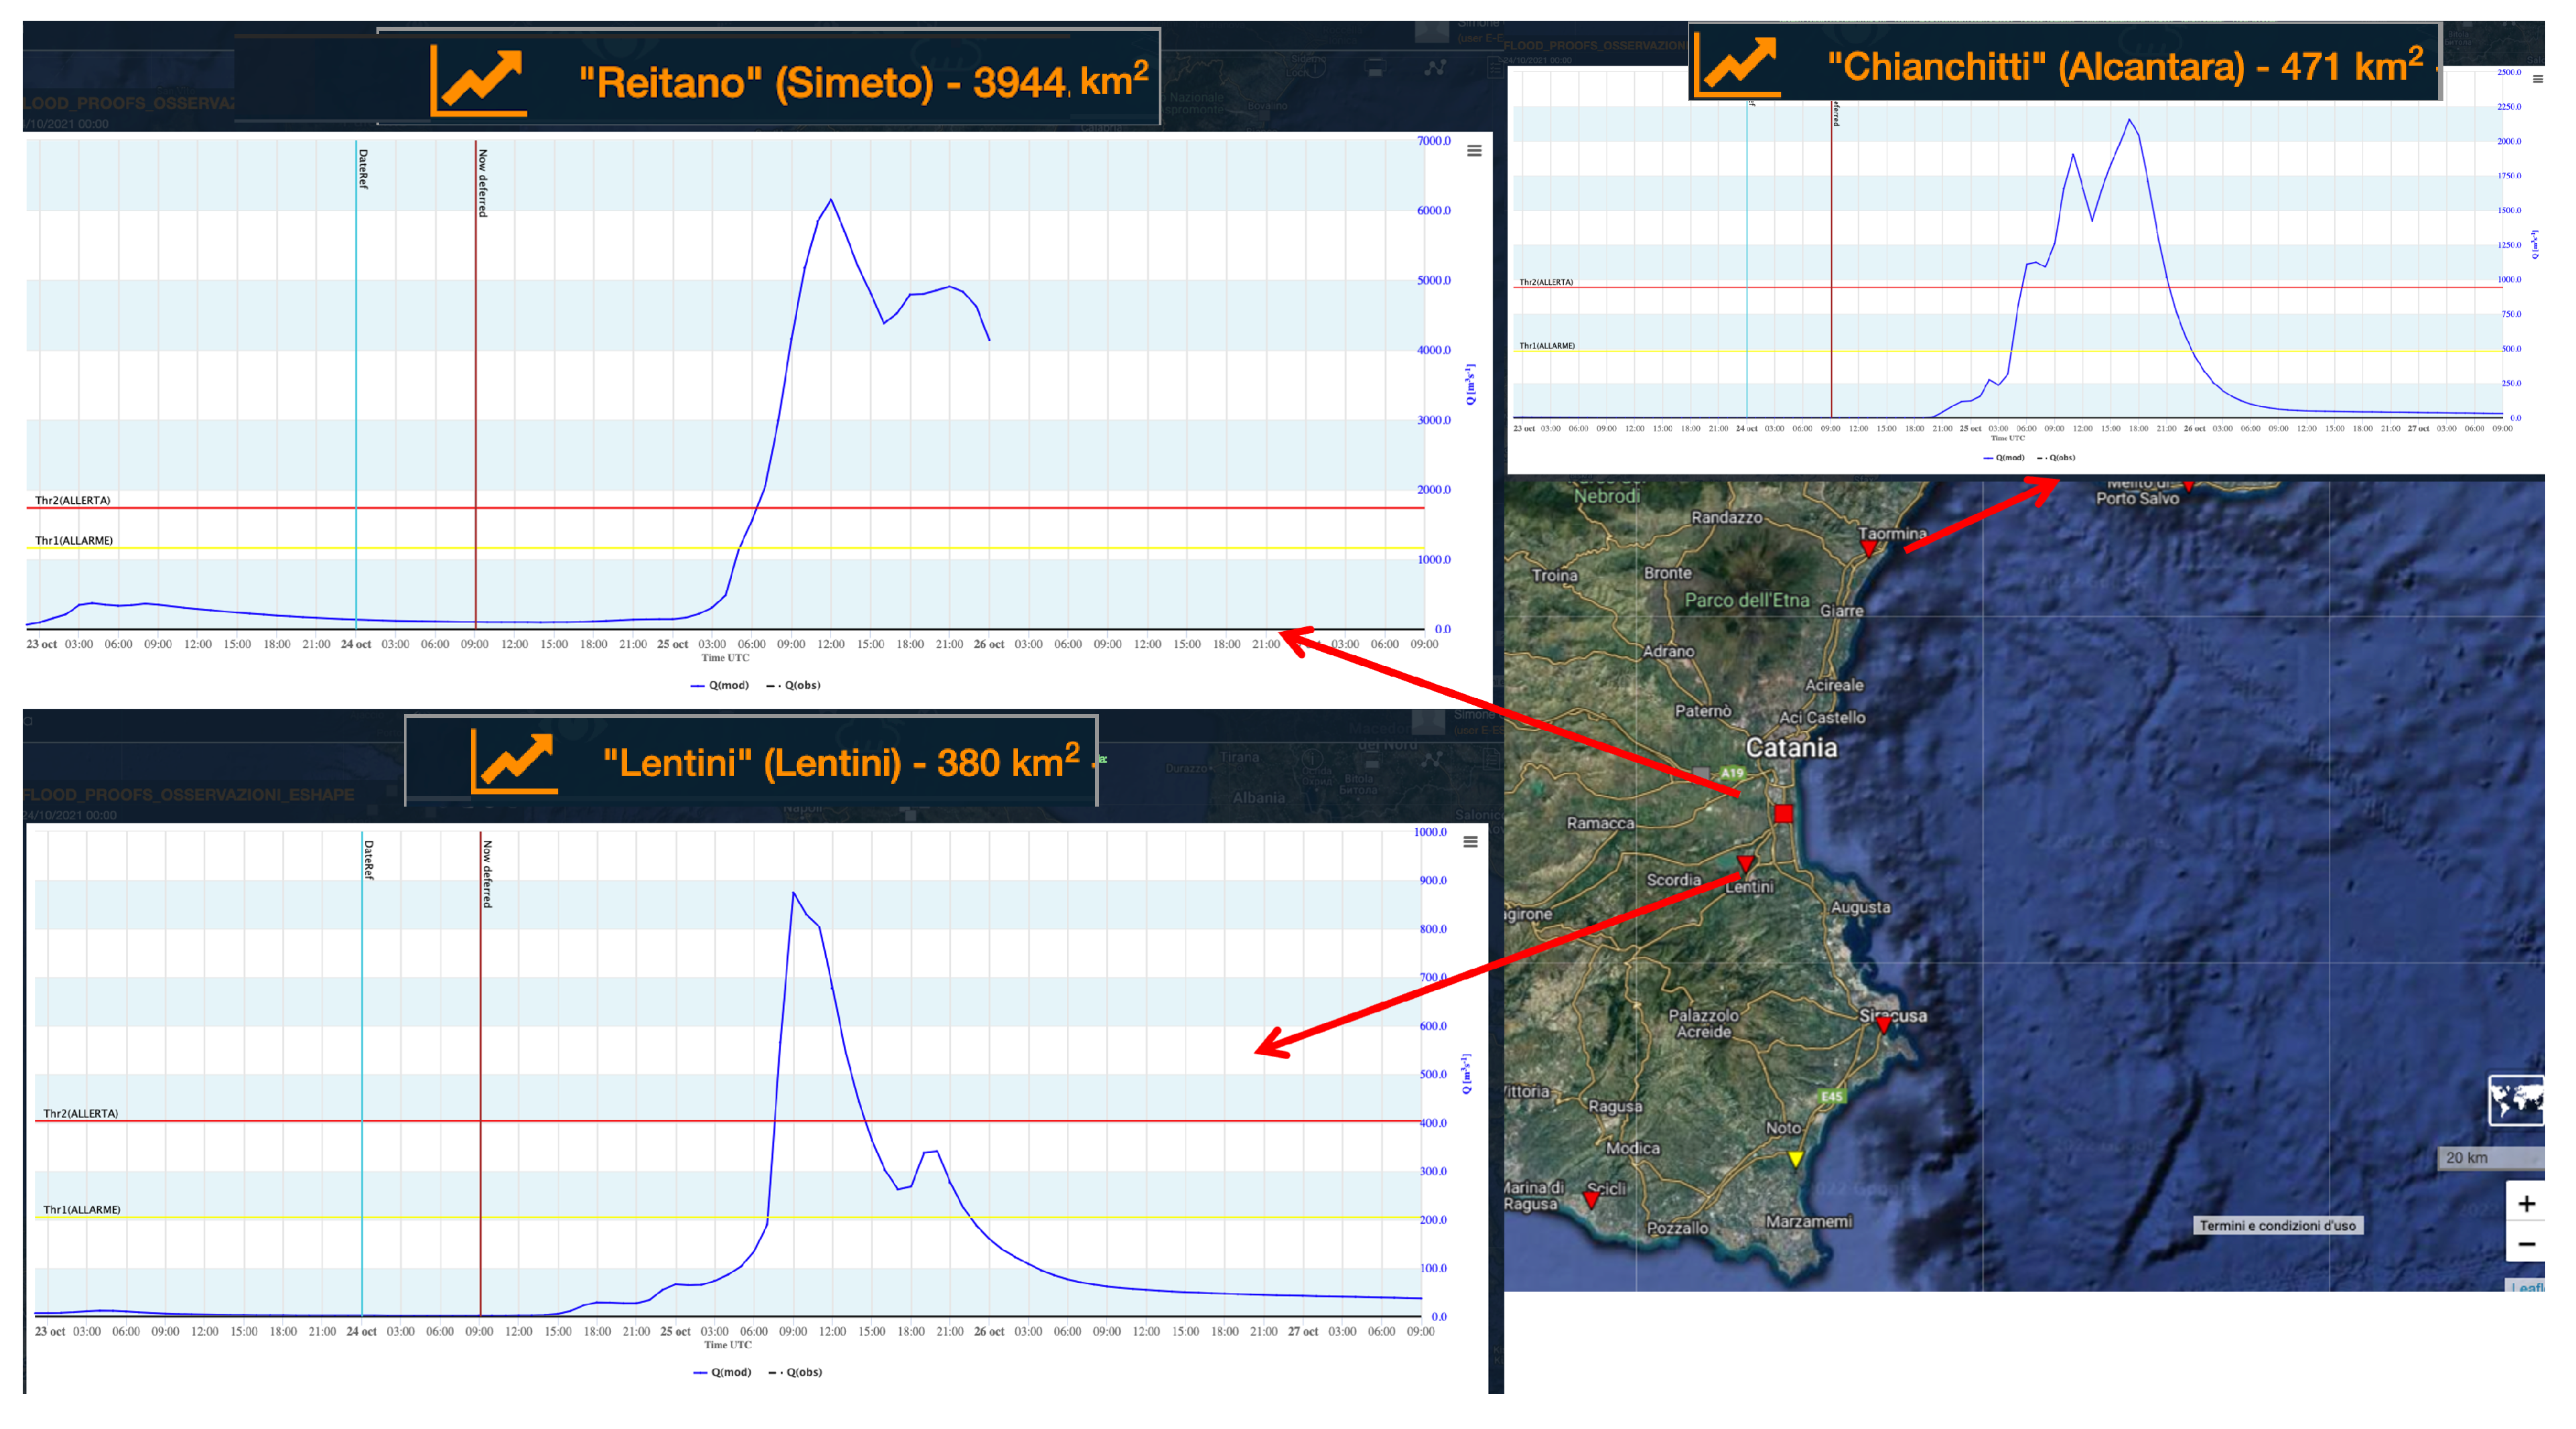
3.2. The Hydrological Forecast

The Flood-PROOFS’ stream flow forecast is obtained using the WRF-OL meteorological forecast as input. The run goal is to support decision makers in issue warning before the event. In Flood-PROOFS, the WRF-OL forecast rainfall is operationally coupled to the hydrological model through the Rainfall Filtered Autoregressive Model (RainFARM) stochastic downscaling procedure [40] that allows to provide a probabilistic hydrological forecast.
Figure 5 shows the hydrological forecast of 24 October 2021; red dots represent critical sections in which the expected discharge overcame the warning thresholds and can lead to flooding. Figure 6 shows the corresponding probabilistic hydrographs in three river sections in Calabria and Sicily. The yellow horizontal line corresponds to the alarm level and the orange one to the alert level. The event was therefore expected as an event of great intensity that could lead to widespread flooding, in particular in Calabria, and on the eastern coast of Sicily (red rectangle in Figure 2).

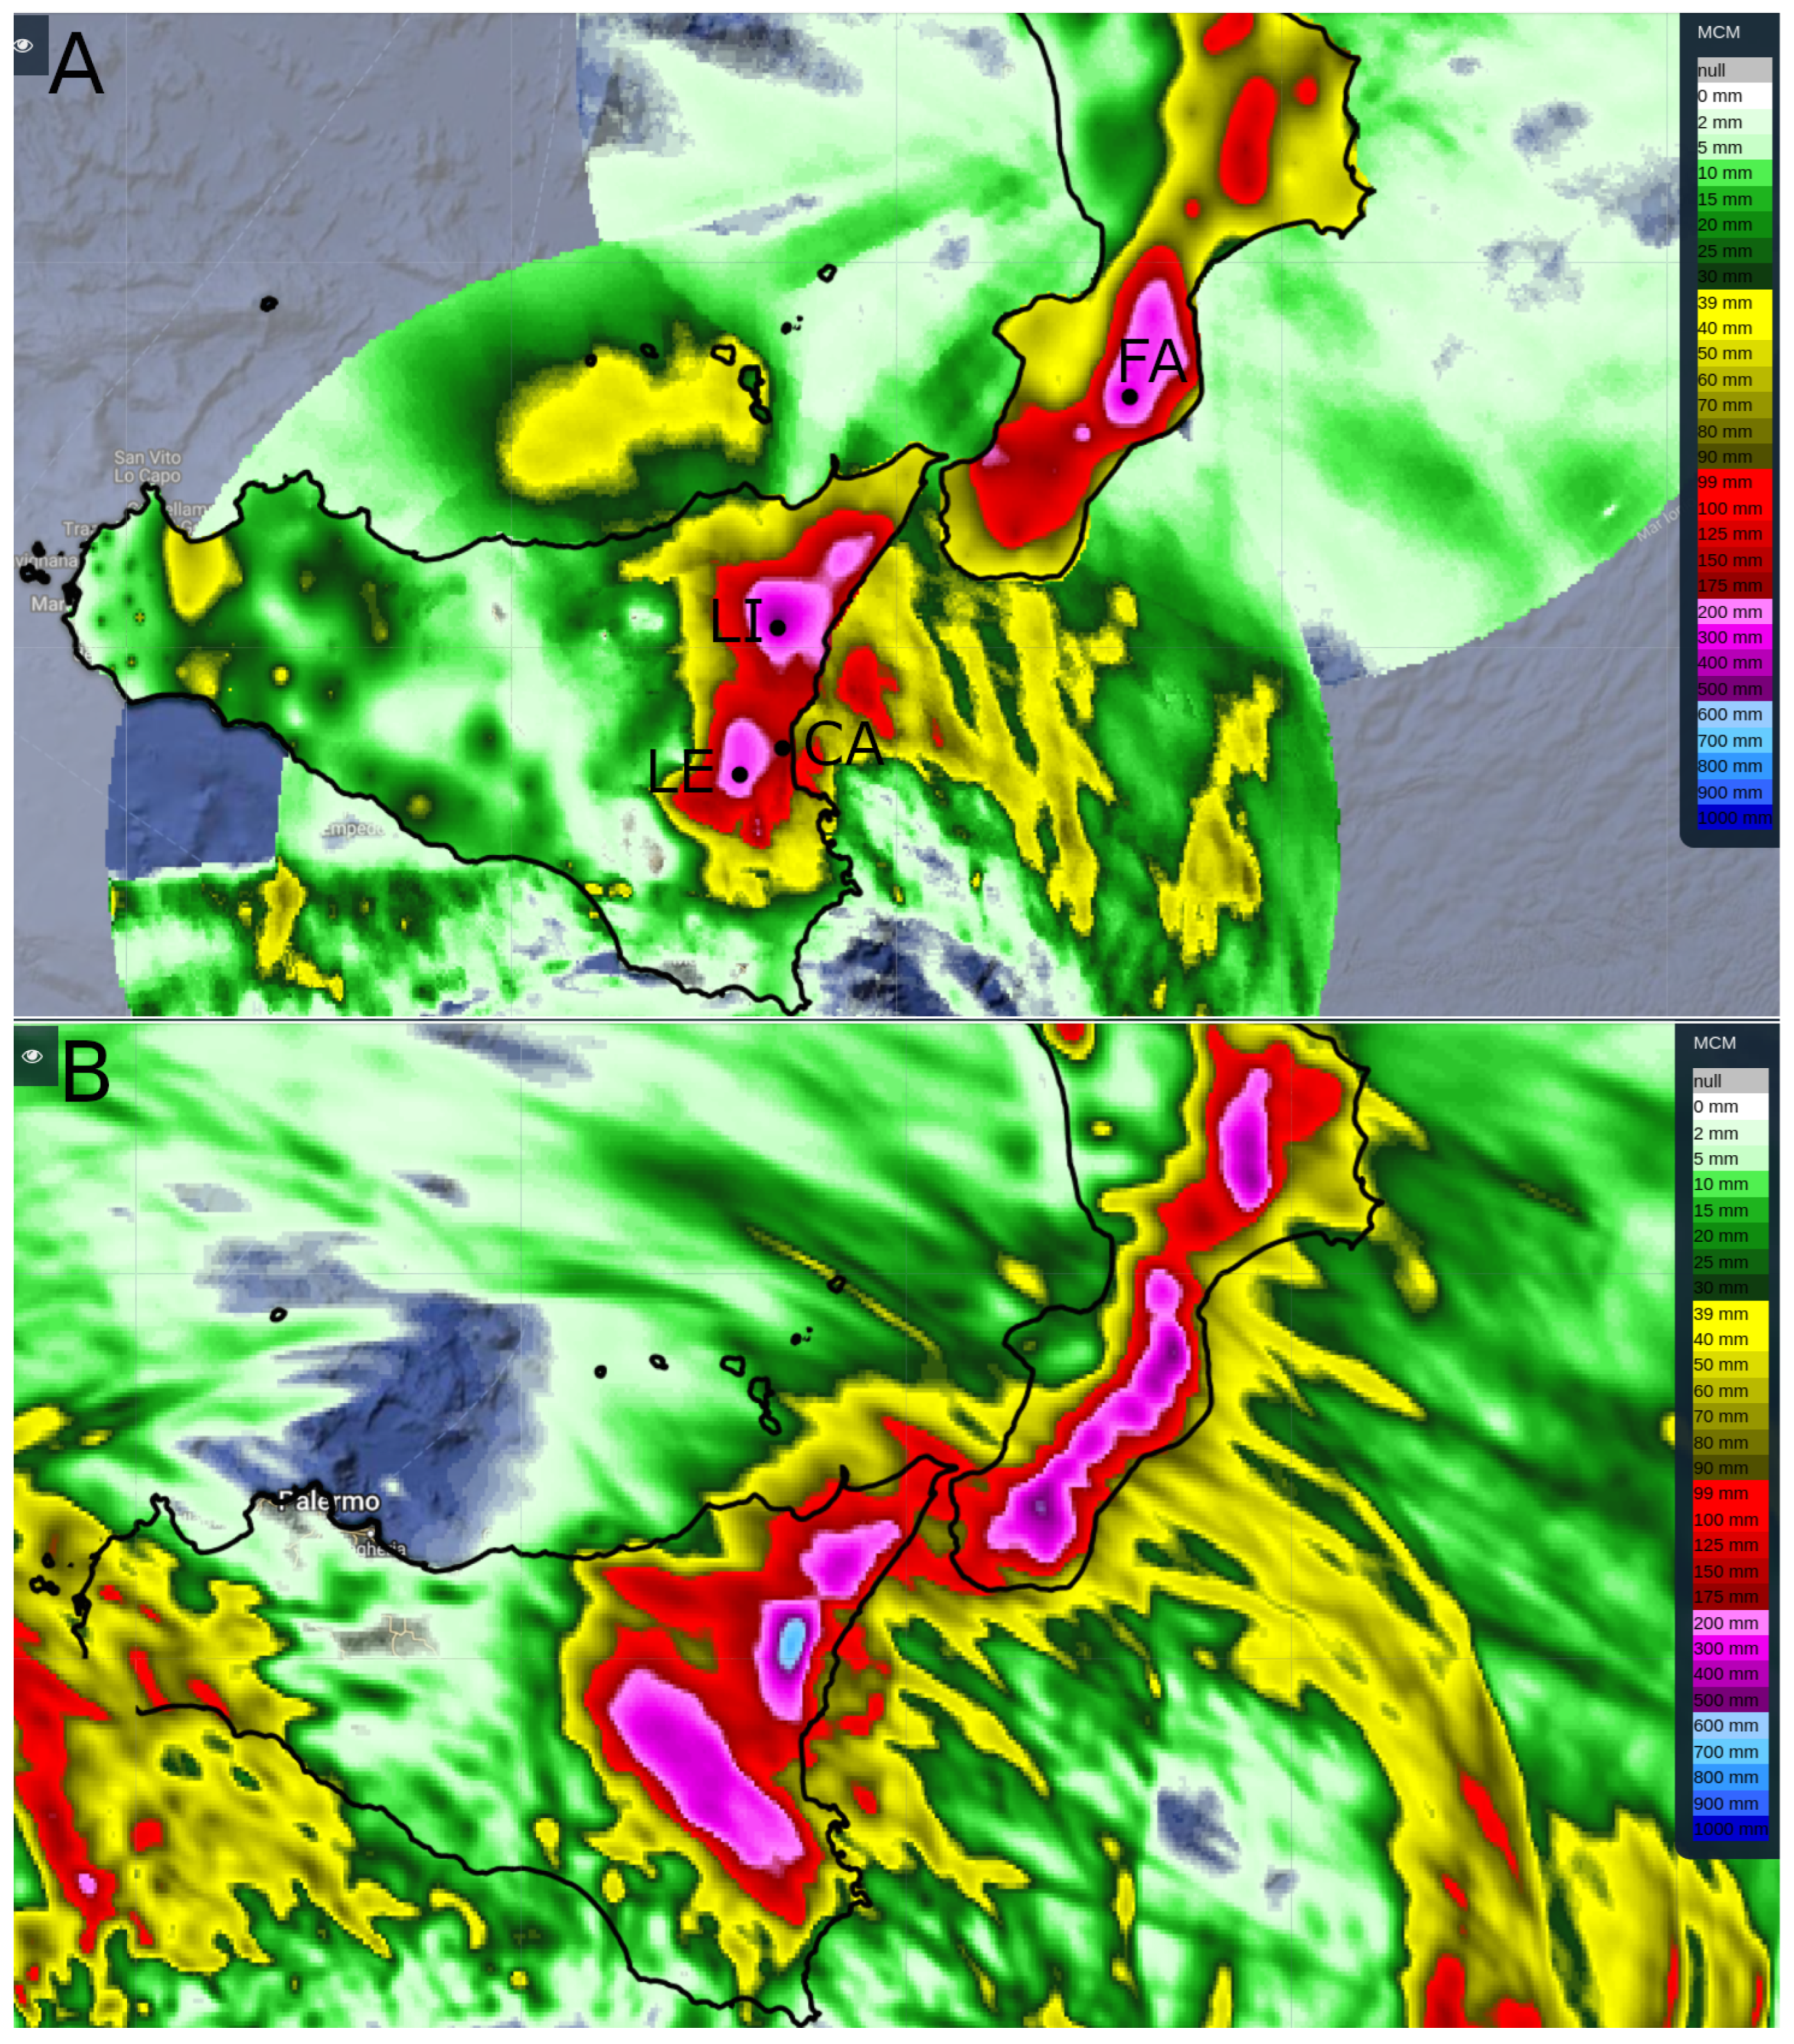
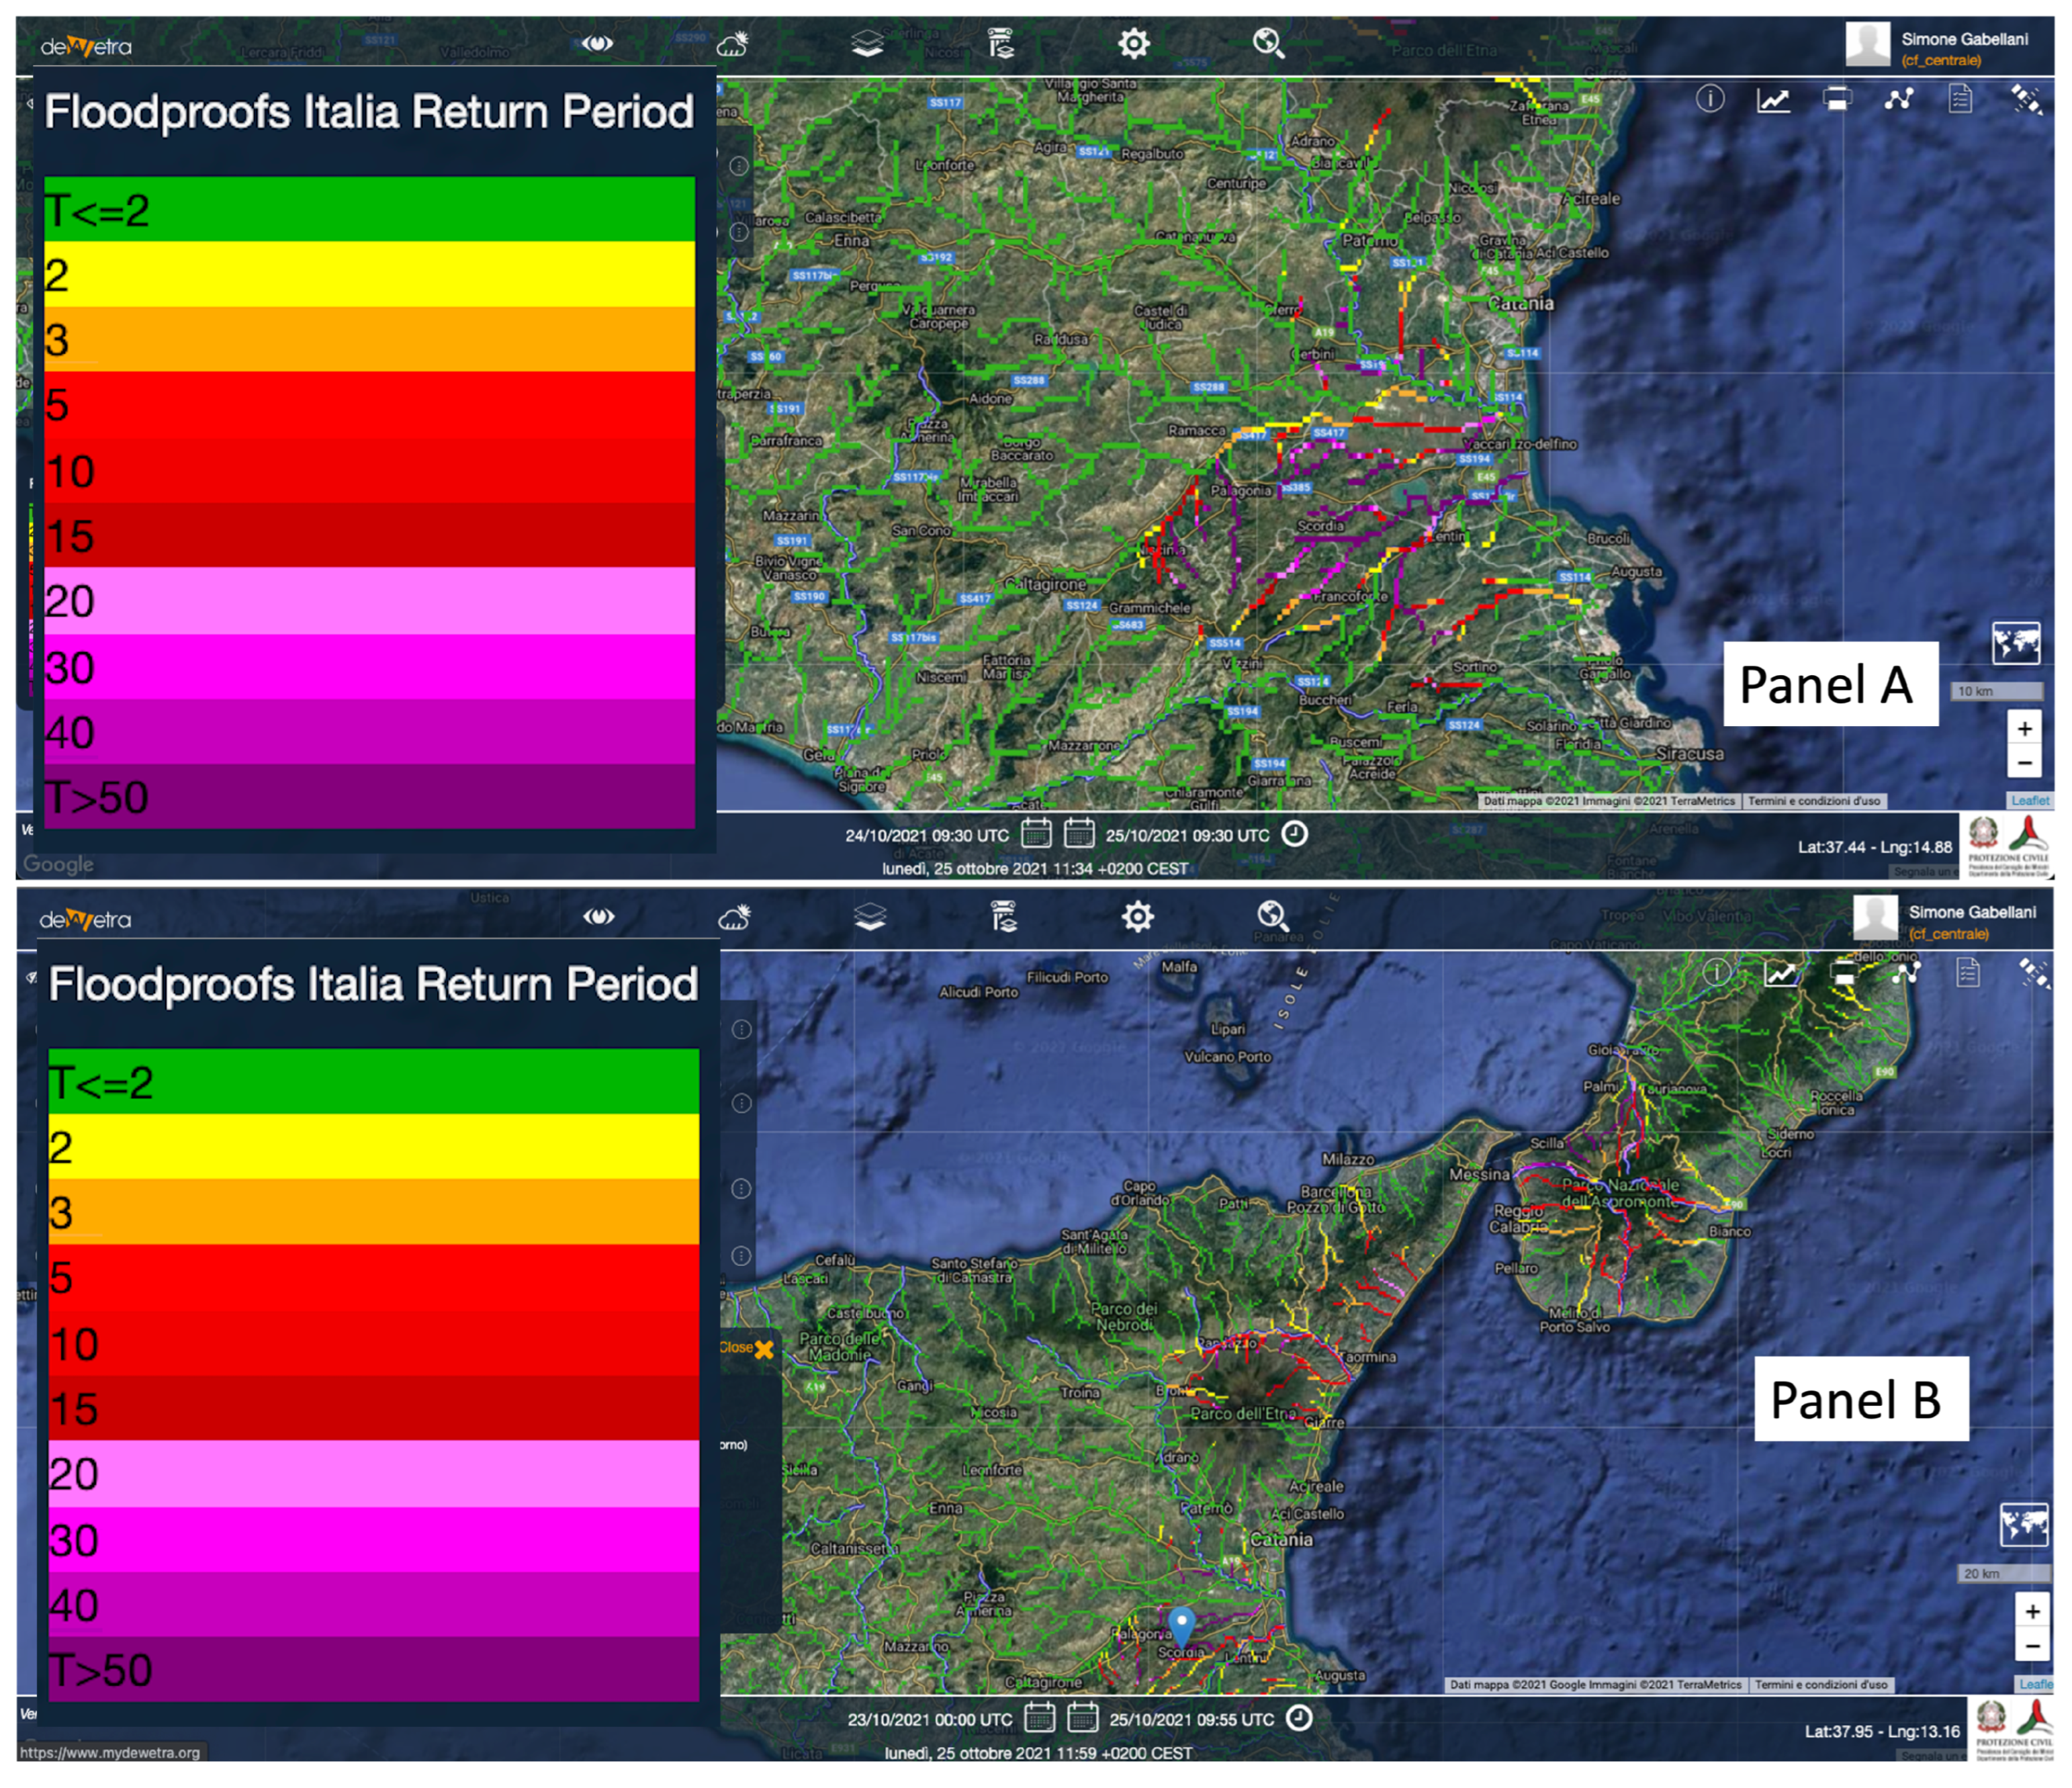
3.3. The Hydrological Monitoring

Flood-PROOFS also allows to monitor the event. When rainfall starts, it is possible to use meteorological observations to guide hydrological modeling and monitor the space–time evolution of the effects of the meteorological event. In the run with the observations, the hydrological simulation is performed using only observed meteorological variables. Figure 7 shows the severity of the event expressed as return period of the discharge estimated according to model climatology. The model’s climatology was conducted by performing a run of the hydrological model on an historical period (2007–2020); then, maximal annual discharge values were extracted from the simulation results, and the statistics were calculated. Flood-PROOFS highlighted the most severely affected areas—including the Catanian plain, the villages of Scordia and Ogliastro (panel A), and Messina and Reggio Calabria (panel B). Many basins hit by intense precipitation (in the night between 24 and 25 October 2021) achieved a return period of the discharge around 20–50 years, highlighting the most severely affected areas. A good agreement between the forecast (Figure 5) and the monitoring tool (Figure 7) is observed. The areas hit by the most intense part of this event (high return period in the monitoring tool) are the same red sections pointed out by the forecast.
The Flood-PROOFS results are uploaded on the MyDewetra platform to be easily accessible and visualized. The platform is updated in near real time whenever new observations or modeling results become available during the event to help the Italian Civil Protection monitoring system. All the figures are screenshots from MyDewetra. Comments on the performances of the streamflow forecast are in the next section, where the hindcast experiment is introduced.

3.4. Flood Mapping with 2D Hydraulic Model

To support the field activities of the Civil Protection in the immediate post-event, we used the TELEMAC-2D hydraulic model to map the flooded areas of the Catanian floodplain (red dot in Figure 2). The TELEMAC-2D model was coupled with the Continuum model receiving the hydrographs simulated by the run on observation to represent the dynamic evolution, in space and time, of the floods in floodplains. Figure 8 shows the results of TELEMAC-2D for the Catanian floodplain (Sicily) in terms of maximum water depth (left panel) and maximum water velocity (right panel) for the event that hit the area between the 24th and 25th of October 2021.

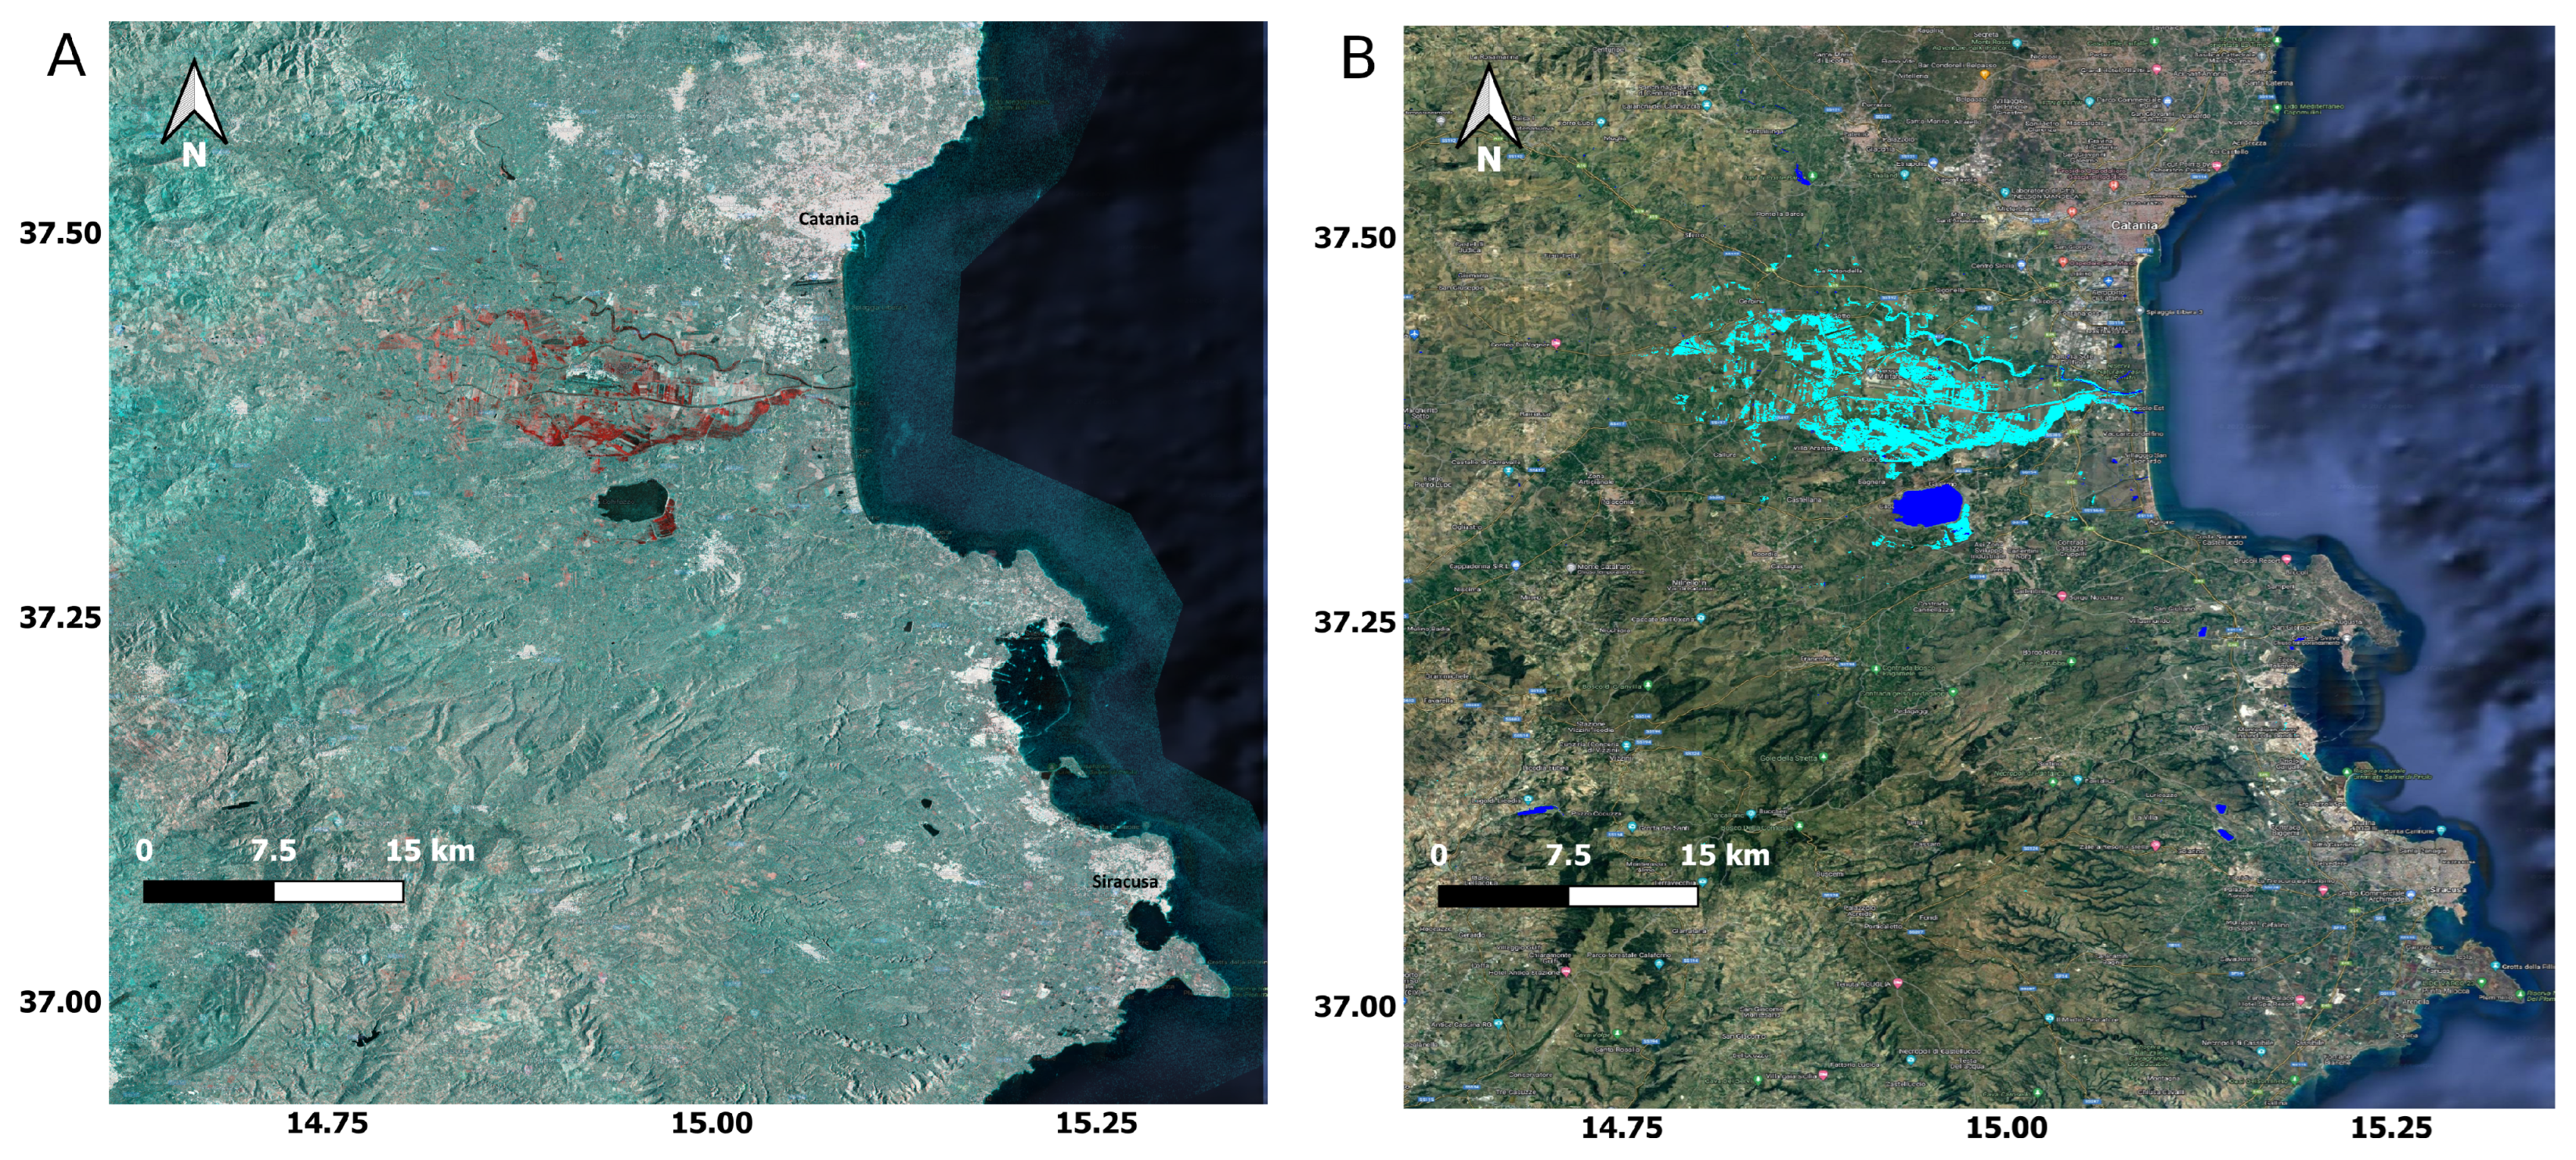
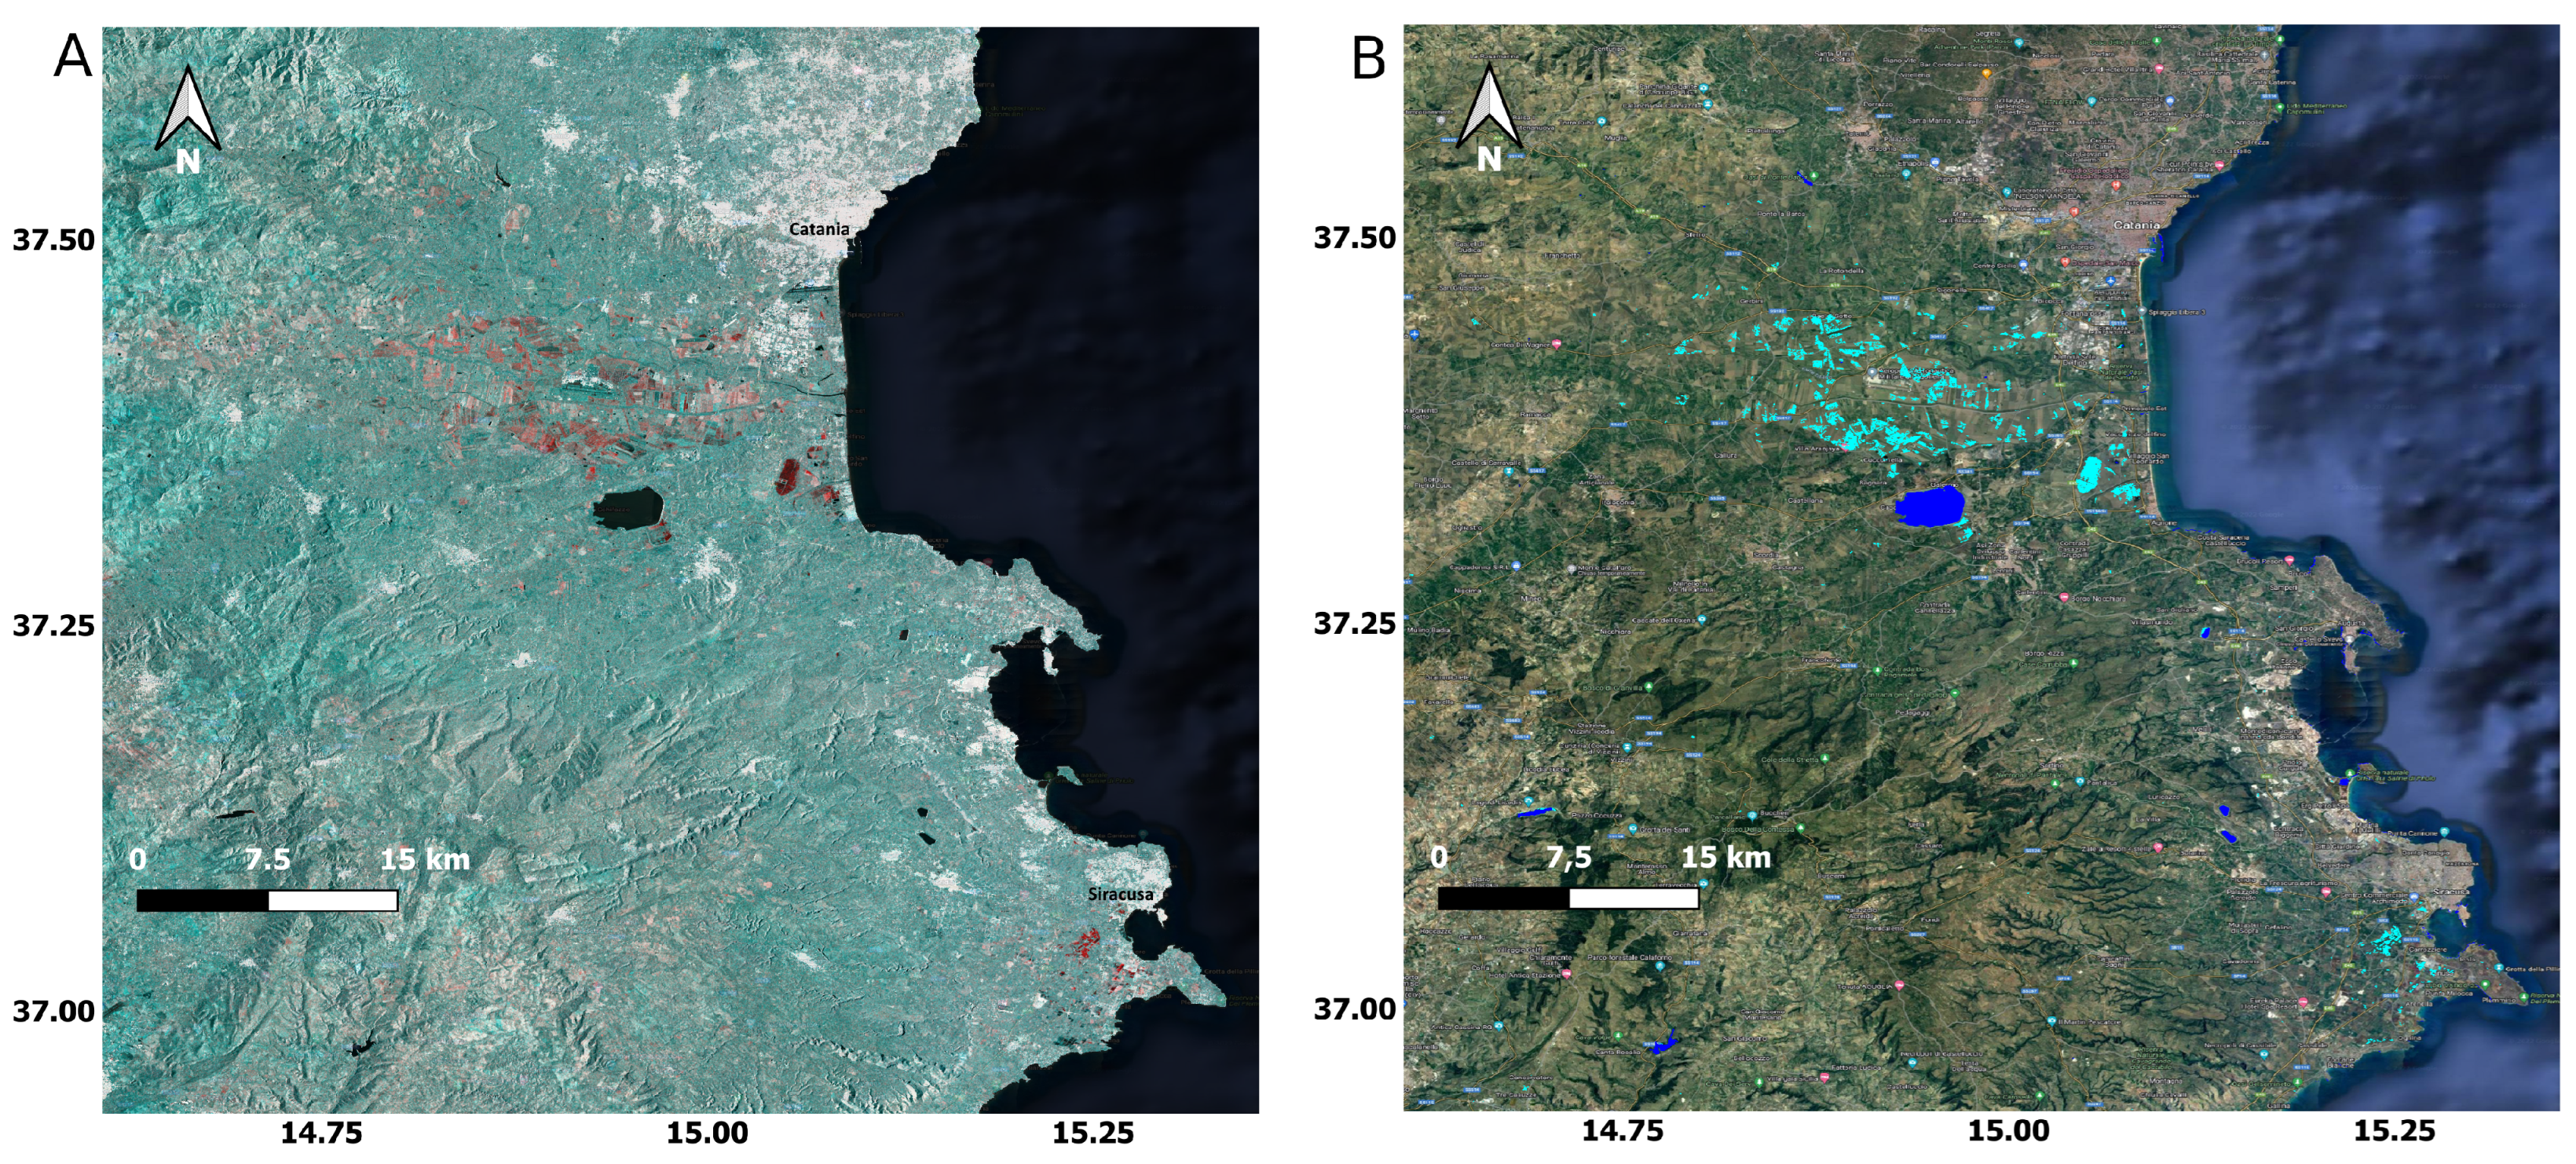
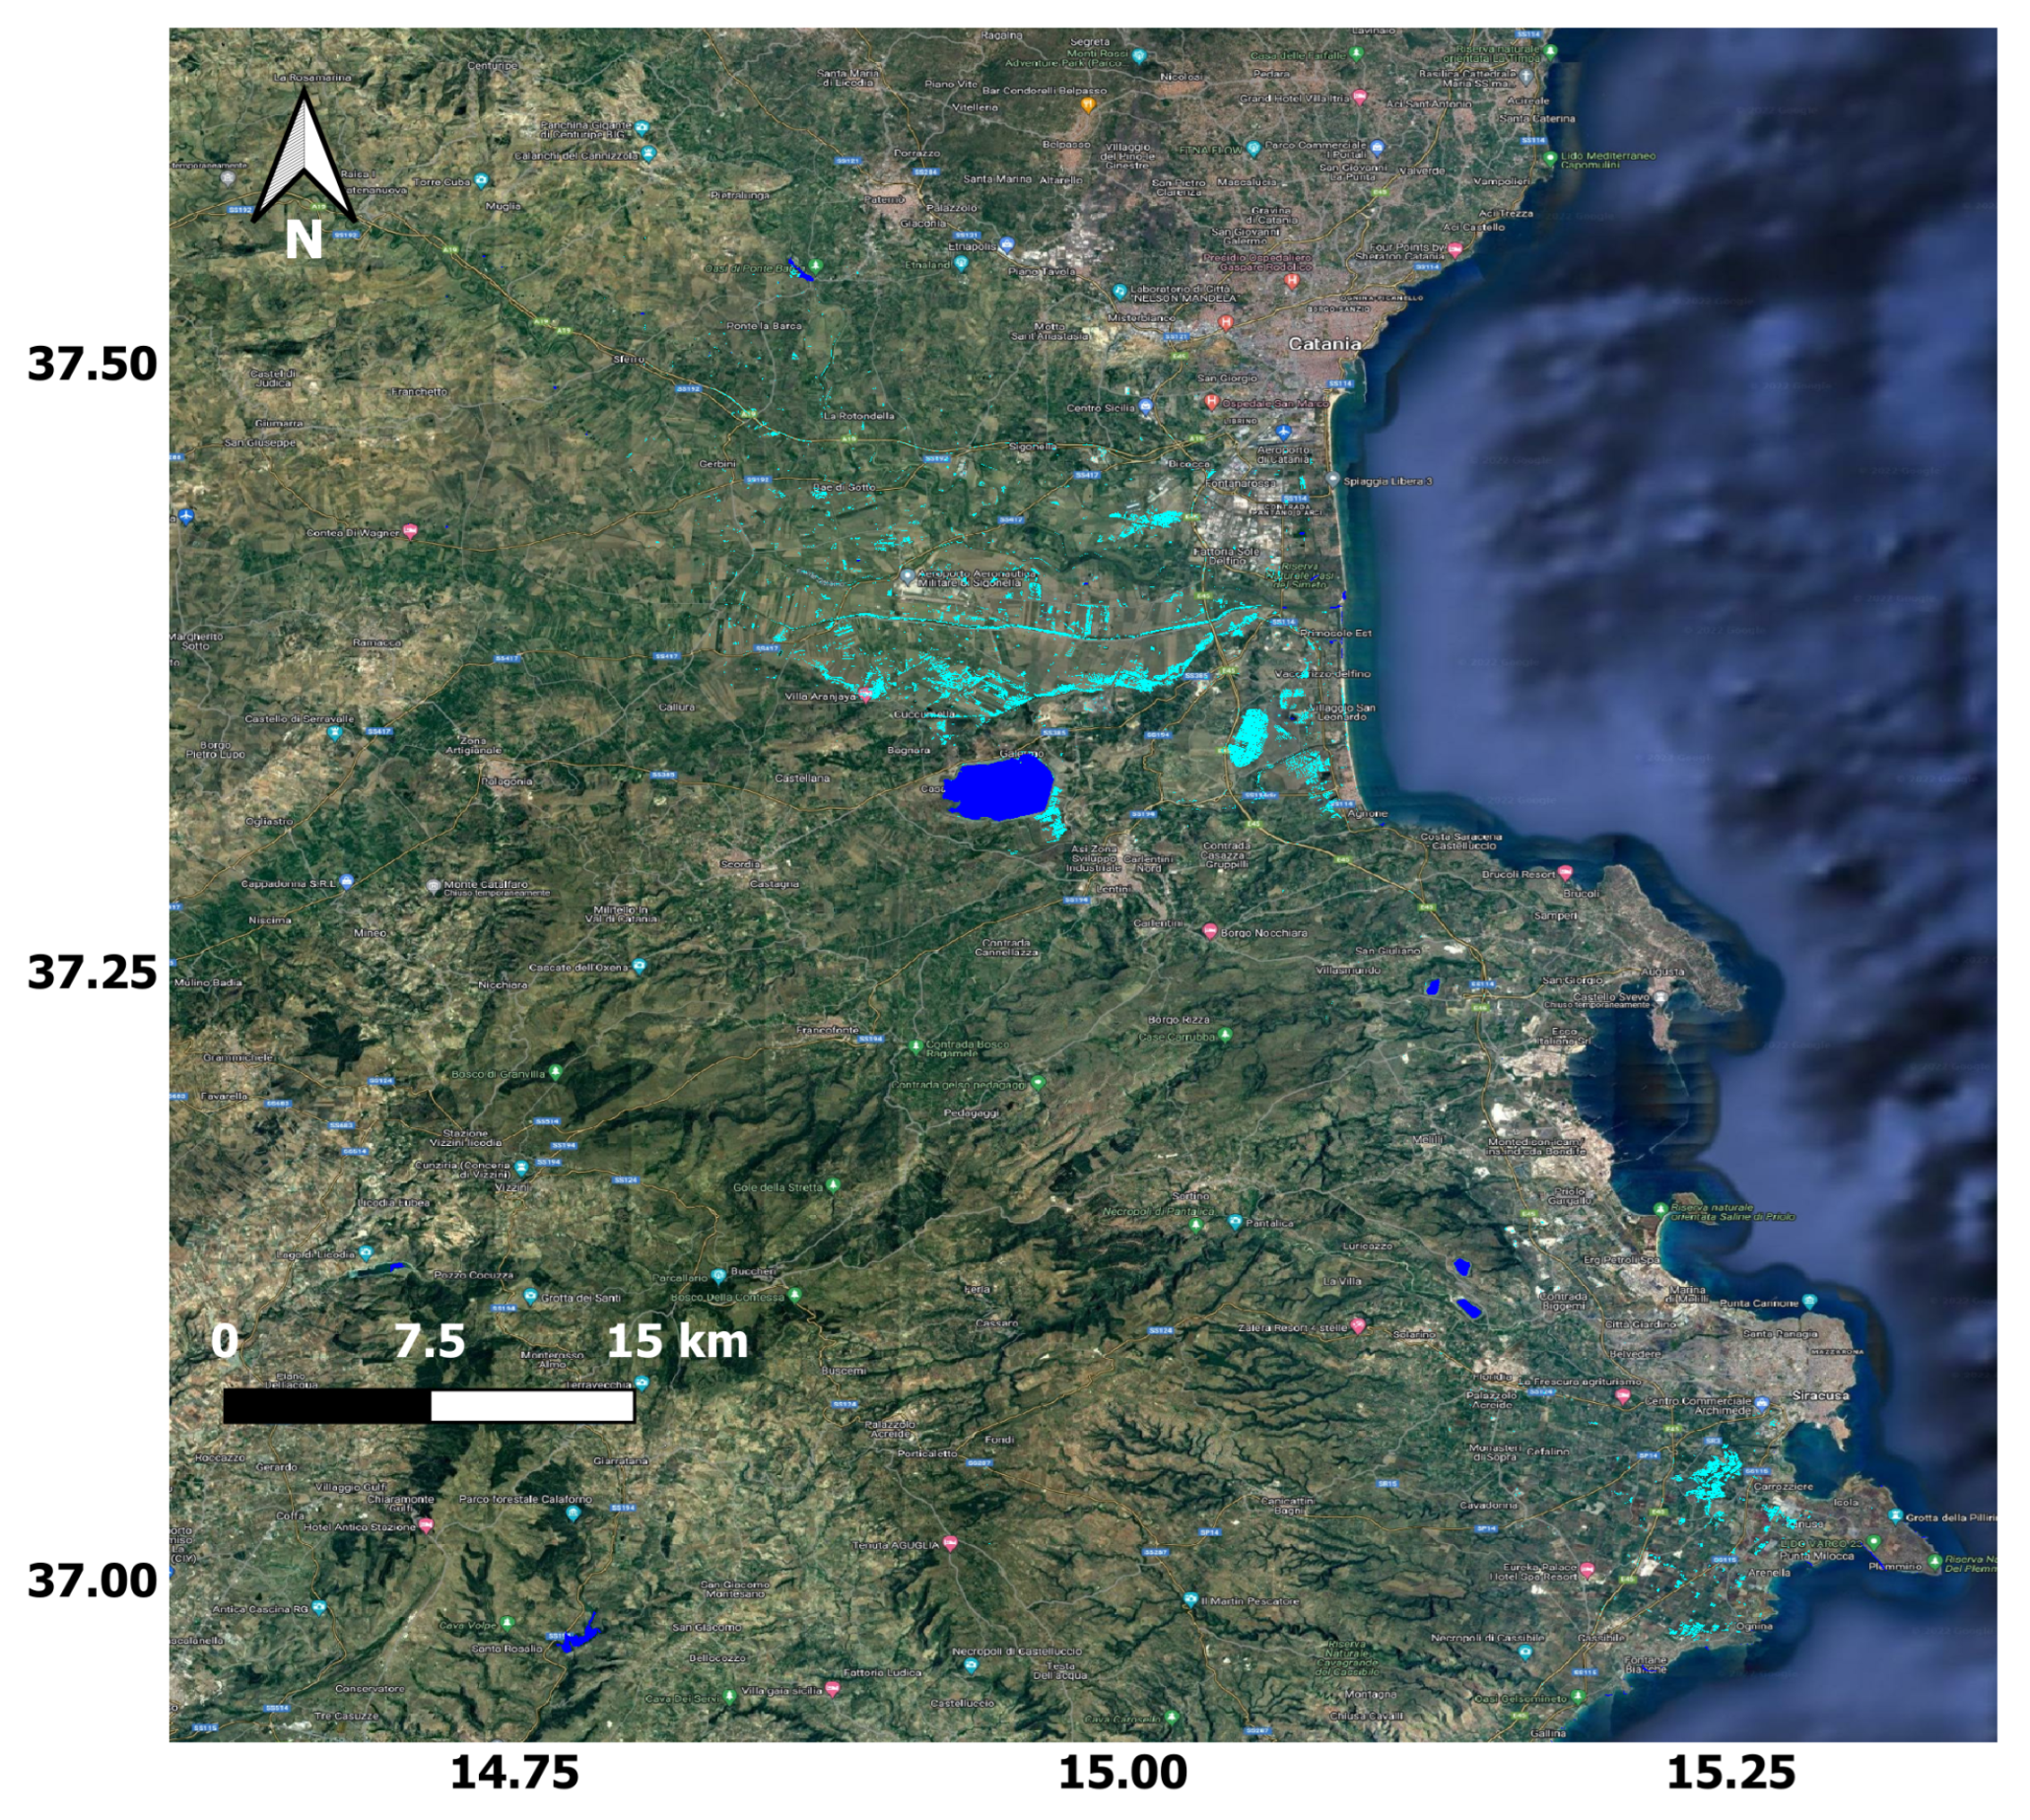
3.5. Flood Mapping from Satellites

Another step along the chain used in this event was the use of a recent tool developed by the CIMA foundation and the Italian Civil Protection Department, AUTOWADE, to detect flooded areas from satellites.
For the Apollo Medicane, the first available S1 data were acquired on Oct 25th 2021 at 05:00 UTC (orbit 124). As preflood image, an acquisition from the same orbit performed on 19 October 2021 at 05:00 UTC was used. The AUTOWADE-derived flood map was made available to the end user on 25 October 2021 at 13:00 UTC. By using both S1 and COSMO-SkyMed (CSK) data, a continuous monitoring of the flood evolution was performed. In particular, the following flood images were also used to produce flood maps in addition to those acquired on 25 October:
  • S1—25 October 2021 at 17.00 UTC
  • CSK—27 October 2021 at 16.45.
  • CSK—28 October 2021 at 16.45.
  • CSG 2nd generation—30 October 2021 at 04.30.
  • S1—31 October 2021 at 05.00 UTC.
Figure 9, panel A, shows an RGB composite produced using the calibrated (backscattering coefficient s0 [dB]) and geocoded images acquired by S1 over eastern Sicily (Catania and Siracusa districts) on 19 October 2021 (red) and 25 October 2021 (green and blue), both at 05:00 UTC. Flooded areas appear in red tone in the RGB composition, because the presence of floodwater produced a significant decrease in s0, as previously discussed. Note that permanent water appears in dark tone because s0 was low on 19 October, too. The same applies for very smooth surfaces such as airport runways. AUTOWADE is able to automatically detect floodwater and distinguish it from permanent water. The detection is based on automatic thresholding applied to both the flood image and the difference image (difference in dB between the flood and preflood images). Considering that automatic thresholding does not work well if water covers a small fraction of the image (as usually occurs in temperate regions), AUTOWADE uses an edge detection filter to reduce the number of input pixels to those placed near the water–land edges. For this purpose, an ISODATA clustering algorithm is preliminary applied for the purpose of a first-guess identification of water surfaces. After having determined the thresholds to identify permanent water and floodwater, AUTOWADE accounts for the spatial context by applying a region growing algorithm (RGA), whose seed region corresponds to the set of pixels identified by applying the thresholds. RGA grows these seeds into regions by successively adding neighboring pixels to them. The map of the flooded area generated by AUTOWADE is shown in Figure 9, panel B.
As previously pointed out, AUTOWADE was used to monitor the flood evolution until 31 October 2021. The following S1 acquisition along orbit 124 was performed on 31 October, at 05:00 UTC. Figure 10, panel A, is analogous to Figure 9, panel A, but with the backscattering measured on 25 October replaced by that measured on 31 October. It can be noted that floodwater was still present six days after the day when the flood occurred and that, even in the Siracusa district, floodwater was present. Figure 10, panel B, shows the corresponding map.
To cope with the latency of S1 images between 25th and 31st October, the Italian Space Agency (ASI) made available two COSMO-SkyMed (CSK) images and one COSMO-SkyMed second-generation (CSG) image. AUTOWADE was adapted to work with X-band SAR data, too, like those provided by CSK and CSG. On the one hand, the use of CSK and CSG allowed AUTOWADE to produce flood maps with higher spatial resolution (5 m instead of 20 m). On the other hand, the lack of preflood images acquired with the same configuration of measurement of the flood images prevented AUTOWADE from applying change detection. This implied a decrease in the accuracy of the flood map and made it difficult to distinguish permanent water from floodwater. Nevertheless, to the best of our knowledge, the map produced using CSG data, shown in Figure 11, represents the first flood product generated using this sensor. By comparing Figure 10, panel B, with Figure 11, it can be noted that more water is present in the former figure, although it was produced using SAR data acquired one day later. This is due to the lack of a preflood CSG image underlined above, which hampered a profitable application of a change detection approach.

3.6. Flood Depth Estimation with FwDET

Starting from the flooded area obtained from satellite observations and the 2 m-resolution DEM, it was also possible to estimate the water depth using the The Floodwater Depth Estimation Tool (FwDET). Figure 12 in the right panel shows the results obtained from the FwDET application fed by the AUTOWADE flooded areas.
Thus, from this chain in near real time, we obtained two different water depth maps, one coming from the TELEMAC-2D model driven by weather observation and another one coming from the FwDET tool fed by both Sentinel-1 and CosmoSkyMed flooded areas retrieved with AUTOWADE (Figure 12). The comparison between the water depth produced by TELEMAC-2D (Figure 12, left panel) and FwDET (Figure 12, right panel) shows differences in the flooded area. This comparison emphasizes the benefits and limitations of individual approaches, even if the overall degree of agreement is noticeable; especially for fast floods, the timing of the satellite passage is not synchronous with the flooding peak, and this can lead to an underestimation of flooded area detection. The hydraulics modeling is affected by the correct estimation of the boundary condition of the flood (peak value of discharge estimated by hydrological modeling) and by the accuracy of the DEM and its ability to include small embankments.
Thus, the best map is obtained by the merging of these two water depth maps in a unique one by taking for each pixel the maximum value between the two maps. Figure 13 shows the result obtained combining the two different water depth sources. This map obtained in near real time can help to evaluate the most affected areas and estimate damages in a very short time after the events hit the area.

3.7. Hindcast Experiments to Improve the Forecasting Chain

In an hindcast experiment, the meteorological forecast was run again using the WRF-DA setup, allowing the assimilation of reflectivity radar and temperature data (Figure 14). The WRF-OL configuration already provided a forecast close to the observed event, as demonstrated by the high Total Interest value obtained during the validation process (Table 2). Moreover, in this case, the MODE validation was applied to the WRF-DA forecast to assess the assimilation value added (Table 3). Despite the starting point having already high performing scores, the Total Interest grows for the 150 mm threshold from 0.95 to 0.97 and from 0.91 to 0.95 for the 200 mm threshold, showing an improvement achieved with the WRF-DA setup.
Comparing Figure 4 and Figure 14, it is possible to highlight that the WRF-DA setup (Figure 14, panel B) allows to reduce the rainfall overestimation provided by the WRF-OL configuration (Figure 4, panel B) in the areas that were not hit by the most intense part of the event, as highlighted by the observed rainfall map (Figure 4 and Figure 14, panels A).
Moreover, the WRF-DA was used as input of the Flood-PROOFS hydrological chain to evaluate the benefit and the predictive skills of the meteorological assimilation. Figure 15 shows the stream flow forecast of this configuration, even with the assimilation, and red dots highlight that the peak discharge forecasts were always exceeding the red threshold in all river sections of eastern Sicily in the night between 24 and 25 October.
By using the forecast hydrographs of Flood-PROOFS with WRF-DA, a run of the TELEMAC-2D hydraulic model led to forecast floodable areas; Figure 16 is a comparison between the forecasting of the floodable area (on the left) and the flooded area using Flood-PROOFS with ground data. The forecast floodable areas overestimates the ground data flooded areas but, nevertheless, having the information of potentially floodable areas in advance would allow better assessments and better civil protection planning for the post-event phase.
Since no streamflows observations are available for the regions, we use the run of the hydrological model fed by observations as benchmark (reference hydrograph), as commonly used in the literature (e.g., [30,41]). In particular, the peak flows from the benchmark run, which occurred in the morning of 25th of October, were compared with the peak flows forecast of the 24th of October.
The comparison is performed on a set of basins in Calabria and Sicily, where peak flows forecast or peak flows from the benchmark exceeded the warning thresholds. Since the WRF-OL forecast is performed using a probabilistic approach as in [42], we reported minimum and maximum peak flows of the ensemble.
Table 4 reports the results of the comparison; it shows the basins where a streamflow threshold [25] is exceeded, and therefore the section is marked with a red color on the myDewetra platform (as explained in Figure 5 caption). In these cases, both the configurations (WRF-OL and WRF-DA) give good results, even if the peaks are slightly underestimated in WRF-DA and overestimated in WRF-OL.
In the cases of the Simeto, Anapo, and Bonamico basins, the overestimation of the forecast is quite high for both configurations, and similar conditions occur in the Amendola basins, even if the WRF-OL configuration has a lower overestimation. The Petrace basin evidences a small underestimation of the Open-Loop configuration, while DA weakly overestimates the peak flow. The selected basins have a drainage area ranging from 50 to 4000 km2; especially for smaller basins, the intrinsic uncertainties of meteorological forecasts contrast with the spatial scales of the catchments [43,44]. This led to consider the hydrological forecast as highly reliable on a subregional warning scale rather than evaluating the results on individual basins; this technique is called the multi-catchment probabilistic approach [45], and the prediction is based on the elaboration of the flood forecast made on a number of small catchments that belong to the same predefined region, in order to issue a unique forecast that is valid for the entire region. In Italy, warning areas are defined by regional laws. From this perspective, even if the streamflow forecast is not quantitatively correct for all the basins, the magnitude of the event is very well captured in all the chain configurations and supported meteo/hydrological offices for warning purpose.

4. Concluding Remarks

Because of the ongoing changing climate, extreme rainfall events’ frequency at the global scale is expected to increase, thus resulting in high social and economic impacts. A full Meteo/Hydro/hydraulic forecasting chain combining heterogeneous observational data sources is a key element of a complete Early Warning System; it supports decision makers (e.g., Civil Protection Authorities) to correctly predict these events, monitor them, and evaluate their effects and damages, speeding up the response and recovery. In this context, the CIMA Foundation, using the cloud-resolving WRF without (WRF-OL) and with the in situ weather stations’ data assimilation (WRF-3DVAR), the fully distributed hydrological model Continuum within Flood-PROOFS, the automatic system for water detection (AUTOWADE), and the hydraulic model TELEMAC-2D, operated in real time (or near real time) to predict the weather evolution and the corresponding hydrological and hydraulic impacts of the Apollo Medicane between 24 and 26 October 2021 over the Sicily and Calabria regions. The WRF-OL simulation (available at 00UTC, 24 October 2021) showed a very good predictive capability concerning the timing and the location of most intense rainfall phenomena over Catania and Siracusa provinces in Sicily, thus also enabling very accurate discharge peaks and timing predictions for the creeks’ hydrological network peculiar of eastern Sicily. Based on the WRF-OL model predictions, the daily run of the AUTOWADE tool, using Sentinel-1 (S1) data, was anticipated with respect to the schedule to quickly produce a flood map (S1 acquisition performed on 25 October 2021, at 05 UTC, flood map produced on the same day at 13 UTC). Moreover, considering that no S1 images of eastern Sicily were available during the period of 26–30 October, 2021, an ad hoc tasking of the COSMO-SkyMed satellite constellation was performed to overcome the S1 data latency. The resulting automated operational mapping of floods and inland waters was integrated with the Floodwater Depth Estimation Tool, FwDET, forecast to obtain water depth maps from satellite observations. Subsequently, the execution hydraulic model TELEMAC-2D starting from the Flood-PROOFS peak discharge forecast on observations allowed to obtain both water depth and water velocity evolution in time and space. The water depth results obtained with the two different tools were combined to overcame the intrinsic limits of the single approaches to obtain a more complete water depth map in near real time to highlight the most affected areas and estimate damages. Eventually, a further experiment was performed in hindcast mode to evaluate the value added of a forecasting chain including data assimilation in the meteorological part and to assess if it is possible to obtain a hydraulic impacts map not only during the monitoring phase but also in the forecasting one. Thus, the Flood-PROOFS deterministic hydrological forecast and the TELEMAC-2D forecast were performed with the WRF-DA simulation (instead of using only observations as in during the monitoring phase). This experiment showed that the data assimilation allows to obtain further forecast improvement, especially in terms of rainfall overestimation reduction, and the use of TELEMAC-2D with simulation could also help highlight the most hit areas during the forecasting phase, not only during the monitoring one. Moreover, on a set of basins located in Sicily and Calabria, the performances obtained with the WRF-OL simulation and the WRF-DA hindcast experiment as input to the hydrological model were compared in terms of peak flows with respect to a benchmark simulation run using the meteorological observations to feed the hydrological model. Both the configurations give good results, and in some sections the WRF-DA configuration was able to improve the forecast, while in some others, a slight overestimation still persists in both configurations. Such a complex chain was run on this use case as an example of how the cooperation of different research fields such as meteorology, hydrology, hydraulics, Earth Observations, and ICT can enable a step change in how high-impact weather events can be predicted and monitored with a rich portfolio of observational data assimilated and the full exploitation of high performance and cloud computing facilities. In this work, the complete chain is tested on a long-lived event allowing to deeply explore instruments and possible improvements both in the forecasting and monitoring phase. Future works will be devoted to also develop a meteo-hydrological chain for nowcasting procedures to better improve the forecast and for very localized (in time and space) intense events. meteo-hydrological chain.

Author Contributions

Conceptualization, A.P. (Antonio Parodi), S.P., and S.G.; methodology, A.P. (Antonio Parodi); software, L.P., G.S., F.P., G.F., and A.P. (Andrea Parodi); validation, R.M., V.M., and E.F.; formal analysis, M.L., M.M., and F.S.; investigation, M.L. and L.P.; resources, L.F. and A.P. (Antonio Parodi); data curation, G.S. and R.M.; writing—original draft preparation, M.L., M.M., S.G., and L.P.; writing—review and editing, V.M., A.P., (Antonio Parodi) and S.P.; visualization, G.F., E.F., and A.P. (Antonio Parodi); supervision, A.P. (Antonio Parodi) and L.F.; project administration, A.P. (Antonio Parodi); funding acquisition, A.P. (Antonio Parodi) All authors have read and agreed to the published version of the manuscript.

Funding

This research was funded by E-SHAPE H2020 project https://cordis.europa.eu/project/id/820852 (accessed on 11 December 2022) Grant agreement ID: 820852.

Data Availability Statement

The data used in this work to present the results are stored in CIMA Research Fundation archives, and they can be available upon request to the authors only for research purposes. The meteorological model outputs are publicly available upon request to the authors.

Acknowledgments

The work has been carried out in the framework of the contract between CIMA Foundation and the National Italian Department of Civil Protection and the H2020 LEXIS https://cordis.europa.eu/project/id/825532 (accessed on 11 December 2022).

Conflicts of Interest

The authors declare no conflict of interest.

References

  1. Emanuel, K. Genesis and maintenance of “Mediterranean hurricanes”. Adv. Geosci. 2005, 2, 217–220. [Google Scholar] [CrossRef] [Green Version]
  2. Romero, R.; Emanuel, K. Medicane risk in a changing climate. J. Geophys. Res. Atmos. 2013, 118, 5992–6001. [Google Scholar] [CrossRef]
  3. Cavicchia, L.; von Storch, H.; Gualdi, S. A long-term climatology of medicanes. Clim. Dyn. 2014, 43, 1183–1195. [Google Scholar] [CrossRef]
  4. Cioni, G.; Malguzzi, P.; Buzzi, A. Thermal structure and dynamical precursor of a Mediterranean tropical-like cyclone. Q. J. R. Meteorol. Soc. 2016, 142, 1757–1766. [Google Scholar] [CrossRef]
  5. Molini, L.; Parodi, A.; Rebora, N.; Craig, G.C. Classifying severe rainfall events over Italy by hydrometeorological and dynamical criteria. Quart. J. Roy. Meteor. Soc. 2011, 137, 148–154. [Google Scholar] [CrossRef]
  6. Department, I.C.P.; Foundation, C.R. The Dewetra platform: A multi-perspective architecture for risk management during emergencies. In Proceedings of the Information Systems for Crisis Response and Management in Mediterranean Countries: First International Conference, ISCRAM-med 2014, Toulouse, France, 15–17 October 2014; Proceedings 1. Springer: Berlin/Heidelberg, Germany, 2014; pp. 165–177. [Google Scholar]
  7. Longhitano, S.; Colella, A. Geomorphology, sedimentology and recent evolution of the anthropogenically modified Simeto River delta system (eastern Sicily, Italy). Sediment. Geol. 2007, 194, 195–221. [Google Scholar] [CrossRef]
  8. Longhitano, S.; Colella, A. Stratigraphy and basin-fill architecture of the Plio-Pleistocene Catania Plain foredeep basin (eastern Sicily): A preliminary synthesis. GeoActa 2003, 1, 75–89. [Google Scholar]
  9. Skamarock, W.C.; Klemp, J.B.; Dudhia, J.; Gill, D.O.; Barker, D.M.; Duda, M.; Wang, X.Y.; Wang, W.; Power, J.G. A Description of the Advanced Research WRF Version 3 (No. NCAR/TN-475+STR); University Corporation for Atmospheric Research: Boulder, CO, USA, 2008. [Google Scholar] [CrossRef]
  10. Fiori, E.; Ferraris, L.; Molini, L.; Siccardi, F.; Kranzlmueller, D.; Parodi, A. Triggering and evolution of a deep convective system in the Mediterranean sea: Modelling and observations at a very fine scale. Quart. J. Roy. Meteor. Soc. 2017, 143, 927–941. [Google Scholar] [CrossRef]
  11. Lagasio, M.; Parodi, A.; Procopio, R.; Rachidi, F.; Fiori, E. Lightning potential index performances in multimicrophysical cloud-resolving simulations of a back-building mesoscale convective system: The Genoa 2014 event. J. Geophys. Res. Atmos. 2017, 122, 4238–4257. [Google Scholar] [CrossRef]
  12. Lagasio, M.; Silvestro, F.; Campo, L.; Parodi, A. Predictive capability of a high-resolution hydrometeorological forecasting framework coupling WRF cycling 3dvar and Continuum. J. Hydrometeorol. 2019, 20, 1307–1337. [Google Scholar] [CrossRef]
  13. Paulson, C.A. The mathematical representation of wind speed and temperature profiles in the unstable atmospheric surface layer. J. Appl. Meteor. 1970, 9, 857–860. [Google Scholar] [CrossRef]
  14. Dyer, A.J.; Hicks, B.B. Flux-gradient relationships in the constant flux layer. Quart. J. Roy. Meteor. Soc. 1970, 96, 715–721. [Google Scholar] [CrossRef]
  15. Webb, E.K. Profile relationships: The log-linear range, and extension to strong stability. Quart. J. Roy. Meteor. Soc. 1970, 96, 67–90. [Google Scholar] [CrossRef]
  16. Beljaars, A.C. The parametrization of surface fluxes in large-scale models under free convection. Quart. J. Roy. Meteor. Soc. 1995, 121, 255–270. [Google Scholar] [CrossRef]
  17. Smirnova, T.G.; Brown, J.M.; Benjamin, S.G. Performance of different soil model configurations in simulating ground surface temperature and surface fluxes. Mon. Wea. Rev. 1997, 125, 1870–1884. [Google Scholar] [CrossRef]
  18. Smirnova, T.G.; Brown, J.M.; Benjamin, S.G.; Kim, D. Parameterization of cold season processes in the MAPS land-surface scheme. J. Geophys. Res. 2000, 105, 4077–4086. [Google Scholar] [CrossRef]
  19. Hong, S.Y.; Noh, Y.; Dudhia, J. A new vertical diffusion package with an explicit treatment of entrainment processes. Mon. Wea. Rev. 2006, 134, 2318–2341. [Google Scholar] [CrossRef] [Green Version]
  20. Hong, S.Y.; Lim, J.O.J. The WRF single-moment 6-class microphysics scheme (WSM6). Asia-Pac. J. Atmos. Sci. 2006, 42, 129–151. [Google Scholar]
  21. Iacono, M.J.; Delamere, J.S.; Mlawer, E.J.; Shephard, M.W.; Clough, S.A.; Collins, W.D. Radiative forcing by long-lived greenhouse gases: Calculations with the AER radiative transfer models. J. Geophys. Res. Atmos. 2008, 113, D13103. [Google Scholar] [CrossRef]
  22. Wang, H.; Huang, X.Y.; Sun, J.; Xu, D.; Zhang, M.; Fan, S.; Zhong, J. Inhomogeneous background error modeling for WRF-Var using the NMC method. J. Appl. Meteor. Climatol. 2014, 53, 2287–2309. [Google Scholar] [CrossRef] [Green Version]
  23. Silvestro, F.; Gabellani, S.; Delogu, F.; Rudari, R.; Boni, G. Exploiting remote sensing land surface temperature in distributed hydrological modelling: The example of the Continuum model. Hydrol. Earth Syst. Sci. 2013, 17, 39–62. [Google Scholar] [CrossRef]
  24. Silvestro, F.; Gabellani, S.; Rudari, R.; Delogu, F.; Laiolo, P.; Boni, G. Uncertainty reduction and parameter estimation of a distributed hydrological model with ground and remote-sensing data. Hydrol. Earth Syst. Sci. 2015, 19, 1727–1751. [Google Scholar] [CrossRef] [Green Version]
  25. Bruno, G.; Pignone, F.; Silvestro, F.; Gabellani, S.; Schiavi, F.; Rebora, N.; Giordano, P.; Falzacappa, M. Performing Hydrological Monitoring at a National Scale by Exploiting Rain-Gauge and Radar Networks: The Italian Case. Atmosphere 2021, 12, 771. [Google Scholar] [CrossRef]
  26. Laiolo, P.; Gabellani, S.; Campo, L.; Silvestro, F.; Delogu, F.; Rudari, R.; Pulvirenti, L.; Boni, G.; Fascetti, F.; Pierdicca, N.; et al. Impact of different satellite soil moisture products on the predictions of a continuous distributed hydrological model. Int. J. Appl. Earth Obs. Geoinf. 2016, 48, 131–145. [Google Scholar] [CrossRef]
  27. Cenci, L.; Laiolo, P.; Gabellani, S.; Campo, L.; Silvestro, F.; Delogu, F.; Boni, G.; Rudari, R. Assimilation of H-SAF soil moisture products for flash flood early warning systems. Case study: Mediterranean catchments. IEEE J. Sel. Top. Appl. Earth Obs. Remote. Sens. 2016, 9, 5634–5646. [Google Scholar] [CrossRef]
  28. Cenci, L.; Pulvirenti, L.; Boni, G.; Chini, M.; Matgen, P.; Gabellani, S.; Squicciarino, G.; Pierdicca, N. An evaluation of the potential of Sentinel 1 for improving flash flood predictions via soil moisture–data assimilation. Adv. Geosci. 2017, 44, 89–100. [Google Scholar] [CrossRef] [Green Version]
  29. Corral, C.; Berenguer, M.; Sempere-Torres, D.; Poletti, L.; Silvestro, F.; Rebora, N. Comparison of two early warning systems for regional flash flood hazard forecasting. J. Hydrol. 2019, 572, 603–619. [Google Scholar] [CrossRef] [Green Version]
  30. Poletti, M.L.; Silvestro, F.; Davolio, S.; Pignone, F.; Rebora, N. Using nowcasting technique and data assimilation in a meteorological model to improve very short range hydrological forecasts. Hydrol. Earth Syst. Sci. 2019, 23, 3823–3841. [Google Scholar] [CrossRef] [Green Version]
  31. Alfieri, L.; Avanzi, F.; Delogu, F.; Gabellani, S.; Bruno, G.; Campo, L.; Libertino, A.; Massari, C.; Tarpanelli, A.; Rains, D.; et al. High resolution satellite products improve hydrological modeling in northern Italy. Hydrol. Earth Syst. Sci. Discuss. 2022, 26, 3921–3939. [Google Scholar] [CrossRef]
  32. Pulvirenti, L.; Squicciarino, G.; Fiori, E.; Ferraris, L.; Puca, S. A Tool for Pre-Operational Daily Mapping of Floods and Per-Manent Water Using Sentinel-1 Data. Remote. Sens. 2021, 13, 1342. [Google Scholar] [CrossRef]
  33. Cohen, S.; Raney, A.; Munasinghe, D.; Loftis, J.D.; Molthan, A.; Bell, J.; Rogers, L.; Galantowicz, J.; Brakenridge, G.R.; Kettner, A.J.; et al. The Floodwater Depth Estimation Tool (FwDET v2. 0) for improved remote sensing analysis of coastal flooding. Nat. Hazards Earth Syst. Sci. 2019, 19, 2053–2065. [Google Scholar] [CrossRef]
  34. Davis, A.C.; Brown, B.; Bullock, R. Object-based verification of precipitation forecasts. Part I: Methodology and application to mesoscale rain areas. Mon. Wea. Rev. 2006, 134, 1772–1784. [Google Scholar] [CrossRef] [Green Version]
  35. Davis, A.C.; Brown, B.; Bullock, R. Object-based verification of precipitation forecasts. Part II: Application to convective rain system. Mon. Wea. Rev. 2006, 134, 1785–1795. [Google Scholar] [CrossRef] [Green Version]
  36. Ebert, E.E. Fuzzy verification of high-resolution gridded forecasts: A review and proposed framework. Meteor. Appl. 2008, 15, 51–64. [Google Scholar] [CrossRef]
  37. Lagasio, M.; Parodi, A.; Pulvirenti, L.; Meroni, A.N.; Boni, G.; Pierdicca, N.; Marzano, F.S.; Luini, L.; Venuti, G.; Realini, E.; et al. A synergistic use of a high-resolution numerical weather prediction model and high-resolution Earth observation products to improve precipitation forecast. Remote. Sens. 2019, 11, 2387. [Google Scholar] [CrossRef] [Green Version]
  38. Davis, C.A.; Brown, B.G.; Bullock, R.; Halley-Gotway, J. The method for object-based diagnostic evaluation (MODE) applied to numerical forecasts from the 2005 NSSL/SPC Spring Program. Weather Forecast. 2009, 24, 1252–1267. [Google Scholar] [CrossRef] [Green Version]
  39. Bullock, R.; Brown, B.; Fowler, T. Method for Object-Based Diagnostic Evaluation (No. NCAR/TN-532+STR); University Corporation for Atmospheric Research: Boulder, CO, USA, 2016. [Google Scholar]
  40. Rebora, N.; Ferraris, L.; von Hardenberg, J.; Provenzale, A. RainFARM: Rainfall downscaling by a filtered autoregressive model. J. Hydrometeorol. 2006, 7, 724–738. [Google Scholar] [CrossRef]
  41. Berenguer, M.; Corral, C.; Sánchez-Diezma, R.; Sempere-Torres, D. Hydrological Validation of a Radar-Based Nowcasting Technique. J. Hydrometeorol. 2005, 6, 532–549. [Google Scholar] [CrossRef] [Green Version]
  42. Laiolo, P.; Gabellani, S.; Rebora, N.; Rudari, R.; Ferraris, L.; Ratto, S.; Stevenin, H.; Cauduro, M. Validation of the Flood-PROOFS probabilistic forecasting system. Hydrol. Process. 2014, 28, 3466–3481. [Google Scholar] [CrossRef]
  43. Siccardi, F.; Boni, G.; Ferraris, L.; Rudari, R. A hydrometeorological approach for probabilistic flood forecast. J. Geophys. Res. Atmos. 2005, 110, D05101. [Google Scholar] [CrossRef]
  44. Silvestro, F.; Rossi, L.; Campo, L.; Parodi, A.; Fiori, E.; Rudari, R.; Ferraris, L. Impact-based flash-flood forecasting system: Sensitivity to high resolution numerical weather prediction systems and soil moisture. J. Hydrol. 2019, 572, 388–402. [Google Scholar] [CrossRef]
  45. Siccardi, F.; Boni, G.; Ferraris, L.; Rudari, R. A reference framework for probabilistic flood forecast. J. Geophys. Res 2005, 110, D05101. [Google Scholar] [CrossRef]
Figure 1. Meteo /Hydro forecasting chain workflow.
Remotesensing 14 06348 g001
Figure 2. 25 October 2021 00UTC: SLP (hPa) and 10 m wind (knots) with the area of interest higlighted by a red rectangle and the Catania floodplain location highlighted with a dark red dot (top); Temperature (°C), Geopotential (dam) and wind (knots) at 500 hPa (bottom). Data from ECMWF analysis.
Remotesensing 14 06348 g002
Figure 3. Panel (A), the WRF-OL setup: three two-way nested domains with 13.5, 4.5, and 1.5 km grid spacing. Panel (B), the WRF-DA setup: three two-way nested domains with 22.5, 7.5, and 2.5 km. Gray shading indicates the model terrain.
Remotesensing 14 06348 g003
Figure 4. Observed (Panel (A)) and modeled (WRF-OL, Panel (B)) 48 h cumulated rainfall between 24–26 October 2021. In Panel A, black dots with labels represent the rain gauges cited in Section 2.1, namely Lentini (LE), Linguaglossa (LI), Catania (CA), and Fabrizia (FA).
Remotesensing 14 06348 g004
Figure 5. FloodPROOFS forecast over southern Italian rivers sections. Visualization on MyDewetra platform. The different sections’ colors refer to the magnitude of the peak discharge with respect to the fixed threshold for alarm (yellow) and alert (red). Green and white colors refer to discharge increasing but still below thresholds and discharge not increasing or decreasing, respectively.
Remotesensing 14 06348 g005
Figure 6. Hydrograph probabilistic forecast obtained by clicking on red sections represented in Figure 5 on MyDewetra platform Ponte Giaretta above and Lentini.
Remotesensing 14 06348 g006
Figure 7. OCTOBER 25 at 09:30 UTC: FloodPROOFS—Event severity expressed as discharge return period estimated according to model climatology. This monitoring tool of the modeling chain highlights the most severely affected areas (run on observations). (A): Catanian plain, Scordia, and Ogliastro (Catania). (B): Messina and Reggio Calabria.
Remotesensing 14 06348 g007
Figure 8. Results of TELEMAC-2D coupled with the Continuum; maximum water depth (on the left) and maximum water velocity (on the right) for the event that hit the Catanian floodplain 24–25 October 2021.
Remotesensing 14 06348 g008
Figure 9. Panel (A): RGB false color image produced using the S1 data acquired on 19 October 2021 (red) and 25 October 2021 (green/blue). Panel (B): Flooded areas map generated by AUTOWADE using the S1 images shown in Panel (A). Cyan: floodwater; blue; permanent water.
Remotesensing 14 06348 g009
Figure 10. Panel (A): RGB false color image produced using the S1 data acquired on 19 October 2021 (red) and 31 October 2021 (green/blue). Panel (B): Flooded areas map generated by AUTOWADE using the S1 images shown in Panel (A). Cyan: floodwater; blue; permanent water.
Remotesensing 14 06348 g010
Figure 11. Map of flooded areas generated by AUTOWADE using the CSG image acquired on 30 October 2021 at 04:30 UTC.
Remotesensing 14 06348 g011
Figure 12. Water depths maps for the Catanian floodplain (Sicily) from TELEMAC-2D (left panel) and FwDET tool (right panel).
Remotesensing 14 06348 g012
Figure 13. Water depth map obtained for the Catanian floodplain (Sicily) from the merging of TELEMAC-2D and FwDET tool results.
Remotesensing 14 06348 g013
Figure 14. Observed (Panel (A)) and modeled (WRF-DA, Panel (B)) 48 h cumulated rainfall between 24–26 October 2021.
Remotesensing 14 06348 g014
Figure 15. OCTOBER 24 09 UTC: Flood-PROOFS stream flow deterministic forecast using WRF-DA of the 24 October at 00 UTC as input.
Remotesensing 14 06348 g015
Figure 16. Comparison between forecast flooded area (left panel) using WRF-DA forecast run of 24 October at 00UTC and flooded area using ground data as input for Flood-PROOFS (right panel).
Remotesensing 14 06348 g016
Table 1. Parametrization schemes adopted for subgrid-scale processes.
Physics OptionsWRF-OLWRF-DA
MicrophysicsWSM6WSM6
PBLYSUYSU
Longwave radiationRRTMGRRTMG
Shortwave radiationRRTMGRRTMG
Land surface physicsRUCRUC
Cumulus parameterizationExplicit on inner domainExplicit on inner domain
Table 2. WRF-OL forecast validation through the MODE tool.
CEN
DIST
ANG
DIFF
FCST
AREA
OBS
AREA
INTERS
AREA
UNION
AREA
SYMM
DIFF
FCST
INT50
OBS
INT50
FCST
INT90
OBS
INT90
TOT
INT
150 mm3.413.121943715570163810862281943602750.95
200 mm12.497.339412401999827832742483983340.91
Table 3. WRF-DA forecast validation through the MODE tool.
CEN
DIST
ANG
DIFF
FCST
AREA
OBS
AREA
INTERS
AREA
UNION
AREA
SYMM
DIFF
FCST
INT50
OBS
INT50
FCST
INT90
OBS
INT90
TOT
INT
150 mm12.63.04125171558013868061961943642750.97
200 mm16.30.295792401856344492662484833340.95
Table 4. Comparison between forecasts and benchmark peak flows. Threshold – criticality is a value of flow for which criticality as flooding or other ground effects happen; the benchmark is the run on observation peak flow; WRF-DA is the forecast chain fed with WRF model that assimilates both radar and ground temperature data; WRF-OL is the forecast chain without assimilation.
Threshold CriticalityBenchmarkWRF-DAWRF-OL Prob.
BasinSectionQpeak
[m3/s]
Qpeak
[m3/s]
Qpeak
[m3/s]
QpeakMin
[m3/s]
QpeakMax
[m3/s]
LentiniLentini4037675329681100
AnapoSiracusa46785507297331
SimetoReitano17421492409352005600
AlcantaraChianchitti9421340146710491446
CatonaReggio Calabria83981375497
AmendolaCalimara330267796294401
PetraceRizziconi756620709428556
BonamicoCasignana349255756353542
Publisher’s Note: MDPI stays neutral with regard to jurisdictional claims in published maps and institutional affiliations.

